An Optimal Cigarette Tax in Malaysiaecon.upm.edu.my/ijem/vol7no2/bab02.pdf · An Optimal Cigarette...
16
Int. Journal of Economics and Management 7(2): 205 – 220 (2013) ISSN 1823 - 836X An Optimal Cigarette Tax in Malaysia NORASHIDAH MOHAMED NOR a , NIK MUSTAPHA RAJA ABDULLAH b , LEKHRAJ RAMPAL c AND ZALEHA MOHD NOOR d a,b,c,d Universiti Putra Malaysia ABSTRACT Determination an optimal cigarette excise tax is essential for the government to ensure that price of cigarette after tax is high enough to reduce consumption of cigarette and generate maximum tax revenue to the government. It is timely that government should consider having a specific tobacco control policy funded from earmarking of revenues from cigarette tax increases or “sin tax”. The estimated regression of optimal cigarette tax is based on Laffer cuve equation. In this study, the estimated optimal real excise tax rate is 0.216 sen or 0.262 nominal excise tax rate per stick, which is 16.5% higher than the excise tax rate in 2009. The increase in real revenue that can be earned after imposing an optimal excise tax is 18% and 23.6% in the short run and long run respectively. The expected reduction in consumption per capita for cigarette is 6.4% in the short run and 11.6% in the long run. Keywords: Optimal cigarette tax, sin tax, laffer curve INTRODUCTION Cigarette Tax in Malaysia As for year 2012, the excise tax on cigarette is 49% or 26 sen per stick of the retail price which is still lower than 70% suggested by Frame Convention on Tobacco Control (FCTC). Cigarette tax is collected from cigarette manufacturers or cigarette importers. Until 2004, taxes on tobacco were levied according to their weight. In 2005, Malaysia has adopted a specific excise tax per stick and this tax structure is easier to administer since it requires only counting the sticks without weighing them. Table 1.0 shows the cigarette taxes imposed by the Malaysia government from 1990 until 2010. Both the excise tax and import tax imposed on cigarettes are increasing however, the sales tax remains fixed at 15% from 1990 to 1999 and increase to 25% from 2001 to 2010. * Corresponding Author: E-mail: [email protected] Any remaining errors or omissions rest solely with the author(s) of this paper.
Transcript of An Optimal Cigarette Tax in Malaysiaecon.upm.edu.my/ijem/vol7no2/bab02.pdf · An Optimal Cigarette...

Int. Journal of Economics and Management 7(2): 205 – 220 (2013) ISSN 1823 - 836X
An Optimal Cigarette Tax in Malaysia
NORASHIDAH MOHAMED NORa, NIK MUSTAPHA RAJA ABDULLAHb, LEKHRAJ RAMPALc AND ZALEHA MOHD NOORd
a,b,c,dUniversiti Putra Malaysia
ABSTRACTDetermination an optimal cigarette excise tax is essential for the government to ensure that price of cigarette after tax is high enough to reduce consumption of cigarette and generate maximum tax revenue to the government. It is timely that government should consider having a specific tobacco control policy funded from earmarking of revenues from cigarette tax increases or “sin tax”. The estimated regression of optimal cigarette tax is based on Laffer cuve equation. In this study, the estimated optimal real excise tax rate is 0.216 sen or 0.262 nominal excise tax rate per stick, which is 16.5% higher than the excise tax rate in 2009. The increase in real revenue that can be earned after imposing an optimal excise tax is 18% and 23.6% in the short run and long run respectively. The expected reduction in consumption per capita for cigarette is 6.4% in the short run and 11.6% in the long run.
Keywords: Optimal cigarette tax, sin tax, laffer curve
INTRODUCTION
Cigarette Tax in MalaysiaAs for year 2012, the excise tax on cigarette is 49% or 26 sen per stick of the retail price which is still lower than 70% suggested by Frame Convention on Tobacco Control (FCTC). Cigarette tax is collected from cigarette manufacturers or cigarette importers. Until 2004, taxes on tobacco were levied according to their weight. In 2005, Malaysia has adopted a specific excise tax per stick and this tax structure is easier to administer since it requires only counting the sticks without weighing them. Table 1.0 shows the cigarette taxes imposed by the Malaysia government from 1990 until 2010. Both the excise tax and import tax imposed on cigarettes are increasing however, the sales tax remains fixed at 15% from 1990 to 1999 and increase to 25% from 2001 to 2010.
* Corresponding Author: E-mail: [email protected] remaining errors or omissions rest solely with the author(s) of this paper.

206
International Journal of Economics and Management
Table 1 Cigarette Taxes 1990 – 2010
YearImport tax Nominal excise tax Sales tax
RM/kg or RM/stick RM/kg or RM/stick %
1990 85/0.08 13/0.013 151991 135/0.12 14/0.014 15
1992-1998 162/0.15 28.60/0.028 151999-2000 180/0.16 40/0.039 15
2001 180/0.16 40/0.039 252002 216/0.2 48/0.047 252003 259/0.24 58/0.056 252004 200/0.18 58/0.056 252005* 0.20 0.081 252006 0.20 0.12 252007 0.20 0.15 252008 0.2 0.18 252009 0.2 0.225 252010 0.2 0.26 25
*Specific tax per stick was introduced (1 kg = 1100 sticks)Source: Royal Custom Malaysia and Confederation of Malaysia Tobacco (CMTM), various years.
The Malaysian Government earns a large amount of revenue from its involvement in the tobacco industry. In 2010, revenue from the excise tax on cigarette is 2% from the total revenue of excise tax collected by the government. It is estimated that an increase of 10% in cigarette tax would lead to an increase almost 7% in government revenue (World Bank 1999). Hana and Nabilla (2007) predicted that the impact of a 25% increase in cigarette excise tax in Malaysia would result 20.8% increase in cigarette tax revenue.
Figure 1 shows the relationship between the excise tax on cigarette and tax revenue generated by government.

207
An Optimal Cigarette Tax in Malaysia
Figure 1 Tax revenue vs excise tax rate (1990 – 2010)
World Bank (1999) reported, in 1995 the average percentage of all government revenue derived from tobacco tax was 0.63% and middle-income countries averaged only 0.42%. Since the current excise tax of cigarette in Malaysia is only 49% of the retail price, thus government should continue to increase the excise tax on cigarette to reduce cigarette consumption. Increasing excise tax rate up to the optimal level will enable the government to generate maximum tax revenue. The availability of tobacco tax revenue can be allocated for earmarking the portion of it for funding health promotion activities including tobacco control program. For example one of the largest China’s cities, Chongquing and several USA states earmark a portion of tobacco taxes for tobacco-related education programs, counter-advertising and other tobacco control activities (Chaloupka et al., 2000). Learning from the experience of those countries, successful earmarking of tobacco revenue in Malaysia would have positive effect in reducing cigarette consumption and potentially provide fund for better health care and services for the Malaysian population.
LITERATURE REVIEWThere are several reasons for raising cigarette excise taxes such as; to increase government revenue, to protect children and youth, to improve public health and to correct externalities. These entire reasoning further pose a question as to what is the optimal tax that should be imposed on cigarette. From the economic

208
International Journal of Economics and Management
perspective, the optimal tax can be achieved when the marginal cost of the last cigarette consumed equals to its marginal social benefits. However, according to Warner et al. (1995) and Chaplouka et al. (2000) evaluation and identification of the negative externalities associated with direct smoking and direct environmental effect from tobacco smoke are abundant and complicated. Therefore for a country to set the level of tax, it should take into account the national health objectives and also depends on societal value such as the extent to which the children should be protected from the effect of smoke polluted environment. Apart from the health and social objectives of imposing tax on cigarettes, some governments may levy taxes with the intention of maximizing revenues. An empirical evidence from a study in South-East Asia reports on the potential revenue generated from tobacco taxes (Arunatilake, 2002). This study assumes that the real GDP per capita in the region was growing at 4% annually and a 5% increase in real cigarette prices induced by higher taxes would generate substantial additional revenue for the region by 2010.
The fundamental principle related to efficiency of taxation is that the generated tax revenues from higher cigarette price due to increase in cigarette tax should minimize the welfare losses. As stated by Ramsey, (1927); Baumol and Bradford, (1970), the criteria for economic efficiency in taxation are; it should have the effect of reducing demand for all commodities in the same proportion, it should distort consumer choice as little as possible, and direct tax payers as little as possible to less preferred patterns of consumption. Taxes discourage people from buying the products and lead to an efficiency loss. This efficiency loss is called the ‘excess burden of tax’ or ‘deadweight loss’ (Zee, 1995). The following Figure 2.0 illustrates the welfare loss due to the increased tax on cigarettes.
Figure 2 Welfare loss due to cigarette tax

209
An Optimal Cigarette Tax in Malaysia
Assume that cigarette supply curve (S0) is perfectly elastic so that firms are willing to supply an unlimited amount of cigarette at the current price. At E, marginal social costs (MSC) is equal to marginal social benefit (MSB) or MSC0 = MSB0 = MSB1. Imposition of a unit tax ‘T’ will shift supply curve parallel upward to S1. At a new price, PE + T, MSC1 > MSB0 and MSB1. Dead weight loss arises because the marginal social cost exceeds the marginal social benefit and it equals the loss in consumer surplus which is represented by area EFG for demand curve D0 and area EIH for demand curve D1. The loss in consumer surplus or the excess burden of tax is greater for the elastic demand curve (D0). This is because more people are changing their consumption decisions as the elasticity increases.
A good tax policy by the government is to set taxes for products which creates the least economic distortion. Ramsey (1927) designs an optimal tax theory that identifies distortion minimizing tax policy and the second best levels of taxes. He argues that the second best tax policy should prescribe tax rates on different commodities as inversely link to their demand elasticity. The “Ramsey Rule” states that tax rate should vary inversely with the elasticity of demand for products by holding the elasticity of supply constant. Products with very inelastic demand such as cigarettes should bear the highest tax rate due to its addictive capacity. This will minimize consumer’s loss of utility associated with a tax by minimizing the need to forego consumption they would prefer in order to avoid paying the tax. Chaloupka et al. (2000) find most estimation for the price elasticity of demand for cigarettes from the literatures on high-income countries is between -0.25 to -0.50. In contrast, demand is more responsive among low-income and middle-income countries that are in the range of -0.50 to -1.00. Given this evidence of inelastic demand for cigarettes, taxes on cigarettes appear to satisfy the Ramsey Rule. Not only that increases in taxes lead to significant reductions in cigarette smoking but also at the same time leads to significant increase in tax revenue. In an estimation by Sunley, Yurekli and Chaloupka (2000), an increase of 10% in cigarette taxes would lead to an increase of almost 7% on average in cigarette tax revenues.
The rate of cigarette excise tax that maximized revenue can be illustrated using the Laffer curve. A Laffer curve is a parabola showing the relationship between tax revenue and the tax rate. Tax revenues are the product of the tax rate, t and the tax base, x, written as a function of the tax rate. There is a negative relationship between tax rates and tax bases. Changes in tax rates have two effects on revenues: the arithmetic effect and the economic effect. The arithmetic effect is simply when tax rates are lowered, tax revenues per dollar of tax base will be lowered by the amount of the decrease in the rate. And, the reverse is true for an increase in tax rates. The economic effect from lower tax rates gives the positive impact on work, output, and employment and thus providing incentives to increase
210
International Journal of Economics and Management
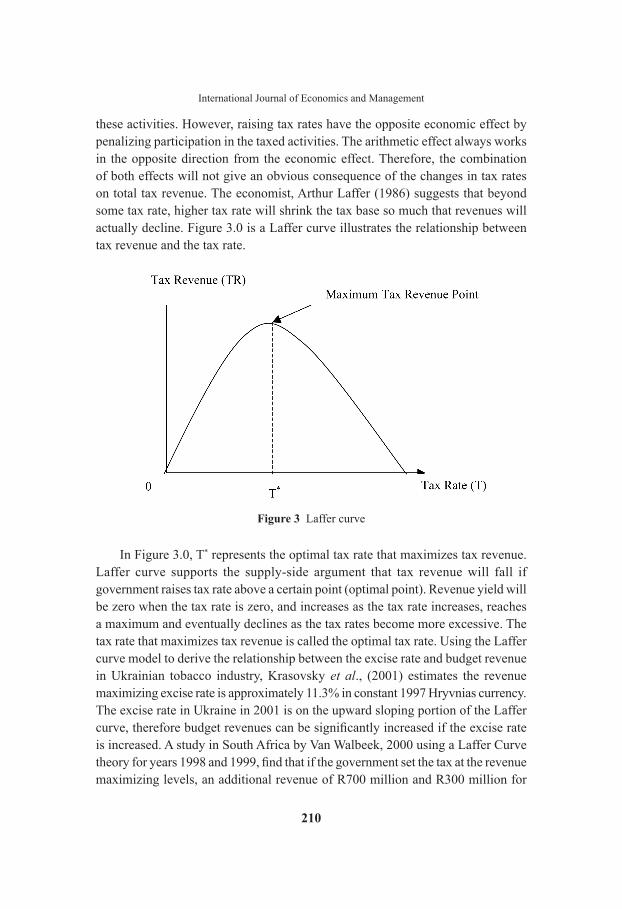
these activities. However, raising tax rates have the opposite economic effect by penalizing participation in the taxed activities. The arithmetic effect always works in the opposite direction from the economic effect. Therefore, the combination of both effects will not give an obvious consequence of the changes in tax rates on total tax revenue. The economist, Arthur Laffer (1986) suggests that beyond some tax rate, higher tax rate will shrink the tax base so much that revenues will actually decline. Figure 3.0 is a Laffer curve illustrates the relationship between tax revenue and the tax rate.
Figure 3 Laffer curve
In Figure 3.0, T* represents the optimal tax rate that maximizes tax revenue. Laffer curve supports the supply-side argument that tax revenue will fall if government raises tax rate above a certain point (optimal point). Revenue yield will be zero when the tax rate is zero, and increases as the tax rate increases, reaches a maximum and eventually declines as the tax rates become more excessive. The tax rate that maximizes tax revenue is called the optimal tax rate. Using the Laffer curve model to derive the relationship between the excise rate and budget revenue in Ukrainian tobacco industry, Krasovsky et al., (2001) estimates the revenue maximizing excise rate is approximately 11.3% in constant 1997 Hryvnias currency. The excise rate in Ukraine in 2001 is on the upward sloping portion of the Laffer curve, therefore budget revenues can be significantly increased if the excise rate is increased. A study in South Africa by Van Walbeek, 2000 using a Laffer Curve theory for years 1998 and 1999, find that if the government set the tax at the revenue maximizing levels, an additional revenue of R700 million and R300 million for

211
An Optimal Cigarette Tax in Malaysia
these two years can be generated. In theory, there is a trade off in raising cigarette taxes. Government gets more revenue on the packs of cigarettes sold, but there are likely to be fewer packs sold as the tax rates increase and eventually tax revenue will decline.
Clausing (2007) provides convincing evidence for the hypothesized parabolic relationship between corporate tax rates and corporate tax revenue for the sample of OECD countries being studied. In addition, she finds the estimated revenue-maximizing corporate income tax rate is 33% for the whole sample. This study has been extended from 1980 to 2005 for OECD countries and confirmed the evidence of Laffer curve existence in the corporate tax sphere throughout most of the sample period (Brill and Hassett, 2007)
Numerous studies in both low and high-income countries have confirmed that increasing tax is highly effective and practical way to correct economic inefficiencies in tobacco markets (Jha and Chaloupka, 1999; Hu, 1997). Increase in taxes would increase the retail price of cigarettes and hence discourage youths from smoking. Using data from the 1997 Harvard School of Public Health College Alcohol Study, Czart, Pacula and Chaloupka (2001) provides strong evidence that raising cigarette taxes and therefore the increase in cigarette prices discourage both smoking participation and the level of smoking among young adults. These arguments are strengthened by a systematic review which concludes that increasing the price of cigarette reduces not only the number of adolescents and young adults who smoke but also the quantity consumed (Hopkins et al., 2001).
The revenue generated from taxing cigarettes can be used to support anti-smoking activities such as tobacco-related education and prevention effort, media campaigns and other public health efforts. Several U.S. states and many policy makers of other countries have earmark part of the revenue churns from this cigarette taxes to promote public health and more directly to cover the social costs resulting from cigarette smoking. The 1988 California Tax and Health Promotion Act (Proposition 99) have explicitly specified the use of tax revenue for health-education programs for the prevention and reduction of cigarette use, impoverished health care and conduct research activities on cigarette usage (Bal et al., 1990). Countries like Egypt and Nepal earmark the tax revenue to subsidized medical expenditures for low income families and in Victoria, Australia, a 5% tax was levied on the sale of tobacco products in 1986 for health promotion (Hu, 1997). The use of earmarked taxes to fund health promotion and disease prevention are consistent with the ‘benefit principal’ of taxation. Higher taxes can reduce the producer loss and/or consumer surplus (Hu, Xu and Keeler, 1998). Given that many publicly provided health insurance programs target lower-income populations, thus earmarking the revenue is consistent with the overall system of taxes and transfers

212
International Journal of Economics and Management
of revenue that promotes vertical equity. Moreover, cigarette tax increases that are earmarked for anti-tobacco media campaigns, prevention program and subsidization of tobacco cessation products generate even larger reductions in cigarette use and improvement in health. Hu, Xu and Keeler (1998), analyse that many activities funded by earmarked tobacco taxes significantly reduce the welfare losses resulting from tobacco tax increases.
MODEL AND METHODThe economist Arthur Laffer suggests that beyond some tax rate, higher tax rate will significantly reduce the tax base and eventually revenues will decline. The Laffer curve shows the relationship between tax rate and tax base and their impact on revenue. The following is the mathematical derivation for a Laffer curve:
R = t × B (1)
where, R is revenue, t is the tax rate and B is the tax base.
B = α – βt, β > 0 (2)
Substituting equation (1) into (2) provides:
R = t(α – βt) = αt – βt2 (3)
As the assumed goal of governments is to maximize revenues, differentiating equation (3) with respect to t gives the following first-order condition:
tR t2 022
a b= - = (4)
The second-order condition:
tR 2 02
2
2
21b=- (5)
Equation (4) and (5) are necessary and sufficient conditions for maximum respectively. Solving for t*:
*2
tba
= , where *t = the optimal tax. (6)
An empirical estimation of a Laffer curve is based on the revenue equation (3), hence a Laffer curve equation for a single tax becomes:
Rt = α0 + δ1 Tt + δ2 T2t + δ4Yt + εt, (7)

213
An Optimal Cigarette Tax in Malaysia
where t indicates years, R is real tax revenue from cigarettes, T is the real excise tax on per stick of cigarette measured in Ringgit, Y is real income per capita and transformed into natural logarithm, and εt is the error term. T2 is real excise tax squared. The inclusion of both tax rate and its square in the regression equation is to allow for the relationship between revenue and tax rate to be non-linear as depicted by Laffer curve model. Both R and T are adjusted for the inflation using the consumer price index (CPI) with year 2000 as the base year.
All the variables of the Laffer curve in equation (7) are tested for their stationarity. For this purpose, three tests for stationarity are performed: the Augmented Dickey-Fuller (ADF) test, the Phillips-Peron (PP) test and the Kwiatkownski-Phillips-Schmidt-Shin (KPSS) test. A requirement for the existence of cointegration relation between a set of I(1) is necessary to further estimates a long run parameters using Fully Modified Ordinary Least Square (FMOLS) method. FMOLS developed by Phillips & Hansen (1990) is an efficient method of estimating equilibrium economic relationship for small samples analysis. The FMOLS estimator corrects the demand model’s variables for endogeneity due to cointegration and modifies least square to account for serial correlation effects. FMOLS yields t-ratios that are asymptotically normally distributed and is independent of the correct choice of lag length of the underlying vector autoregression. According to Borland and Quliaris (1994), the FMOLS estimator permits inference based on normal distribution theory ‘by means of a nonparametric correction’ to the data that effectively eliminates any long-run dependence between the true residuals of the cointegrating regression and the innovations of the explanatory variables.
In order to estimate the impact of increase excise tax rate of cigarette on the expected government revenue, the following mathematical relationship between the changes in the excise tax rate and government revenue is applied (Van Walbeck, 2000):
TRd TR
Td T
x PT1 n= + n
^ ^ ah h k9 C (8)
Where TRd TR^ h is the percentage change in government revenue
Td T^ h is a changes in the excise tax rate, nn is the price elasticity of demand
And PT is the tax proportion of the retail price of cigarette.
Equation 8.0 shows that an increase in government revenue as a result of an increase in the tax rate is inversely proportional to the absolute size of the price elasticity. A relatively inelastic demand implies greater revenue potential and vice versa.

214
International Journal of Economics and Management
The empirical analysis for optimal tax rate in this study was carried out using quarterly data for the period 1980 to 2009. These data was obtained from the Royal Custom of Malaysia and Department of Statistic Malaysia.
RESULTS AND DISCUSSIONThe estimated model of optimal cigarette tax is:
Rt = α0 + δ1 Tt + δ2 T2t + δ4Yt + εt,
where t indicates years, R is real tax revenue from cigarettes, T is the real excise tax on per stick of cigarette measured in Ringgit, Y is real income per capita and transformed into natural logarithm, and εt is the error term. T2 is real excise tax square.
The three tests of stationarity are performed on the variables R, T, T2 (TS) and Y in levels and in first differences, with the optimal lag lengths for each test determined by the E-View 6 software. The results of the unit root tests are shown in Table 2.
Table 2
ADF tests PP tests KPSS tests
LevelR 1.596 -5.624*** 0.858***T 1.383 0.132 0.842***TS 1.674 0.499 0.721**Y -1.735 1.958 0.981***
First Difference∆R -6.779*** -26.633*** 0.304∆T -2.832** -9.567*** 0.256∆TS -5.905*** -8.461*** 0.307∆Y -9.989*** -9.879*** 0.213
Notes: ADF indicates the Augmented Dickey Fuller test, PP indicates Phillips-Peron tests and KPSS indicates Kwiatkowski-Phillips-Schmidt-Shin test. The following notation applies; R= Real Revenue, T=real excise tax rate, Y = real income per capita and TS = real excise tax squared. All the lags values and bandwith are automatically determined by E-views-6. The lags for ADF tests are chosen based on SIC, while the bandwidths for the PP and KPSS tests are based on the Newey-West Bandwith.
‘***’ indicates the test statistic is significant at the 1% significance level, ‘**’ indicates the 5% significance level, and ‘*’ indicates the 10% significance level. The model includes constant without trend.

215
An Optimal Cigarette Tax in Malaysia
From the above table, ADF and PP are tested at 5% level and they do not reject the null hypothesis of a unit root for the series of T, TS and Y. The KPSS test rejects the null hypothesis of stationarity for all variables at level, at 1% significant level except for TS rejected at 5% level. However, for R series, even though PP test rejects the null hypothesis at 1% significant level, but the KPS test and ADF test produce strong indication that the series is integrated of order 1, or I(1) at 1% significance level. Hence, there are enough proof to conclude that all the variables R, T, TS and Y series are following I(1) process.
Since all the variables are I(1), the cointegration technique originally designed by Phillips and Hansen (1990); Pedroni, (1995, 2000); and Phillips and Moon, (1999), the Fully Modified Ordinary Least Square (FMOLS) is employed. Table 3.0 shows the estimation results from the FMOLS analysis.
Table 3 Results of the FMOLS estimation
R = –183.7221 + 28.1669Tt – 0.65320T2t – 4,3147Tt-1 + 20.8322 lnYt
(–0.73059) (2.7982)*** (–1.4106) (0.80937) (0.63354)
ADF[2] = –5.367537*** Error-correction term = –1.0894 ***Notes: The following notation applies; R= Real Revenue, T=real excise tax rate, Y = real income per capita and T2 = real excise ta squared “***” indicates the test statistic is significant at the 1% significance level, “**” indicates the 5% significance level and “*” at 10% significance level. [ ] denotes lags and figures in parentheses ( ) refer to t statistics.
The above results report that R, T, T2 , Tt-1, and lnY do form a cointegrating link. The ADF test performed on residuals from the estimating equation is highly significant which confirmed the existence of long-run equilibrium relationship among the variables. This implies that all the variables drift together in the long run. The speed of adjustment which is the coefficient of error correction term indicates that the disequilibrium is corrected more than 100% over quarterly at 1% significance level. A highly significant error correction term is a further proof of the existence of a stable long run relationship. As expected, the estimated coefficient of T’s sign is positive and significant at 1% level. The positive sign of T implies that increases in real excise tax rate will increase the tax revenue. The opposite sign for the tax rate squared (T2) captured the diminishing effects of the tax in the parabolic equation which is a pattern consistent with the Laffer curve shape. However, the estimated coefficients of other variables are insignificant determinant of real tax revenue in this model.
216
International Journal of Economics and Management
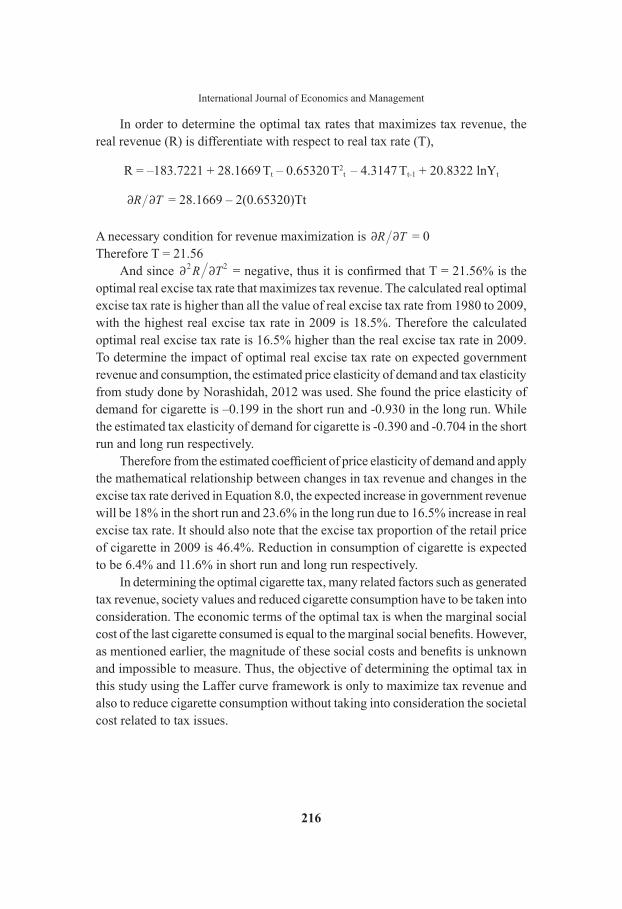
In order to determine the optimal tax rates that maximizes tax revenue, the real revenue (R) is differentiate with respect to real tax rate (T),
R = –183.7221 + 28.1669 Tt – 0.65320 T2t – 4.3147 Tt-1 + 20.8322 lnYt
R T2 2 = 28.1669 – 2(0.65320)Tt
A necessary condition for revenue maximization is R T2 2 = 0Therefore T = 21.56
And since R T2 22 2 = negative, thus it is confirmed that T = 21.56% is the
optimal real excise tax rate that maximizes tax revenue. The calculated real optimal excise tax rate is higher than all the value of real excise tax rate from 1980 to 2009, with the highest real excise tax rate in 2009 is 18.5%. Therefore the calculated optimal real excise tax rate is 16.5% higher than the real excise tax rate in 2009. To determine the impact of optimal real excise tax rate on expected government revenue and consumption, the estimated price elasticity of demand and tax elasticity from study done by Norashidah, 2012 was used. She found the price elasticity of demand for cigarette is –0.199 in the short run and -0.930 in the long run. While the estimated tax elasticity of demand for cigarette is -0.390 and -0.704 in the short run and long run respectively.
Therefore from the estimated coefficient of price elasticity of demand and apply the mathematical relationship between changes in tax revenue and changes in the excise tax rate derived in Equation 8.0, the expected increase in government revenue will be 18% in the short run and 23.6% in the long run due to 16.5% increase in real excise tax rate. It should also note that the excise tax proportion of the retail price of cigarette in 2009 is 46.4%. Reduction in consumption of cigarette is expected to be 6.4% and 11.6% in short run and long run respectively.
In determining the optimal cigarette tax, many related factors such as generated tax revenue, society values and reduced cigarette consumption have to be taken into consideration. The economic terms of the optimal tax is when the marginal social cost of the last cigarette consumed is equal to the marginal social benefits. However, as mentioned earlier, the magnitude of these social costs and benefits is unknown and impossible to measure. Thus, the objective of determining the optimal tax in this study using the Laffer curve framework is only to maximize tax revenue and also to reduce cigarette consumption without taking into consideration the societal cost related to tax issues.

217
An Optimal Cigarette Tax in Malaysia
CONCLUSION AND POLICY IMPLICATIONThe estimation of optimal cigarette tax is done using the Laffer curve model and the estimated optimal real excise tax rate is 21.56% which is 16.5% higher the real excise tax rate in 2009. Imposing the optimal tax on cigarettes would increase revenue generated by the government, where the expected increase in government revenue in short run is 18% and 23.6% in long run Currently; the excise tax rate is still below the optimal tax rate level. Theoretically, this means revenue generated is at the steep increasing slope of the Laffer curve, which indicates a steady increase in government revenue. Therefore the government should work to increase the excise tax rate to its optimal level. Besides that the proportion of current excise tax on cigarette is only about 49% of the retail price of cigarette, which is lower than the suggested proportion of 70% by FCTC. It is recommended that the government should continue to increase the excise tax level imposed on cigarette to achieve higher revenue and to attain the targeted excise tax rate suggested by FCTF.
Excise tax as part of tobacco control policy has proven to be successful; both in reducing tobacco consumption and in increasing revenue in developing as well as developed countries (Hana and Nabila, 2007, Townsend, 1996, Shibuya et al., 2003, Baltagi and Levin, 1986). Higher excise tax rate on cigarette will be passed to the consumer in terms of higher price of cigarette. In this study the negative relationship between price and demand of cigarette will further decrease consumption of cigarette estimated at 6.4% and 11.6% in the short run and long run, respectively.
However, a large increase in cigarette tax has greater tendency to induce smokers to opt for illegal cigarettes. Therefore the enforcement against the snuggling and selling of illegal cigarettes must be stricter and increase simultaneously with tax. Even though the excise tax increases in legal cigarettes leads to an increase in illegal cigarettes’ trade, tax increase still bring greater revenues and ultimately reduce consumption (Merriman, 2002).
In order to maximize the taxation effect and hence reduce smoking, government should efficiently allocate the tax revenue for tobacco control program and strategies. According to Asia Pacific Report Card (SEATCA 2009), there is no tax or pricing policy in Malaysia with the aimed to contribute towards health objectives. It is timely that government should consider having a specific tobacco control policy funded from earmarking of revenues from cigarette tax increases or “sin tax”. The policy should be targeted to increase awareness about the consequences of smoking habits, to reduce larger proportion of tobacco consumption and to reduce tobacco-

218
International Journal of Economics and Management
related illness and death. The collected revenue from the sin tax can be channeled to more comprehensive programs addressing the issues of health consequences of tobacco use, increase awareness on the danger of smoking, educational strategies for smoking prevention and other related activities. The source of funding for those health programs through earmarking can eradicate any conflicts of interest between non-smokers taxpayers and smokers since the earmarked revenue is generated from the consumers who smoke. Thailand is one of the countries which has earmarked 2% of the revenues generated from cigarette and alcohol to establish Thai Health Promotion Foundation (Thai Health) in 2001.
REFERENCESAhmad, S. and Franz, G. A. (2008) Raising Taxes to Reduce Smoking Prevalence in the USA:
A Simulation of the Anticipated Health and Economic Impacts, Public Health, 122, 3-10.Arunatilake, N. (2002) An Economic Analysis of tobacco demand in Sri Lanka. Sri Lanka
Economic Journal, 3(1), 96-120.Bal, D. G., Kizer, K. W., Felten, P. G., Mozar, H. N., and Niemeyer, D. (1990) Reducing
Tobacco Consumption in California, Development of a Statewide Anti-Tobacco Use Campaign, 264, 1570-1574.
Baltagi, B. H. and Levin, D. (1986) Estimating Dynamic Demand for Cigarettes Using Panel Data: The Effects of Bootlegging, Taxation and Advertising Reconsidered, The Review of Economics and Statistics, 68(1), 148-155.
Baumol, W. J., Bradford, D. F. (1970) Optimal Departures from Marginal Cost Pricing, American Economic Review, 60, 415-426.
Borland, J. and Ouliaris, S. (1994) The Determinants of Australian Trade Union Membership, Journal of Applied Econometrics, 9, 453–468.
Brill, A. and Hassett, K. A. (2007) Revenue-Maximizing Corporate Income Taxes: The Laffer Curve in OECD Countries, AEI Working Paper.
Chaloupka, F.J. & Warner, K.E. (2000). The economics of smoking. In: Newhouse, JP, Cuyle A.J ed. The handbook of health economics. New York: North-Holland.
Chaloupka, F. J., Hu, T., Warner, K. E., Jacobs, R. and Yurekli, A. (2000) The Taxation of Tobacco Products. In: Jha P, Chaloupka F.J, ed. Tobacco control in developing countries. Oxford: Oxford University Press, Chp 10.
Clausing, K. A. (2007) Corporate Tax Revenue in OECD Countries, International Tax Public Finance, 24,115-133.
Czart, C., Pacula, R. L. and Chaloupka, F. J. (2001) The Impact of Prices and Control Policies on Cigarette Smoking Among College Students, Contemporary Economic Policy, 19, 135-49.
Hana, R. and Nabilla, A. M. (2007) Demand Analysis of Tobacco Consumption in Malaysia, Nicotine Tobacco Research, 9(11), 1163-1169.

219
An Optimal Cigarette Tax in Malaysia
Hopkins, D. P., Briss, P. A., Ricard, C. J., Husten, C. G., Carande-Kulis, V. G. and Fielding, J. E. (2001) Reviews of Evidence Regarding Interventions to Reduce Tobacco Use and Exposure to Environmental Tobacco Smoke, American Journal of Preventive Medicine, 20(2S), 16–66.
Hu, T. W. (1997) Cigarette Taxation in China: Lessons from International Experiences, Tobacco Control, 6,136-140.
Hu, T. W, Xu, X. P. and Keeler, T. (1998) Earmarked Tobacco Taxes: Lessons Learned, in The Economics of Tobacco Control: Towards an Optimal Policy Mix (Eds.) I. Abedian, R. van der Merwe, N. Wilkins & P. Jha, pp. 102-118, University of Cape Town, Cape Town.
Jha, P. and Chaloupka, F. J. (1999) Curbing The Epidemic: Governments and The Economics of Tobacco Control. World Bank: Washington DC.
Krasovsky, K., Andreeva, T., Krisnov, D. Masliakivsky, M. and Rud, G. (2001) Economics of Tobacco Control in Ukraine from the public perspective, Alcohol and Drug Information Centre (ADIC), Ukraine.
Merriman, D. (2002) Methods for Studying Tobacco Smuggling with Applications to Southeast Asia” presented at Southeast Asia Tobacco Control Workshop organized with financial support from the Rockefeller Foundation. March 25-30, Kanchanaburi, Thailand.
Norashidah, M. N. (2012) Cigarette Demand in Malaysia. Universiti Putra Malaysia Press: Serdang.
Phillips, P. C. B. and Hansen, B. E. (1990) Statistical Inference in Instrumental Variable Regression with I(1) Process, Review of Economic Studies, 122, 3-10.
Ramsey, F. P. (1927) A Contribution to the Theory of Taxation, Economic Journal, 37, 47-61.Shibuya, K., Ciecierski, C., Guindon, E., Bettche, D. W., Evans, D. B. and Murray C. J.
(2003) WHO Framework Convention on Tobacco Control: Development of An Evidence Based Global Public Health Treaty, British Medical Journal, 327(7407), 154-157.
Southeast Asia Tobacco Control Alliance. Tobacco tax in ASEAN, SEATCA 2008. http://seatca.org/.
Southeast Asia Tobacco Control Alliance. (2009) WHO FCTF Articles, 5.3, 6, 8, 11 & 13. Asia-Pacific Report Card. SEATCA, 2009.
Sunley, E., Yurekli, A. and Chaloupka, F. J. (2000) The Design, Administration and Potential Revenue of Tobacco Taxes, in Tobacco Control in Developing Countries (Eds.) P. Jha & F. Chaloupka, Oxford University Press, Oxford, pp. 409-426.
Townsend, J. (1996) Price and Consumption of Tobacco, British Medical Bulletin, 52(1), 132-142.
Tsai, S. P. Wen, C. P. Hu, S. C. Cheng, T. Y. and Huang, S. J. (2005) Workplace Smoking Related Absenteeism and Productivity Costs in Taiwan, Tobacco Control, 14, 33-37.
Van Walbeek, C. P. (2000) The Economics of Tobacco Control in South Africa, Paper presented at 11th Conference on Tobacco OR Health. Applied Fiscal Research Centre, Cape Town.

220
International Journal of Economics and Management
Warner, K. E., Chaloupka, F. J., Cook, P. J., Manning, W. G., Newhouse, J. P., Novothy, T. E., Schelling, T. C. and Townsend, J. (1995) Criteria for Determining an Optimal Cigarette Tax: The Economist’s Perspective, Tobacco Control, 4, 380-386.
World Bank. (1999) Curbing the Epidemic: Governments and the Economics of Tobacco Control. Series: Development in practice. Washington DC: The World Bank, URL: http://www1.worldbank.org/tobacco/reports.htm.
Zee, Howell H. (1995) Taxation and Equity, in Tax Policy Handbook (Ed.) Ny Parthasarathi Shome, Fiscal Affairs Department, IMF, Washington, pp. 30-34.