An Investigation of The Museum of Science and Industry...
17
WORKING PAPER #40 An Investigation of The Museum of Science and Industry, Chicago’s 2012-2013 Get Re-Energized Module William H. Schmidt Leland S. Cogan Michigan State University March 2014 The content of this paper does not necessarily reflect the views of The Education Policy Center or Michigan State University
Transcript of An Investigation of The Museum of Science and Industry...
WORKING PAPER #40
An Investigation of
The Museum of Science and Industry, Chicago’s 2012-2013 Get Re-Energized Module
William H. Schmidt
Leland S. Cogan
Michigan State University
March 2014
The content of this paper does not necessarily reflect the views of The Education Policy Center or Michigan State University

An Investigation of the Museum of Science and Industry, Chicago’s 2012-2013 Get Re-Energized Module
Author Information William H. Schmidt Leland S. Cogan This work was supported by funding provided by the Boeing Corporation.

1
An Investigation of the Museum of Science and Industry, Chicago’s
2012-2013 Get Re-Energized Module William H. Schmidt
Leland S. Cogan
Michigan State University
Assessments of U.S. students typically reveal stronger performance in science than mathematics yet their science performance remains uninspiring at best. Whether the metric considered is an international benchmark from TIMSS or PISA or the nation’s NAEP report card, the mediocre portrait of U.S. science achievement has remained virtually unchanged over the past 20 years. The most recent science scores from the National Assessment of Educational Progress (NAEP) provide a sobering example. The percentage of students deemed proficient in science decreased across the grades assessed from a high of 34 percent at fourth grade to a low of 21 percent at twelfth grade. Even more disquieting, very few students – no more than one or two percent – performed at the advanced level (National Center for Education Statistics, 2011).
Teachers are a major influence in the achievement of students. However, teachers of science – particularly those in the elementary and middle grades – often do not have the academic background needed to teach science effectively (National Research Council [NRC], 2010, 2013). The need for building the professional capacity for science teachers has been recognized and addressed by many diverse organizations such as colleges and universities, regional school districts, professional organizations, educational consortia and private vendors of educational materials. These disparate offerings have provided little consistency in their purpose, scope or content. Offerings range from those that continue the approach of overviewing a large number of topics at a relatively superficial level to those that provide a more focused approach on specific science content. Research has identified a need for classroom science instruction to provide greater depth of understanding of science topics and concepts (Schmidt et al, 2001; NRC, 2011). If this need is to be addressed, professional capacity-building programs for classroom science teachers must also emphasize greater depth of understanding of science topics and concepts (NRC, 2013).
The Museum of Science and Industry, Chicago (MSI) is a readily accessible resource not only to the people of Chicago but also to a much larger multistate area. Very few communities have access to a science resource that is as vast and comprehensive as MSI. Furthermore, MSI has taken the initiative to establish an active and ongoing multifaceted working relationship with the Chicago Public Schools and other local schools, particularly those serving high-needs student populations. Their role has extended considerably farther than the typical level of engagement of a museum with its community and its schools. The issues of lackluster student achievement in science and science teachers’ access to quality professional capacity-building experiences led

2
MSI to form the Institute for Quality Science Teaching (IQST). One of the key goals of the IQST is to improve the science achievement of 4th-8th grade students in the Chicago area. To accomplish this goal, a series of professional capacity-building courses that occur throughout the K-12 school year was developed and targeted toward the teachers of these students in the Chicago area – a move consistent with NRC recommendations (NRC, 2014; Traphagen & Traill, 2014). Each year IQST offers two concurrent courses that span the K-12 school year. Four different courses have been offered on a rotating basis since October 2006. Three goals have been articulated for all of MSI’s teacher courses: 1) improving teachers’ science content knowledge; 2) increasing teachers’ use of hands-on and inquiry-based strategies in the classroom; and 3) building teachers’ use of external resources, e.g., how to use resources such as MSI and other informal learning institutions and web-based experiences, to improve their science teaching.
The connection between teacher ability and student success has broad support in the science education literature (The Council of Chief State School Officers, 2009). Therefore, recruitment efforts for IQST have focused on those science teachers who have expressed that they have limited ability to teach science effectively. By providing these teachers with content-rich capacity-building experiences in which teachers participate in the same type of inquiry-based, hands-on experiences their students would explore in the classroom or other learning settings, IQST intends to affect a positive change in program participants’ ability to teach science. In affecting the knowledge and confidence of teachers to teach science, IQST seeks to affect the ultimate goal of improving students’ science achievement.
In accord with their ongoing work with the Chicago Public Schools and commitment to other area schools, the museum has had a particular focus on improving the condition of science instruction and the science performance of students in high-need, low socio-economic schools. The application teachers complete for all IQST modules gathers information about teachers and their schools. Teachers in mostly urban, high-poverty schools and those indicating a need for greater capacity in teaching science are given priority in the acceptance process. The museum commits considerable resources for those teachers accepted into these capacity-building modules. In addition to a dedicated instructional staff, the museum provides teachers with instructional materials including lesson plans and lab materials they can use to demonstrate specific concepts addressed in their module as well as one bus to transport the teacher, the students in at least one of the teacher’s classrooms, and adult chaperones for a field trip to the museum. The IQST courses are rich in content and in instructional strategies. Each have been accredited to earn 6 graduate credit hours from the Illinois Institute of Technology or five graduate credit hours from Valparaiso University that may be applied towards a middle-grades science endorsement or a Master’s of Science Education.
This study’s main focus was to evaluate the first of IQST’s course goals, improving teachers’ content knowledge, in one IQST course. This focus was justified both logically and from the
3
research linking teacher knowledge to student knowledge. The module selected for this evaluation project was the Get Re-Energized (GRE) module that focuses on energy topics, a part of the physical sciences and an area of particularly weak performance for U.S. students (Schmidt, McKnight, Cogan, Jakwerth, & Houang, 1999). The GRE module consists of six whole day workshops, one workshop occurring in each of the months October through April. The evaluation team, comprised of MSI staff and consultants from Michigan State University’s Center for the Study of Curriculum, designed the study to focus on what teachers had learned through the GRE module. In the planning process the group was emboldened to include measures for teachers’ students on the possibility that the teachers’ increasing capacity might influence their students at the same time as teachers were acquiring it.
THE STUDY
Once all applications for the Get Re-Energized course had been received and screened according to MSI criteria, applicants were randomly assigned either to participate in the course or to be part of a control group. Two strata were used in this random assignment: 1) whether a teacher had participated in a previous IQST course, and 2) whether a teacher had taught science the previous year. It was thought that both of these conditions might influence the quality of the GRE experience so these were included as specific strata in the random assignment. All applicants were currently teaching science yet less than half had taught science the year immediately prior to the GRE study year. One quarter of the applicants had previously participated in an IQST course other than GRE. There were 60 available seats in the GRE course and 92 applicants available to be randomly assigned. Thus 32 teacher applicants were extended invitations to participate in the GRE study as controls. Those in the control condition were asked to complete the same questionnaires as the GRE participants but were not allowed to take any IQST course that year. As incentives, control teachers were offered the same MSI field trip package as that available to GRE teachers, guaranteed acceptance into a future IQST course of their choosing, and an iPad upon completion of their participation in the study. Only two teachers did not respond to this invitation letter to participate in the control condition. In addition, three GRE participants declined to complete any of the surveys for this study. Analyses of available teacher background characteristics did not reveal any discernable bias introduced into the two groups as a consequence of these non-participations.
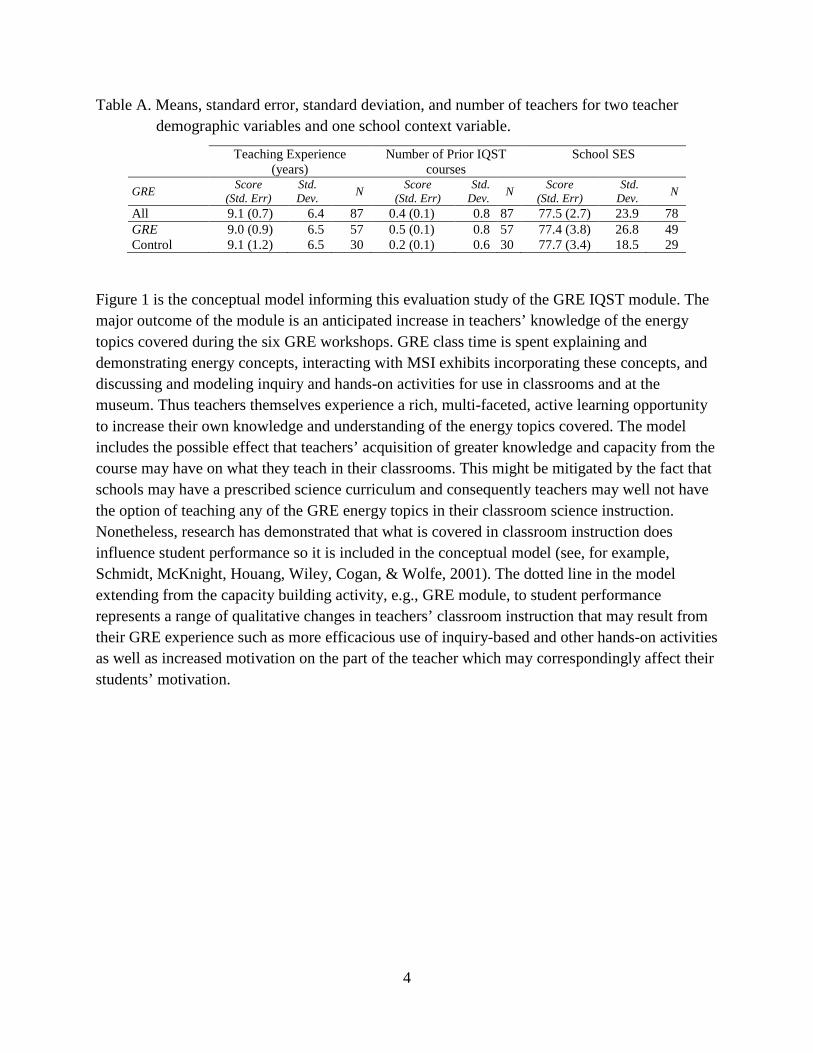
Table A has the means for three key demographic variables for study participants: the mean number of years of teaching experience, the number of prior IQST courses teachers reported having taken, and the mean percentage of students in the teachers’ school eligible for either free or reduced lunch (school SES).
4
Table A. Means, standard error, standard deviation, and number of teachers for two teacher demographic variables and one school context variable.
Teaching Experience (years)
Number of Prior IQST courses
School SES
GRE Score (Std. Err)
Std. Dev. N Score
(Std. Err) Std.
Dev. N Score (Std. Err)
Std. Dev. N
All 9.1 (0.7) 6.4 87 0.4 (0.1) 0.8 87 77.5 (2.7) 23.9 78 GRE 9.0 (0.9) 6.5 57 0.5 (0.1) 0.8 57 77.4 (3.8) 26.8 49 Control 9.1 (1.2) 6.5 30 0.2 (0.1) 0.6 30 77.7 (3.4) 18.5 29
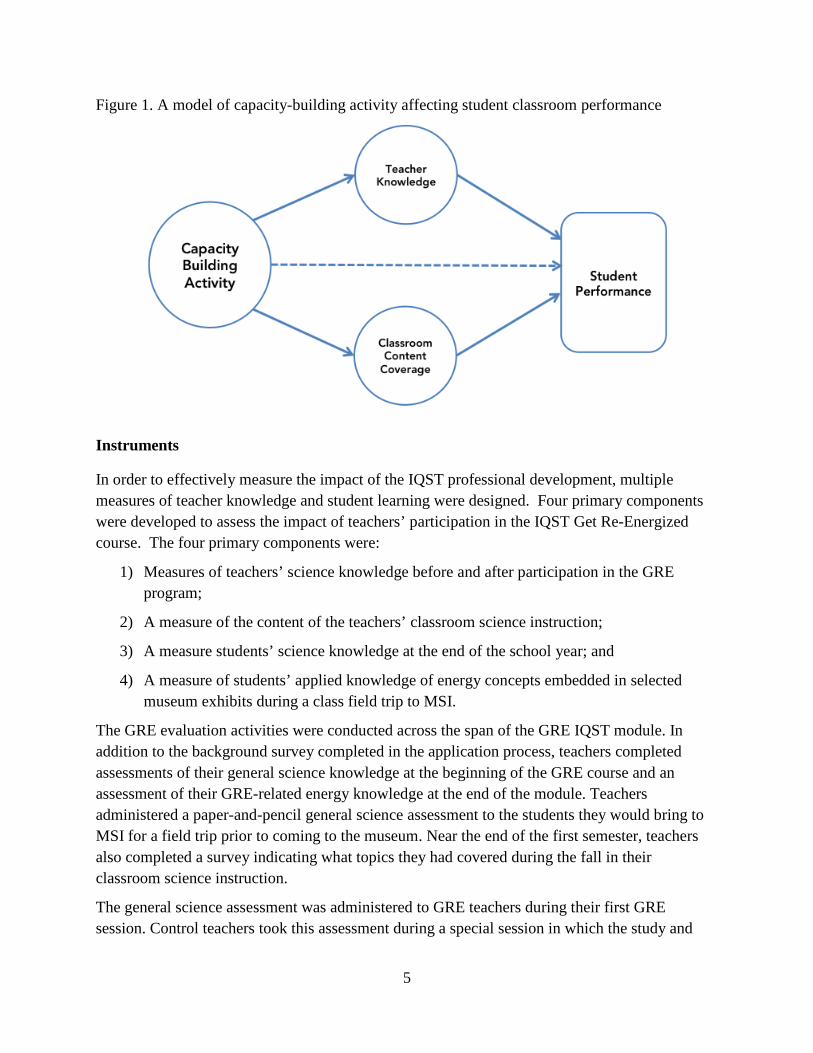
Figure 1 is the conceptual model informing this evaluation study of the GRE IQST module. The major outcome of the module is an anticipated increase in teachers’ knowledge of the energy topics covered during the six GRE workshops. GRE class time is spent explaining and demonstrating energy concepts, interacting with MSI exhibits incorporating these concepts, and discussing and modeling inquiry and hands-on activities for use in classrooms and at the museum. Thus teachers themselves experience a rich, multi-faceted, active learning opportunity to increase their own knowledge and understanding of the energy topics covered. The model includes the possible effect that teachers’ acquisition of greater knowledge and capacity from the course may have on what they teach in their classrooms. This might be mitigated by the fact that schools may have a prescribed science curriculum and consequently teachers may well not have the option of teaching any of the GRE energy topics in their classroom science instruction. Nonetheless, research has demonstrated that what is covered in classroom instruction does influence student performance so it is included in the conceptual model (see, for example, Schmidt, McKnight, Houang, Wiley, Cogan, & Wolfe, 2001). The dotted line in the model extending from the capacity building activity, e.g., GRE module, to student performance represents a range of qualitative changes in teachers’ classroom instruction that may result from their GRE experience such as more efficacious use of inquiry-based and other hands-on activities as well as increased motivation on the part of the teacher which may correspondingly affect their students’ motivation.
5
Figure 1. A model of capacity-building activity affecting student classroom performance
Instruments
In order to effectively measure the impact of the IQST professional development, multiple measures of teacher knowledge and student learning were designed. Four primary components were developed to assess the impact of teachers’ participation in the IQST Get Re-Energized course. The four primary components were:
1) Measures of teachers’ science knowledge before and after participation in the GRE program;
2) A measure of the content of the teachers’ classroom science instruction;
3) A measure students’ science knowledge at the end of the school year; and
4) A measure of students’ applied knowledge of energy concepts embedded in selected museum exhibits during a class field trip to MSI.
The GRE evaluation activities were conducted across the span of the GRE IQST module. In addition to the background survey completed in the application process, teachers completed assessments of their general science knowledge at the beginning of the GRE course and an assessment of their GRE-related energy knowledge at the end of the module. Teachers administered a paper-and-pencil general science assessment to the students they would bring to MSI for a field trip prior to coming to the museum. Near the end of the first semester, teachers also completed a survey indicating what topics they had covered during the fall in their classroom science instruction.
The general science assessment was administered to GRE teachers during their first GRE session. Control teachers took this assessment during a special session in which the study and

6
their participation was explained. The pre-GRE test items had two sources: 1) those developed by the GRE instructional staff that focused on the specific GRE content (5 items), and 2) items adapted from version 5.2 of the Physical, Earth Science, and Life Science assessments developed at the University of Louisville, Center for Research in Mathematics and Science Teacher Development, for use with middle school teachers (25 items). The 30 items assessed three general domains: earth science (12 items); life science (9 items); and physical science (9 items). Teachers were allowed up to 60 minutes to complete the assessment but all completed it in 45 minutes or less.
Near the end of the first semester, teachers completed a survey indicating what they had taught in their science classes up to that point. This instructional content survey was adapted from the teacher questionnaire used in the 1995 Third International Mathematics and Science Study (TIMSS) (see, Schmidt & Cogan, 1996).
The final teacher assessment of GRE-related energy concepts consisted of 35 items. These items came from two sources: energy-related items from the 1995 TIMSS grade 8 science assessment (13 items); and items developed by the GRE instructional staff that focused on the specific GRE content (12 items). Five of the pre-test items were repeated on the post-test.
There were two versions of the classroom paper-and-pencil test for students: one for students in grade 5 or lower and one for students in grades 6-8. Given that the study sought a broad indication of student achievement at the classroom level and student level scores were not of interest, a matrix sampling test design was developed. For students at each of the two levels, 78 items were distributed across 3 forms balancing the major content focus, e.g., earth, life, and physical science. Each form had 24 unique items and the same 6 items that linked the 3 forms. In all, six forms were developed. Three for students in grades 5 or lower were developed using items from the 1995 TIMSS grade 4 science assessment; three forms for middle-grades students developed from the 1995 TIMSS grade 8 science assessment.
Developing a measure of students’ applied knowledge in the context of a museum field trip experience was the most challenging and innovative aspect of this project. This required a non-traditional approach and an opportunity to incorporate the real-time science experiences only available in the museum. The challenge was to measure the students’ ability to think about, and draw conclusions from, a museum exhibit involving energy. In order to accomplish this task, the MSU staff worked with scientists and science educators that were involved in the development of the PROM/SE 8+1 science project (Schmidt et al, 2011). The team visited the museum to identify exhibits that might provide opportunities for students to demonstrate their knowledge and understanding of energy-related concepts found in real-world physical processes. This group then developed and refined sets of questions for each of the identified exhibits to assess students’ understanding of what they had observed. Again, as the study focus was on teachers, only the mean performance reflecting typical student performance in each of the teachers’ classrooms was of interest. Thus questions developed for the six selected exhibits were divided into two sets. Upon arrival at the museum, students were divided into two groups each with an adult chaperone

7
and each group visited three exhibits and responded to the relevant questions. This took about 30 minutes. Dividing the students into groups kept this aspect from being overly burdensome and intrusive to students’ field trip experiences.
Results
Teachers
GRE participating teachers and those randomly assigned to the control condition were assessed twice. An assessment of their general science knowledge encompassing earth, life, and physical science was given early in the fall. An assessment was administered to all teachers at the conclusion of the GRE course that focused on the aspects of physical science covered in GRE. Given the different content focus of the two assessments it is not appropriate to compare them. The general science assessment was included to provide an indication of each individual teacher’s science knowledge that would be used as a covariate in analyzing the end-of-course GRE-content focused assessment. Table 1 presents the means for these assessments. Mean performance of the GRE teachers was 76 percent correct compared to 68 percent correct for control teachers. The 8 percent difference was statistically significant at the .05 probability (p) level (p < .003). Since not all teachers taught at the same grade level, Table 1 also summarizes teachers’ performance by the grade they taught. These means suggest that differences between those in the GRE program and the control group differed by grade level. A formal analysis taking this into account and including the fall pre-test score as a control variable is presented in Table 2.
Table 1. Score means, standard error, standard deviation, and number of teachers (classrooms) by condition and grade(s) taught
Teacher Scores Mean Student Scores Pre-Test Post-Test Classroom Museum Field Trip GRE Grade Score
(Std. Err) Std. Dev. N Score
(Std. Err) Std.
Dev. N Score (Std. Err)
Std. Dev. N Score
(Std. Err) Std.
Dev. N
All All 58.5 (1.4) 13.0 87 73.2 (1.3) 12.4 85 50.6 (1.3) 11.1 68 36.5 (0.8) 7.3 77 GRE All 59.4 (1.7) 12.7 57 76.2 (1.5) 11.4 55 53.0 (1.7) 10.7 40 37.3 (1.0) 7.3 50 Control All 56.9 (2.5) 13.4 30 67.8 (2.3) 12.5 30 47.3 (2.1) 11.0 28 35.1 (1.4) 7.3 27 GRE 4 59.1 (3.1) 13.6 19 77.8 (2.9) 12.3 18 51.9 (2.8) 11.1 16 35.5 (1.5) 6.4 18 Control 4 58.9 (4.4) 10.9 6 67.6 (5.0) 12.3 6 45.7 (5.3) 12.9 6 28.6 (2.5) 6.0 6 GRE 5 57.3 (2.2) 8.6 15 73.5 (2.9) 10.7 14 58.8 (2.8) 9.4 11 36.0 (2.2) 7.9 13 Control 5 53.3 (6.2) 13.9 5 66.9 (3.5) 7.7 5 54.1 (6.3) 12.7 4 31.2 (0.5) 0.8 3 GRE 6 59.7 (3.2) 11.4 13 71.2 (2.5) 8.9 13 46.4 (2.1) 6.0 8 39.3 (2.3) 7.9 12 Control 6 60.0 (6.3) 16.7 7 73.5 (4.5) 12.0 7 41.3 (2.6) 6.9 7 36.0 (2.5) 6.6 7 GRE 7/8 62.7 (5.7) 18.2 10 83.4 (3.4) 10.8 10 54.5 (5.9) 13.1 5 40.9 (2.5) 6.5 7 Control 7/8 55.6 (3.9) 13.6 12 65.0 (4.2) 14.7 12 49.4 (3.2) 10.7 11 39.2 (2.0) 6.7 11

8
An analysis of covariance (ANCOVA) of the teachers’ post-test scores used their pre-test as a covariate. This model yielded a significant fit (p < .0001) with an R2 of 44 percent suggesting that the pretest and the capacity-building activity (CBA) accounted for over 40 percent of the teacher variation in the post-test. The mean performance of GRE teachers was still 8 percent higher than that of the control teachers after adjusting for the pretest. To describe the substantive meaning of the finding, we characterized the size of this mean difference relative to the variation between the 85 teachers – termed the effect size. The estimated effect size was two-thirds of a standard deviation which is typically considered to be quite large in education.
Table 2. Teacher post-test ANCOVA
Source df F Significance Pre-test 1 31.52 0.000 GRE/Control (A) 1 8.79 0.004 Grades taught (B) 3 0.26 0.857 A x B interaction 3 2.82 0.045 Error 76
However, in this particular case the interaction effect was also significant (p < .045) indicating that the effect of the GRE program was not the same for teachers at each of the four grade levels (grades 7 and 8 were combined due to the small sample sizes). Table 1 shows the eight cell means needed to understand the significant interaction. As noted above, if one ignores the interaction, the estimated difference between the two groups is 8 percent, which represents a rather large effect size of two-thirds a standard deviation. For all grades except grade six, GRE teachers did better on the post-test than did the control group teachers. The largest difference was evident among those teaching seventh or eighth grade where the estimated difference controlling for the pretest is 18 percent. The lack of a statistically significant difference between the two groups for sixth grade teachers is not readily explainable from the data available in the study.
Clearly, there are important differences in teacher knowledge related to energy between those teachers who received the yearlong GRE course and those who did not. Given the random assignment of the teachers to the two groups we can interpret this causally, that it was the GRE course that produced the rather large effect size of two-thirds of a standard deviation. The only caveat to this statement is that, given the presence of the interaction, the conclusion must be modified that this was not true for the sixth-grade teachers.
Student Formal Knowledge
The goal of the GRE course and all similar efforts with teachers is to increase their professional knowledge and competence. Yet this is not intended as an end in itself; the ultimate goal is to improve what happens in the classroom, to improve student learning. Thus it is a reasonable question to pose with respect to any capacity building effort such as GRE whether this has had

9
any impact on student learning. The difficulty with this question is that it might be premature to expect to find such an effect in the same year that the teacher him/herself is acquiring the new knowledge. Put simply, it may be too soon to expect such a student impact. Nonetheless, fully aware of this well-reasoned caveat, in designing this evaluation we decided to measure such a potential impact on student learning.
The paper-pencil test of students’ formal knowledge included general science items related to all three areas typically tested at these grade levels – earth, life, and physical science. An analysis of variance compared the mean performance of students whose teachers were in the GRE program with students’ who teachers were not. This ANOVA controlled for test difficulty, using a test level indicator (0/1), given that two different tests were used: one for students in the upper elementary grades and another for students in the middle grades. The model also included a school-level SES indicator to control for demographic differences as students came from different schools across the Chicago area including the city center and various suburbs.
The means for this classroom paper-and-pencil test for GRE teachers/classroom and those in the control group are given in Table 1. Overall, the students of GRE teachers had a mean total test score 6 percentage points higher than the students whose teachers were part of the control group (53 percent vs. 47 percent). The ANOVA testing for the significance of this 6 percent difference was not statistically significant when controlling for the difficulty of the test (p < .068). This result was expected. The test was a general science test and the total test score reflected their knowledge of life and earth science as well as energy and physical science more generally.
Due to the matrix sampled test design which utilized three forms for each classroom and the fact that the classroom, not the individual student, was the unit of analysis four subtests were defined at the classroom level. These results, as well as those for the total test score, are reported in Table 3. For the earth science and life science subtests there were no statistically significant differences between the GRE and control groups (p < .47 and p < .15 respectively), again, what one would expect given the GRE course focus on energy. Given that energy is a critical part of physical science, it is somewhat surprising to find a lack of statistical significance for the physical science subtest scores between the two groups. However, on the energy-specific test items the GRE teachers’ students did better those of the control teachers by a statistically significant amount of 5 percentage points (p < .033).

10
Table 3. ANOVAs on the student classroom test
Test Source df F Significance Total Score GRE/Control 1 3.46 0.068 Test level 1 0.63 0.429 School SES 1 23.28 0.000 Error 58 Physical Science GRE/Control 1 2.60 0.112 Test level 1 1.44 0.235 School SES 1 27.15 0.000 Error 58 Energy GRE/Control 1 4.75 0.033 Test level 1 12.81 0.001 School SES 1 21.30 0.000 Error 58
This pattern of results has a clear element of face validity to it that warrants comment. The student test was designed to determine whether the GRE program has any type of effect on student learning in science broadly defined. Of course, the core part of the test was defined by the energy content, which is the focus of GRE. Yet it is possible, at least conceptually, that such a capacity-building program – a year’s worth of instruction for teachers with limited backgrounds around science content and related instructional practices – would impact student learning in science more generally as the teacher might simply become more confident and effective in teaching science. At least this was the hypothesis that led to the student test blueprint used in the study. The results proved otherwise.
The statistically significant result arrived at for GRE in terms of an effect on student learning occurred only for the test that focused on energy. The GRE effect was specific to the content that served as the focus of the course. Even the broader physical science test, which included the energy items but also covered other non-energy topics, was not significant. It is perhaps this content-specific focus of the GRE module that resulted in the somewhat surprising effect on student learning within the same year as the teachers’ GRE participation.
The findings that opportunity to learn defined by content coverage is related to student learning (Schmidt & Maier, 2009) may lay at the heart of this finding, although in an indirect way; through the teachers’ opportunities which then may affect related student opportunities. The finding of an effect of the GRE program on the performance of the students is truly remarkable in that it occurred within the same year in which the teachers were themselves GRE students. Findings reported in a subsequent section offer some insights as to why this might have occurred. When these results were reported to the GRE teaching staff, their conjecture was that it was related to the practice of giving the teachers in the program instructionally related materials they can use in their classroom instruction immediately following a GRE session.

11
Student Applied Knowledge
One of the most innovative aspects of this research study was the incorporation in the design of a museum-based test component that focused on measuring applied science knowledge related to energy. What was reported on in the previous section was the formal knowledge related to energy or, if you will, the school-based knowledge. Here we look at whether students can identify and understand important energy concepts as they operate in applied, real-world situations such as in machines, cars, inclined plane, etc.
The fact that the GRE program is housed in a world-famous museum makes such a test possible, as many of the exhibits within the museum show various aspects of energy. Secondly, an added focus of the GRE program beyond the energy content is an emphasis on inquiry and teaching science using real-world demonstrations/applications. As described in an earlier section, six such exhibits were chosen and in each, four to five questions were asked related to energy. A total test score was constructed across the six exhibits and all questions within each of the sites indicating the average percent correct for students in each classroom.
Table 4. ANCOVA on student museum-based assessment
Source df F Significance GRE/Control 1 5.73 0.021 Grades taught 3 3.08 0.036 School SES 8 1.37 0.234 Error 47
As teachers taught in schools from the general Chicago area, including the suburbs, which cut across different SES boundaries, a school SES indicator (the percent of students eligible for free and reduced lunch) was also included in the analysis to reduce the error variance. The grade level of the students was also added to the model. Table 4 gives the results of the ANCOVA in which the over-all model was statistically significant (p < .044) with an R2 of .34 indicating the model fit the data reasonably well.
The results also indicated that the difference in mean performance on the applied test of knowledge between the students whose teachers were in the GRE program and those students whose teachers were in the control group was 5 percentage points (39 percent vs 34 percent) indicating an effect size of .7 of a standard deviation (p < .021). Not only does the GRE program have a direct effect on teacher knowledge, but as the previous two sections indicated the program also influenced student performance on both the formal and applied tests.
A model of Student Learning
The question that arises from the student results reported above is how does the GRE capacity-building program have its effect on student performance on the energy subtest? After all, it is the

12
teachers who attended the sessions provided by the museum and not the students. In a previous portion, we hypothesized a model for this process (Figure 1). Here we examine the fit of this model to the data using standard path analysis. Results of the least squares estimation for the causal coefficients for the hypothesized paths are summarized in Figure 2 for the formal student science test.
Figure 2. Path model of capacity building activity affecting student classroom performance
+ p<.135 * p<.05
All of the hypothesized causal paths were found to be statistically significant with one small caveat. The tested model included two measures of classroom content coverage; the topic of energy and physical process and the topic of energy types, sources and conversions. The first of these, and the broader of the two topics, was not significant in the model (p < .l35). However, the relationship for energy types, sources and conversions, which is the focus of the GRE course content, was statistically significant (p < .0003). In addition, the estimate for the effect was large, 1.12, yielding an effect size of almost one full standard deviation implying that GRE teachers spent substantially more time on this topic during the fall term than did those in the control group. In other words, one effect of GRE program was that the GRE teachers, as early as the fall of the year, were spending more time teaching this important energy topic than were the control teachers.
Another interesting finding about the effect of GRE on teacher classroom coverage was with respect to scientific inquiry – an underlying theme of the GRE program. Results reveal a significant effect on the amount of time teachers indicated they spent on this topic during the fall term. More specifically, GRE teachers spent nearly three-fourths of a standard deviation more time covering this empirical aspect of science than did the control teachers.

13
The other GRE program effect discussed in the first section of results was that GRE teachers knew more about energy than did those who hadn’t taken the course. The core of the model suggests three paths by which the GRE program could have an effect on students’ performance on the energy subtest. First is an indirect effect through the program’s impact on teacher knowledge which itself had a large statistically significant impact on student performance as indicated in Figure 2. Second is the indirect path through classroom content coverage as previously described, and third is a hypothetical direct effect controlling for the two indirect effects which, as Figure 2 suggests, was also statistically significant. The meaning of this direct effect is less clear, however, as the GRE sessions were personally experienced by teachers and not by their students. The effect of the capacity-building program would only seem to have the possibility of an indirect effect on student performance. But there is a statistically significant direct effect, even after controlling for the two indirect effects, which represent the two dominant means by which such training would likely have an effect on student performance – through their teacher’s knowledge of the content and in terms of the coverage of the important content in the classroom. What, then, might this direct effect represent?
One possibility is that the measure of content coverage representing only the fall term might be inadequate and the direct effect is merely picking up some additional indirect effect. The other possibility is there is some other impact on the classroom stemming from the GRE course. One possibility is the creation through the teacher of some zeitgeist about science that encourages student performance. For example, it may be that the increased emphasis on scientific inquiry in the classroom by the teacher creates an environment that encourages greater student motivation to learn science. This must remain an hypothesis given that the available data do not allow further explanations. Nonetheless, the bottom line appears to be that the GRE capacity-building course benefited not only the participating teachers but their students as well.
14
References
National Center for Education Statistics. (2011). The Nation’s Report Card: Science 2009. Washington, D.C.: Institute of Education Sciences, U.S. Department of Education.
National Research Council. (2010). Preparing Teachers: Building Evidence for Sound Policy. In Committee on the Study of Teacher Preparation Programs in the United States, Division of Behavioral and Social Sciences and Education, (Ed.), (pp. 232). Washington, D.C.: National Academy Press.
National Research Council. (2011). A Framework for K-12 Science Education: Practices, Crosscutting Concepts, and Core Ideas. Washington, DC: Committee on a Conceptual Framework for New K-12 Science Education Standards. Board on Science Education, Division of Behavioral and Social Sciences and Education. The National Academies Press.
National Research Council. (2013). Monitoring Progress Toward Successful K-12 STEM Education: A Nation Advancing? (pp. 80). Washington, DC: Committee on the Evaluation Framework for Successful K-12 STEM Education; Board on Science Education; Board on Testing and Assessment; Division of Behavioral and Social Sciences and Education; National Research Council.
National Research Council. (2014). STEM Integration in K–12 Education Status, Prospects, and an Agenda for Research. Washington, DC: Committee on Integrated STEM Education; National Academy of Engineering; National Research Council.
Schmidt, W. H., & Cogan, L. S. (1996). Development of the TIMSS Context Questionnaires. In M. O. Martin & D. L. Kelly (Eds.), Third International Mathematics and Science Study Technical Report (Vol. Volume I: Design and Development, pp. 5-1-5-22). Chestnut Hill, MA: Boston College.
Schmidt, W., Leroi, G., Billinge, S., Champagne, A., Hake, R., Heron, P., . . . Williams, P. (2011). Towards Coherence in Science Instruction: A Framework for Science Literacy (pp. 13). East Lansing, MI: Promoting Rigorous Outcomes in Mathematics and Science Education (PROM/SE), Michigan State University.
Schmidt, W. H., & Maier, A. (2009). Opportunity to Learn. In G. Sykes, B. Schneider & D. N. Plank (Eds.), Handbook of Education Policy Research (pp. 541-559). New York: American Educational Research Association, Rutledge.
Schmidt, W. H., McKnight, C., Cogan, L. S., Jakwerth, P. M., & Houang, R. T. (1999). Facing the Consequences: Using TIMSS for a Closer Look at U.S. Mathematics and Science Education. Dordrecht/Boston/London: Kluwer.
Schmidt, W. H., McKnight, C. C., Houang, R. T., Wang, H. A., Wiley, D. E., Cogan, L. S., & Wolfe, R. G. (2001). Why Schools Matter: A Cross-National Comparison of Curriculum and Learning. San Francisco: Jossey-Bass.

15
The Council of Chief State School Officers. (2009). Effects of Teacher Professional Development on Gains in Student Achievement: How Meta Analysis Provides Scientific Evidence Useful to Education Leaders (pp. 71). Washington, DC: Council of Chief State School Officers.
Traphagen, K., & Traill, S. (2014). Report from the Field: How Cross-Sector Collaborations are Advancing STEM Learning (pp. 35). Los Altos, CA: The Noyce Foundation.