An investigation of serious injury motor vehicle...
104
An investigation of serious injury motor vehicle crashes across metropolitan, regional and remote Western Australia RR 09-001 CURTIN-MONASH ACCIDENT RESEARCH CENTRE School of Public Health Curtin University Hayman Road Bentley WA 6102 Peter Palamara; Kriti Kaura and Michelle Fraser January 2013
Transcript of An investigation of serious injury motor vehicle...

An investigation of serious injury motor vehicle crashes
across metropolitan, regional and remote Western Australia
RR 09-001
CURTIN-MONASH ACCIDENT RESEARCH CENTRE
School of Public Health
Curtin University
Hayman Road
Bentley WA 6102
Peter Palamara; Kriti Kaura and Michelle Fraser January 2013

ii
CURTIN-MONASH ACCIDENT RESEARCH CENTRE DOCUMENT RETRIEVAL INFORMATION
__________________________________________________________________________ Report No. Project No. Date Pages ISBN RR 09-001 09-002 RSC January 2013 82+ N/A ___________________________________________________________________________ Title An investigation of serious injury motor vehicle crashes across metropolitan, regional and rural Western Australia ___________________________________________________________________________ Author(s) Palamara, P.; Kaura, K., Fraser, M. ___________________________________________________________________________ Performing Organisation Curtin-Monash Accident Research Centre (C-MARC) School of Public Health Curtin University Hayman Road BENTLEY WA 6102 Tel: (08) 9266-2304 Fax: (08) 9266-2958 www.c-marc.curtin.edu.au ___________________________________________________________________________ Sponsor Road Safety Council of Western Australia c/- Office of Road Safety Department of Transport 10th Floor 40 St. George’s Terrace PERTH WA 6000 ___________________________________________________________________________ Abstract Previous research has identified that road crashes in the non-metropolitan area are significantly more likely to result in more severe injuries compared with those occurring in the metropolitan area. The aims of this study were twofold: to (i) review the published literature in regard to the factors associated with serious injury crashes across metropolitan and rural (regional and remote) areas, and (ii) to quantify and elucidate the risk of serious injury across Western Australia using police reported crash data for the period 2005-2009. Compared with crashes in the metropolitan area, crashes in the regional and remote area were 25%-50% more likely to result in an injury (any level) and two to three times more likely to result in either the death or hospitalisation of an involved road user. A range of crash, road, road user and behavioural issues were identified and discussed as contributing factors to the increased incidence of serious injuries in the regional and remote areas. This was followed up with a number of recommendations for further research in the areas of safer roads and roadsides, safer speeds, and safer road use and users. ___________________________________________________________________________ Keywords Road safety; motor vehicle crashes; serious injury; metropolitan, regional, remote area ___________________________________________________________________________ Disclaimer This report is disseminated in the interest of information exchange. The views expressed here are those of the authors and not necessarily those of Curtin University or Monash University. ___________________________________________________________________________

iii
TABLE OF CONTENTS
LIST OF TABLES ..................................................................................................................... v
LIST OF FIGURES ................................................................................................................. viii
EXECUTIVE SUMMARY ....................................................................................................... ix
ACKNOWLEDGEMENTS .................................................................................................... xxi
1. INTRODUCTION .................................................................................................................. 1 1.1 Crashes by geographic location ....................................................................................... 2 1.2 Aims and objectives ......................................................................................................... 3
2. METHOD ............................................................................................................................... 5 2.1 Ethics approval ................................................................................................................ 5 2.2 Literature search and retrieval ......................................................................................... 5 2.3 Western Australian motor vehicle crashes ....................................................................... 5
2.3.1 Definition and selection of serious injury motor vehicle crashes .......................... 6 2.3.2 Classification of the location of serious injury motor vehicle crashes ................... 7 2.3.3 Data management and analysis .............................................................................. 8
3. LITERATURE REVIEW ....................................................................................................... 9 3.1 Demographic factors ........................................................................................................ 9
3.1.1 Age ......................................................................................................................... 9 3.1.2 Gender .................................................................................................................. 10
3.2 Driver behavioural factors ............................................................................................. 10 3.2.1 Speed .................................................................................................................... 10 3.2.2 Seat belt use .......................................................................................................... 11 3.2.3 Alcohol ................................................................................................................. 13 3.2.4 Fatigue .................................................................................................................. 15
3.3 Road user type ............................................................................................................... 16 3.3.1 Pedestrians ............................................................................................................ 17 3.3.2 Motorcyclists ........................................................................................................ 18 3.3.3 Bicyclists .............................................................................................................. 18
3.4 Road characteristics ....................................................................................................... 19 3.4.1 Road alignment ..................................................................................................... 19 3.4.2 Road gradient ....................................................................................................... 19 3.4.3 Road surface ......................................................................................................... 19
3.5 Crash and vehicle characteristics ................................................................................... 20 3.5.1 Multi-vehicle crashes ........................................................................................... 20 3.5.2 Single vehicle crashes .......................................................................................... 21 3.5.3 Vehicle type .......................................................................................................... 21
3.6 Limitations ..................................................................................................................... 21 3.7 Summary and conclusion ............................................................................................... 22
4. ANALYSIS OF WESTERN AUSTRALIAN CRASH DATA 2005-2009 ......................... 25 4.1 Crash severity and location of crashes ........................................................................... 25 4.2 Serious injury crash analysis .......................................................................................... 26
4.2.1 Selected crash characteristics ............................................................................... 26 4.2.2 Road characteristics .............................................................................................. 31

iv
4.2.3 Road user characteristics ...................................................................................... 35 4.2.4 Drivers/riders ........................................................................................................ 35 4.2.5 Passengers ............................................................................................................ 43 4.2.6 Pedestrians ............................................................................................................ 46
4.3 Vehicle characteristics ................................................................................................... 49 4.3.1 Vehicle Type ........................................................................................................ 49 4.3.2 Vehicle Registration Status .................................................................................. 50
4.4 Multivariate analysis of serious injury crash risk by location ....................................... 51 4.4.1 Crash and road factors .......................................................................................... 51 4.4.2 Driver/rider factors ............................................................................................... 52
5. DISCUSSION ...................................................................................................................... 55 5.1 Introduction .................................................................................................................... 55 5.2 The association between location of crash and crash severity ....................................... 55 5.3 Safe Roads and Roadsides ............................................................................................. 56 5.4 Safe Speeds .................................................................................................................... 59 5.5 Safe Vehicles ................................................................................................................. 62 5.6 Safe road use and users .................................................................................................. 64 5.7 Methods Issues ............................................................................................................... 68
6. RECOMMENDATIONS ..................................................................................................... 70
7. REFERENCES ..................................................................................................................... 75

v
LIST OF TABLES
Table 1.1 Distribution of fatal crashes by remoteness index; Australia 2002-2006 ........... 2
Table 3.1 Fatalities by road user group and year, Western Australia, 2001-2006 ........... 16
Table 3.2 Hospitalisations by road user group and year, Western Australia, 2001-2006 (Meuleners, 2007) ............................................................................................. 17
Table 4.1 Severity of crashes; by location, Western Australia, 2005-2009 ..................... 25
Table 4.2 Unadjusted odds of an injury crash (any level) and serious injury crash; by location of crash, Western Australia, 2005-2009 ............................................. 26
Table 4.3 Crash nature of serious injury crashes; by location, Western Australia, 2005-2009 .................................................................................................................. 27
Table 4.4 Selected primary object types for hit object serious injury crashes; by location, Western Australia, 2005-2009 .......................................................................... 28
Table 4.5 Categories of road user movements for serious injury crashes; by location, Western Australia, 2005-2009 .......................................................................... 29
Table 4.6 Time of day of serious injury crashes; by location, Western Australia, 2005-2009 .................................................................................................................. 30
Table 4.7 Lighting conditions for serious injury crashes; by location, Western Australia, 2005-2009 ......................................................................................................... 30
Table 4.8 Day of week of serious injury crashes; by location, Western Australia, 2005-2009 .................................................................................................................. 31
Table 4.9 Posted speed zone of serious injury crashes; by location, Western Australia, 2005-2009 ......................................................................................................... 32
Table 4.10 Road surface of serious injury crashes; by location, Western Australia, 2005-2009 .................................................................................................................. 32
Table 4.11 Road alignment of serious injury crashes; by location, Western Australia, 2005-2009 ......................................................................................................... 33
Table 4.12 Road grade of serious injury crashes; by location, Western Australia, 2005-2009 .................................................................................................................. 33
Table 4.13 Condition of road of serious injury crashes; by location, Western Australia, 2005-2009 ......................................................................................................... 34
Table 4.14 Road ownership of serious injury crashes; by location, Western Australia, 2005-2009 ......................................................................................................... 34
Table 4.15 Road users involved in serious injury crashes; by location, Western Australia, 2005-2009 ......................................................................................................... 35
Table 4.16 Injury outcome* of drivers/riders involved in serious injury crashes; by location, Western Australia, 2005-2009 ........................................................... 36
Table 4.17 Age of drivers/riders involved in serious injury crashes; by location, Western Australia, 2005-2009 ........................................................................................ 37
Table 4.18 Sex of drivers/riders involved in serious injury crashes; by location, Western Australia, 2005-2009 ........................................................................................ 37

vi
Table 4.19 Licensing status of drivers/riders* involved in serious injury crashes; by location, Western Australia, 2005-2009 ........................................................... 38
Table 4.20 Driver demographics associated with unlicensed driving for those involved in a serious injury crash in the metropolitan, regional and remote areas of Western Australia; 2005-2009 ........................................................................................ 39
Table 4.21 Presence of alcohol among drivers/riders involved in serious injury crashes; by location, Western Australia, 2005-2009 ........................................................... 40
Table 4.22 Positive Blood Alcohol Concentration Level of drivers/riders involved in serious injury crashes; by location, Western Australia, 2005-2009 ................. 40
Table 4.23 Driver demographics and licensing status associated with a positive BACL for drivers/riders involved in a serious injury crash in the metropolitan, regional and remote areas; Western Australia 2005-2009 .............................................. 41
Table 4.24 Seat belt/helmet use by drivers/riders* involved in serious injury crashes; by location, Western Australia, 2005-2009 ........................................................... 42
Table 4.25 Driver demographics, licensing status and alcohol use associated with the non-use of a seat belt/helmet by drivers/riders involved in a serious injury crash in the metropolitan regional and rural areas; Western Australia 2005-2009 ........ 43
Table 4.26 Injury outcome of passengers involved in serious injury crashes; by location, Western Australia, 2005-2009 .......................................................................... 44
Table 4.27 Age of passengers involved in serious injury crashes; by location, Western Australia, 2005-2009 ........................................................................................ 45
Table 4.28 Sex of passengers involved in serious injury crashes; by location, Western Australia, 2005-2009 ........................................................................................ 45
Table 4.29 Seat belt/helmet use by passengers involved in serious injury crashes; by location, Western Australia, 2005-2009 ........................................................... 46
Table 4.30 Injury outcome of pedestrians involved in serious injury crashes; by location, Western Australia, 2005-2009 .......................................................................... 47
Table 4.31 Age of pedestrians involved in serious injury crashes; by location, Western Australia, 2005-2009 ........................................................................................ 47
Table 4.32 Sex of pedestrians involved in serious injury crashes; by location, Western Australia, 2005-2009 ........................................................................................ 48
Table 4.33 Posted speed zone of serious injury pedestrian crashes; by location, Western Australia, 2005-2009 ........................................................................................ 48
Table 4.34 Time of day of serious injury pedestrian crashes; by location, Western Australia, 2005-2009 ........................................................................................ 49
Table 4.35 Vehicles* involved in serious injury crashes; by location, Western Australia, 2005-2009 ......................................................................................................... 50
Table 4.36 Registration status of motorised vehicles involved in serious injury crashes; by location, Western Australia, 2005-2009 ........................................................... 50
Table 4.37 Multinomial Logistic Regression of metropolitan*, regional and remote serious injury crashes by crash and road factors; Western Australia, 2005-2009 ........ 52

vii
Table 4.38 Multinomial Logistic Regression of metropolitan*, regional and remote serious injury crashes by driver/rider+ factors; Western Australia, 2005-2009 ............ 54

viii
LIST OF FIGURES
Figure 1.1 Road crash fatality rate; Western Australia 1961-2006 ...................................... 1
Figure 3.1 Fatal crashes attributed to speed; Western Australia, 2001-2006 (Marchant, et al., 2008). .......................................................................................................... 11
Figure 3.2 Linear Regression between seat belt compliance and road traffic death rates in 46 high income countries (Abbas, Hefny & Abu-Zidan, 2011) ....................... 12
Figure 3.3 Motor vehicle occupant fatalities where seat belts were not worn; by year, Western Australia 2001-2006 (Marchant et al., 2008). .................................... 13

ix
EXECUTIVE SUMMARY
Introduction
Road injury is a major public health concern throughout the world. Serious injuries are not
only a financial burden but also a personal burden to those involved. Numerous studies have
identified that the risk of crash involvement and the severity of injury varies with geographic
location. In general, proportionally more crashes are recorded in urban or metropolitan areas
while non-urban (regional and remote) area crashes are more likely to result in either the
death or hospitalisation of an involved road user.
The aims of this investigation were two-fold. Firstly, to synthesise the understanding of
factors that contribute to crashes of varying injury severity by location of occurrence, and
secondly, to compare this understanding with that derived from the analysis of serious injury
crashes across Western Australia. The specific objectives of the investigation were to:
Critically review the published research literature to identify the range of factors
associated with the occurrence of a serious injury motor vehicle crash by location of
crash;
Describe the epidemiology of serious injury crashes across metropolitan, regional and
remote Western Australia and relevant risk factors through an analysis of police
reported crash data;
Compare and contrast the findings of the literature review with those obtained from
the analysis of Western Australian crash data; and to
Where warranted, provide recommendations for further research.
Method
For the literature review, a search of relevant databases including Google Scholar, ProQuest,
Current contents, Scopus, Factiva and EconLit was conducted using ‘key words’ to identify
local, national and international reports, referred journal articles and conference papers
examining motor vehicle crashes by location of crash. The search was restricted to
publications from 1990 onwards. For the analysis of Western Australian crash data, police
records of all on-road motor vehicle crashes (both police attended/reported and road user
reported) occurring during the period 2005-2009 in Western Australia were extracted by Main
Roads Western Australia from their Integrated Road Information System (IRIS). After an
initial set of analyses, the larger dataset of all police recorded crashes was reduced to those
resulting in a ‘serious injury’ (defined as those resulting in the death or hospitalisation of an

x
involved road user). Factors associated with the distribution of serious injury crashes across
the metropolitan, regional and remote areas of Western Australia were investigated. For the
purposes of this study, the local government area of the crash reported in the IRIS database
was assigned an Accessibility/Remoteness Index of Australia (ARIA) code and then
categorised as metropolitan, regional and remote for analysis.
Summary of the main findings of the review of the literature
The literature review summarised the existing evidence on factors associated with serious
injury crashes in different geographic locations (metropolitan, rural and remote areas). Factors
reviewed include demographic, behavioural, road user, road and crash/vehicle characteristics.
The main findings include:
Demographic factors
Fatal and injury crash rates may be lower for metropolitan versus rural novice drivers
up to two years post licensure.
Males are more commonly involved than females in rural and remote area fatal and
hospitalisation crashes.
Driver behavioural factors
Speed compliance in Western Australia has been increasing since 2000 on both
metropolitan and rural roads and in 2011 was noted (across all zones) to be higher on
rural roads compared with metropolitan roads.
In Western Australia in 2011, compliance was lowest on 60km/hour roads in the
metropolitan area (51.8%) and 90km/hour zones in the rural area (59.9%).
Speeding is estimated to be a contributing factor in up to 29% fatal crashes in remote
WA compared with 26.5% of regional and 19% of metropolitan fatal crashes.
Seat belt usage rates are lower among motor vehicle occupants in rural or remote areas
than in metropolitan areas of WA.
The proportion of motor vehicle occupants in WA killed or hospitalised due to a crash,
not wearing a seat belt, increases with the ARIA remoteness index.
The burden of road crash related injury associated with drink driving is
disproportionately high in rural areas of Australia.
Around 19% of rural/ remote drivers in northern WA report falling asleep at the wheel
at least once.

xi
It has been estimated that fatigue is the primary contributing factor in 30% of fatal
crashes on rural roads throughout Australia.
Road user type
The majority of pedestrian crashes in Western Australia occur in metropolitan areas
but rural and remote pedestrian crashes are more likely to result in death.
Alcohol consumption by pedestrians may be an important risk factor in fatal
pedestrian crashes in rural and remote areas.
A significant proportion of fatal motorcycle crashes take place on rural and remote
roads (34%).
Little is known about the risk factors for bicycle crashes in rural and remote areas.
Road characteristics
In Western Australia the majority of all reported crashes occur on straight roads.
However, international evidence suggests that the risk of single vehicle crashes
increases with the density of sharp bends in rural areas.
The majority of fatal crashes occur on sealed roads in Australia. However, crashes in
rural and remote areas are more likely to occur on unsealed surfaces compared with
metropolitan areas.
The majority of sealed roads with unsealed shoulders in WA are in rural and remote
areas. Treatment of sealed shoulders is a highly effective method for reducing all-
severity crashes, casualty crashes and the cost of crashes.
The proportion of crashes in higher speed zones gradually increases as the ARIA
remoteness indicator increases.
Crash and vehicle characteristics
The majority (87%) of fatalities on rural and remote Western Australian roads are due
to single-vehicle crashes. Single vehicle crashes have been found to commonly occur
in high speed zones and on curved and unsealed roads and often have more severe
outcomes than multi-vehicle crashes.
Rural and remote environments constitute a mix of vehicle types including cars, buses,
heavy trucks, agricultural vehicles, mopeds and bicycles and this diverse mix increases
the likelihood of a crash in these road environments, though truck and heavy vehicle
crashes are more common on rural versus metropolitan roads.

xii
Conclusion
Fatal and serious injury crashes that result in hospitalisation are significant problems across
metropolitan, rural and remote locations, including those in WA, with the risk of death and
hospitalisation higher when crashes occur in the non-urban areas. This review identified
several risk factors for crashes in these geographical regions and how they differ between
regions. Existing evidence however, comes from several different sources internationally and
nationally, using a wide variety of definitions for geographical regions and crash severity.
Summary of the main findings of the analysis of Western Australia crash data 2005-2009
Crash severity and location
A total of 196,276 crashes were recorded by WA Police during the period 2005-2009.
Approximately 82% of crashes occurred in the metropolitan Perth area, 12% in the
regional area, and 6% in the remote areas of WA.
Serious injury crashes involving either the death or hospitalisation of an involved road
user totalled 11,874 and accounted for 6.1% of all crashes recorded during the study
period.
Minor injury crashes requiring medical treatment only constituted a further 13.8%,
with the majority (80.1%) of crashes across the State resulting in only minor to major
property damage.
The majority of serious injury crashes occurred in the metropolitan area (67.8%),
versus the regional (19.2%) and remote areas (13%). Serious injury crashes accounted
for a significantly higher proportion of all crashes in the regional (9.6%) and remote
(14%) areas, compared with the metropolitan area (4.9%).
Compared with crashes in the metropolitan area, a crash in the regional and remote
area was respectively 25% and 50% more likely to result in an injury (any level) to an
involved road user, and two to three times more likely to result in either death or
hospitalisation (i.e., serious injury).
Serious injury crashes were three to 4.5 times more likely to result in the death versus
hospitalisation of a road user when occurring in the regional and remote areas relative
to the metropolitan area.
Univariate analysis of crash, road, road user and vehicle factors
Multivehicle crashes involving right turn-right thru manoeuvres, particularly at
intersections, were the predominant metropolitan crash type, whereas single vehicle

xiii
run off road hit object and roll-over crashes were the predominant crash type in
regional and remote areas.
When vehicles were involved in hit object collisions they most commonly collided
with trees and embankments in the regional and remote areas compared with kerbs,
trees and traffic islands in the metropolitan area. Very few vehicles in any area
collided with an identified roadside barrier.
Around six in ten serious injury crashes in the metropolitan area occurred on roads
with posted speed limits of 60km/hour or less, while the majority of serious injury
crashes in regional (46.5%) and remote areas (62.1%) occurred on roads with the
maximum posted speed limit (110km/hour).
The proportion of crashes occurring on unsealed roads was substantially higher in the
remote area (21.9%) and slightly higher in the regional area (7.7%), compared with the
metropolitan area (0.5%) of WA.
Crashes on curved sections of road were twice as likely in the regional (35.8%) and
remote areas (32.4%) of WA, compared with the metropolitan area (17.6%).
Around two-thirds of serious injury crashes in the metropolitan area occurred on local
government owned roads compared with just under 50% for the regional and remote
areas. However, local government was the predominant owner of unsealed crash
involved roads in the regional and remote areas.
Approximately 25,798 road users were involved in the 11,874 serious injury crashes,
with three-quarters being drivers. Passengers accounted for one-quarter to four in 10
involved road users in the regional and remote areas and 16% in the metropolitan area.
For drivers who were injured, they were approximately three times as likely to be
killed in regional and remote area crashes compared with metropolitan area crashes.
Males accounted for two-thirds of all seriously injured drivers, with this figure being
higher in the regional (68.4%) and remote areas (71.4%) compared with the
metropolitan area (65%).
Across all locations, 79.7% of seriously injured drivers/riders held a full licence, with
a further 11.1% holding a provisional licence. In the remote area, 6.9% of the driver/
riders were unlicensed, 4.9% had a cancelled licence and 3.9% had a suspended
licence.

xiv
Across all locations males and younger age drivers were more likely to be driving
without a valid licence, with the risk for these factors being greatest for regional and
remote area crashes compared with the metropolitan area crashes.
Drivers/riders involved in a serious injury crash in metropolitan Perth were less likely
to record a positive Blood Alcohol Concentration Level (BACL) (11.2%) compared
with those in regional (16.5%) and remote areas (23.4%). Overall, 51% of the
drivers/riders testing positive for alcohol recorded a BACL exceeding 0.100gm%,
with this figure being highest in the remote area (63.7%).
Across all locations, crash involved males, younger age drivers/riders and unlicensed
drivers/riders were significantly more likely to be record a positive BACL, with some
variation in the risks associated with these factors across the locations.
Just under 6% of all crash involved drivers/riders were recorded to be not wearing
protection (seat belt or helmet), with this figure highest for those crashing in the
regional (7.6%) and remote areas (15.6%), compared with the metropolitan area (4%).
Males and those recording a positive BACL across all areas were significantly more
likely to be unprotected at the time of the crash. Unlicensed drivers/riders crashing in
the metropolitan and remote areas were also significantly more likely to have not used
protection. Variation in the risks associated with these factors was noted across the
locations.
Passengers involved in a serious injury crash were significantly more likely to be
killed in the regional (6.7%) and remote areas (7.8%), compared with the metropolitan
area (2.5%).
Passengers injured in remote area crashes were three times more to have not used
protection (33.8%) than passengers injured in regional (10.9%) and metropolitan
(8.4%) area crashes.
Serious injury crashes involving pedestrians were most likely to occur in the
metropolitan area (77.3%) and in most cases resulted in hospitalisation only.
Pedestrians were more likely to be killed in crashes occurring in the regional (13.3%)
and remote (17.4%) areas compared with the metropolitan area (7.4%). This may be
due to a higher proportion of pedestrian crashes occurring in high speed zones
(≥80km/hour) in the regional and remote areas.

xv
Trucks were more frequently involved in serious injury crashes in the regional and
remote areas, while bicycles were more frequently involved in serious injury crashes
in the metropolitan area.
Motorcycles and their derivatives were consistently represented in crashes across the
locations though the nature of their crashes varied. They were more often involved in
multiple vehicle crashes in the metropolitan areas and more likely to be involved in
single vehicle crashes in the regional and remote area.
Multivariate analyses of crash/road and road user factors
Compared with the metropolitan Perth area, serious injury crashes in the regional and
remote areas were significantly more likely to involve a single vehicle rather than
multiple vehicles/units (OR=1.65 regional; OR=3.0 remote), to occur on unsealed rather
than sealed roads (OR=6.51 regional; OR=19.0 remote), on curves rather than straight
sections of road (OR=2.15 regional; OR=2.35 remote) and on roads with posted speed
limits of ≥90km/hour compared with ≤80km/hour (OR=9.21 regional; OR=12.01 remote).
Compared with the metropolitan area, increased odds of involvement in a serious
injury crash in the remote area were identified for male drivers (OR=1.25); drivers
aged 25-39 years (OR=1.43); drivers recording a BACL of ≥0.101gm% (OR=2.54),
0.05gm%-0.100gm% (OR=1.54) and 0.001gm%-0.49gm% (OR=1.48), and drivers
who did not hold a valid licence at the time of the crash (OR=2.13).
Compared with serious injury crashes in the metropolitan area, increased odds of
involvement in a serious injury crash in the regional area were identified for drivers
aged 40-59 years (OR=1.36) while drivers aged 17-24 years showed reduced odds of
crashing (OR=0.86). All positive BACL were associated with an increased odds of
crashing in the regional area: ≥0.101gm% (OR=1.72); 0.05gm%-0.100gm%
(OR=1.70), and 0.001gm%-0.049gm% (OR=1.55). Driver sex and driver licence
status were not significantly associated with serious injury crashes in the regional area.
Summary discussion
As noted in other studies, a significant relationship was identified between the location of the
crash and the injury severity of the crash. Calculation of the odds associated with being
injured (any level), seriously injured, and killed showed that compared with crashes in the
metropolitan area, non-urban area crashes, and particularly those in the remote area, entail a
higher risk of injury and more severe injury. Notwithstanding this finding, the majority of the

xvi
road injury burden, because of the absolute numbers of road users injured, can be attributed to
crashes within the metropolitan area.
The findings of the study can be discussed in relation to safer roads, safer speeds, safer
vehicles and safer road use and users. In relation to safer roads, there is a clear need to
continue the existing micro analysis of metropolitan intersection with a high incidence of
serious injury crashes because of the identified higher contribution of crashes in these
environments to serious injuries in metropolitan Perth. In contrast, in the regional and remote
areas of Western Australia it is imperative that roads are treated using known effective
initiatives to reduce the comparatively high incidence of single vehicle run off road crashes
which are a significant feature of the serious injury crashes in these locations. This finding
was consistent with that identified in the review of the published literature. Treatment of the
non-urban area roads to reduce run off road crashes is a responsibility for the State and the
local government sector, which together share and ownership of the non-urban area roads on
which these serious injury crashes occur.
Whilst it was not possible to investigate the role of illegal speeding in the serious injury
crashes examined, there was reasonable evidence to conclude that speeding is strongly
implicated in the higher incidence of serious injury crashes in regional and remote WA. This
concurs with previous research which has identified a higher incidence of serious injury
crashes in higher speed zones in the non-urban area. Thus, limiting travel speeds in the non-
urban areas to those that are within biomechanical tolerances in the event of a crash is
essential, particularly if the road does not have the necessary treatments and infrastructure to
manage crash forces and limit injury severity. The higher incidence of serious injury crashes
on unsealed roads in the regional and remote area also suggests that open speed limits on
these roads be reduced to limit loss of control/run off road crashes. In addition to addressing
the appropriateness of speed limits on non-urban area roads, attention must be given to how
best to enforce existing speed limits in these locations. To this end the program of enhanced
speed enforcement being implemented by WA. Police is an important initiative in reducing
speed related crashes across the State and particularly on regional and remote areas roads
which are often ‘under enforced’.
As with other studies of non-urban area crashes, trucks were more likely involved in serious
injury crashes in regional and remote area crashes, which is perhaps due to the greater
exposure of these vehicles to these roads. Heavy vehicle use and particularly long haul

xvii
transport is known to represent a considerable crash risk for a variety of work, environment
and driver related reasons. A better understanding of the potential crash risk factors for trucks
and heavy vehicles in the non-urban area may be derived from the nation-wide investigation
of heavy vehicle crashes that is soon to be concluded. The higher incidence of single vehicle
crashes in the non-urban area also underscores the importance of increasing the uptake of
vehicles with technologies such as electronic stability control and traction control that will
reduce the incidence of loss of control, run off road crashes.
This study noted a number of significant findings in relation to the behaviour of drivers in the
regional and remote area that can potentially explain their higher involvement in serious
injury crashes. In general, drivers involved in crashes in these areas, compared with those
crashing in metropolitan Perth, were more likely to have recorded a higher level of Blood
Alcohol Concentration, to be unlicensed, and to not have worn a seat belt. This pattern of
unsafe, risky behaviour may be due to a perceived and/or actual lower likelihood of detection
and greater community tolerance of such behaviours. Male drivers were more likely than
female drivers to engage in such behaviours. Consequently there is a strong need to
understand the factors contributing to such risk behaviours and how best to intervene to
reduce the contribution of these factors to serious injury crashes in the non-urban area.
In summary, it is reasonable to conclude that a combination of road, environment, speed, and
road user behaviours are likely contributing factors to the higher incidence of serious injury
crashes in regional and remote WA. That said the findings of the study are tempered by the
use of police reported data and not linked data which would confirm the injury outcomes of
involved road users. Furthermore, the examination of contributing factors was limited by the
unavailability of other driver behavioural factors such as fatigue and illegal speeding and
information on the crash worthiness of involved vehicles. Most importantly the study was not
able to examine the role of post-crash care and how this may be a contributing factor to the
higher incidence of fatal injuries among non-urban area crashes as has been observed
elsewhere.
Recommendations
This study noted a range of safer roads, safer speeds, safer vehicle, and safe road use factors
that go some way towards explaining the identified variation across Western Australia in the
distribution of serious injury crashes. It is clear however, that additional research is required
using a variety of methods to further elucidate the causes of and potential countermeasures for

xviii
serious injury crashes across WA. The following recommendations for future research were
developed after consultation with the WA Office of Road Safety.
Safer Roads and Roadsides
1. Expansion of the Main Roads WA micro analysis of serious injury crashes at
metropolitan intersections to further investigate the contribution of road and driver
factors to crashes at intersections.
This study noted that one in five serious injury crashes in the metropolitan area occur
at intersections, with around four in ten serious injury crashes involving vehicles
colliding at right-angles. The first tranche of 20 metropolitan intersections investigated
by the micro-analysis noted a number of potential contributing factors and made
recommendations for cost-effective treatments. It is recommended that the micro-
analysis be extended to the next 20 intersections for serious injury crashes.
2. Further research to identify new and innovative treatments for metropolitan intersections.
To complement Recommendation 1, it is recommended that further research be
undertaken to identify new and innovative treatments for metropolitan intersections,
including signalised and non-signalised intersections. This work should also include
proposals for the development, implementation and evaluation of trials of innovative
measures to create Safe System intersections.
3. In-depth analysis of the factors contributing to run off road crashes and treatments to
reduce the incidence of and injury severity.
This study noted that single vehicle run off road crashes accounted for around one-
quarter of serious injury crashes in the metropolitan area and nearly 60% and 70%
respectively of serious injury crashes in the regional and remote areas. Further to this,
around a third of run off road crashes in the regional and remote areas occurred on
curves, with most run off road crashes across all three areas resulting in the collision
with an object other than a designated barrier. On the basis of these findings it is
recommended that a micro-analysis style project be developed to identify and review
roads with a high incidence of run off road events to investigate potential contributing
crash and injury factors and appropriate cost-effective countermeasures by location.
This project can also draw on the findings from two current C-MARC projects: the

xix
epidemiology of single vehicle run off road crashes in metropolitan Perth, and, a
review of initiatives to improve curve delineation.
Safe Speeds
4. Identify and audit high crash risk roads in the regional and remote locations to
determine the appropriateness of the current speed zone and need for rezoning.
Though this study was not able to investigate the contribution of excess or
inappropriate speeds to serious injury crashes across Western Australia, there was
some evidence to support previous research identifying a relationship between crashes
in higher speed zones (90km/hour and higher) and serious injury outcomes for the
regional and remote area. At issue is whether the roads on which these crashes have
occurred are appropriately speed zoned for their condition and level of infrastructure
(e.g., sealed roadway and shoulders; edge lining; clear zones; barriers; median to
separate vehicles). It is therefore recommended that further research be undertaken to
identify and audit high crash risk roads in the regional and remote areas to determine
the appropriateness of the posted speed limit and make recommendations where
appropriate for a lowering of the speed limit to reduce the risk of crashing and serious
injury.
Safe Road Use and Users
5. Undertake an in-depth investigation of unlicensed driving in the remote areas of
Western Australia.
Drivers involved in serious injury crashes in remote Western Australia were twice as
likely as those crashing in regional WA and metropolitan Perth to be unlicensed (i.e.,
not holding a current, valid licence at the time of the crash). It is therefore
recommended that a program of both quantitative and qualitative research be
undertaken to address the following issues:
the extent of unlicensed driving;
persons at risk of unlicensed driving;
factors associated with the failure of remote areas residents to obtain and
maintain a valid motor vehicle drivers’ licence and drive unlicensed; and,
a review of the effectiveness of existing systems and programs in remote
Western Australia to promote licensure.

xx
The research should also consider how best to (i) engage remote communities to take
responsibility for the problem of unlicensed driving and to reduce the incidence of; (ii)
the provision of alternate modes of transport other than private vehicle use, and (iii)
more strategic detection and enforcement initiatives and appropriate penalties (i.e.,
vehicle impounding; wheel clamping;) for unlicensed driving.
6. Undertake an in-depth investigation of the use of alcohol and drink driving in remote
and regional Western Australia.
Around 13% of drivers involved in a serious injury crash tested positive (non-zero) for
alcohol; this proportion was greatest in remote Western Australia (23.4%) compared
with regional WA (16.5%) and metropolitan Perth (11.2%). Even more concerning
was the finding that three-quarters of remote area drivers and 60% of regional area
drivers who tested positive recorded a BAC ≥ 0.08gm%. Understanding the unique
area-specific factors that predispose non-urban area drivers to drink drive and the
development of relevant countermeasures is thus warranted. Both quantitative and
qualitative methods should be used to investigate the range of factors associated with
the use of alcohol in non-urban areas and compliance/non-compliance with drink-
driving legislation, in particular:
the extent of drink driving;
persons at risk of drink driving;
the range of individual, sociocultural and community-wide factors that support
or inhibit drink driving;
access to alcohol and alternative means of transport;
current detection and enforcement practices and the appropriateness of
penalties for non-urban area residents; and,
how best to reduce the incidence of alcohol impaired driving.
7. Undertake an in-depth investigation of the non-use of seat belts by motor vehicle
occupants in remote areas of Western Australia.
Seat belt use can significantly reduce the risk of serious injury in the event of a crash
and yet in this study remote area drivers (inclusive of helmet use by riders-15.6%) and
passengers (33.8%) were considerably more likely to be unbelted compared with those
involved in crashes in metropolitan Perth and even regional WA. At present there is no
contemporary evidence of the prevalence of and risk factors for the non-use of seat

xxi
belt across Western Australia using observational (as opposed to crash) data. Given
the level of non-use identified in this study among remote area motor vehicle
occupants there is a need for research using a mix of quantitative (observational data)
and qualitative methods to understand:
the prevalence of use and non-use of seat belts and other restraints among
remote area motor vehicle occupants;
persons at risk of being ‘unrestrained’;
the range of individual, vehicle, sociocultural (particularly Indigenous issues)
and community-wide factors that support or inhibit appropriate restraint use;
current detection and enforcement practices and the appropriateness of
penalties for remote area residents; and
how best to increase the use of seat belt by drivers and passengers.
8. Detailed examination of the pattern of pedestrian injury crashes in regional and
remote Western Australia.
The majority of pedestrians killed or hospitalised state-wide were involved in crashes
in the metropolitan area, though the risk of being fatally injured was greatest for
pedestrians involved in crashes in the regional and remote location. This is perhaps
because of their greater likelihood of being hit whilst using roads with higher posted
speed limits and the lack of facilities for safe walking. Given the higher risk of fatal
injury for pedestrians, the is good reason to undertake a detailed examination of the
high risk localities in regional and remote Western Australia to determine the
circumstances and risk factors for pedestrian crashes so as to develop appropriate and
effective counter measures in relation to engineering and road user behaviour
initiatives.

xxii
ACKNOWLEDGEMENTS
The authors would like to acknowledge the assistance of Main Roads Western Australia for
the supply of road crash data for analysis and the Project Advisory Group for their advice on
the study methodology and comments on various sections of the report.
Thanks are also extended to Michelle Broughton, C-MARC, for assistance with editing and
formatting.

1
1. INTRODUCTION
Road crashes cause serious injuries, loss of life and damage to infrastructure.
According to the World Health Organization (WHO, 2009), approximately 3500
people die every day and millions are injured or disabled every year worldwide due
to road crashes. More than 50 % of people who die in road crashes are aged between
15 and 44 years (WHO, 2004) and millions of others sustain injuries or suffer major
disabilities. This is significant in terms of potential years of life lost and quality
adjusted life years. In Australia, four people die and 90 people suffer a serious road
injury every day (Australian Transport Council, 2011) (ATC), with the cost of the
problem estimated to be $27 billion annually (Bureau of Infrastructure, Transport
and Regional Economics, 2006). Even though there has been a significant decline in
the number of road crash related fatalities on Australian roads, less progress has been
made towards reducing the number of non-fatal serious injuries in the past decade
(ATC, 2011).
As shown in Figure 1.1, the road crash fatality rate for Western Australia has also
gradually declined from the peak rates of the late 1960’s and early 1970’s but also
shows evidence of flattening in more recent years. In 2007, Western Australia (11.2
deaths per 100,000 population) was ranked worse than only the Northern Territory
(27/100,000 pop.) in terms of road deaths and had a road death rate substantially
higher than the Australian rate of 7.6 deaths per 100,000 population (Thompson &
Hill, 2010).
Figure 1.1 Road crash fatality rate; Western Australia 1961-2006

2
1.1 Crashes by geographic location
The characteristics of road crash related deaths and serious injuries are known to
vary with the location of the crash. Epidemiological analyses of the distribution of
motor vehicle crashes elsewhere have found that fatal injury crashes occur more
commonly in non-urban or rural areas while crashes resulting in non-fatal injuries
more commonly occur in urban or metropolitan areas (Elvik, Vaa, Hoye, Erke &
Sorensen, 2009; Peden et al., 2004; Zwerling et al., 2005). The explanations that
have been offered for this pattern include road design, proximity to emergency
medical services, human factors (Rakauskas, Ward, & Gerberich, 2009) and high
travel speeds (ATC, 2011).
The National Road Safety Strategy 2011-2020 noted that outer regional and remote
areas of Australia evidence higher incidences of crashes in comparison to the
metropolitan areas (ATC, 2011). Table 1.1 presents the distribution of fatal crashes
in Australia by remoteness index for the period 2002-2006. Fatal crashes were
significantly higher in the outer regional and remote areas when the population of
these areas were taken into account (ATC, 2011). In WA, nearly one-quarter of fatal
crashes occurred in the remote and very remote areas, which was second only to the
Northern Territory (67% of fatal crashes).
Table 1.1 Distribution of fatal crashes by remoteness index; Australia 2002-2006
Australian Jurisdiction
ARIA+ Region NSW
%
VIC
%
QLD
%
SA
%
WA
%
TAS
%
NT
%
ACT
%
AUS
%
Major Cities 35 40 29 38 36 0 0 88 34
Inner Regional 28 40 33 27 21 37 0 7 30
Outer Regional 15 13 23 23 17 50 29 0 18
Remote 1 1 7 5 9 10 23 0 4
Very Remote 1 0 4 5 14 1 44 0 4
Unknown 20 6 4 1 3 2 4 5 9
Source: ATC (2011)
In 2006, the majority of road crashes occurred in the metropolitan area of WA,
seriously injuring 2,768 people (Marchant, Hill, Caccianiga & Gant, 2008). In
comparison to the previous five year average, there was an overall increase in the
total number of rural (16%) and metropolitan (19%) fatal crashes in 2006

3
(Meuleners, 2007). The author also reported an increase in the number of fatal rural
crashes in 2006 compared to the previous five year average in all regions of Western
Australia except for the Gascoyne, Kimberley, Great Southern and Wheatbelt North
regions. A rise in the proportion of fatal crashes in 2006 was particularly evident in
the Wheatbelt South (61%) and the South West (67%) regions, compared to the
previous five years. A noteworthy decline in the number of fatal crashes in 2006
compared to the previous five year average was found in the Kimberley (-31%) and
Wheatbelt North (-26%) regions (Meuleners, 2007).
Three other reports affirm the relationship between location of crash and injury
outcome in Western Australia. Over the period 1999-2010, approximately 58% of
road user deaths occurred on rural roads compared with 42% on metropolitan Perth
roads (Office of Road Safety, 2011). In contrast, the majority of crashes resulting in
hospitalisation in 2006 occurred in metropolitan Perth compared with rural Western
Australia: 69% versus 31%. (Marchant et al., 2008). Finally, other evidence from a
population based study by Fatovich, Phillips, Langford and Jacobs (2011) utilising
data from Royal Flying Doctor Service (RFDS) database, Australian Bureau of
Statistics (ABS) and Western Australia’s trauma registry, found a direct relationship
between remoteness of road crashes and the fatality rate during the period 1st July
1997 to 30th June 2006.
1.2 Aims and objectives
Whilst many studies have described the epidemiology and characteristics of crashes
by regional location (e.g., Tziotis, Roper, Edmonston, & Sheehan, 2006), there have
been few reviews investigating how contributing factors to injury outcomes might
systematically vary by crash location and the relative risks of these factors.
Understanding how the factors associated with a serious casualty crash vary with the
regional location of the crash can provide useful information for the development of
region-specific countermeasures.
The aims of this investigation were two-fold. Firstly, to synthesise the understanding
of factors that contribute to crashes of varying injury severity by location of
occurrence, and secondly, to compare this understanding with that derived from the
analysis of serious injury crashes across Western Australia. The specific objectives
of the investigation were to:

4
Critically review the research literature to identify the range of factors (e.g.,
driver, vehicle and road factors,) associated with the occurrence of a serious
injury motor vehicle crash;
Determine whether the factors associated with a serious injury crash vary with
the regional location of the crash;
Describe the epidemiology of serious injury crashes across metropolitan,
regional and remote Western Australia and relevant risk factors through an
analysis of police reported crash data;
Compare and contrast the findings of the literature review with those obtained
from the analysis of Western Australian crash data; and to
Where warranted, provide recommendations for further research.

5
2. METHOD
2.1 Ethics approval
This research was undertaken with the approval of the Human Research Ethics
Committee of the School of Public Health, Faculty of Health Sciences, Curtin
University (approval SPH-38-2011).
2.2 Literature search and retrieval
A critical review of the scientific literature published in Australia and elsewhere was
undertaken to:
define the nature of serious injury motor vehicle crashes;
identify the range of driver, vehicle, and road variables associated with serious
casualty crashes; and
explore how serious injury crash factors vary with the regional location of the
crash.
A literature search of databases including Google scholar, ProQuest, Current
Contents, Scopus, Factiva and EconLit was undertaken using ‘key words’ to retrieve
local, national and international publications (books, reports, scientific journal
articles, conferences papers) relevant to the topic. The inclusion criteria for the
literature search were as follows:
information on crashes occurring on public roads;
crashes where the resulting injury involved the death or hospitalisation of a
road user;
crashes involving at least one motorised vehicle (i.e., cars, truck, buses,
motorbikes etc); and
publications from 1990 onwards.
2.3 Western Australian motor vehicle crashes
Police records of all on-road motor vehicle crashes (both police attended/reported
and road user reported) occurring during the period 2005-2009 in Western Australia,
were extracted by Main Roads Western Australia from their Integrated Road
Information System (IRIS). After an initial set of analyses, the larger dataset of all
police recorded crashes was reduced to those resulting in a ‘serious injury’ to

6
investigate the factors associated with their distribution across the metropolitan,
regional and remote areas of Western Australia. A discussion of the nature of serious
road injury crashes and its application in this study follows.
2.3.1 Definition and selection of serious injury motor vehicle crashes
Even though there is a clear definition of fatality, some jurisdictions find it
problematic to define a serious injury. Many jurisdictions define serious injury based
on police crash reporting (D’Elia & Newstead, 2010). In Victoria the definition of
serious injury is based on a combination of being taken to the hospital and being
admitted in a hospital after a crash. This hospital admission status is validated
through follow up from various sources of data. In Western Australia, the
designation of a crash involving a serious injury relies initially on police reports in
relation to the death or hospitalisation of the crash involved road user. This outcome
is represented in the IRIS database under the ‘Severity’ variable and relates to the
highest level of injury sustained by a crash involved road user.
Other measures of serious injury related to the Abbreviated Injury Scale (AIS) and
the Injury Severity Score (ISS) and the International Classification of Diseases Injury
Severity Score (ICDISS) have been recently proposed to address the shortcomings of
police reported information
Abbreviated Injury Scale – Injury Severity Score
The AIS is a specialised classification of injuries that is based mainly on anatomical
descriptors of the resulting tissue damage from an injury (D’Elia & Newstead, 2010).
It has two parts, namely the injury descriptor and a range of severity scores on a scale
of 1-6, assigned to each injury descriptor. The AIS is a measure of severity for a
single injury. ISS is derived from AIS and aims to combine multiple injuries in order
to create a single combined score for each patient (D’Elia & Newstead, 2010).
International Classification of Diseases Injury Severity Score
Due to the proprietary nature of the AIS, researchers have developed an empirically
derived measure of severity based on ICD (International Classification of Diseases)
diagnoses and short term outcomes such as hospital mortality coded along with the
ICD system (D’Elia & Newstead, 2010). ICISS is one of the empirically derived
measures of injury severity. This approach to assessment of serious injury is based
on the calculation of Survival Risk Ratios (SRRs) for each ICD code. The SRRs are

7
calculated by dividing the number of patients that survive a given ICD injury
diagnosis code by the number of patients with that diagnosis code (D’Elia &
Newstead, 2010). ICISS is the product of the SRRs corresponding to a patient’s set
of injuries.
In Western Australia there is a well-established practice of linking population-wide
police crash reports, hospital admission records and death registrations (Lopez,
Rosman, Jelinek, Wilkes, & Sprivulis, 2000). Crashes reported by the police have
been linked to hospital admission records enabling the direct calculation of ICSS
(D'Elia & Newstead, 2011). Reliable information on injury outcomes is essential for
the evaluation of road safety countermeasures and interventions. For this reason,
linkage of crash details in police crash reporting systems with injury details in
hospital records makes the best use of both data sources (Lopez et al., 2000).
However a linked database has its limitations that need to be understood. There are
problems of comprehensiveness, precision and consistency associated with the use of
routinely collected data, whether from police, hospital, ambulance or insurance
sources. There is also the possibility that some records are incorrectly matched.
Probabilistic matching of records can result in links that are either ‘false positives’ or
‘false negatives’ (Rosman, 2001).
For a range of pragmatic reasons, and noting the on-going work by the Data Linkage
Branch of the Health Department of Western Australia to develop a more meaningful
measure of serious injury, a serious injury crash for this project was considered to be
one which resulted in the police reported death or hospitalisation of a crash involved
road user. These crashes were identified in the IRIS database via the Severity
variable: 1=Fatal; 2=Hospitalisation. It should be noted that the hospitalisation of the
road user was not verified through the identification of and link with a corresponding
Health Department of Western Australia (HDWA) hospitalisation record and thus
may be a less than valid measure of hospitalisation. This is because previous
investigations have shown that less than half of hospital admission records for a road
traffic casualty actually link to a corresponding police crash report (Rosman, 2001).
2.3.2 Classification of the location of serious injury motor vehicle crashes
The Accessibility/Remoteness Index of Australia (ARIA) (Department of Health and
Aged Care, 2001) represents one measure of geographic remoteness across Australia

8
and physical distance by road to the closest urban centre. The ARIA presents five
categories of remoteness ranging from Highly Accessible, Accessible, Moderately
Accessible, Remote, and Very Remote. These categories can be used to classify
Western Australia into areas defined as metropolitan, regional and remote. In
general, the metropolitan area of Perth consists of Highly Accessible and Accessible
areas, while areas outside of metropolitan Perth with an ARIA index of Accessible
and Moderately Accessible are classified as regional Western Australia. Remote and
Very Remote areas are classified as remote Western Australia (Marchant et al.,
2008).
For the purposes of this study the local government area of the crash reported in the
IRIS database was assigned an ARIA code and then categorised as metropolitan,
regional and remote for analysis.
2.3.3 Data management and analysis
Motor vehicle crash data extracted from the IRIS database were imported into SPSS
(Version 19) for management and analysis. Descriptive and multivariate analyses
(using binary logistic regression and multinomial logistic regression) were
undertaken of crash and person level serious injury data. The pattern of serious injury
crashes across the metropolitan, regional and remote areas of Western Australia was
described and the risk factors for the occurrence of serious injury crashes and other
driving outcomes modelled.

9
3. LITERATURE REVIEW
This literature review discusses the existing evidence on factors associated with
serious injury crashes in different geographic locations (metropolitan, rural and
remote areas). Factors reviewed include demographic, behavioural, road user, road
and vehicle-crash characteristics.
3.1 Demographic factors
3.1.1 Age
Although road injury affects all age groups, it is a leading cause of death globally for
those aged 15-29 years, particularly drivers (WHO, 2009). Numerous studies have
shown that in comparison to other drivers, drivers aged less than 25 years, are more
likely to be involved in crashes and have higher casualty rates in the event of a crash
(Ryan, Legge & Rosman, 1998; McGwin & Brown, 1999). In Australia, drivers aged
17-25 years are similarly over-represented among driver fatalities. For example, in
2008 they accounted for 25% of driver fatalities while representing only 15% of total
licensed drivers (ATC, 2009).
Some evidence suggests that crash risk for younger drivers varies with geographical
location of residence or crash, more so than for other drivers. Analysis of Australian
and New Zealand crash data for the period 1999-2003 by Tziotis et al. (2006)
identified that young driver (under 25 years), particularly males, were more likely to
crash on rural and remote roads. In another study of nearly 1,700 provisional drivers
in WA, it was noted that drivers in the metropolitan area were slightly more likely
than those in rural areas to be involved in a police reported crash in their first year of
licensure (Stevenson & Palamara, 2001). Location of residence however, was not
significantly associated with crash involvement after adjusting for a range of other
demographic and socio-cultural factors. The authors cautioned that a higher level of
under-reporting of non-casualty crashes to police by rural drivers may have
undermined the validity of the findings (Stevenson & Palamara, 2001).
In contrast, a study of provisional drivers in NSW found that fatal and injury crash
rates were significantly lower for metropolitan versus rural novice drivers up to two
years post licensure (Chen et al., 2009). While young drivers in the metropolitan area
also had an elevated risk of crashes compared to other drivers, novice drivers in rural
areas had a much higher rate of involvement in single vehicle crashes (Chen et al.,

10
2009). The elevated risk of crashes for young drivers in rural areas may be due to
factors including road infrastructure, road alignment and speeding.
3.1.2 Gender
In Australia, males accounted for two-thirds (66%) of serious injury road crashes in
2006–07 (Henley & Harrison, 2009). Male rates of serious injury due to crashes were
approximately twice the rate observed for females in each remoteness area (Henley
& Harrison, 2009). In addition, another study found that the male crash fatality rate
in rural and remote areas of Australia was significantly higher than the male fatality
rate in metropolitan areas (Veitch, 2009).
In WA, males accounted for 61% of persons killed or hospitalised due to crashes in
the rural areas and 57% in the metropolitan area in 2006 (Marchant et al., 2008).
When compared to the 2001 to 2005 average, the overall number of male crash
fatalities in 2006 in WA increased by 26%, compared to a marginal decrease in
female fatalities of 6% during the same period (Meuleners, 2007).
Risk-taking behaviour has been recognised as a possible explanation for the higher
incidence of motor vehicle crashes among male drivers (Turner & McClure, 2003).
3.2 Driver behavioural factors
3.2.1 Speed
Speeding is an important contributing factor to the occurrence and severity of
crashes. Higher travelling speeds allow drivers less time to respond to hazards and
increase the level of energy involved in the event of a crash. (Marchant et al., 2008).
According to WHO (2009), a 5% increase in average speed is related to a 10%
higher risk of crashing and a 20% higher risk of a fatality. In addition, pedestrians
have more than a 90% chance of surviving a crash at 30km/hour but less than a 50%
chance of surviving a crash at 45 km/hour (WHO, 2009).
According to the ATC (2011), speeding accounts for 34% of fatal and 13% of serious
injury crashes in Australia. In WA, speed was considered to be a factor in 24% of all
road crash fatalities in 2010, with the proportion being highest in the remote area
(29%) versus the regional (26.5%) and metropolitan (19%) (Hill, Thompson, Yano &
Smith, 2012). Earlier studies have shown that 52% of passenger fatalities and 16% of
hospitalisation crashes involve speed as a contributing factor (Marchant, et al., 2008).

11
Among young adults aged 17-24 years killed or hospitalised due to a crash, speed
was found to be a factor in over 32% of crashes (Marchant et al., 2008). In addition,
there was an 18% increase in speed-related road crashes in 2006 in WA compared to
the previous five year average (Figure 3.1) (Marchant et al., 2008).
Figure 3.1 Fatal crashes attributed to speed; Western Australia, 2001-2006 (Marchant, et al., 2008).
Periodic surveys of vehicle travel speeds across the Western Australian metropolitan
and rural road networks shows that the proportion of speed compliant vehicles varies
with geographic location and posted speed zones. Overall, the proportion of vehicles
complying with the posted limit (all zones) increased in both locations since 2000
with the greatest percentage increase in the rural area (9.8%) versus the metropolitan
(6.8%) (Radalj & Sultana, 2012a; Radalj & Sultana 2012b). In 2011, compliance was
lowest on 60km/hour roads in the metropolitan area (51.8%) (Radalj & Sultana,
2012b) and on 90km/hour roads in the rural area (59.9%) (Radalj & Sultana, 2012a).
Though speed compliance appears greater on Western Australian rural roads versus
metropolitan roads, speeding is typically considered more common on rural roads
due to low traffic volumes, sparse roadside development and perceived lower
likelihood of being detected by police. Indeed Tziotis et al. (2006) concluded that
speed was a significant factor in crashes on rural and remote Australian and New
Zealand roads.
3.2.2 Seat belt use
Worldwide, there is a highly significant negative correlation (R= -0.77) between seat
belt compliance and road crash fatality rates (Figure 3.2) (Abbas, Hefny & Abu-
Zidan, 2011). It has been reported that 50-80% of all road fatalities could be

12
prevented by proper use of seat belts (FIA Foundation for the Automobile and
Society, 2009).
Figure 3.2 Linear Regression between seat belt compliance and road traffic death rates in 46 high income countries (Abbas, Hefny & Abu-Zidan, 2011)
Australia enjoys relatively high overall rates of seat belt use (95-99%) and remains
one of the leading countries globally in this regard. However, more than 25% of
vehicle occupants killed in road crashes in Australia were reportedly not wearing a
seat belt (ATC, 2008). It is estimated that if seat belt wearing rates increased to
100%, the overall cost of road crashes could be reduced by approximately $279
million. (Department of Transport and Regional Services, 2005).
In WA, approximately one third (29%) of police reported motor vehicle occupant
fatalities were not wearing a seat belt, comprising 31% of male and 22% of female
fatalities (Marchant et al., 2008). Figure 3.3 shows the number and percentage of
fatal crashes where seat belts were not worn in WA between 2001 and 2006.

13
Figure 3.3 Motor vehicle occupant fatalities where seat belts were not worn; by year, Western Australia 2001-2006 (Marchant et al., 2008).
Evidence suggests that seat belt usage rates are lower among motor vehicle
occupants in rural or remote areas, than in metropolitan areas of Australia (ATC,
2008). An observational survey in WA found that across all occupant positions and
ages, the prevalence of seat belt or restraint use in rural and remote regions varied
widely, ranging from 72 to 97%, with non-use being more prevalent in the most
remote towns (Roberts, Taylor, & Sidebottom, 2006). In contrast, the prevalence of
seat belt or restraint use in metropolitan Perth was 98%. Similarly, Marchant et al.
(2008) reported that the proportion of motor vehicle occupants killed or hospitalised
due to a crash in WA, who were not wearing a seat belt, increased with the ARIA
remoteness index. In very remote areas, 38% of vehicle occupants who were killed or
hospitalised were not wearing a seat belt, compared to 18% in remote areas and 4%
in highly accessible areas (Marchant, et al., 2008).
Reasons for lower levels of restraint use in rural or remote areas may include higher
proportions of Indigenous people (who are less likely to use seat belts) and the
perceived lower likelihood of detection by police for failure to wear a seat belt
(Oxley et al., 2009).
3.2.3 Alcohol
Drinking and driving increases both the risk of a crash and the likelihood of death or
serious injury in the event of a crash (Peden et al., 2004). Alcohol consumption
adversely affects judgment, reaction time and vision as well as use of seat belts/
helmets and choice of driving speed (WHO, 2007). Even low Blood Alcohol
Concentrations (BAC) can impair judgment and increase crash risk. A BAC of 0.04

14
g/dl significantly increases the likelihood of involvement in a crash (Moskowitz &
Fiorentino, 2000). Laws enforcing low BAC levels, random breath tests and sobriety
checkpoints have resulted in a 20% decrease in alcohol related crashes throughout
the world (WHO, 2009).
In Australia, alcohol is the single biggest contributor to serious crashes, accounting
for 30% of fatal and 9% of serious injury crashes (ATC, 2011). In Australia, the
BAC limit for the general population is 0.05g/dl and for young or novice drivers is
0.0 (WHO, 2009). In WA, 26% of fatal crashes involved a driver/rider with a BAC
of 0.05 g/100mL or above (Marchant et al., 2008). In addition, 71% of all road users
killed or hospitalised in an alcohol-related crash in WA were male (Marchant et al.,
2008).
The burden of road crash related injury associated with drink driving is
disproportionately high in rural areas of Australia (Havard, Shakeshaft, Conigrave, &
Sanson-Fisher, 2011). In 2008, 54% of alcohol-related road fatalities occurred on
country roads (Miller, Coomber, Zinkiewicz, & Toumbourou, 2010). In WA in 2006,
48% of alcohol-related road fatalities and hospitalisations occurred in highly
accessible areas, 8% in moderately accessible areas and 15% in remote and very
remote areas (Marchant et al., 2008). It is clear that remote and very remote areas
were over-represented in alcohol-related crashes as the population of these areas is
very low.
Evidence suggests that alcohol may also be an important risk factor for fatal
pedestrian crashes in rural WA. Among pedestrians killed in 2006 in WA, 14 were
killed in the metropolitan area and seven in rural areas. Five out of seven pedestrians
killed in rural areas had a BAC of 0.05 g/100mL or above and 4 had a BAC over
0.15 g/100mL. In contrast, only four of the 14 pedestrians killed in the metropolitan
area had a BAC of 0.05 g/100mL or greater (Marchant et al., 2008).
There are several reasons why serious injury drink driving-related crashes are over-
represented in rural and remote areas. Crashes involving drink driving are often
characterised by high speed and involve single vehicles running off the road (WHO,
2007). These crashes are associated with higher severity. In addition, individuals
who live in rural and remote areas of Australia have been found to have a greater
incidence of high alcohol consumption than those who live in metropolitan areas
(Parliament of Victoria Road Safety Committee, 2005). There are also limited

15
transportation options other than driving and a perceived lower likelihood of being
detected drink driving by police than in metropolitan areas.
3.2.4 Fatigue
It has been well established that driving while fatigued is an important contributory
factor for fatal and serious injury crashes (Armstrong, Smith, Steinhardt, & Haworth,
2008). There is a substantial body of evidence to show that fatigue adversely affect
tasks requiring alertness such as driving (Moskowitz & Fiorentino, 2000). In
addition, it has been recognised that fatigue can have comparable impairments on
driving capability to alcohol. Consistent with dips in alertness associated with the
human circadian rhythm, fatigue-related road crash incidents have been found to
peak between 2:00am and 6:00am and 2:00 pm and 4:00 pm (Obst, Armstrong,
Smith & Banks, 2011). Evidence also suggests that younger drivers are at higher risk
of fatigue-related crashes at night, than other drivers (Obst et al., 2011).
In Australia, fatigue has been identified as an important road safety issue. Fatigue-
related crashes are often high severity crashes, with run-off road crashes being the
most common. When drivers are fatigued or asleep, they often cannot employ crash
avoidance manoeuvres prior to impact, resulting in high speed, high severity crashes
(Diamantopoulou, Hoareau, Oxley, & Cameron, 2003). It is difficult however, to
determine the proportion of crashes that can be attributed to fatigue. For example,
Obst et al. (2011) stated that fatigue could be identified as the primary causal factor
in nearly 6% of all road crashes in Australia and 15% of all fatal road crashes. In WA
between 2005 and 2007 however, it was estimated that driver fatigue played a role in
20-30% of all road crash deaths and serious injuries (ATC, 2011).
Several reports have identified driver fatigue as a particular safety issue for rural/
remote areas of Australia. This may be due to the high speed limits, long, straight,
monotonous stretches of road with little scenery, long distances between towns and
long distances travelled in these areas (Centre for Accident Research and Road
Safety Queensland (CARRSQ), 2005). According to Ryan, Cercarelli and Mullan
(1998), 19% of rural/remote drivers in northern WA reported falling asleep at the
wheel at least once. It has been estimated that fatigue is the primary contributing
factor in 30% of fatal crashes on rural roads throughout Australia and many
contribute to as many as 40-50% of fatal single vehicle semi-trailer crashes
(CARRSQ, 2005). In Queensland, the relative risk of dying as a result of a fatigue

16
related crash was 13.5 times higher in rural than metropolitan areas (CARRSQ,
2005). There is a gap in the evidence surrounding the role of fatigue in crashes in
WA specifically.
3.3 Road user type
According to the global report on road safety by the World Health Organization
(2009), almost 50% of road deaths worldwide are recorded amongst vulnerable road
users. Vulnerable road users include pedestrians, cyclists, drivers of two wheeled
motorised vehicles and their passengers. This group of road users does not have a
protective shield around them and hence, are at a higher risk of road crash
injury/fatality than other road users.
In WA, an increase in the number of fatalities for all road user types was seen in
2006 except for bicyclists (-21 per cent), compared to the previous five year average
(Meuleners, 2007). Table 3.1 compares the fatalities among different road user group
in the year 2006 with the previous five years.
Table 3.1 Fatalities by road user group and year, Western Australia, 2001-2006
Age
Group
2001 2002 2003 2004 2005 5 year
average
2006 2006
Percentage change from 5 year average
Driver 71 80 84 85 88 81.6 95 16.4
Passenger 41 47 53 44 36 45.6 50 9.6
Motorcyclist 28 24 23 22 20 23.4 31 32.4
Pedestrian 20 22 18 25 14 19.8 21 6.1
Bicyclist* 5 6 1 3 4 3.8 3 -21.1
(Source: Meuleners, 2007)
The number of hospitalisations for all road user types decreased in 2006 compared to
the previous 5 year average, except for motorcyclists (14% increase) and passengers
(2% increase).

17
Table 3.2 Hospitalisations by road user group and year, Western Australia, 2001-2006 (Meuleners, 2007)
Age
Group
2001 2002 2003 2004 2005 5 year
average
2006 2006
Percentage change from 5 year average
Driver 963 1543 1554 1723 1604 1477.4 1435 -2.9
Passenger 513 725 687 795 790 702 713 1.6
Motorcyclist 219 294 295 342 321 294.2 335 13.9
Pedestrian 160 195 218 207 248 205.6 180 -12.5
Bicyclist* 77 121 121 115 119 110.6 83 -24.9
3.3.1 Pedestrians
In Australia and globally, pedestrian crashes are more common in metropolitan areas,
with the majority occurring in 50 or 60 km/hour speed zones (Devlin, Hoareau,
Logan, Corben & Oxley, 2010). This is due to higher levels of pedestrian and vehicle
activities in metropolitan areas (Zegeer & Bushel, 2011). In WA, there were a total
of 104 pedestrian deaths and over 950 serious injuries between 2004 and 2008,
representing nearly 10% of all road deaths and approximately 9% of all serious
injuries (Oxley, 2010). Child pedestrian crashes usually take place in local streets,
near home and while the child is unattended, often on the way to or from school and
especially while playing after school. Pedestrian crashes involving older adults occur
in built-up areas, close to home and shops, usually on a regular shopping trip, and in
complex environments such as strip shopping centres, intersections and two-way
roads characterised by heavy and fast traffic.
Although fewer pedestrian crashes occur in rural and remote areas, it has been found
that rural and remote crashes are 2.3 times more likely to result in pedestrian death
(Mueller, Rivara, & Bergman, 1988). Reasons for this include higher speed limits ,
fewer separate facilities for pedestrians and long distances from emergency care
facilities in rural and remote areas (Mueller et al., 1988). In addition, it has been
suggested that many pedestrians who are fatally injured in a crash in rural WA are
under the influence of alcohol, which impairs judgement and slows reflexes (Oxley,
2010).

18
3.3.2 Motorcyclists
Motorcyclists are considered to be vulnerable road users because of their relative
lack of protection against impacts with other vehicles, the ground and roadside
objects. Therefore, rider injuries are often more severe than those of other road users.
The inherent instability of motorcycles also makes them more susceptible to crashing
in comparison with other vehicles. Motorcyclists’ low conspicuousness (ability to be
seen by other road users), small numbers and behavioural factors such as high speeds
and unexpected locations (e.g. driving between lanes) also contribute to their high-
risk of involvement in a road crash (Blackman, Steinhardt, & Veitch, 2009)
Motorcyclists in Australia are approximately thirty times more likely to be killed in a
crash than car occupants (Blackman, Steinhardt, & Veitch, 2009). Even though
motorcyclists comprised a small percentage of the WA vehicle fleet (5.4%), they
accounted for 15% of all road deaths during 2008 (ORS, 2011a). Motorcycling
activity has grown rapidly throughout Australia and motorcycle registrations have
increased by 56% between 2005 and 2010 (ATC, 2011). This is expected to increase
the number of motorcycle crashes in WA in the coming years (ORS, 2011a).
Single vehicle crashes comprise a significant proportion of motorcycle crash deaths
(42%) (ATC, 2011) and a significant proportion of fatal motorcycle crashes take
place on rural and remote roads (34%) (ORS, 2011a).
3.3.3 Bicyclists
Worldwide, the majority of bicycle kilometres travelled are undertaken in
metropolitan areas, over relatively short distances. Even though cycling rates are
relatively low in Australia, in the six year period between 2003 and 2008, fatal
cyclist crashes represented 2.3% of all road deaths in Australia (Garrard, Greaves &
Ellison 2010).
In WA, over the ten years to 2009, a total of 34 bicyclists were killed and 1,060 were
seriously injured (Edwards, 2011). In the metropolitan area of WA between 2000 and
2009, there was a decreasing trend in the number of bicyclist fatalities. Over the
same period, the number of bicyclist serious injuries increased by an average of 5%
per annum (ORS, n.d.). Between 2000 and 2009, 13 bicyclists were killed in regional
and remote areas of WA, with a peak of four fatalities in 2007. During the same
period, the number of bicyclists who were seriously injured decreased by an average
of five per year (Edwards, 2011). According to the Australian Transport Safety

19
Bureau (ATSB) (2006) there was no real variation between rural and urban areas in
cycling related crashes in Australia during the four year period from 2000-2004.
3.4 Road characteristics
3.4.1 Road alignment
The horizontal and vertical alignments of the road are two important aspects of road
design that can influence crash risk. Road alignment influences speed, variations in
speed, friction and driver expectations of the road ahead. It has been reported that
crash risk increases as the curvature of a road and number of unanticipated curves
increases (Elvik & Hoye, 2004). Across Australia and New Zealand, crashes on rural
and remote roads more commonly in rural and remote areas. In WA, the majority of
crashes occur on straight roads, as straight roads are more common in the road
network (Meuleners, 2007). Little is known about the risk of crashes by road
alignment in metropolitan, rural and remote WA though Meuleners (2007) did note
that single vehicle crashes in 2008 across the metropolitan, regional and remote areas
of WA were significantly more likely to occur on curves for the metropolitan area
only. However research from Norway found that over 50% of rural crashes occurred
on roads with high curvature (Elvik & Hoye, 2004). An analysis of rural crashes in
the United Kingdom also suggested that the risk of single vehicle crashes increased
with the density of sharp bends (34% increase in crash frequency per additional sharp
bend per kilometre) (Taylor, Baruya, & Kennedy, 2002).
3.4.2 Road gradient
Road gradient, or slope of the road is an important road safety factor. Steep uphill
slopes may restrict the visibility of the driver and steep downhill slopes may lead to
excessive speeds, improper use of brakes and loss of control of the vehicle,
particularly for heavy vehicles (Elvik & Hoye, 2004). In Australia, the severity ratio
of crashes (fatal crashes versus other) was slightly higher for hilly roads, compared
with flat roads for both Local Government and State controlled roads (Turner, Pyta,
Wooley & Zhang, 2010). In WA, the majority of all crashes occur on level roads
(Meuleners, 2007). However, little is known about differences in the risk of crashes
on metropolitan, rural and remote roads in WA.
3.4.3 Road surface
In Australia and in WA overall, the majority of fatal crashes occur on sealed local
and State roads (Meuleners, Hendrie, & Lee, 2011; Meuleners, 2007). However, the

20
vast majority of crashes on unsealed roads occur in regional and remote areas.
Crashes in rural and remote areas are more likely to occur on unsealed surfaces
(13.8%), compared to metropolitan areas (0.9%) (Legge, Kirov, & Cercarelli, 2001).
In addition, unsealed shoulders of sealed roads pose a major hazard to drivers
(Baldock, Kloeden & McLean, 2008). When the wheel/wheels of a vehicle come into
contact with the unsealed gravel or dirt shoulder, drivers often make a sharp
overcorrection, which may result in the vehicle leaving the roadway or colliding with
another vehicle (Baldock et al., 2008). Sealed shoulders provide drivers with
manoeuvring space and the opportunity to recover safely if the vehicle leaves the
lane it is travelling in.
The majority of sealed roads with unsealed shoulders in WA are also in rural and
remote areas. Sealing of road shoulders is one of the most common engineering road
treatments on rural roads in Australia. One case-control study demonstrated a 43%
reduction in casualty crashes following shoulder sealing on Victorian highways in
Australia. A recent WA-based study also confirmed that treatment of sealed
shoulders was a highly effective method for reducing all-severity crashes, casualty
crashes and the cost of crashes at sites on Albany Highway, treated under the State
Black Spot Program (Meuleners et al., 2011).
Compared to other OECD countries, Australia has higher speed limits across much
of the road system due to its vast regional road network. The majority of regional
roads in Australia are single-carriageways with high default speed limits (100
km/hour in most jurisdictions) (ATC, 2011). In rural South Australia, fatal and
serious injury crashes were found to be over-represented on roads with speed limits
of 80 km/hour or higher (Mackenzie, 2008). In addition, the majority of crashes
occurred on roads with speed limits of 110 km/hour and these had the largest
proportion of high injury severity outcomes (Mackenzie, 2008). A Queensland-
based study also reported that the proportion of crashes in higher speed zones
gradually increased as the ARIA remoteness indicator increased (Steinhardt, Sheehan
& Siskind, 2009).
3.5 Crash and vehicle characteristics
3.5.1 Multi-vehicle crashes
Multi-vehicle collisions are also an important source of road trauma in metropolitan
and rural areas and include collisions at intersections, head-on impacts and rear-end

21
collisions. Multi-vehicle crashes are often more severe in rural than metropolitan
areas due to higher travelling speeds. In WA in 2006, 56% of multi-vehicle fatal
crashes occurred in the metropolitan area. In addition, 66% of metropolitan
hospitalisation crashes were multi-vehicle, compared to only 30% of rural
hospitalisation crashes (Marchant et al., 2008)
3.5.2 Single vehicle crashes
Single-vehicle crashes are a road safety priority in WA due to their large contribution
to death and injury on rural roads. In 2008, 56% of fatal crashes in WA occurred on
rural roads, with 87% of these fatalities being single-vehicle crashes (Meuleners et
al., 2011). Single vehicle crashes have been found to commonly occur at high speeds,
on curved and unsealed roads and often have more severe outcomes than multi-
vehicle crashes (Ryan et al., 1998).
In WA in 2006, there was a 63% increase in hit object crashes in metropolitan areas,
an 18% increase in hit object and 29% increase in non-collision crashes in rural
areas, compared to the previous five year average.
3.5.3 Vehicle type
In WA between 2001 and 2006, sedans/hatchbacks were the most common vehicle
type involved in fatal and hospitalisation crashes. In rural and remote areas, there is a
high dependency on self-owned vehicles, due to lack of alternative transport options.
Rural and remote environments constitute a mix of vehicle types including cars,
buses, heavy trucks, agricultural vehicles, mopeds and bicycles and this diverse mix
increases the likelihood of a crash in these road environments. Even so, Tziotis et al.
(2006) noted that rigid and articulated trucks had a relatively high crash rate on rural
and remote roads compared with metropolitan roads for crashes occurring on
Australian and New Zealand roads, 1999-2003.
3.6 Limitations
A key concern of this literature review that has implications for its findings, is the
major inconsistencies in defining “rural” and “remote” areas in the literature. In
addition, there were inconsistencies in defining crash severity levels. Despite the
definition of a road fatality being relatively clear, the definition of a serious injury
varies widely between jurisdictions. These definitional ambiguities mean that
findings and research studies needed to be carefully examined to determine their
definitional base.

22
3.7 Summary and conclusion
This literature review summarised the existing evidence on factors associated with
serious injury crashes in different geographic locations (metropolitan, rural and
remote areas). Factors reviewed include demographic, behavioural, road user, road
and crash/ vehicle characteristics. Main findings include:
Demographic factors
Fatal and injury crash rates may be lower for metropolitan versus rural novice
drivers up to two years post licensure.
Males are more commonly involved in rural and remote area fatal and
hospitalisation crashes than females.
Driver behavioural factors
In Western Australia in 2011 speed compliance was noted to be higher on rural
roads compared with metropolitan roads.
Speeding is estimated to be a contributing factor in 24% of all police attended
fatal crashes state-wide, with the proportion being highest for fatal crashes in the
remote area and lowest in the metropolitan area.
Seat belt usage rates are lower among motor vehicle occupants in rural or remote
areas (72-97%), than in metropolitan areas of WA (98%).
The proportion of motor vehicle occupants in WA killed or hospitalised due to a
crash, not wearing a seat belt, increases with the ARIA remoteness index.
The burden of road crash related injury associated with drink driving is
disproportionately high in rural areas of Australia.
19% of rural/ remote drivers in northern WA report falling asleep at the wheel at
least once.
It has been estimated that fatigue is the primary contributing factor in 30% of
fatal crashes on rural roads throughout Australia.
Road user type
In Western Australia the majority of pedestrian crashes occur in metropolitan
areas but rural and remote pedestrian crashes are more likely to result in death.
Alcohol consumption by pedestrians may be an important risk factor in fatal
pedestrian crashes in rural and remote areas.

23
A significant proportion of fatal motorcycle crashes take place on rural and
remote roads (34%).
Little is known about the risk factors for bicycle crashes in rural and remote
areas.
Road characteristics
In Western Australia, the majority of crashes state-wide occur on straight roads.
However, international evidence suggests that the risk of single vehicle crashes
increases with the density of sharp bends in rural areas.
In WA, the majority of all crashes occur on level roads. Little is known about
differences in the risk of crashes on metropolitan, rural and remote roads in WA.
The majority of fatal crashes occur on sealed roads in Australia. However,
crashes in rural and remote areas are more likely to occur on unsealed surfaces
compared to metropolitan areas.
The majority of sealed roads with unsealed shoulders in WA are in rural and
remote areas. Treatment of sealed shoulders is a highly effective method for
reducing all-severity crashes, casualty crashes and the cost of crashes.
The proportion of crashes in higher speed zones gradually increases as the ARIA
remoteness indicator increases.
Crash and vehicle characteristics
The majority (87%) of fatalities on rural and remote roads are due to single-
vehicle crashes. Single vehicle crashes have been found to commonly occur at
high speeds and on curved and unsealed roads and often have more severe
outcomes than multi-vehicle crashes.
Rural and remote environments constitute a mix of vehicle types including cars,
buses, heavy trucks, agricultural vehicles, mopeds and bicycles and this diverse
mix increases the likelihood of a crash in these road environments, with some
evidence of a higher risk of heavy vehicles crashing on non-metropolitan roads.
Conclusion
Fatal and serious injury crashes are significant issues across metropolitan, rural and
remote WA with a higher risk of death and serious injury when crashes occur in non-
urban areas. This review has identified several risk factors for crashes in these
geographical regions and how they differ between regions. Existing evidence

24
however, comes from several different sources internationally and nationally, using a
wide variety of definitions for geographical regions and crash severity. The WA road
environment is unique, covering vast distances with extremely varied road
conditions. Therefore, to better understand the different risk factors for serious injury
crashes in metropolitan, rural and remote areas of WA and to develop relevant
counter measures that addressing safer roads, safer speeds, safer vehicles and safer
road users it is essential to undertake comprehensive analyses using WA data.

25
4. ANALYSIS OF WESTERN AUSTRALIAN CRASH DATA 2005-2009
4.1 Crash severity and location of crashes
A total of 196,276 crashes were recorded by WA Police during the period 2005-
2009. Approximately 82% of crashes occurred in the metropolitan Perth area, 12% in
the regional area, and 6% in the remote area of WA (Table 4.1). Crashes with the
highest injury severity of either the death or hospitalisation of an involved road user -
defined as ‘serious injuries’ and the focus of this project - totalled 11,874 and
accounted for 6.1% of all crashes recorded during the study period. Minor injury
crashes requiring medical treatment only constituted a further 13.8%. The majority
(80.1%) of crashes across the State resulted in no personal injury to an involved road
user but minor to major property damage only.
Table 4.1 Severity of crashes; by location, Western Australia, 2005-2009
Location
Crash Severity Metropolitan Regional Remote All Areas
n % n % n % n %
Fatal 392 0.2 285 1.2 235 2.1 912 0.5
Hospitalisation 7660 4.7 1996 8.4 1306 11.9 10962 5.6
All Serious 8052 4.9 2281 9.6 1541 14.0 11874 6.1
Row % 67.8 19.2 13.0 100.0
Medical 22606 14.0 3094 13.1 1331 12.1 27031 13.8
PDO Major 95285 59.0 13652 57.8 6340 57.7 115277 58.7
PDO Minor 35682 22.1 4609 19.5 1778 16.2 42069 21.4
All crashes 161625 100.0 23636 100.0 10990 100.0 196251 100.0
n=26 missing Location. PDO: Property Damage Only. Chi Square: X2=27003.55 df=8; p ≤ .001.
The majority of serious injury crashes were noted to have occurred in the
metropolitan area (67.8%) versus the regional (19.2%) and remote areas (13%), with
serious injury crashes accounting for a significantly higher proportion of crashes in
the regional (9.6%) and remote (14%) areas compared with the metropolitan area
(4.9%).
Calculation of the unadjusted odds of a crash resulting in (i) any injury to an
involved road user versus no-injury, and (ii) serious injury to an involved road user
versus no serious injury, showed a significant increased likelihood of both outcomes
with increasing distance and remoteness from the metropolitan area. As shown in
Table 4.2, a crash in the regional and remote area was respectively 25% and 50%

26
more likely to result in an injury (any level) to an involved road user, and two to
three times more likely to result in a serious injury (death or hospitalisation) of an
involved road user.
Table 4.2 Unadjusted odds of an injury crash (any level) and serious injury crash; by location of crash, Western Australia, 2005-2009
Odds Ratio 95% CI P-value
Crash resulting in any level of injury
Metropolitan^ 1.0
Regional 1.25 1.21-1.29 <0.001
Remote 1.51 1.44-1.58 <0.001
Crash resulting in a serious injury
Metropolitan^ 1.0
Regional 2.03 1.94-2.13 <0.001
Remote 3.10 2.94-3.29 <0.001
^reference group
Further analysis showed that when a serious injury crash did occur, it was
significantly more likely to result in the death of a road user in the remote (OR=4.59,
95% CI 4.08-5.10) and regional areas (OR=3.05 95% CI 2.74-3.41) compared with
the metropolitan area.
4.2 Serious injury crash analysis
A detailed analysis of the sub-group of serious injury only crashes across the
metropolitan, regional and remote areas of Western Australia is presented in the
following sections. The analysis was undertaken with respect to selected crash, road,
road user and vehicle characteristics.
4.2.1 Selected crash characteristics
Descriptive findings for the nature of the crash; road user movement; time of day;
lighting; day of week, and weather are considered for each location in the following
sections.
4.2.1.1 Nature
Nearly 40% of metropolitan area serious injury crashes related to right angle or right
turn thru scenarios. The next major category of crashes in this location was hit object

27
single vehicle crashes (20.6%). In contrast, hit object crashes were the predominant
crash type for the regional (45%) and remote areas (37.6%). A further two-thirds of
serious injury crashes in the remote area were designated as non-collisions or roll-
overs, which was significantly greater than that for the regional (14.4%) and
metropolitan areas (5.9%). A statistically significant association was computed
between the nature of the crash and location of occurrence.
Table 4.3 Crash nature of serious injury crashes; by location, Western Australia, 2005-2009
Location
Nature of Crash Metropolitan Regional Remote All Areas
n % n % n % n %
Rear End 1256 16.0 150 6.7 41 2.7 1147 12.5
Head On 272 3.5 139 6.2 56 3.7 467 4.0
Sideswipe Same Direction
416 5.3 65 2.9 27 1.8 508 4.4
Right Angle 1899 24.2 275 12.3 95 6.3 2269 19.6
Right Turn Thru 1154 14.7 109 4.9 33 2.2 1296 11.2
Hit Pedestrian 759 9.7 122 5.5 100 6.7 981 8.5
Hit Animal 25 0.3 39 1.8 44 2.9 108 0.9
Hit Object 1616 20.6 1007 45.2 564 37.6 3187 27.5
Non-Collision 463 5.9 321 14.4 540 36.0 1324 11.4
Total 7860 100.0 2227 19.2 1500 12.9 11587 100
n=287 missing Nature information. Chi Square: X2=2506.34 df=16; p ≤ .001
Hit object crashes across metropolitan, regional and remote areas
Analysis of hit object serious injury crashes for all three locations revealed a
statistically significant association between location of crash and the primary object1
of collision. Table 4.4 shows the distribution of seven specific objects, which
accounted for 86.1%, 81.5% and 82.2% of primary objects hit in metropolitan,
regional and rural serious injury crashes respectively. Roadside kerbs (22.3%)
followed by Trees/Shrubs (19.0%) were the most common objects hit in metropolitan
area crashes. In contrast, Trees/Shrubs accounted for 46.7% and 34.3% respectively
of objects hit in regional and remote crashes. Embankments accounted for a further
22.4% of objects hit in remote area crashes, nearly twice the proportion of regional
crashes and six times the proportion of metropolitan crashes.
1 Primary object of collision may not necessarily be the main cause of injury if a subsequent object was collided with. This is especially relevant when a kerb is noted as the primary object.
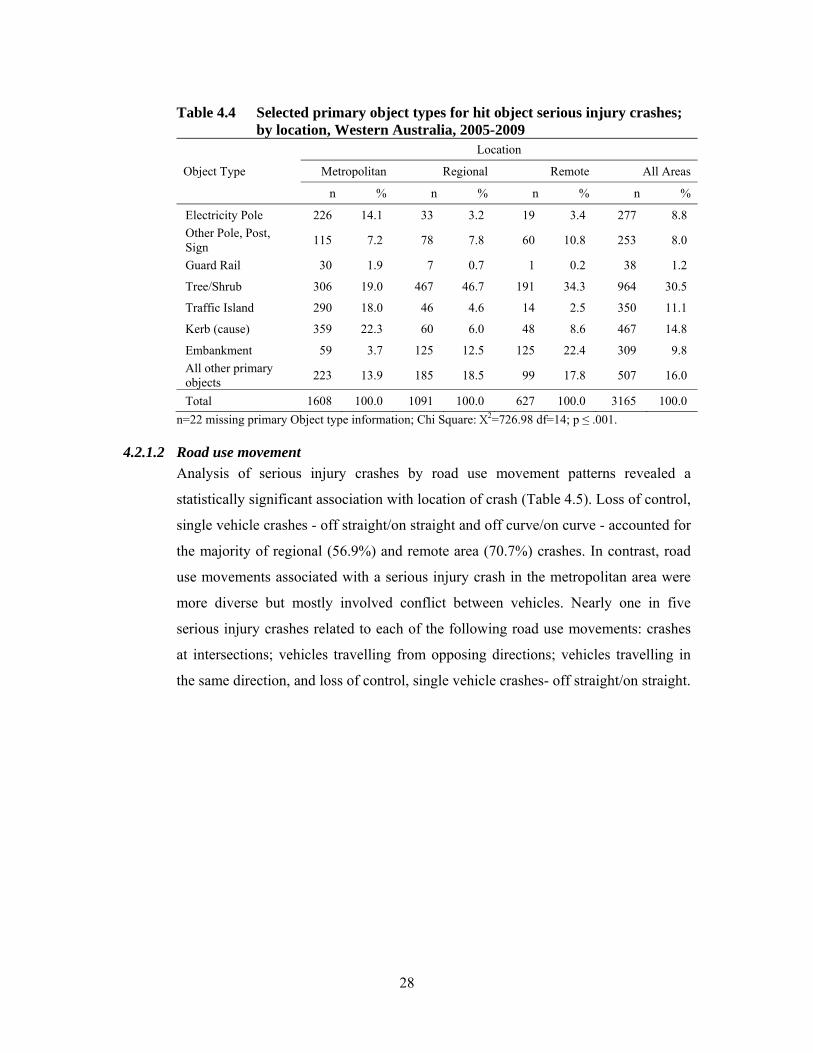
28
Table 4.4 Selected primary object types for hit object serious injury crashes; by location, Western Australia, 2005-2009
Location
Object Type Metropolitan Regional Remote All Areas
n % n % n % n %
Electricity Pole 226 14.1 33 3.2 19 3.4 277 8.8
Other Pole, Post, Sign
115 7.2 78 7.8 60 10.8 253 8.0
Guard Rail 30 1.9 7 0.7 1 0.2 38 1.2
Tree/Shrub 306 19.0 467 46.7 191 34.3 964 30.5
Traffic Island 290 18.0 46 4.6 14 2.5 350 11.1
Kerb (cause) 359 22.3 60 6.0 48 8.6 467 14.8
Embankment 59 3.7 125 12.5 125 22.4 309 9.8
All other primary objects
223 13.9 185 18.5 99 17.8 507 16.0
Total 1608 100.0 1091 100.0 627 100.0 3165 100.0
n=22 missing primary Object type information; Chi Square: X2=726.98 df=14; p ≤ .001.
4.2.1.2 Road use movement
Analysis of serious injury crashes by road use movement patterns revealed a
statistically significant association with location of crash (Table 4.5). Loss of control,
single vehicle crashes - off straight/on straight and off curve/on curve - accounted for
the majority of regional (56.9%) and remote area (70.7%) crashes. In contrast, road
use movements associated with a serious injury crash in the metropolitan area were
more diverse but mostly involved conflict between vehicles. Nearly one in five
serious injury crashes related to each of the following road use movements: crashes
at intersections; vehicles travelling from opposing directions; vehicles travelling in
the same direction, and loss of control, single vehicle crashes- off straight/on straight.

29
Table 4.5 Categories of road user movements for serious injury crashes; by location, Western Australia, 2005-2009
Location
RUM class Metropolitan Regional Remote All Areas
n % n % n % n %
Pedestrian 749 9.3 120 5.3 99 6.4 968 8.2
Intersection (adjacent approaches) 1658 20.6 235 10.3 76 4.9 1969 16.6
Vehicles from opposing directions
1445 17.9 236 10.3 87 5.6 1768 14.9
Vehicles from same direction
1473 18.3 184 8.1 41 2.7 1698 14.3
Manoeuvring 325 4.0 52 2.3 28 1.8 405 3.4
Overtaking 110 1.4 67 2.9 32 2.1 209 1.8
On path 188 2.3 69 3.0 74 4.8 331 2.8
Off/on straight 1376 17.1 715 31.3 695 45.1 2786 23.5
Off/on curve 672 8.3 585 25.6 395 25.6 1652 13.9
Passengers and Misc. 56 0.7 18 0.8 14 0.9 88 0.7
Total 8052 100.0 2281 100.0 1541 100.0 11874 100.0
Chi Square: X2=1918.32 df=18; p ≤ .001. RUM=Road User Movement
4.2.1.3 Time of day
Time of day of serious injury crashes by location is presented in Table 4.6. The
highest proportion of serious injury crashes occurred in the 12:00 to 17:59 period.
The proportion of crashes in each location during this time was similar: metropolitan
36.6%; regional 39.5%; remote 35.4%. A statistically significant association was
computed however, between time of day and location, with a higher than expected
number of crashes occurring in the regional and remote areas and lower than
expected number of crashes occurring in the metropolitan areas during the 00:00 to
05:59 period.

30
Table 4.6 Time of day of serious injury crashes; by location, Western Australia, 2005-2009
Location
Time of day Metropolitan Regional Remote All Areas
n % n % n % n %
00.00-05:59 828 10.4 285 12.6 210 13.8 1323 11.3
06.00-11:59 2104 26.4 541 24.0 369 24.3 3014 25.7
12:00-17:59 2912 36.6 893 39.5 539 35.4 4344 37.0
18:00-24:00 2116 26.6 539 23.9 403 26.5 3058 26.0
Total 7960 100.0 2258 100.0 1521 100.0 11739 100.0
n=135 missing Time of Day. Chi Square: X2=33.60 df=6; p ≤ .001
4.2.1.4 Lighting
Information on the lighting conditions at the location of crash is presented in Table
4.7. Across all locations, the majority of crashes occurred during daylight. There
were however, significant variations across locations in the lighting conditions for
the remaining serious injury crashes. Around one in five and one in four serious
injury crashes respectively in regional and remote locations occurred when it was
dark and without street lighting, compared with just 3.5% of crashes in the
metropolitan area. Further to this, nearly 30% of crashes in the metropolitan area
occurred when it was dark but the street was lit, compared with around one in ten
crashes in the regional and remote areas.
Table 4.7 Lighting conditions for serious injury crashes; by location, Western Australia, 2005-2009
Location
Lighting Conditions Metropolitan Regional Remote All Areas
n % n % n % n %
Daylight 4938 62.6 1436 64.1 884 58.5 7258 62.4
Dawn or Dusk 338 4.3 101 4.5 98 6.5 537 4.6
Dark-lights on 2274 28.8 231 10.3 166 11.0 2671 22.9
Dark-lights off 60 0.8 18 0.8 10 0.7 88 0.8
Dark-no lights 277 3.5 455 20.3 354 23.4 1086 9.3
Total 7887 100.0 2241 100.0 354 100 11640 100.0
n=234 missing Lighting Condition. Chi Square: X2=1284.60 df=8; p ≤ .001
4.2.1.5 Day of week
Across the days of the week and all locations, the highest proportion of serious injury
crashes occurred on Friday (17%) followed by Saturday (16.4%). A statistically

31
significant association was computed between location and day of week of crash. A
higher than expected number of crashes occurred in the regional and remote areas on
a Saturday and Sunday; while a higher than expected number of crashes occurred in
the metropolitan area on a Tuesday and Wednesday and to a lesser extent, Thursday.
Table 4.8 Day of week of serious injury crashes; by location, Western Australia, 2005-2009
Location
Day of Week Metropolitan Regional Remote All Areas
n % n % n % n %
Monday 1005 12.5 281 13.2 183 11.9 1469 12.4
Tuesday 1107 13.7 264 11.6 183 11.9 1544 13.1
Wednesday 1117 13.9 275 12.1 180 11.7 1572 13.2
Thursday 1159 14.4 293 12.8 195 12.7 1647 13.9
Friday 1415 17.6 363 15.9 243 15.8 2021 17.0
Saturday 1244 15.4 401 17.6 303 19.7 1948 16.4
Sunday 1005 12.5 404 17.7 254 16.5 1663 14.0
Total 8052 100.0 2281 100.0 1541 100.0 11874 100.0
Chi Square: X2=84.78 df=12; p ≤ .001
4.2.2 Road characteristics
The road characteristics considered in this section include: road ownership; posted
speed zone; road surface; road alignment; road gradient, and the condition of the
road at the time of the crash.
4.2.2.1 Speed zone
Posted speed limit was found to be significantly associated with the location of the
serious injury crash. Around six in ten serious injury crashes in the metropolitan area
occurred on roads with posted speed limits of 60km/hour or less, compared with
three in ten in the regional area and one in five in the remote area. In contrast, the
majority of serious injury crashes in regional (46.5%) and remote areas (62.1%) of
Western Australia occurred on roads with the maximum posted speed limit
(110km/hour).

32
Table 4.9 Posted speed zone of serious injury crashes; by location, Western Australia, 2005-2009
Location
Speed Zone Metropolitan Regional Remote All Areas
n % n % n % n %
40km/hour or less 59 1.0 8 0.4 3 0.3 70 0.8
50km/hour 1470 24.1 281 15.7 166 14.0 1917 21.1
60km/hour 2181 35.7 235 13.1 116 9.8 2532 27.9
70km/hour 1120 18.4 103 5.7 31 2.6 1254 13.8
80km/hour 352 10.7 148 8.2 68 5.7 868 9.6
90km/hour 156 2.6 114 6.4 48 4.0 318 3.5
100km/hour 363 5.9 71 4.0 19 1.6 453 5.0
110km/hour 100 1.6 835 46.5 738 62.1 1673 18.4
Total 6101 100.0 1795 100.0 1189 100.0 9085 100.0
n=2789 missing Speed Zone. Chi Square: X2=3853.40 df=14; p ≤ .001
4.2.2.2 Road surface
Across all locations, 95% of serious injury crashes occurred on roads that were
sealed as opposed to unsealed. This finding is consistent with a higher level of travel
on the predominantly sealed road network in the metropolitan area. Consistent with
this, the proportion of serious injury crashes occurring on unsealed roads was
substantially higher in the remote area (21.9%) and just slightly higher in regional
area (7.7%) of Western Australia. This distribution contributed to the finding of a
significant association between road surface and location of crash.
Table 4.10 Road surface of serious injury crashes; by location, Western Australia, 2005-2009
Location
Road Surface Metropolitan Regional Remote All Areas
n % n % n % n %
Sealed 7961 99.5 2096 92.3 1198 78.1 11255 95.3
Unsealed 41 0.5 176 7.7 335 21.9 552 4.7
Total 8002 100.0 2272 100.0 1533 100.0 11807 100.0
n=67 missing Road Surface. Chi Square: X2=86.51 df=2; p ≤ .001

33
4.2.2.3 Road alignment
Across all locations serious injury crashes were more likely to occur on straight
sections of the road (76.9%), compared with curved (23.1%). Perhaps consistent with
the distribution of straight and curved sections of road across the State road network,
a significant association was found between road alignment and location of crash.
Crashes on curved sections of road were twice as likely in the regional (35.8%) and
remote areas (32.4%) of Western Australia compared with the metropolitan area
(17.6%).
Table 4.11 Road alignment of serious injury crashes; by location, Western Australia, 2005-2009
Location
Road Alignment Metropolitan Regional Remote All Areas
n % n % n % n %
Curved 1359 17.6 799 35.8 489 32.4 2647 23.1
Straight 6355 82.4 1432 64.2 1022 67.2 8809 76.9
Total 7714 100.0 2231 100.0 1511 100.0 11456 100.0
n=418 missing Road Alignment. Chi Square: X2=406.44 df=2; p ≤ .001
4.2.2.4 Road gradient
Just over three-quarters of serious injury crashes across Western Australia occurred
on a level grade, with a further 22% occurring on a slope. These proportions did not
vary significantly across the metropolitan, regional and remote areas.
Table 4.12 Road grade of serious injury crashes; by location, Western Australia, 2005-2009
Location
Road Grade Metropolitan Regional Remote All Areas
n % n % n % n %
Level 5833 75.4 1625 73.7 1153 76.8 8611 75.3
Crest of Hill 209 2.7 64 2.9 41 2.7 314 2.7
Slope 1692 21.9 516 23.4 308 20.5 2516 22.0
Total 7734 100.0 2205 100.0 1502 100.0 11441 100.0
n=433 missing Road Grade. Chi Square: X2=4.92 df=4; p=.288
4.2.2.5 Road condition
Across all locations the vast majority of serious injury crashes (85%) occurred during
dry conditions, with this proportion being highest in remote Western Australia
(92.6%). Serious injury crashes whilst wet were more frequent in the metropolitan

34
area (16.6%), compared with regional (14.4%) and remote areas (7.4%). The rainfall
pattern across these locations is likely to be an important factor in the observed
significant relationship between weather and location of crash.
Table 4.13 Condition of road of serious injury crashes; by location, Western Australia, 2005-2009
Location
Road Condition Metropolitan Regional Remote All Areas
n % n % n % n %
Wet 1322 16.6 324 14.4 112 7.4 1758 15.0
Dry 6632 83.4 1928 85.6 1408 92.6 9968 85.0
Total 7954 100.0 2252 100.0 1520 100.0 11726 100.0
n=148 missing Road Condition. Chi Square: X2=86.51 df=2; p ≤ .001
4.2.2.6 Road ownership
Approximately six in ten serious injury crashes across all locations occurred on roads
that are the direct responsibility of Western Australian local government. This
proportion was highest for serious injury crashes occurring in metropolitan Perth
(66.4%) and similar for crashes occurring in regional (47.7%) and remote (48.6%)
Western Australia.
Table 4.14 Road ownership of serious injury crashes; by location, Western Australia, 2005-2009
Location
Road Ownership Metropolitan Regional Remote All Areas
n % n % n % n %
Local Government 5301 66.4 1069 47.7 710 48.6 7080 60.6
State/Federal Government
2687 33.6 1173 52.3 750 51.4 4610 39.4
Total 7988 100.0 2242 100.0 1460 100.0 11690 100.0
n=184 missing Road Ownership. Chi Square: X2=355.29 df=2; p ≤ .001
Analysis of the ownership of the road by road surface (sealed; unsealed) showed a
statistically significant relationship for the regional (X2=164.76 df=1; p ≤ .001) and
remote (X2=196.84 df=2; p ≤ .001) areas only. A higher than expected number of
serious injury crashes occurred on local government owned, unsealed roads in the
regional (97.4% of serious injury crashes on unsealed roads) and remote (87.5% of
serious injury crashes on unsealed roads) areas.

35
4.2.3 Road user characteristics
A total of 25,798 road users were recorded by police as being involved in the 11,874
serious crashes occurring during the study period. It must be borne in mind that this
number does not for a number of reasons, represent the actual number of crash
involved road users. One reason is that during the study period, police were not
required to record the involvement of road users who were not the controller of the
vehicle and were not injured.
Approximately three quarters of those reported to be involved in a serious injury
crash were designated drivers/riders. A further 21% were passengers (including those
on motorcycles and bicycles) with the remainder designated as pedestrians. The
majority of road users within each group were involved in crashes occurring in the
metropolitan area. A significant association was found between road user status and
location of crash with a higher than expected number of passengers involved in
serious injury crashes occurring in the regional (26.1%) and remote (38.5%) areas,
compared with the metropolitan area (16.5%). Also, a higher than expected number
of pedestrians were found to be involved in crashes in the metropolitan area (4.7%),
compared with regional (3.1%) and remote (3.5%) areas of WA.
Table 4.15 Road users involved in serious injury crashes; by location, Western Australia, 2005-2009
Location
Road User Metropolitan Regional Remote All Areas
n % n % n % n %
Driver/Rider* 14310 78.8 3178 70.8 1834 58.0 19322 74.9
Passenger^ 3007 16.5 1170 26.1 1217 38.5 5394 20.9
Pedestrian 837 4.7 136 3.1 109 3.5 1082 4.2
Total 18154 100.0 4484 100.0 3160 100.0 25798 100.0
Chi Square: X2=883.02 df=4; p ≤ .001; *also includes drivers of tractors, motorised wheelchairs and riders of bicycles; ^includes passengers on motorcycles and bicycles.
4.2.4 Drivers/riders
The injury outcome, age, sex, licensing status, seat belt/helmet use, and Blood
Alcohol Concentration Level (BACL) of drivers (car, motorbike and bicyclists)
involved in a serious injury crash across the three locations are presented in Tables
4.16 to 4.22.

36
4.2.4.1 Injury outcome
Injury information was available for 61% (n=11,772) of the n=19,322 drivers/riders
recorded to be involved in a serious injury crash. The remaining drivers/riders for
whom no injury information was recorded may have either been uninjured or failed
to have their injury recorded by police. These drivers/riders were therefore excluded
from the analysis of injury outcomes.
Of the drivers/riders with a known injury outcome, the majority (80.1%) required
hospitalisation while a further 5.5% were fatally injured. The injury outcomes of
drivers/riders were found to vary with the location of crash. Drivers/riders injured in
a serious injury crash in the regional (9.6%) and remote (10.5%) areas were
approximately three times more likely to be killed compared with those involved in a
serious injury crash in the metropolitan area (3.5%).
Table 4.16 Injury outcome* of drivers/riders involved in serious injury crashes; by location, Western Australia, 2005-2009
Location
Injury Outcome
Metropolitan Regional Remote All Areas
n % n % n % n %
Death 285 3.5 221 9.6 146 10.5 652 5.5
Medical attention 741 9.2 231 10.0 124 8.9 1096 9.3
Hospitalisation 6580 81.4 1773 77.1 1082 77.7 9435 80.1
Injury not requiring medical attention
475 5.9 74 3.2 40 2.9 589 5.0
Total 8081 100.0 2299 100.0 1392 100.0 11772 100.0
n=7,550 no Injury information. Chi Square: X2=236.19 df=6; p ≤ .001. *The injury outcome is a person level variable.
4.2.4.2 Age
Police crash records show that n=264 drivers/riders involved in a serious injury crash
were aged up to 16 years. Approximately 27% of serious injury crash involved
drivers/riders were aged 17-24 years and a further 31% aged 25-39 years. Age of
driver/rider and location of crash were significantly related. In the regional area, a
higher than expected number of drivers/riders aged 12-16 years, 17-24 years and 60+
years were involved in a crash. In the remote area, a higher than expected number of
drivers/riders aged 40-59 years were involved in a crash.

37
Table 4.17 Age of drivers/riders involved in serious injury crashes; by location, Western Australia, 2005-2009
Location
Age Group Metropolitan Regional Remote All Areas
n % n % n % n %
Up to 11 years 33 0.2 13 0.4 4 0.2 50 0.3
12-16 years 129 1.0 57 1.9 28 1.6 214 1.2
17-24 years 3644 27.2 848 27.8 468 26.6 4960 27.3
25-39 years 4278 32.0 853 28.0 588 33.4 5719 31.4
40-59 years 3772 28.2 861 28.2 252 29.8 5158 28.4
60+ years 1525 11.4 418 13.7 146 8.3 2089 11.5
Total 13381 100.0 3050 100.0 1759 100.0 18190 100.0
n=1132 missing Age. Chi Square: X2=69.17 df=10; p ≤ .001
4.2.4.3 Sex
Males accounted for approximately two-thirds of all drivers/riders involved in a
serious injury crash across all locations, with a significant relationship being
observed between driver/rider sex and location of serious injury crash. The
proportion of male drivers/riders involved in a serious injury crash was somewhat
higher for crashes occurring in the regional area (68.4%) and higher again in the
remote area (71.4%), compared with the metropolitan area (65%).
Table 4.18 Sex of drivers/riders involved in serious injury crashes; by location, Western Australia, 2005-2009
Location
Sex Metropolitan Regional Remote All Areas
n % N % N % n %
Male 9044 65.0 2133 68.4 1285 71.4 12462 66.2
Female 4871 35.0 984 31.6 514 28.6 6369 33.8
Total 13915 100.0 3117 100.0 1799 100.0 18831 100.0
n=491 missing Sex. Chi Square: X2=37.93.02 df=2; p ≤ .001
4.2.4.4 Licensing status
The frequency distribution of the licensing status of drivers/riders involved in a
serious injury crash across the three locations is presented in Table 4.19. This
analysis was restricted to drivers/riders of vehicle types requiring a licence to be
driven/ridden (e.g., cars, buses, trucks, motorcycles, mopeds and on-road trail bikes).
Across all locations, 79.7% of serious injury crash involved drivers/riders held a full
licence, with a further 11.1% holding a provisional licence. Licensing status was
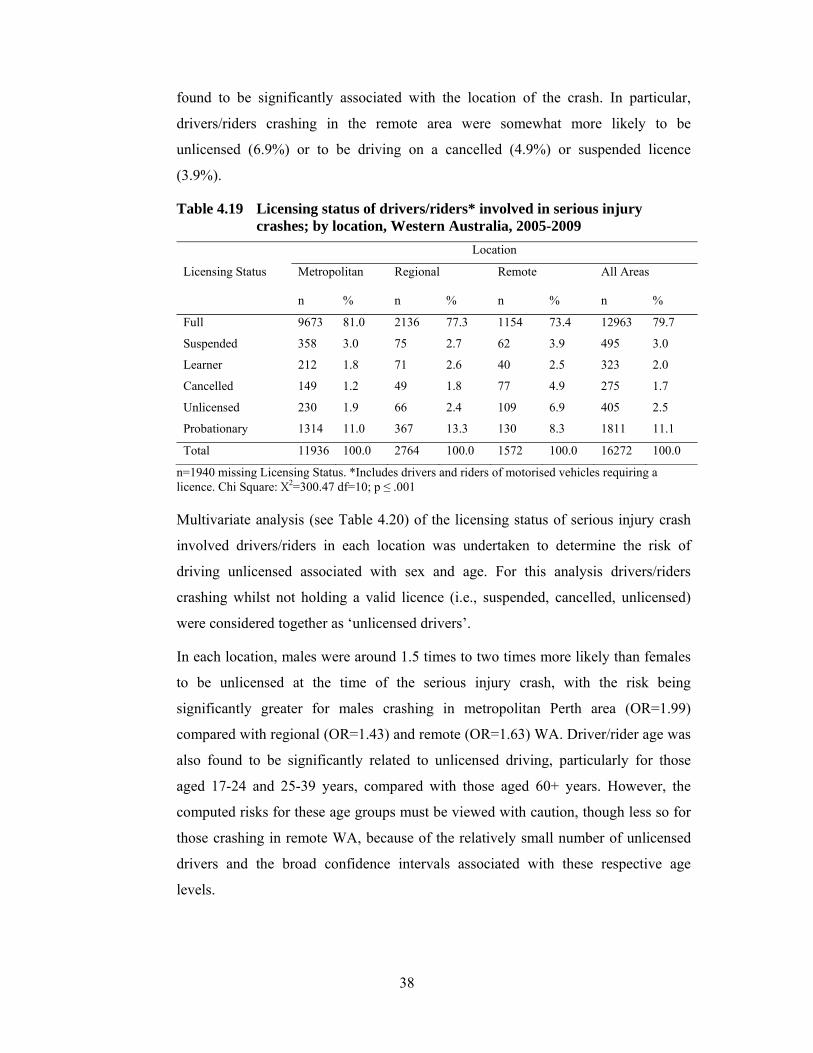
38
found to be significantly associated with the location of the crash. In particular,
drivers/riders crashing in the remote area were somewhat more likely to be
unlicensed (6.9%) or to be driving on a cancelled (4.9%) or suspended licence
(3.9%).
Table 4.19 Licensing status of drivers/riders* involved in serious injury crashes; by location, Western Australia, 2005-2009
Location
Licensing Status
Metropolitan Regional Remote All Areas
n % n % n % n %
Full 9673 81.0 2136 77.3 1154 73.4 12963 79.7
Suspended 358 3.0 75 2.7 62 3.9 495 3.0
Learner 212 1.8 71 2.6 40 2.5 323 2.0
Cancelled 149 1.2 49 1.8 77 4.9 275 1.7
Unlicensed 230 1.9 66 2.4 109 6.9 405 2.5
Probationary 1314 11.0 367 13.3 130 8.3 1811 11.1
Total 11936 100.0 2764 100.0 1572 100.0 16272 100.0
n=1940 missing Licensing Status. *Includes drivers and riders of motorised vehicles requiring a licence. Chi Square: X2=300.47 df=10; p ≤ .001
Multivariate analysis (see Table 4.20) of the licensing status of serious injury crash
involved drivers/riders in each location was undertaken to determine the risk of
driving unlicensed associated with sex and age. For this analysis drivers/riders
crashing whilst not holding a valid licence (i.e., suspended, cancelled, unlicensed)
were considered together as ‘unlicensed drivers’.
In each location, males were around 1.5 times to two times more likely than females
to be unlicensed at the time of the serious injury crash, with the risk being
significantly greater for males crashing in metropolitan Perth area (OR=1.99)
compared with regional (OR=1.43) and remote (OR=1.63) WA. Driver/rider age was
also found to be significantly related to unlicensed driving, particularly for those
aged 17-24 and 25-39 years, compared with those aged 60+ years. However, the
computed risks for these age groups must be viewed with caution, though less so for
those crashing in remote WA, because of the relatively small number of unlicensed
drivers and the broad confidence intervals associated with these respective age
levels.

39
Table 4.20 Driver demographics associated with unlicensed driving for those involved in a serious injury crash in the metropolitan, regional and remote areas of Western Australia; 2005-2009
Location/Variable OR 95% Confidence Interval P value Metropolitan Area Sex -Female^ 1.0 -Male 1.99 1.66-2.38 .000 Age (years) -60+ ^ 1.00 -40-59 4.62 2.23-9.55 .000 -25-39 17.05 8.43-34.47 .000 -17-24 13.93 6.87-28.26 .000 Regional Area Sex -Female^ 1.0 -Male 1.43 1.05-2.04 .047 Age (years) -60+ ^ 1.00 -40-59 14.67 1.99-108.11 .000 -25-39 43.91 6.08-316.91 .000 -17-24 33.89 4.68-245.38 .000 Remote Area Sex -Female^ 1.0 -Male 1.63 1.16-2.30 .01 Age (years) -60+ ^ 1.00 -40-59 2.01 0.83-4.85 ns -25-39 5.06 2.16-11.83 .000 -17-24 4.93 2.09-11.62 .000 ^reference group
4.2.4.5 Blood Alcohol Concentration Level
Blood Alcohol Concentration Level (BACL) information was available for 62.5% of
drivers/riders involved in a serious injury crash during the study period. A significant
association was found between the presence of alcohol and location of crash (Table
4.21). Drivers/riders involved in a serious injury crash in metropolitan Perth were
less likely to record a positive BACL (i.e., greater than zero) (11.2%) compared with
drivers/riders involved in a serious injury crash in regional (16.5%) and remote
Western Australia (23.4%).

40
Table 4.21 Presence of alcohol among drivers/riders involved in serious injury crashes; by location, Western Australia, 2005-2009
Location
Presence of alcohol
Metropolitan Regional Remote All Areas
n % n % n % n %
Zero BACL 7886 88.8 1706 83.5 875 76.6 10467 86.8
Positive BACL* 992 11.2 338 16.5 267 23.4 1597 13.2
Total 8878 100.0 2044 100.0 1142 100.0 12064 100.0
n=7258 missing BACL; Chi Square: X2=154.57 df=2; p ≤ .001. *Greater than 0.000gm%
Further analysis of the crash and alcohol data showed that approximately 63.3% of
drivers/riders involved in a serious injury crash across WA and testing positive for
alcohol, recorded a BACL exceeding 0.08gm%. This proportion was significantly
higher for drivers crashing in remote Western Australia (74.6%) and slightly higher
for those crashing in regional Western Australia (61.2%), compared with
metropolitan Perth (60.9%).
Table 4.22 Positive Blood Alcohol Concentration Level of drivers/riders involved in serious injury crashes; by location, Western Australia, 2005-2009
Location
Level of +ve BAC
Metropolitan Regional Remote All Areas
n % n % n % n %
0.001-0.019gm% 73 7.4 23 6.8 9 3.4 105 6.6
0.020-0.049gm% 160 16.1 52 15.4 29 10.9 241 15.1
0.050-0.079gm% 155 15.6 56 16.6 30 11.2 241 15.1
0.080-0.100gm% 131 13.2 41 12.1 29 10.9 201 12.6
≥0.101gm% 473 47.7 166 49.1 170 63.7 809 50.7
Total 992 100.0 338 100.0 267 100.0 1597 100.0
Chi Square: X2=24.13 df=8; p ≤ .005
Multivariate analysis of the effect of driver/rider sex, age, and licensing status on
driver/rider BACL (zero versus positive) was undertaken for serious injury crashes
occurring in each location. As shown in Table 4.23, in all locations male
drivers/riders were two to three times more likely than their female counterparts to
have crashed with a positive BACL. Next, drivers who crashed and did not hold a
valid licence were significantly more likely to have crashed with a positive BACL.
This ranged from 3.7 times more likely for metropolitan driver/riders to a high of 6.4
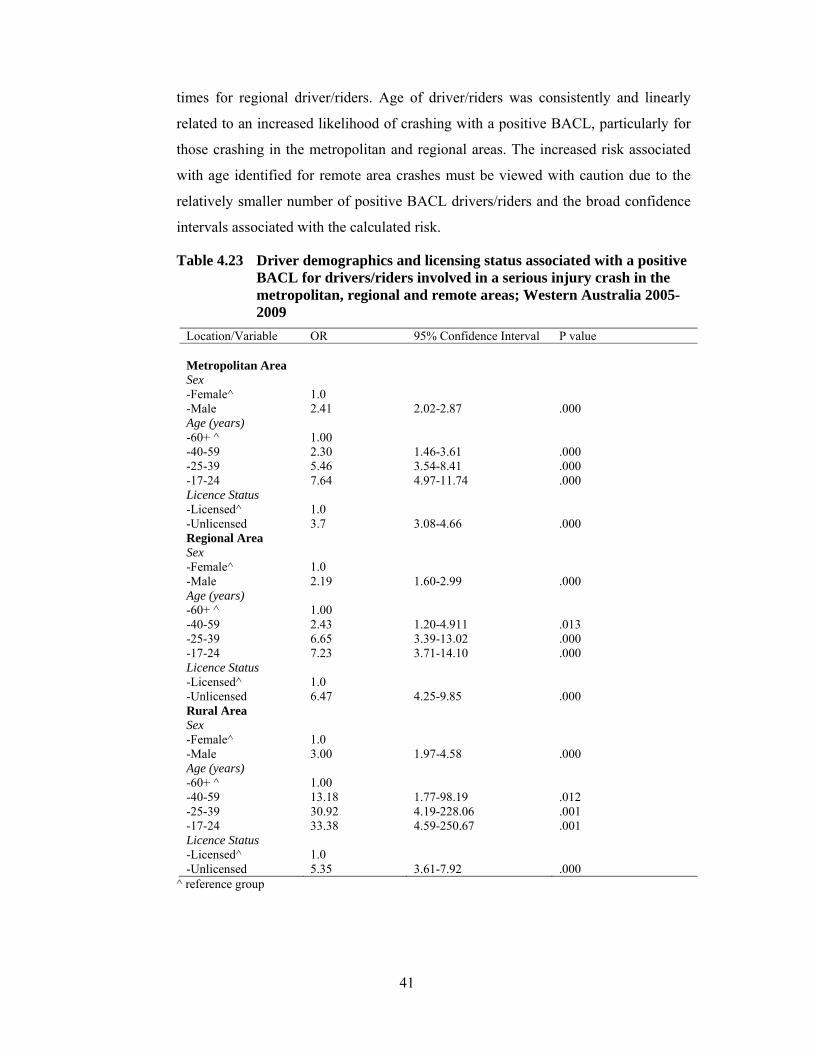
41
times for regional driver/riders. Age of driver/riders was consistently and linearly
related to an increased likelihood of crashing with a positive BACL, particularly for
those crashing in the metropolitan and regional areas. The increased risk associated
with age identified for remote area crashes must be viewed with caution due to the
relatively smaller number of positive BACL drivers/riders and the broad confidence
intervals associated with the calculated risk.
Table 4.23 Driver demographics and licensing status associated with a positive BACL for drivers/riders involved in a serious injury crash in the metropolitan, regional and remote areas; Western Australia 2005-2009
Location/Variable OR 95% Confidence Interval P value Metropolitan Area Sex -Female^ 1.0 -Male 2.41 2.02-2.87 .000 Age (years) -60+ ^ 1.00 -40-59 2.30 1.46-3.61 .000 -25-39 5.46 3.54-8.41 .000 -17-24 7.64 4.97-11.74 .000 Licence Status -Licensed^ 1.0 -Unlicensed 3.7 3.08-4.66 .000 Regional Area Sex -Female^ 1.0 -Male 2.19 1.60-2.99 .000 Age (years) -60+ ^ 1.00 -40-59 2.43 1.20-4.911 .013 -25-39 6.65 3.39-13.02 .000 -17-24 7.23 3.71-14.10 .000 Licence Status -Licensed^ 1.0 -Unlicensed 6.47 4.25-9.85 .000 Rural Area Sex -Female^ 1.0 -Male 3.00 1.97-4.58 .000 Age (years) -60+ ^ 1.00 -40-59 13.18 1.77-98.19 .012 -25-39 30.92 4.19-228.06 .001 -17-24 33.38 4.59-250.67 .001 Licence Status -Licensed^ 1.0 -Unlicensed 5.35 3.61-7.92 .000
^ reference group

42
4.2.4.6 Use of protection
Seat belt/helmet wearing was analysed for drivers and riders of known vehicle types,
(including bicycles) who are required to use protection. Overall, 94.3% of
drivers/riders involved in a serious injury crash reportedly used a seat belt/helmet. A
significant relationship was computed between use of protection and the location of
crash. Non-use was lowest among drivers/riders crashing in metropolitan Perth (4%)
and higher among drivers/riders crashing in regional (7.6%) and remote Western
Australia (15.6%).
Table 4.24 Seat belt/helmet use by drivers/riders* involved in serious injury crashes; by location, Western Australia, 2005-2009
Location
Seat belt/helmet use Metropolitan Regional Remote All Areas
n % n % n % n %
Worn 10673 96.0 2378 92.4 1247 84.4 14298 94.3
Not worn 443 4.0 195 7.6 230 15.6 868 5.7
Total 11116 100.0 2573 100.0 1447 100.0 15166 100.0
n=4156 missing seat belt/helmet use. *Includes drivers and riders of known vehicle types, including bicycles, required to use a seat belt or helmet. Chi Square: X2=950.35 df=2; p ≤ .001.
Across all crash locations unprotected drivers and riders were nearly five times
(OR=5.07 95% CI 4.14-6.19) more likely to be killed as opposed to non-fatally
injured/no injury when involved in a serious injury crash. The unadjusted odds of an
unprotected driver/rider being fatally versus non-fatally injured/no injury were
highest for those crashing in the remote area (OR=5.46 95% CI 3.72-8.05) versus the
regional (OR=3.98 95% CI 2.76-5.74) and metropolitan area (OR=3.67 95% CI 2.59-
5.21). Only the remote and metropolitan areas significantly differed in the risk of
death associated with the non-use of protection.
Multivariate analysis of the effect of various driver/rider (excluding bicycle riders)
factors (sex, age, licensing status, BACL status) on the use of a seat belt/helmet use
(worn versus not worn) was undertaken for each location and is reported in Table
4.25. Age of driver/rider was a significant risk factor for being unbelted only for
those aged 25-39 years and crashing in regional WA (OR=2.57). Across all crash
locations male drivers/riders and those recording a positive BACL were significantly
more likely to be unbelted, with the risk varying across the locations. Being

43
unlicensed was a significant risk factor for drivers/riders being unbelted in crashes in
the metropolitan (OR=2.33) and rural (OR=3.17) areas only.
Table 4.25 Driver demographics, licensing status and alcohol use associated with the non-use of a seat belt/helmet by drivers/riders involved in a serious injury crash in the metropolitan regional and rural areas; Western Australia 2005-2009
Location/Variable OR 95% Confidence Interval P value Metropolitan Area Gender -Female^ 1.0 -Male 1.99 1.35-2.92 .000 Licence Status -Licensed^ 1.0 -Unlicensed 2.33 1.53-3.55 .000 BACL status -Zero 1.0 -Positive 4.35 3.12-6.06 .000 Regional Area Age (years) -60+ ^ 1.00 -40-59 1.58 0.61-4.05 ns-25-39 2.57 1.04-6.36 .040 -17-24 1.46 0.57-3.72 ns Gender -Female^ 1.0 -Male 4.04 2.05-7.95 .000 BACL status -Zero^ 1.0 -Positive 5.16 3.22-8.28 .000 Rural Area Gender -Female^ 1.0 -Male 4.49 2.19-9.23 .000 Licence Status -Licensed^ 1.0 -Unlicensed 3.17 1.89-5.31 .000 BACL status -Zero^ 1.0 -Positive 3.10 1.94-4.96 .000 ^reference group
4.2.5 Passengers
Information on passengers involved in a serious injury crash is only available when
the passenger is noted by police to have sustained an injury. The details of uninjured
passengers were otherwise not recorded during the study period. A total of n=5394
passengers were recorded by police to have been fatally or non-fatally injured when
involved in a serious injury crash during the period 2005 to 2009, with the majority
(55.7%) of injured passengers involved in serious injury crashes occurring in the

44
metropolitan area. The injury outcome, age, sex, and use of protection by passengers
are presented in Tables 4.26-4.29.
4.2.5.1 Injury outcome
The majority (68.3%) of passengers involved in a serious injury crash sustained
injuries that, according to police, required hospitalisation. A further 4.6% of
passengers were reported to be fatally injured. The injury outcomes of passengers
varied with the location of crash: passengers were more likely to be fatally injured in
remote area crashes (7.8%) compared with regional (6.7%) and metropolitan area
(2.5%) crashes, while passengers were somewhat more likely to be hospitalised as a
result of metropolitan area crashes (70.6%) compared with regional (67.1%) and
remote area (63.8%) crashes.
Table 4.26 Injury outcome of passengers involved in serious injury crashes; by location, Western Australia, 2005-2009
Location
Injury Outcome
Metropolitan Regional Remote All Areas
n % n % n % n %
Death 76 2.5 78 6.7 95 7.8 249 4.6
Medical attention 538 18.0 233 19.9 285 23.4 1056 19.6
Hospitalisation 2114 70.6 784 67.1 776 63.8 3674 68.3
Injury not requiring medical attention
268 8.9 74 6.3 61 5.0 403 7.5
Total 2996 100.0 1169 100.0 1217 100.0 5382 100.0
n=12 missing Injury Outcome; Chi Square: X2=68.15 df=10; p ≤ .001
4.2.5.2 Age
Just over 50% of all passengers involved in a serious injury crash were aged 17-39
years. A significant relationship was computed between age and location of crash.
For example, a higher than expected proportion of passengers aged 17-24 years were
involved in a crash in the metropolitan area, while a higher than expected proportion
of passengers aged 25-39 and 40-59 years were involved in a crash in the remote
area.

45
Table 4.27 Age of passengers involved in serious injury crashes; by location, Western Australia, 2005-2009
Location
Age Group
Metropolitan Regional Remote All Areas
n % n % n % n %
Up to 11 years 332 13.7 145 14.9 109 10.4 586 13.2
12-16 years 300 12.4 130 13.3 95 9.1 525 11.8
17-24 years 812 33.6 280 28.7 301 28.8 1393 31.4
25-39 years 424 17.5 182 18.7 281 26.9 887 20.0
40-59 years 293 12.1 134 13.8 164 15.7 591 13.3
60+ years 256 10.6 103 10.6 94 9.0 453 10.2
Total 2417 100.0 974974 100.0 1044 100.0 4435 100.0
n=959 missing Age; Chi Square: X2=68.15 df=10; p ≤ .001
4.2.5.3 Sex
The sex of passengers was not identified for 51.2% of those involved in a serious
injury crash. Of the remaining, males and females were near equally distributed
among crash involved passenger across all locations. A significant relationship was
computed between sex of passengers and location of crash, with 60.1% of crash
involved passengers in the remote area being male, compared with 44.9% in the
metropolitan area and 49.2% in the regional area.
Table 4.28 Sex of passengers involved in serious injury crashes; by location, Western Australia, 2005-2009
Location
Sex
Metropolitan Regional Remote All Areas
n % n % n % n %
Males 634 45.0 292 49.5 377 59.8 1303 49.6
Females 775 55.1 298 50.5 253 40.2 1326 50.4
Total 1409 100.0 590 100.0 630 100.0 2629 100.0
n=2765 missing Sex; Chi Square: X2=38.37 df=2; p ≤ .001
4.2.5.4 Use of protection
Information on passenger seat belt use (or helmet use in the case of those riding
pillion on motorcycles and bicycles) was not available for 18% of those recorded by
police to be involved in a serious injury crash. Across all locations, 85.6% of injured
passengers were reported to have used protection, though this proportion was lowest

46
for passengers involved in a crash in the remote area (66.2%) and highest for those
involved in a crash in the metropolitan area (91.6%).
Table 4.29 Seat belt/helmet use by passengers involved in serious injury crashes; by location, Western Australia, 2005-2009
Location
Seat belt/helmet use Metropolitan Regional Remote All Areas
n % n % n % n %
Worn 2249 91.6 889 89.1 641 66.2 3779 85.6
Not worn 206 8.4 109 10.9 328 33.8 643 14.4
Total 2455 100.0 998 100.0 969 100.0 4422 100.0
n=972 missing Seat Belt/Helmet Use; Chi Square: X2=375.95 df=2; p ≤ .001
As per driver/riders, passengers involved in a serious injury crash across WA were
five times more likely to be fatally versus non-fatally injured if they were not using
protection (seat belt or helmet): OR=5.01 95%CI 3.75-6.70. The odds of a passenger
being killed in a metropolitan area serious injury crash when unbelted/not wearing a
helmet (OR=3.92 95%CI 2.18-7.06) was not significantly different from those
crashing in regional (OR=3.01 95%CI 1.64-5.51) or remote Western Australia
(OR=5.91 95%CI 3.54-9.87).
4.2.6 Pedestrians
A total of n=1082 pedestrians were involved in a serious injury crash during the
period 2005 to 2009, with the majority (77.3%) involved in crashes occurring in the
metropolitan area. Injury outcome, age, and sex of crash involved pedestrian and the
posted speed zone of the crash are reported in Tables 4.30 to 4.34. No analysis was
undertaken of pedestrian BACL as this information was missing for 89% of crash
involved pedestrians.
4.2.6.1 Injury outcome
Almost nine in ten pedestrians involved in a serious injury crash required
hospitalisation (Table 4.30). As for drivers and passengers, the injury outcome of
crash involved pedestrians varied with the location of the crash. Pedestrians were
significantly more likely to be hospitalised when involved in a crash in the
metropolitan area, while pedestrians were more likely to be killed when involved in a
crash in the regional (13.3%) and remote area (17.4%), compared with the
metropolitan area (7.4%).

47
Table 4.30 Injury outcome of pedestrians involved in serious injury crashes; by location, Western Australia, 2005-2009
Location
Injury Outcome
Metropolitan Regional Remote All Areas
n % n % n % n %
Death 62 7.4 18 13.3 19 17.4 99 9.2
Medical attention 15 1.8 2 1.5 2 1.8 19 1.8
Hospitalisation 751 90.2 114 84.4 88 80.7 953 88.5
Injury not requiring medical attention
5 0.6 1 0.7 0 0.0 6 0.6
Total 833 100.0 135 100.0 109 100.0 1077 100.0
n=5 missing Injury Outcome. Chi Square: X2=105.40 df=6; p ≤ .001
4.2.6.2 Age
Around 46% of all serious injury crash involved pedestrians were aged 17-39 years.
The age of crash involved pedestrians was similar across the metropolitan and
regional area. In contrast, pedestrians involved in crashes in the remote area were
more likely to be aged 25-59 years and less likely to be under 17 years of age.
Table 4.31 Age of pedestrians involved in serious injury crashes; by location, Western Australia, 2005-2009
Location
Age Group
Metropolitan Regional Remote All Areas
n % n % n % n %
Up to 11 years 64 8.5 14 11.3 7 7.4 85 8.8
12-16 years 81 10.8 19 15.3 4 4.2 104 10.7
17-24 years 178 23.7 27 21.8 16 16.8 221 22.8
25-39 years 166 22.1 24 19.4 31 32.6 221 22.8
40-59 years 137 18.2 17 13.7 26 27.4 180 18.5
60+ years 126 16.8 23 18.5 11 11.6 160 16.5
Total 752 100.0 124 100.0 95 100.0 971 100.0
n=111 missing Age; Chi Square: X2=21.36 df=10; p ≤ .05
4.2.6.3 Gender
Around six in ten crash involved pedestrians were male. The distribution of males
and females was similar across metropolitan and regional crashes. In the remote area
however, males accounted for approximately three-quarters of those involved in a
serious injury crash.

48
Table 4.32 Sex of pedestrians involved in serious injury crashes; by location, Western Australia, 2005-2009
Location
Sex
Metropolitan Regional Remote All Areas
n % n % n % n %
Males 487 61.5 78 59.1 74 74.0 639 62.4
Females 305 38.5 54 40.9 26 26.0 385 37.6
Total 792 100.0 132 100.0 100 100.0 1024 100.0
n=58 missing sex; Chi Square: X2=6.63 df=2; p ≤ .05
4.2.6.4 Posted speed zone
The posted speed zone of serious injury crashes involving pedestrians is presented in
Table 4.33. In each location the majority of serious injury pedestrian crashes
occurred on roads posted 60km/hour and below. Posted speed zone and location of
crash were found to be associated, with a higher than expected number of pedestrian
crashes observed in higher speed zones (e.g., ≥80km/hour) in the remote and rural
area, and a higher than expected number of pedestrian crashes in the 60km/hour-
70km/hour speed zone in the metropolitan area.
Table 4.33 Posted speed zone of serious injury pedestrian crashes; by location, Western Australia, 2005-2009
Location
Speed Zone Metropolitan Regional Remote All Areas
n % n % n % n %
40km/hour or less 18 2.9 3 2.8 1 1.1 22 2.7
50km/hour 274 43.4 52 47.7 47 54.0 373 45.1
60km/hour 231 36.6 20 18.3 15 17.2 266 32.2
70km/hour 66 10.5 12 11.0 3 3.4 81 9.8
80km/hour 29 4.6 7 6.4 4 4.6 40 4.8
90km/hour 3 0.5 5 4.6 4 4.6 12 1.5
100km/hour 9 1.4 1 0.9 1 1.1 11 1.3
110km/hour 1 0.2 9 8.3 12 13.8 22 2.7
Total 631 100.0 109 100.0 87 100.0 827 100.0
n=255 missing Speed Zone. Chi Square: X2=109.85 df=14; p ≤ .001
4.2.6.5 Time of day
The time of day of serious injury crashes involving pedestrians is presented in Table
4.34. A higher than expected number of pedestrian crashes occurred during the

49
period 18:00-23:59 in both the regional and remote locations, and higher than
expected number in the period 00:00-05:59 in remote locations.
Table 4.34 Time of day of serious injury pedestrian crashes; by location, Western Australia, 2005-2009
Location
Time of day Metropolitan Regional Remote All Areas
n % n % n % n %
00.00-05:59 111 13.5 23 16.9 23 21.3 157 14.8
06.00-11:59 185 22.6 26 19.1 22 20.4 233 21.9
12:00-17:59 289 35.2 41 30.1 18 16.7 348 32.7
18:00-23:59 235 28.7 46 33.8 45 41.7 326 30.6
Total 820 100.0 136 100.0 108 100.0 1064 100.0
n=18 missing Time of Day. Chi Square: X2=21.31 df=6; p ≤ .001
4.3 Vehicle characteristics
Police crash records unfortunately contain minimal information that is useful for an
analysis of vehicle factors relevant to a serious injury crash by location. The most
useful information relates to the vehicle type and registration status. Other vehicle
information, such as age of manufacture and number of cylinders, are mostly
incomplete in police crash records and therefore of limited use.
4.3.1 Vehicle Type
As shown in Table 4.35, nearly 85% of vehicles involved in a serious injury crash
across all locations were passenger type vehicles. Motorcycles (inclusive of mopeds
and trail bikes) accounted for a further 8.4% of serious injury crash involved
motorised vehicles, while trucks (including arrangements of prime movers, trailers
and road trains) accounted for another 3.6% of vehicles. There was some variation in
vehicle type by location of crash: motorcycles and bicycles were more frequently
involved in metropolitan crashes, while trucks and buses were more frequently
involved in remote area crashes.

50
Table 4.35 Vehicles* involved in serious injury crashes; by location, Western Australia, 2005-2009
Location
Unit Type Metropolitan Regional Remote All Areas
n % n % n % n %
Passenger Car 14168 84.2 3612 84.8 2564 84.8 20344 84.8
Motorcycle/mopeds 1473 8.8 367 8.6 194 6.4 2034 8.4
Truck 487 2.9 199 4.7 181 6.0 867 3.6
Bicycle 487 2.9 61 1.4 18 0.6 560 2.3
Bus 191 1.1 14 0.3 59 2.0 264 1.1
Other 24 0.1 7 0.2 7 0.2 38 0.2
Total 16824 100.0 4260 100.0 3023 100.0 24107 100.0
*Excludes non-motorised scooters and skateboards. Chi Square: X2=220.64 df=10; p ≤ .001
4.3.2 Vehicle Registration Status
Registration status was analysed for cars, trucks, buses, motorcycles, moped and
motorbikes. Over 99% of motorised vehicles involved in a serious injury crash were
registered at the time of the crash. The proportion of unregistered crashing vehicles
was slightly higher in regional and remote Western Australia and contributed to a
significant association between registration status and location of crash.
Table 4.36 Registration status of motorised vehicles involved in serious injury crashes; by location, Western Australia, 2005-2009
Location
Registration Status
Metropolitan Regional Remote All Areas
n % n % n % n %
Registered 13010 99.5 2930 98.8 1693 98.0 17633 99.3
Unregistered 62 0.5 37 1.2 34 2.0 133 0.7
Total 13072 100.0 2967 100.0 1727 100.0 17766 100.0
n=446 missing registration status; Chi Square: X2=57.76 df=2; p ≤ .001

51
4.4 Multivariate analysis of serious injury crash risk by location
The aim of the multivariate analysis was to investigate if groupings of crash and road
factors and groupings of driver/rider factors could predict or discriminate serious
injury crashes in each of the three locations. For this analysis, Multinomial Logistic
Regression (MLR) was used in preference to Discriminant Function Analysis (DFA)
since the former does not require assumptions of normality, linearity, and
homogeneity of variance for the independent or predictor variable, which are
required for DFA. For the analysis, the metropolitan area was selected as the
‘reference location’ (see Tables 4.37 and 4.38).
4.4.1 Crash and road factors
The Likelihood Ratio Test confirmed a statistically significant relationship between
four crash/road variables and the location of the occurrence of the serious injury
crash. Compared with the metropolitan Perth area, serious injury crashes in the
regional and remote areas were significantly more likely to involve a single vehicle
rather than multiple vehicles/units (OR=1.65 regional; OR=3.0 remote), to occur on
unsealed rather than sealed roads (OR=6.51 regional; OR=19.0 remote), on curves rather
than straight sections of road (OR=2.15 regional; OR=2.35 remote), and on roads with
posted speed limits of ≥90km/hour compared with ≤80km/hour (OR=9.21 regional;
OR=12.01 remote). Comparison of the odds ratios and 95% confidence intervals of
variables across the regional and remote locations shows that for all variables,
except road alignment, the odds ratios were consistently higher for remote area
crashes than those for regional area crashes.

52
Table 4.37 Multinomial Logistic Regression of metropolitan*, regional and remote serious injury crashes by crash and road factors; Western Australia, 2005-2009
Location/Variable Odds Ratio 95% Confidence Interval
(P)
Regional WA Type of crash -Multiple Unit^ -Single Unit
1.00 1.65
- 1.43-190
- <0.001
Road Surface -Sealed^ -Unsealed
1.00 6.51
- 3.97-10.67
- <0.001
Road Alignment - Straight^ -Curved
1.00 2.15
- 1.87-2.48
- <0.001
Posted Speed Limit -≤80km/hour]^ -≥90km/hour
1.00 9.21
- 8.08-10.49
- <0.01
Remote WA Type of crash -Multiple Unit^ -Single Unit
1.00 3.00
- 2.54-3.54
- <0.001
Road Surface -Sealed^ -Unsealed
1.00 19.09
- 11.82-30.84
- <0.0001
Road Alignment -Straight^ -Curved
1.0 2.35
- 1.97-2.81
- <0.001
Posted Speed Limit -≤80km/hour^ -≥90km/hour
1.00 12.01
- 10.27-14.05
- <0.001
*Metropolitan area is the reference category location. ^Reference value -2 Log Likelihood= 263.64, 2=3101.31, df=8, p<0.001;
4.4.2 Driver/rider factors
The Likelihood Ratio Test confirmed a statistically significant relationship between
four driver/rider variables and the location of the occurrence of the serious injury
crash, particularly for crashes occurring in remote WA compared with metropolitan
WA. Compared with crashes in the metropolitan area, increased odds of
involvement in a serious injury crash in the remote area were identified for male
drivers (OR=1.25); drivers aged 25-39 years (OR=1.43); drivers recording a BACL
of ≥0.101gm% (OR=2.54), 0.05gm%-0.100gm% (OR=1.54) and 0.001gm%-
0.49gm% (OR=1.48), and drivers who did not hold a valid licence at the time of the

53
crash (OR=2.13). Whilst driver sex and driver licence status were not significantly
associated with serious injury crashes in the regional area compared with the
metropolitan area, driver age and BACL were. Increased odds of involvement in a
serious injury crash were identified for drivers aged 40-59 years (OR=1.36), while
drivers aged 17-24 years showed reduced odds of crashing (OR=0.86). As for the
remote area, all positive levels of BAC were associated with an increased odds of
crashing: ≥0.101gm% (OR=1.72); 0.05gm%-0.100gm% (OR=1.70), and 0.001gm%-
0.049gm% (OR=1.55) These findings highlight the linear relationship between
BACL and crashing in both the regional and remote areas, with the risk of crashing
associated with the highest level of BAC being greatest in the remote area. The other
notable difference between the two non-metropolitan areas is the higher odds of
unlicensed drivers being involved in a remote area serious injury crash.

54
Table 4.38 Multinomial Logistic Regression of metropolitan*, regional and remote serious injury crashes by driver/rider+ factors; Western Australia, 2005-2009
Location/Variable Odds Ratio
95% Confidence Interval
(P)
Regional WA Driver Sex -Female^ -Male
1.00 1.10
- 0.90-1.23
- ns
Driver Age+ -60+ years^ -40-59 years -25-39years -17-24 years
1.00 1.36 1.05 0.86
- 1.15-1.60 0.91-1.23 0.75-0.98
- <0.001 ns <0.05
Blood Alcohol Concentration Level -0.000gm%^ -≥ 0.101gm% -0.05-0.100gm% -0.001-0.049gm%
1.00 1.72 1.70 1.55
- 1.40-2.10 1.33-2.19 1.18-2.06
- <0.001 <0.001 <0.01
Driver Licence -Valid licence^ -No valid licence
1.0 0.86
- 0.69-1.08
- ns
Remote WA Driver Sex -Female^ -Male
1.00 1.25
- 1.07-1.45
- <0.01
Driver Age+ -60+ years^ -40-59 years -25-39years -17-24 years
1.0 0.92 1.43 1.04
- 0.70-1.20 1.19-1.70 0.88-1.25
- ns <0.001 ns
Blood Alcohol Concentration Level -0.000gm%^ -≥ 0.101gm% -0.05-0.100gm% -0.001-0.049gm%
1.00 2.54 1.54 1.48
- 2.05-3.16 1.11-2.13 1.03-2.13
- <0.001 <0.05 <0.05
Driver Licence -Valid licence^ -No valid licence
1.0 2.13
- 1.73-2.63
- <0.001
*Metropolitan area is the reference category location. ^Reference value +Excludes drivers under 17 years and bicycle riders. -2 Log Likelihood=483.56, 2=248.33, df=20, p<0.001

55
5. DISCUSSION
5.1 Introduction
The aims of this investigation were to report the distribution of serious injury crashes
across the metropolitan, regional and remote areas of Western Australia and to
identify possible explanatory factors for the variation in the distribution. Based on
police reported crashes for the period 2005-2009 this study identified significant
variation in the distribution of serious injury crashes across Western Australia and
varying evidence in relation to the involvement of road/environment, speed, vehicle,
and road user behavioural factors across the three locations. In the following sections
the findings will be discussed and recommendations made for further research.
5.2 The association between location of crash and crash severity
In keeping with the findings presented in the literature review of an association
between crash severity and location of crash, this investigation similarly noted a
significant relationship between crash location and severity. When considering all
crashes recorded by WA Police during the period 2005-2009, fatal and
hospitalisation crashes – collectively regarded as serious injury crashes in this study
– were proportionally higher in the regional and remote areas. Less than 5% of
crashes occurring in the metropolitan area resulted in either the death or
hospitalisation of an involved road user compared with 9.6% of crashes in the
regional area and 14% of crashes in the remote area. Indeed, a crash in the regional
and remote areas was respectively two to three times more likely to result in a serious
injury compared with a crash in the Perth metropolitan area. Even more troubling
was the finding that the seriously injured road user was three to 4.5 times more likely
to be killed if the crash occurred in regional and remote Western Australia
respectively compared with metropolitan Perth.
While these findings clearly exemplify the greater risk of serious injury for those
involved in crashes in the regional and remote areas of Western Australia, the
majority of the road injury burden, because of the absolute numbers of road users
injured, can still be attributed to travel and crashes within the metropolitan area. This
however, does not discount the need to understand the additional risk of serious
injury crashes in the non-urban area and to propose appropriate countermeasures.

56
In the following sections the factors identified to be associated with serious injury
crashes by location will be discussed in relation to the Safe System framework to
elucidate the role of these factors in the differential pattern of crashes and to inform
relevant countermeasures.
5.3 Safe Roads and Roadsides
Improving the quality of roads and maintaining safe and hazard-free roadsides is
integral to reducing the incidence of crashes and the severity of injury (Elvick et al.,
2009) and is a cornerstone of the State’s Toward Zero road safety strategy. In
keeping with this theme, a number of road and roadside factors were found to be
associated with the distribution of serious injury crashes across the State.
Crashes at intersections, particularly those involving right angle and right turn thru
vehicle movements, were the main crash type for serious injury crashes in the
metropolitan area. This finding is reasonably consistent with research elsewhere and
locally. Indeed the problem of serious injury crashes at metropolitan intersections
was investigated in greater detail by Main Roads Western Australia (2009) through a
micro analysis of the top 20 metropolitan traffic light controlled intersections for
serious injury crashes, 2003-2007. The aims of the analysis were to identify the
characteristics of serious injury crashes in each intersection and to consider if and
how the layout and infrastructure of the particular intersection contributed to the
pattern of crashes and what ‘treatments’ could be effected to reduce future serious
crashes. Right angle, right turn thru, and rear end crashes were noted to be the
predominant crash types across the 20 intersections. Recommended short, medium
and long term treatments, including cost-benefit calculations, to address these crash
types were subsequently proposed. Examples of the recommended treatments
included:
increasing the signal clearance time;
the installation of red light cameras to deter red light running;
the reduction of speed limits through the intersection;
speed cushions at the intersection;
right turn with green arrow only;
modifying lane configurations; and the

57
removal of vegetation to improve sight lines.
The strength of the micro analysis approach, though intensive and costly, is that it
permits a detailed analysis of the relationship between the circumstances of the
crashes and the specific environmental and traffic engineering conditions of the
particular intersection, which this analysis was not able to do.
Though there is no information to hand to indicate the extent to which the broad
ranging recommendations of the micro analysis have been adopted across the 20
intersections reviewed so far, the process highlights the commitment of the State in
addressing serious injury crashes at metropolitan intersections. The status of the
recommendations for the previous micro analysis should nevertheless be reviewed
and consideration given to continuing the process for an in-depth review of the next
20 ranked metropolitan intersections for serious injury crashes.
Future micro analysis reviews should adopt the four key principles proposed by
Corben (2010) for improving safety at intersections and reducing crashes. Corben
(2010) considers that traffic engineers should firstly look to reduce the number of
vehicles using the intersection. Secondly, the road network should be designed to
limit the need for intersections. Thirdly, intersections should be designed so there are
few opportunities for conflict between vehicles. Lastly, speeds at intersections and
potential impact angles should be engineered to lessen impact forces to levels that are
biomechanically tolerable. Countermeasures that could be applied that are consistent
with these principles include: the installation of roundabouts; raised platforms and
stop line speed humps to reduce vehicle speeds; grade separation of traffic (e.g.,
bridges at major intersections (Corben, 2010); reduced speed limits through
intersections (OECD, 2008); red light cameras (Retting, Ferguson & Hakkert, 2003)
and dual speed and red-light cameras to reduce red light running and travel speeds
(Brimson & Anderson, 2002; Budd et al., 2011).
In contrast to crashes at metropolitan intersections which involve conflict between
vehicles, this study identified that regional and remote area serious injury crashes
more commonly involved single vehicle crashes where the vehicle left the road on a
curve or straight, rolled over, or hit a roadside object such as tree/shrub or
embankment. Indeed the multivariate analysis of the data showed that serious injury
crashes in the regional and remote areas were respectively 65% and three times more

58
likely to involve a single vehicle compared with crashes in the metropolitan area, and
twice as likely to occur on a curve in both the regional and remote area compared
with the metropolitan area. Not so surprisingly, serious injury crashes in both the
regional and remote area were substantially more likely (6.5 to 19 times) to occur on
unsealed roads compared with those in the metropolitan area. These crash scenarios
are again consistent with those identified elsewhere for non-urban area crashes and
highlight the need for measures to reduce the incidence of vehicles leaving the road
and rolling over or colliding with non-frangible objects like trees.
Previous research has identified a variety of risk factors for single vehicle run off
road crashes, including driver impairment (e.g., fatigue, alcohol, illicit drugs); road
conditions (e.g., pavement edge drop off; poor delineation; loose material) and
inappropriate vehicle speed (ARRB, 2011). Unfortunately it was not possible to
reliably investigate the contribution of the preceding factors to run off road crashes in
the regional and remote areas in this study. A more comprehensive dataset based on
Coroner’s and crash reconstruction investigations might provide the detail required at
an individual crash level. Despite the absence of evidence to ascertain the precise
cause of run off road crashes in this study, a number of effective countermeasures
can be generally applied to reduce the incidence of and consequence of run off road
crashes in the non-urban areas of Western Australia. These include sealed shoulders,
audible edge lining, clear zones, road side barriers, and improved curve delineation.
Sealed shoulders and audible edge lining have been found to reduce the incidence of
all severity crashes in rural areas by up to 58% with an estimated cost-benefit ratio of
40.3 (Meuleners et al., 2011). Second to these measures, clear zones and barriers are
known to effectively reduce the severity of injury should the vehicle leave the road
by limiting the opportunity to collide with hazardous objects (Szwed, 2011). In
regard to barriers, flexible wire rope barriers are regarded as the most
comprehensively effective measure to reduce the severity of injuries associated with
run off road crashes (Corben, 2004), contributing to casualty and serious injury crash
reductions of up to 87% (Candappa, D’Elia, Corben & Newstead, 2011). Similarly,
initiatives such as signage, road markings and chevrons to improve the delineation of
horizontal curves to assist drivers in maintaining appropriate positioning and speed
through the curve have been found to reduce the incidence of crashes and crash
severity on rural roads, with a cost-benefit ratio of 8:1 (FHWA, 2009).

59
The above discussion has highlighted the effectiveness of a range of countermeasures
to reduce the incidence of run off road crashes and injury severity on regional and
remote roads, and further, opportunities for reducing the incidence of serious injury
crashes at metropolitan intersections. At present, Main Roads Western Australia
(MRWA) administers a number of programs such as the Nation, State and Local
Road Black Spot programs and the Safer Roads Program which aim to identify and
treat roads to reduce crashes and injury severity. Road treatments funded under these
programs have to date included initiatives to reduce metropolitan intersection crashes
and run off road crashes in regional and remote areas. These programs are
instrumental to the advancement of safer roads across Western Australia, thus, it is
incumbent on both MRWA and local government – who together share responsibility
for the improvement of the State road network- to continue to advocate for increased
funding for these programs and to apply for program funds to improve the safety of
roads in locations identified by the respective road owners as having a high serious
injury crash risk.
5.4 Safe Speeds
Excess and inappropriate speeds have been consistently identified as significant risk
factors for the occurrence of a crash and the severity of any resulting injury
(Kloeden, McLean, Moore & Ponte, 1997; Kloeden, Ponte & McLean, 2001; Aarts
& van Schagan, 2006). It is hypothesised that high travel speeds increase the risk of a
crash firstly because drivers may lose control of the vehicle and secondly because the
distance travelled during the time taken to react and brake is increased which
therefore increases the distance required to stop (Kloeden et al., 2001). The Safe
Systems approach to road safety consequently seeks to apply lower and more
appropriate speed limits to minimise the risk of crashing and to lessen impact forces
to more tolerable, survivable levels in the event of a crash to reduce injury severity.
In support of this, calculations by Nilsson (2004) estimate that even a 5% reduction
in average vehicle travel speeds can hypothetically result in a 10% reduction in all
injury crashes and a 20% reduction in fatal crashes.
This study was unfortunately limited in regards to the investigation of speed as an
explanatory factor for the variation in serious injury crashes across the Western
Australia because of the lack of valid and reliable information on speed as a
contributing factor as reported by police. Alternatively, the speed zone of the road at

60
the location of the crash was considered as a proxy measure of speed involvement. It
was found that around six in ten serious injury crashes in the metropolitan area
occurred in speed zones of 60km/hour or less. In contrast, between 50% and two
thirds of serious injury crashes in the regional and remote areas occurred in speed
zones of 100km/hour and higher. Moreover, the multivariate analysis showed that
serious injury crashes in the regional and remote areas were substantially more likely
(between nine and twelve times) to occur in higher speed zones (≥90km/hour)
compared with those in the metropolitan area, even after adjusting for the type of
crash, road surface, and road alignment.
These finding are consistent with those reported by Tziotis et al. (2006) and others of
the relatively greater involvement of higher speed zones and speeds in crashes
occurring on rural and remote area roads. On the assumption that these crashes will
have occurred at the maximum posted speed or close to it (if not higher), speed is
strongly implicated in the higher prevalence of a serious injury in regional and
remote area crashes in these locations relative to the metropolitan area. Unfortunately
it was not possible to develop rates of serious injury crash involvement per kilometre
of speed zone across the locations to adjust for differences in the distribution of
speed zones.
The increased risk of a serious injury crash associated with a higher speed zones in
the regional and remote locations does not in itself suggest that speed is any less an
important factor in the occurrence of serious injury crashes in the metropolitan area.
Indeed, a recent unpublished analysis by Holman (2011) of the relationship between
illegal speeding and serious injuries in 60km/hour and 110km/hour speed zones in
Western Australia identified that “..speeding causes a lower proportion of serious
crashes in regional 110km/hour zones than in metropolitan 60km/hour zones: 22%
versus 52% (page 4). Holman’s (2011) analysis confirms that low level speeding in
metropolitan areas is particularly problematic, especially given the likelihood that
crashes in the metropolitan area are more likely to involve multiple vehicles in
conflict situations such as intersections. However, the higher travel speeds in
regional and remote area crashes means that crashes are more likely to occur at
higher impact speeds, thus increasing the risk of a severe injury to occupants. In the
regional and remote area, this risk is exacerbated by a higher likelihood that vehicle

61
occupants in these localities will be unbelted (see Roberts et al., 2006 and Oxley et
al., 2009).
The challenge for Western Australia under the Toward Zero strategy is to implement
initiatives that reduce travel speed, both in terms of lower and more appropriate
speed zones, and to ensure that vehicles keep to the posted speed limit. The finding
in this study of a relationship between the posted speed zone at the crash site and the
geographic location of the crash highlights the need in the first instance to consider
the appropriateness of existing speed limits in the regional and remote areas. This is
not to suggest a blanket reduction in the maximum speed limit (110km/hour) is
warranted. Rather, it is suggested that MRWA review the non-urban road network to
identify roads currently zoned to the maximum speed of 110km/hour but are less
than appropriate for such speeds because of:
inadequate roadside treatments (sealed shoulders, clear zones and barriers,) to
reduce run off road crashes and injury severity, and;
an inability to separate vehicles from opposing direction (medians, barriers) to
reduce the chances of head-on collision.
Indeed it has been suggested that a 70km/hour speed limit be applied to two-way
roads without separation to reduce the severity of head on crashes (OECD, 2008).
However, it may be more feasible and acceptable to the community to introduce a
reduction from 110km/hour to 80km/hour on secondary regional and remote roads
that lack the necessary treatments to reduce the likelihood of run off road and head
on crashes at speeds that increase the risk of more serious injuries. Further to this,
given the identified high risk of serious injury crashes associated with unsealed roads
in the regional and remote area, it would also be appropriate to limit the maximum
speed on unsealed roads to 80km/hour. Admittedly this would be difficult to enforce
given the remoteness of most unsealed roads.
Second to initiatives to selectively reduce speed limits on high risk regional and
remote roads, there is good reason to consider that vehicle speeds in these area could
be better managed and serious injury crash reductions achieved through strategic
speed enforcement (Kloden et al., 2001). At present, WA Police are in the process of
implementing a comprehensive, targeted program of speed enforcement across

62
Western Australia. The program, proposed by Cameron & Delaney (2006) and
Cameron (2008), represents best practice in speed enforcement using a variety of
automated enforcement activities including fixed black spot speed cameras, dual red-
light/speed cameras at intersections, and point to point camera operations. There is
good evidence to show that automated speed enforcement activities can reduce both
the incidence of crashes and injuries (Wilson, Willis, Hendriks & Bellamy, 2009)
and would thus likely contribute to a reduction in speed related serious injury crashes
in the regional and remote area if and when the enhanced speed enforcement
program is extended to these areas. For example, modelling undertaken by Cameron
(2010) shows that fixed speed cameras applied to major road links 5-10km long can
significantly reduce crashes and associated costs, with a cost-benefit ratio of 1:1.3.
A program of strategic speed enforcement on the typically less enforced regional and
remote roads of Western Australia should necessarily involve the co-operation of the
local government sector since they have ownership of approximately 50% of roads in
the regional and remote areas on which serious injury crashes in this study occurred.
One recent suggestion by Palamara (2011) to the local government sector and WA
Police is for local government to undertake a more strategic approach to measuring
vehicle travel speeds in their localities and supply timely information on problem
area speeding to police to facilitate targeted camera and non-camera based
enforcement.
5.5 Safe Vehicles
Improving the safety of vehicles and increasing the uptake of safer vehicles by road
users is a key cornerstone of the Safe System response to road injury. To this end, the
Western Australian Toward Zero road safety strategy promotes the use of vehicles
with crash avoidance features (such as Anti-lock Braking Systems, Electronic
Stability Control, Traction Control) to reduce the incidence of crashing, and
advanced crash worthiness and occupant protection systems (such as multiple
airbags) to reduce the severity of injury in the event of a crash. Unfortunately, this
study was not able to comprehensively address the range of vehicle factors that may
have contributed to the over-representation of serious injury crashes in remote and
regional areas compared with metropolitan area. The crash data used for this project
did not contain information on the prevalence of crash avoidance features or the
crash worthiness ratings of vehicles.

63
Previous research (e.g., Tziotis et al., 2006) has noted that older and consequently
lower crashworthy vehicles were more commonly involved in fatal crashes in rural
Victoria compared with metropolitan Melbourne. This was presumed to be due in
part to the lower socioeconomic status of rural area residents and their ability to
afford new and safer vehicles. Whilst WA Police do record the age of vehicles
involved in a serious injury crash, this information was found to be incomplete for
many serious injury crash records used in this study and therefore unsuitable for
analysis.
This study did however identify variation across the locations in the distribution of
certain vehicle types in serious injury crashes, namely the involvement of trucks.
Consistent with the findings of other studies (e.g., Meuleners, 2009) this study noted
that trucks were more likely to feature in the serious injury crashes occurring in
regional (4.7%) and remote (6%) areas compared with the metropolitan area (2.9%).
One explanation for this finding may be the higher exposure of trucks on non-urban
roads but other evidence also indicates that the crash risk for trucks and heavy
vehicles is due to a number of work environment, vehicle, and driver related factors
and a complex interplay between them, particularly for non-urban area crashes. This
literature was recently reviewed by Meuleners & Fraser (2012) and highlighted
among many things the unique nature of the truck and heavy vehicle industry in
Western Australia where vast distances between locations underscore the
involvement of known crash risk factors such as driver fatigue, associated driver
sleep disorders, and adverse working conditions. A detailed national investigation of
non-fatal heavy vehicle crashes, including those in Western Australia (see Stevenson
et al., 2010) is near completion and is likely to provide a range of recommendations
for countermeasures to reduce heavy vehicle crash involvement.
Notwithstanding the absence of detailed information in this study on vehicle factors
associated with serious injury crashes across WA, there is considerable information
and evidence regarding the features of safer vehicles that would assist in the
reduction of the higher incidence of loss of control, run off road serious injury
crashes in regional and remote Western Australia. For example, crash avoidance
technologies such as intelligent speed adaptation, lane departure warning, and fatigue
monitoring systems will likely reduce single vehicle crashes with estimated
reductions in crashes between 10.8% and 4.3% depending on the crash type

64
(Langford, 2009). Other evidence suggests that a combination of anti-lock braking
systems and electronic stability control will prevent a large proportion of both fatal
and non-fatal crashes, particularly in relation to single vehicle crashes (Kahane &
Dang, 2009).
Over the years there has been a general increase in the crashworthiness of vehicles.
For example, vehicle manufactured between 2003 and 2007 are considered to be
three times safer than those manufactured in the period 1964-1973 (Langford, 2009).
This trend and the increasing availability of crash avoidance technologies mean that
the safety of the vehicle fleet will continue to steadily increase (Langford, 2009). The
challenge is to quickly and comprehensively promote the uptake of safer vehicles,
particularly among at risk groups, to help reduce certain crash types such as run off
road single vehicle crashes in non-urban areas and the severity of injury in the event
of a crash.
5.6 Safe road use and users
Reducing the incidence of unsafe, risky on-road behaviours and protecting
vulnerable, ‘at risk’ road user groups are key concerns of the Safe System and the
Toward Zero strategy of the State. This study has provided some evidence in relation
to road users and the safety of their behaviours that in part explains the greater
incidence of serious injury crashes in the non-urban area. The examination of these
factors in this study was limited to the investigation of road user status, demographic
factors such as age and gender, and behavioural factors such as unlicensed driving,
driver/rider alcohol levels, and the non-use of seat belts/helmets. Unfortunately, no
investigation could be undertaken of behavioural factors such as inattention and
fatigue which are known to be associated with crashes occurring in non-urban areas
of Australia (see Tziotis et al., 2006).
Whilst other studies have identified males and those of a younger age as risk factors
for crashes in the non-urban areas (e.g., Hamilton & Kennedy, 2005; Tziotis et al.,
2006;) there was less convincing and consistent evidence in this study for those two
factors to distinguish serious injury crashes in the non-urban areas of Western
Australia from those occurring in the metropolitan area. Serious injury crashes
occurring in the regional area were not significantly more likely than those occurring
in the metropolitan area to involve male drivers/riders. However, males were 25%

65
more likely to be driver/riders of vehicles involved in a serious injury crashes in
remote WA relative to metropolitan Perth. This could be because females in remote
areas (particularly Indigenous) are less likely to be licensed or to drive less often, or,
that males engage in greater risk taking behaviours which thus increases their risk of
crashing. This point will be reconsidered in the discussion below of drink-driving,
unlicensed driving, and seat belt use
There was also no consistent evidence to show that younger age drivers/riders were
significantly more likely to be involved in crashes in regional and remote areas
compared with metropolitan Perth. This is contrary to other studies where younger
age drivers (under 25 years) accounted for the greater proportion of crash involved
drivers in rural Victoria (Symmonds, Haworth & Johnston, 2004). Males aged 40-59
years (regional area crashes) and males 25-39 years (remote area crashes) were
significantly more likely to be involved in a serious injury crash compared with their
same aged counterparts crashing in metropolitan Perth. Again, this finding could be
related to patterns of risk taking by non-urban drivers/riders and/or driving exposure.
Consistent with previous research, serious injury crashes in the regional and remote
area were more likely to be associated with certain risky road user behaviours
compared with serious injury crashes in metropolitan Perth. Strong evidence was
found to show that serious injury crash involved drivers/riders in the regional and
remote areas, more so than those involved in metropolitan crashes, were more likely
to record a positive BACL, to be unlicensed, and to be unbelted at the time of the
crash.
In relation to alcohol, regional and remote area drivers/riders involved in a serious
injury crash were 1.7 time to 2.5 times more likely than crashing metropolitan drivers
to record the highest level of BAC (≥ 0.101gm). Moreover, certain groups of
regional and remote area drivers, such as males, younger age drivers, and the
unlicensed, were noted to have a higher involvement of positive BACL levels. Why
alcohol per se and higher BAC levels are a greater problem in the non-urban area is
open to speculation. The reasons for this could include the absence of viable
alternative transport in these areas; limited surveillance and detection of drinking
drivers, and greater tolerance and acceptance of drinking and driving by members of
these communities. Further investigation of these possible explanations and others is

66
required to determine how best to reduce the greater incidence of drink driving
outside of metropolitan Perth and the risk of crashing.
While research has identified unlicensed driving to be a significant risk factor for
crash involvement (see Palamara et al., 2012), no information was noted in the
review of previous research to suggest a higher incidence of unlicensed driver among
the crashes in regional and remote area. In this study drivers/riders without a valid
licence accounted for 6.1% and 6.9% of drivers/riders crashing in the metropolitan
and regional areas and 15.7% of drivers/riders crashing in remote WA. Other
analyses showed that in all locations males were significantly more likely than
females to be unlicensed at the time of the crash. There was also some evidence to
suggest that younger age drivers/riders (17-24 years and 25-39 years) in all locations
were significantly more likely to not be validly licensed at the time of the crash. This
finding appears to be most robust and reliable for drivers/riders crashing in the
remote area. From the information contained in the IRIS database it would seem that
most crashing drivers/riders in remote WA without a valid licence had never
obtained or held a driver/rider licence. This immediately suggests that existing
programs and processes to facilitate driver/rider licensing in remote WA should be
reviewed to determine if and how they could be improved.
There are a number of hypothetical reasons why unlicensed drivers are likely to have
an increased risk of crashing, among them being a lack of certified driving skill if
they have never held a licence, and/or an increased likelihood of engaging in other
risky on-road behaviours if such behaviours contributed to the cancellation or
suspension of the licence. In relation to this last point, this study did note that
unlicensed drivers involved in a serious injury crash in all areas, particularly in
regional area, had a significantly higher likelihood of a positive BACL compared
with licensed drivers.
Consistent with the previous findings of a higher incidence of unlicensed and alcohol
involved driving among drivers/riders crashing in regional and remote WA, this
study also identified that the non-use of seat belts and helmets for drivers/riders was
relatively higher among those crashing in the regional and remote areas. This finding
might partially explain the relatively higher incidence of fatalities in these areas
given that unprotected drivers/riders are five times more likely than protected

67
drivers/riders to be fatally as opposed to non-fatally injured. Once again, male
drivers/riders were significantly more likely than females to not use protection at the
time of the crash, with males in the regional and remote areas having a significantly
higher risk of non-use than their metropolitan area counterparts. It was also noted
that crashing drivers/riders in each location without a valid licence and those testing
positive for alcohol were significantly more likely than licensed and alcohol free
drivers/riders to not use protection.
The finding in this study that non-metropolitan crash involved drivers, and even
passengers, have a higher likelihood of being unbelted is also consistent with
previous WA research of crashing drivers and crash involved passengers undertaken
by Oxley et al., (2009). The noted association of alcohol and unlicensed driving with
failure to wear a seat belt portrays an image of increased risk taking among drivers in
these locations relative to those in the metropolitan area. If this is so, it might also
help explain why serious injury crashes, and in particular fatal crashes, are more
prevalent in these locations. Why WA drivers in the non-urban areas are
proportionally more likely to engage in these concurrent risk behaviours is open to
speculation and further investigation. One possible contributing reason is because
non-urban and urban area drivers differ in their attitudes toward road safety and risk
taking behaviour and perceptions of the risk of detection. Previous research by
Rakauskas et al. (2009) found that rural drivers compared with urban drivers in the
USA were significantly more likely to not use a seat belt, to engage in more
deliberate violations, to more frequently speed above the speed limit, and to consider
that traffic law enforcement was less useful. Irrespective of the attitudes and
perceptions of WA non-urban drivers there is a clear need for greater management of
risk taking behaviour in these areas. This could include increased levels of ‘targeted’
enforcement and appropriate community based education programs to promote
appropriate safety behaviours in the remote areas of WA where levels of
enforcement are compromised because of fewer resources and an expansive road
network. Initiatives such as these were also proposed by Austroads (2001) in their
review of the non-use of seat belts on remote area roads in Australia..
In addition to the above driver issues, injuries to pedestrians are also relevant to the
discussion of the variation in serious injury crashes across the three regions. Serious
injuries to pedestrians accounted for around 4% of all injured road users during the

68
study period 2005-2009. They most commonly occurred in the metropolitan area
(77.3%) compared with the regional (12.5%) and remote area (10.2%). The weight of
these numbers initially suggests that the bulk of countermeasures to reduce
pedestrian injuries should be concentrated in the metropolitan area, particularly in
relation to lowering speeds around high pedestrian activity areas to survivable levels.
It is important to note however, that pedestrians were significantly more likely to be
killed in remote and regional area crashes compared with the metropolitan area
crashes. This is perhaps because of the greater exposure of pedestrians in these
locations to higher speed zones. For example, around 24% of pedestrian crashes in
the remote area occurred in a 80km/hour or greater speed zone, with nearly 14% at
the maximum speed limit, compared with 6.7% of crashes in the metropolitan area in
equivalent zones. This finding, along with the higher relative likelihood of a
pedestrian in the remote and regional areas being injured at night, also suggests that
greater attention must be given to the types of roads pedestrians access in the non-
urban area, particularly at night, and how best to separate them from high speed
traffic and be more visible to drivers.
5.7 Methods Issues
There are a number of methodological issues in relation to the data used to identify
serious injuries and the location of serious injury crashes and the factors related to
serious injuries. These issues temper the validity of the findings and are briefly
discussed below.
For pragmatic reasons, serious injury crashes were defined as those involving the
police reported death or hospitalisation of an involved road user. No attempt was
made to validate these injury outcomes through linkage with official death and
hospital separation records. Previous research by Rosman and Knuiman (1994)
comparing WA Police reported level of injury severity with those from hospital
discharge files noted that police hospitalisation data was less reliable and at times
under-reported the admissions and injury severity of certain road user groups. Hence
there is some uncertainty regarding the accuracy of the police data used in this
investigation, particularly in relation to hospitalisations.
The categorisation of the crash location into metropolitan, regional and remote areas
based on the Accessibility/Remoteness Index of Australia (ARIA) (ABS, 2007) may

69
not necessarily represent the best measure of location. For example, the ARIA index
does not take into account the time taken to obtain treatment or the form of transport
used to travel to an appropriate treatment facility. Regional variations in post-crash
care and treatment could not be considered in this investigation and are likely to have
contributed to the severity of crashes noted in this study. Previous research has noted
that variation in medical care post-crash is a significant contributor to the higher
incidence of fatalities among road users in rural areas (Muelleman, Wadman, Tran,
Ullrich & Anderson, 2007).
The use of IRIS crash data has also imposed limitations on the investigation,
particularly in relation to driver behavioural factors such as illegal speeding and
fatigue, and the inability to describe crash involved vehicles in relation to crash
avoidance and occupant protection systems. The level of variation across the
locations in serious injury crashes that can be potentially attributed to these factors
could not be investigated in this study

70
6. RECOMMENDATIONS
This study noted a range of safer roads, safer speeds, safer vehicle, and safe road use
factors that go some way towards explaining the identified variation across the
Western Australia in the distribution of serious injury crashes. It is clear however,
that additional research is required using a variety of methods to further elucidate the
causes of and potential countermeasures for serious injury crashes across WA. The
following recommendations for future research were developed after consultation
with the WA Office of Road Safety.
Safer Roads and Roadsides
1. Expansion of the Main Roads WA micro analysis of serious injury crashes at
metropolitan intersections to further investigate the contribution of road and driver
factors to crashes at intersections.
This study noted that one in five serious injury crashes in the metropolitan area
occur at intersections, with around four in ten serious injury crashes involving
vehicles colliding at right-angles. The first tranche of 20 metropolitan
intersections investigated by the micro-analysis noted a number of potential
contributing factors and made recommendations for cost-effective treatments. It is
recommended that the micro-analysis be extended to the next 20 intersections for
serious injury crashes.
2. Further research to identify new and innovative treatments for metropolitan
intersections.
To complement Recommendation 1, it is recommended that further research be
undertaken to identify new and innovative treatments for metropolitan
intersections, including signalised and non-signalised intersections. This work
should also include proposals for the development, implementation and evaluation
of trials of innovative measures to create Safe System intersections.
3. In-depth analysis of the factors contributing to run off road crashes and treatments
to reduce the incidence of and injury severity.
This study noted that single vehicle run off road crashes accounted for around
one-quarter of serious injury crashes in the metropolitan area and nearly 60% and

71
70% respectively of serious injury crashes in the regional and remote areas.
Further to this, around a third of run off road crashes in the regional and remote
areas occurred on curves, with most run off road crashes across all three areas
resulting in the collision with an object other than a designated barrier. On the
basis of these findings it is recommended that a micro-analysis style project be
developed to identify and review roads with a high incidence of run off road
events to investigate potential contributing crash and injury factors and
appropriate cost-effective countermeasures by location. This project can also draw
on the findings from two current C-MARC projects: the epidemiology of single
vehicle run off road crashes in metropolitan Perth, and, a review of initiatives to
improve curve delineation.
Safe Speeds
4. Identify and audit high crash risk roads in the regional and remote locations to
determine the appropriateness of the current speed zone and need for rezoning.
Though this study was not able to investigate the contribution of excess or
inappropriate speeds to serious injury crashes across Western Australia, there was
some evidence to support previous research identifying a relationship between
crashes in higher speed zones (90km/hour and higher) and serious injury
outcomes for the regional and remote area. At issue is whether the roads on which
these crashes have occurred are appropriately speed zoned for their condition and
level of infrastructure (e.g., sealed roadway and shoulders; edge lining; clear
zones; barriers; median to separate vehicles). It is therefore recommended that
further research be undertaken to identify and audit high crash risk roads in the
regional and remote areas to determine the appropriateness of the posted speed
limit and make recommendations where appropriate for a lowering of the speed
limit to reduce the risk of crashing and serious injury.

72
Safe Road Use and Users
5. Undertake an in-depth investigation of unlicensed driving in the remote areas of
Western Australia.
Drivers involved in serious injury crashes in remote Western Australia were twice
as likely as those crashing in regional WA and metropolitan Perth to be
unlicensed (i.e., not holding a current, valid licence at the time of the crash). It is
therefore recommended that a program of both quantitative and qualitative
research be undertaken to address the following issues:
the extent of unlicensed driving;
persons at risk of unlicensed driving;
factors associated with the failure of remote areas residents to obtain and
maintain a valid motor vehicle drivers’ licence and drive unlicensed; and,
a review of the effectiveness of existing systems and programs in remote
Western Australia to promote licensure.
The research should also consider how best to (i) engage remote communities to
take responsibility for the problem of unlicensed driving and to reduce the
incidence of; (ii) the provision of alternate modes of transport other than private
vehicle use, and (iii) more strategic detection and enforcement initiatives and
appropriate penalties (i.e., vehicle impounding; wheel clamping;) for unlicensed
driving.
6. Undertake an in-depth investigation of the use of alcohol and drink driving in
remote and regional Western Australia.
Around 13% of drivers involved in a serious injury crash tested positive (non-
zero) for alcohol; this proportion was greatest in remote Western Australia
(23.4%) compared with regional WA (16.5%) and metropolitan Perth (11.2%).
Even more concerning was the finding that three-quarters of remote area drivers
and 60% of regional area drivers who tested positive recorded a BAC ≥ 0.08gm%.
Understanding the unique area-specific factors that predispose non-urban area
drivers to drink drive and the development of relevant countermeasures is thus
warranted. Both quantitative and qualitative methods should be used to investigate

73
the range of factors associated with the use of alcohol in non-urban areas and
compliance/non-compliance with drink-driving legislation, in particular:
the extent of drink driving;
persons at risk of drink driving;
the range of individual, sociocultural and community-wide factors that
support or inhibit drink driving;
access to alcohol and alternative means of transport;
current detection and enforcement practices and the appropriateness of
penalties for non-urban area residents; and,
how best to reduce the incidence of alcohol impaired driving.
7. Undertake an in-depth investigation of the non-use of seat belts by motor vehicle
occupants in remote areas of Western Australia.
Seat belt use can significantly reduce the risk of serious injury in the event of a
crash and yet in this study remote area drivers (inclusive of helmet use by riders-
15.6%) and passengers (33.8%) were considerably more likely to be unbelted
compared with those involved in crashes in metropolitan Perth and even regional
WA. At present there is no contemporary evidence of the prevalence of and risk
factors for the non-use of seat belt across Western Australia using observational
(as opposed to crash) data. Given the level of non-use identified in this study
among remote area motor vehicle occupants there is a need for research using a
mix of quantitative (observational data) and qualitative methods to understand:
the prevalence of use and non-use of seat belts and other restraints among
remote area motor vehicle occupants;
persons at risk of being ‘unrestrained’;
the range of individual, vehicle, sociocultural (particularly Indigenous
issues) and community-wide factors that support or inhibit appropriate
restraint use;
current detection and enforcement practices and the appropriateness of
penalties for remote area residents; and
how best to increase the use of seat belt by drivers and passengers.

74
8. Detailed examination of the pattern of pedestrian injury crashes in regional and
remote Western Australia.
The majority of pedestrians killed or hospitalised state-wide were involved in
crashes in the metropolitan area, though the risk of being fatally injured was
greatest for pedestrians involved in crashes in the regional and remote location.
This is perhaps because of their greater likelihood of being hit whilst using roads
with higher posted speed limits and the lack of facilities for safe walking. Given
the higher risk of fatal injury for pedestrians, the is good reason to undertake a
detailed examination of the high risk localities in regional and remote Western
Australia to determine the circumstances and risk factors for pedestrian crashes so
as to develop appropriate and effective counter measures in relation to engineering
and road user behaviour initiatives.

75
7. REFERENCES
Aarts, L. & van Schagen, I. (2006). Driving speed and the risk of road crashes: A review. Accident Analysis and Prevention, 38, 215-224.
Abbas, A. K., Hefny, A . F., Abu-Zidan, F. M. (2011). Seat belts and road traffic collision
injuries. World Journal of Emergency Surgery, 6, 18. Armstrong, K. A., Smith, S. S., Steinhardt, D. A., & Haworth, N. L. (2008). Fatigue crashes
happen in urban areas too: Characteristics of crashes in low speed urban areas. In 2008 Australiasian Road Safety Research, Policing and Education Conference, (pp. 1-13). Adelaide, SA.
Australian Road Research Bureau. (2011). Safety on rural roads: run-off road, head-on and
intersection crashes. Road Safety Risk Reporter June 15th. Australian Transport Council. (2008). National road safety action plan 2009 and 2010.
Canberra, ACT: Australian Government Department of Infrastructure and Transport. Australian Transport Council. (2009). Road deaths Australia: 2008 statistical summary.
Canberra, ACT: Australian Government Department of Infrastructure and Transport. Australian Transport Council. (2011). National road safety strategy 2011-2020. Canberra,
ACT: Australian Government Department of Infrastructure and Transport. Australian Transport Safety Bureau. (2006). Deaths of cyclists due to road crashes. Canberra,
ACT: Australian Government Department of Infrastructure and Transport. Austroads (2001). Increasing seat belt/restraint use on remote area roads. Sydney: Austroads
Incorporated. Report No. AP-R187/01 Baldock, M. R. J., Kloeden, C. N., & McLean, J. (2008). In-depth research into rural road
crashes. Adelaide, SA: Centre for Automotive Safety Research. CASR Report Series No.CASR057
Blackman, R A., Steinhardt, D., & Veitch, C. (2009). Fatal motorcycle crashes in north
Queensland : Characteristics and potential interventions. In Gregory, G (Ed.) Proceedings of 10th National Rural Health Conference. Cairns, QLD.
Brimson, T. and R. Anderson (2002). Fixed Red Light and Speed Cameras in Canberra:
Evaluating a New Digital Technology. Paper presented to the 2002 Road Safety Research, Policing and Education Conference, Adelaide.

76
Budd, L., J. Scully, et al. (2011). Evaluation of the Crash Effects of Victoria’s Fixed Digital Speed and Red-Light Cameras. Melbourne, Victoria: Monash University Accident Research Centre.
Bureau of Infrastructure, Transport and Regional Economics. (2006). Cost of road crashes in
Australia, 2006. Canberra, ACT: Bureau of Infrastructure, Transport and Regional Economics.
Cameron, M. (2010). Policy advice to guide the placement of fixed and speed/red-light
cameras in Western Australia. Melbourne, Victoria: Camcomp. Cameron, M. (2008). Development of strategies for best practice in speed enforcement in
Western Australia: Supplementary report. Melbourne, Victoria: Monash University Accident Research Centre (MUARC). Report No. 277
Cameron, M., & Delaney, A. (2006). Development of strategies for best practice in speed
enforcement in Western Australia: Final report. Melbourne, Victoria: Monash University Accident Research Centre (MUARC). Report No. 227
Candappa, N., D’Elia, A., Corben, B. & Newstead, S. (2011). Wire rope barrier effectiveness
on Victorian Roads. Paper presented to the 2011 Australasian Road Safety Research, Policing and Education Conference. Perth, Western Australia.
Centre for Accident Research and Road Safety Queensland. (2005). Driving on empty:
Fatigue driving in Queensland. Brisbane, QLD: CARRSQ. Report No. 43 Chen, H.Y., Ivers, R.Q., Martiniuk, A.L., Boufous, S., Senserrick, T., Woodward, M.,
Stevenson, M., Williamson, A., & Norton, R. (2009). Risk and type of crash among young drivers by rurality of residence: Findings from the DRIVE Study. Accident Analysis and Prevention, 41, 676-82.
Corben, B. (2010). Safe roads and roadsides: Fact Sheet #7. Perth, Western Australia: Curtin-
Monash Accident Research Centre. D'Elia, A., & Newstead, S. (2010). De-identified linkage of Victorian injury data records: a
feasibility study. Melbourne: Monash University. D'Elia, A., & Newstead, S. (2011). Alternative Measures of Serious Injury for National Road
Safety Strategy Target Setting. In Proceedings 2011 Australasian Road Safety Research, Policing and Education Conference. Perth, WA.
Department of Health and Aged Care. (2001). Measuring remoteness:
Accessibility/Remoteness Index of Australia (ARIA). Canberra, ACT. Retrieved from www.health.gov.au/publicat.htm

77
Department of Transport and Regional Services. (2005). Australian Design Rule 69/00 –Regulation Impact Statement. Canberra: Department of Transport and Regional Services.
Devlin, A., Hoareau, E., Logan, D., Corben, B., & Oxley, J. (2010). Towards zero pedestrian
trauma: Literature review and serious casualty analysis. In Proceedings of the 2010 Australasian Road Safety Research, Policing and Education Conference. Canberra, ACT.
Diamantopoulou, K., Hoareau, E., Oxley, P., & Cameron, M. (2003). The feasibility of
identifying speeding-related and fatigue-related crashes in police-reported mass crash data. Melbourne: Monash University Accident Research Centre.
Elvik, R. & Hoye A. (2004). The handbook of road safety measures. Bingley, UK: Emerald
Group Publishing. Elvik, R., Vaa, T., Hoye, A., Erke, A., & Sorensen, M. (2009). The handbook of road safety
measures. (2nd ed.)., Amsterdam, Holland: Emerald Group Publishing. Fatovich, D. M., Phillips, M., Langford, S. A., & Jacobs, I. G. (2011). A comparison of
metropolitan vs rural major trauma in Western Australia. Resuscitation, 82, 886-890. Edwards, D. (2011). Crash statistics update: Cycling safety forum.
http://ors.wa.gov.au/Documents/Cycling-Safety-Forum/cyclists-forum1-edwards.aspx FIA Foundation for the Automobile and Society. (2009). Seat-belts and child restraints: a
road safety manual for decision-makers and practitioners. London, UK: FIA Foundation.
Federal Highway Administration (2009). Safety evaluation of improved curve delineation. US
Department of Transportation, Federal Highway Administration. Report No. HRT-09-045
Garrard, J., Greaves, S., & Ellison, A. (2010). Cycling injuries in Australia: Road safety's
blind spot? Journal of the Australasian College of Road Safety, 21, 37-43. Hamilton, K. & Kennedy, J. (2005). Rural road safety: A literature review. Scotland, Great
Britain: Scottish Executive Social Research. Havard, A., Shakeshaft, A. P., Conigrave, K. M., & Sanson-Fisher, R. W. (2011). The
prevalence and characteristics of alcohol-related presentations to emergency departments in rural Australia. Emergency Medicine Journal, 28, 290-295.

78
Henley, G., & Harrison, J. E. (2009). Serious injury due to land transport accidents, Australia 2006–07. (Injury Research and Statistics Series No. 53, AIHW Catalogue No. INJCAT 129). Canberra, ACT: Australian Institute of Health and Welfare.
Hill, D.; Thompson, P.; Yano, Y. & Smith, E. (2012). Reported road crashes in Western
Australia 2010. Nedlands, Western Australia: Data Analysis Australia. Holman, D. (2011). Attributable fraction analysis of illegal speeding and road crashes.
Unpublished report to the Road Safety Council of Western Australia. Perth, Western Australia.
Kahane, C. & Dang, J. (2009). The long term effect of ABS in passenger cars and LTVs.
Washington, USA: National Highway Traffic Safety Administration. Report No. DOT HS 811-182
Kloeden, C., McLean, A., Moore, V. & Ponte, G. (1997). Travelling speed and the risk of
crash involvement. Canberra: Federal Office of Road Safety, Report No. CR146. Kloeden, C., Ponte, G. & McLean, A. (2001). Travelling speed and the risk of crash
involvement on rural roads. Canberra: Australian Transport Safety Bureau, Report No. CR204.
Langford, J. (2009). Safer Vehicles: Fact Sheet #4. Perth, Western Australia: Curtin-Monash
Accident Research Centre. Legge, M., Kirov, C., & Cercarelli, L. (2001). Reported road crashes in Western Australia
2000. Perth, Western Australia: Road Safety Council of Western Australia. Lopez, D. G., Rosman, D. L., Jelinek, G. A., Wilkes, G. J., & Sprivulis, P. C. (2000).
Complementing police road-crash records with trauma registry data - an initial evaluation. Accident Analysis & Prevention, 32, 771-777.
Mackenzie, J. R. (2008). Characteristics of High Injury Severity Crashes on 80 – 110 km/h
Rural Roads in South Australia. Adelaide: Centre for Automotive Safety Research, The University of Western Australia.
Main Roads Western Australia (2009). Microanalysis of the top 20 serious crash intersections
in the Perth metropolitan area: Recommended treatments. Perth, Western Australia: Main Roads Western Australia.
Marchant, R. J., Hill, D. L., Caccianiga, R. A., & Gant, P. (2008). Reported Road Crashes in
Western Australia 2006. Perth, Western Australia: Road Safety Council of Western Australia.

79
McGwin, G. & Brown, D. (1999). Characteristics of traffic crashes among young, middle-aged, and older drivers. Accident Analysis and Prevention, 3, 181-198.
Meuleners. L. (2007). An analysis of fatal and hospitalisation crashes in Western Australia
from 2001-2005 compared to 2006. Perth, Western Australia: Curtin University of Technology.
Meuleners, L. (2009). The epidemiology of single vehicle crashes, 1999-2008. Perth, Western
Australia: Centre for Population Health Research, Curtin University. Meuleners, L. & Fraser, M. (2012). The results of the Western Australian heavy vehicle study.
Perth, Western Australia: Curtin-Monash Accident Research Centre. Meuleners, L., Hendrie, D., & Lee, A. (2011). Effectiveness of sealed shoulders and audible
edge lines in Western Australia. Traffic injury prevention, 12, 201-205. Miller, P. J., Coomber, K., Zinkiewicz, L., & Toumbourou, J. W. (2010). Review of rural and
regional alcohol research in Australia. Australian Journal of Rural Health, 18, 110-117.
Moskowitz H. & Fiorentino D. (2000). A review of the literature on the effects of low doses of
alcohol on driving-related skills. U.S. Washington, DC: Department of Transportation, National Highway Traffic Safety Administration, Report No. DOT HS 809 028.
Muellerman, R., Wadman, M.,Tran, P., Ullrich, F. & Anderson, J. (2007). Rural motor
vehicle crash risk of death is higher after controlling for injury severity. Journal of Trauma-Injury Infection and Critical Care, 62, 221-226.
Mueller, B. A., Rivara, F. P., & Bergman, A. B. (1988). Urban-rural location and the risk of
dying in a pedestrian-vehicle collision. The Journal of Trauma, 28, 91-94. Nilsson, G. (2004). Traffic safety dimensions and the power model to describe the effect of
speed on safety. Bulletin 221. Lund, Sweden: Lund Institute of Technology. Obst, P., Armstrong, K., Smith, S., & Banks, T. (2011). Age and gender comparisons of
driving while sleepy: Behaviours and risk perceptions. Transportation Research Part F, Traffic Psychology and Behaviour, 14, 539-542.
Office of Road Safety. (2011). Annual fatalities for metropolitan and regional WA, 1999-
2010. Perth: Office of Road Safety. Organisation for Economic Co-operation and Development (2008). Towards Zero: Ambitious
road safety targets and the safe systems approach. Paris: International Transport Forum, OECD.

80
Oxley, J. (2010). Improving pedestrian safety. Perth, Western Australia: Curtin-Monash Accident Research Centre, Curtin University.
Oxley, J., Langford , J., Palamara, P., Muir, C., Koppel, S., Bohensky, M., & Williamson, A.
(2009). Non-wearing of adult seat belts in Australia: Where to next? Austroads Report No. AP–R346/09.
Palamara, P. (2011). Local government enhanced speed enforcement management project:
Final report. Perth, Western Australia: Curtin-Monash Accident Research Centre, RR 10-002.
Palamara, P., Kopinanthan, C., Langford, J., Molnar, L. & Eby, D. (2012). Review of young
driver risk taking and its association with other risk taking behaviours (in preparation). Perth, Western Australia: Curtin-Monash Accident Research Centre.
Parliament of Victoria Road Safety Committee (2005). Inquiry into the country road toll,
(Parliamentary paper no. 120), session 2003-2005, Melbourne, VIC: Road Safety Committee.
Peden, M., Scurfield, R., Sleet, D., Mohan, D., Hyder, A. A., Jarawan, E., & Mathers, C.
(2004). World Report on Road Traffic Injury Prevention. Geneva: World Health Organisation.
Radalj, T., & Sultana, S. (2012a). Trends in driver speed behaviours on Western Australian
rural road network 2000 to 2011. Perth, WA: Main Roads Western Australia. Radalj, T., & Sultana, S. (2012b). Trends in driver speed behaviours on Perth metropolitan
road network 2000 to 2011. Perth, WA: Main Roads Western Australia. Rakauskas, M. E., Ward, N. J., & Gerberich, S. G. (2009). Identification of differences
between rural and urban safety cultures. Accident Analysis & Prevention, 41, 931-937.
Retting, R., Ferguson, S. & Hakkert, A. (2003). Effect of red light cameras on violations and
crashes: A review of the international literature. Traffic Injury Prevention, 4, 17-23. Roberts, P., Taylor, S., & Sidebottom, A. (2006). Observational study for motor vehicle
restraint use in Western Australia. Perth, WA: ARRB Consulting. Rosman, D. L. (2001). The Western Australian Road Injury Database (1987-1996): Ten years
of linked police, hospital and death records of road crashes and injuries. Accident Analysis and Prevention, 33, 81-88.

81
Rosman, D. & Knuiman, M. (1994). A comparison of hospital and police road injury data. Accident Analysis and Prevention, 26, 215-222.
Ryan, G., Cercarelli, L., & Mullan, N. (1998). Road safety in the rural and remote regions of
Western Australia. Perth, WA: Road Accident Prevention Research Unit. Ryan, G., Legge, M., & Rosman, D. (1998) Age related changes in drivers' crash risk and
crash type. Accident Analysis and Prevention, 30, 379-387.
Steinhardt, D. A., Sheehan , M. C., & Siskind , V. (2009). The effectiveness of using a simple ARIA based goegraphical classification to identify road crash patterns in rural and urban areas of Queensland. In Proceedings of 2009 Road Safety Research, Policing and Education Conference. Sydney, NSW.
Stevenson, M. R., & Palamara, P. (2001). Behavioural factors as predictors of motor vehicle
crashes: differentials between young urban and rural drivers. Australian and New Zealand Journal of Public Health, 25, 245-249.
Stevenson, M., Sharwood, L., Wong, K., Elkington, J., Meuleners, L., Ivers, R., Grunstein, R.,
Williamson, A., Haworth, N. & Norton, R. (2010). The heavy vehicle study: A case-control study investigating risk factors for crash in long distance heavy vehicle drivers in Australia. BMC Public Health, 10, 1-5.
Symmonds, M., Haworth, N. & Johnston, I. (2004). Rural road safety: Overview of crash
statistics. Melbourne, Victoria: Monash University Accident Research Centre, Report No. 212.
Szwed, N. (2009). Flexible road safety barriers: Fact sheet #8. Perth, Western Australia:
Curtin-Monash Accident Research Centre. Taylor, M.C., Baruya, A., & Kennedy, J. V. (2002). The relationship between speed and
accidents on rural single-carriageway roads.Berkshire, UK: Transport Research Laboratory, Report No.TRL511.
Thompson, P.E., Hill, D.L. (2010). Reported Road Crashes in Western Australia 2007. Perth,
WA: Road Safety Council of Western Australia. Turner, C., & McClure, R. (2003). Age and gender differences in risk-taking behaviour as an
explanation for high incidence of motor vehicle crashes as a driver in young males. Injury Control and Safety Promotion, 10, 123-130.
Turmer, B., Pyta, V., Wooley, J., & Zhang, S. (2010). Road safety on local government
roads: Final report. Sydney, NSW: Austroads. Austroads Report AP-R359/10

82
Tziotis, M., Roper, P., Edmonston, C. & Sheehan, M. (2006). Guide to road safety part 5: Road safety for rural and remote areas. New South Wales: Austroads, Project # SP1051
Veitch, C. (2009). Impact of rurality on environmental determinants and hazards. The
Australian Journal of Rural Health, 17, 16-20. World Health Organisation. (2004). World report on road traffic injury prevention:summary.
Geneva: WHO. World Health Organisation. (2007). Drinking and driving:A road safety manual for decision
makers and practitioners. Geneva: WHO. World Health Organisation. (2009). Global status report on road safety: time for action.
Geneva: WHO. Wilson, C., Willis, C., Hendrikz, J. K., & Bellamy, N. (2009). Speed enforcement detection
devices for preventing road traffic injuries (Review). The Cochrane Library, 2009 (1). Zegeer, C. V., & Bushel, M. (2011). Pedestrian crash trends and potential countermeasures
from around the world. Accident Analysis and Prevention, 44, 3-11. Zwerling, C., Peek-Asa, C., Whitten, P., Choi, S., Sprince, N., & Jones, M. (2005). Fatal
motor vehicle crashes in rural and urban areas: decomposing rates into contributing factors. Injury prevention, 11, 24.