An Investigation into the Usefullness of a Method of ...
173
University of Cape Town AN INVESTIGATION INTO THE USEFULNESS OF A METHOD OF ANALYSIS FOR STRAIGHT, UNIFORM-SECTION, BOX-GIRDER BRIDGE DECKS WITH SIDE CANTILEVERS by F J RETIEF BSc (Civil) Engineering A thesis submitted in partial fulfillment of the requirements for the degree of Master of Science in Engineering Department of Civil Engineering UNIVERSITY OF CAPE TOWN April 1991 Tiie University of Ca;:;e Town has been given the right to re?rr.,hr:e ttds thesis in wliole or In part. Copyright is hsld by the author.
Transcript of An Investigation into the Usefullness of a Method of ...
Univers
ity of
Cap
e Tow
n AN INVESTIGATION INTO THE USEFULNESS OF A METHOD OF ANALYSIS FOR STRAIGHT, UNIFORM-SECTION, BOX-GIRDER BRIDGE DECKS WITH SIDE CANTILEVERS
by F J RETIEF BSc (Civil) Engineering
A thesis submitted in partial fulfillment of the requirements for the degree of Master of Science in Engineering
Department of Civil Engineering UNIVERSITY OF CAPE TOWN April 1991
Tiie University of Ca;:;e Town has been given the right to re?rr.,hr:e ttds thesis in wliole or In part. Copyright is hsld by the author.
'----'"'""=~,......._,,.,......._"""

Univers
ity of
Cap
e Tow
n
The copyright of this thesis vests in the author. No quotation from it or information derived from it is to be published without full acknowledgement of the source. The thesis is to be used for private study or non-commercial research purposes only.
Published by the University of Cape Town (UCT) in terms of the non-exclusive license granted to UCT by the author.

Univers
ity of
Cap
e Tow
n DECLARATION BY THE CANDIDATE
I, FRANCOIS JACQUES RETIEF, hereby declare that this Thesis is my own work and that it has not been submitted for a Degree at any other University.
F J RETIEF April 1991
\

Univers
ity of
Cap
e Tow
n
( i)
SYNOPSIS
Maisel and Ro 11, in a technical report for the London Cement and Concrete Association, proposed a method of analysis, in the form of an extension of simple beam theory, which is suitable for application to straight, rectangular, single-cell, uniform-section concrete box-girder bridge-decks with side cantilevers. This method only requires a calculator for execution and if a computer is used, results for maximum stresses may be obtained almost immediately. The authors state that since their method does not discretize the structure as in the case of finite element methods, the requirements in terms of computer capacity and therefore computation time is considerably reduced. Maisel, in a later Cement and Concrete Association development report, examining the use of small computer capacity for the analysis of concrete boxbeams, indicates that the hand method was being programmed.
Since the usefulness of such a method is obvious, especially if available in program form, it remains to confirm the accuracy and range of application of the method. For this purpose, four Perspex box-girder models of different depths were constructed and tested. Strain· gauges were fitted at the mid- and quarter-span sections and readings for four to five loadcases per model were taken. Several problems relating to the creep and thermal properties of Perspex had to be overcome during the experimental phase.
Strain values obtained from the model tests were converted to stresses and these were compared to the stresses calculated by the recommended method of analysis proposed by Maisel and Ro 11. Genera 11 y, the ex per imenta l results showed a very good correlation with the analytical values and thus adequately confirmed the accuracy of the method.
The analysis for the model loadcases were performed using a programmable calculator and although some of the more complex equations were individually programmed to save calculation time, it still took about 6 hours to do an analysis for a loadcase comprising only point loading at a single position on the span. However, once the method has been programmed for small-capacity computers, the time required for analysis will be consideraly shorter, even for more complex load arrangements and this will provide the Engineer with a fast and inexpensive analytical tool.

Univers
ity of
Cap
e Tow
n
(ii)
ACKNOWLEDGEMENTS
The author especially wishes to thank Associate Professor M 0 de Kock for his valuable assistance and support as Supervisor in the execution of this Thesis.
Futhermore, the efforts of the following people in giving assistance are appreciated:
Mr G Bertuzzi Mr H A Fagan Assoc Prof R D Kratz Assoc Prof R Tait Mrs E van Niekerk Miss A Serdyn
Dept of Civil Engineering (Workshop) Principal Partner, Henry Fagan Consulting Engineers Consultant, Henry Fagan Consulting Engineers Dept of Mechanical Engineering Henry Fagan Consulting Engineers Henry Fagan Consulting Engineers
Finally the author wishes to express his gratitude to the Council for Scientific and Industrial Research for their financial assistance towards this Thesis.

Univers
ity of
Cap
e Tow
n
(iii) CONTENTS
Synopsis
Acknowledgements
Li st of Figures
Notation
Terminology
1
2
2.1 2.2 2.3 2.4 2.5 2.6 2.7
3
3.1 3.2 3.3 3.4 3.5
4
4.1 4.2 4.3 4.4
5
5 .1 5.2
. 5. 3 5.4
5.5
6 .
INTRODUCTION
EXPERIMENTAL PROCEDURE AND RESULTS
General Selection of model dimensions Production of models and measurement Instrumentation Testing procedure and results Calculation of stresses and presentation Properties of Perspex
REVIEW OF THEORY OF THE ANALYTICAL METHOD
General Analysis of simple bending and St Venant torsion Analysis of Torsional warping Analysis of Distortional warping Analysis of Shear Lag
ANALYTICAL RESULTS
General Section properties Loading Cases Diagrams for combined stresses from analyses
COMPARISON OF RESULTS AND DISCUSSION
General Simple bending and shear lag in bending Torsional warping and St Venant torsion Combined St Venant torsion, torsional and distortional warping and transverse bending Combination of all action types
CONCLUSION
REFERENCES
PAGE
( i)
(ii)
(v)
(viii)
(xiii)
1
3
3 3 6 7
12 15 17
21
21 28 34 39 45
51
51 51 52 52
54
71 71 79
88 105
108
110

Univers
ity of
Cap
e Tow
n
(iv)
PAGE
APPENDIX A Tables of strain readings and ~erived stresses A.1
APPENDIX 8 Table 9 of C & CA Technical Report (Torsional 8.1 Warping Functions)
APPENDIX C Table 16 of C & CA Technical Report (Distortional C.1 Warping Functions)
APPENDIX D Table 2 of C & CA Technical Report (Equations for D.1 K2g)
APPENDIX E · Examples of typical analysis using the Recommended E.1 Method
Univers
ity of
Cap
e Tow
n
LIST OF FIGURES
Figure 2.1
Figure 2.2
Figure 2.3
Figure 2.4
Figure 2.5
Figure 2.6
Figure 2.7
Figure 2.8
Figure 2.9
Figure 2.10
Figure 2.11
Figure 3.1
Figure 3.2a
Figure 3.2b
Figure 3.2c
Figure 3.3
Figure 3.4
Figure 3.5
Figure 3.6
Figure 3.7a
(v)
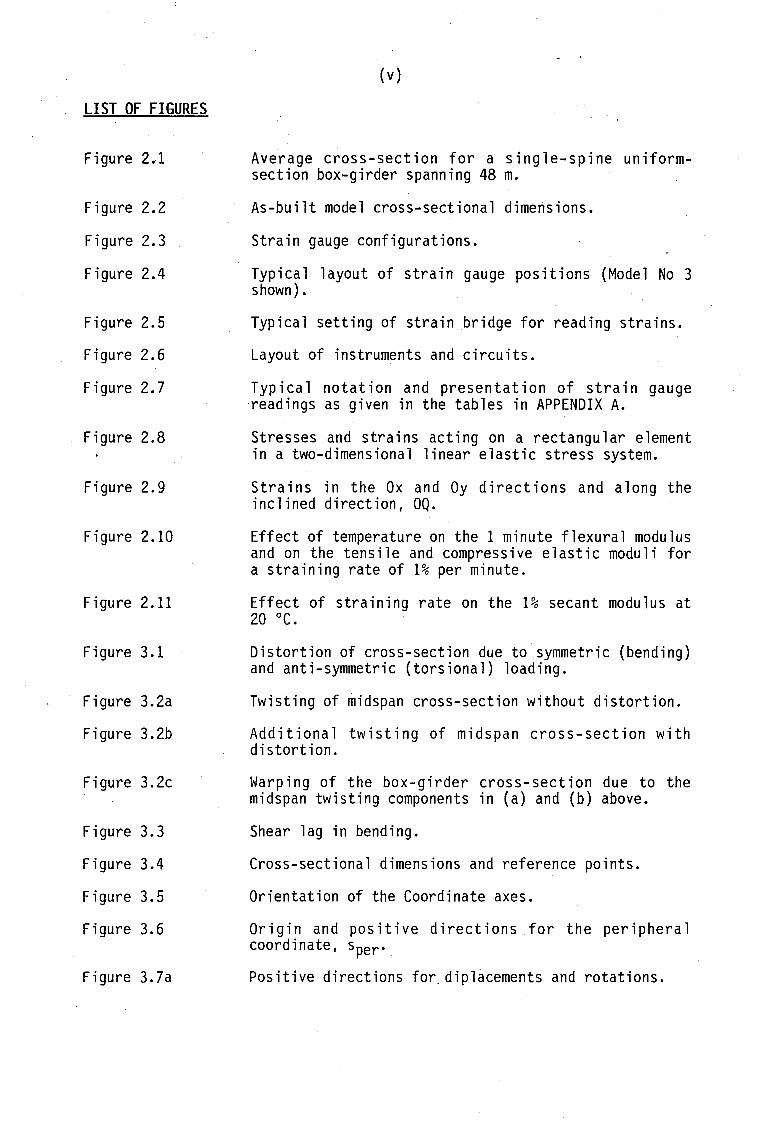
Average cross-section for a single-spine uniformsection box-girder spanning 48 m.
As-built model cross-sectional dimensions.
Strain gauge configurations.
Typical layout of strain gauge positions (Model No 3 shown).
Typical setting of strain bridge for reading strains.
Layout of instruments and circuits.
Typical notation and presentation of strain gauge readings as given in the tables in APPENDIX A.
Stresses and strains acting on a rectangular element in a two-dimensional linear elastic stress system.
Strains in the Ox and Oy directions and along the inclined direction, OQ.
Effect of temperature on the 1 minute flexural modulus and on the tensile and compressive elastic moduli for a straining rate of 1% per minute.
Effect of straining rate on the 1% secant modulus at 20 °C.
Distortion of cross-section due to symmetric (bending) and anti-symmetric (torsional) loading.
Twisting of midspan cross-section without distortion.
Additional twisting of midspan cross-section with distortion.
Warping of the box-girder cross-section due to the midspan twisting components in (a) and (b) above.
Shear lag in bending.
Cross-sectional dimensions and reference points.
Orientation of the Coordinate axes.
Origin and positive directions for the peripheral coordinate, sper·
Positive directions for. diplacements and rotations.

Univers
ity of
Cap
e Tow
n
Figure 3.7b
Figure 3.8
Figure 3.9
Figure 3.10
Figure 3.11
Figure 3.12
Figure 3.13
Figure 3.14
Figure 3.15
Figure 3.16
Figure 3.17
Figure 3.18
Figure J.19
Figure 3.20
Figure 3.21
Figure 3.22
Figure 3.23
Figure 3.24
Figure 3.25
(vi)
Positive distortional displacement under antisymmetric loading.
Positive directions for internal stress-resultants and external applied loading.
Boundary conditions for shear stresses.
(Ay)~ at J,K or L is the first moment of area of the shad~d areas about the centroidal x-axis.
Typical bending and shear stresses in longitudinal bending.
Internal torsional moment diagrams.
Typical diagrams for shear stresses in St Venant torsion.
Typical torsional loading, torsional warping stresses and torsional warping shear stresses.
Typical longitudinal distribution of torsional warping stresses and the relationship between the internal torsional moments due to torsional warping shear stresses and due to St Venant shear stresses.
Warping force group and bimoment.
Configurations of loading types ~nd support conditions for which expressions for Btwr(z), Ttwr(z), Tsvt(z) and 0twr(z) are given.
Typical torsional loading, distortional warping stresses, distortional warping shear stresses and transverse bending stresses.
Distribution of distortional warping stresses along the span of the beam.
Distortional warping coordinate wdwr·
Configurations of loading types and support conditions for which expressions for Bdwr(z), dBdwr(z)/dz and ~trb(z) are given.
Division of cross-section into flange elements.
Graphs for evaluation of A f and A s·
Moment types and associated A. values.
Derivation of A. values for continuous beams.

Univers
ity of
Cap
e Tow
n
Figure 3.26
Figure 3.27
Figure 4.1
(vii)
Function for variation of longitudinal bending stresses from edge of flange element to web.
Typical longitudinal bending stress diagram, in terms of f'lbq (top web) and f'lbg(bot web), taking shear lag inta account.
Loadcases for which models were tested and analysed.
Figures 4.2 to 4.18 Combined stresses diagrams from the analyses.
Figures 5.1 to 5.4 Experimental stresses versus analytical results for bending and shear lag in bending.
Figures 5.5 to 5.8 Experimental stresses versus analytical results for torsional warping and St Venant torsion.
Figure 5.9 Comparison of measured warping stresses at quarterspan to the theoretical stresses allowing for distortional warping (due to inefficiency of diaphragm).
Figures 5.10 to 5.16Experimental stresses versus analytical stresses for combined torsional warping, distortional warping and transverse bending
Figure 5.17
Figure 5.18
Figure 5.19
Measured peak transverse bending stresses at webs (extrapolated from midpoints) for top and bottom flanges versus b/d.
Experimental stresses versus analytical stress values for Loadcase 4.4 (a combination of all action types).
Experimental stresses versus analytical values for Loadcase 4.6 (as for Figure 5.18 but with distortional warping and transverse bending excluded).

Univers
ity of
Cap
e Tow
n
NOTATION.
A
Atop
Aweb
(Ay);" 2
b
bcant
8
Bdwr,o
Bext
Btwr
Cc en
(viii)
vertical deflection of web associated with distortion
vertical deflection of web associated with longitudinal bending
vertical deflection of web associated with St Venant torsion
vertical deflection of web occurring in torsion without distortion
vertical deflection of web associated with torsional warping
different i a 1 longitudinal deflection in flange associated with shear lag
displacement in the direction of the x axis
displacement in the direction of the y axis
displacement in the direction of the z axis
dimensions relating to longitudinal position of load
perpendicular distance from shear centre to tangent to mid-1 ine of wall at the point considered
total area of cross-section including side cantilevers
bhbot
bcanthtop
area enclosed by mid-line of wall of closed portion of crosssection = bd
bhtop
dhweb
first moment of area of partial half-cross-section about centroidal x axis
breadth between mid-lines of webs
breadth of cantilever
internal bimoment
distortional warping bimoment
term in expression for Bdwr
concentrated applied bimoment
torsional warping bimoment
central torsional moment of inertia of cross-section
Univers
ity of
Cap
e Tow
n
Ctwr
Ctwr
d
dshc
D
E
f trb
f twr
f I lbg
G
h
hbot
ht op
hweb
I bot
Ifra
I top
I web
Ix
(ix)
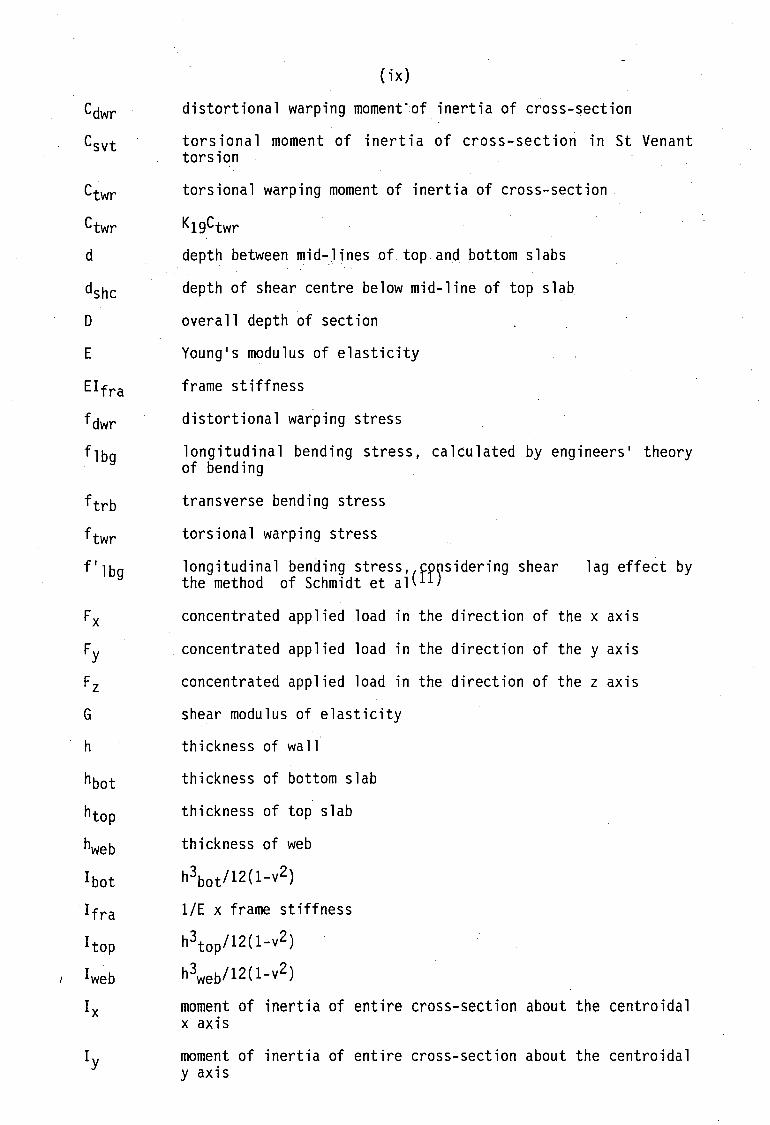
distortional warping moment"of inertia of cross-section
torsional moment of inertia of cross-section in St Venant torsion
torsional warping moment of inertia of cross-section
KigCtwr
depth between mid-lines of top.and bottom slabs
depth of shear centre below mid-line of top slab
overall depth of section
Young's modulus of elasticity
frame stiffness
distortional warping stress
longitudinal bending stress, calculated by engineers' theory of bending
transverse bending stress
torsional warping stress
longitudinal bending stress,(fDDSidering shear lag effect by the method of Schmidt et al lJ
concentrated applied load in
concentrated applied load in
concentrated applied load in
shear modulus of elasticity
thickness of wa 11
thickness of bottom slab
thickness of top slab
thickness of web
h3botl12(1-v2)
1/E x frame stiffness
h\0 p/12(1-v2)
h3web/12(1-v2)
the direction of the x axis
the direction of the y axis
the direction of the z axis
moment of inertia of entire cross-section about the centroidal x axis
moment of inertia of entire cross-section about the centroidal y axis

Univers
ity of
Cap
e Tow
n
mx,ext
my,ext
Mapp lied
(x)
constants arising in various analyses
span
distributed applied bending moment about the x axis
distributed applied bending moment about they axis
applied bending moment (shear lag analysis)
Mbot flange Resisting moment due to bending stresses in the bottom flange (shear lag analysis)
Mtop flange Resisting moment due to bending stresses in the top flange (shear lag analysis)
Mtop webs
Mtrb
Mtrb,B
Mtrb,D
Mx,ext
My
My,ext
n
N
T
Resisting moment due to bending stresses in the webs above the neutral axis (shear lag analysis)
trinsverse bending moment
transverse bending moment at top of web due to distortional load system
transverse bending moment at bottom of web due to distortional load system
internal bending moment about the x axis
concentrated applied bending moment about the x axis
internal bending moment about the y axis
concentrated applied bending moment about they axis
index in summation of series
intensity of distributed loading in the x direction
intensity of distributed loading in the y direction
intensity of distributed loading in the z direction
internal axial force
peripheral coordinate along mid-line of wall
distributed applied torsional moment
internal torsional moment
concentrated applied torsional moment
internal torsional moment in St Venant torsion
internal torsional moment aue to torsional warping shear stresses

Univers
ity of
Cap
e Tow
n x
y
z
~trb
~trb,o
°Csvt
0Tsvt
v
(xi)
distortional warping shear stress
shear stress in longitudinal bending
shear flow in longitudinal bending
shear stress in St Venant torsion at mid-line of wall
shear flow in St Venant torsion of thin-walled section
torsional warping shear stress
shear force in the x direction
shear force in the y direction
horizontal coordinate referred to centroidal axes
vertical coordinate referred to centroidal axes
longitudinal coordinate
angle of distortion of cross-section
term in expression for ~trb
increment in Csvt due to antisymmetric shear stress distri~ution measured by ovsvt
increment in Tsvt due to antisymmetric shear stress distribution measured by &vsvt
increment in Vsvt over half thickness of wall
strain in x direction for plane stress analysis
strain in y direction for plane stress analysis
shear strain for plane stress analysis
term used in shear lag analysis of Schmidt et a1(ll)
normal stress in x direction for plane stress analysis
normal stress in y direction for plane stress analysis
shear stress for plane stress analysis
rotation due to St Venant torsion
rotation about the x axis
rotation about the y axis
rotation about the z axis
Poisson's ratio
Univers
ity of
Cap
e Tow
n
J dA
j
(xii)
distortional warping coordinate
· sectorial coordinate in torsional warping, referred to the shear centre
integral over the entire cross-sectional area
integral along the mid-line of wall of the closed portion of cross-section
dwtwrf dsper derivative of Wtwr with respect to sper

Univers
ity of
Cap
e Tow
n
(xiii)
TERMINOLOGY
The definitions for the various terms and expressions used in the text are as follows:
distortion
warping
tors ion al warping
distortional warping
shear lag
St Venant torsion
longitudinal
transverse
centreline
mid-line
midpoint
deformation of a cross-section (Figure 3.1)
the out-of-plane displacement of points on a cross-section (Figure 3.2c)
warping of cross-section associated with shear deformations in planes of flanges and webs caused by torsion
warping of cross-section associated with in-plane bend~ng of flanges and webs caused by torsion
a form of warping associated with bending without torsion as a result of shear deformations in the planes of the flanges (can also occur under torsional loading) (Figure 3.3)
pure torsion, theory assumes zero warping restraint and therefore no longitudinal normal stresses
in the direction of the span or z axis
in directions perpendicular to the span
vertical ~ine through axis of symmetry (centroid) of cross-section
centrelines of flanges and webs in section
a point halfway between reference points
The terms measured, experimental and observed readings refer to the stresses determined from the strain readings from the model tests.
The terms analytical, theoretical and calculated values refer to stresses determined by using the hand method of analysis.

Univers
ity of
Cap
e Tow
n
1
1 INTRODUCTION
Torsional loading in box-girders introduce longitudinal warping stresses over and above those found from the simple bending and torsional analyses. Additionally, transverse bending stresses due to the distortion of the cross-section as well as local bending also occurs. These stresses must be taken into account in the ~design of such members since they represent a major portion of the total stresses that are present.
Several methods are available whereby the warping and transverse bending stresses can be determined. The most accurate method and also the method with the widest application is the finite element method which requires a computer of sufficient capacity. These methods involve extensive calculations and as such use considerable computational time and therefore have high costs. Also, the time required for preparing the input for such programs may be substantial, especially if a facility for automatically discretizing the structure is not available.
The finite strip method also involves discretizing ti~ structure and considerable computation but according to Maisel l '1, has been developed into an economical method for dealing with box-giders of uniform section as well as curved and skew girders and continuous members.
Maisel and Ro11(7), in the method that they proposed, selected the most suitable methods available, in their assessment, for dealing with each of the structural actions that typically occur in boxgirder structures. The structural action types are the following: simple bending and shear, St Venant torsion, torsional warping, distortional warping, transverse bending, shear lag in bending and local plate bending. The final result is obtained by superimposing the relevant stresses from each of the above effects. The method is limited to rectangular, single-cell, constant-section members and requires considerable calculation time if done by hand. However, if it is programmed for a small computer, and it is suitable for this purpose, it will be a fast and inexpensive analytical method which is competitive with the finite element procedures within its scope of application. The only question remaining therefore is with regard to accuracy and whether the method can produce suitable results for use in the actual design of members.
Maisel and Roll performed tests on a single Perspex model with successive single point-loads applied at various points on the deck of the model and in addition did have some results available from tests performed by Steinle. The Maisel and Roll model represented a box-girder of average proportions and the tests gave satisfactory although sparse results.

Univers
ity of
Cap
e Tow
n
2
In order to broadly assess the accuracy of the method, it was decided to test four Perspex models ranging from extremely deep to extremely shallow sections with the in-between models slightly deeper and slightly shallower than normal. The support conditions in all cases represented a system preventing distortion but not warping. Loading was in the form of single point loads or pairs of point loads (mostly) applied at either midspan or quarter-span. Where possible, loadcases were devised to be able to separately examine individual structural action types. Electrical strain gauges around the midspan and quarter-span sections were used to find stresses which were compared to those found from analysis.
The tests on the models may have been extended to include distributed loading as well as support conditions which provided full warping restraint as in the case of continuous members. It was however felt that in the first instance, if good results are achieved with point loading, good results should also be achieved for distributed loading since this merely represents a superposition of a number of point loads. In the second instance, Maisel and Roll refer to an example by Steinle in which the warping stresses at midspan under concentrated midspan torsional loading differ by only 5% when calculated for no warping restraint at the supports and then for· full warping restraint at the supports. This is a relatively small influence and as such less important than the other effects examined here.

Univers
ity of
Cap
e Tow
n
3
2 - EXPERIMENTAL PROCEDURE AND RESULTS
2.1 GENERAL
2.2
2.2.1
The purpose of the experimental work was to establish the ac7~racy of the hand method of analysis proposed by Maisel and Rolll J and this was done by testing four box-girder models with different {but realistic) cross-sectional dimensions.
It was decided to construct the models using Perspex sheets mainly because of the ease in accurately machining and assembling this type of material.
A further consideration in selecting Perspex was that Maisel and Roll had also tested their proposed analytical method against(jbe results of tests on Perspex models. According to their report J, these tests yielded results which compared favourably with those. from the analysis.
For simplicity, the loading type was restricted to point loads applied at the mid- and quarter-span sections of the models to give the required combinations of torsional, distortional and bending effects. The support conditions for the models were chosen so as to restrain both torsion and distortion but not warping. In terms of longitudinal bending, the models were all simply supported single-span structures.
SELECTION OF MODEL DIMENSIONS
Design Considerations
The selection of proportions for the box-girder models was based on the results of a feature survey by SwannllJ) of 173 concrete box-girder bridges constructed between 1957 and 1972.
From the above publication it was found that the preferred range of spans for uniform-section, single-spine box girders lie between 25 and 50 metres and that span to depth ratios vary between about 12 (economic limit) and 32 (flexural stress limit).
In order to keep model-making to a minimum and to re-use strain gauges as far as possible, it was decided to initially build and test the deepest model (l/D = 8) and to subsequently modify this model by cutting the webs to the depth required for the next deepest model(l/D = 14). After accurately milling the shortened webs, the bottom flange, either the one used previously or a new one if a different thickness was required, was re-glued. This process was repeated three times to yield the four models.
In this way it was possible to retain the top flange (deck) and web portions from one model to the next and since these had the most gauges attached to them and consequently were the most expensive and time-consuming to replace, considerable savings were achieved.
Univers
ity of
Cap
e Tow
n
4
The modification procedure de.scribed above, imposed restrictions on the selection of dimensions for the various models in that it fixed the thicknesses of the top flanges and the webs, htoJJ and hweb• as well as the width of deck, b, and length or the cantilevers, be ant. Therefore, it was a 1 so necessary to check whether these t1xed dimensions and thicknesses did not result in abnormal values for some models, especially the ones with the deepest and shallowest sect ions, in terms of the various Swann criteria. However, it was found that by selecting suitable scaling factors, the full scale dimensions for all models could be made to fall within the normal range.
2.2.2 Design Procedure
•
Firstly, the dimensions for a box-girder of average proportions was determined using results from the Swann survey.
A span length of 48 m, which is relatively large for this type of deck, was selected so that the member sizes and thicknesses would be determined in terms of structural requirements rather than nominal sizes. This gave a model length of 1.200 m when using a scaling factor of 40. The above length was found to be suitable in terms of the available Perspex sheet sizes and the size of milling machine.
A span to depth ratio of 21, which is approximately the mean value for this length pf span, was chosen from a diagram of maximum span/depth ratio at the piers versus maximum(I%qn for the various bridge structures included in the survey J. This gave an overall depth of section of about 2.3 m and a model depth of 57.5 mm .
The deck width b, was found from a diagram of ratio of total breadth/maximum span versus maximum span. The approximate mean ratio given for single-cell ·structures is 0.21 for a 48 m span, giving a deck width of about 10,1 m and a model dimension of 252.5 mm.
The the cantilever length, bcant• was calculated using the following equation given for single-cell box-girders:
bcantlb = 0.24 - 0.00048 lmax + 0.0058 b
where
lmax = maximum span length
bcant = length of cantilever measured from the web centreline
b = breadth of deck including the cantilevers
The above equation gives a value of approximately 2.80 m for bcant and an equivalent model dimension of 70.0 mm.

Univers
ity of
Cap
e Tow
n
5
The thicknesses of deck slabs are largely dictated by transverse bending design considerations. Swann considers this dimension at two critical positions: at the root of the cantilever and between webs. In both instances plotted diagrams of slab thickness versus span and which differentiate between transversely reinforced and· transversely prestressed deck slabs, are given for the structures surveyed. For a cantilever length of about 2.6 m (measured from the outside of the webs, assuming a web thickness of 400 mm) the average thickness at the root was found to be about 320 mm. In
· terms of the second cons i derat iOn, the average thickness for a deck slab with a 4.10 m clear span between webs, again assuming a web thickness of 400 mm and with haunches present between flange and webs, was found to be about 240 mm. The thickness selected for the top flange was based on an average of the above, i.e. 280mm, which translated to a model dimension of 7 mm.
The web thickness was found from a diagram of 2hwebD/blmax versus maximum span, lmaxr and which distinguishes between box-girder structures with constant section, varying slab thicknesses and varying depth of section. The parameter given above is a dimensionless expression taking web shear area at the supports (proportional to shear resistance) and deck area (proportional to load) into account. For. a constant section
3with a span of 48 m,
the diagram gives a value of about 3.8 x 10- which works out to a web thickness of 0.801 m for both webs or 400 mm per web. This gave a model dimension of 10 mm.
The final stage in finding dimensions for the average box-girder was determining the thickness of the bottom flange. A diagra~ similar to that for the webs but with parameters of D Abotlblmax versus maximum span l~ax• where Abof is the area of the bottom flange, is provided. lh1s gives a va ue of about 1.0 x 10⁻⁴ for a constant section member with a 48 m span. The thickness of the bottom flange was then 210 mm which for the model became 5.3 mm.
The dimensions for the average section from the above calculations are illustrated in Figure 2.1.
[, • ~ 2.8 , (70.0mm I 1c
1 I
10,1 ( 252,S 19m I 4 .5 ( 112. S11m I
L
Z.8 !70.0l!IJ!ll 1
L0.4~0nml 1 1
MOOa DIMENSIONS (1 IN 40 SCALE! GIVEN IN BRACKETS
FULL SCALE DIMENSIONS IN m
Figure 2.1 Average cross-section for a single..;spine, uniform-. section box:...girder spanning 48 m. ·

Univers
ity of
Cap
e Tow
n
6
Secondlyi span to depth ratios weri chosen for the four models so that these would be spaced towards the upper and lower portions of the range of values presented in the Swann survey, i.e. from 12 to about 28. Values of 8, 14, 27 and 32 were selected.
The cross-sectional dimensions for all the models with the exception of the bottom flange thicknesses were therefore known at this stage: the width of the deck, length of cantilever and thicknesses for webs and deck were taken from the sizes found for the average inode l above and· remained the same throughout and the depths were calculated from the above span to depth ratios.
The required bottom flange thicknesses were provided for each of the models according to the Swann survey since these panels had to be removed for the modification from one model to the next in any case.
Thirdly, as a check, it was seen whether suitable scaling factors could be found on a trial and error basis to give full scale dimensions that would fall within the range of values described by the Swann survey. The~e factors were found to be 30, 33.3, 40 and 40 for models 1 to 4.
The models were made, as described in the next section, using the Perspex sheet thicknesses nearest to the values found above. See Figure 2.2 for the as-built model cross-sections.
2.3 PRODUCTION OF MODELS AND MEASUREMENTS
As described previously, Model 1 (deepest section) had to be made first and tested before being modified by cutting through the webs to produce the next model - ie Model 2. This process was then repeated twice more to obtain the other models.
The various panels for the deck, webs and bottom flange were cut with a handsaw from 6, 10 and 3mm Perspex sheets respectively and accurately machined down to the required sizes using a milling machine. The panels were then glued together using Tensol cement for Perspex - a chloroform based adhesive. The as-built crosssectional dimensions of the models are given in Figure 2.2.

Univers
ity of
Cap
e Tow
n
2.4
2.4.1
... ...
... ...
7
.f 63,98 9,fit
·, -,.
MODEL No 1 MODEL No 2
t 63 85 ~t'~ 2~,48
7 85 '7~ 6385 t ! 6385 9f7L ,
l'.
ff <.
": r<•
zi.i..~ 97, 5 9,fl 6385 t
... ...
~ N ..
~
....
.... 0
;
n i .. I ·~···--- .... • . ..... ~
11 11 11 t I ;:+-· -.# ...
-.# ,..,
.,; Ill <If
MODEL No 3 MODEL No 4
Figure 2.2 As-built model cross-sectional dime'nsions.
For the modification, the webs were cut 2 to 3mm below the required depth with a handsaw and the excess material machined off accurately with a milling machine. The bottom flange, which could either be from the previous model from which the residual web portions had been carefully machined down or a completely new panel depending on the thickness required, was then glued on.
INSTRUMENTATION
Strain Gauges
2.4.1.1 Selection of strain gauges
The strain gauges that were used had to be compatible with both Perspex as base material and with the available measuring instruments (see 2.4.2) and in addition had to be small enough in relation to the size of the models to give sufficiently localized strain values.

Univers
ity of
Cap
e Tow
n
I
~
• -' E -0
i.n , • .. •
I
LINEAR
Figure 2.3
8
" e. - E
·o N
~
L 2.0mm L '( ,
0 - 90 ° ROSETTE
Strain gauge configurations.
L 2.0mm 1
o- 45° - 90° ROSETTE
Strain gauges produced by KYOWA ELECTRONIC INSTRUMENTS COMPANY of Japan were chosen since they satisfied both the above requirements - see Figure 2.3 above. These gauges were available in 2 and 5 mm lengths for the rosettes and the linear types respectively and were small when compared to a model span of 1200 mm or deck width of 245 mm.
2.4.1.2 Choosing the strain gauge positions
For simplicity and ease of making direct comparisons with the results from other published sources, it was decided to mount the strain gauges at the midspan and quarter-span sections for all four of the models tested.
These gauge positions also coincided with the loading points, which were on the web centrelines at either midspan or quarterspan sections. This form of loading was chosen to provide results for the most elementary loading configurations. Hence, it was anticipated that some local stress concentrations would occur in the immediate vicinity of the loads but that these would not affect gauge readings lower down on the webs, on the bottom flange or at the edges and centre-line of the deck at the same section.
The transverse arrangement of gauges on the cross-sections depended on several factors, the most important of which was the amount of information that could be obtained from the various types i.e. linear strain gauges, 0-90 degree two-gauge strain rosettes and the 0-45-90 degree three-gauge strain rosettes.

Univers
ity of
Cap
e Tow
n
//n e.et.r
9
To find the normal stress at a point, it was necessary to know the strain in the direction considered as well as either the strain Of'
the stress in the perpendicular direction - see Section 2.6.1. Therefore, perpendicular normal stresses could be calculated readily when using rosettes which measured the strains in perpendicular directions. However, in the case of the linear gauges, either the stress or strain for the perpendicular direction had to be known or assumed before the normal stresses could be determined.
Since the side cantilevers were not loaded, normal stresses in the transverse direction in these members remained zero and thus only linear gauges were required to find the longitudinal stresses.
Similarly, when the webs were loaded symmetrically, transverse normal stresses in the top and bottom flanges remained zero and so again only the linear gauges were needed to find the longitudinal normal stresses. However, under torsional loading conditions, transverse bending stresses occured in the flanges between webs in. addition to the longitudinal normal stresses and therefore strain rosettes were required to find the perpendicular normal stresses at these positions.
To find the shear stress at a point, it was necessary to know the strains in at least three separate (and preferably widely spaced) directions at that point. These strains could be found by making use of a 0-45-90 degree three-gauge rosette. These gauges were consequently provided at positions where significant shear stresses were expected to occur, such as in the webs under symmetrical vertical loading conditions and in the top and bottom flanges as well as the webs under torsional loading conditions. Figure 2.4 shows the layout of gauge-positions used for Model 3, which was typical for all the models.
~ ~ H 31,8 t 31,6 f16.8 + 26,6 t 26B t26,9 t 31,8 t 32 5 H I I I + I + I I I
-T + '('e>~e--6t~ I + + I
i¥'9f-ll'9P'1 p!S It 4,1 5,4
..---""~-- Position of Strain Guages
it 31. 6 t 3U ~ 26.7 t 26.7 r 26.a + 26,9 r 31.9 "" 32.4 H I~ +~+l"*°I
:r·· +. l) '. '. . I} + ··1= I+""+ I N 26 9 ~ zz o i 26 6 ~ 261 H
lo,7 5,4
Fbsition of Strain Guages at 1;4 span ( z = IlOl
at midspan ( z :600)
y
Figure 2.4 Typical strain gauge positions (Model No 3 shown)~

Univers
ity of
Cap
e Tow
n
10
2.4.1.3 Mounting and wiring of strain gauges
2.4.2
The strain gauges were cemented to the Perspex models in accordance with the procedure prescibed by the gauge manufacturer. Also, a gauge from each lot number was cemented to a spare piece of Perspex by the same procedure to act as temperature compensation or dummy gauge and was to be used when reading active gauges on the models with the same lot number.
The leads for each gauge comprised two eight-strand (200 micron) copper wire conductors sheathed in insulating plastic and were approximately 1.2 m long to reach the reading instruments.
Finally KYOWA CS protective silicone coating was used to seal the gauges after first driving off moisture with a blow drier.
Equipment for reading strain gauges
The basic instrument for taking strain readings was a Wheatstone (strain) bridge, in this case manufactured by HUGGENBERGER of Zurich, which measures the change in the electrical resistance of a strain gauge due to a change in length.
Initially only one of these instruments was used and was connected to ij.b,e strain gauges via a HUGGENBERGER switching unit which could acc~odate up to 22 gauges at a time together with a single dummy gauge. The strain bridge could only monitor one gauge reading at a time and the switching unit therefore enabled one to switch rapidly from one gauge to the next and so reduce the time for taking readings. This however only applied if the dummy gauge already matched the lot number of the chose~ active gauge.
A typical Huggenberger strain bridge is read by adjusting a meter to the centre-zero position using a selector switch and a rotating dial for fine adjustments. See Plate 1 and Figure 2.5.
\.~ tJ tt v ,,~
Plate 1 Huggenberger strain bridge and switching unit.

Univers
ity of
Cap
e Tow
n
11 ,------Selector switdl (coarsa adjustlllel'ltl
Sockets for connecting directly ta gauges
antra - zara utar
Figure 2.5
······
(
-, \. \ \ \ I 1~· v Sa"'ctor for gauge factir K
.----+--Setting for static loading ·
~·@ 01 -~-i---ln~tnimant OFF
QBA i:lililVJ-------l--Roi:tlng dail
TE~ HUGGENBERGER
Q KO (flna adjustmtntsl
O• L GAUGE READING : 15.375
Sactet tar switching unit cable
Typical setting of strain bridge for reading strains.
A instability problem was encountered with the gauge readings, which was the result of the heating influence of the reading current and whi£h severely slowed the rate of taking readings. The result was that two more strain bridges similar to the above had to be used to speed up the reading process. Each additional instrument was connected directly to a single active gauge and the appropriate dummy gauge. See figure 2.6 below for a basic layout of the arrangement of instruments and their connecting circuitry.
Figure 2.6
MOO EL
HOO GEN BERGER SWITCH ING UN IT
@ 0 G) A @
·~ e@ • • • HUGGENBERGER STRAIN BRIDGE (ADDEO LATER)
Cl.JMMY GAUGES
HUGGENBERGER STRAIN BRIDGE
Layout of instruments and connections.
Sm 9V BATTERIES IN SERIES
AC 230V POWER SOURCE

Univers
ity of
Cap
e Tow
n
2.5
2.5.1
12
TESTING PROCEDURE AND RESULTS
Setting up for testing
The support conditions for all the models and loadcases were identical - i.e. the models were simply supported on pinned supports at one end and on roller or vertical supports at the other. In addition, the supports also provided full torsional restraint but not warping restraint. Since the model span lengths (1.200m) were identical it followed that the same support configuration could be used throughout.
A 50 x 50 angle-section with the legs turned downwards was used to make the pinned or knife-edge support. The roller support was made by sandwiching two 10 mm diameter steel rollers between two 6 mm thick glass plates and mounting this assembly on a 10 mm thick flat steel plate with levelling screws. These supports were set on a rigid steel frame at the required distance apart and adjusted with shims and the levelling screws to be at the same level. Finally the model under test was positioned on the supports and weights applied on the web centrelines directly above the line of the supports in order to provide the required torsional restraints. Diaphragms (aluminium cross-braces) were fitted inside the closed elements of the models at supports to prevent distortion of the cross-section.
Plate 2 Roller support details.

Univers
ity of
Cap
e Tow
n
2.5.2
2.5.3
13
System of loading
The models were loaded as follows:
The downward loading was provided by using a system of weights on hangers and suspending these from the models. Upward loading was also by weights on a hanger but these acted on the models via a thin flexible cable running over two pulleys mounted on greased ball-bearings and fastened to a steel beam. The steel beam was supported by stands on either side of the model and could be moved to position the one pulley (from which the cable ran down to the model) directly above the point required i.e. so that cable pulled up vertically. The cable was hooked onto anchors threaded through the deck into the web.
Plate 3 Loading system.
Reading procedure
The typical steps for reading a strain gauge was as follows:
Before loading up the model, an active gauge (on model) and matching temperature compensation (dummy) gauge were selected and connected , either directly or through the sw i tching unit , to a strain bridge and the instrument switched on.
The gauges were allowed to reach thermal equilibrium in order to obtain a constant reading by leaving them switched on for about 20 minutes.

Univers
ity of
Cap
e Tow
n
2.5.4
14
After taking the initial reading, the loading was applied and the gauge reading taken again and finally the loading removed and another gauge reading taken. This loading process was then repeated with the loading sequence reversed for those loadcases in which two point loads were used - see Section 2.5.4 for presentation of results.
The complete procedure above was repeated until all the gauges for the model being tested had been read, i.e for about 45 to 50 gauges per model.
It was obviously important to minimise the build-up of friction at the roller support and for this reason the model was tapped lightly a few times at this position before taking any readings in order to release the rollers.
The time taken to load a model and take readings for a single loading sequence took approximately two minutes and had a direct influence on the amount of creep that would occur during the period for which the loads were applied. The amount of creep was reflected in the difference between the first (just before loading) and the third (just after removing the loading) readings .. · This generally small creep component could therefore be eliminated by taking the average of the first and third readings and subtracting this from the second reading (under loading) to give the actual elastic strain - see 2.5.4.
The reading process was speeded up by using three strain bridges simultaneously i.e. two gauges could be switched on and be left to stabilize while a third gauge was being read. This increased the rate of reading gauges from about one every 25 minutes to about three per 25 minutes .
Presentation of results
The strain readings as well as the derived stress values for each of the models and loadcases tested are presented in tables given in APPENDIX A.
A typical reading is presented in the tables as follows:
Reading refererrca no
Transversely to
1 mod1l. \.
(l) Pnrttllel tol @ wm'i.
Gauge factor
SlraJn road ings (Stramel0- 3)
ABC Loading soauenco 1 DEF: Loading soquenu 2 1"z UB+ El. 1"z lA+C+O+Fll
NO NO AVERAGE STRESS LOAD LOAD LOAD STRAIN NOTE
T A C
~';:;;n~~~~--"iUJ3 • 1 L w cc 15,3815 15 ,375 15,382 -0,016 ---~ -0 : 0 0 E f -0,0070f---i
Additional set of--+-~ l N 15,382 15,374 15,3805 =0,012~~ r1.adings taken to be c.on!.lell!rtd in mtculation __ _.....,.._-+-_....._..__ _ _._ _ ___, __ _._ _ ___, __ _,
L1t'ol11n ""'b and -i1l Ii. at s tress1s
Figure 2.7
1t~ Span 13 •3001
Deck Iott af C\.
I W • W1b F • Bottom flang1
E • at edql of dock ~· bltwen td::)I af dttt .and 'a'eb 'W • at web on OHie or bctto"' flange Ii. • at Ii. of deo: or botto10 flan91 T • at tap of web M • at 1a1dd la of web B • at batta. of wo
Stress in t h1 perpendicular direct ion at tho 9au91 IHPaJ
Str•ss n direct ion of thl gou91 t HPo.1
Typical notation and presentation of strain gauge readings as given in the ~ables in APPENDIX A.

Univers
ity of
Cap
e Tow
n
2.6
2 .. 6.1
15
The theory and calculation procedure for finding the experimental stress values are given in Section 2.6. These stress values are plotted together with the theoretical stress diagrams in Figures 5.1 to 5.8, Figures 5.10 to 5.16 and Figures 5.18 and 5.19.
DERIVATION OF STRESSES AND PRESENTATION
Theory of elastic stress-strain relations
The theory describing elastic stress - strain relations as well as strain - strain relations in two- dimensional stress systems is well documented in most(
1literature dealing with the strength of
materials and structures J and can be summarised as follows:
2.6.1.1 Normal stresses acting in perpendicular directions
Assume the tensile stresses ax and a are acting separately in mutually perpendicular directions at l point in an elastic body. The resulting strains are indicated in Figure 2.8 bel-0w.
-vO"x
E '
Undeformed element
r Eyr-1 !'x-1 -:-E;l-ax
L_'.__I
cy
Stress in x direction Stress in y direction Stresses combined
Figure 2.8 Stresses and strains acting on a rectangular element in a two-dimensional linear elastic stress system.
The total strains in these directions, Ex and E , are found by superimposing the strains due to a and a acting separately. Taking tensile strain as positive, t~e equations for the strains in each of the x- and y-directions can be written thus
Ex (x) = (ax Vcry)/E
Ey (x) = (cry vcrx)/E (1)
and rewritten as
ax (x) = E(Ex + vEy)/(1 v2)
cry (x) = E(Ey + vEx)/(1 v2) (2)

Univers
ity of
Cap
e Tow
n
16
Note that when a shearing stress txy is present in addition to the direct or normal stresses crx ana a, it is assumed that the sheating s~ress has no effect on the direct strains Ex and Ey ryor does the direct stresses crx and cry have an effect on the shearing strain -rxy-
It is clear from the above equations that in order to find the normal stresses at a point, at least two of the variables crx, cry, Ex or Ey must be known.
2.6.1.2 Derivation of shear stress from known strains in 3 directions
For a two-dimensional system of strains, the Mohr's circle of strain can be constructed if the direct and shearing strains in two mutually perpendicular directions are known. Hence, it follows that the direct and shearing strains in any direction can be found if the direct and shearing strains in two mutually perpendicular directions are known.
Consider a rectangular element of material, OPQR, in the xy-plane as given in Figure 2.9 below. All strains are considered to be sma 11.
Figure 2.9
Q~~_._~~~~~....._r-..._~--K
cos 8 tic cos 8
Strains in the Ox and Oy directions and along the inclined direction, OQ.
The direct strain on the diagonal OQ can be determined as follows, given that the direct strains, Ex and Ey, and shearing strains Txy in the Ox and Oy directions are known.
When the rectangular element is strained, side OR extends by Excose and side OP by Eysin0. Also, the side OP rotates through a small angle Txy due to the shearing strain and point Q moves to point Q1
•

Univers
ity of
Cap
e Tow
n
17
Therefore, the movement of Q parallel to Ox is
Excos0 + Txysin0
and the movement parallel to Oy is
Eysin0
The movement of Q parallel to OQ then is
(Excos0 + Txysin0)cos0 + (Eysin0)sin0
Since the strains are small, this is approximately equal to the extension of OQ in the strained condition and since OQ is of unit length, the extension is also the direct or normal strain in the direction of OQ. This can therefore be denoted as follows
E = (Excos0 + Txysin0)cos0 + (Eysin0)sin0
and may be written in the form
E = Excos2e + Eysin2e + Txysin0cos0 (3)
The above equation can be used to find the shearing strains as well as the perpendicular normal strains for any orientation of the x and y axes by using the three strain readings given by the 0-45-90 degree rosettes at the same point. Since the 0- and 90-degree gauges were always lined up with the x and y axes on the model and using the above equation, the following three equations could be written for the three gauges
Ea = Ex.12 + Ey.O + Txy·0.1
E4s = Ex(0.71) 2 + Ey(0.71) 2 + Txy(0.71)2
Ego = Ex.a + Ey.12 + Txy·l.O
and more conveniently rewritten as
Ex = Ea
xy = 2(E45 - O.SEo - O.SEgo)
Ey = Ego (4)
From the above the direct stresses could be found using the equations developed in 2.6.1.1 above. The shearing stress is found ilSing the following equation
(5)
G = E/2(1 + v) (6)

Univers
ity of
Cap
e Tow
n
2.6.2
2.7
2.7.1
2.7.2
18
Calculator program for strain-stress conversion
A program was written for a Hewlett-Packard 41C calculator whereby a single average strain was calculated using the six readings taken per gauge(i.e. for the unloaded, loaded and again unloaded conditions repeated for two loading sequences) and from which the stress was then calculated.
PROPERTIES OF PERSPEX
General
'Initially, after a lengthy but unsuccessful search for suitable literature on the properties of Perspex, it was decided to do tensile tests to establish a value for the Young's modulus and to use certain of the strain rosette readings from the model tests to. determine the Poisson's ratio.
Later, following completion of the tests, enquiries to the AECI company,( 9~hich manufactures Perspex, produced a comprehensive brochure 11 giving all the important proper.ties of this material. This brochure shows that both temperature and the rate of application of stress or straining have a considerable influence on the elastic modulus and Poisson's ratio values. The effects of these are briefly discussed in 2.7.2.
The values derived from the tests were found to be close to those given in the AECI brochure for a temperature of 20°C and short term testing, which are the conditions nearest to those in the laboratory where the tests were done. Sections 2.7.3 and 2.7.4 deal with the selection of appropriate values for E and v.
The effects of temperature and straining rate on the elastic modulus and Poisson's ratio of Perspex
2.7.2.1 Elastic modulus
The AECI brochure(9) considers several types of elastic moduli -the initial tangent, tangent and 1% secant moduli in tension; the flexural modulus; the compressive modulus and the apparent Young's modulus - for a range of temperatures and straining rates.
Figure 2.10 below illustrates the influence of temperature on some of the moduli and shows the similarity of the rates of change of the various moduli with temperature. It is also clear from the graph that the magnitudes of initial tangent moduli in tension and compression as well as the flexural modulus are substantially similar at a given temperature and rate of strain.

Univers
ity of
Cap
e Tow
n
19
5,000 r-----r--------,r-----------------.
c£ 3,000
I::
u -1-~ 1,000
UJ
~~---1--Tensile modulus ( tangent at the origin! ..-----+--Compressive mo du !us (tangent at the origin!
.---+--1 m(nute flexural modulus 1% secant modulus in tension
o.__ _______________ __.. ____ __. ____ _. -20
Figure 2.10
0 20 60 BO
Temperature ·c Effect of temperature on the 1 minute flexural modulus and the tensile and compressiv~ elastic moduli for a straining rate of 1 % per minute.
The influence of the rate of straining on the 1% secant modulus at a given temperature is shown by Figure 2.11 and it can be assumed that the effect of straining rate on the other types of moduli referred to above will be similar on a pro rata basis.
Figure 2.11
s. 000
4,000
c:l 3,000 CL I::
VI
.3 2,000 :::i -0
~
== 1,000 VI 0
UJ
0
~ ~
Straining Rate % per second
Effect of straining rate on the 1% secant modulus at 20 °C.

Univers
ity of
Cape T
own
20
2.7.2.2 Poisson's ratio
2.7.3
2.7.4
Essentially, according to the brochure(9), for small values of strain, the Poissons 1 s ratio for Perspex remains constant over the -25°C to +50°C temperature range. At temperatures above 100° C, where large deformations can occur, Poisson's ratio approaches a value of 0.5.
As far as the iluence of straining rate is concerned, a short term (6 hours) design value of 0.39 and a long term (10 years) design value 0.40 is given.
Choosing a suitable value for the Modulus of Elasticity of Perspex
The tensile tests, performed on samples taken from the same sheets. of Perspex as used for building the box-girder models, produced a value of 2918 MPa for the Elastic modulus. This value represents the initial tangent modulus in tension for a temperature of between 18°C to 22°C and a straining rate of about 0.3% per minute.
The equivalent value given in the brochure is 3357 M~a for a temperature of 20°C and a straining rate of 1% per minute and which, if adjusted for a straining rate of 0.3% per minute, using figure 2.11 above, becomes 3185 MPa. This figure is about 9% higher than the test value.
However, since the tensile tests were carried out using samples from the same sheets of Perspex as used for making the models and since the test values compared closely to those given in the brochure in any case, it was decided to rather use the test value for this thesis, i.e. 2918 MPa.
Choosing a suitable value for the Poissons 1 s Ratio of Perspex
The value of Poisson's ratio, derived from the strain rosette readings of the model tests with symmetrical loading - i.e. for which the transverse normal stresses were theoretically zero - was 0.39. This value represents the Poisson's ratio for short term testing at a temperature of between 18°C and 22°C.
The equivalent value from the brochure, defined as being for short term testing at a temperature of 20°C, is 0.38, which is close to the value from the model tests given above. The brochure also gives short term (6 hours) and long term( IO years) design· values of 0.39 and 0.40 respectively.
Since the test value is confirmed by the information from the AECI brochure, it was decided to use this value of 0.39 for this thesis.

Univers
ity of
Cap
e Tow
n
21
3 REVIEW OF THEORY OF ANALYTICAL METHOD
3.1 GENERAL
3.1.1
The hand method proposed by Maisel and Ro11(7), the theo~y of which is discussed here, basically treats the analysis of boxbeams as the summation of the stresses arising from a number of independant structural actions. Typical examples of using the hand method in analysing the loadcases used for the experimental testing of models~are given in APPENDIX E.
Distortion and warping
Apart from simple beam action, there are two major types of structural action that occur in box-girders: distortion or deformation of the cross-section and warping of the cross-section (defined as an out-of-plane displacement of points on the crosssection).
The typical forms of loading giving rise to distortion are shown · in Figure 3.1 below.
Figure 3.1 Distortion of cross-section due to symmetric (bending) and anti-synunetric (torsional) loading.
Warping of the cross~section is most conveniently described with the aid of Figures 3.2, which are for a box-girder under torsional loading.
Firstly, consider a box-girder with cross-sections which are prevented from distorting by the presence of rigid diaphragms. The diaphragms are assumed not to restrict longitudinal displacements from taking place. Figure 3.2 (a) shows the twisting of the cross-section without distortion and Figure 3.2 (c) shows the resulting longitudinal warping (torsional warping) displacements (dashed line) which are associated with shear deformations in the planes of the webs and flanges. The midspan deflections of the webs are denoted by at. Note that, due to symmetry, no warping occurs at the midspan section.

Univers
ity of
Cap
e Tow
n
22
The second stage is to .assume that th~ rigid diaphragms are removed so that distottion of the cross-sections can occur. Thi~ is shown in Figure 3.2 (b), with the additionar vertical. deflection of each web denoted by adis· As a result, additional· twisting of the cross-sections take place and therefore also additional warping displacements (distortional warping) which are associated with bending in the planes of the flanges and webs -see Figure 3.2 (c). Again, due to symmetry, no longitudinal dispacements occur at midspan.
Lt_____ l-1 ~r_-=- _-_Jr
Ed•fl•<t•d '"moo Figure 3.2(a) Twisting of midspan cross-se.ction without
distortion
Figure 3.2(b) Additional distortion
t
twisting of midspan cross-section with ~..----...:::-
~ ............. ~
-::;?"/ ~/
~ /
Undeflected form of structure
Deflected form of structure with rigid transverse diaphragms all along the span
Deflected form of structure after ~moval of diaphragms between supports
Figure 3.2(c) Warping of the box-girder cross-section due to the midspan twisting components in (a) and (b) above.
The two components of warping displacements, described above and which occur in box-girders under torsional loading conditions, give rise to longitudinal normal stresses (warping stresses) when the warping displacements are prevented, for example' by symmetry at the midspan section or at a support where there is continuity.

Univers
ity of
Cap
e Tow
n
3.1.2
23
The longitudinal normal .warping stresses· can significantly incfease the total longitudinal stresses above those values predicted by simple bending theory. The authors state that distortion of the cross-section is the main source of warping stress in concrete box-girder construction, in those situations where distortion is resisted mainly by transverse bending.
· A third form of warping arises when a box-girder is subjected to bending without torsion. This type of warping, known as shear lag .in bending, results from shear deformation in the planes of the flanges and causes the longitudinal bending stresses to decrease away from the webs. This effect is more pronounced in configurations with wide side cantilevers and widely spaced webs and affects the effective widths of the flanges in bending.
Shear lag can also occur in box-girders subjected to torsion~ but this aspect is not taken into account by this analysis. See Figure 3.3 for an illustration of shear lag in bending.
A7r--a•IQ r----------1 !TB---'l' ·--1.V
J //I -·I
Key
c ,~::::::.-:-:::_- - -
undeflected form of structure
deflected form of structure
Figure 3.3 Shear lag in bending.
Methods of elastic analysis
The following methods of analysis are used to analyse the various structural action types and collectively make up the reconunended method.
Longitudinal bending and shear and St Venant torsion is analysed by using simple beam theory.

Univers
ity of
Cap
e Tow
n
3.1.3
24
·Torsional warping is dealt Wttfi by a method developed by Kollbrunner, Hajdi~S) and Heiligl2) from work originally done by Vlasov. ·
Distortional warping together with transv(1~~e bending analysis is by the beam-on-elastic-foundation analogy :J.
Shea1 l,g is dealt with by the method given by Schmidt, Peil and Born 1 . Note that this method was chosen after thi; m~thod presented by Maisel and Ro 11 in their tee hn i ca 1 report t 1 U J was found to be unsuitable - see Section 3.5.
Local bending effects due to loading between webs and on the cantilevers are determined by means of influence surfaces for plates.
The various calculated stresses found for the above effects are superimposed to give the total or combined stresses.
These individual methods are discussed in detail in the following sections.
Definitions for thin-walled members
The theories relating to torsional warping and St Venant torsion, were originally developed for thin-walled members. Criteria for the definition of thin-walled members, associated with each of these, are given.
Vlasov, on whose work the torsional warping theory is based, defines a thin-walled beam as a structure having the form of a long prismatic shell where the shell thickness is small when compared to any characteristic cross-sectional dimension and the cross-sectional dimensions are also small in comparison to the length of the shell. His criteria are as follows:
shell thickness s 0.1 width or depth of cross-section
and
width or depth of cross-section s 0.1 length of shell (7)
Maisel and Roll claim that the first criterion is often not satisfied by concrete boxbeams but that Vlasov's theory has nonetheless been used for ana~ysing them.
Kollbrunner and Basler(4), in dealing with the theory for St Venant torsion, give the following criteria for identifying thinwalled sections:
The first is: "There is less than 10 % error in calculating the shear stresses for a hollow cross-section with constant wall thickness, if the effective area of cross-section is less than one-fifth of the area enclosed by the wall centre-lines". This condition is usually not satisfied by concrete boxbeams. Note that the effective area of cross-section is the area of the crosssect ion without the side-cantilevers, i.e that of the closed section.
Univers
ity of
Cap
e Tow
n
3.1.4
25
The second criterion is: · 11 There less than 10% error in the calc~lated internal torsional moment if the effective area of cross-section does not exceed the area enclosed by the wall centre-lines 11
- a condition which is usually satisfied by concrete boxbeams. A more general form of the above criterion for cases where the wall thickness varies around the perimeter is given in 3.2.2.
Notation and sign convention
3.1.4.1 Notation
The notation used by Maisel and Roll, and also used here, is in accordance with an internationally agreed procedure for the selection of symbols. Where equations and algebraic expressions were taken from sources other than the Maisel and Roll report, these were adapted in order to maintain conformity.
A list of the symbols used here, together with the appropriate descriptions and definitions are given in the "Notation" section on page (viii).
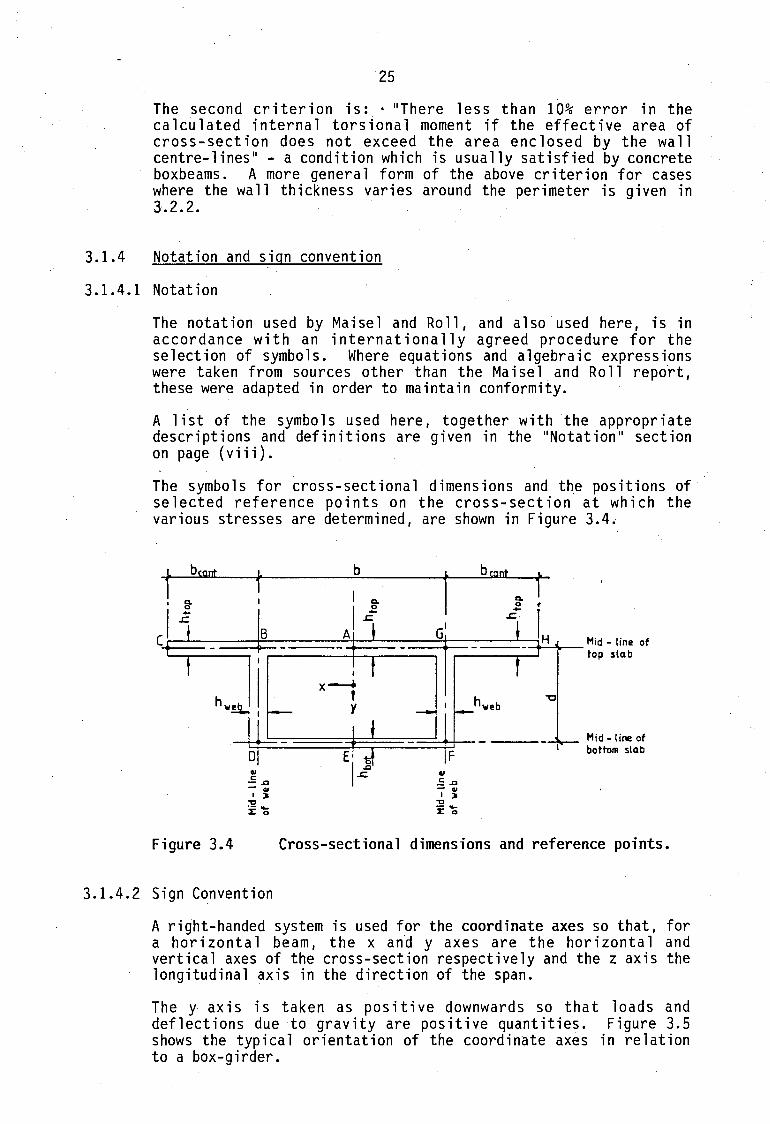
The symbols for cross-sectional dimensions and the positions of selected reference points on the cross-section at which the various stresses are determined, are shown in Figure 3.4i
L
1 bcant
I a. 0
cl -.c
Figure 3.4
L
1
B
0 ., .E ..c - ..
I )I
:2 .. :I: 0
3.1.4.2 Sign Convention
b
1 bront
lL I a. a.
I .l 0 t ...
IH .&; .
A G' Mid - line of ----top slab
i
x---t hweb y
Mid - line of
E· bottorR slab
IP ., .= ..c - .,
I )I "Cl --:I: 0
Cross-sectional dimensions and reference points.
A right-handed system is used for the coordinate axes so that, for a horizontal beam, the x and y axes are the horizontal and vertical axes of the cross-section respectively and the z axis the longitudinal axis in the direction of the span.
The y axis is taken as positive downwards so that loads and deflections due to gravity are positive quantities. Figure 3.5 shows the typical orientation of the coordinate axes in relation to a box-girder.

Univers
ity of
Cap
e Tow
n
26
Figure 3.5 Orientation of the Coordinate axes.
The position of the origin of the x and y axes within the crosssect ion is taken as the centroid for longitudinal bending analysis, as the shear centre for torsional warping analysis and as the geometric midpoint of the closed portion of the crosssection for the distortional warping analysis.
The origin and positive directions for the peripheral coordinate, Sper• is shown in Figure 3.6.
Figure 3.6
,;------Origin for co-ordinat1 Sper
. -!
71 -T--
i---Mid-lin• of wall
Origin and positive directions for the peripheral coordinate, sper·
Displacements and rotations are positive if they are in the directions shown in Figure 3.7 (a). The positive direction for distortional displacement of the cross-section under antisymmetric loading is given by Figure 3.7 (b).
Figure 3.7(a) Positive directions for diplacements and rotations.
•

Univers
ity of
Cap
e Tow
n
Figure 3.7(b)
27
~ositive distortional displacement under antisylilmetric loading.
A positive face of cross-section is a section on which the external normal is in the positive direction of the longitudinal or z axis. Similarly a negative face is one for which the external normal is in the negative direction of the z axis. Generally a positive face is used when analysing a section within the span and a negative face for analysing a section at a support.
The positive directions for internal stresses, stress resultants and applied or external loading are shown in Figure 3.8 below.
Figure 3.8
/s ~
~5}-T A lied loadin Internal forces
Vy
Positive directions for internal stress-resultants and external applied loading.
All stresses referred to in this thesis are internal resistive stresses arising from the application of the external loading.
The sign convention for normal stresses and shear stresses acting on a cross-section is as follows:
Normal stresses are regarded as positive if, for a positive face of cross-section, they act in the direction of the positive zaxis. Also, normal stresses acting in the negative direction of the z axis for a negative face of cross-section are positive. It thus follows that tensile stresses on a cross-section are always positive. ·

Univers
ity of
Cap
e Tow
n
28
Shear stresses are positive if foi a positive face of crosssection they act in the positive direction of sper, the peripheral coordinate.
Transverse bending stressei, associated with distortion of the cross-section and hence also with. the deflected shapes shown in Figure 3.1, are simply plotted on tDe tension face of the crosssection and therefore do not require signs.
Note that since the. stress resultants or internal forces are summations of .intefhal stresses, they must naturally follow the same signs. ·
In Figure 3.8 above it may be noted that the positive directions for the internal stress resultants acting on the positive face and those for the external loads acting on the member are the same.
3.2 ANALYSIS OF SIMPLE BENDING AND ST VENANT TORSION
3.2.1
The structural effects ignored in this analysis are torsional and distortional warping, shear lag and distortion.
Simple longitudinal bending and shear
In this section, the torsional components of external loading and their effects are not considered. For example, in horizontal beams, vertical loads are treated as if they are equally shared between webs, irrespective of their actual lateral position.
The bending moments and shear forces along the length of the beam are determined by simply using the basic equilibrium equations for statically determinate structures or in the case of continuous structures, any convenient method of elastic analysis - e.g. moment distribution or virtual work.
Once the bending moments and shear forces are known, the longitudinal normal stresses at the midlines are found from the following equation, assuming section is thin-walled and that cross-sections remain plane.
where
x,y =
(8)
midline normal stress in longitudinal bending
coordinates of a point on the mid-line, referred to the centroidal axes
moments of inertia of the entire cross-section about the centroidal x and y axes respectively
bending moments about the centroidal x and y axes
Univers
ity of
Cap
e Tow
n
29
In ·practice1 the borizontal loads ~hich give rise to bending about the y-axis, i.e. My, are generally small in comparison with the vertical loading a~d their effects are as such not considered here.
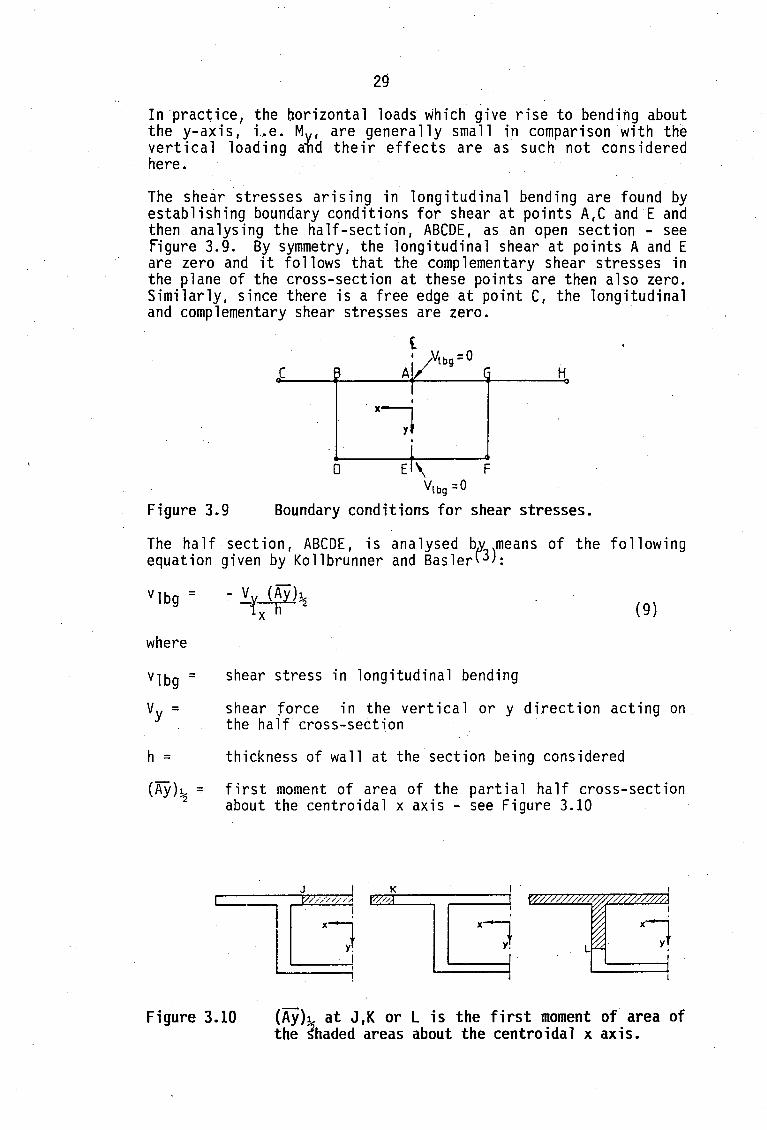
The shear stresses arising in longitudinal bending are found by establishing boundary conditions for shear at points A,C and E and then analysing the half-section, ABCDE, as an open section - see figure 3.9. By symmetry, the longitudinal shear at points A and E are zero and it follows that the complementary shear stresses in the plane of the cross-section at these points are then also zero. Similarly, since there is a free edge at point C, the longitudinal and complementary shear stresses are zero.
c H
0 El\ F Vtbg =O
Figure 3.9 Boundary conditions for shear stresses.
The half section, ABCDE, is analysed b,y3
)means of the following equation given by Kollbrunner and Basler\: :
where
h =
(Ay )~ =
(9)
shear stress in longitudinal bending
shear force in the vertical or y direction acting on the half cross-section
thickness of wall at the section being considered
first moment of area of the partial half cross-section about the centroidal x axis - see Figure 3.10
K l'///.A I
XJ Y.
x-:i I
Figure 3.10 (Ay)~ at J,K or L is the first moment of area of the shaded areas about the centroidal x axis.
Univers
ity of
Cap
e Tow
n
3.2.2
30
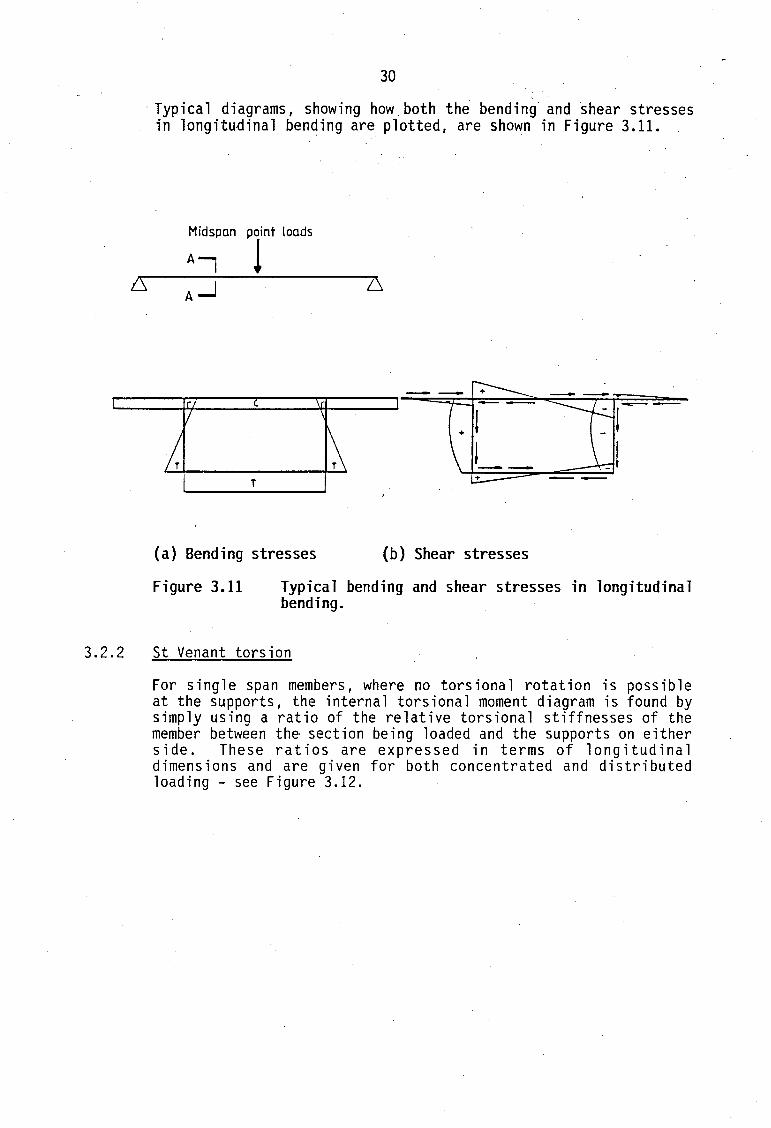
·Typical diagrams, showing how_ both th~ bending· and shear stresses in longitudinal bending are plotted, are shown in Figure 3.11.
Midspan
T
(a) Bending stresses (b) Shear stresses
Figure 3.11 Typical bending and shear stresses in longitudinal bending.
St Venant torsion
For single span members, where no torsional rotation is possible at the supports, the internal torsional moment diagram is found by simply using a ratio of the relative torsional stiffnesses of the member between the section being loaded and the supports on either side. These ratios are expressed in terms of longitudinal dimensions and are given for both concentrated and distributed loading - see Figure 3.12.

Univers
ity of
Cap
e Tow
n
. Tsvt
31
al -T -ext L
Uniformly distributed torsional loading text over portion .of span
~l I
Elevation of beam
+
I
Text
· . Diagram of torsional moment. T,.,
(a) Concentrated torsional loading, T01
I 0 $ z $ a3
a3
$ z $ (a3
+ a4)
a4 a4 as .. T as +- z - a
T .. text 1 4 t a4
( 2 - __ 3) svt l ext L a4
a,
I ____ '·_ .. _ --....
I Elevation of beam
+ ~
Diagram of torsional moment. T •••
(bl Uniformly distributed torsional loading '••• over portion ot span
(a3 + a4) $ z" L
a4 a3 +2
- text a4 l
Figure 3.12 Internal tors ion al moment diagrams:.

Univers
ity of
Cap
e Tow
n
32
In continuous members subjected to torsional loading, supports preventing torsional rotation also prevent the carry over of torsion into the next span and hence the internal torsional moment can be determined as for a discontinuous member. Supports not affecting rotation can be neglected in the torsional analysis altogether. The special case of elastically rotating supports is not considered in this analysis.
(It is important to note here that the internal torsional moment resisting the externally applied torsion~l loading at a section is made up of the sum of the moments due to St Venant shear stresses and to torsional warping shear stresses.)
The following expression, given by Kollbrunner and Basler(4), is used to find the St Venant shear stresses for a section that can warp freely:
Vsvt =
where
Vsvt =
h =
Tsvt =
Aenc =
T -SVt-2 Aenc h (10)
shear stress in St Venant torsion at the mid-line of wall
thickness of wall of closed portion of cross-section at the point considered
internal torsional moment in St Venant torsion at the section being considered
area enclosed by the mid-lines of the walls of the closed portion of the cross-section
For thicker-walled sections, the authors give the following equation for adjusting the values found in equation 10 above:
h T svt. Csvt ( 11)
where
S Vsvt = the increment in St Venant shear stress over half the thickness of the wall
Csvt = torsional moment of inertia of the cross-section in St Venant torsion
= 4 A2 j dspe~?g-
and where
~ dsper- = _b_ .Y. n htop
+ b hbot
+ 2d hweb
Sper = peripheral coordinate along the mid-line of the wall
= integral along the midline of the wall of the closed portion of the cross~section.

Univers
ity of
Cap
e Town
33
See Figure 3.4 for the notation of cross-sectional dimensions.
Typical St Venant shear stress diagrams for both thin- and thickwal led sections are given in Figure 3.13 below.
,- ___________ L, 3 vs vt + i ---
+ r--·--- - -- ----- - . -- .....--- I
+ l . 1 +
- -I
l 1 I . I
I + + . I . I I I I L --- - ~
.,. .,. L--------------~
(a) thin-walled (b)thick-walled
Figure 3.13 Typical diagrams for shear stresses in St Venant torsion.
From equations 10 and 11 above, a more refined form of the Kolbrunner and Basler criterion for thin-walled sections referred to in 3.1.3, which takes the effect of varying wall thicknesses around the perimeter of the cross-section into account, can be derived.
3 Vsvt.= h2 b + Vsvt 2Aenc[htop
and also
_b_ + hbot
2d hweb]
3Tsvt1Tsvt = [b(h3top + h3bot) + 2dh3webJ/3Csvt
where
(12)
( 13)
oTsvt = increment in Tsvt due to the antisymmetric shear stress distribution measured by ovsvt.
These equations can therefore be used to calculate the percentage errors in the shear stresses and the torsional moment due to the influence of wall thickness.
It is recommended that if the error in the torsional moment exceeds 10%, the section should be regarded as being thick-walled and that the value of Csyt should be modified by adding on a correcting factor8Csvt which is found thus:
= J h3 dsper I 3
= [(b + 2bcant)h3top + bh3bot + 2dh3webJ/3 where
(14)
bcant = breadth of cantilever

Univers
ity of
Cap
e Tow
n
34
3.3 ANALYSIS OF TORSIONAL WARPING
(Kollbrunner, Hajdin(5) and Heilig(2))
For the torsional warping analysis it is assumed that no deformation of the cross-section occurs. Shear lag in warping as well as a minor effect causing transverse normal stresses constant through the wall thickness, are not considered. ,
The theory of torsional(,w_arping presented here was developed by Kollbrunner and Hajdin ~J from work by Vlasov for thin-walled beams of both open and closed undeformable sections. Their method, in which the shear deformation due to torsional warping is taken into account, determines the longitudinal torsional warping stresses, torsional warping shear stresses and indirectly also the St Venant shear stresses at any section along the span.
Torsional warping occurs when a box-girder is loaded by torsional moments within the span as shown in Figure 3.14. Torsional warping stresses, which act normally to the cross-section in the longitudinal direction, arise when the warping displacements are restrained, for example by symmetry at midspan of a member or at a continuous or built-in end. These stresses vary around the perimeter of the cross-section as well as along the beam. As a result torsional warping shear stresses also occur in the longitudinal direction together with complementary shear stresses in the plane of the cross-section. Both the torsional warping stresses and torsional warping shear stresses are assumed to be constant through the wall thickness. Typical diagrams of torsional warping stresses and torsional warping shear stresses are shown in Figure 3.14.
A-. I HldsD<111 ccncenlT'ai'!!d lcrsi0t1al aonenr
- Text
loading
J reactive mom•nt at support
ZS: Text j I +
2.
A-,
.___ ____ __,j T e;r internal tors10t1 moments along ,.ion
+ ,_ -' +
.,,,arp1ng stresses 1 long•tudinal J warping shear strosses
Figure 3.14 Typical torsional loading, torsional warping stresses and torsional warping shear stresses.

Univers
ity of
Cap
e Tow
n
35
As stated before, the ·internal torsional moment resisting the ·externally applied torsional loading at any section is made up of
the sum of the torsional moments due to St Ven ant shear stresses and due to the torsional warping shear stresses. Figure 3.15 illustrates a typical distribution of torsional warping stresses along the span and the relationship between the torsional moments due to torsional warping shear stresses and the St Venant shear stresses. The longitudinally localized nature of torsional warping stresses is also apparent from this diagram. It will be shown later that the resultant internal torsional moment due to distortional warping shear stresses is zero since the applied torsional moment is only equilibrated by the sum of the moments from the St Venant shear stresses and the torsional warping shear stresses.
Mi!hllan amcenrra tea tors1ana1 mom1nr
TPXt .-. ------_____ __;:__;: _____ "';'lt.l -z-• '------------- T~rt
L Text .___ ____ __,-2-
longrrua1nal d1str1b..it1on
Figure 3.15 ·
Moment du• to St. Venonr
T~rt r Moment due to torsional Z J "IU"Olr>:J sh1nr ~t~su
....,...:__--=:.._--JL--.f----~--~-4-
~ 1.-----~-r
d 1>11s1on at sbeor stresses
Typical longitudinal distribution of torsional warping stresses and the relationship between the internal torsional moments due to torsional warping shear stresses and due to St Venant shear stresses.
The following definitions and expressions form the essence of the method proposed for the torsional warping analysis of box-girders:
The bimoment Btwr is a pair of equal and opposite moments in parallel planes which represent a warping force group with zero longitudinal force resultant and zero moment resultant by definition. Figure 3.16 shows a positive bimoment for the horizontal or x-axis.

Univers
ity of
Cap
e Tow
n
36
Figure 3.16 Warping force group and bimoment.
lt follows that bimoments cannot be found from the equilibrium conditions of a beam, since self-equilibrating quantities do not affect equilibrium. Therefore, the bimoments of torsional warping can only be found when the deformations representing angle of twist and the second derivatives with respect to the longitudinal coordinate are known. The torsional warping bimoment is given by the expression:
Btwr =
where
A =
f twr =
Wtwr =
J f twr Wtwr dA A
(15)
total area of the cross-section including the side cantilevers
torsional warping stresses
sectorial coordinate in torsional warping, referred to . the shear centre
The sectorial coordinate Wtwr is defined as s
Wtwr = J Per(aa - Csvt/ 2 Aenc h)dsper. 0
where
aa =
Csvt
Aenc
h
Sper =
(16)
the perpendicular distance from the shear centre to the tangent on the mid-line of wall at the point considered
is defined for equation 11
is defined for equation 10
is the wall thickness at the point considered
the sectorial coordinate along the mid-line of the wall - see Figure 3.6
Note that the term Csvtl2Afnc·h is included in the integrand for integration around tne wal of the closed section only - not the side cantilevers. Also, Wtwr can be regarded as being positive if anti-clockwise integration about the shear centre produces a positive quantity. See Appendix E for a typical diagram of the sectorial coordinate plotted around the cross-section of Model 3.

Univers
ity of
Cap
e Tow
n
37
The position of the shear centre is given by the expression:
dshc = b2 ~ [ (K13 + K14 + Kls + K15)/ Ki7 ] I ly (17)
where
dshc =· depth ~f the shear centre below mid-line of top slab
moment of inertia of the entire cross-section about the centroidal y-axis
b, bcantr d, htop• hweb and hbot are shown in Figure 3.4
K13 = ~ bhbot hweb(bhbot/3 + 3dhweb)
K14 = bdhtop (h2botf6 - ~h2web)
K15 = ~ht op hbot hweb(b2/6 +d2)
K16 = bcant htop hbot hweb(bcant + b)
K17 = bhweb(htop + hbot) + 2dhtop hbot
The torsional warping moment of inertia of cross-section Ctwr is defined as:
Ctwr = .J: w2twrdA (18) A
The torsional warping stresses and torsional warping shear stresses are formulated in terms of internal stress resultants represented by the bimoment Btwr and the torsional moment Ttwr respectively. The sectorial coordinate Wtwr and the various torsional moments of inertia of cross-section, Ctwr ,Ccen and Csvt• also appear in these equations which are given later on.
Algebraic expressions for Btwr and Ttwr• as well a? for the torsional moment due to St Venant shear stresses Tsvt and twist about the shear a1j~ 0z, are given in Tables 9 to 15 in the Maisel and Roll reportl/J for the various loading types and support conditions shown in Figure 3.17. These expressions are presented in terms of the applied torsional loading as well as the following:
and
c --ceo-Ccen - Csvt
(19)
(20)

Univers
ity of
Cap
e Tow
n
38
where
Ctwr = (21)
Ccen = central torsional moment of inertia of cross-section
= ~ a28 dA (22)
The functions for BtwrCz), TtwrCz), Tsvt<z) and 0twrCz) applicable to this thesis, i.e. for concentrated applied torsional loading with no warping restraints at the ends, are reprbduced in Appendix 8.
In the case of continuous box-girders, only supports providing full torsional restraint are dealt with - elastically rotating supports are not considered. Also, for the torsional warping analysis of continuous members, it is assumed that full warping restraint occurs at continuous ends.
Figure 3.17
text- ~ text- ~ ~ text-
~ ~ ~
I et 112 et 112 et a~
Concentrated torsional •o•ents
text text text
/5,. ~ ~ .. ~ ~ 6.
Uniformly distributed torsional loading over entire span
text-
~
83 I •4 I .s I
~ S~port providing full torsional rotational restraint but no vsrping restraint
~ Support providing full torsional rotational restraint and full warping restraint
' Uniformly distributed torsional loading over portion of span
Configurations of loading types and support conditions for which expressions for BtwrCz), TtwrCz), TsvtCz) and OtwrCz) are given.
The torsional warping stresses f twr are found from the following:
f twr = (23)
The form of this expression is similar to that of equation 8 for simple bending. In loadcases where eccentric loading is applied (torsion and bending), the longitudinal normal stresses ftwr due to torsional warping and f]bg due to simple bending are superimposed to give the total lonyitudinal normal stresses.
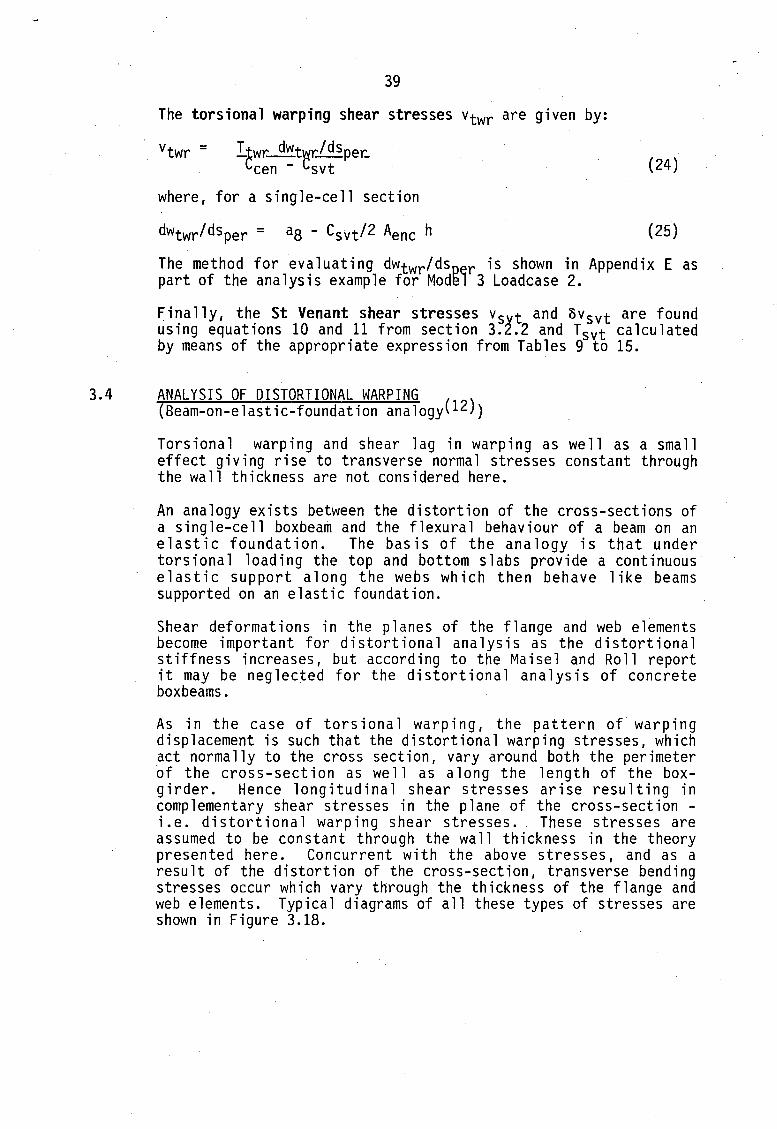
Univers
ity of
Cap
e Tow
n 3.4
39
The torsional warping shear stresses Vtwr are given by:
Vtwr = Ttwr. dwtwr./dspe~ Ccen - ~svt
where, for a single-cell section
(24)
(25)
The method for evaluating dwtwrldsper is shown in Appendix E as part of the analysis example for Model 3 Loadcase 2.
Finally, the St Venant shear stresses vs t and Svsvt are found using equations 10 and 11 from section 3.2.2 and Tsvt calculated by means of the appropriate expression from Tables 9 to 15.
ANALYSIS OF DISTORTIONAL WARPING (Beam-on-elastic-foundation analogy(12))
Torsional warping and shear lag in warping as well as a small effect giving rise to transverse normal stresses constant through the wall thickness are not considered here.
An analogy exists between the distortion of the cross-sections of a single-cell boxbeam and the flexural behaviour of a beam on an elastic foundation. The basis of the analogy is that under torsional loading the top and bottom slabs provide a continuous elastic support along the webs which then behave like beams supported on an elastic foundation.
Shear deformations in the planes of the flange and web elements become important for distortional analysis as the distortional stiffness increases, but according to the Maisel and Roll report it may be neglected for the distortional analysis of concrete boxbeams.
As in the case of torsional warping, the pattern of warping displacement is such that the distortional warping stresses, which act normally to the cross section, vary around both the perimeter of the cross-section as well as along the length of the boxgirder. Hence longitudinal shear stresses arise resulting in complementary shear stresses in the plane of the cross-section -i.e. distortional warping shear stresses. These stresses are assumed to be constant through the wall thickness in the theory presented here. Concurrent with the above stresses, and as a result of the distortion of the cross-section, transverse bending stresses occur which vary through the thickness of the flange and web elements. Typical diagrams of all these types of stresses are shown in Figure 3.18.

Univers
ity of
Cap
e Tow
n c
40
A J MldspC111 concentrated :::::£ hlrs1onal moment
"*-------,8.
loading and torsional moments
Applied mo1111nt c at midspan
) Reactive moment at support
warping stresses (longitudinal)
transverse bending stresses
warping shear stresses
Figure 3.18 Typical torsional loading, distortional warping stresses, distortional warping shear stresses and transverse bending stresses.
Note that there is a zero resultant internal torsional moment due to distortional warping shear stresses since the applied torsional moment is equilibrated by the sum of the torsional moments due to torsional warping shear stresses and St Venant shear stresses.
Figure 3.19 illustrates the typical longitudinal distribution of distortional warping stresses. It can be seen from the figure that the distortional warping stresses are less localized longitudinally than the torsional warping stresses are.
Figure 3.19
f'11dsoan concentrated tors1onat. mmn I! nt
I
I Distribution of distortional warping stresses along the span of the beam.

Univers
ity of
Cap
e Tow
n
41
The following definitions and expressions are used in the method· proposed for distortional warping analysis for box-girders:
The bimoment Bdwri defined before for torsional warping, is a pair of equal .and opposite moments, acting in parallel planes, which represent a warping force with zero longitudinal force resultant and zero moment resultant - see Figure 3.16. In the context of the beam-on-elastic-foundation analogy, the bimoment Bdwr is analogous to the bending moment in .the beam. Similarly, the distortion of the cross-section is analogous to the deflection of the beam. Diaphragms in the beam which prevent distortion but not longitudinal warping correspond to unyielding simple supports of the beam. End supports which prevent both distortion and warping are analogous to built-in supports of the beam.
The distortional warping coordinate wdwr is shown in Figure 3.20 below.
(_b +2bcant). bd \ b 4(1+K2s>
"-..
"\ bd 4 (1 +Kzs)
""- K2s bd
4 U+K2si
K25 bd
4 (1+K2s)
Figure 3.20 Distortional warping coordinate wdwr·
K25 is found from:
K25 = 3 + K --6-3 + K1 (26)
where
K5 = bhtop- [b + 2~cant:J3 dhweb (27)
K1 = bhbot-dhweb (28)
The distortional warping moment of inertia of cross-section Cdwr is given by:
(29)
with
(30)

Univers
ity of
Cap
e Tow
n
42
The frame stiffness Eifra is obtained from:
Ifra = (31)
where
K26 = 1 + 2b/d + 3(ltop_:t_!bot>l1webh'T2-(It0p + Ibot)fiweb T 6d ltopibot/bI web (32)
and
I top = (33)
I bot = (34)
I web = (35)
v = Poisson 1 s ratio
E = Young 1 s modulus of elasticity
The various stresses associated with distortional warping and transverse bending, as described, are formulated in terms of the bimoment Bdwr• the first derivative of the distortional warping bimoment dBctwrldz and the angle of distortion of the cross-section ~trb· The sectorial coordinate wdwr• ·the distortional moment of inertia of the cross-section Cctwr as well as material properties and terms based on cross-sectional dimensions, some of which are shown above, also appear in the equations which are given later on.
Algebraic expressions for Bdwr• dBdwr/,(94 and ~trb are given in Tables 16 to 20 in the Maisel and Roll J report for the various loading types and support conditions shown in Figure 3.21. These expressions are given in terms of the applied torsional moments Text• the frame stiffness Ifra• the modulus of elasticity E, Cdwr as well as trigonometric functions involving span length and loading positions. ·
The functions for Bctwr(z), dBdwr(z)/dz and ~trb(z) applicable to this thesis, i.e. for concentrated applied torsional loading with no warping restraints at the ends, are reproduced in Appendix C.

Univers
ity of
Cap
e Tow
n
43 text- ~ text-
6. ~·
81 82 el
Concent.rated torsional moments
text text
6. ~ ~ .. ;-,;:
Uniformly distributed torsional loading over entire span
~ e2
~
text-
~ ~ Support providing full torsional rotational
restraint Out no warping restraint
e3 ,. e4 j e5 j ~ Support providing full torsional rotational restraint and full warping restraint ;-,;:
Uniformly distributed torsional loading over portion of span
Figure 3.21 Configurations of loading types and support conditions for which expressions for BdwrCz), dBdwrCz)/dz and ~trb(z) are given.
The distortional warping stresses fdwr are found using the express ion:
f dwr = ~~r~dwrdwr (36)
Again, as in the case of equation 23, the form of the above expression is similar to that of equation 8. In loadcases where eccentric loading is applied (bending and torsion), the longitudinal normal stresses f dwr due to distortional warping and f lbg due to simple bending are superimposed to give the total longitudinal normal stresses.
The distortional warping shear stresses vdwr are given by the fallowing:
(37)
where
K25 is as defined above
K28 is given for various pQ~Qts on the cross-section in Table 2 of the Maisel and Roll reportl J which is reproduced here in Appendix 0. The equations for K28 are written in terms of the following:
and
b + 2bcantb (38)

Univers
ity of
Cap
e Tow
n
44
Atop = b_htop
Acant = bcant htop
Aweb = dhweb
A bot = bhbot (39)
Finally, the transverse bending stresses f trb are determined by means of the following:
f trb = (40)
where
Mtrb = transverse bending moment due to the loading causing distortion
h = wall thickness
f trb = transverse bending stress at the surface of web or flange elements
The transverse bending moments due to the loading causing distortion are:
at the top of the left-hand web
Mtrb, B = Llf ra-11ttb-2 ( 1 + K3oJ
and at the bottom of the left-hand web
Mtrb, D = -.!3QLlfra ~trb-2t 1 + K3o)
where
and
(41)
(42)
(43)
~trb is the distortional angle (a measure of the distortion of the cross-section) found from the expressions given in the tables referred to above.
Mtrb B is positive for positive ~trb which gives compressive transverse stresses on the outer surfaces of the top flange and webs at B. Mtrb,D is negative for positive ~trb and gives tensile transverse stresses on the outer surf aces of the web and bottom flange at D. Note that B and D are reference points on the crosssection as given in Figure 3.4. Figure 3.18 above shows a typical transverse bending stress diagram.

Univers
ity of
Cap
e Tow
n
3.5
45
ANALYSIS OF SHEAR LAG (Schmidt, Peil and BornCll))
The structural effects not considered. here are shear lag in torsional and distortional warping.
Although shear lag can arise in torsion, Maisel and Ro11(7) only consider it for the case of bending without torsion. A me,tho.d of analysis for shear lag based on the work of Reissner,lOJ is presented in their report. Reissner uses the principle of minimum potenti~l energy to obtain expressions for the longitudinal bending stresses in a doubly symmetric rectangular box-section (i.e. without side cantilevers) with uniformly distributed loading over the full length of the span. The expressions cover the cases for the stresses at the midspan section of a simply supported member and at both the midspan and support sections of a member· built in at both ends.
From the above, it is clear that shear lag is not dealt with adequately by this method, especially with respect to the presence of side cantilevers, but also in terms of a wider range of load configurations, for example point loads or uniformly distributed loading over a portion of the span only. Maisel and Roll recognise the limitatdQns and make reference to a study performed at Imperial Collegel J for shear lag in steel box-girders with side cantilevers. Unfortunately this literature was not available and consequently it was necessary to find another method to deal with this aspect of the analysis.
Schmidt, Peil and Born(ll) in their paper, give a practical method for determining the distribution of bending stresses for varying flange and cantilever widths. A brief description of the method follows.
The cross-section of the box-girder is divided into a number of individual flange elements of width ~as shown in Figure 3.22 below.
b' l b' L
1 r 1 1 I I
I
I I
I
I I I
I
I I
I I
L b' b' ~
Figure 3.22 Division of cross-section into flange elements.

Univers
ity of
Cap
e Tow
n
/
46
The basic equation governing the ratio of the magnitude of the longitudinal bending stress at the edge of a flange element to that at the web for symmetrical loading conditions (no torsional loading), is given by:
~lbg~ = 1,25( Af - 0,20) or 1,25( As - 0,20) f'lbg~ (44)
where
f'lbg(edge)
f 1 lbg(web) =
A f ,"A s =
= longitudinal bending stress at the edge of the flange element
longitudinal bending stress at the web
factors dependant on the shape of the bending moment diagram (type F or S) and the ratio of span length to flange width, L/b: See Figure 3.23.
Values for A f and ?.. s for use in the above equation can be found from the graphs presented in the following figure:
1,0
o:g
0.8
0,7
1
0,6
0,5
>.. O,L
F' 0.3 As 0.2
0.1
0
~'
AF v .., v ,,,. " "
~ ; v / ' ,/
/ .,,.,,, ......... v / ,/
Lib< 2: / / '/ ... / ,/ ./ o.1s L1b'
/ .... ,,,. ... v .........
... 0.09 Lib' -........ ........
r:...-0,08 L/b'
2 .. 3 4 5678910
,..!..+-
:o ~
4 V'I; ,..1" .... v
.... ~ .. ;
.... IP
1
L.--'~
.... v
>..s '
·~ 1, -~::::: -----
0
9
8
7
.6
s
_.. . .,,,,. .n /
I
-· u,
-. -
{!,
-. u,
-. u,
0
I.
3
2
15 20 30 l.O so 100 -. Lib'
Figure 3.23 Graphs for eva 1 uat ion of .A f and A. s.
The nature of the bending moment diagram along the longitudinal axis must be taken into consideration when selecting values from the above graphs. For this purpose, bending moment di a grams are classified as type F or type S depending on their form which is governed by the loading configuration and by the support conditions. The correspondence of moment types to the diagrams as well as the variation of A. f and 'As along the span is illustrated in Figure 3.24 below.

Univers
ity of
Cap
e Tow
n
47
AF 0
0
t1F+ L +tFt
Figure 3.24 Moment types and
0 s
l +ts+1s+ j L 1
associated ft. values.
o,s ~f ~ 0.15
~ ' '"Hmax
For continuous beams the spans are divided into portions within which specific moment types occur. Hence appropriate values of ~ and therefore also the shear lag effect can be determined at any point along the span of such members. A typical example of the method of dealing with a continuous beam is given in Figure 3.25.
Feldbereich StUtz- Feldbereich Endfeld bereich lnnenfeld
T ....,....
1, '2 X 1
Figure 3.25 Derivation of A. values for continuous beams.
The variation of the longitudinal bending stresses from the edge of a flange element to the web (i.e. transversely) is close to a fourth degree parabola, the equation of which can be written in terms of the stress values at the webs. The form of the equation is:
y = ax4 + c (45)
and is illustrated in Figure 3.26

Univers
ity of
Cap
e Tow
n
48
y =axZ. +c Ill
(~ ......... -::-:_=::-_ - - - - ~ 1·4 --1
I
Figure 3.26 Function for variation of longitudinal bending stresses from edge of flange element to web.
Since the ratio of the longitudinal bending stress at the edge_ of a flange element to that at the web is known from equation 44 -above, the values of c and a can also be determined in terms of f'lbg (top web) or f'lbg(bot web) as follows:
At x = 0, y = c = f 1 lbg(edge) = f' lbg(web).1,25(_A- 0,2)
At x = b, y = ab4 + c = f'lbg(web)
from which a is found:
a= f'lbg(web)[ 1 - 1,25(~ - 0,2)]/b4
The longitudinal bending stresses f'lb can therefore be calculated in terms of f' lbg (top web) or fglbg(bot web) for any point across the flange.
A typical diagram of the longitudinal bending stresses expressed in terms of f'lbg (top web) and f'lbg(bot web) is given in Figure 3.27.

Univers
ity of
Cap
e Tow
n
Figure 3.27
49
.,,,....,.-,..... I ----- I I ' .. ,__ ,
---- : : -----1 .I I ,, I I I I '
: : !
I I
~I I I
..._' __ ----+~-----
83.98 je.s~ I I I I I I I I I I I I ----•
48.71 *~ii : ; ~ I . Ji ____ j 0
--- i
Dimensions shown are for MODEL 1
Typical longitudinal bending stress diagram, in terms of f'lbg (top web) and f'lbg(bot web), taking shear lag into account.
The values for f'1b (top web) and f'1b (bot web), given that the moment due to the aiplied loading is kWown for th'e section being considered, can be determined on a trial and error basis by using the equilibrium conditions for longitudinal bending.
The first equilibrium equation is that the sum of the axial forces arising from the longitudinal bending stresses must be zero in a beam without axial loads.
Ntop flange + Ntop webs + Nbottom flange +Nbottom webs = 0 (46)
where
Ntop flange =
Ntop webs =
Axial force due to bending stresses in the top flange
Axial force due to bending stresses in the portions of the webs above the neutral axis
Nbottom flange = Axial force due to bending stresses in the bottom flange
Nbottom webs= Axial force due to bending stresses in the portions of the webs below below the neutral axis

Univers
ity of
Cap
e Tow
n
50
The second equation is that the resisting moment due to the longitudinal bending stresses must equal the applied moment.
Mapplied = Mtop. flange +Mtop webs +Mbot flange +Mbot webs (47)
where
Mapplied =
Mtop flange =
Mtop webs =
Mbot flange =
Mbot webs =
Applied bending moment
Resisting moment due to bending stresses in the top flange
Resisting moment due to bending stresses in the webs above the neutral axis
Resisting moment due to bending stresses in the bottom flange
Resisting moment due to bending stresses in the webs below the neutral axis
Equations 46 and 47 may be written in terms of the two variables f 1 1b (top web) and f'1b (bot web) and solved by trial and error. The gexample of shear la~ analysis given in APPENDIX E illustrates the trial and error procedure. In this example the distribution of stresses between the flange edges and webshare taken as linear with a single intermediate point on the 4t degree curve as a simplification for solving the equilibrium equations.
Schmidt et a1(ll) also present equations for dealing with shear lag under conditions of torsional loading, but since Maisel and Roll do not treat this aspect, it is not discussed here.

Univers
ity of
Cap
e Tow
n
51
4 ANALYTICAL RESULTS
4.1 GENERAL
The four Perspex models, described in Chapter 2, were each subjected to four different loadcases in order to check the accuracy of the proposed analytical method for simple loading· configurations. These loadcases, shown in Figure 4.1, were selected to, as far as possible, individually examine the accuracy of analysis for the different structural actions. In this context it is possible to isolate shear lag in bending as well as the torsional warping action but the distortional warping action cannot take place without the torsional warping action. Loadcases 1.1, 2.1, 3.1 and 4.1 focus on simple bending together with shear lag in bending; loadcases 1.4, 2.4, 3.4 and 4~5 isolate torsional warping effects without distortion by making use of rigid diaphragms at the load positions and loadcases 1.2, 1.3, 2.2, 2.3, 3.2, 3.3 and 4.2 include actions for torsional warping as well as for distortional warping. Loadcase 4.4 includes all action types, i.e. torsional and distortional warping together with simple bending and shear lag in bending. Loadcase 4.6 is the same as loadcase 4.4 except there is a diaphragm at the loaded section.
Examples nf typical analyses, done in accordance with the theory given in Chapter 3 for the analytical method, are shown in Appendix E. These are for Model 1 Loadcase 18 (simple bending and shear lag in bending) and for Model 3 Loadcase 2 (torsional and distortional warping), which between them cover all aspects of analysis.
4.2 SECTION PROPERTIES
The cross-sectional dimensions for the as-built models were given in Figure 2.2 and the main cross-sectional properties used in the different analyses are given in Table 4.1.
Note that the position of the origin of the x and y axes within the cross-section is taken as the centroid for longitudinal bending analysis, as the shear centre for torsional warping· analysis and as the geometric midpoint of the closed portion of the cross-section for the distortional warping analysis.
4.3 LOADING CASES
The applied loading and support conditions constituting the various loadcases are shown in Figure 4.1. Support conditions are the same throughout, i.e providing full torsional restraint with no warping restraint. Load magnitudes were selected for each loadcase in order to give a suitable range of strain readings.

Univers
ity of
Cap
e Tow
n
52
Model 1 Model 2 Model 3 Model 4
A 4.554.103 mm2 3.368.103 2.771.103 2.633.103
Aenc 15.864.103 mm2 9.260.103 4.168.103 3.386.103
Ixx 13.254 mm4 3.614.106 0.792.106 0.511.106
Ye 93.30 mm 58.74 27. 77 23.34
Csvt 11 861.103mm4 4 763.103 1 565.103 1 070.103
Ctwr 2 069.106mm6 1 355.106 404.106 292.106
Cdwr 9 869.106mm6 2 433.103 390.106 238.106
If ra 1. 79 mm2 2.04 4.20 4.27
Table 4.1 Cross-sectional properties for models.
4.4 DIAGRAMS FOR COMBINED STRESSES FROM ANALYSIS
The diagrams for the combined or total stresses, derived from the analyses, are shown in Figures 4.2 to 4.18 for all the loadcases. The diagrams typically show the various stress types, i.e longitudinal normal, shear and transverse bending, for both the midspan (z = 600 mm) and quarter-span (z = 300 mm) sections and are again used in Chapter 5, omitting the stress values for more clarity, as a background for plotting the experimentally derived stresses as points.
The method of the construction of the combined stress diagrams from the various structural actions as well as the use of the sign convention, can be seen in the analysis examples given in Appendix E. .

Univers
ity of
Cap
e Tow
n
53
MODEL 1 MODEL 2 MODEL 3 MODEL 4 128. 0 828. 0 N
t-z . l2x12B.ON
ti '6.
12B.Ou2B.O" 108.0uOB.O N BB 0 N 68 0 N . u· 12 x 128.0 N 12 x 108. 0 N ,2 x 68.0 N
ti '6. ti L ti L 1/2 p ~ ~ ~
LOADCASE 1. 1 B LOADCASE 2.1 LOADCASE 3.1 LOADCASE 4.1
t-z 1BB.Ou68.0 N 188.0u68.0 N 108.0UOB.O H 881rN
-17.98 NII -17.98 NII -11.6\l NII -9.45 Nit
ti L ti L ti L ti L
~ ~ ~ ~ LOADCASE 1.2 LOAOCASE 2.2 LOADCASE 3.2 LOAOCASE 4.2
t-z t68.0u68.0 N t68.0u68.0 N 104011
68. 0 N
t
68.0 N .
L 17. 98 Hit - 17.98 Nil 11. 60 NII - 3.65 Nol
6 L 6 6 ti L 6 6
~ ~ M M LOADCASE 1.3 LOADCASE 2.3 LOAOCASE 3.3 LOADCASE 4.4
168.0 .... 68.0 N 68. 0 H 68. 0 N w Oiaonre9" at L_ -g-Oi apnr-age at
,-z loaoea section
168. 0 N 168. 0 N
-Y--Oill!lhraQlll at loaded sect! on
108.011108.0N
--U-Oia¢trag.~ a~ JoeOl!d s~tion I olldea sec ti on
17. 98 H•
~ LDADCASE 1.4
Figure 4.1
17. 98 Hit 11. 60 Ntl - 7.30 II•
M ~ ~ LOAOCASE 2.4 LOADCASE 3.4 LOAOCASE 4.5
68. 0 N
L 68. 0 N Di eonregm et t Joeaea section
- 3.65 II~
L D
~ LOADCASE 4.6
Loadcases for which models were tested and analysed.

Univers
ity of
Cap
e Tow
n
0,576
a)
0,441 I 0,441
. 0,432:
o.s~6 I o,576
Longitudinal stresses at midspan (m1dtines)
C) Transverse stresses at midspan
o. 029 I o. 029
0 042 r------_
0,056
'
-0.038 I
0,054 t ··----y-··
I
0,01.7 I 0,01.7
z = 6 o a- I z = 6 oa +
e) Shear stresses at midspan
54
FIGURE 4.2: Hodel 1 Loadcase 1 B
0,266 .
b) Longitudinal stresses at ~ -span ( z =300 mm) fm1dhnes I
d) Transverse stresses at ~-span
4
0,056
lz:300mmJ
0,029
0,04.2 r---___
0,016
f) Shear stresses at ~ - span ( z = 300 mm)
Combined stresses from analysis MPa ·

Univers
ity of
Cap
e Tow
n
0,312
a) Longitudinal stresses at midspan
0,87S
C) Transverse at midspan
0,782
stresses·
-0,075 -0,07S
QtXJ4
e) Shear stresses at midspan
55
FIGURE 4.3: Hodel 1 Loadcase 2
0,033 0,014 ·I
I
.1 I
I I
-0,014
0,037 0,037
-0,033
b) Long!fudina/ stresses at ~ -span (z =300 mm}
O,Sl.2
0,212
0,1.BS
d) Transverse stresses at ~-span
4 (z:300mmJ
0009 0.01S O,O!S 0009 · -ooq; -0040 ·
-0,01.8 -0,01.4 ,Ot.8
I -{), 041-0.0 1
I
-0,075 -0,066 -0,0lS
-0,024 -0,021.
f J Shear stresses at ~-span fz=300mmJ
Combined stresses from analysis MPa

Univers
ity of
Cap
e Tow
n
0.033 0,011,
0,014
-0,037 -
-0,037
-0,014
-0,014 -0,0.JJ
~ 0,037 • 0,037
a) Longitudinal stresses at midspan 0,51,3
0,212
0,485
c) Transverse stresses at midspan
I 0. 025 0:020 0, 025
0,029 r----+--• 0,029
-O,C13 -0.0Z
Q,CJO d,030
0,020 0,007
0,020
e) Shear stresses at midspan
FIGURE 4.4: Hodel 1
:--
56
0,203
Loadcase 3
0,339
b) Longitudinal stresses . at ~ -span (z =300 mm)
0,642
0,Si3
d) Transverse stresses at ~-span
4. f Z= 300 mm J
-0.027 -0,001 I
z = 300- I Z: 300+
f) Shear stresses at ~ -span I z =300 mm)
Combined stresses from analysis : MP a

Univers
ity of
Cap
e Tow
n
(
a) Longitudinal stresses at· midspan
C) Transverse stresses at midspan
00~1. r o 026J 0,002 . .LC=-< If L-' 0,002 .
·-I I I I I I
0.015 0,015'• I jt-10. 019 0, 019)-1
I I I
I I I I
. o 01.1 'to 01,e 1
( --- outer fibre slre.c;ses)
e} Shear stresses at midspan
57
-0,063
FIGURE 4.5: Hodel 1 Loadcase 4
b) Longitudinal stresses at ~ -span (z =300 mm)
d) Transverse stresses at ~-span
4 (z:300mmJ
(0,004 ) Bl 0,002~ - 0,026
-0 049 --r-6,ossJ
{-0, 719) I O.tt. 0,079 ~0,027}.
-0, 049 ,.059)
0,021 ( 0,022)
z = 300_, z = 300+
f} Shear stresses at ~ -span ( z =300 mm)
Combined stresses from analysis MPa

Univers
ity of
Cap
e Tow
n
:: ·.
-0,740
a) 1,025 1,01/J 1,025
Longifudihal. stfesse°S'at midspan v '-.J
1,338 1,338
c) Transverse stresses at midspan
0,092
0,089
0,056 0,056
0,080
o,m V! o. 109 I . 0,109
z = 600- z = 600+ e) Shear stresses at midspan
58
-0,312 -0,312.
0 608
b) Long!fudinal stresses at % -span
'd) Transverse stresses at ~-span
4
( z = 300 mm J
0,056 0,072
!
I -0056 "---0,10!J
O/(J37 -0,037
0,109
f} Shear stresses at ~ -span
FIGURE 4.6: Model 2 Loadcase 1 Combined stresses from analysiS MPa

Univers
ity of
Cap
e Tow
n
0.205 0.222
0,22
a) 0,564
Longitudinal. stresses at midspan
1,242~
0,490 I ~ 0,490
·0,091
C) Transverse stresses at midspan
0.072
1,242
0,924
59
c:======-10F.0~1~7:o=';.._~~--=::;;;;0T,o~":=::=====o~.039 o.o" o.o" -0,039
-0,205
0,564 0,062
b) Longitudinal stresses at ~-span
0,041
0,562
~0.041
0,418
d) Transverse stresses at ~-span
I,.
( z = 300 mm J
0,006 0.0fO_IJ.058 -1)058 0010
-O.aJ2 -0,080
-0,082
0,006
-0,153 - I -0,1S3
~0,144 -Q.o.s;r; - - - - -1.o, 137
-0,058 I
0039 0,021 I
0,021 0,039 -0,048 -0,048
I o; m
z:·6oo-I Z:600+
e I Shear stresses at midspan
FIGURE 4. 7: Hodel 2 ·Combined
f) Shear stresses at % -span
Loadcase 2 stresses from analysis MP a

Univers
ity of
Cap
e Tow
n
-0.017 0017
'-0,039 -0,01, 0,017
qOd2 ~==---==:::!J-0,062
0,062 -q062
a/ Longitudinal stresses at midspan
0,562
. 0,418
C) Transverse stresses at midspan
0037 0,043 0039
\ I 0,043
I 0,037
-(),010 ':0.017 -0,017 -0,010
0,036 -- --- 0,036
0,020 \ I 0,020 i
-0,064 0,049 0,064
e) Shear stresses af midspan
60
0.250 0,242 0,039
0,242
-(),250
0,635
b/ long1fudinal stresses af ~-span
0,473
0,088
d) Transverse stresses at ~-span
I,.
(Z= 300mmJ
0,065
-0,032
-0/)67
0,017
I
z = 300- il= 300+
1, 799
0.123 0032 0,003 / (
f/ Shear stresses af % -span
FIGURE 4. 8: Hodel 2 Loadcase 3 Combined stresses from analysis MPa

Univers
ity of
Cap
e Tow
n a) Longitudinal stresses at midspan
C) Transverse stresses at midspan
(0,044) -----------
0,041
I I
0,02.sl I (0,03411
I I
11 I I I 'o.02s I I <0,0341
I I I
- - - - {Outer fibre stresses J e) Shear stresses at midspan
FIG.URE 4. 9: Model 2 ·
61
,131
b) Longitudinal stresses at ~-span
d) Transverse stresses at ~-span
4
lz=300mmJ
(-0,00 7)
- 0 ,032 -0,009 ----(-0,046) - (-0,0861 -
(-0,1701
,0961 I 1(-0, 118) I
(0,034)
r· ,I
I I I (0, 049) I I0,045 I I I
O,OO! (0,002)
I
Z:300- ll=300""
f) Shear stresses at % -span
Loadcase 4 ·Combined stresses from analysis MP a
;

Univers
ity of
Cap
e Tow
n
I -1,411,
I . -f,1,11,
-1 ()()1 - 0,913------
1-1, 173) 2~60 ~--+'-----+--......;....~--~
1,807 1,770 1,807
2,3M .. ----;,, 1 9a~7"'' ... 2 ~60 (2,646) 12,646)
62
-0,571,
-o,-m f-0,696)
1 017
. fl, 139)
'"':
a) Long/fudinal stresses at midspan b) Longitudinal stresses at i -span (z = 300mm)
c) Transverse stresses at midspan
0.103 I ~I
0,123
0,103
0,123
e) Shear stresses at midspan
z = 600-1 z = 600+
~ - -(Outer fibre sfrtJsses J
FIGURE 4.10: Hodel 3
d) Transverse stresses at %- span
4 (z:300mmJ
0,103 0,131
0,182 f) Shear stresses at % - span
(z =300 mm J
Loadcase 1 Combined stresses from analysis MPa

Univers
ity of
Cap
e Tow
n
.63
- 0,013 0,()13 0,031
0,621
a) longitudinal stresses at midspan
0,897
c) Transverse stresses at midspan .
0,107
&,136
I
0,893
z = 600- z = 600+
e) Shear stresses al midspan
0,038
T 1
0.013
0,068lf=l==---....:=~::.-0,068 0,068 -0,068
b) longitudinal stresses al ~ - span (z = 300mm)
0,029 0,012
0,0 'I ]"°" 0. 029~~-=='==-----=~dl0,011
O,Off 0,029
dJ Transverse stresses at !,,-span
4 f Z= 300 mm J
-0,066 -0.010
-~073 -0.073
f} Shear stresses at % - span (z =300 mm J
F/6URE. 4.11: Hodel 3 loadcase 2 Combined stresses from analysis MPa
I

Univers
ity of
Cap
e Tow
n
64
-0013 0.013
-0,031 0,013 0,013
~ 0.067 0,067
-0,067 0,067
a) Longitudinal stresses at midspan b) Longitudinal stresses at ~ -span (z = 300mm)
o.m~ 1'029 o.oA~:;=-----==~=-0.011 0, 011 0,029
0029 0,012
C) Transverse at midspan
0/)57 0.008 00!4
0,028
0,029 ••
0,037
0,059
stresses
,0060 OOS7 I 0011.
I 0,028
I 0,029
I 0,037 I
0,059
e) Shear stresses at midspan
FIGURE 4. 12: Hodel 3
O.OJ8
dJ Transverse stresses at ~-span
4 ( z = 300 mm J
0,105 I
-02r.1 I
I
z = 300-, z = 300 ...
f) Shear stresses at ~ - span (z =300 mm)
Loadcase 3 Combined stresses from analysis MPa
0.(138

Univers
ity of
Cap
e Tow
n
a) longitudi'na/ stresses at midspan
C) Transverse stresses at midspan
(0,059)
.Lt 0,071) ---- 0 058_.( ____
I
I I
0,037, 10.oss1-,
I
o.os9 ; (0,070)
- - -- {Outer fibre stresses J
(0,011 '\..
I
~.037 ~0.~51 I
e) Shear stresses at midspan
65
0,166
b) longitudinal stresses at ~ - span (z = 300mm)
dJ Transverse stresses at ~-span
4 <z=300mmJ
I (-0, 019)
/0,039)
0038
(0,072)
L-.--L:L...----f::=:::::=::::::=:L.JI ,Olf
(-0,018)
I
z = 300-1 z = 300+ I
fj Shear stresses at % -span (z =300 mm J
FIGURE 4.13: ./1odel 3 Loadcase 4 Combined stresses from analysis MPa

Univers
ity of
Cap
e Tow
n
66
-1, 106 -1. 106
-0,761
(-0,9571 1,90J....C::::~-=::._...:::~~'--~-+-~.....::..~~~~~=
1, 907 ,,,,,----,---,, 1, 907
2 1.Bl) L/' ft, 640 I ',_J (... . (2,187}
. .
a} Longitudinal stresses at midspan
C) Transverse stresses at midspan
e)
0,080 0,080
0,115
-0,702
v 0,146 0,146
z = 6 0 o- z = 6 00 + Shear stresses at midspan
- - - - - (Outer fibre stresses)
FIGURE 4.14: Hodel 4
0,115
-0,t.M -0.446 .
-o 446
( -0,565)
0,815
0815 ~--------
(.0,933)
b} Long!fudinal stresses at ~ - span lz=300mm)
d) Transverse stresses at %- span
4 (z:300mm)
0.080 I ~I 0115
0,102
fJ Shear stress.es at I z = 300 mm)
~ -span
Loadcase 1 Combined stresses from analysis MPa
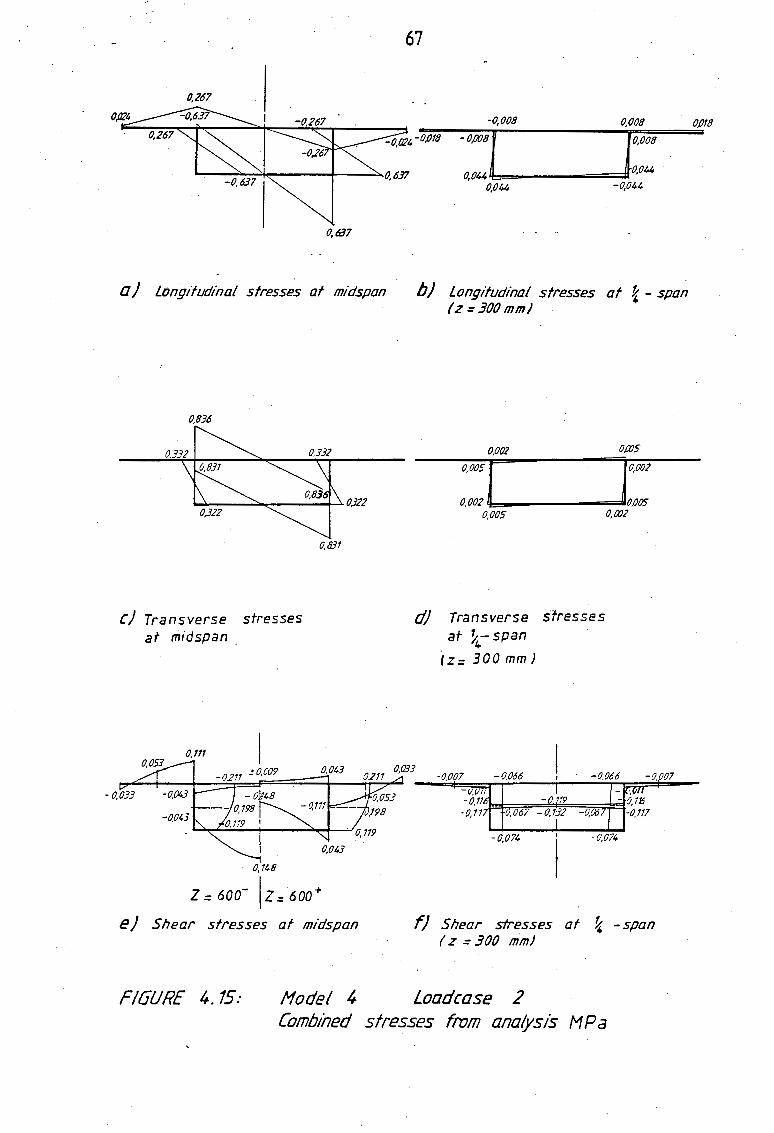
Univers
ity of
Cap
e Tow
n
0,267
a J Longitudinal stresses at midspan
0,836
c) Transverse stresses at midspan .
0,148
0,831
z = 600- lz= 600+
e J Shear stresses at midspan
FIGURE 4. 15: Hodel 4
67
-0,008 0,008
- 0008l !0,008 0,~441!:=----==;;;:s~0,044 .
0,044 -0,044
b) Longifudinal stresses at ~ - span I z = 300 mm)
0,002 OflJS
0,005! 1°'@2
0,002 'l!=~-----==110,005 0,00S 0, crJ2
d) Transverse stresses at ~-span
I,.
iz:300mmJ
-0,074 -0,074
f) Shear stresses at ~ -span ( z = 300 mmJ
Loadcase 2 Combined stresses from analysis MPa
0/)18

Univers
ity of
Cap
e Tow
n
-0.226 -0220
0,1;24"----t>,390 (0,453 J (0, 449 J
a) longifudindl stresses at midspan
0.001 0 002
0,002 [ ] 0,001
0,001\:::===------~-0·002 0,002 0,001
C) Transverse stresses at midspan .
68
I . ,
0,{,16--o:s~~lf (0,5821 ' I_.'-'
(0,618} .... ,
II 'o,,962
(1,068J
b) longitudinal stresses at t - span (z=300mml
0.323
0,129 ~ 0.129
~~ ~ I .0,124 0,124 ~
0,!21
d) Transverse stresses at ~-span
4
lz=300mmJ
. -0.013-0.01 -5,0!J
0,014~---=""1---"-'----'
o.o43 rz=300mmJ _:.__---0,013 0,013
0,059 '0.029
r z= Joo+mmJ
. e) Shear stresses at midspan f) Shear stresses at ~ -span
(- - - - - Outer fibre stresses J
FIGURE 4 .16: Hodel 4 Loadcase 4 Combined stresses from analysis MPa

Univers
ity of
Cap
e Tow
n
a) longtfudinal stresses at midspan
c) Transverse stresses at midspan
(0,056} ----- - -- ----(0.010} 0,046 ---------
I 0,026
J
( 0, 044)
0 046 - (0,056)
- - - - (Outer fibre stresses I
(0,010) -------I
!J,028
r.044}
e) Shear stresses at midspan
FIGURE 4.17: · Hodel 4
69
0,141.
0,146
b) longtfudinal stresses at ~ - span f z =300 mm)
d) Transverse stresses at ~-span
4 (z:300mmJ
0.026.
j (0,02.4-0,058) L--0,026--
(-0,046 I II 0,060
l..!.:;~~L...C~Q2fJ.~~-~-__i!
I
Z = 300-1Z:300+
f) Shear stresses at ~ -span ( z = 300 mm)
Loadcase 5 Combined stresses from analysis MPa

Univers
ity of
Cap
e Tow
n
·-0.223 -0,223
0,407
~ -0,407-----l . (0,466}
a) Longitudinal stresses at midspan
c) Transverse stresses at midspan
0,()IJ
-0,013 -~o;;;;;.o;,.,.11__,,,------------~ ,0.039
------.i 0,059
e) Shear stresses at midspan
--- Outer fibre stresses
70
0,514 0,58& 0.61.J-----0,£79-..._
rofS2J roJ1sJ .......... fJ:l.92 l td.898)
I
b) Longitudinal stresses at ~ - span (z=300mm)
Transverse stresses d) at ~4- span
(z=300mmJ (z=300-mmJ
( z =J001inm J
f) Shear stresses af ~ -span
FIGURE 4. 18: Hodel 4 Loadcase 6 Combined stresses from analysis MPa

Univers
ity of
Cap
e Tow
n
71
5 COMPARISON OF RESULTS AND DISCUSSION
5.1 GENERAL
The results from the model tests are used here to broadly assess the accuracy of the proposed method of analysis in finding the various internal stresses. The influence of the cross-sectional proportions and the distribution of stresses around crosssections, as well as longitudinally along spans, are also .investigated. Figures 5.1 to 5.8, 5.10 to 5.16 and 5.18 and 5.19 show the experimentally determined stresses superimposed onto the appropriate stress diagrams from Chapter 4 for the theory.
The correlation between actual stresses and those from the analyses are examined as far as possible in the context of the individual structural action types defined in the theory, namely: simple bending and shear lag in bending; torsional warping and St. Venant torsion; and distortional warping and transverse bending. The following sections deal with different the action types and those loadcases which are relevant to each.
5.2 SIMPLE BENDING AND SHEAR LAG IN BENDING
Loadcases 1.1, 2.1, 3.1 and 4.1 are applicable to these aspects of the theory for Models 1 to 4 respectively, i.e having equal point loads applied to webs at midspan and thus with no torsion present.
Figures 5.1 to 5.4 show the various stress diagrams for experimental and theoretical values.
5.2.1 Longitudinal normal stresses
Midspan (z = 600)
Main points of note on the cross-sections are those on the flanges at the webs where peak stresses occur and on the centrelines of the flanges as well as on outer edges of the top flange where minimum stresses occur. Stresses found at the positions of the applied loads, i.e. top flanges over webs, are affected by local concentrated stress effects of the point loads and are therefore not reliable. Table 5.1 gives the ratio of stresses derived from the experiments to those from the theory for the outer fibres at various points. ·
MODEL.LOADCASE 1.1 2.1 3.1 4.1
Bottom Flange left web 0.87 0.86 0.81 0.82 right web 0.90 0.82 0.82 0.81 centreline 1.07 1.01 0.98 0.97
Top Flange right edge 1.03 1.02 0.95 0.93 left edge 1.04 1.01 0.96 0.96 centreline 1.07 1.00 0.97 0.96
Table 5.1 Ratio of experimental to theoretical longitudinal stresses at midspan using outer fibre stresses throughout.

Univers
ity of
Cap
e Tow
n
• 0,"60 O,t.80.
' o,~o I _ 0,1,3] .
0,470 0,510.. 0,527
a) Longitudinal stresses af af midspan
. . 0,009 0,007
0,~7 0,065
. 0,013
C) Transverse stresses at midspan .
0,000
I I
Z:600- IZ:600+
e) Shear stresses at midspan
FIGURES.!.' Hodel 1
. 72
l..oadcase - 1 B
-0,140-0,1.
I I
I 0,213 .
0,21,8 0,196 0,259 I
I b) Longitudinal stresses
at ~ -span (z =.300 mm)
• 0..003
d) Transverse stresses at %-span
4 lz:300mm)
. f) Shear stresses at ~ -span ( z =300 mm}
Stress values from experiments MPa

Univers
ity of
Cap
e Tow
n
...
73
-0,256
1030 •
0,1!91 I , 0, 92() (Ot.Q •
1,183 _/ I " 1,fl,f) Longi dinal. stresses at midspan
v I ~ a)
0,007 0,003
. 0,0{)9
c) Transverse stresses at midspan
·-0, 015
z = 6 0 o- z = 6 00 +
e) Shear stresses at midspan
F/6URE 52 .. Hodel 2
0, f61 0..486
0,553 0,458 0,575
b) Long!fudina/ stresses at ~-span
o,oos o.~ 0,001
O,Otl 0,007 • O,OOS
d) Transverse stresses at ~-span
4
<z=300mmJ
f) · Shear stresses at % -span
Loadcase 1 Stress values from experiments MPa
~,299

Univers
ity of
Cap
e Tow
n
'.
1,866
a) Longitudinal stresses at midspan
0,04S
0,045
' 0,075 I
c) Transverse stresses at midspan
I I
--0,035
V1'\J z = 6 0 o- z = 6 00
e) Shear stresses at midspan
-- - --Outer fibre stresses
74
~932'---+-~~~0~,7~7~1~~~~0,934 0, 916 ,_ 0,.879
----- ------1,0~ fOSO
b) Longitudinal stresses al ~ -span (z = 300mm)
0,011
0,027 0,039 0.012
d) Transverse stresses at ~-span
4
(Z= 300 mm J
f) Shear stresses at % -span (z =300 mm J
0,008
FIGURE 5. 3 .. Hodel 3 Loadcase 1 Stress values from experiments MPa

Univers
ity of
Cap
e Tow
n
a)
1,1.SI, ,_ __ ......,_ __ _....,,
,,,,,,.. 1,598 ...... 1,.;9t l '-t-;?62
I Longtfudinal stresses at midspan
O,Oo~ 0,0.06 .. 1/W
,# J J
0, 044 0,040
c) Transverse stresses at midspan
Vi~ z = 6 0 o- z = 6 00 +
e J Shear stresses at midspan
- - -Outer fibre stresses
75
-0,'426 -o. -----1-~o,451-
' 0,770 0,703
'-------0723 ----.J 0,863 '1 0,857
I
I
b) Longitudinal stresses at ~ - span lz=300mm)
0,005 0 001 . . 1[.ALLY 15Hour
rHEO~~o rH'!1u q 009 • 0.004
0,003 0,013
d) Transverse srresses at ~-span
4
(z:300mmJ
f) Shear stresses at ~ -span I z = 300 mm)
0,011 .
FIGURE 54. Hodel 4 Loadcase 1 Stress values from experiments MPa.

Univers
ity of
Cap
e Tow
n
76
From the longitudinal stress diagrams, it is apparent that the stresses found from the experiments are generally slightly lower than those predicted by the theory.
The ratios for loadcase 1.1 vary between 0.87 and 1~07 and decrease progressively through loadcases 2.1 and 3.1 to vary between 0.82 and 0.97 in the case of 4.1. The best correlation is for stresses on the centrelines of the flanges which lie between 1.07 and 0.97 for the bottom flange and lie between 1.07 and 0.96 for the top flange; Values on the edges of the top flange also agree well with these ratios being between 1.04 and 0.92. However, for the important peak stresses on the lower flange at webs, the theory overestimates the actual stresses by between 10 % and 23 %, i.e. from ratios of 0.91 and 0.81.
Anomalies occur in terms of the stresses measured on the top and bottom flanges between webs in that the values found at the centrelines are slightly higher than the values at the adjacent points, i.e. at the midpoints between centrelines and the webs. All the loadcases considered here reflect this trend.
Quarter-Span (z = 300)
The comparative diagrams show that as for the midspan section, the experimental stresses are consistently slightly lower than those predicted by theory. The distribution of stresses on the top flanges are fairly uniform whereas for the lower flanges there is a clear decrease in the measured stresses from webs to centreline. The above trends are present in all these loadcases. Table 5.2 gives the ratios for the experimental centreline stress values to average of the stresses at the webs, as well as the ratios for the average measured values to the theoretical outer fibre stresses for the bottom flange.
MODEL.LOADCASE
expt. cl./av. expt. @webs
av. all expt./theory
1.1 2.1 3.1 4.1
0.77 0.81 0.74 0.84
0.82 0.81 0.82 0.84
Table 5.2 Ratios of longitudinal bottom flange stresses.
A convenient way to assess the average difference between theory and the actual stresses is to compare these values at a position where the readings are fairly uniform and no other influen~ing factors are apparent, such as for the top flange at the quarterspan section. Table 5.3 gives the ratios between average measured stress and the outer fibre stresses from the theory.

Univers
ity of
Cap
e Tow
n
5.2.2
5.2.3
·MODEL.LOADCASE
av. all expt./theory
77
l~l 2.1 3.1 4.1
0.87 0.82 0.81 0.79
Table 5.3 Ratios of longitudinal top flange stresses at quarter-span.
From this table, it is clear that the theory overestimates the stresses to a greater degree for the shallower sections. The average ratio for all loadcases given in the table is 0.82.
Transverse Stresses
For the symmetrical loading considered here, with point loads applied directly over webs, the theory gives the transverse stresses as zero for all sections.
Midspan {z = 600)
The experimental values show that small (i.e. if compared to the ·peak longitudinal bending stresses) transverse compressive stresses occur within webs below loading points for the deeper sections, i.e. loadcases 1.1 to 3.1 but that for the shallowest section (loadcase 4.1) these are negligible. Also apparent is the occurence of small tensile stresses within the lower flanges of the shallower sections, i.e. loadcases 3.1 and 4.1.
Quarter-span section.
Compressive stresses, again small if compared to the peak longitudinal bending stresses, occur within the lower. flanges at these sections with those for loadcases 1.1 and 3.1 being the most prominent.
Shear stresses
Shear stresses measured at midspan sections are not relevant since these coincide with the step in the shear force diagram at the loaded section.
Quarter-span section
The measured shear stresses are generally slightly less than the values predicted by the theory and the difference is more marked in the case of the webs than the case of the flanges and decks. Table 5.4 gives the ratios of measured ~hear stresses to theoretical stresses for the webs as well as for the projecting top flanges.

Univers
ity of
Cap
e Tow
n
5.2.4
78
MODEL.LOADCASE
expt. web/theory web
av. expt. cant./theory cant.
1.1 2.1
0.78 0.80
3.1 ,4.1
0.69
0.96 0.84 0.84 0.82
Table 5.4 Ratios of measured and theoretical shear stresses for webs and cantilevers.
Discussion
Longitudinally, the major trend is that the experimental values are consistently lower than those given by the theory throughout. This is illustrated in both Tables 5.1 and 5.3 which indicates the difference to be in the order of about 20%. This phenomenon can be attributed to a difference between the E-value used for converting the strain readings to stresses and the actual E-value. As was discussed in Chapter 2, Perspex is prone to considerable creep deformation and the extent of creep is d~pendant on the period for which the loading is applied as well as the magnitude of stress which affects the rate of creep. It was also explained in Chapter 2 that for the experimental strain readings, the creep component was largely eliminated by using the average of the readings taken at the start and at the end of a load cycle with the loads removed. The creep component is however not eliminated in the same way from the E-value determined by means of the tensile tests and this would result in reduced stress values. A rough assessment of the difference between the value used, i.e. 2918 MPa, and a value that largely excludes creep, is 11J~de by comparing the above to one obtained from the AECI brochurel ) for a faster rate of strain.
The tangent modulus for a high rate of 1 % per minute is 3357 MPa which is about 15 % higher than the one used for the models and is of the same order as the discrepencies experienced here.
The experiments show that shear lag does significantly affect the magnitude and distribution of the longitudinal bending stresses. For the lower flange at midspan, the ratio of the average longitudinal stresses at the webs to the stress at the centreline is 1.10 for loadcase 1.1 and 1.11 for each of 1.2, 1.3 and 1.4. Although the theory does not show shear lag effects occurring at the quarter-span section, there is a clear reduction in the longitudinal stresses in the lower flanges from the webs towards the centreline in all cases indicating that shear lag is present. These ratios are in the range from 1.35 to 1.19 which are even higher than the equivalent ratios at midspan. Also evident is the anomalous trend in the stress values on the flange and deck centrelines at midspan where these are higher than the adjacent stress values measured midway between the centrelines and the webs. This trend is not present at the quarter-span section. The influence of shear lag on the stresses within the top flanges is not as clear as in the case of the lower flanges and appears to be absent in the top flange at quarter-span altogether.
~- -""-r"l""'r ~---
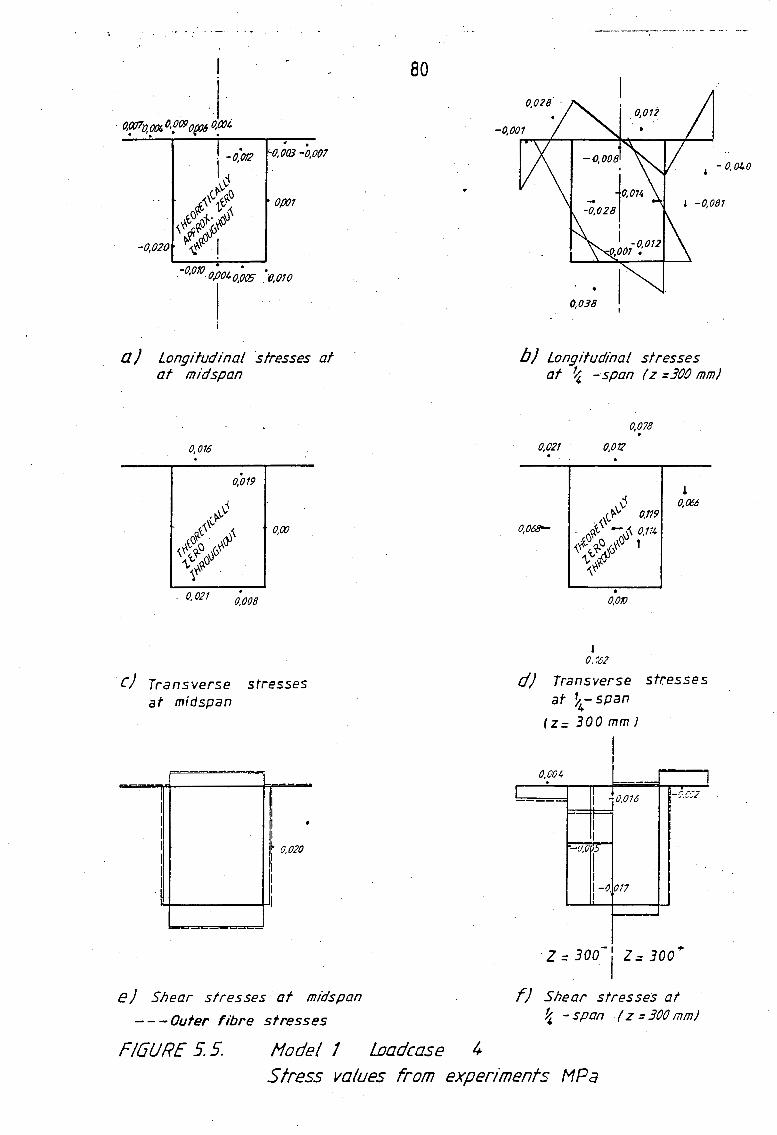
Univers
ity of
Cap
e Tow
n
. ~0,003 -0.007
0/)01
-0010 • • • . T'o""' . 0.010
a) Longitudinal stresses al at midspan
0,016 . . 0,019
. 0,021 .
0,008
C) Transverse stresses at midspan
I I I I I I • I I I r 0.020 I I I I I
I I I
e) Shear stresses at midspan
- - -Outer fibre stresses
FIGURE 5.5. Hodel I
80
Load case
0,028
' - 0,01.0
0,038
b) longtfudinal stresses at ~ -span (z =300 mm)
0,021 .
O,OfXJ"-
0,012
. 0,01)
J 0,162
0,078 .
d) Transverse str:esses at ~-span
4 (Z=300mmJ
0,004 I I I ~ l -r;.c-:2
I ,0,016 ,_ -- --
I I
-O,O'l5
I I 1-o I . 017
Z = 300-i Z:: 300+
f) Shear stresses at ~ -span ( z = 300 mm)
Stress values from experiments MPa

Univers
ity of
Cap
e Tow
n
0.,002 0~22 0,013 0,002
81
I
I 0/)06
• - 0. 005 -0,007 -0,0tz ' - 0,028
. . 0,009 O,ot4
a) Longitudinal stresses at midspan
'0,031
0,010·
0,014
c) Transverse at midspan
stresses
-- --
II 11
11 I I I
0,028 l I I I
I I I I I I I
J
e) Shear sf resses at midspan
-- ----- Outer fibre stresses
FIGURE 5.6. Hodel 2
b) Longitudinal stresses at ~-span
d) Transverse at ~-span
4.
lz=300mmJ
-0,004
I - -- ·--- -
I
! I
I I I I I
z = 300
0,~029 0,024
. 0,047
stresses
r== I .
- 0,028 1-0. Cl/8 I I I
-0,012• I
I I I -0,048 I I I
f) Shear stresses at % - span
Loadcase 4 Stress values from experiments MP a
!

Univers
ity of
Cap
e Tow
n
82
0,001. OC&
a) Longitudinal stresses at midspan
0.012 . 0,001
0,011. . 0,011.
C) Transverse stresses at midspan
--::~ ----------~-----
e) Shear stresses af midspan
----- Outer fibre stresses
____ .. ___ ,_
b) Longitudinal stresses af 1 -span (z = 300mm)
0,006
dJ Transverse stresses at ~-span
4
<z= 300mmJ
-0,019
I
Z = 300-1 Z.: 300+
f) Shear stresses at i -span (z =300 mm)
1 ' 0,038
0,002
F/6URE 5. 7. /1odel 3 Loadcase 4 Stress values from experiments MPa

Univers
ity of
Cap
e Tow
n
2e!eo . . -0,001 0,001 O,tm
- O,OC5 -0,0CO -0,0os 0, OOQ -0,001
0.011 • ' :-0,009
0,021 0:010 -o,oo1 -0/)06 -O.aJB
a) Longitudinal stress~s at midspan
0,002 0,001
. 0. 008 O,OOS
c) Transverse stresses at midspan
,__ _____ _ I !
------------------: I I I
e) Shear stresses at midspan
-- ----- Outer fibre stresses
. 0,314
b) Longitudinal stresses at ~ - span (z =300 mm)
0,003 0,076
0,100. -OPB2 o,226
0,139
d) Transverse stresses at ~-span
4 lz=300mm)
-0,011
---- ---..-.r-t-~o,b.I6t ---,--. -0041
0,039 __ ..::._..:
I
z =Joo- lz= 100+
f) Shear stresses at ~ -span ( z = 300 mm)
0,031
FIGURE 58. Hodel 4 Loadcase 5 Stress values from experiments MPa

Univers
ity of
Cap
e Tow
n
5.3.1
84
Figures 5.5, 5.6, 5.7 and 5.8 show the various stress diagrams for experimental and theoretical values.
Longitudinal stresses
Quarter-span section (z = 300)
Three broad trends are apparent. The first two are that for the same loadi~g, the measured warping stresses increase with decreasing section depth and that the torsional warping stress pattern around the cross-sections become more discernable, also with decreasing section depth. For loadcase 1.4 the experimental stress values do not follow the predicted stress distribution at all, but in general the stresses are small and of the same order of magnitude as those from the theory. The best correlation between measured and calculated stresses is found with Loadcase 3.4 where the torsional warping pattern is clearly reflected by the measured values and the stress magnitudes are comparable. Table 5.5 gives the ratio of the extrapolated (from the average of the midpoint values since those at the webs are not reliable) experimental stresses to the theoretical stress values at the webs· for both top and bottom flanges.
MODEL.LOADCASE 1.4 2.4 3.4 4.5
Top flg. av. expt./theory
Bot flg. av. expt./theory
0.52 1.51 1.14
0.36 1.33 2.01
0.44 1.42 1.58 av. ratio for top & bot. flanges
Table 5.5 Ratios of measured (extrapolated from centreline and flange midpoint values) and theoretical longitudinal stresses at the webs for top and bottom flanges.
The third trend is that the measured longitudinal stresses in the cantilever portions of the deck elements are about zero at the outer edges and appear to increase linearly to a peak value, either positive or negative, at the webs. This occurs for all four loadcases and is in contrast to the theory which gives stress values of approximately equal magnitude (slightly higher at the webs) but opposite signs at the edges and webs respectively. .In all cases the rate of change of stress from edge of deck to webs follow the same sign. Table 5.6 gives the averaged ratios of the extrapolated (from cantilever midline) measu.red web stresses to the theoretical values.

Univers
ity of
Cap
e Tow
n
5.3.2
85
MODEL.LOADCASE 1.4 2.4 3.4 4.5
av. expt./theory 1.95 0.86 0.64 0.77
Table 5.6 Ratios of measured (extrapolated) and theoretical longitudinal stresses for the top flanges at the webs.
Midspan (z = 600)
The longitudinal stresses measured at midspan are small throughout (compared to those at quarter-span) and as such agree well with the small stresses from the theory. Peak stresses were generally measured at the lower flanges on the line of the webs.
It is apparent that the lower flange stresses for all loadcases vary approximately linearly between webs with stresses of opposite signs at the respective webs. For loadcases 1.4 and 2.4 negative stress values occur at the webs under upward point loading and for 3.4 and 4.5 these stresses are positive.
Transverse stresses
As stated before, the transverse stresses at the quarter-spa·n sections are affected by the axial forces within the struts forming the diaphragms and are therefore not reliable. This is reflected in the random nature of the measured values both with respect to distribution as well as magnitude.
Midspan (z = 600)
In all cases transverse stresses occur which follow a typical transverse bending pattern and if these are compared to the transverse bending stresses that occur at the loaded section with the diaphragms omitted (i.e. loadcases 1.3, 2.3 and 3.3), it can be seen that these negligibly small.
From these diagrams it is also evident that for loadcases 1.4 and 2.4 the presence of diaphragms at quarter-span cause a considerable reduction in the midspan transverse stresses but that in the case of loadcase 3.4 the difference is hardly noticable. Although the loading for loadcase 4.4 was not the same as for 4.5, it can be expected that transverse bending stresses at midspan would be more pronounced in the absence of a diaphragm at quarterspan but, as for 3. 4, this appears not to affect the midspan stresses.

Univers
ity of
Cap
e Tow
n
5.3.3
5.3.4
86
Shear stresses
Shear stresses measured at quarter-span sections are not reliable since these coincide with the step in the shear force diagram at· the loaded section.
Midspan {z = 600)
The shear stresses were measured on the outside of the webs for loadcases 1.4, 2.4 and 3.4. These stresses are wholly St Venant shear stresses according to the theory and the correlation with the experimental readings are good as can be seen from Table 5.7.
MODEL.LOADCASE 1.4 2.4 3.4 4.5
experimental 0.020 0.028 0.039
theoretical 0.019 0.034 0.055 0.044
Table 5.7 Measured and theoretical shear stresses at outside of webs. (MP a)
Discussion
The aspect of the analysis examined by this series of model tests, i.e. torsional warping, is based on the theories of Vlasov which are applicable to thin walled box-girder members. Various criteria are given for the definition of thin walled members and the table below shows to which extent the different models meet these requirements.
MODEL.LOADCASE ' 1.4 2.4 3.4 4.5
Vlasov: h/b or h/d (~ 0.100) 0.082 0.104 0.212 0.300 b/l or d/l (~ 0.100) 0.127 0.097 0.097 0.097
Kollbrunner and Basler: Aeffectf Aenc (~ 0.200) 0.239 0.281 0.481 0.552 Aeffe7tfAenc (~ 1.0) 0.239 0.281 0.481 0.352 ovsvt vsvt (~ 0.100) 0.244 0.352 0.478 0.568 oTsvtlTsvt (~ 0.100) 0.008 0.012 0.024 0.031
Table 5.8 Various criteria for thin-walled box-girder members applied to the models tested.
It also follows that the observations made in the discussion relating to longitudinal bending and shear lag with respect to the applicable E-value and the shear modulus are also relevant here, i.e. that the actual E- and G-values are about 15 % higher than the values used for converting strains to stresses. This means that the measured stress values presented here should also be higher by the same margin.

Univers
ity of
Cap
e Tow
n
87
The longitudinal stresses measured around the cross sections at the loaded sect ions do not fallow pure torsional warping patterns and in the case of 1.4 no recognisable pattern at all. In all these loadcases small transverse stresses occur at midspan which are typical transverse bending stresses. This indicates that the diaphragms did not eliminate distortion of the cross-section entirely and that a small degree of distortional warping was present. The above observation is supported firstly by the anomalous stresses measured on the cantilevers at quarter-span ~hich reflect the stress pattern that could be expected if distortional warping stresses are superimposed onto those for torsional warping, i.e. the stresses at the edge of the deck would for the two action types be subtractive and if the magnitudes are similar would be close to zero. See Figures 3.14 and 3.18.
The second phenomenon that supports the observation is that, although very small, the longitudinal stresses at midspan follow typical distortional warping patterns with those for the two shallower sections indicating a reversal in the sign of the stresses. According to the theory, and illustrated by Figures 3.15 and 3.19, the sign reversal only occurs with distortional warping and not for torsional warping .
The random nature of the warping stresses from loadcase 1.4 is likely as a result of the small stress values being overshadowed by local concentrated stress effects which for the other loadcases where larger warping stresses are generated, are not overriding.
It is difficult to make a good estimate of the portion of stresses at the loaded section which results from distortional warping. Using the proportion of the distortional warping stresses measured at midspan for 3.4 to the distortional warping stresses from the analysis for loadcase 3.3, a rough estimate can be made of the magnitude of the distortional warping stresses at quarter-span. Figure 5.9 gives the measured warping stresses together with the superimposed diagrams for the torsional and estimated distortional warping stresses.
-0,001 -0,128 -o '161
Figure 5.9
0,161 0,12<l
°'-0,007
INCLUDING PARTIAL DISTORTIONAL WARPING (15% l
TORSIONAL WARPING ONLY
Comparison of measured warping stresses at quarter-span to the theoretical stresses allowing for distortional warping (due to inefficiency of diaphragm). (MPa)

Univers
ity of
Cap
e Tow
n
88
From the above it is apparent that the addition of the estimated distortional warping stresses generally improves the correlation of the theory with the experimental readings. Also, it must be added that this procedure is not very reliable since the accuracy of such an adjustment is highly dependant on the location of the point along the span where the distortional warping stresses cross over from positive to negative and which occurs at approximately midspan in the case of the loading being applied at quarter-span. The above excercise was not repeated for the other loadcases in this series. '
The main conclusions are as follows:
The torsional warping analysis, given that the E-value used for converting strain to stresses was about 15 % too low, generally slightly under-estimates the actual stresses.
The under estimation of torsional warping stresses by the torsional warping theory is not a serious source of error in terms of the total warping stresses seeing that these are mostly less than a quarter(Qf the total warping stresses according to the parameter study I) for a 30 m span under purely live loading and are also highly localised longitudinally.
The torsional warping-theory gives best results for the shallower sections, as shown by loadcases 3.4 and 4.5.
The trend in the experimental results that the torsional warping stresses increase with a decrease in sect(lftl- depth for the same loading is confirmed in the parameter study J.
The fact that the torsional warping theory was developed for thin walled sections and that all the models tested are thick-walled in terms of the Vlasov criteria, is the most likely source of the differences between theory and the measured stresses, together with the diaphragms not fully preventing distortion of the crosssections.
5.4 COMBINED TORSIONAL AND DISTOf{f'IONAL WARPING AND TRANSVERSE BENDING
Two loading formats are used to examine these aspects of the theory and are illustrated in Figure 4.1. The first comprises equal point loads, one acting vertically upwards and the other vertically downwards, applied to the top -0f the deck on the centrelines of the respective webs at midspan (z = 600). The relevant loadcases are 1.2, 2.2, 3.2 and 4.2.
The second format is like the first with the exception that the loads are applied at the quarter-span section (z = 300) and are represented by loadcases 1.3, 2.3, and 3.3. All these loadcases are purely torsional with no longitudinal bending present.

Univers
ity of
Cap
e wn
89
As was the case with th~ loadcases discussed previously, stress concentrations arise in the immediate vicinity of the .loading points so that ·readings at or near these positions may be affected.. · · · · ·
Figures 5.10, 5.11, 5.12 and 5.13 show ttie various stress diagrams from botlt the theory and the ~xperiments for loadcases 1.2, 2.2, 3.2 and 4.2 and Figures 5.14,· 5.15 and 5.16 the diagrams for loadca~es 1.3, 2.3 and 3.3. ·
5.4.1 Longitudinal stresses
. 5.4.1.1 Loading·at midspan (1.2, 2.2, 3.2 and 4.2)
Midspan (z = 600)
A number if trends manifest themselves throughout these loadcases.
··Firstly, the theory and experimental. value~ agree Very weJl,at th~ edges and midpoints of the cantilevers for all loadcases with most experimental values tending to be fractionally smaller than the theory.
Secondly, at the midpoints between centreline and webs on the d~ck, the experimental reading~ are ~onsiderably higher than the values from the theory, being on average about t~ice as high. The biggest differences occur with loadcases 1.~ and 2.2. ·
Ariother trend is noticeable ~ith regard to the l~wer flange stresses. For loadcases 1.2 and 2.2 the experimental v~lues are considerably higher than those given by the theory but for 3.2 and 4.2 the differences are negligible. Furthermore, whereas the theory predicts a linea~ variation in the lower flange stresses between webs, the measured stresses have a distinct non-linear tendency in all cases, with increased peak stresses at the webs .
. In overall terms, almost ~omplete agreement bet~een theory and the experiments is obtained for loadcases 3.2 and 4.2; and for 1.2 and 2.2 the theory underestimates the actual stresses, especially
·at the midpoints between the girder centreline and webs on the top flanges and at the webs on the bottom flanges. ·
Finally, for the same applied loading, the measured longitudinal. stresses show a clear increase with the decre~se in the section depth from 1.Z to 4.2 as does the theory. A useful reference point for this observation is the peak stress values at the web centreline on the · 1 ower flange. Adjusting these on a pro rata basis to allow fof diffetent magriitudes of loading, the measured stresses (theoretical values in brackets) are, arranged from deep to shallow: . 0.496(0.312); 0.712(0.564); ·· L064(0.966) and 1.590(1.574) MPa for loadcases 1.2 to 4.2.
'.

Univers
ity of
Cap
e Tow
n
·.--.... ..
0,295 .
. (J.
a) Longitudinal stresses at midspan
~I 0.38~
c) Transverse stresses at midspan
J 0.011. J
I z = 600- lz = 600+
e) Shear stresses at midspan
91
I ·0.133: I .
o,bo4 . ..,0,026 -0,018 I
I
,089 . 1. it 041 - o.o.o
I . -0,052
0,015 '0.020
. 0,062 .
b) Longitudinal stresses at ~-span
d) Transverse stresses at ~-span
4
fZ= 300mmJ
0003
i
- -o. 090 . -.:0,125 - 0,031
I I \
0.002
0001.
f) Shear stresses at % - span
FIGURE 511. Hodel 2 Loadcase 2 Stress values from experi!Tlenfs MPa

Univers
ity of
Cap
e Tow
n
. 0,696
a) Longtfudinal stresses at midspan
C) Transverse stresses at midspan
I
z = 600_1 z = 600+
e) · Shear stresses at midspan
FIGURE 512. Hodel 3
92
-(J.011 -0,009
0,025'
'
0,()03 0,012 . 0.010 '0,018
I I
I -~018 -Oil1J9-0,01S .-0,028
b) Longitudinal stresses at i -span (z = 300mm)
d) Transverse stresses at ~-span
4
(Z= 300mmJ
-0, 011 - 0 !08 ---t/l-Lo. { 16
-0,012
- -·
f) Shear stresses at % -span (z =300 mm J
Loadcase 2 Stress values from experiments MPa

Univers
ity of
Cap
e Tow
n a J longitudinal stresses at midspan
C) Transverse stresses at midspan .
I
z = 600- lz= 600+
0,037
e) Shear stresses at midspan
FIGURE S.13. Hodel 4
93
I 0,00S 0,009 0, oos 0,010
I
0,012 I -0,015 4==-0~0i."-19_-"--_-... o. ... 01=='5=---o,026 0,038. -0,007
I
b) longitudinal stresses at ~ - span (z=300mm)
0. 011. . ! 0,004
0,008
0.003 0,010 0,008
d) Transverse stresses at ~-span
4 lz:300mm)
I -o.o2o I
-0,1(/3
-o.t(s I
-0,111,.
~
0,003
-I 0,008
-0,017 -0,073
f} Shear stresses at ~ -span ( z =300 mm)
Loadcase 2 Stress values from experiment MPa

Univers
ity of
Cap
e Tow
n
. 0,168 I • 009)
0.031 0,021+ '• O.!OOS ·
l-0,072
. j -0,015 I
0,173 I -0080
L • 0,0
I -
-0,021+-0,036
I 0,076 •
(), 162
a) Longitudinal stresses at at midspan
c) Transverse stresses at midspan .
0,022 •
e) Shear stresses at midspan
FIGURE S.14. Hodel 1
94
0,156
Loadcase 3
. 10.208
. b)
~I+~ Longitudinal stresses at ~ -span (z =300 mm)
. 0,030
d) Transverse stresses at ~-span
4. lz:.300mmJ
I I
- "" + z = 300 z = 300 .
f} Shear stresses at ~ -span ( z =300 mm)
Stress values from experiments MPa

Univers
ity of
Cap
e Tow
n
0,134 0,065
0,008 0,019 . :... 0,020 -0,017
-0,058 '-0,123
0,038 • -0,034
-0,055 -0.035 • -0,002 .
0,028 0,067
a) Longitudinal. stresses at midspan
c) Transverse stresses at midspan .
0,014 .
\
-
e) Shear stresses at midspan
FIGURE 515 11odel 2
95
0,018
0,161 0,146 .
b) Longitudinal stresses at
I q,009
d) Transverse stresses at ~-span
4 lz:300mmJ
. 6,769
1. ~-span
0,023
i z = 300-, l= 300+
f) Shear stresses at % - span
loadcase 3 Stress values from experiments MPa
-0,176

Univers
ity of
Cap
e Tow
n
..... 0,017 -0,017
0,026
a) Longitudinal stresses at midspan
0,020
c) Trans verse stresses at midspan
I : ·-
0,034
e/ Shear stresses at midspan
96
. 0,744.
b) Longifudi'na/ stresses at . ~ - span (z = 300mm)
d) Transverse stresses at ~-span
I.
(Z= 300 mm)
I
z = 300- lz = 300+
f} Shear stresses at ~ - span (z = 300 mm J
FIGURE 5.16. /1odel 3 Loadcase 3 Stress values from experiments MPa

Univers
ity of
Cap
e Tow
n
97
Table 5.9 gives the ratios of the measured longitudinal stresses to stresses from the theory for various points around the crosssection. Note that since the diagrams for longitudinal stresses are anti-symmetrical about the girder centreline, a single average ratio can be determined for equivalent points.
MODEL.LOADCASE 1.2 2.2 3.2 4.2
Top Flange edges cants. 0.89 0.72 1.18 1.63
midpts. cants. 0.99 0.81 . 0.85 0.89
.midpts. webs/cl. 2.68 2.50 1. 75 1.63
Bot Flange midpts. webs/cl. 1.39 1.08 0.93 0.87
webs 1.59 1.26 1.10 1.01
Table 5.9 Ratios of experimental to theoretical longitudinal stresses for various points on the midspan cross-section.
Quarter-span (z = 300)
Both the measured and calculated stresses at these sections are substantially smaller than those at midspan and therefore follow a similar trend. Also, for loadcases 2.2, 3.2 and 4.2 the theory indicates a reversal of sign for the stresses from those at midspan which is also the case with the experimental readings from 3.2 and 4.2, but not 2.2. The readings for 1.2 have the same sign as for midspan as do the calculated values.
Best correlation is found with loadcase 4.2 where the stresses agree closely with respect to distribution and magnitude ~ the experimental values are marginally less. Loadcase 3.2 also shows good agreement as far as distribution around the cross-section is concerned but the experimental values are approximately only half those from the theory.
5.4.1.2 Loading at quarter-span (1.3, 2.3, and 3.3)
Quarter-span (z = 300 111n)
The overall trends are the following:
For the top flange, the tendency for the measured stresses in the cantilever portions is to follow the same pattern as that given by the analysis but only slightly smaller. In all three loadcases an anomalous reading occurs at the midpoint between the centreline and the lefthand web which is considerably higher than the theoretical stress.

Univers
ity of
Cap
e Tow
n
98
At the lower flanges a good correlation is found at the centreline and midpoint values throughout. However, in all cases the stresses at the webs are markedly higher than those given by the theory.
For the same applied loading, the measured longitudinal stresses show a clear increase with the decrease in the section depth from 1.3 to 3.3 as does the theory. Using the peak stress values at the web centreline on the lower flange as a reference point, and adjusting these on a pro rata basis to allow for different magnitudes of loading, the measured stresses (theoretical values in brackets) are, arranged from deep to shallow, 0.472(0.339), 0.753(0.635) and 1.135(0.977) MPa for 1.3 to 3.3. ·
Table 5.10 gives the ratios of measured to calculated longitudinal stresses for the main points around the cross-section. As for Table 5.9 a single average stress ratio can be determined for points symmetrical about the girder centreline.
MODEL.LOADCASE 1.3 2.3 3.3
Top Flange
Bot. Flange
Table 5.10
~~ , egaes cantilevers 0.88 0.68 0.60
midpts. cantilevers 0.86 0.67 0.92
midpts. webs/cantilevers 2.33 2.17 1.84
mi dpts. webs/cantilevers 1.18 1.00 0.96
webs 1.39 1.19 1.16
Ratios of experimental to theoretical longitudinal stresses for various points on the loaded quarterspan cross-section.
Midspan (z = 600 mm)
The stress measurements and theory at midspan both show a large decrease from those at the loaded quarter-span sections for all loadcases. With regard to signs, the theory shows a reversal for loadcases 2.3 and 3.3 from those at quarter-span but the experimental values only shows this for loadcase 3.3. For loadcase 2.3 the stresses on the cantilever portions of the deck follow the sign reversal indicated by the theory whereas the stresses between webs on both top and bottom flanges do not.
The best agreement is found at loadcase 3.3 where the measured values are slightly smaller than those from the theory throughout. For loadcases 1.3 and 2.3 a poor correlation exists between the different stresses.

Univers
ity of
Cap
e Tow
n
99
5.4.1.3·Comparison of 5.4.1.1 and 5.4.1.2
The loadcases for midspan and quarter-span loading show similar trends at the loaded sections as well as at the non-loaded sections of a model for the observed and the analytical stresses. Note that a matching loadcase with loading at quarter-span was not tested for Model 4 so that the results for 4.2 are not included here.
For each model, identical trends in the· distribution of stresses around the cross-section occur at the loaded sections for both loadcases but with slight differences in the stress values.
Table 5.11 shows stress values at various points on the loaded sections for theory and measurements.
MODEL.LOADCASE 1.2 1.3 2.2 2.3 3.2 3.3
APPLIED LOADING +168 N +168 N +168 N +168 N +108 N +108 N
Top Flange: edge cant. av. expt. 0.158 0.176 0.149 0.169 0.073 0.039
theory 0.177 0.200 0.206 0.249 0.062 0.065
mi dpt. av. expt. 0.164 0.156 0.173 0.169 0.140 0.153
theory 0.165 0.181 0.214 0.246 0.165 0.107
mi dpt. web/cl. av. expt 0.204 0.189 0.278 0.263 0.234 0.247
theory 0.076 0.001 0.111 0.121 0.134 0.134
Bottom Flange: midpt. web/cl. av. expt.0.218 -0,201 -0.306 -0.317 -0.288 -0.301
theory -0.156 -0.170 -0.282 -0.318 -0.311 -0.314
webs av. expt. -0.496 -0.472 -0.712 -0.753 -0.684 -0.730
, theory -0.312 -0.339 -0.564 -0.635 -0.621 -0.628
Tab le 5.11 Comparison of stress values at the loaded sections for various points on the cross-section for theoretical and measured values. (MPa)
As with the loaded sections, identical trends occur for the individual models at the non-loaded sections with the small differences being in the magnitudes of the measured stresses. The theoretical stresses at the non-loaded sections are identical for loading at midspan and at quarter-span.
5.4.2 Transverse stresses
Loaded sections
In all, the stresses from theory and the measured values compare well although the theory consistently presents with slightly higher values.

Univers
ity of
Cap
e Tow
n
100
There is a trend for the transverse bending stresses to increase with decreasing depth of sectiori, both for loading at midspan and at quarter-span. ·
Table 5.12 gives the average of stresses measured at the midpoints between the webs and the girder centreline for top and bottom flanges as well as theoretical values. Stress values in the table have been adjusted on a proportional basis to reflect the same magnitude of loading throughout.
MODEL.LOADCASE 1.2 1.3 2.2 2.3 3.2 3.3
Top Flange av. expt. 0.337 0.284 0.473 0.438 0.320 0.541
theory 0.438 0.321 0.621 0.600 0.698 0.717
Bot. Flange av. expt. 0.324 0.255 0.383 0.360 0.532 0.555
theory 0.391 0.287 0.462 0.446 0.605 0. 712
Table 5.12 Comparison of transverse stress values at the loaded sections for midpoints between girder centreline and the webs for top flanges. (MPa)
and bottom
Non-loaded sections
There is a very good agreement between the analysis and the tests for loadcases 3.2 and 3.2, but the theory clearly gives higher values for 1.2, 1.3, 2.2 and 2.3.
Table 5.13 gives the average of stresses measured at the midpoints between the webs and the girder centreline for top and bottom flanges for both theoretical and experimenta 1 values. Stress values in the table have been adjusted on a pro rata basis to represent the same applied loading throughout.
MODEL.LOADCASE 1.2 1.3 2.2 2.3 3.2 3.3
Top Flange av. expt 0.178 0.191 0.184 0.185 0.025 0.026
theory 0.271 0.272 0.281 0.281 0.023 0.023
Bot. Flange av. expt. 0.187 0.198 0.129 0.142 0.022 0.026
Table 5.13
theory 0.243 0.243 0.209 0.209 0.023 0.023
Comparison of transverse stress values at the nonloaded sections for midpoints between girder centreline and the webs for top and bottom flanges. (MP a)
The stresses at the non-loaded sections can be compared to those at the loaded sections by using the above table and Table 5.12.

Univers
ity of
Cap
e Tow
n
101
5.4.3 Shear stresses
Loaded sections
The experimental values at the loaded sections are not suitable for making comparisons since the position of the strain gauges coincide with the step in the longitudinal torsional-moment function at the position of the applied loading.
Non-loaded sections
Loading at midspan (Loadcases 1.2, 2.2, 3.2, 4.2)
Loadcases 3.2 and 4.2 show close agreement between the readings and the theory throughout. Similarly, for Loadcases 1.2 and 2.2 there is also generally a good correlation between theory and the measured values with the exception being the web readings, where the measured stresses are significantly less than those from the analysis.
Loading at quarter-span (Loadcases 1.3, 2.3 and 3.3)
Here, at the midspan section, readings were only taken at the midheight of the webs. Loadcases 1.3 and 2.3 give experimental values that are lower than the calculated values while 3.3 shows only a small difference.
Table 5.14 compares the different shear stress values for the above loadcases.
MODEL.LOADCASE 1.2 1. 3 2.2 2.3 3.2 3.3 4.2
webs expt. -0.015 0.022 -0.031 0.014
theory -0.041 0.030 -0.058 0.036
- 0.034 -0.073
- 0.030 -0.069
midpt. cant. expt. 0.008
theory 0.009
cl. top flg. expt -0.052
theory -0.044
cl. bot. flg. expt 0.077
theory -0.066
- 0.004
- 0.006
- -0.090
- -0.080
- -0.125
- -0.144
- -0.012 - -0.019
- -0.006 - -0.007
- -0.108 - -0.103
- -0.118 - -0.119
- -0.123 - -0.115
- -0.130 - -0.132
Table 5.14 Shear stress values from the theory and the experiments at the non-loaded sections for various points on the cross-sections. (MPa)

Univers
ity of
Cap
e Tow
n
5.4.4
102
Discussion
As discussed previously, the measured stress values given 1n the diagrams should be approximately 15 % higher than shown due to .the under-estimation of the elastic modullus.
Longitudinal and transverse stresses at the loaded sections
From the stress diagrams, a trend is clearly discernable at the loaded sections whereby the measured longitudinal stresses in the flanges between webs are consistently higher than the theoretical values. The largest differences occur at the deep section and reduce progressively with decreasing depth. At the same time the stresses observed at the edges and the midpoints of the cantilevers show a much closer agreement with the theory throughout. Tables 5.9 and 5.10 support these observations.
The transverse bending stresses are confined to the zone between and including the webs and from Table 5.12 it is clear that the theoretical values are higher than the experimental values throughout. The average difference, using the values from the table is about 28 % and varies by between 13 % and 37 % higher.
It can be seen that if an upward adjustment of 15 % is made to the measured stresses to allow for the higher actual E value, the longitudinal stresses excluding the cantilever stresses would be roughly 30 % higher than the theory on average (using the average of the ratios for the lower flanges for midspan and quarter-span loading). The experimental transverse stresses would still be slightly less than the theory by an average of roughly 1.28/1.15 which is about 11 %.
The high stresses measured longitudinally can be explained in terms of the the high transverse stresses, which are mostly higher than the longitudinal stresses themsel~es, and the Poisson 1 s ratio effect. According to Maisel and Rolll J, in their conclusion, the Poisson 1 s ratio effect becomes significant and must be allowed for where the transverse stresses are of the same. order of magnitude as the longitudinal stresses.
An approximate assessment can be made of the contribution to the longitudinal stresses by the Poisson 1 s ratio effect and this can then be compared with the effects observed above. Table 5.15 shows that if the Poisson's ratio effect is omitted, the measured longitudinal stresses become less than the theory with the difference increasing with decreasing section depth. Similarly the transverse stresses which are slightly less than the theory to start with, reduces even further if the Poisson•s ratio effect is removed. .Note that the experimental stresses in the table have all been increased by 15 % to offset the under-estimation of the E-value.

Univers
ity of
Cap
e Tow
n
MODEL.LOADCASE
Longitudinal
expt. with v
expt. without v
theory
Transverse
1.2
103
1.3 2.2 2.3 3.2 3.3 4.2
0.251 0.231 0.351 0.365 0.331 0.346 0.311
0.124 0.137 0.212 0.226 0.209 0.219 0.207
0.156 0.170 0.282 0.318 0.311 0.314 0.319
expt. with v 0.373 0.293 0.440 0.414 0.393 0.410 0.348
expt. without v 0.324 0.240 0.357 0.314 0.311 0.324 0.267
theory 0.391 0.287 0.462 0.446 0.447 0.459 0.416
Table 5.15 Theoretical stresses and experimental stresses calculated both allowing for and ignoring Poisson's ratio for the midpoints on the bottom flange at the loaded cross-sections. (MPa)
Another less prominent trend, is the tendency for the measured longitudinal stresses on the lower flanges to increase exponentially towards the webs. This tendency is more pronounced for the deep sections and becomes less noticable for loadcases 3.2, 3.3 and 4.2. From this it appears as if a small shear lag effect in warping is present.
Longitudinal and transverse stresses at the non-loaded sections
The variations between the values from the analysis and the experimental work can be explained along similar lines to those for the loaded sections.
In the case of loadcases 1.2 and 1.3, the transverse stresses in the flange~ between webs for experiments as well as theory, are more than twice the magnitude of the measured longitudinal stresses, which are in turn about two to three times bigger than the longitudinal stresses from the theory. This discrepancy in the values of the longitudinal stresses can only be ascribed to the Poisson's ratio effect ..
. Similarly, for loadcases 2.2 and 2.3, for both the top and bottom flanges between webs, the transverse stresses are considerably larger than the measured longitudinal stresses which are approximately equal in size to the longitudinal stresses from the theory but opposite in sign. The reversal of the sign of the longitudinal stresses are again due to the Poisson's ratio effect which overshadows the warping stresses.
For the other loadcases, i.e. 3.2, 3.3 and 4.2, both the transverse and longitudinal stresses are small an~ 1therefore the Poisson's ratio effect does not have a noticable inlience.
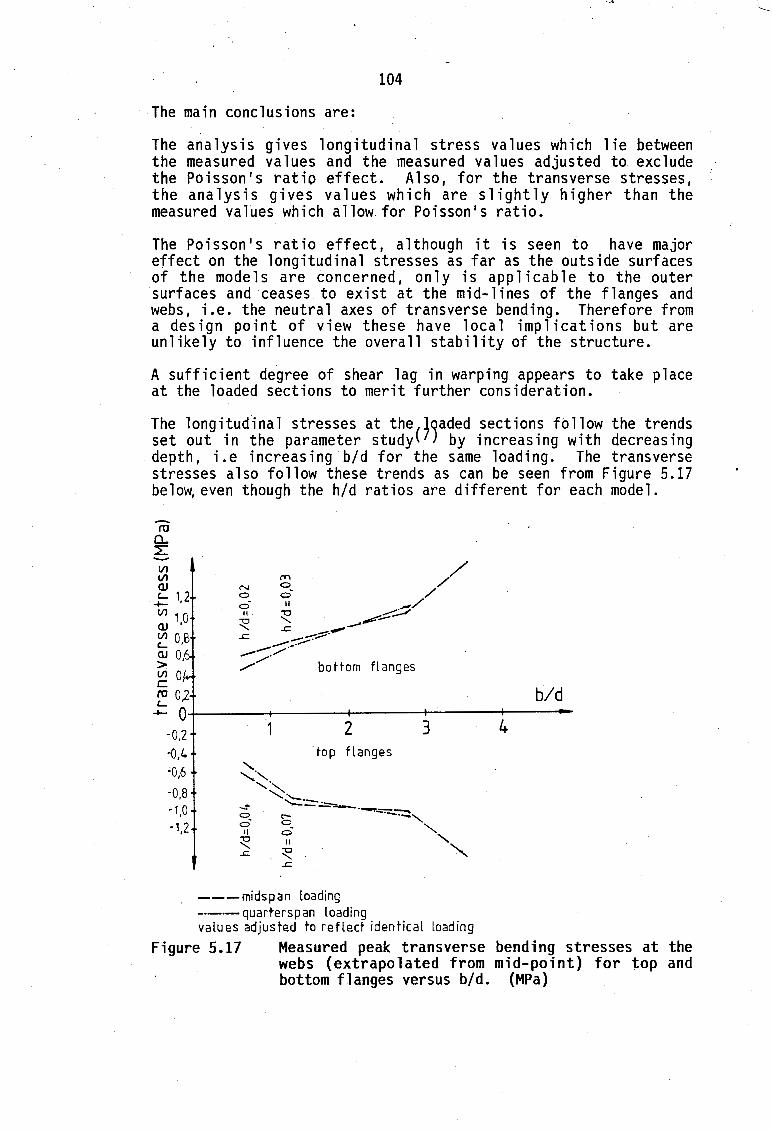
Univers
ity of
Cap
e Tow
n
104
The main conclusions are:
The analysis gives longitudinal stress values which lie between the measured values and the measured values adjusted·t~ exclude the Poisson's ratio effect. Also, for the transverse stresses, the analysis gives values which are slightly higher than the measured values which allow for Poisson's ratio.
The Poisson's ratio effect, although it is seen to have major effect on the longitudinal stresses as far as the outside surfaces of the models are concerned, only is applicable to the outer surfaces and ceases to exist at the mid-lines of the flanges and webs, i.e. the neutral axes of transverse bending. Therefore from a design point of view these have local implications but are unlikely to influence the overall stability of the structure.
A sufficient degree of shear lag in warping appears to take place at the loaded sections to merit further consideration.
The longitudinal stresses at the(1qaded sections follow the trends set out in the parameter study J by increasing with decreasing depth, i.e increasing b/d for the same loading. The transverse stresses also follow these trends as can be seen from Figure 5.17 below, even though the h/d ratios are different for each model.
-ro a. L -VJ Vl QJ c... 1 2 -. VJ , 0 QJ '
~ 0,8 QJ 0 > . ~ 0, ro 02 c... b/d
- o-+-~~~-+-~~~-+~~~--+~~~~1--~~--
-o.2 2 3 4 -0,4 top flanges -0,6
-0,8 -1,0 -1,2
---midspan loading -·-·-quarters pan loading values adjusted to reflect identical loading
Figure 5.17 Measured peak transverse bending stresses at the webs (extrapolated from mid-point) for top and bottom flanges versus b/d. (MPa)

Univers
ity of
Cape T
own
105
5.5 . Combination of all action types
Loadcase 4.4 incorporates all action types namely, longitudinal bending and shear lag in bending, torsional warping and St Venant torsion, as well as distortional warping. Loadcase 4.6 is the same as 4.4 in all respects but with a diaphragm installed at the loaded quarter-span section and is a useful measure to assess the contribution of distortional warping and transverse bending.
As discussed beforei stress concentrations arise in the immediately vicinity of the loading point so that readings at or near these positions may be affected. However in the instance of 4.4, only a single point load is applied to the model which leaves more of the readings unaffected by the stress concentrations than in the case of double loads being applied. The same local effects associated with diaphragms and discussed in 5.3 apply for Loadcase 4.6. .
Figures 5.18 and 5.19 show the various stress diagrams from both the theory and the experiments for loadcases 4.4 and 4.6.
In overall terms, for Loadcase 4.4, the differences between theory and the stresses from the model tests readings are consistently very small at both midspan and quarter-span sections for longitudinal as well as transverse stresses. Shear stresses were not measured at the un 1 oaded sect ion, i.e. at midspan, so that 'these are not part of this assessment.
Good correlation between results are also found for Loadcase 4.6, notably for the longitudinal stresses and transverse stresses at midspan, i.e. the un 1 oaded section. The transverse stresses at quarter-span are affected by the presence of the diaphragm and shear stresses were not recorded at the unloaded midspan section.
The main conclusion to be drawn from the results for 4.4 are: Since the transverse bending stresses are proportionally smaller than the longitudinal stresses than was the case for the loadcases discussed in Section 5.4, the Poisson•s ratio effect on the stress values in both direction is smaller and consequently there is better agreement between the measured and the experimental values. Also the addition of longitudinal bending stresses which in previous loadcases showed good correlation between the theory and the experiments results, adds to the improvement in the agreement between the stresses.
On the basis of the good agreement of the theory with the observed values for a combination of all action types, the recommended analytical method gives results that are adequate for use in the design of concrete box-girders for the categories defined here.

Univers
ity of
Cap
e Tow
n
<J.1,21;----o,41a----o,39e I
a) Longitudinal stresses at midspan
0.001
o,w;l I
0,002
O,f06
0,003
c) Transverse stresses at midspan
]oow
e) Shear stresses at midspan
----- Outer fibre stresses
106
oP,14 ........
................. , 0;965.
b) Longitudinal stresses at ~ - span fz=300mm)
dJ Transverse stresses at /1,.- span
(Z= 300mmJ
-0,019
rZ= 300-J
. 0;012
f) Shear stresses at ~ - span
F/5URE S. 18. Model 4 Loadcase 4 Stress values from experiments MP a
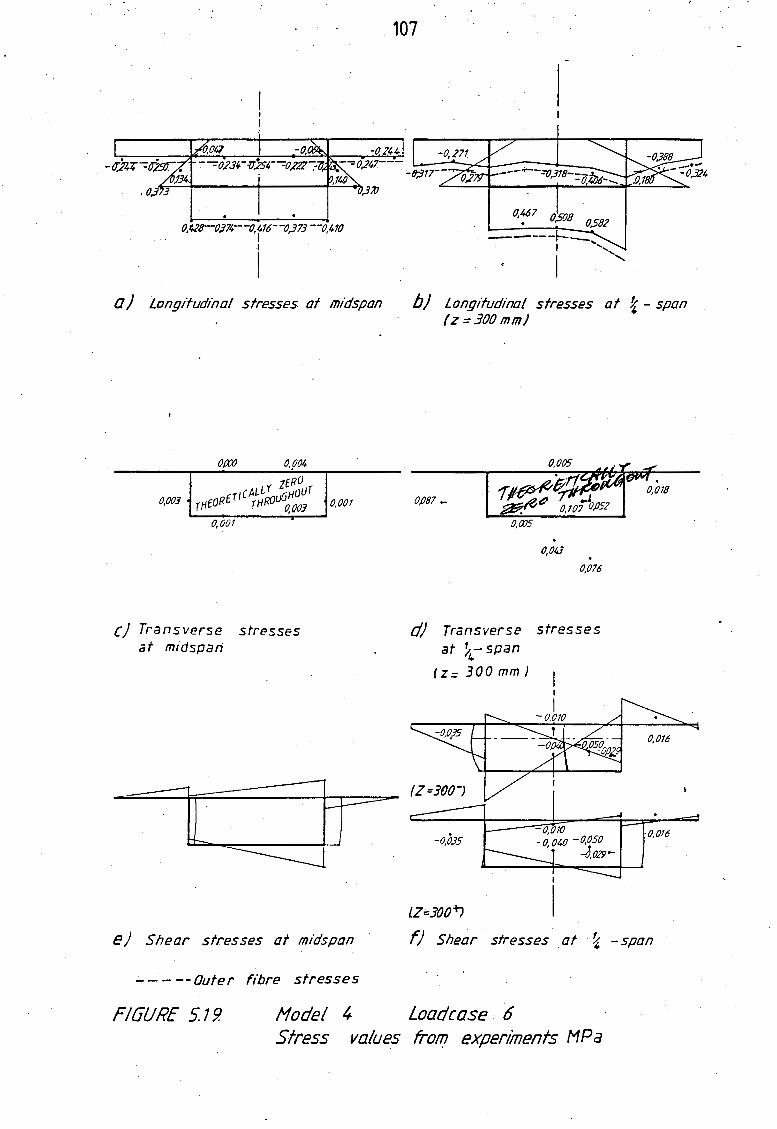
Univers
ity of
Cap
e Tow
n
a) Longitudinal stresses at midspan
0.003
0,001
c) Transverse stresses at midspan
0,001
e) Shear stresses at midspan
- - - --Outer fibre stresses
107
b) Longitudinal stresses at ~ - span lz=300mm)
0,087 -
0,043
0,076
d) Transverse stresses at ~-span
4 (Z= 300 mm J
lZ=JOO+J
f) Shear stresses at · ~ -span
F/6URE 519. Hodel 4 Loadcase 6 Stress values from experiments MPa
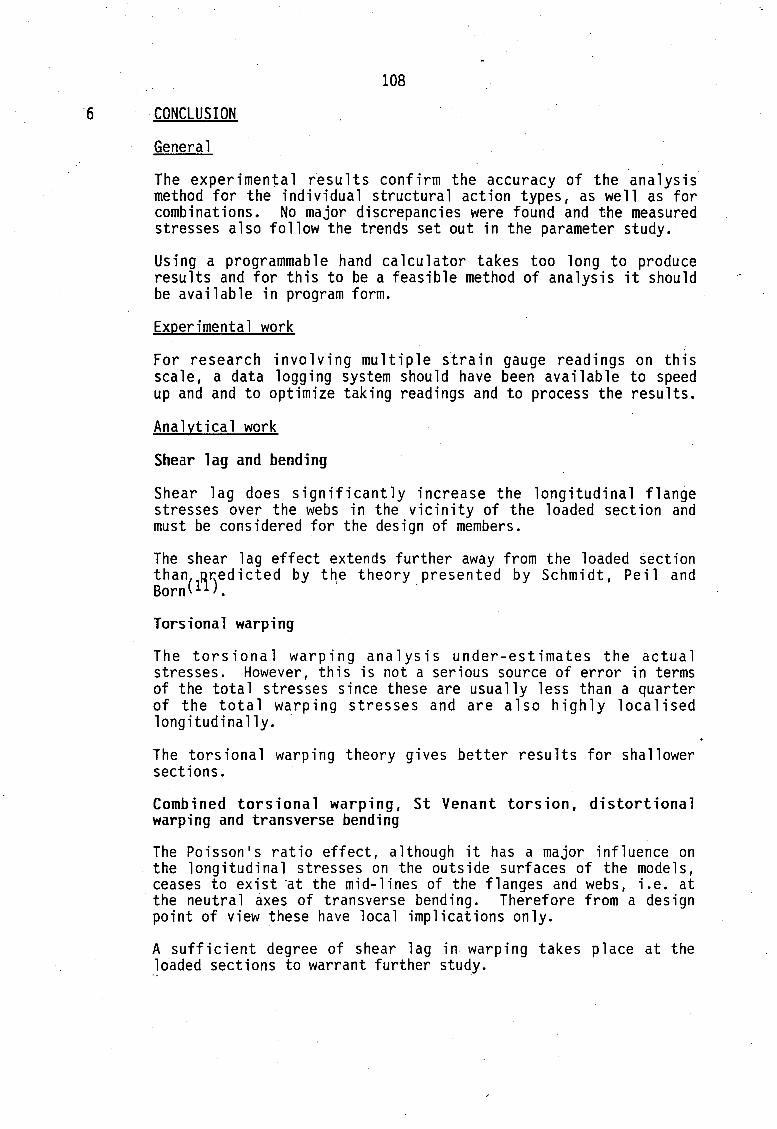
Univers
ity of
Cap
e Tow
n
108
6 CONCLUSION
General
The experimental results confirm the accuracy of the analysis method for the individual structural action types, as well as for combinations. No major discrepancies were found and the measured stresses also follow the trends set out in the parameter study.
Using a programmable hand calculator takes too long to produce results and for this to be a feasible method of analysis it should be available in program form.
Experimental work
For research involving multiple strain gauge readings on this scale, a data logging system should have been available to speed up and and to optimize taking readings and to process the results.
Analytical work
Shear lag and bending
Shear lag does significantly increase the longitudinal flange stresses over the webs in the vicinity of the loaded section and must be considered for the design of members.
The shear lag effect extends further away from the loaded section than( nr.)edicted by t~e theory presented by Schmidt, Peil and Born l'l .
Torsional warping
The torsional warping analysis under-estimates the actual stresses. However, this is not a serious source of error in terms of the total stresses since these are usually less than a quarter of the total warping stresses and are also highly localised longitudinally.
The torsional warping theory gives better results for shallower sections.
Combined torsional warping, St Venant torsion, distortional warping and transverse bending
The Poisson 1 s ratio effect, although it has a major influence on the longitudinal stresses on the outside surfaces of the models, ceases to exist ~t the mid-lines of the flanges and webs, i.e. at the neutral axes of transverse bending. Therefore from a design point of view these have local implications only.
A sufficient degree of shear lag in warping takes place at the Joaded sections to warrant further study.

Univers
ity of
Cap
e Tow
n
109
Combination of all action types
The analytical method gives good results for a combination of all structural action types (as for 4.4) and on this basis is adequate for the design of concrete box-girder bridge decks.
\
'·

Univers
ity of
Cap
e Tow
n
110
REFERENCES
1 Case, John and Chilver, A.H. Strength of Materials and Structures, 2nd edition. Edward Arnold (Publishers) Ltd, 1976. pp.69-89.
2 Heilig, R. A contribution to the theory of box-girders of arbitrarycross-sectional shape. Cement and Concrete Association. 1971. Translation No 145.
3 Kollbrunner, C.F., and Basler, K. Sektorielle Grossen und Spannungen bei offenen dunnwandigen Querschnitten.(Sectorial quantities and stresses in open thin-wall~d cross-sections). Mitteilungen Schweizer Stahlbau-Vereinigung, Zurich. January 1964.
4 Kollbrunner, C.F., and Basler, K. Torsion in structures. An engineering approach.(Translated from German). Springer 1969.
5 Kolbrunner, C.F. and Hajdin, N. Warping torsion of thin-walled beams of closed section. Mitteilungen der Technischen Kommission, Heft 32. Schweizer Stahlbau-Vereiniging, Zurich. 1966.
6 Maisel, B.I. Analysis of concrete box beams using small- computer capacity. Cement and Concrete Association. December 1982. Development Report 5.
7 Maisel, B.I. and Roll, F. Methods of analysis and design of concrete boxbeams with side cantilevers. Cement and Concrete Association. November 1974. Technical Report 42.494.
8 Moffatt, K.R. and Dowling, P.J. Steel box-girders. Parametric study on the shear lag phenomenon in steel box girder bridges. CESLIC Report BG17. Civil Engineering Department, Imperial College, London. September 1972.
9 Perspex properties. Acrylic Products (Pty)Ltd under copywrite of Imperial Chemical Industries Limited. September 1975.
10 Reissner, E. Analysis of shear lag in box beams by the principle of minimum potential energy. Quarterly of Applied Mathematics. October 1946. pp. 268-278.
11 Schmidt, H., Peil, U., und Born, W. Scheibenwirkung breiter Strassenbruckengurte - Verbesserungsvorschlag fur Berechnungsvorschriften (mitwirkende Gurtbreite). Bauingenieur 54, 1979. pp. 131-138.
12 Steinle, A. Torsion and cross-sectional distor/ion of the singlecell box beam. Beton- und Stahlbetonbau. September 1970. pp. 215-222.
13 Swann, R.A. A feature survey of concrete box spine-beam bridges. Cement and Concrete Association. June 1972. Technical Report 42.469.

Univers
ity of
Cap
e Tow
n
A.1
APPENDIX A
Tables of Experimental Results
Strains given in millistrain units
Stresses given in MPa

Univers
ity of
Cap
e Tow
n
A.2
TABLE 1 Strain gauge readings for Hodel 1 Loadcase 1
NO AV LOAD LOAD STRAIN

Univers
ity of
Cap
e Tow
n
A.3
TABLE 2 Strain gauge readings for Hodel 1 Loadcase 2

Univers
ity of
Cap
e Tow
n
A.4
TABLE 3 Strain gauge reaqings for 11odel 1 loadcase 3
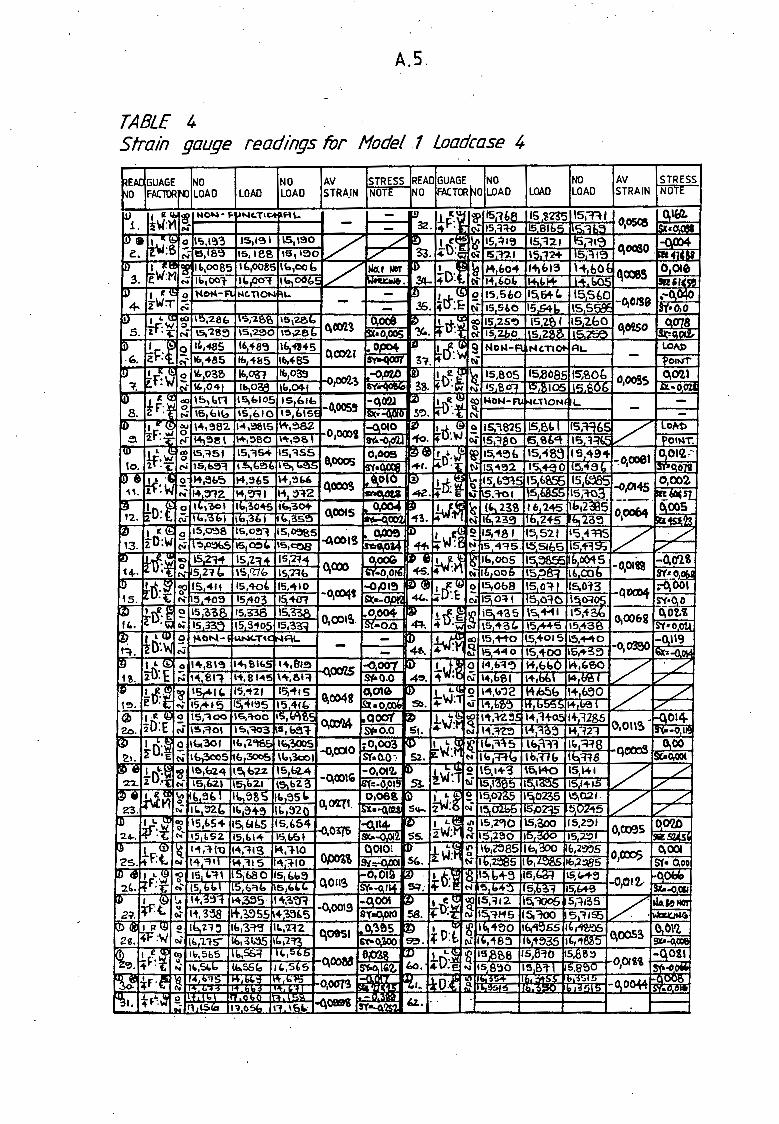
Univers
ity of
Cap
e Tow
n
A.5.
TABLE 4 Strain gauge readings for Hodel 1 Loadcase 4

Univers
ity of
Cap
e Tow
n
A.6
TABLE 5 Strain gauge readings for Hodel 2 Loadcase 1
READ GUAGE NO NO AV STRESS READ GUAGE NO NO AV STRESS NO FACTORf'-D LOAD LOAD LOAD STRAIN NOTE NO FACTORro LOAD LOAD LOAD STRAIN NOTt
D .1. ~a;: 0 13,"'1105 13,(-A-o 13,"'1105 -0.~06 ~ I L.3 w 15'5~1 ·~,410 ~~ . O,OC>i!I i. ~:T ;- 13,"~~5 l~,E.S'=' 13j~IO -q~C>b BY•!> 32. 11f:F ri.· .~5".frt<;. l~"l~S 1~!!>2~ -.n~ QtanQl)JI
IJ) 1.. ll.. u: ct; l"l,%3 14,950 14,~45 0 Ol4" -0,007 J) I L <i:l 2 \'5,'3-41 15,"'l~ \6,~3 0 "lllW" I 1140 . i!. +W:M ~ '"·~"s ~.'351 14-,9bb.5 - 1
" sx~~ 33. 2F:w N" 1s,340 1~~2~ 15,31-t ·~ Sl•O
v lL ~ \!,) Q 1+,82~5 l~CX>b5 14, S3•5 (\ 11'3 Oi514 IJ) J..r~ ~ ~ 15.~'=' 15,422 1S.~ 0..,,., ..0.0\"1 3. 14w .B of t+,8305 151008 14 8'325 "'I 8'(c0 gq... "' · T C\I 15 548 15,-424.5 15 ~~ , • .., ~O.~
~ • I L '8 1'5,~'30 15,b20 IS1f.ff'T ~<>')'T.l -Q,OCJ7 IUJ f . Q,. 2 1-t,~z 15,320 I-+.~ ~ . ,{,040 4- ~F: rJ 15 <oB" 15,bl~ 15,081 .,,. SX..~ .$. '2t:t. oi t-t,~35 16,'321 .... '?l6b 0, :.r-0
Ul .!.r. (:!'. '8 1&4?.'3 15,?.lo~ 15,433 Jl.AUf. -0.010 ~ 1 ... ~ ~ 15.~ IE.,308 15~ ··9.11 :' 0,92.D 5. +r .ct N" llS <436 15, 3"l2 15,4 385 -..,W"tO S.too.4SI '?JG.. ~- ~ al 1~.e~ I l&,3055 IS~ .. , • I l'f-0~
ID .L R0 ~ ~ NoN-FUNCTlo ~AL / / !:> 1 DR·~ ~ 15,2855 1'5,19bS IS,285 -OMl'fb ~6.'1.50 "· .. r.l: (\] / / 311 r.1:1 .. w rJ 1s2a'l 1s,201 •s.·~ ~"!'1 .• 1~- ""•o
l!l 'f.~ g> l",29"t 16,4~ 11'.. 12!:)8 a l'it: 0,4'(>\ ~ LQ~ ~ 15~1~ l~T<:>':l IS.-:t20 OlllO'} 0,0?>4. ":1. ~- ''i: C\i IC.,'29" l"r4-65 lb,'29l "" ISYl!Q. 38. + E ~ 1!>,,z15 15::111 15,:Ui~- 1 IH~
© t U> Ill 1~ 1 '308 15,4'.8 15 S095 O I ~ 0.45£ ..;.J 1 l Q:l 'l? l&,~el':J. 15,40BS 15, ... ~G cm5 -~'2,6() 8. :f'.' F:t ~ 15 &>8 15,4(,6 1s 30'j5 1 ~ ~....-qo10 3'!>. 40 :~ ...- 1s.~1.s 1s,40"l is 4e5s -o, ::.~~
l\IJ I tt lf O 14,8~8 15,06'35 l"l,8'l85 .0.5,~· '° 1 ~ \C. o 15j034_5 14~2'45 15p32 · 70,1>f1 ei 14'f':w iii 1"',S'l" 1!>,065 t4,SlS5 0.l&SS g-cao. "fO. 4D:E ~ 15,033 14,~'?3 1s o~o --().t~· S't'-0

Univers
ity of
Cap
e Tow
n
A.7
TABLE- 6 Strain gauge readings for Hodel 2 Loadcase 2

Univers
ity of
Cap
e Tow
n
A.8
TABLE 7 Strain gauge readings for Hodel 2 Loadcase 3
·RE NO
AV STRESS STRAIN NOT

Univers
ity of
Cap
e Tow
n
A.9
TABLE 8 Strain gauge readings for Model 2 loadcase 4
NO NO AV STRESS LOAD LOAD LOAD LOAD STRAIN NOT

Univers
ity of
Cap
e Tow
n
A.10
··, ·:TABLE 9 Strain gauge readings for Hodel 3 Loadcase 1
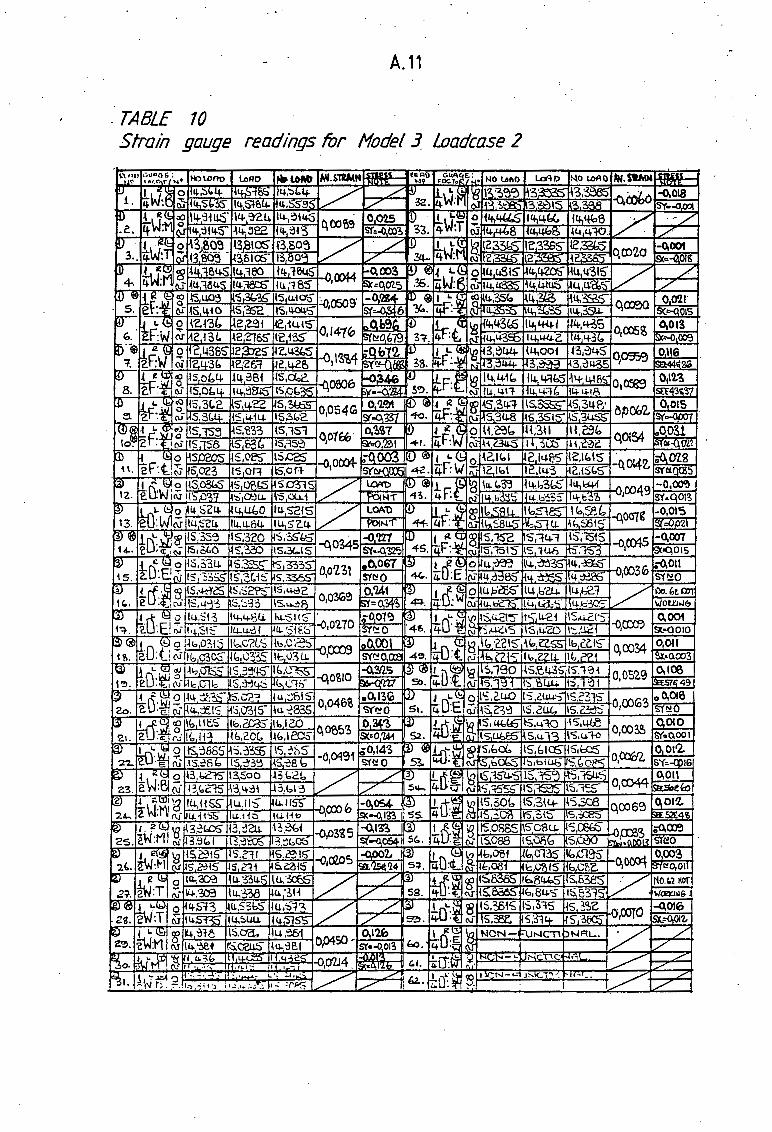
Univers
ity of
Cap
e Tow
n
...
A.11
. TABLE 10 Strain gauge readings for Model J loadcase 2

Univers
ity of
Cap
e Tow
n
A.12
TABLE 11 Strain gauge readings for Hodel 3. Loadcase 3

Univers
ity of
Cap
e Tow
n
A.13
TABLE 12 Strain gauge readings for Model 3 loadcase 4

Univers
ity of
Cap
e Tow
n
···- '....,_ ...... .
A.14
TABLE 13 Strain gauge. reading . for Model 4 loadcase 1 ·
NO LOAD LOAD

Univers
ity of
Cap
e Tow
n
TABLE 14 Strain gauge reading for Model 4 Loadcase 2

Univers
ity of
Cap
e Tow
n
A.16
TABLE 15 Strain gauge reading for Hodel 4 Loadcase 4

Univers
ity of
Cap
e Tow
n
A.17
TABLE 76 Strain gauge reading for Model 4 Loadcase 5.

Univers
ity of
Cap
e Tow
n
#'·· .... ,
A.18
TABLE 11' Strain gauge _reading for Model 4 Loadcase 6

Univers
ity of
Cap
e Tow
n
8.1
APPENDIX B
TABLE 9 of the Technical Report - ie g1v1ng longitudinal torsional warping functions for concentrated torsional momerits applied to box girders without warping restraints at the supports
TABLE 9
Btwr (z)
. T svt (z)
8 (z) z
Btwr (z)
T svt (z)
Tt · ( z) wr
8 (z) z
- A
Text sinn K18 a 2 . K K . h K smh K.8 z
18 19 Sl.ll 18 L -J.
T a ext (_1 K
K19
L 19
sinh K18 a2 cosh K.8
z) sinh K18
L --i.
Text sinh Kl8 a2 -K . h Ki cosh K18 z
19 Sl.ll 8 L
s~nh Kia a1, . nh K Slnh ~B ( L - z)
Sl lB L
Text a1 sinh ~8 a1 . - [- - K ... cosh K.
8 ( L - z)]
K19
L 19 . sinh KlB L -~
Text sinh K18 a 1 - -- cosh ~8 ( L - z) ~9 sinh ~8 L
Text a1 sinh ~8 a1 GCsvt ~8 ~9 (7 ~8 ~9 ( L - z) - sinh ~8 L sinh K18 ( L - z)]

Univers
ity of
Cap
e Tow
n
C.1
APPENDIX C
TABLE 16 of the Technical R~port - ie·giving longitudinal distortional warping functions for contentrated torsional moments applied to box girders without warping restraints at the supports
TABLE 16
Bdwr (z)
Bdwr, o (z)
d - B (z) dz dwr
. n 1T al . n 1T z T t co sm-- sm--
B (z) _ ext .E t t dwr, o 2 1 4 C
1T n= n2[l+n4(7T dwr)]
Text (t - al) ---,2,..--L -- z
4 1rra L
Text al 2 L (L - z) for a1 ~ z ~ L
. n 1T al n rr z T co sm -- cos --
~ B (z) _ ext .E L L dz dwr, o rr 1 4 C
n = TT
n (1 + n 4 ( d~r) J
Ifra L
d B ( ) ' Text ( L - al) dz dwr, o z ' 2 L
13trb, o (z)
T . a1 ext 2 L
T L3
13trb o (z) - 4 ext ' rr EC dwr
. n rr al . n rr z co sm--sm--
L L .E 4
n = 1 4 4 rr Cd n [l + n ( ·~r)]
Ifra L
2 Text al z 2
12 EC..._. [(L - al) z <2 al - -l-. - -z-)] U\Vr
Text . al 2
z 2 J] -----[(t - a ) z (2 a - - - -) + (z - a1) 12 ECdwr 1 1 L L
-•

Univers
ity of
Cap
e Tow
n
D.1
APPENDIX D
TABLE 2 of the Technical Report - K28 values
7
TABLE 2
Point on I cross-section (Figure 51)
1
2
3
4
5
6
7
8
9
Figure 51: Points on cross-section at which K28 is defined in Table 2. · 9•
K (A + 2 A ) A ~ 29 top cant + ( 5 _ 4 K ) web _ K ot
4 25 12 2512
(K229 - 1) A A. (A 2 A ) (5 4 K ) web - K ~
-4,..-:-:K-29
- top + cant + - 25 12 25 12
(Kz29 - 1) 4 K (At + 2 A t)
29 op can
(K29
- 1)(3K29
+ 1) 16 K (At + 2 A t)
29 op can
( 5 4 K ) Aweb - K ~ot - 25 12 25 12 ..

Univers
ity of
Cap
e Tow
n
E. l
APPENDIX E
Examples of typical analysis using the recommended method of analysis

Univers
ity of
Cap
e Tow
n
I I I 1
1 j i
f ~ • I J, 1
11 ! I~ : r - I I i " ~ j, ~ :~ l~-1) I
I o, , c ~ R I Vii i -a 0 : ·c; 0
i t l i. r : .~ ~ 11 '&] ~.r ; ..i I . l 1 "
J ii ! ' ' l "<f
0 !2
J
t
~ ·. ~
Iii
! t~ !
I
i 14
; .... ... ·~··- L-
.. -
.L 'r i~
~ o· I
• • • Ill :> \!)
E.2
c 0
-
t j
a .:. 'l ·-
'
I
~
r ' J1 ' t:.+- ,,
.r :4
:j
i t !
I

Univers
ity of
Cap
e Tow
n
· ~"'n.j-'<S : l'io"a... ~o.1 Lo~
_[_==----·--·--····-·-----·--· i --e. c.e-..lTI:> . A~"'l.jE>I~ : 1-\ol>!:L No I l~ I 1!i ~ •
---·----~---·----
1~_:_~_4 -~-_:_==~-~-~ ---~~---- . ~Cak.ula~.-- ~e..c\r _ $\'rc.sses __ ps ___ -{&llcx.:>s ._; ---·--------l
! + \hn ( 4ot>mOl!.t -A bre) = st;,
4 ~ + ~ • f lh.-. (M,"dl:ric) ~ .5&, 4£> ~
.. - "lb;}:: - v;c;:;)~ = _.stieP.r s~ _ 1,;_ ~~-hAd,Oo.I ~i~, 1~.h l - ... - . . . --- --.. ·-
: =- 1 I\ ( d.I .. " ·--L----------------·---.1105~ -t-\~ ~ 1n-t..J.
f - . - -- ·-~·- ·--··--- --· --- ---
- [ ___ s~~1\aclj ~ fhe. _ btt-~ ~an.qe I . ~
t Its ( boit°"""~°'t ~bu.) ,. 01,«I-+-~ t1b:9 (IYl;dl1A4) ~.SI
i -- ,. ~ 1 01" P1~ (M;dl."A.i)
( Ga.~ tt"ea.d•-"3S +c.lc.cn. at
• o,S?:f
o.!>~2- 11tl: o,~~
I 1111111 1 JI II t!Y 0,'&'32,.
f i!3 . l.-t.:~ : fit:s on m;d l;nes
at rnidsran <~;"""'~
cx.ckP''''o:;.1 h"bre'> J.
nmm!Jlilll :»== .11iu--o,~.
o, 2.E.6
o,U'6
f,3 I. I. 4 · . .f 1b:3 0<1 ~1d \,A<..,
at ~-span {o/mm'-J
__ -~= ·~~~--·- ~··-±h;- ~~~~~-- ~~t -fu~--~~~ --j · a..c:is o~ _ c;:ro.ss.:: S€.d\~ ·---(_~) . 1 __ -thc. __ _l~~+w:h·,..'IQJ _____ j shear _<D-h-cQ; 1·e. -~~ro ____ ~t .. ~i& ___ o'a<.le __ (l.Q. ~l __ :x,~~) --j and hCU"'lc: 42. also -+he. ~l~en.f-Q r~ sh..cta..r sh"~so ___ .'.
,,;.. ~ ~lOA~ a\: cross..; .~each.a~, { nlle..d ~ere;for<e.. o"\:j .
O~jSli?. ha.If -\-h::. sech...o.:.. QS or\ ~ ~) -· -- -- -··- .:
(A~Jl1z "" -fie-St IY'\~er<t of-~ c:.f ~ ~ __ _ he.It- cross s~ o.bc:.U\.t -I-he. c:.u---.6 -ro;dc..I ')(. - oKi.s -, ~ (-A!j) ~ ord v(l:s l/~'-'~s con be. c.o.lc..ula.t~d Q.+
-th::. .fd\o~~ S4p....;n~; . of
~ ~-J..., ~ I~ a 0 .. (J.,u l 1L lXlll.4~ ore. ~ ·-- =~~,~,.o ..::i ~ i1 T°t> -f\o.ntr- -b naht ot
rnidl"1~ '* wc.b _ (~ (A~l ~-= s,01.sa,4e:1. -tu;,4::>
" .... :!1 j!
I
-~~~ .'.j . . I -. .
. _ __ _..-~~!!.'!I, 116 rorn &
c hotd-ied ///) _, !!>. Ct 1 ..F.
tL @=%:1 '- i. "fbs=-0
. _ it) io~ ~~ .\o \~ ~ Ml°d·- ·-· 1,ri .. of. . ...w (~©) __
.. ___ (,\-;)!{.;: S,':TJ. Goa,1i...-Sl0.49 ·-------
sa,4~ . ··-·- .... -- . __ :-J23 1c;<;?, ~~ ~-··--· ( ha+c.h~d ,,,)
···----·- --- ·-- ·- . - . -·· --·- ----- -
~IC. ~.l.S: ae~ ~ .... calculcd.;...'.) V\ba, ..
fT1 w

Univers
ity of
Cap
e Town
"""""'-~ , .-iol>f:\. i.:.o. i (o,t,pCAEit> I ?> ~. ~j5'1~ ·. ~r:i.. ~ loA-1.:lc.~ I B ~. -------
-·----·----·---- -·-------·--------------------- -----------------·-· -------· .... ~_(L;i}~ ~es _a1e ... <:>s -~II~:-----------·--: __ t·· ll19•~ -H.:-te._9bo~-~~1.~ ~l~e.s ____ ~lc...Jodcz. __ ~ -~hea.'-----1
_ i-i{) !o~ _of ~ r·--J~t kt°"" ~~ -fl~~ (~ @) ; ________ ; ____ s+rc.s;.~ _ _?t -~ -~!:·~-~choV"'ls __ a.t_~ -~~n (~_i.6-
__ (A'd )i,._ :r Siu--. of l) ancl ii) obcN<.. 3e.n::> Qt. ~;d1;~rl.J .. __ ·----·-·---------------.. ------·--·-----~-( ~ . -
__ . . _ !-cz.. _ =--:: I ~o~~.2..s .. fl a 1~, ~)~ -+1 22S , 2.4 f'ht""- ___ v __ . i) Tor .-flc.nsc- , +o fl8ht _ .ot © : __ ---------··--------·-··--· . ··•··--· --- ---··----
j.,.) Ot I~ of' c.G.<"t.-o•d (s..~@) : .
--•-- ---·- _(~~)I~ .': - iii..) a~ + ( .SI0.4-'!>-5 •"'Vz..)
2 • .!!>,SS. - ~
-..\1 Z2.Z ,'2.q. + (- ·~ ~ ''40>
- .54 g0g • o.\- "'""'3 "' I I ") Ot ~ - d~p+h cf ~ ( .s=h~ @J: I V\!i)\_ ~ iv') ah:Ne. -lo g,ss >< 11,"-~. ~
• -54 '6~, o.+ + i 4-.?':l, fl.1
- 5~ 4cg I q.,3 IV"\N'\2 ..,
~ r) at iottoYY\ ~ we.b
( ;:;11{ • l\/J above + (6ech~@), J.te.I: obovc. -bottt,VVI +1.
90,'32 2 • '1-z- • ~.ss
-s+ 'il~'!,Of + i11 953 1 0~
-Is s4s, 01 mma. v
Vi.i.) 'Bo~ -f\~e.. I -4-o nsht of modi .~<L of ..,,e_b (.sc.ci:.10;.,©)
(I\ l:i) \... -Vi.) a~ + '2:. ei,ss. e1,<a1
Os a check.
. .+h~ -h::rttoN"\ (Aj ;,i... •
-1~ ~S 1 01 + ·H!iOG ,41
- 14 c:;~. c;;o N'l<Yl0 v
~lc.ulo.t~ (A~)•1._ uo.lue at ~C?..I•~<. ('k.~ o) o~
-fb.n~e.. \Ji\.) ob::Nc. .+ .soAg. 'l,~s. e1,'i1
"' - 14 E>i!a , IOo + i4 Ga.4 , s~
:: - -4,01 ;i. 0
_ -·----(;-)·, ''"" , ~ ..,. _ 1Co:se,'2s __ -~-'I "ll 'z. ~o~ . - .. - -rJ' = - __ !j • ____ 'E _-::: 1azs4 o~ /Z.s · S.,'11"f . -- I~ :r)(.. h ___________ --- ·-
--- --·· -·· ------ ··--· ---~--;~2~-~-~~=~ ----·-· ·--------··----' ii:) Tep .\- la'"'S~ . +o le..H o.f (!) '.
l\J ~ = -J'.2.ll, <>44 • - ~11!«,'!>0
laz.s4 001 ,'2.:s. s.'lt'f· o,o:!S ~/1""'""'2 •
iii.) lcp of · t.>c:.b, Ju'* ~ .\-a~ -f\o.r..'.Je. - .se.ch0.:.. ®:
= o,04e. t.f/,_7. '\S~ : -12.'! o o44- • -41 22jl t '24 I~ '2 •4 oio1, '2.$ • ~.ss
,~ ... ~~~~) s~ch~ (ii)-. · ~·ti) 01:- kud ct- ~d.
11.i,~ _ :-_!2S, ~~ ~ -~~ 808, o.; = 0 OSG tJ L
- I~ '2S<\ oe1,u:.. ~.s& ' /,......._
'lr) Ot rn:d -de~ of web (.se.~(fi):
'"lb - - l"i'l., o4.t . -s~ -Ac« .g~ •u •Q - -- . . ··- -·· .,- 1 a 00~4 1\1/, L .J I!> 'U;.\ 0~1. -is • 21,S'O ' ,_
. ..~--···~·· -----~
'11'~) Ot b::stl:.orn of'~ I dus.t.. obo-,,e. -~ ~Q~ -Se.c..r,.;....@ -
--· -···--··- ··----·-· - . ·------·----·--------·-----·-- ------------(lS Iba ::. -1-zB,o44 . ::16 ~4S10\_ =:O:_O,Ol 6 .. ~/~rn2 ___ ----'----
la Z4 ~I, '2.S • 9.5$
(~.~~~Q,.: ~-----
rn ~
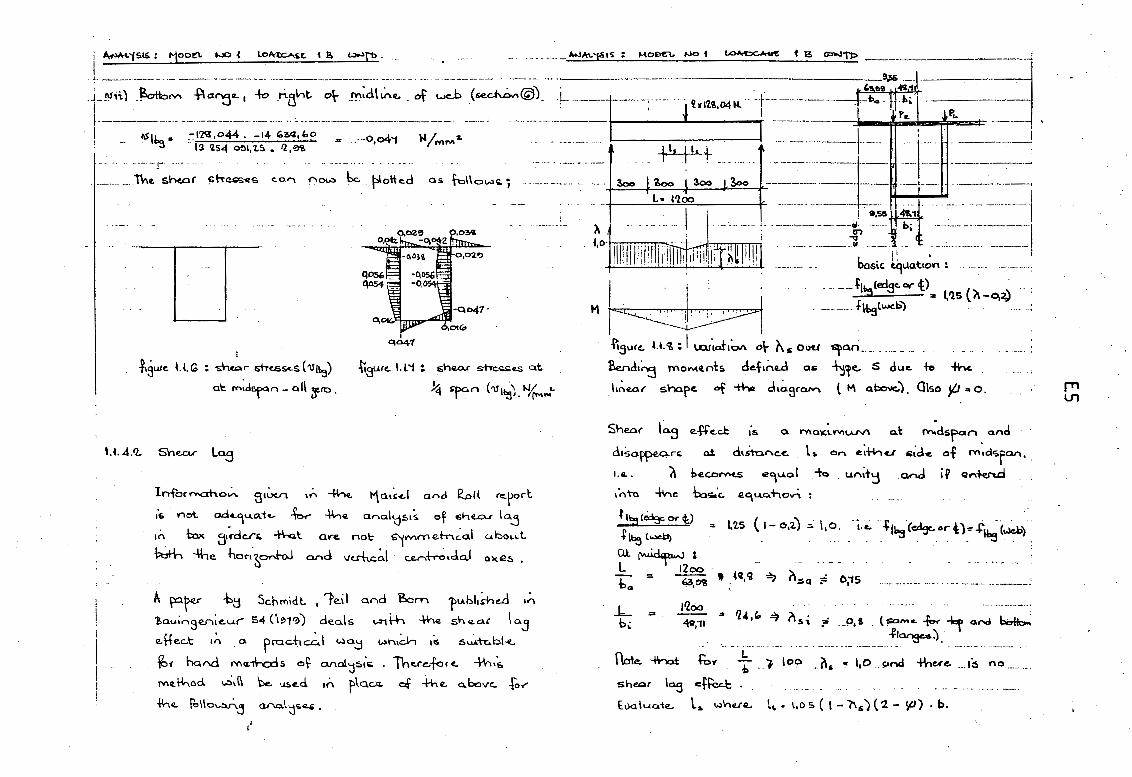
Univers
ity of
Cap
e Tow
n
-· _________ .t..J,\\.'j:SIS : MO~ fJO t ~ i ~'fS1£ : ljoofl. I-JO t Lol\-~f. t P. ~fl> . ...
L-----·-·- --------- ·--···----·--------:---.-··-------·--·-·-------- ·-:--·-· ---·. ·----- . '"9,5!;-4i~-.1
-t~~~-~=---~~-~-~--~--~B~-~--~=~~~~-~~-wc-b --~:~~>--~~ ----1--: -} ''"'·04"- l~-== i:.•. •·
t 13 cn..11'J:> !
I _ . - ~ \: • --1;-~;:t'..; .. ~:·. ·.".'.::O - =- -0,°'" M / M~' ~- = ~ ---- ' . t 1, t I, j m - ' : ::::. =_::+_::::_ _:_ i= ~=~--_J ··--- __ Th< -sh.a< <IT""5<S <•~ . "~ be t'o••d •• f,,110~< i --- -- · - -- .f,,., >oo "'° 3oo ---------t - -• -· ----~
!
-iisure U.G : ~~r mc.sS<-s('ll'lb::l)
at. rn;dsrn - all ~ro .
u. 4.'2.. sne.cv Las
I q047
t~.lfC. l.l '1 ~ E;he.a.r she.~~ qt
~ S"PU. n hr 11.. \ >J/ .. I . -;:i'. /('MN
lrtfor""'<:Xho~ 31\.JU"\ ,;, ~ t'\a.1~~1 ancl ~IL rc.~rt
16. not o.dc..'\'"'-'~:h.. -b...- ~~ anal'd.51~ of .slrte..o-r la.j
In tcK 31~dcfi;. -+hJ.t Qre. nae b°1VV1mem~al c:..bOL~t ~ --\\,e, ~or-1-~0nhJ and vc.rhc,;,_I <:.U""\~•da.1 aJ<Q~
A faF -b~ Scf.r<'lidt.. , 1e.il and Born -pu.bl1~he.d 1ri
'tau;n9~ieul 54 ('1~10) dea.\s t.rTlth -\he snQ.a( \ O.j
e.tfe.c:.\: ,;... a prod1~\ wa,:i t..>n,dri 16 s~Tt:..bl<..
~-< hqAd N\a:1ho:is ot aAal'j~i'..: . There.foe<. -+h,~ l'V\e..~od ~,\\ be. u:.c.d 10 plocA. of 4-he. a.boV'c.. .fo_,..
~e.. fOl\o~ aAa.lj<D~ ,
i'
L· 1'200 ----·---- _____ . __ _ --1· .... ---------,-------.! 1 e,55 4'1.1
,,~-.-,~.~:~.!- ----=~~·===1-~-= ii~· t. -~~~~=:·-~-=-=! --. -·- . - bo.s\c · ~uation : . - ·--- -- .
_ .. ___ ....;t1_..is'-Cai_..;;~'-c.-or_c£)"' ~'ls ( 1\-o.~ - ---- --- -f~lwc.b) . - - __ ; I~ M~
fisucc. tl.'l.: I \.Qf0
1.J-1~ o\- ~ s out.t
Bend,~ mo ..... e.nh. ckf1nui as
h~~r sha.~ of ~ d1~5ralV"\
~n._ ----- -- -
~'f4!.. S clue. +& -fhe
l M Qbo"C.) . C\so jL.I ,. o.
She.or lo.3 e-ftc.d: is a N\O)(.'.\.Mu.N\ o.~ rn.dspan and
d1so.~q.n; Qt, dlSt'anC.C. l~ On e;f.h«J s;;dc. o-f rn'1a<;fQr\• .
Le. ft W.c:o~ e"'\u.al -to . un;t~ .a.nd i9 Qt"\ttn.d
1°r\To +..c to~·c. ~qu.c.+to.n f . ll::)<~o-rcl) : ~2.S ( 1- 0;2.) :: \,o. -i.e.· +1ko::J"<~ori)::-.¢~(..kb).
- . . - ....
(ll_ MJ..ida,,,,. I l L . .-1200 - - - - -·- -·- --
1 = 63~ .. (Q,o; ~ n.:sa f: 0;1s. ·-·--···--------·---------··------·· 'Da . '
..L b.:
= 1'20o
~.11 .= '24,(o ~ (\ 5 .\ :' __ o,g _ (sa,.. .. .f.:w ~ at'd ~ ~·~:'>.
. ·-- ------- -···- ····-···--·. -. - --··-·-- .. ···------ -f\ote. -llnat foy ~ __ ) loo _ (\
6 c 110 .. 9nd +hue ... 16 no
sheot 1°3 ef~ · E.uCl luc.d~ l!o w\rie.rQ. l~ ~ \,OS. ( I - ?\ 5 ') ( 2 - tp) · b.
rn U1

Univers
ity of
Cap
e Tow
n
#to.l""-'{lOt'S. : >iOOC\.. 1-lQ. 1 LO,...~Sl:" ( !> l.U"'10 .
th'-re.-f01c. ls:" = 1,05 (2- i/>) Ll-1\:.l b .. ~ 1,os.z.. [1-0,;s].l.3,'?>S
"' 3~," MIV\ . ( < 3oo """")
Cll'lcl L~i = l,os (2- o) [!- o,'61 <4<r.11
= Q.o,S IY\h\. (Ooo """") (-hip W"lc:I idtoM -lla~cc)_
troM -'he. abouc. it (..QI\ k seen. 4'---.o.t ~ s we II be. u~;t'j at -the Y4 - sra" -po1~ts fol'" b:ri-h -the edge.
Qnd {. .f'b"j~ ar-.d 4-4-.at C..OV\5~1J-.V"\+l'j -4-hece... ...;,11 -be no she.a.If" I a3 effect at -+nesL Sli!ChbAs
DC = t - 0,5 ?\ . (I- bo) [I - a,"t S• -b;
r. :P._ - 0 13" ~:1 r ...
.. -fuclo.- -Po, a~sh~ (\ 5~ 1~ orde.t +o allow
~ non - "E;~f"VYV"l-c..ho:c.o.I load.s ( f e. F PL).
(.so(""C. ..ft,, ~ °"'d 1>crlt.,....,... ~· J. '51nC.e fL" P1'!.., ~ = Lo . Tuere%><e. use""''-" o,'l. <=>.s k{orc..
I • -b 'P. )1 ,( I 5 ~1'=9 {ed9e) .. ~.'1.s ( ~ _ o,-i) ( \ + o,s ~ (I - ;.,_ ~ ~ ·~ (.-.bl
c \,'ls ( o.1s - o,£) [ I t- o J = o,c.:.ea
I b +lbs Ct) = !.ls (lls.;-o,-z.) [l+ °-·~ L~_.(1- .!1 }] ~c. t' ""' l'c. -tl~ C-h1. ·
~
r,~t)
::. 1,'ls (o,ca-o,i) [ l+o] :: o,1s (+dp~~ ~
:. 1~~~~ ~ ~ ON -tk ~er ~11~~~ ~~~ ~;...To~~~ ~'~ ~f~~.
~\SIS : t-1.ot:ll:l. ~. I ~~E" IB ~.
fv~ -ta._ o.boJ;, I ~ Skes.5 ~ fw ~ ~ ~ ~s ~ ~u.c:A-vd.. 1n ~s ~ -4e...
. <.;.\-(ess ual.....u. c:XJCI ~ ~ ~ -le.. 1tt ( f'l~ l~IJ ~ \,dro...... ~ ( ~\.~ Oxt11. ~ %w-~ I. I. 0 ~.
:~~ ~i .i1
·; -1
I~ -.... j-
"' JP -:r
1 :'.:! -<+ ~B ~i-~-!> _...,.
l ..... ; l 1~ .... ,_zi -.-
J ~:
/
/ /
, ,
/ /
/ ,
/ flboc
' .,.__ I~
"~·~9
, I ,
/
,~ I
-;.)--
?----I
I b: / . bit: t v•t a.[ 9.s 4•.11. --:-- l -- '1
u:M~
. --- -- assUMC.d . t'iYM UCllMC.6
~ ~app~iClM~t'\ ef o 4fl-I de~r-e. pc:vc..bo~ - ~ rie.ct ~.
fi5ure. t. 1. ~ : drstc-ibul:;C?n .:tt;iwd1"nQI -hcrc:l1~g · stm.& ~inj sfltQ(" \as 1-0lo acc.oW\t ( fj"S}.
The 5~, fci! ~ kn. ~ shows +'nQ.t -the. ua..r1~h~ of \ona1h...d~o-i -b~di.A~ stfess .fro""' edca«-o{- -f.lo.n.3e. +o~o.stls; -tha.. 11-)eh c:ao ·be o{froximokd '-3\-\-t, o -t'o.......+h d.ear.ee.. 1o..robola. 1.e.. tl ... "): ~-= a-x.1 + c
! i I
i
'i
Mi . °'

Univers
ity of
Cap
e Tow
n
E.7
II
J

Univers
ity of
Cap
e Tow
n ~ -
---·- ·----·--··
CJ ,,...
-.1- .,..
~ -:z
~ re ii
II . II u +I
I I ')
I
II
Rf al 0
>
v
" -!. 1' 7. 7. .g -0 --r ::1 ~ °°' 11 ti
() +I
E.8
I . ..J .
1~

Univers
ity of
Cap
e Tow
n
E.9
-- --~--·-·
.. ~ ~
·~ ..... ~
I
~
~
E
·~ ~
z:l;= ~ 1 . -;r;
1 '11'"' ,...-..-., . ~ { E 1 " ,.; I I ~
~
"Z 7
~i1 IS 1 ~ - J ~~ .t ~
~ i lr~ lJ--~ -~ 3
II II
-T=t .f ........ I 0
·1 ~ ' ··+" .!()
} ~ I
.....
i= ~ ll ,,~--- ' \ \
~ \
I 'l:' 7:
-1-
~~ I ...... ______ _,..,..,
g> ~
' IO ' I ' ......
_j ~ ~1- I ........ 0
.5 ! ' I
.. ... ....i 4- '-' ii I
' :::::
(j ~ z! ?~L '..J
2
-1" _;
~ }~ ~-~ ciJ
~ *- '1f ? . Iii 3 ..;J
0 . O')
.. "i r;:- ~ ....;:::
'° 1-p i1' :.I § ~ ~
'fO <313 -?O'ce ~
.( ~
1 01 1 f>y\
.JE
-~ -±
~ ;t. ,--,. 1
~ ') ·i 11 £
11) I
.....
6 7-t - -z ~ +-
1 ·J ,-- ~,~
21
II
- .-
·~ l !(I -v- "'1" l)
1 '-../ ~ :i $ 1 ('It: I
_J: .. g) ~ ~ Iii'
_SJ t ~ (/'J c.,.. r -~
-:z: :z -~ .....---.
~ E
1·1 II
d ~ '-
-.!)
] -'It ~ !I" ch i .. ..i. ,,.
I~ ~1 <"}
r 11: - ci -z z
~ 0 rl N + 0
0 I
~ !I ~f
"E .., I/)
v <5) ~
II II "' ~
0 I 11 -
·.S. ~r N N
" ___.. II j - t- 1~ Cll N
1-- ~-r " ....,. .... ~~ ('n If)
') 1 ~1~ f yj ~~ "' V\ ~ • 9,
ii 11
..__.. > it> ""
JJ ctl _g:> en- & I
1..;"' •. ..J- "I" -:z >
"'t- c . u +-
§ 1 4- J •i
tJ N I
r~ j 1 ~ _p ff.
U> m ~
"" 0 ·~. ~ -~
-'t 0 0 3 ~ -d:
ell ..a _f in rj I
0 ~ : 1 11 ,, ~·
...I
.')
~ Ii; ~ • ~ c;;- C' <--'
~
1~ II ~ '.! l ~
~ r-
.E' &. -..J • II
ii~!') Ill ~ -~ ~ ·i -..J
ii~+-,n ~ _El .P
ra 0 i~ a
--~ m .j. lI d·f r 11 c...... "-+
r
0
N>
r om _,
~ - j "i .. g- If I i Ill .. .. $....
__... ~
~ 0. Ill (I II
·I~ .. J~ 1~ '--' d ·i g ~ J.
...... ~- J 5 .<f -z.
~
.4:

Univers
ity of
Cap
e Tow
n
1'NA-Ljst~ : MoPE"\. t-W. I L~~ I e,
1.1.5 ~~~ts
0.. ~ l"l; ~ I'~~ ~ 4e.... p.ho.{e_ ~
VOA) b.«- ~.~ flo~ 4R.. ~ ~ ~· -\-1"6.;..~S.Q... ~ ~ ~e.s~~ ~ ~ ~ ~
~-~~· ~~-~~b. ~~+,rf\~o~~~~ v~ . Sea. r\la~L s I. I. 1 z. -b I. 1. q ~ ,e---i -tQ..,
~~·
\tu_~ ~~A)~~-~ PJe-~ ~-iL~ ~e.s~-\e. ~ ~:
~-~: ~~~fkss ~· I. 1..f..
-t.-~ ~c;;t,/<5$ ~~
~ ci-re.ss ~· 1.q
~~: \~~s~s ~e. I. I. II
~en.. ~ ffrt..S'i ~~
~~5 ~·uie.. 1.1 .i.
O,S16
-0.267
'----+------t-----"O.S~
o.u1 o.ut ~
O.S16 O';S76
a) longitudinal stresses at at midspan
ii-~ ~.J
t''~~ov' o" .1u
,~'""1.i"'
C) Transverse bending stresses at midspan
0,079
0.0'1 0,0'1
e) Shear stresses at midspan
FIGURE 4.2: Model 1 l.Padcase 18
0,714 '---'1-------t---.
0.766
b) lllngitudinal stresses at ~ -span f z =]()()mm)
1. .. ~ ~
~~\;' ,/,'' ~ov
1:l""&'o ,~,~'f.
d) Transverse bending stresses at % -span (z:]OO mm/
0,013
f} Shear stresses at ~ -span / z =300mmJ
wmbined stresses from analysis
rn -0

Univers
ity of
Cap
e Tow
n
E.11
--------··------

Univers
ity of
Cap
e Tow
n
E.12
·-·-·- -· -----·-· - . . --· -- .. - .
% E > '> \9 Ill '> :t £ > 0
~ .. ~ e Ill tCI
~ ~
6' > i In g ~ ~." .... f ...,,.
" tCI ~~
~ 0 £ .t E
~ 0 Ill '> ~ T ,.. Cl' 0 !!! -ii
"" -i r- (}""" ' . ii ~ -~
'> r- I ()
~i ~
00 I- r-
~ -~
j. n Ill ii ~.
--;;"" I! 0-
c<>' t- II ..... a
1 + T /,;"' II OI. (jf 'll ~
~ IN' s ' t; Ill~
_, .... ~· ~ j .?
t" "' + di "' '9 ~ N .[ ~ t/l
"'- .. i:: 1 - ......, ..... 2 "a -+ Iii (~ l -1..:. "'· :§" ~ "' _;;;. +
~ Ill ci UI "'> II Iii I -
\I ~ _,.., + ·~ IJ
~ r-
_,,, .., "(\ + !:'
or 1(1 T ~
..._,, ..._,
~ '! -::./. \111 0 cri" ,..: ell
~ ,..: r- Iii :i.i } < "1' .,..
E' CJ ..c * "
,,. ... + 0 . . Ii'> ~· ~ ..J
t!lil}~ <Sl !fi ~
~ E ~ + (\ 111· 0 ::J. .oil c<> ill' .,,. "'- ..._, '9 . "~ 0 a>_ .,.
"' ,.: t ...._,, i"" "' 1/'i I()
-.i ....,
~ ~ "1' -ul ~ - -< \/I r ell Ill ~ b
fil. I) i'
~ C"&·:r--.. _dl .,.; 111· ~ H "'t Jll} "1_ -II • "- 61. ill C!l "' 111· Iii &1
:.D
·~ -1"1' Ul
b II dl 11'1 ,, ~ -(('I ·j o " II II ~ «I " - 1 !- 11
II 11 II II
•• -11 If " ,, !!] ~ .s: .....
n :n ! ~ !:" ~ -u_s:..c..C H ~ Ill
~ ...a ...D ::Jo :;;/. '::.I. ::J. " u .jJJ 1(1 v l ·- ·-··· -· . -······-----
i;1 it . ·t ~ ).
f 1J1 ~ ~··
<" ("
£ £ ~ ~· '"T
2 illti ~flt ~ "' T Di '
g~ ...._,. ~
'2 1 "' - j ...::_
'1 '% 1-1 f- 1 -4 f 1] tt ·t . 8& J-1 ~ l ~ ..!) r 1 ..f! --' 3
~ a I ~ j_ ! ? l .3 Ii
.. N 1 _a - ). ~ i J w
l ' I I I
t ~ ~ ...
-3 I tl
~l ~ I
l11J i /'""'-
i:: "' I Cl ~
0 i:: I :2 tJ. ~ 1 ::i ~ ...J Ill
Cfl ~ - IA ~ "' t~ ~ 1-~~
,.. \II
I ~ ~ ! -.g l I 0 J. A -1-
~~ a :r CJ 0 l 0
~ ~ ~ ..J ~ ] ~ 11 ~
~ ...; (!)
I ~ ~
i :z 0 (<) "')- --- - q) l 'c:l Vi ~ ~
~ "l 4l
~ :! ~ ... :J ~ .~ J t-
~ ,..
~ <r 0 ~ "' 3. 1-F ,Ji. I #= -r .i :i ......... _, ~
"' -iii
:t ~ ~ • ~ "<r
~ ~ ~ C"'
l <::!' <:'> ~ ~

Univers
ity of
Cap
e Tow
n
!'.N>.t.j:.l S '! !joDO- l.:lO. ~ LOApc.f\-.SC: 12.
w-t...r= J5pu(aa - 1C5vt: ) dspu ~ 'iec.~ ~ " .A~.1-i
w\u.rc. a%=~ d..st. ~o- ~ ~ -b~ 1c
('Mi..cL -~ <>\- u_oll pr ~ ~ <..:>~.
= 18,&<0 (Y\(Y\ (-top~
::. lo~,?.~ = &3 1 l<.co mrn (1..-)ebsJ
:. 3e1 64 - t~,S'-::. l<?>,ee mM (boito ..... ~) ../
Cl.t_ /.,. ~ E. I o\1!~ -::. 0 (~~-~)
io1,ioc. I 5*.S -a.o. lo°' ) d _ ' s -fu $, t.l-k/" j(IQ,'l'-- 'l.lCll,Jl.!£,'l><!.S,'!>1 f'V _ ro7s , " rt\m z v
0
11Z1?~ lit c, uhM = J (l'il,%)dsrcr- '-ls,t';. "' <011,·a mrnr.
$,'""
\/
{~.so 1'111,1~ ) d CU. t>, w-n.., = j (s?>,'-" - ~.4l s f>«i" - G7s, C.
:SS,"-
= C."38, 4 mm 4 ./
Os,,.~:
14'- '" cu £ I (\,61'.:>f : ! ( \!:),~ -
si.$0
_, - o,oo ~) d:s. .;G:.s,<t - b<_ ) S, 6 '!l i"" ( 1 ·." . sh.ou.td. 'r-"'
Ci>lS,c;,
" JI . A ... . ~ l;° ••1.0 !».. • iA~ -•'1,0 "' c ' .....-J..;< ' ~
./
J ,s,se ,L 101, '3-z ~ t.&lse i 1'llili&6 3. '2. 2 : W-n...- d1.Cl.j.-o"" ( romi)
f"_.....; .... l.A iZ.'l.P
""'1>rt..'\SIS: Mot:E\. tJo. '2. l.OA1XAsE2.
I
! i
I
tu~ o\ c~ .. ;
ck "- 1 w~,dA=-\cxg~~~~~ oicr~-~. ,.,
101,?."Z. 5,01
"' '" ( '2. -""lS,6 .. ) + '1.. "111~"· 5i!>1 (~11, s2 +1. -IZB,O~ + - 1915,ba) +-
... + fl..3s,a:. ~A, (:.i;.1s,,~ _. .+. -1~,"'+"u.1~+ lot,~.S,&'!> ('2. 63'9,.fa)
: ~o1 /288 ~Ill. = 4o4,-z.~ 11- loG> rnrn." ...
CCU\ .. J ~~ d1>.: CWnJ. ~~at~ o% ct...a.-~. A.
" IZ+t,4~. s,eri. l1&,sG2 + '2. &s,e4. e, .. 41, s&,'-';2· _.. lcst,az. • .s,&o. 10,0eL
• 'l 88~ "' 'l, 8,0 If. to' l'f'WW-"- ...
c"'""' 12 '5~. 10' "'" Q.«~o. 10" _ 1,s"'s .ao" "' r2, 1 az v K 1~ = C"""'- CS\/t
g-&z 12~ 45'!> L
C. twr .::: ~I'!>• Cw,. 6 l " + .. Q,1'£2. 4-0i,tt9 -.10 = eez, 111. iit- o ""4Mv
K fG ~ l'i "' · Cs"t :I
(\OSO. l,S:.s.10'° )~2 Q~l'i>. e87.,1'l. l0. •
'LS I 2'-~ • 10 --a l'llrfl -1
./
tuaiu.o.L.. ~ I t-wt ~ t ~ {!JI. 4R... ~ ~ 114-sp:u" (~.a~ twww) ~ ~ t~ i.Jo. '!> _µ. ~Nt>\X. Q. ( ~. 10<\) o\ -\Q.... t~ ~ tOll ~ :
t "Ill± = - I\ ses 14 -~ . 'Q 1 .::: Ba.: <Poo mm.
f°..,;.._,L....l 03. lo. ~i
rn -l.AJ
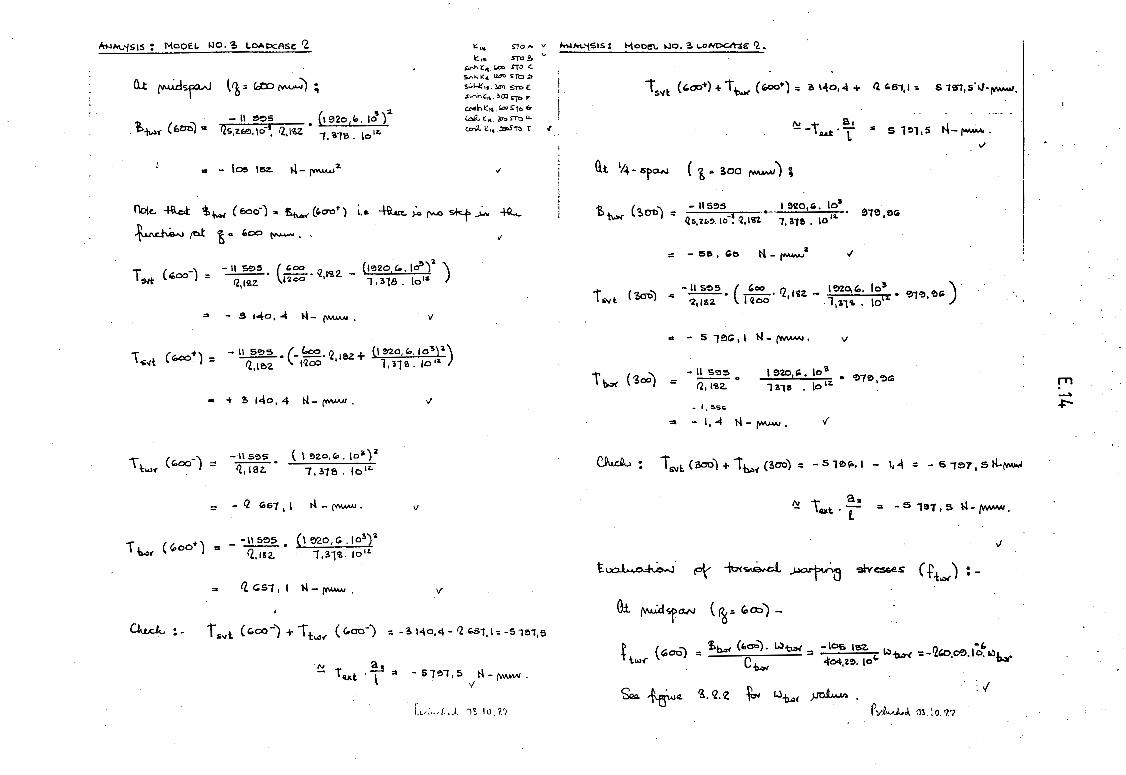
Univers
ity of
Cap
e Tow
n
"'1-1""-iSIS: MooEL IJO. '3 LOAIXASe '2 1::, .. S'TO,., v MJ"'1..'i'Sl.S: "'toOC\. !JO. ~ \..0~€' '2. •
(Lt~~ ( i = fern f"l'AJMJ} ;
. t-i...< ( 6t:TO/ = - 11 ~s • (1 e20 1 b. 16)2
Qs,z.6'?>.1°-1• 12, l'l.Z 1. o1B . lo iz
.. - 105 1~ 1-t- (V'U-W2
~.~ st>:>.!> Slf\h t:I'\. l.cx> S'T.) C..
~h)r:::c t2D'O Slt:Jj)
sO:..i....t" it. . la'o STD (.
Slf""lh(t\. ~OJ '10 F
C<>Shl:'.,.."">ro &
(aJ...( •. ~IT.:>"
CD;l. ~ " . :x.oS'"" r
v
rlote. -+ad: t-\..w" ( E>Oo") "' %....- (<.0-01") 1.e.
~µ i .. t.oo~,, -1-k ;.,, ""'° ~ _;.,. ~
v
T ( -) - II Ee>S ( c:;oo 5.1t bOO : ---• --• '2 l'i12. Q,l£Z. l~oo •
(1<?>20,t...1~)1 \
i .-aw. 10 1a )
= - .s Ho, -4 N-~ . v
'~"t ('-Oo+) = - ~.c-c.oo·2,1ez+ o~o.'-.lo'!o)'i) Q,1ez 1tzco 1. ?il"" . 10 1&
• -t ?> 140, 4 ti- (MM». ./
T \: (c.oo-) = - II S!:>S ( I ~zo,G>. Jo~) 2
Q, l8Z. • 7, 318. tc 1z. W<
= - Q fOS"( I I tL (V'MMJ. v
+ _ -~. (1 '!l20, c;. lo~y i k< ('00
) = Q,IS2. 1,31£· 10 1&
rz. cs1, 1 ~ - ('f'MMt • v
~:- rsvt. ("00-1 +l-1:..., ... ('-co-) :. -3140,4-QI0.51,1:-51~1.s
·NT .!.! = -s1~n.s K-t-MJMJ. ~Ki • l V
L,: . .,1 .. J. IJ~ Ill.?:/
.,
ls¥t (c.ao+) +rt-("°°+):: ?> 1-\01 ~ + 12 G.6"f, I " S 101, S. tJ- f'l'AM"'.
a, ~ -t.a...1:. T "' s i:11,s t-l-~.
\/
G..t 1/-i - 6fOJ\I ( i ... 300 (W'JIVJ) ;
Qs,'Z":>. 10·! 12,l'Ol. 1,a7e. 10 1~ •
I !l!ZO, tO. lo• 01!!>,CG i -h.>< ( '3. 01>) = - llS!:>S
= - S& ' t;& 11 - f""'AM'a ./
- II s~s ( 'oo Q lllZ. I~°'"· lo' t~l (?>cro/ _.. ~- frOO' I - 1,3,f. • 10(£
i \).:,< ( '300}
.. - s l!?ll; I I w - f'i'MMI. v
- II s~s = ---o
"· 1£2.
_ I, asc;
I e20,i:;. lea .. ~7!!>,<oG la1e · lo tz
= - 1,4 N-1""'-"'· v
~1'Z), 'ZlCO).
c.9u.du : Tsvl:. (300) + 1~< (3ao) :: - S l!!>ID, I - I, -4 .: - 5 1ei1, 5 N-~
a,. ~ \'b<t.. T = - 5 1~7. s 1-l- fN'MN.
v
t~· ~ -ltx~ ~ 9Yesse.s (f-liM) :-
fu. ,w..:d"faN { ~"' ro~) -_,
~ ( :::'\ _ f,~ ("co). 1..)-b:H = -lcs l~'Z. i.:i-ti..:rl' :-Q'°,d.!>.lo.r.:>~ (i,aol - c 4°o4Z~. 10'-tw< ~ '
~ ~~ i. '2.e ~ 1.l-h.>, ~ :./
Pvi...,J...J. 01. lo.1.7
rn . -~

Univers
ity of
Cap
e Tow
n
HlM..'1~ : Mct::eL ..io. ?> Lof\-~E '2
1'.I:. A. p,d ~ :, ~\:...,< (<000) = o ~~-~·
Qt!>' ~-h.,,, {"°1>):. -!2Go,o~.10-~-co1s,'1 .. o,qb o/('MM-'Ja. v
a! c. ~ t~, (6o0) = -'200,oei.10-~ '"11,B:::. - o,l!Ol t-.1/(MMN• v
Ott>; ~11,., (i<ioo")= -'2'-0,00.10-~ "ae.4:. -0,\<0<01-l/~· "
~ ~e. 3. 2 . a -for p.. ~°""' <=t-\R.. ohov-. ~csu . .s; •
fu Y-t - Sfc:!.N ( i .. sc:O) " -
ll St,..,. ( '300). w'h..:>I -5~ 1 65> -7 ilw1 (301>) = . C :: ~o4 z~ \o:•wh..ir = -l,&7, 10. L...)ii.><"
-twr ' . v'
Sa ~~ ti. Z.2. fo< Wk .J)~.
Ut A p.A.d.. 'E i ~ \,.,r (?.oO) :. o ~~~~~
G..t 'ti +h.l,c~oo),. -l;a·z.i.10-,, -G1s,"" o,coooeo~ o
Gt C; ~~(;on) .. -l,n1.10-7. i<;11 1e = -o,ooco.!z. ~o v
Oi 1>; ~ho< (y,O) " -1,a-z.1. lo1 . t.0·ae, .f = - 0,00001?>5 ~ o v
&,a, ~u.i~ S.CZ.G io-i p. ~o..w ~ -1.Q.. ~~ ~-i.e. s+.-es:'-'= p..s«.. ~· rg..ro ~~ . v
e,b.,.bd o;,. lo. t<i
~"'1.'iS1s·: ~..lo.a. L°""PcA-'£'2
Eu~ iO\) ~ ~ ~ <;;t-fesses (~") ~
G.t ,..w.dr Ci="oo-) ;
nr-iu.N { ~= -) :. T ~ ( c;ex>-) 0
dw+....- = - <2 Gs.1, t _ •-· d~ CCUl-Csvt d:spe.r (U'?>O-l,Sb<S:).10" ds~
= - Q c:x:iG ~I lo_i; d~ I o • -- N /{'MM-'}
Use ~~ o :z .z ( W-kot ') ft, -{\.Mi.
dsr-r
d..:i~ ...uoJ.....u.... dsr-"
v
Si:.L:h\AD.:t ks ; nr-\i..r ((,oo-):. - '2ooc:.,~1. \o-". - '~ ~-o :: C\025 ~ i. --a··-- I V ~
~ '!.c i l\S'~(~) .. -'Zoo6,&1. lo~ 611,8-(·"le.,~= -o,o:aa"/ a. ,8, 51!. v ("'-"
Sa~ 'it>· C'\ft. ('ccf') = -Qoot. M to' '-:se,.+-(-'-75.~ = -oo~ ll/ u- - -. > 'JW(" I • ' '?ja s4 I 3, .... Y' ~
~ 'bE ·, ns-1wv ("oo):. -'200'-,?.1. lo-~ o - 63.!,.f "' o.0z-t o/ ~z S~,GG o/
Seu. ~ S.2,4 for (Q. ~ a.fl -ttlt. tCJ:.ov<. sff~:1eQS', o/
G.t. ~ ("t• "oo"j ;
T 1'.>< (,oo•) "' - T-1:..:.., (GOO-) ~ ~ ~ ~ ....v~ .. ~ ~e.s'W<I:> ~ ~ ~ (ew~ cV-J.-'t t.M..a~I /ile. 49~ ~ ~ W orpa~).,,.., ~. .;
v ~ ~ 3.aA ~ to-~ ct--W.. ~«- stre..ss~s.
· ~u n. hl.l'<
rn _... lJ1

Univers
ity of
Cap
e Tow
n
/\l-lAL'{:5lS : rv\OPal.. IJO. 3 Loi><OcA.SE Q
(il_ 14 - Sf"°"1 ( i :: ~00 J :,
{\S-h.or ( "!.oO) "" t~ ..... (~ -=---~~o
Lc;cn - Csvt. dCJl..,r = d&r~
- I,.+. 10-i;
('2.s~o- \,S~s} dw-n,.,,.. ds1&1"
_ 6 dw1'.s-< = _ l,024 * 10 • dsfW" ~;~ ..
Use. T~ 'b.Q.e. to ~ ~ ~ JJ~. as!"""
~OnnA~AJ- I -" -'-7S.,-O 1-l/ --a·~- ~1!, ~ (U1w< (!OOJ :: - ,024 . lo . S'3.= : 0,00CC1'3 I'~
~ 0
QonrvwJ; t>c:.· Mt. (s®'• -102" .10""". '-l1.9 -(-<.7s, .. ):: - o 0000 1~ ~'/ ~o u · ' 'IW' '' • .. b6,sa ' ~
S'C2AJl"Y'ltAt 1.'P; Ol'-h.o< (SO-O);; -l,024. lo"°': C.l&,4- (-'lS,<.) :: -o, oo ocns I}." , ~ O ~i. $f , iw.-
~ -" o- '-3t.,~ uy u1"41\.t 1:£ i 1\5-h.o< (Sae)• -1, O'l'f • (o . Ss,blO :: o,oo co IZ ~ t: o
SI£ ~e '3.'Z.7 ft,J tC. ~ of-ta.. dxNe. stresses - l.e
stresse..- ,o..re.. ~aO.. o1· o.:j ~ -J-e....°"t]'~~ . v
Eu~ ie\;- St.V~ s~ "3f"r~s (ll!l'Ntl ':,
Gt ~~ ( i: "cxi) .-
('-Olq t L (C.00") S'/~
{\S - h svt ~ - Q AIU\c:. •
- 31..fo,..{
:: '2. 101 ,3Z .1e,a.\. h
A '1S' >JI;. ("co") ::. h · 't*svi (E:.oc:i) c~"t =
h. - 31-40, 4 .. 1,565. lo"
0, <S-r-r h i.t;f'W-~
- o,ooQ~. h iy '?.
~ II'
\'o,.~vt, ... l r:·:$. \""' · ::_
~M..'/51s: l"tOPEl- tJO. 3 L~ Q.
~"~ A 0,"3J"'I "'!. U!"fU..11..t +'- ~ j nfi-/l: (ba0)::. - S,'!11 :O - 0,06& {W-WJZ v
.11.ns&.11: ("4:7U)= ..:.o,co'Z~.5.~1 .. -o.01z M~._ v
~ rYW\l. k i (Ifs.it ( c;.:,u-) = 0
&.ru~I: ('-OO-)::. -o,Otl'200'.s,e1 .. -o,ol'z. ...,{-..,~ ·v
~l'tW\t ~Di
~acr O\u\.t 'f>E ;
ns-wl:. ('-otf) : -~ 0,<f.1
= -o,o ... o IJ//'M'W,. I/
41\Ii>vt ("oo"):: -o,oozaob.0,-t7:. -o,01el N/,...........i. v
l\S ('-=-) .. - Oi$"f7 = - 0,064 IJ / .......... 'l. v s.tt s,e'!> 1··-
ltlfs~I: (600-) = -o.co'2CoG . .s,ee>.. -o,01z._ W/ ~t. v
'3'1a. ~we ~.2.~ ftw ra.. ~a.....J o~ -1-e.... ,.o.ho-ic. ~sse.s I/
(il ~~ ( b ~ f'ooo") :-
~~ 1 s'/l (bO'o+) = - t.>vt (&.oo-') 1 ~ . St. V~ ~ {");re9i>e..~ iO-i ~ ~ {o-...~ ~ tct ~~") ~ J>e-'4~ ~ ~ 1>..t ~~ µ... ~·
&a. ~ ~ .'2. ~ ~ f!'-~ ~-If?.. ie.bovc. 5"-ess~. v
~~.ea..~>,,l O 4 Io. 'l. q
j.
'
rn __..
°'

Univers
ity of
Cap
e Tow
n
~'lSl:S: MoPEl.. ~- 3 LOfl'P<:AsE Q.
G.t 111 -?"1 ( is "" ~00) i
ru s..it ( 3oo"\:. lsy't; (~~ _ - 5 ,!!JG I 0
\/ J_ IJ/ 'I 1... - - - 6~S • h I u " fl l\e,(\C. • l I fl. lO"'J 1~. ~81 !>4. h - I f"'M'"'J
Al'lS'~I: (3ou} =
s ~ 'N\&J\.I:. ,. f, ·,
~ VV\t.lll t. c.
S'~~ to i
~~t>i;
h r~1:.<~ Csvt
v h o/. l.. n. -SJ£JG, I = - o,a:i:.103. ~ = I SGS,~. lo°'
nrio"t l?iou) :. 0,6!!>5 = - 0.11,.; 5.1!>1
N(('M.'M} I/
.d fll"".s./I:: (~u-o} = - 01 ocr~101!.. s,e1 ,. _ o,ozz N / ('M.w.} v
()S"INt ('?,cl'OJ ::. Q
Al°'6""'l: (~ao)-:. -o,oo3lo"?>.&,e1 = -o,czz t-J/~1. \/
(3$)
nrs.1::,."' H/. -z ~ = -o, OJ3 f°M4'-'J - '!l,4-1 v
(lab) arirs,,t = - o,cn:n.,03. e,'41 = N / '/ -0,035 -~,.
($0<>) c,"e>s - - o 110 I-I/ ~ V (\f$>/l,_: - 5,8'0 - I ~
2--'lrS\il: (~<5'0): - 0 1 croi10~.s,s~ = -o,ozz N/f""'U"V4 •I
s>Qll. *5..u~ '3 . Q. 8 fo.., fO. ~o.-.1 o~ 4-a... .c:U:.o~ sh-"es.'5e.s .
v c~e::c.1::.1.ia toe. ~£.1:3S VM..UE"S CAL.C.u.<-."<TE'°J:> "'eo.JE :
t9~nu..w &..ur.iu ~ ~ ~ ~-kr (E>Oo") :-
~ ~Ull!. '3.2 . ..t .·I •#•I ..,_ ~ ~ .:!. "; 1
l.wAL'/SIS : tjoPC\. i.:io.-a. l.oM::c.ASE. f'l..
G.iili. -c.L:l~ ~ ~ ~ ~ ~ )-0 : -
l'!,B<D. o,ozs • .s,c7. 10"{,"3.2. - 1"1 132. ~.-41. o,oh~ .. !Ss,e4+· ...
... + - l~ 1 %l'O. b0 1se. Q .s.~. o,038 + 01 02-i-.s,s~. ICSl,32. 1~1~8
~ - Q. GGS, ~ N-('MM' t:! Q bSl1
I N- ('MMN \,,. t-6! ( 1<.o0)) . :. o.~ .
.15~ ~ ~ ~I ra-re- ~ ~WJ.:.h~ - I.e. SUM.-fo~.
~~~~
- Q. o,oae. s.-01. f>s,se .+ 0 102s. \O"J13z .s.~- 0 1 02.1' .s,e~. lt:s-t i3Z
= -:sc 17.11'l ~ 1.'1 lar3e ~ ~ -h> ~ + loo.H..s..
:. <lr -h->< ( "ao-) she.s.s .9jst'2/v\l is ~~ ...lJ\J i . . . I
°4~ (1.t.o ~ ~ ~ .~ ~} !
__w'rtei -te..._ ~ ~~ ~W, ~-AX~~ iet~~~I -ta., ~~ ~"" .
tq~ ~ ~ ~ ret Afk ('1oo ... ):-
~ ~ sh~es ~ -IR..n ~~ fQ.t"(. ~~~ ~ w ~.;.. ~ -b_~ ,abo\)G, 1.e.
,e.f. 1'"' ~-, ;_.t ~ws -lRc..t ~ ~ _~.{'MD~ p.hou.t. -+e...... r.Jl..o.c ~ ~ + Q. "'-5, !> 1-1- ('MM.I ~ J.N
~µ;, ~~'9~-lc~~~ ~~~-6~~~~~ stresses i.a. t b..::.< (600+) = Q~Sl, I N- f'MAM' • (sa. f3· 7 )
t~ . .-;I -,q~• : J IQ .. l
,,, __. -.J

Univers
ity of
Cap
e Tow
n
>-z: >
. 'j;Jff§ ~~r1tr~ rj fr r r f ~ ' I m · t Ill "' . • .
t~1 rrr[ r . i ~ .. A~~ ~er. "Zi - :!.
~ t ~_j - 0 -: x.-0 rr ~ z ts ~ . ~ {)l ' 1 ~ ~
l f· i ti { ~ 1 .n .~f -~ ~ -tr ft~ t t _j... ...;, [)l
[ 1 ~ . r _m - .... 1 . ~ ;-1 ~ ·: i~ fl t rt~ l i;1 r-. ~ ~ - I .__/ {.I) (.II
.:i- N _3 ·f ~ 0 -. ~ ~ -r ~ . [ 1 -~~ l ~- . f' :z:. 19 ~ I :.... t I/) . ~
1. rf <:. p:rt 1 ..J n-
UI ,....._ tla
6"I -- t ~
0 t& ~ " c, t \;i ~ ~ r tr "~ .__/
_o ..
~ J-iJ .~ ·: ). ~ i ~-I
,..... 0 tr ft "' 0 + .......... o, : ~-~ I
----- - .. -··· ---------~
~ f ~ r r l =f 15 ~ ~ r rf r ~ j f f ~ cfi:' . } '[. . ~ ~ l -t J ff- . a ~ 1 E f j Jl <Ji J [ V\:· . t ~ !' T ~ : f f 1"' ~ ~ r tw~ . ~ ~ r ! ~ iv ~ . . l f fil r -'"' t J i ·i s. ~ . , O> • <l 5· p ~ ~ ~ ! ~ ~
~ · ulL~ir..s ~ -~ _. • · ~ ~ f ~rhtrt~.r~ t .. -r ~ -~- ~ fe · 1 3 . r t- H ~. . t ,.'l • ~-r } ... . . ~ . . t· ~ ... ~- • ~ IJ . • .
2; ~ . ;-· - ~ } Qi .
2G 1~°51 ~ :! r·l t . . ~ • t f1" II' ~ !II ~ '""' J .
i · Ii i r I t f t i t ~ t -! · ~-(~~ tl" ~ ~ ·1 ~: '
i' · 1 r -~ ( l t1. ~. -~ : 9" ) . .. "'· r f · ~· !J ~ . · · · ; , . .. <> ,,
I .. ,
.. -- . - ............ -·--- - - - - --·· .. ·-·---~···-- . ---· ... ---·
BL'3

Univers
ity of
Cap
e Tow
n
.. rJ1
.·~
~ I
"E E I -z
v
~ [ iO
I Q
'9 d -- Ill 0 1ri s ~· vi tO_ . b ~ -r-= !ti 0 Cl -: (I-
~-.,~ IXI
1
E .19

Univers
ity of
Cap
e Tow
n
ANAL'CSl5: MoPf:L NO.'! l.oAt:>el'l.SE'l_
Units fa-<" -t'ne. fo llo~in::J d1ogroros
-0,1<.1
I I 0,11<.~
v
t1au.~e. :?..Z.'?>: t"~, ~~'fl"'
(6,. "t:X>J
-0.06& I 10,0"75 -o,cqs,I , 1°·~-a
o,oie
v
ar-e.
llon::'tblluHnes ~ nr~1:tA"ll$.1~ ~.
all tl/rnm~ (Mfa.)
-o,osa,. ~J f-o,=s ::_o/ O,oz.+ I - O,OIZ.f" .._ °"Gt + ,
:i=b=-~ ~: ~+ 7 I 'Fl,_U~3.'Z..4 :..LJ'~ ~ ,...._.d~,
( b ~ G:a:>- ,(INl "°° ")
v
i:IG.UU. 3.2.i;: f +.,r .oJ: 4-;xw (~" ~oo")
v
-o,="S~'---_ - -~ - - ' t.. •O.O'I! _:s -O,Ot:'2.
- I •0,0J'!,
-14106 ~ -o.11s -o.1os
°flG.Uu ?..2.1: ns~ tat. V4-sF"'
( i= '300)
·o.i.to •)
1=1~u~e "3. 'l. • .!I : nr5..n, iOi ~ -~
CtiA '300)
l.Xrtf: lbtNd hf-...& skow~..,,~4,'l!"'t ~.
1'.NAL'fS16 ~ MDPEL IJO. ~ loAPCAs£ '2.
~.'2.-4.'Z '•. ."'\' ·::· ..... · . - - .. i ·:.:·-·-· ~ -~. ! l -
i>~"T\oo.JAL \.J~tt.le! ... N't> ~-At.JS\l~E - .. ~...,J<!
El..1'S\\C. fOJ.>-JD~co-l ~A~~e.Y.) .. -' ( t!.'FAM ON <f"
·i'
·::·:J. ...... ~~-:.: LL. -t ...... :: '· · .. :._:;: : .. ? ":.' ~:.. ,.l .;4~ . ..r~~ ... (""~~--t··~:: .-;:~- ·J"'..:.~~! • • :i,. . '-\
E~ ....l,. .... • ... ;~l--·~ ·~d..o< .... _,, '.'-'~"" .
I< bh~-( I:>+ 12bcont.)s . .:;.···;,· .· 11is · ,. ""' ,......:--r- b · -- -., o s~ .. · · . " ahwch . ~-">. I · ··V
: ~· ::: . ~ ~ ~.:
K, = -~h..bot. ' ' B eUJ dh ~- .1.11~ " 'v . :;. ~ ..
wh...re. b: 101 ,:!>Z f'f'l('t\ " bca.J. ... '-S,sa rnM v
d = Be,!!> ..... mro " nU:f • S, !!>1 IY\N'I " h ue_b::. 0,41 Mm . .'. :·.·: I/
hbot = 5, 8!> MIVl v
K a+ 11::, -1." ~"' <?>75
Qs = ~ + ~7 .. 5,0CC>. o/
:I J'~S,£5 I/ rn.'8 It : 11S,68~ iii J
c - s 1 t ql.11~.~8 t4 'l ~ /' ls :o -l!eS,.;s_,, •~· -- 7 f'"'" - 86e,4o ~
- " t -~e,-to
J c;s,ss .I 107,"!z. ..t c:.e.,se J
i'tGueE '!>.'Z.e : wdwr ~ (mm2 ) v
; fnr·\
£4. t . K-zs. b. d ~o. IOJ,~Z. Bl!>,&<f "->c:tu,.... = -.. H l-i- K-zs) ... - ( l + s,o') = -568,40 ftl(T\'3.
v
Q± G: ~d....:r< ,,. b.d = 101,?.2. . as,e+ = 4(1H:is:.) 1 (I+ s,o)
11?. 1"6 mm z..
. •./ -.; = "" ' ' ..
' \ • ~ l'-1 .• l
rn N C>

Univers
ity of
Cap
e Tow
n
AHAL'{SIS ll MODEL I-JO.<!> loAOCAsC: '2.
~.'Z.4.'Z ~~"T\o>..lAL VJN!ftt.JG ,..t-l'D ~A+Jsl/E:""e.SE 1f:i...lPl.o..J<3 ( i!.CA-M ON
£1..>.S\IC. fC\.l>-SP"°'i'Ot-l ~ALOfi>Y.J
E~ it:\) w d..o<
bh~. ( b+ Q. bCOJ'lt ) 3 = l<r; = dh~ b
bh l:>ot. -"2
l<.1 = dhwd> 3~
1.11~
wh...re. b.::. IO"J ,az IY'\(V'\
b""'1 a "s,sa mm
d"' ~e,ei-t IYlM
h~ .. S, ~1 Mm
h ue.b .::. el .41 l"l'"h"Y\
h bot= 5, 8!) Mrr'l
.;
K a+ K" -I . ' ·) ·) "'·1 c;
Qf, = _s ___ .. + ~7
5,0CO.
'l lZS Qo,sei3 "
./
I/
,, I/
v
v
-1121'8 I 11g6B~ J"' Y.>5,l>S v c g 1 "' . -!eS,c;s_,, -'1?.,ll>S _/ Lq~•'°" H ]
E - 868,40 ~ 'f .
t -e.c>e,..jo ./
J · (;S,se ,f 107.~z.. ~ <..e.,se J
-flGUeE ?..'Z.!:): Wdwr ,~ (mm2 ) ·I
D.t. t : K 15 • b.d ,,,_ s,o. lOJ,~Z. 38,e,cf loJ c:L..,,y- = - 4- ( l + K 'ZS) 4 ( I + s I 0 ') ., = -868,40 l"'\t'r)~
Oi G : LV~ _ b.d _ 101 ,?.2 . -oa,e{ "' - •HIH1!!.) - 1 ( l+ s,o")
IT3, "8 mm 2
l>IHAL'i51S t t-\Ot:>£L. lo)O. '3 LOADc..-.sE Q
I Gt -H : W ::: (b+ Q bcont) • -bd -~ !244.'IV.. 113 E>S "' L.... b 4 ( l+K-z;.) \Ol,& ' '3e)S'' 5 IT!l'l'f I
" Vnkulo,lt, ~ ~~ ..U~ ~ 1' ~· ct· ~ CC'OSS • ~ I Cc:L,,y- I fa ~ ·
C _b~. d~hle!5.\? K ~o '383 er,o v
101,a.2-z. se.&f~ e..fJ.q 1'32= '?,~o,'3eit to rnm du,,...= +a .. "- . " ~ ::a -{'! ' c
( , 1n ~u'2. K = o+'Z i:::~+ 1<,,+.K •. 1::7"' Q ~'2 "
4 r +i:::<;; +Ki I
E~t~ fdS~
'3 s.~~ MM/. !9> ==
hioe l'l (1-\P)
... 1'2 ( I - o, 3~ ... ) -:
l20,e>12 r-w.
I~ h!ot 5,aoi\ · rn~
c l'l.( l-\J") .. l'2 ( l - O,"M>') = Qo, OSS ~.
I i....c.e. = r.:.U. .. '!l,..\13 t'l'lm/ 1'2 ( l-\J .. ) ltz ( 1- 0,3!'l') ...
"3,'4IO~ ~-
K21;. = I+ ii} + ~ r, + lbot
I 'lot + I bcrl + G l_ • It.er. It.rt. 'Z ~{,
= -42, 1253
IWcJ:> b I~
Q4. tueb ... Ii:...,. = K'.lc;. d
124. '?.?.,-tco!> -=
l'Z,25~. i~. '64
362. 4-, '20~ rnm2
;:
<;
'/
v
t uo.l..u..c.L.. 'B d..:.v (z,} 1 d f> d...:w' ( ~') r:;u..d- ~ b-P tz} to!: -l"1..
~~ fOJ'-d.- 1/4 -~ lti.:~OOJ ~ ~ ~
I/
v
v
4u,o.:h.ON.) ~ µ.. iABLE I~ I ~~IX !> . (~.Iii). U:se. 'tits1'tx.1''
t-<aaca-.l ~ ~ Hf41·C. ckk-~ ~ ~ ~ ~
~ ~ '\~4~. ·I it-. :.'4 ,,.J_\ J.;, '-") .. •.
rT1
N -

Univers
ity of
Cap
e Tow
n ..J
uJ 0. 0 I:
••
..
------···-·· ·-----·-· --
r;; ..JI
<Ji..)~ ~ )..
\....~ a· ...._,
I
I
g .,., .
U\ C' (j) I/)
= ti
'g' ~
"
::; 8 ~ II '9 t(]
J ~;
...
~ - r
'91-J ,£ N '> 40 ....,.
ell 0
'-"
8 '3 0
n
·0 tf\ -.r 6l C!' l.ll
=
1
l I
"2
..... Ul
N 0
<:::"
,,
~
.2 ' 0
~I~ I
I
§
I
-z
I IT
E.22
.., ~ • ...,. \9
Ill t/I I
11
,.-.. 0
I 0
s ~ 8 ~~ ~~ I
I
" ,..... ·s ~
~~ -ul~
I ..
'
j
I
f I
~ t
~
,,
>
'8 ....
ti
0
11
'o' 0 .!)
1
u
II
l f :z ~
111 E 8 ~ E ~
1 8 ., •II ('(I co .. " ' " -;.__? N ~
I
_.:!"
n UI \t
tJl
~

Univers
ity of
Cap
e Tow
n
..J w ll 0 r
If
>
,, r-" ui
::.
II
.t ..c
II
L Ill I
~
=
,, II
ti ti
3 \I
'o ~
II
~ 0 ,,
'.] -r-r r-
ti
r: r r-
E.23
r: rr-
"
..., 'o
.....
>
.... 'o
.. 'a .
,, 1a" 0 \9
' ,,
> > ,..:
'8 o_ 0
If
II

Univers
ity of
Cap
e Tow
n
Aut\~'{s1.s: MoOEL HO.~ LoAPCAsE. Q
II' -• 802,"2 o 11~ IJ/ 2. a.t 9 i llfdi.or ( ~ocr) = I QS'?>,'-3. lo • ~ = , .., fW'W".,;
~ 'f.aurt.. '6. '2. 12. ~ P, ~ o.\l ~ ~ -st~s.
' Ql ~ ti= k,oo•) :-
I/
s~ fz. °Bdo.,or (GCOi'): -i ~dW<' (roco·) I Jl ~(~ -le.....:..t ~ ~£~ _µd.u.t.o pf -tfu. 1s "' <PcO-+ ~ ,CUC, A9 ud ~ f'M'°G~ ,\wL ofip~fR. . ;_, ~ -b -\fu:n<. ~ ~.,_ -P., ~ i= e:ioo- ~. v ·
~ -1\5we '3. Q. 12.. ~ fO. ~ro.-J ·'4' ~ 5!-re.sses · I/
fu. !4-s~ ( o= ~) :-
\1u. cL.~ µorh ~ stre.=e.s µu..; ).JC. ~ o! ~ f'4.-MJ- ~ of <UD5.S-~ - see ~ -a. 12.. lo.
l'\I (~oo)-= - 'Zo2,s+. lCT"J,32.. '!>~,c;;+ • K2s = - eio, 11. lo~. l<'l'i ~ 2
c:b" '3~o.~. lo.,A (I -tS,o) h h mm v
fl. • l ;\ -G 108, 06 1-1;, 2 u:i.. l 1 nr dwr y:x)' = - 2>0 1 1 l. 10 . --S:W = - o,coe rnlT'I .;
I/
11. ( -<: -sz.,10 H / .u.t. Q; (IS' ct,;;,. :;oo): -eic,11.10 • s,•!q .. 0, 00 l / ["V..w}
v './
{}, ( :'i -b '7;71,0S w / w. i ·, l'\f d.....x 3001 : -0011-l. lo • ~= - 0 1010 /mmz.
. v \;
. (\, .J. -~ -1:00 ~3 I.!/ UL.,.; nsd..u" (3o0)= .,.00111. 10. 5 ~ .... -= -0 100~ 'mrn2....,, .
v
~ -723,IS. _ t-! / (}( S ; (\S d.wr (300') :: - ec,11. 10 . !?l,4.1 - o ,ooi / ('WMi z.
,6.,NAL'{SIS : Mo:DE..L NP. 3 LOA"t:CAst Q
Cli. ~ ·, l\S d.w.- ( ~oc) = -~0 1 11. \o- ~ -"'e'i~,° == o,ooC:. '%: '2. I V v f"A"W
0t. :'\ -CD . l'? 1 4-Ca 1 ·, C\S'ciw< ('!>oOJ = -eo1 11. 10 • 0141 ; o,ooo v'
n. -c. \'l,4'0 U1 8 i C\S d.u>r (-:,cO) ::. - eo.11. \0 • ~v o, 000 I/
fu. ( . '"' 'i!ICZ,"2 H / '!l; 1\f ~" '3c:O):. -eo,11 . 10 . ~ = -0 1 01e. /~z
" ·v
&irz. ~we. '3. 2 • \ s -\b-r ia. ~\"O.IMJ ~ ~ p.bo./e s.ffe.s-ses •
I/
tu~ q +r~~ srresse.s ,+t,b• (01.~ ~ (tUU:l. ~ - sp:i.iu ~ : -
Al ~?Sr ( i,,, Goo) :.
\1 lrh & (<;:;ooj: E .I.,e.t.@icb(c.c:O}:: '2 ~IS. ~,<l~. -\108,'llO. lo°" I . '2(l+K~) v 'Z (I+ O,E>IO~)
Mirb, t> ("°°)
~ K3o"'
: - S 1 a~~ ll- lf\M /mm v
,,, _K:!.e .E.I:l'IZA. ~'t<i:>C~ =-o,~i;0. 122>1<0.4',i~.-llCS.2'> '2 (I+ K:so) 11 CZ. ( I +c,e><Pe). 101;
= S 1-1-mm./ , IGZ /mrn v
b !l!l!2 3 +Cf. Itop
.._ Iwc.b 3 +..J:.. ·...--
d J.1.ot
3 + 101,f.. 83-4'0 ::. 38, Qo,~1'2.
~+~.~ 3'l,'l{ '20,0'80
n;, 8 SG~
=r °' e>c;li?) "
~~, ~ Sf!C:S£eS COJ\J k ~ f'J:J ~Y!. : -
I, •• ~ . a:.·•.~ ,.. · f ' ~ ,,- ·1
rrt N +'

Univers
ity of
Cap
e Tow
n
ANAL'(Sls ~ MoDEL No. 3 l.oA.PC~SE Q.
at ry of web, 01. tl<l"(Je t b(~= ~z. • - :..~~ = t= O,Ser( %m-z. . ~r ~~ v
at tor or~.~ ~ -ft...-b(bo:i)=- ~41 ... • -s,2>2~= + o,~sr ~/f't'l1ri~ . v
a.t M. q web 1 ~ ~ h..-b (~= :..n1. &,l"2. .:::.! o,'!4J> H/mm2.
{>1___ co v H o.t M. of~,~ ~e. t'trb (coo:l) .. s.~~t. •S,IE>Z- 00 ~0,8~3 Ymmz
~{s~e S.2.13 -fO.r P.. ~ ~-W.....Aho./<.. ti-ress~. Clt. 114 - sparu ( ~= ~oo) :, v +
Mlrt>, & (YJO) = _,
12~1~. 4,'.?0"::>. • SS,'4, IO .,,. - o, 11 4 H·mm /.'. mmv fl. (I+ o,~4!>)
Mtrb D l~ = _ o,eia~. Qeu'iS . ..f,'2~.-SS,'-4. lo~= 0 IC<ie H-mm/m ' Q.. (I+ O,::>G!l) ' m v
~F , 4k r)tfess~~ u:&J\J 6-. ~ fj/) ~ " -
al: -kp o\- web I ~ ~Q. ~h-b (~ao):. S~'i?11 z. • - o,114 = + o, ~z~ %m2
at -ht of LJe.b I _;,,., web h'f'b(~O"tlJ" ...§.__.-Ci 11.\ =:; 0,012.. %!Y\1. ~.41 2
• v
o± M. ct web, .>.A. web t-b--b (~oo):. !l~41z. • o, \G'il .. :! o, o~ o/rvvn2
al b:rt. of ~ 1 v.. ~e_ t-1: ... b (?.ao}= 5~ 1 • a, \IQ~ ... ! o,ce.'i!>tJ/mm:z. • ~ v.
~ ~~ ~.fl.. ICO . .fc.t tO- ~Cl.NJ ot- +Q... ,.o..hcNe ~ess.e5. v
A-NA-L'(SIS :: 1-1 DPU, t..lO. "3 LOADCH:;E 12
T+\£ tcu.ow1t-J~ cttE.c.~s CAN SE -po~t:. ~ _1HE ste.a.s VALUES.
M;. W"~ C'.U:J...U . .Ati:t> ~£ :,
~~ cO..>Jt.L ~ JS cl.M (~ex:>)~ p.t ~~(-t\'.J i.z.12):-i
. . . .. - . -- . I honF1-~ ~ 4' ~~ .. sn.kcrr,az(-~011.'2-topza1)+12· 14•:5ei(1.0;C6114115)'.
. = 14.1~ N t- ·. . I hon~~µ. M. ~b :: ~.<ie>.g:JJ,~('Z.o,ooo+-4.01 11c;")
= 11,~M ~
:. re~ ~~ ~ ~ Cll:>6.S-~. 'i- O po_µ
~u..ML .pt ~ ~- AC\,,~ (1ite.ss ~.
~ Yu ~ ~ ~u..J, ~ ~4. ... (e.sulh..J:. ~
+= i:- 0 fJ-.o Jr> f«L,~ 16< fa. ~ -4~ fk~ ~ .
JS~ F .M. ~ ;.>zb .. ~'!>.~ !?l,47 (-o,oee+•l.-o,oe~ +o,oo~
= -'2~.~J7 H (t~rhswe.h) ~-a-1.e
:. re.s~ ~. ~ ~ .. -<lr...tTl. \at,'!>tz-r(!4,J~+14~'!R..'&f
( abciut ~ • ~ at c1ot.eJ. pt"" )
= \o,oa, t4 - rnm j
~ f\\lC-W: µ ~ ~~µUQ~~ -be~ (V'<D"'-'1 Pt 1154?>'5 H-mm f'll\.d.. -\e.... N'o.,.w- ("°°-") ~"
.. ~~µ~ ~-a.9~ P.·c.'..1 ri .. • ... ..:.!' ......
I
!Tl N lJl

Univers
ity of
Cap
e Tow
n
? ..
ls ft r ti
i r i r ~- l ~- ,. j f J t f ' i 1--1 1 ~I - II r
~ ~ 'f ~II~ O di~~
i OI : ~ ~~ ~ ~ ~ ~ ~ g ;. ~ (' ~ ?~ I .9 ~
· 1 j:: j. ;- n t I ti\ ~ • f
1~~
r \...:I r---fi~ &- ;
N -1- "" 0
l.t q 8 ~ II'
-....!./ + r- ~
:·
~ .t
e .._.,,
k 0
g ~
_]
l G-e ~ ~
Jff F . ';' J· r~
I?. r-
f- 5. ....
II f l w, f
I I II
·. - 'c
Ff 11 i::J I"> "' tr :er' ~ 'b· ~~ _l9 ~t •. ~ 0 ..... l IV I!, 19 .O Ill
i ~- 'f ; ~
11
~ r ?· ~
1 (0
" •
~ §
r r 'f ·
-t ~ 1 ~ ,.
~ I t
I ~ ..-.. (JI dl .. ~
(}J
R C5">:9 z i, z: ~ ..J,. ~ 'z;
~ f l t ;_ i --: ·• a cf -~j +_ ~ b ~ o-">
:£ ;.., in :_. <P Ill
i ':( ~
t
~ ~i r _£'[· ~ ~:n j:> . :!
j "' 'F· 8 . t f2 1<f ~ ~ !
. er- 9. · ~ ~ Rf- ! R
rr t ~ ~ 1·~ ~ ~ N
;· 5. ..8 l ~i~ t-.J 8 ~ ~-
if J. cf } . ~ ~ r~t ~ ..
' r
II
"' 0 (/I
z. I
:I. u
ll
+ f:> ~ ·to UI ~
• t.)
~ ~ . ..
f rcr [ ~ ~ r~ P. ~ li F~
~=l - ~ ~ ~ I~
3 3
lJ! Ill
-~ ~ C5">
f ~ "' iJ ~"'I
~ $ ..:;:; <~ • g - ~"'" ~ ..:;,t o.,. .. "' . ~~ ·. .s .o ~ A-~
i .. ~ u ~ i
1. i~1 rJ 1. [ ! tl i
"' ~~-
~
~ . n ~
i t ~Ci i · r~ ~- f ;
I
- J. f 1 Ir .._::,, : .. I
;z:: I
3 3.i
~ I J ~ -f . ~ : l i);..t:) • ~ 31 d ..s -"t1 }: ts 4- l i
J9 •
!J: ~ -: Jo . .. . ~ ~
~
9z·3
~ "'~ ~":(>
ciS -
<I.- ..$ ~ ·" ~ Iii f
]
'o g
~i .+ i
. ~ 8 -;b ..a- ~ C.lJ
's· .-- ~ ~-
1 ~ ~,. -~ f -. c.·
l . f . ~
t -1.
I -
'J! I • 1 : : ~
l! t='. f ())" '
i

Univers
ity of
Cap
e Tow
n
Al-1Ai:{51S : MOPEL !VO, '.3 LOAt>C..oQ: f/..
Gu.di P-.J ~d..:>< (~) ~ -6::, ~ ~u.re '>. rz. 14 - 1'., ~ i ai..o( lioO) stte.ss. ~. N"' ~-le.... ~ cL.:rc" (~ c;+u.~ ~-b2.,w ~ 0:\~.
l
'E!i ~-~~~ct. (~:O> .~~ ClNd ~ ~~ CIOS~- ~ _M ~
~. H;l\I.:. 0 ~ ~-~.
M.j = Q.. liz,i.f ... S.<z>1. - o,oat. \t~. 'Ya:\.+ la-t,32. e>.41. '31!.,~. O,CXDB~-0,01& ~+
... + Q.s.s~.sa.~2: '12.0,068.%,t
= lo11s ~-mm ~
i\un J,roL.w µ, ~ i.\:i ~ -b -la.. ~ \a~ .
~' , ~ f>dw< (ioO)= sa,"~s.~'O. 1/'Z.Ya.c:iocoe.'2.~'l. 1<&-t,+-o.01~.~."iA~~.<11.101 1ai.;i
... + (o,011>6-t0.01a'),:3e,a4~ lar,-cz..~."'··1'1. 11z.
:: G1 1 Qe N-mm~ ll-10 5
':!! fl .,.. 't.d.w< (act>) - ~ ~ci.. Qa.
(= Qif.~1'?>.o\-*-l?~:. ICO,GfHf(O~ ti-mm~)
: • ~ <iwC" ( acO) .unl.u.v.> _µere. ~ ~ to"" -IQ... 1 ~ ("?.C51>)
JJ~. ;,.1Sol -1{L. • rd..M (~at>} {'9;!e.-..1: ~~ ;r, rcLt --,.,..,·.1.~.:.._,,
4.-,~--·-0 .
r · .. ;~.-i.,
kNAL'(s1s : MODEL. \.lO ~ LOAtx.M:.£ '2.
Uni \s for -\he. 10,l\o~.5 d1a31"0.Ms cm. al\ i." ll / r""""i. ,l 11P,,_:)
;r ~
l I ! .:· :--·-~-- , __ : ___ \·--------~
o,'11:>1-:i, - ~ :::i:i rr Ai 1
~E,00-if -- -·----·-··-···-··-·· - . _.;.
' ttawu.'3.12,11: ~0...<pi{"".i.d~ - ______ F\GU£.E ~.~.1Q:l'd'd.,,(~~f.W
' . !1 <i=bd:l-4'<!~"') __ : __________________ .. ___ ! ____ ----- ---·--·--·- -
_ :_ .:_]~----- ------- ---- -- -
I .. -- --- . ·- -r------------· ----1 ,,,...~ f°"'' n»"' - ~'::1: -~-~-=~~~i~~: iJ~~~~---
.._ ~ 'i0?> v op.a i L-Oic68
0 1wi4 0,3!>1J,
I . + ! -------- -----------;-~ + y+ t· • ·- . ----·-· ·-· -- -- ··----- ---------------
:l'IGU2E '3.fL 13 ~ f-tri> ,cl.~ ____ ----~l'IGUl1.lt '3~t_.J4.tf~(~-D:~fY\!Y\.------- _____ --~---- :----~---1Y-t~l-,-----:
. , ... ·- .. I
: e:.,02.'ll;i 1 .i. ,o,oa
- ~01?. -'( • ~ o,aui --- - - . ' 0 ~ ' I .. __ .. --~j~o,ou ------ i
~ 0 1011 · o.,c::e.e , ------ .. ----· -------------------- _ __JL'. ___ :
I/ J I I i ••• k.o •O • --- -·••-•- • • •••••---··-·---- ----,-·-t·---~•••_:.... _______ . •
1'1auee. ~.CZ.is: <1rciw< p.t i=Stx:>rnfY\ - __ i:IGUU 3.rl.lc.:-ttrb~·~·~MM. ( V..-~ -------- -· -- ' - (Y.f~}_ -
r ,,._ ... ;.., "(;· .. ...;_ -,:-= .. :.. :·= ....
,.,, N -.....l

Univers
ityof
Cape T
own
J.NAL'(sts : MOOE:L I-to'?:. LO,O,tx.M;.£ Q
Uni\:s for -\he 1Q1l\o~~ d105(<:lMs C\C"e. al\ ~I"\ 1\-IE C:Ot-ifllo.1£P ! ~s ~.>a'""'':"s c>.t4 ~ ~
! I : I l-1/l""""'~ l t1PE\:)
~ rou-o.Hs:
• ~ ... +·
~ ...
~oL.. ~ . .....
· o,u.7i I c-b.~1 C\046~' ").. ·~~~-0,~
- o,e21 .J J O,GCZI -0,<lel
! --; .. , i
t10uiu. '!A, 11t lcn.'.:11ti...d1nal '31Y~ . at ro\~ l'k "°°>
0.~7. 0.157-,.
-0,0rl")(2:]- ),\,, -0,10!0 O,c
.. -·· . __ to,13&'1 ·----· - - - -- - -
'a~"'°°-. __ 5 _J .. ~ '1a:.'-m+ '~ ··--.0
V t'\GU£.E ~.Z. l<a: s-.r sh'ess«s ot
! rri1d"'F" ( i = "°°) ~: ,.~ ... ;, ...... ~ """"af:"
1Cul.lP u~.,.. f\G. :i..2.s. (txll"l"n> 1. .... o:s.)
('-0.ol'l!I ' O.Oll!>).
0,031
-+-l · _jt_O,OI!!. ~* =o.=1-: : ~')"':~~ HO.,..-------- ·--·- -o,066
-· -- -- 1/··--·- --- . o,a;e
·_L I
.l=lGUii:E ~.'L. I~ : nun5'1/e.rsc. be.ndi~ stre.sGe:S at mids;pan ('71• (Ooomm)
./
1=1aU£.1!. ';!..'l. (21: sheat .stresaes a.t
~ -5F"' Ci,•~) HaT'E: tl<'!'U<Mii 1'111U STeE1~61 C..M tJe
b.I..., u..1..n t• ...... u &. q, .~ (""TTO> u.s'.).
PIGUU '3.~. '20:_ ~~ii:.~-· al ~ - ;:aru .
-· {'ba 3oo r!ll"I\.) -- -
o,oz~L q01zl
0012.J\ Jopz.0 o,oz.~ _.., op11
lop11 to.=~ v
't=tGUlt.I!, 3,'2_,e2:f'<~ krditj st<~ at 4-tm· t'b:. '3=~
-0,013 0.08 0.1.lf
~-0,QJI [--~1~08
Q,521
a) longitudinal stresses at midspan
0,891
- ··- OJ'>
0,89J
C) Transverse bending stresses a at midspan
-0,018
0,0)7
e) Shear stresses at midspan
4C48 . ..(),068
0,068 -QQ68
b) longitudinal stresses at ~ - span (z = 300mmJ
0,019 1,012
~u'T Jon 4QZ9 o,m
0.011 O,IQ9
dJ Transverse bending stresses at ~-span fz=300mmJ
·MtHJ(}66
·0,006 j I -O.all ·O.llS . . :O/Jd7 -IQ/18 -0, llS
-o.11a I 1 ao -o.ori -O.IT8
-0.01:1 I • ...
f) Shear stresses at % - span (z =300 mm I
FIGURE 4.11: Hodel 3 Loadcase 2 Combined stresses lrom analysis
rn N CD