The Role Played by International Law in Ending the Kenyan ...
An investigation into the role played by researchassessment in the socio-geographic fragmentationof undergraduate economics education in the UK
James Johnston1& Alan Reeves1
Published online: 27 January 2018
Abstract This study charts the socio-geographic fragmentation of the economics discipline inthe UK. It is revealed that the marriage of economics teaching and research is now limited toelite institutions located mainly in the south of the UK. None of the UK’s new (post-1992)universities submitted to the Economics and Econometrics (E&E) unit of assessment (UOA) in2014, the UK’s most recent research evaluation exercise (REE). Lower REE scores are shownto be associated with higher withdrawal rates from the next E&E UOA and subsequentundergraduate economics programme closure. Universities that exit the E&E UOA movingto the Business and Management (B&M) UOA appear to benefit in the form of higher REEscores. Though restricted to the experience of one academic discipline in one country, thelessons from this study yield important insights into how the results of REEs can be a principaldriver of change in higher education.
Keywords Economics research . Undergraduate economics programmes . Retention .
Programme closure .Withdrawal from units of assessment
JEL classifications A10General . A22Undergraduate . I23 Higher education . Researchinstitutions . I24 Education and inequality . I28 Government policy
Introduction
The UK higher education (HE) system is made up of about 130 universities, ranging from theancient to the new, the small to the large and from those that offer a wide range of programmesto those that specialise in particular disciplines. The development of universities in the UK hasconsisted of a number of distinct phases of expansion after the establishment of the six ancient
High Educ (2018) 76:589–614https://doi.org/10.1007/s10734-017-0227-9
* James [email protected]
1 University of the West of Scotland, 2 High Street, Paisley PA1 2BE, UK
# The Author(s) 2018. This article is an open access publication

universities of Oxford, Cambridge, St Andrews, Glasgow, Aberdeen and Edinburgh which goback to mediaeval times. The nineteenth century saw the creation of a few more includingDurham and the various London and Welsh collegiate institutions. There was then no activityuntil the first half of the twentieth century when 13 civic universities in cities such asLiverpool, Bristol, Nottingham and Southampton were created. The result of the RobbinsReport of 1963 was a large expansion in the 60s of more than 20 universities in large citiessuch as Newcastle and Bradford but also in smaller towns and cities such as Loughboroughand Bath. The Further and Higher Education Act (FHEA) of 1992 (Department of Educationand Science, 1992) saw the end of the binary divide between the universities and thepolytechnics and others when more than 30 polytechnics and several Scottish Central Institu-tions were awarded university status. Many were in towns and cities such as Birmingham,Leeds, Manchester and Brighton that already had a university.
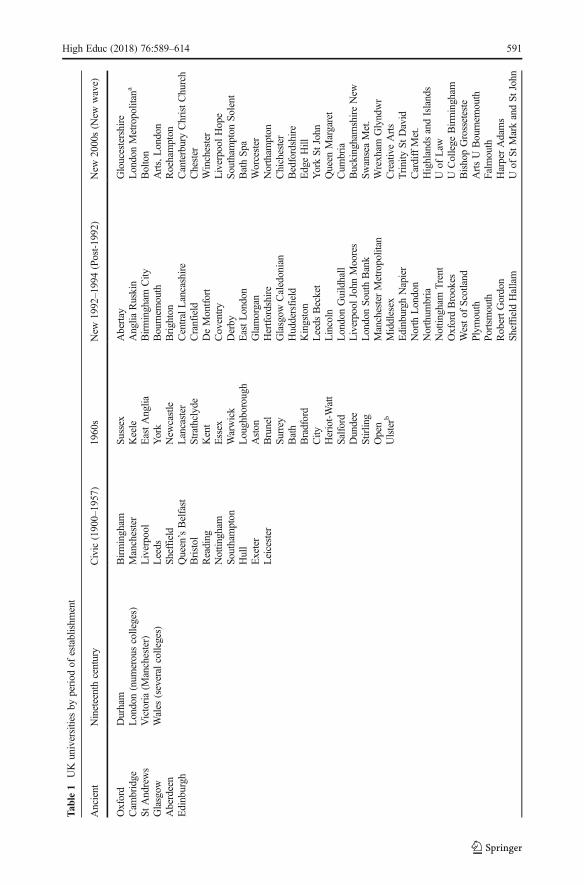
The rise in the number of universities in the UK as a result of the addition of the post-1992universities was substantial but the 2000s brought a second wave of new university creationwith an even larger expansion of more than 40 new universities, taking the total to around 130.This second wave of new universities consisted largely of former colleges of education andspecialist colleges with many having quite small student numbers compared with their oldercounterparts. Table 1 shows clearly the acceleration in university formation. The increases inthe numbers and variety of universities has caused many, especially the more established ones,to try to differentiate themselves from others with very different aims by forming missiongroups around common themes. These included the prestigious Russell Group of 24 research-intensive universities, the MillionPlus group of 20 new universities whose declared aim is towiden access and extend opportunity, and the University Alliance of 18, mainly new univer-sities that aim to drive innovation and enterprise through research and teaching. The increasedimportance of the contribution of new universities is underlined by the fact that there are nowmore new than old universities in the UK. The FHEA swept away barriers to competitionbetween universities, polytechnics and colleges and allowed them to compete with one anotherin the market for students and staff.
The major changes to the structure of the UK HE system ushered in by the FHEA wereaccompanied by the rise to prominence of formal research evaluation exercises (REEs) such asthe Research Assessment Exercises (RAEs) of 1992, and 2008 and the Research ExcellenceFramework (REF) of 2014. Before this, the UK REE of 1986 was the first attempt anywhere inthe world to measure formally the quality of research output from higher education institutions.It was undertaken at the behest of the Thatcher government to put in place a system whereresearch quality was rewarded and encouraged, with research funding based on the quality ofresearch outputs. Soon after, in 1989, a ‘research selectivity exercise’ saw the introduction of‘units of assessment’ (UOA) to represent subject areas. A major criticism of the 1986 exercisewas that institutions felt that they were not able to demonstrate the full extent of their researchprowess by being permitted to submit just two pieces of research per member of staff, and fromthe 1992 RAE onwards, institutions were allowed to submit up to four research papers permember of staff. Yet, even this higher limit has not been without its critics, and it has beensuggested that ‘it discriminates against highly productiveworld-leading researchers’ (Matthews,2016). Over the years many writers have claimed that the UK HE landscape has beentransformed by universities and researchers reacting both consciously and unconsciously toREEs. Among the main criticisms are that researchers engage in a variety of dubious activitiessuch as ‘salami slicing’ or putting into several papers what before the advent of REEs wouldhave been in just one paper, ‘shadow publishing’ or publishing what is essentially the same
590 High Educ (2018) 76:589–614
Tab
le1
UK
universitiesby
period
ofestablishm
ent
Ancient
Nineteenthcentury
Civic(1900–1957)
1960s
New
1992–1994(Post-1992)
New
2000s(N
ewwave)
Oxford
Durham
Birmingham
Sussex
Abertay
Gloucestershire
Cam
bridge
London(num
erouscolleges)
Manchester
Keele
Anglia
Ruskin
LondonMetropolitan
a
StAndrews
Victoria(M
anchester)
Liverpool
EastAnglia
Birmingham
City
Bolton
Glasgow
Wales
(severalcolleges)
Leeds
York
Bournem
outh
Arts,London
Aberdeen
Sheffield
New
castle
Brighton
Roehampton
Edinburgh
Queen’sBelfast
Lancaster
CentralLancashire
CanterburyChristChurch
Bristol
Strathclyde
Cranfield
Chester
Reading
Kent
DeMontfort
Winchester
Nottin
gham
Essex
Coventry
Liverpool
Hope
Southampton
Warwick
Derby
Southampton
Solent
Hull
Loughborough
EastLondon
BathSp
aExeter
Aston
Glamorgan
Worcester
Leicester
Brunel
Hertfordshire
Northam
pton
Surrey
Glasgow
Caledonian
Chichester
Bath
Huddersfield
Bedfordshire
Bradford
Kingston
EdgeHill
City
Leeds
Becket
YorkSt
John
Heriot-Watt
Lincoln
Queen
Margaret
Salford
LondonGuildhall
Cum
bria
Dundee
Liverpool
John
Moores
BuckinghamshireNew
Stirlin
gLondonSo
uthBank
SwanseaMet.
Open
ManchesterMetropolitan
Wrexham
Glyndwr
Ulsterb
Middlesex
CreativeArts
Edinburgh
Napier
Trinity
StDavid
North
London
CardiffMet.
Northum
bria
Highlands
andIslands
Nottin
gham
Trent
Uof
Law
OxfordBrookes
UCollege
Birmingham
Westof
Scotland
BishopGrosseteste
Plym
outh
ArtsU
Bournem
outh
Portsm
outh
Falm
outh
RobertGordon
HarperAdams
SheffieldHallam
Uof
StMarkandSt
John
High Educ (2018) 76:589–614 591

Tab
le1
(contin
ued)
Ancient
Nineteenthcentury
Civic(1900–1957)
1960s
New
1992–1994(Post-1992)
New
2000s(N
ewwave)
Staffordshire
Leeds
Trinity
Sunderland
RoyalAgriculturalU
Teesside
NorwichU
ofArts
WestLondon
New
man,B
irmingham
Westm
inster
Regents,L
ondon
Westof
England
SouthWales
Wolverham
pton
BPP
UStMary’s,Tw
ickenham
Arden
Suffolk
Leeds
Arts
Anumbero
funiversities
thatwereform
allyestablishedinthe2000ssuch
asUniversity
ofLondonandtheUniversity
ofWales
collegesareexcluded
from
thelistthoughthey
doaddto
thenumbers
Nam
esused
arecurrentones
thatmay
differ
from
thoseatthedateof
establishm
ent
aLondonMetropolitan
cameaboutthroughamergerin
2002
betweentwopost-1992universities:LondonGuildhallandNorth
London
bFo
rmed
in1968
astheNew
University
ofUlsterandfollowingmergereventually
becameto
beas
UlsterUniversity
592 High Educ (2018) 76:589–614

work in different forms in several different journals and short-term behaviour leading topremature submission of articles. Some writers also point to the rapid increase in the numberof journals and the creation of a vibrant market for strong researchers who can sell their servicesto the highest bidder (Elton, 2000; Sharp and Coleman, 2005).
Over time, there have been many changes in the methods used to assess research quality butthe prime aim of REEs to focus research monies on those areas and into those universities thathave demonstrated their ability to produce the highest quality research has been maintained. Itis not the purpose of this paper to describe in detail the changes that have taken place over theyears for these were many and varied (Bence and Oppenheim 2005; Otley 2010; Radice 2013;Rebora and Turri 2013). Nor is it the intention to discuss the underlying approaches to theconsequences for management control systems in higher education as a response to researchassessments (Smith et al. 2011; Rebora and Turri 2013; Agyemang and Broadbent 2015;Maesse 2017). Nevertheless, some brief comments on some of the main changes in the regimeare useful in the context of the approach taken here. The first major change is in the length ofthe assessment period which has risen from three to four to five and latterly to 7 years. Thisreflects the increasing scale and complexity of the assessment process. The second change is inthe rating scales used to assess research quality. Initially a simple 5-point scale was used butthis was changed to a 7-point scale and eventually to a profile system. Other things such asresearch environment and esteem were also formerly included in 2008 and in the 2014 REFresearch impact was assessed for the first time (Broadbent 2010; Pidd and Broadbent2015).The final change is in funding arrangements. Over the years, the changes have beenvery significant. The trend has been to reward the highest quality research with more fundingand to take away funding from those that are not of the highest quality. To illustrate, in theearly days, lower quality research was given some funding, albeit less than higher qualityresearch, but since 2008 everything below 3* (internationally excellent) and 4* (worldleading), that is, 1* (nationally recognised) and 2* (internationally recognised) and unclassi-fied (below nationally recognised) is unfunded. For the 2104 REF, the ratio of funding for 4*and 3* was raised from the 2008 figure of 3:1 to 4:1, emphasising the increasing importance ofthe highest quality research. Despite this, Otley (2010) found evidence that in 2008 fundingwas more evenly distributed than in earlier years but this appears to be an anomaly connectedwith the move from a single number rating system to one based on profiles.
Despite these changes some things have remained largely unchanged. Universities havealways had a choice as which UOAs to enter and how many staff should be entered. Forexample, Russell Group institutions have entered many more UOAs than some other univer-sities: most Russell Group members averaged more than 40 UOA entries over the period1996–2014 while new universities could boast fewer than 20. On the staff entered into REEs,after the Stern Review (Department for Business, Energy & Industrial Strategy, 2016), therules for REF 2022 may change to include all relevant staff as opposed to those selected byuniversities. The use of peer assessment rather than metrics has remained at the heart of theassessment process despite the increasing availability of more sophisticated bibliometricmethods and it is likely to continue into the future.
Geuna and Martin (2001), Lucas (2006) and Hicks (2012) are among researchers who haveexplored performance-based research funding, a system that is gaining ground across theworld. To be classed as a performance-based system, a number of conditions have to be met:research has to be evaluated ex post, research output (not input) has to be evaluated, fundingmust depend on the results of the evaluations and finally, it must be organised on a nationalbasis. The UK is one of many countries that now assess research quality as a means of
High Educ (2018) 76:589–614 593

identifying areas most worthy of funding. Across the world in 2010, Hicks (2012) identified atleast 14 such systems, most of which were in Europe. An interesting feature is the diversity ofways of measuring the quality of research in different countries. The UK continues to beextremely active in its use of REEs to the extent that REEs have become a vitally importantpart of the activities of many UK universities, especially the older ones which traditionallyhave a strong research role. Excellent results mean more research funding and more leaguetable points that enable UK universities to compete successfully at home and on a world stage.Increasing globalisation and the need to enhance international competitiveness behove gov-ernments to search for means of gaining an advantage (Lucas 2006). World class research willhelp universities to do that. REEs will continue to evolve and become more refined but theirpurpose remains unchanged. It is the unintended consequences some of which have alreadybeen pointed out that may give rise for concern. The impact of not doing well in REEs canmean threats to whole subject areas when degree programmes are closed as a consequence ofresearch funds being cut or completely withdrawn. Also, as reported by Lee (2007) and Earle(2017) with respect to economics research, it may lead to a narrowing of the subject asresearchers focus on what is needed to meet the demands of the REF and possible intellectualstagnation as the unorthodox is eschewed in favour of mainstream contributions.
The Stern Review of REF 2014 and the responses from interested parties such as univer-sities and other bodies indicate some areas of consensus but a number of areas of concern. Forthe next REF in about 2022, the role of impact is said to be enhanced but metrics will notreplace peer assessment. Lord Stern will take into account the responses before he arrives atthe format for REF 2022.
The aim of this study is to investigate the relationship between research performance asmeasured in REEs and the structural changes to economics education that have taken place inthe last two decades in the UK, with reference to undergraduate economics programmes.1 Toachieve this aim four questions are posed:
Question 1: Has UK economics research undergone a similar socio-geographic fragmen-tation as economics programmes?Question 2: Is poor performance in the E&E UOA a factor in universities pulling out ofsubsequent E&E UOAs?Question 3: Do universities that have moved from the E&E UOA to the B&M UOAimprove their performance in the B&M UOA?Question 4: Is the decision to stay in or withdraw from the E&E UOA connected with theretention/withdrawal of economics undergraduate programmes; and for the withdrawers,did withdrawal from the E&E UOA precede, follow or coincide with the closure ofeconomics programmes?
The absence of undergraduate economics programmes and the failure to submit to thediscipline’s UOA in REEs suggests that the subject is not meeting the ‘gold standard’ of strongteaching married to strong research. If teaching is not underpinned by research, the quality of thestudent experience may suffer. Old universities have long been active in research as well as
1 In this paper only single Economics, Business Economics and Financial Economics undergraduate programmesare included. These are the easily the most popular economics undergraduate programmes in the UK (Johnstonet al. 2014). Thus, major, minor and joint programmes are excluded. The term ‘economics programme’ refers toone or more of Economics, Business Economics and Financial Economics.
594 High Educ (2018) 76:589–614

teaching though they have not always been easy bedfellows (Bessant et al., 2003). Many newuniversities have traditionally focused on teaching to the detriment of research activity. Thoughacademic research in this field does not provide a clear answer to the question about whetherresearch-informed teaching is necessarily better than teaching not informed by research, manywould agree (among them most universities) that a nexus of research and teaching is a vitalelement of the activities of a successful university (Robertson 2007; Visser-Wijnveen et al.2010). It is in this context that the paper sets out to explore the relationship between economicsresearch and economics programmes between 1992 and 2014. The economics programmes usedfor this purpose are predominantly the undergraduate degree programme entitled BA (Hons)Economics or BSc (Hons) Economics. Also possible but in much smaller numbers are BA(Hons) or BSc (Hons) Business Economics and BA (Hons) or BSc (Hons) Financial Economics.It excludes universities that only offer economics as part of major, joint or minor programmes.
The paper is organised as follows. The next section discusses the existing literature on thesocio-geographic fragmentation of economics education in the UK HE system and provides anup-date on Johnston et al.’s (2014) results. A rationale for the rise to prominence of REEs isprovided along with a short assessment of the literature on how the increased attention given toformal REEs has affected the UKHE system. The extent to which an institution’s REE score inthe Economics and Econometrics (E&E) UOA is associated with changes in future support forresearch in the E&E area is then explored. Whether switching from E&E to B&M boosts aninstitution’s REE scores is then analysed. The link between research performance and pro-gramme retention and closure decisions is discussed. Finally, conclusions and suggestions forfurther research are set out.
The socio-geographic fragmentation of economics education in the UK HEsystem
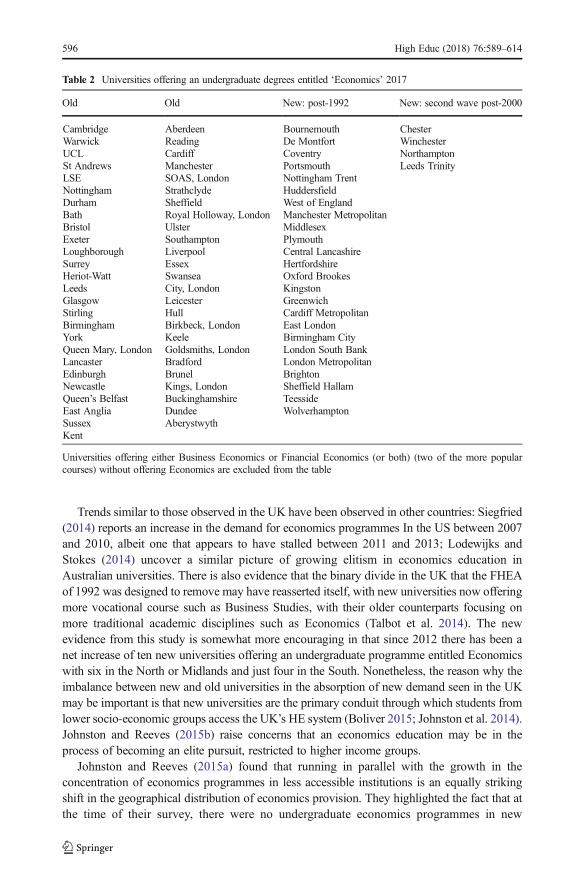
Johnston et al. (2014) document the socio-geographic fragmentation of undergraduate econom-ics education in the UKHE system. Their study revealed that many of the UK’s new universitieshave closed their undergraduate economics programmes over the last two decades. Theprogrammes concerned with mainly Economics but also included Business Economics andFinancial Economics. In fact, the best predictor of whether a university offered an undergraduateeconomics programme at the time of their survey was whether it was old or new. Not only werenew universities less likely to offer an undergraduate economics programme but they had alsoexperienced a significantly higher undergraduate economics programme closure rate over theperiod. Between 2003 and 2012, 16 universities in the UK removed an undergraduate econom-ics programme and all but two were post-1992 universities. It is important to recognise that thiscontraction came against the backdrop of rising student demand for undergraduate economicsprogrammes, most of which was met by growth in the numbers studying at the UK’s olduniversities. Analysis of university websites and The Complete University Guide 2017 showedthat the current situation is a little more encouraging with the last 5 years seeing an increase ofeight post-1992 universities and four post-2000 universities offering a single undergraduatedegree programme entitled ‘Economics’. Among the universities that had undergraduateprogrammes in Business Economics or Financial Economics four added Economics, threeremoved Business Economics and one Financial Economics from their portfolios. Thus, as of2017, a total of 79 UK universities (51 old, 24 post-1992 and 4 post-2000) offered singleundergraduate degrees entitled ‘Economics’ (Table 2).
High Educ (2018) 76:589–614 595
Trends similar to those observed in the UK have been observed in other countries: Siegfried(2014) reports an increase in the demand for economics programmes In the US between 2007and 2010, albeit one that appears to have stalled between 2011 and 2013; Lodewijks andStokes (2014) uncover a similar picture of growing elitism in economics education inAustralian universities. There is also evidence that the binary divide in the UK that the FHEAof 1992 was designed to remove may have reasserted itself, with new universities now offeringmore vocational course such as Business Studies, with their older counterparts focusing onmore traditional academic disciplines such as Economics (Talbot et al. 2014). The newevidence from this study is somewhat more encouraging in that since 2012 there has been anet increase of ten new universities offering an undergraduate programme entitled Economicswith six in the North or Midlands and just four in the South. Nonetheless, the reason why theimbalance between new and old universities in the absorption of new demand seen in the UKmay be important is that new universities are the primary conduit through which students fromlower socio-economic groups access the UK’s HE system (Boliver 2015; Johnston et al. 2014).Johnston and Reeves (2015b) raise concerns that an economics education may be in theprocess of becoming an elite pursuit, restricted to higher income groups.
Johnston and Reeves (2015a) found that running in parallel with the growth in theconcentration of economics programmes in less accessible institutions is an equally strikingshift in the geographical distribution of economics provision. They highlighted the fact that atthe time of their survey, there were no undergraduate economics programmes in new
Table 2 Universities offering an undergraduate degrees entitled ‘Economics’ 2017
Old Old New: post-1992 New: second wave post-2000
Cambridge Aberdeen Bournemouth ChesterWarwick Reading De Montfort WinchesterUCL Cardiff Coventry NorthamptonSt Andrews Manchester Portsmouth Leeds TrinityLSE SOAS, London Nottingham TrentNottingham Strathclyde HuddersfieldDurham Sheffield West of EnglandBath Royal Holloway, London Manchester MetropolitanBristol Ulster MiddlesexExeter Southampton PlymouthLoughborough Liverpool Central LancashireSurrey Essex HertfordshireHeriot-Watt Swansea Oxford BrookesLeeds City, London KingstonGlasgow Leicester GreenwichStirling Hull Cardiff MetropolitanBirmingham Birkbeck, London East LondonYork Keele Birmingham CityQueen Mary, London Goldsmiths, London London South BankLancaster Bradford London MetropolitanEdinburgh Brunel BrightonNewcastle Kings, London Sheffield HallamQueen’s Belfast Buckinghamshire TeessideEast Anglia Dundee WolverhamptonSussex AberystwythKent
Universities offering either Business Economics or Financial Economics (or both) (two of the more popularcourses) without offering Economics are excluded from the table
596 High Educ (2018) 76:589–614

universities in Scotland. Something of a north-south divide in the supply of undergraduateeconomics programmes in the new universities would appear to have developed, with the newuniversities that offered the subject were located mainly in London and the south of England.As there is some evidence that middle class students prefer Economics and working classstudents Business Studies (Office for Fair Access 2010), it might then be expected thatuniversities, irrespective of whether they are old or new, that draw their intake from moreaffluent areas of the UK are more likely to continue to offer the subject. However, given thatmost universities draw students from outside of their local area, this is only likely to be part ofthe explanation of the socio-geographic fragmentation of undergraduate economicsprogrammes.
The current situation is presented in Table 3 which gives the number of universitiesclassified as old, post-1992 and post-2000 in selected areas of the UK. Precise definitions ofthe areas as the North, Midlands and South is the cause of much heated debate in somequarters but here, pretty conventionally, the North is defined as consisting of Cheshire,Merseyside, Lancashire, greater Manchester, Yorkshire and above; the South is London, theSouth-East and the South-West of England; and the Midlands everywhere in between. Walesand Northern Ireland are treated separately. The table shows that the South dominatesespecially for new universities but the changes since 2012 have redressed the balancesomewhat with the North now having one quarter of undergraduate programmes in ‘Econom-ics’ in new universities. Scotland and Northern Ireland though still have no provision amongnew universities and Wales has but one.
The rise to prominence of the REE in the UK HE system
In the year 2014–15, the HE Funding Council for England (HEFCE) distributed around £1.6billion in funds, with the majority of funds allocated on the outcome of the 2008RAE. Estimatesof the cost of REEs in the UK vary dramatically, depending on the assumptions made. HEFCE(2008), based on a study by PA Consulting, estimate the total sector cost for all higher educationinstitutions in England of the 2008 RAE at £47 million, but others have pointed to a figureperhaps as high as £200 million (Jump 2014). As a result of REEs, universities have sought tobuild up centres of research excellence from funds allocated according to the quality of theresearch output. REEs attempt to capture the complexity and diversity of the research producedby universities in a simple number(s) that enables the research productivity of differentindividuals, teams and institutions to be ranked. The results of REEs underpin resourceallocation both between and within individual institutions and so it is difficult to overestimate
Table 3 The number of UK universities offering a degree entitled Economics by area 2017
Northa Midlandsb South Otherc Total
Old 18 8 20 5 51New: post-1992 5 5 13 1 24New: post-2000 2 1 1 0 4Total 25 14 34 6 79
a Includes Scotlandb Includes East AngliacWales and Northern Ireland
High Educ (2018) 76:589–614 597

their importance. High ratings will mean more funds, and low ratings may mean no funding atall, putting at risk departments and academic jobs. One interpretation of the ongoing commit-ment by policy makers of scarce resources to REEs is that such exercises yield sufficient off-setting benefits in the shape of higher quality information on research performance. Thisinformation should lead to improved efficiency in the allocation of resources and in the longrun to an increase in the quality-adjusted volume of research output. Viewed from thisperspective, the REE can be thought of as a response to the difficulty of quantifying the outputsfrom research activity. REE scores allow state support for research to be directed to thosedeemed by the independent panels of experts best able to make use of them.
University managers will often lack the expertise required to gauge accurately the quality ofthe research produced by academic staff across a variety of disciplines. The academicsthemselves may seek to exploit any informational asymmetry by supplying an overly opti-mistic view of the quality of their research efforts. Given that UOA panels are composed ofindependent experts, their evaluations have the potential to alleviate this information asym-metry and to enable university managers to assess more accurately the quality of researchoutput. While research groups may have had greater opportunity to exploit information gaps inthe past, the development of formal REEs ought to have reduced the scope for such oppor-tunistic behaviour. It would be surprising if the data on research quality provided by REEswere not used to inform decisions on whether to continue to support research in a particularUOA. In addition, the information provided by REEs may show that some UOAs operate withless demanding standards than others. If institutions believe, rightly or wrongly, that any givenset of output will be treated more favourably in one UOA than another, then this will providean incentive to submit to the more ‘profitable’ UOA. The scores produced by REEs are likelyto affect research activity directly but programme provision indirectly. For any given level ofstudent fee income, the lower the research performance of an institution in a REE the morelikely it is that the institution will simply decide to withdraw support from the subject entirely.The HE system as a whole will change as the individual institutions of which it is composedmake decisions about what to teach and what to research in the light of REE scores.
Proponents of this approach to the evaluation of research would argue that without theresults of REEs, scarce resources would be squandered on low quality programmes andresearch, and that the creation and implementation of this system will have identified andremoved poor performers. However, once these ‘low hanging fruit’ have been picked, critics,such as Geuna and Martin (2001) question the merits of the approach. They contend that theostensible meritocracy of the ex-post peer review approach may simply entrench the interestsof first-movers and work against future research potential, and that it may in addition lower thewillingness of researchers to engage in riskier research projects. Others, such as Docherty(2015), express concern over the potential loss of institutional autonomy as the state, throughits ability to shape the REE process, uses its influence to alter the kinds of research carried outin universities, e.g. the shift in emphasis away from publications to measures of ‘impact’assessment is seen by critics as an attempt to tie the research efforts of universities moreclosely to the needs of the economy. Sayer (2015) maintains that the inadequate compositionand mode of operation of some of the assessment committees means that they may fail toevaluate accurately the outputs put before them. Good research may be classified as bad, andbad as good. Agyemang and Broadbent (2015) go further and suggest that the academiccommunity itself through its willingness to internalise the externally imposed exercise in‘commensuration’—that is the research assessment regime—may have contributed to itsown subjugation to university management.
598 High Educ (2018) 76:589–614

A simple model of the UOA submission decision and programme retention
Figure 1 illustrates how REE research scores and programme retention might be related to oneanother. Though the cases included in the figure do not capture the actual experience of realuniversities—they are intended to illustrate some of the key possibilities—actual REE dateshave been imposed on the model to link it more closely to the empirical work carried out in thestudy.2 To interpret the figure, note that the vertical lines indicate the timing of different REEs,running from 1992 to 2014. Given the focus of the paper, it is natural to use the E&E UOA toillustrate the various possibilities. In case III, for example, the university’s last submission tothe E&E UOAwas in 1996 but it was still offering a programme in 2014. Case IV shows aninstitution that withdrew from the REE in 1996 and closed its programme around 2003.
If the results of REEs are important in decisions on whether to continue to support researchin E&E and if this decision in turn influences the decision on whether to retain or close aprogramme, then we would expect cases I, IV, VIII and IX to occur frequently. The reason forthis expectation is that case I represents the ‘gold standard’ in that it picks out universities thathave always submitted to the E&E UOA and offered an economics undergraduate programmethroughout the period under consideration. At the other end of the spectrum, the absence of asubmission to the E&E UOA at any time may be taken as an indication of weak researchcapability in E&E. As such, case IX, which captures institutions that have never engaged withthe subject either by offering a programme or submitting to the UOA, should be fairlycommon, as should case VIII. In cases IV and V, institutions withdraw programmes and exitthe E&E UOA. The difference between the two cases is the sequence of these events. In caseIV pulling out of the UOA precedes programme closure, whereas in case V, the programme isclosed before the institution removes itself from the UOA. If poor research performance in aREE raises the risk of programme closure, then case IV should be more common than case V.Case II should also be rare as it is for institutions that have removed programmes but havesubmitted to the UOA in all REEs. If a group’s research performance is deemed by universitymanagers to be of high enough quality to justify continued submission to the UOA, it would besurprising if such a group did not also offer a programme. Case III institutions have withdrawnfrom the UOA but may not yet have fully adjusted to the implications of this choice for theirprogrammes. Case VI universities are those that find it worthwhile to offer a programme that isnot underpinned by UOA entry. Teaching-led universities such as those in the MillionPlusgroup and the University Alliance in areas where programme demand is strong would fall intothis category. Case VII should be very rare. This would involve institutions with researchdeemed by management good enough to be submitted to the UOA in every REE but where anassociated programme has never been offered. Large numbers in cases II, V and VII wouldsuggest that the information produced by REEs does not carry a large weight in the decisionmaking of university managers.
Data and methods
The basis of assessment of the quality of research done in UK universities is the UOA.Between 1992 and 2008, the number of UOAs was little changed with around 70 units in total;
2 It is recognised that this set out cases is not exhaustive but for the sake of brevity it is restricted to what areconsidered the most important cases.
High Educ (2018) 76:589–614 599

the REF of 2014 saw the number reduced to just 36. Over the years with subject developmentsand other changes, the titles and compositions of many units have changed, so that of theoriginal 72, just 14 have remained the same from 1992 to 2014. This includes the E&E UOA,the subject of this paper, which, having the same title throughout and very similar contentallows a longitudinal study to be undertaken. Secondary data gleaned from official UCAS,HESA and REE publications (RAEs 1992, 2008, REF 2014a, b) on the entire population ofaround 129 universities, roughly 50 old and 80 new, are used in the study. All universities areassigned to one of three groups in relation to programme status at the observation point, 2014-retainers, closers and those that have never had an economics programme. With the growth inthe number of universities around 1992 and in the 2000s, the early years had fewer universitiesthan the later years. Table 4 shows that of the 129 UK universities examined in the study, 67continued to offer an economics programme in 2014, with 16 having closed an economicsprogramme and the remaining 46 universities never having offered one. E&E UOA statusconsists of four possibilities—always in the E&E UOA, withdrawn from the E&E UOA, neverin the E&E UOA and late entrant to the E&E UOA. Over the period 1992 to 2014, 26
Table 4 All universities’ E&E UOA status and economics programme status 1992–2014
Col. 1 Alwaysin the E&EUOA
Col. 2 Withdrawnfrom the E&EUOA
Col. 3 Neverin the E&EUOA
Col. 4 Lateentrant to theE&E UOA
Col. 5Totals
Economics programme retainers 26 27 12 2 67Economics programme closers 0 7 9 0 16Never had an economics programme 0 1 45 0 46Totals 26 35 66 2 129
UOA status refers to a university’s position vis-a-vis the E&E UOA. Programme status refers to whether or notthe university offered an undergraduate honours degree with the title ‘economics’, either in BA or BSc form.Programme retainers have always had such a programme; programme closers have at some point ceased to offersuch a programme; and finally there are those universities that have never offered an undergraduate economicsdegree programme
CASE IX - Never in the E&E UOA & neveroffered a programme
CASE VIII - Never in the E&E UOA &Programme Closer
CASE VII - Never offered a Programmebut always in the E&E UOA
CASE VI - Never in the E&E UOA butalways offered Programme
CASE V - E&E UOA & Programme Closer
CASE IV - E&E UOA & Programme Closer
CASE III - E&E UOA Withdrawer &Programme Retainer
CASE II - E&E UOA Retainer &Programme Closer
CASE I - E&E UOA & Programme Retainer
E&E UOA submission and economics programme status
E&E UOAStatusProgrammeStatus
REE 1992 1996 2001 2008 2014
Fig. 1 E&E UOA submission and economics programme status
600 High Educ (2018) 76:589–614
universities were always in the E&E UOA, 35 had entered and withdrawn at some point, 66had never entered and there were two late entrants.
Though data on REE scores and UOA and programme retention decisions over time mayshed light on how each is related to the other, it is important to bear in mind that just becauseone event occurs before or after another does not mean that the two are causally related (thefallacy known as post hoc ergo propter hoc). The findings have to be carefully interpreted andimportant caveats borne in mind. If, for example, a low score in a REE is found to beassociated with an increased likelihood of withdrawing from a subsequent REE, to say thatthe low research score is the cause of the increased likelihood of withdrawal would only bevalid to the extent that all of the other possible determinants of the decision to withdraw thatmay vary across universities have remained constant over time. Similarly, in the case of auniversity that withdraws from one UOA and submits to another in the next REE, to attributeany higher score solely to the decision to submit to another UOA would require all otherpossible determinants of an institution’s REE score to remain unchanged. The difficulty for theresearcher is that many of the factors that might conceivably influence UOA submission andprogramme retention decisions such as changes in management or strategic focus are inher-ently difficult to identify, let alone measure.
Furthermore, there are other limitations stemming from the method used in this study. Itshould be noted that the data are censored at the observation date and that programmesmay be closed and universities may still withdraw from a UOA beyond this point and anysuch changes will not be picked up. The data are also left censored in that they do notallow an assessment of the relationship between research performance and researchsupport and between research support and programme retention before the initiation offormal REEs. It is also recognised that the definition of what constitutes economicsresearch and economics teaching used in this paper is specific and a wider interpretationmay yield different results.
Results
Question 1: Has economics research experienced a similar socio-geographic fragmenta-tion as economics education?
REE data plotted in Fig. 2 show that the total number of UK universities that submitted tothe E&E UOA fell from 60 in 1992 to 28 in 2014 while the number of old universities fellfrom 49 in 1992 to 28 in 2014. This decline is modest when compared to the experience ofnew universities. All 1thirteen new universities that had submitted to the E&E UOA in 1992had withdrawn from the unit by 2014, and any latecomers had also withdrawn by 2014. Totease out whether this stark decline in economics research in the UK’s new universities wasdiscipline-specific or more general, the experience of new universities in the closely relatedfield of B&M was considered.
Figure 3 shows that while the percentage of submissions to the E&E UOA from newuniversities had fallen from 22% in 1992 to zero in 2014, the percentage of submissions to theB&M UOA showed a comparatively modest fall from 53 in 1992 to 46 in 2014. While themovement of old universities from the E&E UOA to the B&MUOAwill partly be responsiblefor this fall, it may also be the result of the withdrawal of new universities previously includedin the B&M UOA.
High Educ (2018) 76:589–614 601

Just as new universities have retreated from economics research so also have some oldinstitutions. It emerges from further investigation of the data that 16 of the 28 submissions tothe E&E UOA in 2014 were from Russell Group universities with another six coming from thenow defunct 1994 group, which consisted of smaller universities with a strong research focus.Two former 1994 group members also submitted, bringing the total to 24 out of 28 drawn fromthis elite group of research-intensive universities. To the extent that submission to the E&EUOA is the most important indicator of the presence of serious economics research in auniversity, it would seem that such research has become the preserve of a small and shrinkinggroup of elite universities.
It is also apparent that the increased concentration of economics research in the UK’s eliteuniversities has been accompanied by a reconfiguration of its geographical distribution acrossthe UK. The institutions that have withdrawn from serious economics research have not beenevenly spread across the regions of the UK. Economics research in the north of England and inthe Celtic nations would appear to have struggled to compete successfully. None of the Welshor Northern Irish universities was included in the E&E UOA in 2014, and above a linebetween Preston and Sheffield in the north of England, very few universities were included inthe E&E UOA. Only the Scottish ancient universities of St Andrews, Edinburgh, Aberdeenand Glasgow had an economics submission. There may be something of a cluster effect here
0
10
20
30
40
50
60
1992 1996 2002 2008 2014
The percentage of submissions from new UK universi�es inthe E&E and B&M UOAs 1992-2014
Economics & Econometrics
Business & Management
Fig. 3 The percentage of submissions from new UK universities in the E&E and B&M UOAs 1992–2014
0
10
20
30
40
50
60
70
1992 1996 2001 2008 2014
The number of UK universi�es submi�ng to the E&E UOA(1992-2014)
All
Old
New
Fig. 2 The number of UK universities submitting to the E&E UOA (1992–2014)
602 High Educ (2018) 76:589–614

with a large proportion of universities entered into the E&E UOA being based in London andthe south of England. Given the concentration of economic and political power in London, thisshould not come as a surprise. Referring back to the question posed at the start of this section,it is clear that economics research has gone through a similar socio-geographic fragmentationas that found in economics education. However, at this stage, it is important to stress that justbecause these two aspects of the development of this particular subject appear to have followeda similar path does not necessarily mean that they are causally related.
Question 2: Is poor performance in the E&E UOA a factor in universities pulling out ofsubsequent E&E UOAs?
What explains the withdrawals from the E&E UOA? Is it simply those that have scoredhighly in the past stay and those that have not, leave? Though the data presented above provideuseful information on the link between research performance and the decision on whether tosubmit to an E&E UOA at the next REE, they do not relate directly to why this pattern isobserved. A number of possible explanations suggest themselves. The first relates to institu-tional expectations. Research groups that perform below their universities’ expectations maybe candidates to be pulled out of the next E&E UOA (Johnston and Reeves 2017). One of theconsequences of performing less well than expected may be a cut in funding or, very likely, nofunding at all (Lee et al. 2013; Sayer 2015). Unfortunately, it is very difficult for an outsideobserver to know the expected rating for any given university. Take for example the LSE,which has had very high scores in the five E&E UOAs (1992–5, 1996–5*, 2001–5*, 2008–3.55, rank 1, 2014–3.55, rank 2).3 Given its record, it would be safe to assume that the LSEwould expect the highest ratings in any future E&E UOAs, and any less would be a blow to itsreputation and could lead to a drop of internal support. Protection would undoubtedly comefrom the large scale of research activity in institutions like LSE. Second, at the beginning of theRAE in 1992, many universities would have been unaware of the standards necessary toachieve a particular rating, and some would have been very disappointed and possiblysomewhat embarrassed to get such low ratings of 1 and 2. Avoiding humiliation may havebeen the reason why they did not re-enter the E&E UOA. Third, the relatively small number ofhigh quality submissions to the E&E UOA increases the likelihood of an institution beingnearer the bottom of the rankings, damaging its reputational capital. University managers, withleague tables in mind, may prefer to be lost in the mass of the B&MUOA table than to occupya place towards the bottom of E&E rankings. Fourth, the importance university managersattach to the results of REEs may not reflect concern over their impact on a university’s staffand students but on how these influence the remuneration and future career prospects of themanagers concerned. In these circumstances, starving areas that have strong student numbersand research to avoid closing university departments are likely to become increasinglyunpalatable. Once the rot has set in in an area, the danger is that no new appointments aremade, and the failure of the subject area is locked in. Programmes can be closed at any time butthe REEs take place only about every 6 years so it is unlikely the two would match up.
How the evidence produced by REEs is used by university managers in internal resourceallocation decisions is difficult to come by. One possibility is that the REE scores may behighly weighted in internal decision making, and institutions may respond quickly andstrongly to the latest set of REE results. Alternatively, they may not attach great importance
3 Note that the rating system changes on each occasion making comparison over time difficult.
High Educ (2018) 76:589–614 603

to the scores or use them only as part of a broader set of measures of an area’s performance.Which of these competing views is the more accurate cannot be answered on an a priori basis,and ultimately only relevant empirical evidence can help us to better understand what hashappened. Table 5 gives a list of universities that pulled out of the E&E UOA from the firstRAE in 1992, 2008. Universities in italics are new and otherwise are old. A total of 35universities (22 old and 13 new) withdrew from the E&E UOA over the whole period. Therewere ten withdrawals after the 1992 RAE, 13 after the 1996 RAE, seven after the 2001 RAEand seven after the 2008 RAE making a total of 37 withdrawals.4Durham and Kingstonwithdrew twice, Brunel did not submit in 1996 but re-entered in 2001.
Two measures of performance are presented in Table 5: first, the score achieved and second,the ranking in the UOA. Note that the number to the right of the slash is the number ofsubmissions to the UOA in the year that the institution last submitted. The number to the left isthe institution’s ranking, with the equals sign indicating that the ranking was shared with atleast one other institution. Quite how university managers interpret league table data is unclear.Take the case of an institution that achieves the same score in two consecutive REEs but thatscore places it 28 out of 60 in the first REE but 28 out of 28 in the other, how does theinstitution interpret this information to assess performance? Using a relativist interpretation ofthe data, it might be argued that in the earlier REE, the institution is in the top half of allsubmissions and has done relatively well, while in the latter submission, it has finished last andso has done very poorly. Equally, however, it might be argued that as the institution hasmaintained its score, it has maintained its performance, which would reflect an absolutiststance.
Though it is difficult to know how university managers evaluate the information producedby REEs, we can nonetheless draw some useful inferences from the empirical relationshipbetween results and subsequent decisions. Columns 3 and 4 of Table 5 show the rating andranking respectively in the E&E UOA at the time of the last E&E UOA entry. For 2014, onlythe ranking is shown. Thus, for example, reading’s last entry was in 1996, and its rating of 4then put it in equal 14th place out of an entry of 50; and Dundee’s last entry in 2008 was after arating of 2.45 and a ranking of equal 31st. What is apparent from the ratings of thoseuniversities that pulled out of the E&E UOA is that none of them ever had a top rating of 5or 5* in any E&E UOA. A top rating of 5 or 5* then guaranteed continuation in the E&EUOA, and a rating lower than 5 or 5* led either to continuation in the E&E UOA or a laterwithdrawal from it. This is a strong result that emphasises the importance of REE performancein university funding decisions.
At the other end of the rating scale were the four (all new) universities that left the E&EUOA after being awarded the lowest rating of 1. Among these, two left after 1992 but Abertayand Thames Valley (nowWest London) continued after receiving a rating of 1 in 1992, leavingin 1996 after ratings of 2 and 1, respectively. This illustrates how different institutions mayrespond differently to the same score. Four universities left after receiving a rating of 2 but fiveuniversities also with a 2 rating continued to the next E&E UOA (East London, ManchesterMetropolitan, Northumbria, Queen’s Belfast and Salford). All but Manchester Metropolitansubsequently dropped out after one more submission. What of the ratings 3, 3a and 3b? As thetable shows, with 14 universities dropping out after receiving ratings of 3, 3a or 3b, for theseuniversities, the rating was not high enough to justify staying in the E&E UOA. It was, though,
4 Two universities, Durham and Kingston, withdrew then re-entered only to withdraw again. The actual total ofuniversities is thus 35 and altogether there were 37 withdrawals.
604 High Educ (2018) 76:589–614

Tab
le5
Ratings
andrankings
ofE&EUOAwithdraw
ersin
theE&EandB&M
UOAs
University
Yearof
lastE&E
UOA
subm
ission
priorto
with
draw
al
Ratingof
E&EUOA
subm
ission
priorto
with
draw
al
Ranking
ofE&E
UOA
subm
ission
priorto
with
draw
al
B&M
ratin
g1992
B&M
ratin
g1996
B&M
ratin
g2001
B&M
ratin
g(ranking)2008
B&M
(ranking)
2014
a
Abertay
1996
150/50
11
3b1.55
(=84/90)
–Aberystwyth
1996
3b=33/50
––
3b1.55
(=84/90)
=69/101
Bangorb
1992
3=24/60
33b
––
–Bath
1996
3a=36/50
35
52.95
(=5/90)
6/101
Brunel
1992
3=24/60
23b
42.35
(=42/90)
65/101
BuckinghamshireNew
1992
1=56/60
12
2–
–CentralLancashire
1992
1=56/60
12
–1.95
(=64/90)
79/101
DeMontfort
1996
3b=33/50
23b
3a2.25
(=49/90)
50/101
Dundee
2008
2.45
=31/35
=84/101
Durham
1992,2
001
4=15/41
23a
3a2.65
(=19/90)
16/101
EastLondon
2001
3a=32/41
–2
2–
88/101
Heriot-Watt
1996
3a=36/50
33a
42.40
(=41/90)
23/101
Hull
1996
3a=36/50
33b
42.35
(=42/90)
30/101
Keele
2001
3a=32/41
34
42.30
(=46/90)
=73/101
Kingston
1992,2
008
234/35
23b
3a2.45
(=35/90)
45/101
Leeds
1992
2=46/60
24
52.85
(=11/90)
=8/101
Liverpool
2001
4=15/41
––
–2.45
(=35/90)
=27/101
LondonMet.
2008
2.25
=33/35
=84/101
Loughborough
2008
2.45
=31/35
=22/101
ManchesterMet.
2008
1.70
35/35
53/101
New
castle
2001
4=15/41
22
3a2.50
(=29/90)
59/101
Northum
bria
2001
3b=31/41
12
3b1.55
(=84/90)
72/101
Nottingham
Trent
1996
2=47/50
13a
3b2.15
(=54/90)
=54/101
Portsm
outh
1996
3b=33/50
23b
42.10
(=58/90)
=51/101
Queen’sBelfast
1996
3a=36/50
––
42.65
(=19/90)
=34/101
Reading
1996
4=14/50
–5
52.50
(=29/90)
=11/101
Salford
1996
3a=36/50
2–
3a2.00
(=61/90)
=56/101
SOAS
1992
3=24/60
––
–2.35
(=42/90)
=56/101
SSEES
1992
3=24/60
2–
––
–Staffordshire
1992
2=46/60
–2
3b–
–Stirlin
g2008
2.75
=22/35
33/101
High Educ (2018) 76:589–614 605

Tab
le5
(contin
ued)
University
Yearof
lastE&E
UOA
subm
ission
priorto
with
draw
al
Ratingof
E&EUOA
subm
ission
priorto
with
draw
al
Ranking
ofE&E
UOA
subm
ission
priorto
with
draw
al
B&M
ratin
g1992
B&M
ratin
g1996
B&M
ratin
g2001
B&M
ratin
g(ranking)2008
B&M
(ranking)
2014
a
Strathclyde
2001
4=14/41
55
42.85
(=11/90)
=20/101
Swansea
2008
2.75
=22/35
=30/101
Thames
Valley(U
WL)
1992
1=56/60
11
––
–Ulster
1992
3=24/60
33a
3a2.25
(=49/90)
=34/101
aRankedin
the2014
REFby
percentage
of3*
and4*
publications
bBangorwithdrew
in1992
butre-entered
in2001
606 High Educ (2018) 76:589–614

for City, Kent, Leicester, Loughborough, Manchester, Manchester Metropolitan, Surrey,Dundee, Edinburgh, St. Andrews and Stirling, all but Manchester Metropolitan being olduniversities. Five universities with a rating of 4 (Durham, Liverpool, Newcastle, Reading andStrathclyde) also dropped out, contrasting with 21 universities with the same rating in at leastone E&E UOA that continued.
Another perspective on how REE scores and future research activity are linked is shown inFig. 4, where the proportion of all universities withdrawing from the E&E UOA for the variousREE scores rated 1–5, 1 being the lowest score and 5 being the highest, is set out.5 The barsshow the proportion that withdrew from the next E&E UOA for each score. Thus, for REEscores of 1, the proportion equal to 1 signifies that all universities with a score of 1 withdrewfrom the next REE. At the other extreme, with a proportion being zero, a score of 5 meant thatnone withdrew. The shape of the chart shows that the higher the REE score, the more likely itwas that universities would stay in the E&E UOA and vice versa.
While it is apparent that universities may respond differently to the same REE scores, someimportant patterns emerge. For the vast majority of universities, a rating of 4 was sufficient forthem to submit to the next E&E UOA. For the seven universities dropping out after 2008, nonewas ranked in the top 20 (out of a total of 35), while five were ranked as the bottom five. Withregard to the question set out at the start of this section, these results suggest that theinformation on research quality provided by REEs may enter into decision making on whetheror not to continue to support research in the area.
Question 3: Do universities that move from the E&E UOA to the B&M UOA improvetheir performance in the B&M UOA?
It has been suggested that it may be easier to get a high rating in UOAs such as B&M thanin E&E where the standards are thought to be more demanding. In E&E, publications in elitejournals (e.g. the so-called Diamond list) are essential for a high rating to guarantee funding forfuture research (Lee et al. 2013). It is believed by some that the Diamond list journals are openonly to those with specialist training in econometrics and work against researchers working inareas that do not excel in econometric techniques (Lodewijks and Stokes 2014). In theirattempt to get a higher rating, some universities may have moved out of the E&E UOA into theB&MUOA in the belief that they will achieve a higher rating and consequently boost researchfunding. Yet, it is important to stress that the assessment panels in UK REEs work in such away that outputs submitted to the B&M UOA deemed to be more appropriate for the E&Esub-panel are simply cross-referred. Nonetheless in 2008, in addition to more than 3,000outputs being directly submitted to the Economics sub-panel, a further 1240 outputs werecross-referred from the B&M sub-panel (RAE 2008 UOA 34 Subject Overview Report). Thissuggests that a large number of outputs were ‘wrongly’ categorised by those making submis-sions. Not only that, but the Economics sub-panel stated that the cross-referred work wasgenerally of lower quality than that submitted directly to the Economics sub-panel in both2008 and 2014. Both of these observations are supportive of the possibility that institutions
5 Scales were converted to 5-point scales in 1996, 2001 and 2008 to allow comparison with 1992 which used a 5-point scale. In 1996 and 2001, ratings of 3a and 3b were combined, and 5 and 5* ratings were combined toreduce the number of ratings to 5. In 2008, a weighted average of output quality ranged from 1* to 4*, 1 beingwork that is recognised nationally in terms of originality, significance and rigour and 4* being world-leading onthe same basis. To form a 5-point scale, 1 was made equal to 1.00–1.59, 2 to 1.60–2.19, 3 to 2.20–2.79, 4 to2.80–3.39 and 5 to 3.40 to 4.00. In reality, the range was from 2.32 to 3.82.
High Educ (2018) 76:589–614 607

may have behaved strategically in relation to where they have submitted their outputs in thehope of achieving better scores.
To determine whether a shift to B&M from E&E makes a difference to performance inB&M, the data in Table 5 are used to make a comparison between the B&M score at the timeof the shift and the B&M score at the next REE. Take the case of Abertay which achieved ascore of 1 in both their E&E and B&M submissions in 1996 but managed to achieve a 3b inB&M in the 2001 REE after withdrawing from the E&E UOA, a clear improvement. Carefulscrutiny of the data reveals that 13 of those who withdrew from the E&E UOA and that alreadyhad a B&M entry improved their B&M performance at the next REE; nine experienced nochange and only one institution performed less well. So, with respect to question three, almostall of those universities that withdrew from the E&E UOA either improved or at leastmaintained their previous B&M score.6 This is a strong finding but it is one that has to beinterpreted cautiously. Of course, the improvement in the B&M score could have been due toother factors not connected with the output of the economists. For example, the quality of thenon-economics output may have risen, and the economics output may have had little or noeffect on the rating. On the other hand, it is also possible that the B&M UOA ratings wouldhave been lower if the economists’ output had not been included but without a breakdown ofwho was awarded what it is impossible to know.
Question 4: Is the decision to stay in or withdraw from the E&E UOA connected with theretention/closure of undergraduate programmes in Economics, Business Economics andFinancial Economics; and for the withdrawers, did withdrawal from the E&E UOAprecede, follow or coincide with the closure of economics programmes?
Figure 1 outlined how decisions on submission to the E&E UOA and the retention ofeconomics programmes may be related to one another. Table 1 provided evidence on thefrequency of each of the theoretical possibilities. Column 1 of Table 1 shows that there were 26(case I) universities. Uninterrupted submission to the E&E UOA was sufficient for thecontinuous provision of an economics programme over the period under consideration, arobust finding that highlights the importance of a strong research base in programme provision
6 It is not possible to make this comparison for all institutions as the information is not available, e.g.Aberystwyth withdrew from the E&E UOA in 1996 but did not submitted to B&M in 1992, making it impossibleto identify a boost to performance.
0
0.2
0.4
0.6
0.8
1
1.2
1 2 3 4 5
Prop
or�o
nw
ithdr
awin
gfr
omth
eE&
EU
OA
Score (1-5) in the last REE submission
Propor�ons of UK universi�es withdrawing from the E&EUOA a�er various REE scores (UK REEs 1992-2008)
Fig. 4 Proportions of UK universities withdrawing from the E&E UOA after various REE scores (UK REEs1992–2008)
608 High Educ (2018) 76:589–614

decisions. There were no universities always in the E&E that had withdrawn (case II) or neveroffered (case VII) an economics programme. At the other end of the spectrum, there were 45institutions that had never submitted to the E&E UOA at any REE and have never offered aneconomics programme (case IX universities). The absence of a research base and a programmego hand in hand in these cases. However, the table also demonstrates that submission to theE&E UOA was not necessary for a university to offer an economics programme. Column 3shows that 21 of the 66 universities that had never submitted to the E&E UOA had offered aneconomics programme between 1992 and 2014. Only 12 of the 21 universities (case VI) in thisgroup continued to offer a programme over the whole period, with just under half (nine of the21) removing their economics programme (case VIII universities). So, 82 % of institutions thathad never submitted to the E&E UOA had either never offered or had offered but removed aneconomics programme. Once again this speaks to the link between research prowess andprogramme provision. The picture for institutions that had entered but withdrawn from theE&E UOA at some point over the period is perhaps a little less clear cut. Of the 35 universitiesin column 2 that had withdrawn from the E&E UOA at some point, 27 (case III universities)had nonetheless retained an economics programme throughout the entire period, with one fifth(seven of 35) of this group were closing their programme (case IV universities).7 Surprisingly,one university had entered and pulled out of the E&E UOA even though it had never offeredan economics programme. When summed up, cases I, IV, VIII and IX account for 67% (87 ofthe 129) of the entire population of UK universities. Moreover, it has to be borne in mind thatthe data are right censored and that universities that have withdrawn from the E&E UOA butthat have not withdrawn their programme may go on to do so at a later date. In the extreme, ifall of the 27 case III universities—that is those that have withdrawn from the REE but have notyet removed their economics programme—eventually closed their programmes, and this groupis added to the existing group, then the resultant combined group accounts for 88% or 114 ofthe 129 universities. With reference to question 4, the evidence suggests that the completeabsence of a research submission or a very strong research record are strongly associated withprogramme provision but that between these two extremes, the picture is more nuanced. Toexplore these complexities a little more closely new and old universities are consideredseparately.
In Tables 6 and 7 old and new universities are considered separately. Column 1 of Table 3shows that all 28 (26 and two late entrants) universities that have always had an E&E UOAentry (case I universities) and that have retained their economics programme were olduniversities. Column 2 shows that there have been 20 old university withdrawers from theE&E UOA that have still retained an economics programme (case III universities) so that onlytwo, Salford and Liverpool, have closed one or more of their economics programmes (case IVuniversities). Liverpool still retains an economics programme while Salford still has someeconomics joint titles. Almost all of the old universities that have withdrawn from the E&EUOA retained an economics programme. It is interesting to note that in old universities,submission to the E&E UOA does not appear to be tightly linked to the decision to offer anundergraduate programme, with almost all withdrawers continuing to offer a programme.
Column 3 of Table 7 shows that 66 of the 79 new universities have never been in the E&EUOA and from column 1, it is clear that no new universities have always been in the E&EUOA. Column 2 shows that of the 13 new universities that have withdrawn from the E&EUOA, only seven institutions have retained an economics programme (case III universities).
7 It is shown below that there are in fact no case V universities.
High Educ (2018) 76:589–614 609

This proportion is clearly far lower than the similar proportion for old universities and indicatesthat old universities are less likely than their new counterparts to close a programme followingwithdrawal from a REE. Remarkably, one new university, Buckinghamshire New (asBuckingham College of Higher Education), submitted to the E&E UOA without having aneconomics programme. The data show that in new universities, withdrawal from the E&EUOA is more likely to be followed by economics programme closure. For some universities, itis almost as if a withdrawal from the E&E UOA signifies the death knell for economics withthe subsequent removal of an economics programme and the probable disappearance of manyof the economics staff.
Examination of the relationship between the sequence of decisions on research withdrawaland programme retention may help shed further light on the nature of the relationship betweenthe two. Cases IV and V from Fig. 1 earlier both involve withdrawal from the UOA andclosure of a programme. In case IV, the programme closure takes place after withdrawal fromthe UOA, with withdrawal from the UOA following on from programme closure in case V. If itis poor performance in a REE that leads to closure of a programme and not the other wayround, then we would expect case IV to be more common than case V. Table 8 shows for eachuniversity that closed an economics programme the dates of programme closure and E&EUOAwithdrawal. Also, shown is the area in which the university is located divided as beforeinto four areas: the South, the Midlands, the North and Other for Wales and Northern Ireland.So, for example, Northumbria’s last submission to the E&E UOAwas in 2001 and its FinancialEconomics programme closed in 2004 and its Economics programme in 2005. The mainfeature of Table 8 is the disproportionate rate of programme closure in the North comparedwith other areas. Recall that the North includes Scotland which saw four of its universitiesclosed an economics programme.
In all cases, the closure of an economics programme occurred after the institution hadwithdrawn from the E&E UOA. Just as there were no cases II or VII universities, there were nocases where a programme was closed before the institution had pulled out of the E&E UOA(case V universities), nor were there any where both were closed or withdrawn in the same
Table 7 New universities’ E&E UOA status and economics programmes 1992–2014
Col. 1 Alwaysin the E&E UOA
Col. 2 Withdrawersfrom the E&E UOA
Col. 3 Never inthe E&E UOA
Col. 4Totals
Economics programme retainers 0 7 12 19Economics programme closers 0 5 9 14Never had an economics programme 0 1 45 46Totals 0 13 66 79
Table 6 Old universities’ E&E UOA status and economics programmes 1992–2014
Col. 1Always inE&E UOA
Col. 2Withdrawersfrom the E&EUOA
Col. 3Never in theE&E UOA
Col. 4Late entrantto the E&EUOA
Col. 5Totals
Economics programme retainers 26 20 0 2 48Economics programme closers 0 2 0 0 2Never had an economics programme 0 0 0 0 0Totals 26 22 0 2 50
610 High Educ (2018) 76:589–614
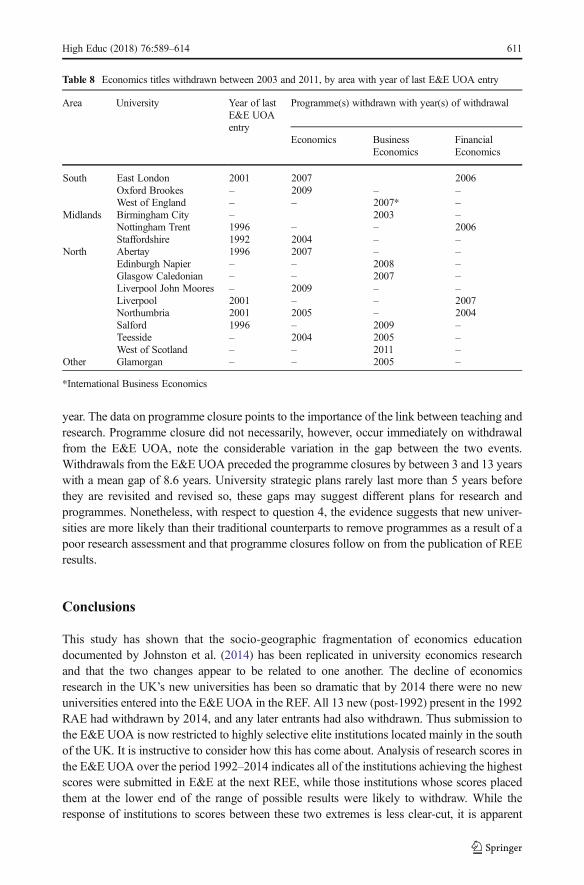
year. The data on programme closure points to the importance of the link between teaching andresearch. Programme closure did not necessarily, however, occur immediately on withdrawalfrom the E&E UOA, note the considerable variation in the gap between the two events.Withdrawals from the E&E UOA preceded the programme closures by between 3 and 13 yearswith a mean gap of 8.6 years. University strategic plans rarely last more than 5 years beforethey are revisited and revised so, these gaps may suggest different plans for research andprogrammes. Nonetheless, with respect to question 4, the evidence suggests that new univer-sities are more likely than their traditional counterparts to remove programmes as a result of apoor research assessment and that programme closures follow on from the publication of REEresults.
Conclusions
This study has shown that the socio-geographic fragmentation of economics educationdocumented by Johnston et al. (2014) has been replicated in university economics researchand that the two changes appear to be related to one another. The decline of economicsresearch in the UK’s new universities has been so dramatic that by 2014 there were no newuniversities entered into the E&E UOA in the REF. All 13 new (post-1992) present in the 1992RAE had withdrawn by 2014, and any later entrants had also withdrawn. Thus submission tothe E&E UOA is now restricted to highly selective elite institutions located mainly in the southof the UK. It is instructive to consider how this has come about. Analysis of research scores inthe E&E UOA over the period 1992–2014 indicates all of the institutions achieving the highestscores were submitted in E&E at the next REE, while those institutions whose scores placedthem at the lower end of the range of possible results were likely to withdraw. While theresponse of institutions to scores between these two extremes is less clear-cut, it is apparent
Table 8 Economics titles withdrawn between 2003 and 2011, by area with year of last E&E UOA entry
Area University Year of lastE&E UOAentry
Programme(s) withdrawn with year(s) of withdrawal
Economics BusinessEconomics
FinancialEconomics
South East London 2001 2007 2006Oxford Brookes – 2009 – –West of England – – 2007* –
Midlands Birmingham City – 2003 –Nottingham Trent 1996 – – 2006Staffordshire 1992 2004 – –
North Abertay 1996 2007 – –Edinburgh Napier – – 2008 –Glasgow Caledonian – – 2007 –Liverpool John Moores – 2009 – –Liverpool 2001 – – 2007Northumbria 2001 2005 – 2004Salford 1996 – 2009 –Teesside – 2004 2005 –West of Scotland – – 2011 –
Other Glamorgan – – 2005 –
*International Business Economics
High Educ (2018) 76:589–614 611

that institutions were more likely to pull out of the E&E UOA if scores were towards the lowerend of the range. This suggests that the information provided by REEs may have been used byuniversities in making decisions on whether to continue to support or withdraw from a researcharea. The likelihood of a university withdrawing from the E&E UOA is found to be inverselyrelated to the score at the previous UOA. The possibility that some UOAs may offer higherscores for any given body of work and in so doing provide an incentive to switch from onearea to another is also considered. In the case of E&E, the closest alternative unit of assessmentis Business and Management. The results show that universities that exit the E&E UOA andmove to the B&M UOA boost their scores in B&M.
A positive association between a strong research base, as evidenced by uninterruptedsubmission to the E&E UOA and an institution continuing to offer an economics programmeis clearly discernible. It also emerges that withdrawal from the UOA is more likely to beassociated with programme closure in the new than in the old universities. With regard to thesequencing of decisions on programmes and research, withdrawals from the E&E UOAalways preceded the closure of an economics programme, suggesting that causation may runfrom research performance to programme retention or closure. However, one event does notflow automatically or immediately from the other, and the time between the withdrawal fromthe E&E UOA and programme closure displays a lot of variation. Nonetheless, the findings ofthis study suggest that the results of REEs have played a role in generating the observedchanges in the position of economics in the UK’s HE system. There is little reason to believethat the experience of economics in the UK has not been replicated in other subject areas.REEs would appear to be implicated in the fragmentation of the UK’s HE system in ways thatmay be intended and unintended. REEs may have driven up research standards and movedresources to their most productive use but in doing so they may also have contributed to asocio-geographic fragmentation of economics education in the UK HE sector. The desirabilityof restricting access to certain academic areas by particular groups is open to debate. Policymakers, when designing REEs should bear in mind these (presumably) unintendedconsequences.
Though this investigation has shed light on some important questions, it is not without itslimitations. To derive more accurate estimates of the relationship between research performance,research support and programme decisions would require the specification and estimation of afully specified structural model. If the data could be obtained their use in this waywould provide auseful extension to the work carried out in this study. In addition, future research might explorewhether the experience of E&E is replicated in other disciplines in theUK and in other parts of theworld where performance-based research funding systems are in place.
Open Access This article is distributed under the terms of the Creative Commons Attribution 4.0 InternationalLicense (http://creativecommons.org/licenses/by/4.0/), which permits unrestricted use, distribution, and repro-duction in any medium, provided you give appropriate credit to the original author(s) and the source, provide alink to the Creative Commons license, and indicate if changes were made.
References
Agyemang, G., & Broadbent, J. (2015). Management control systems and research management in universities.Accounting, Auditing and Accountability, 28(7), 1018–1046.
Bence, V., & Oppenheim, C. (2005). The evolution of the UK’s research assessment exercise: publications,performance and perceptions. Journal of Educational Administration and History, 37(2), 137–155.
612 High Educ (2018) 76:589–614

Bessant, J., et al. (2003). The state of the field in UK management research: reflections of the research assessmentexercise (RAE) panel. British Journal of Management, 14(1), 51–68.
Boliver, V. (2015). Are there distinctive clusters of higher and lower status universities in the UK? Oxford Reviewof Education, 41(5), 608–627.
Broadbent, J. (2010). The UK research assessment exercise: performance measurement and resource allocation.Australian Accounting Review, 20(1), 14–23 No. 52.
Department of Education and Science. (1992). Further and higher education act and further education(Scotland) Act. London: HMSO.
Department for Business, Energy and Industrial Strategy, July 2016, Crown copyright, https://www.gov.uk/government/uploads/system/uploads/attachment_data/file/541338/ind-16-9-ref-stern-review.pdf
Department for Business, Energy & Industrial Strategy (2016) Research Excellence Framework (REF) review:building on success and learning from experience. 28 July.
Docherty, T. (2015). Universities at war. London: Sage.Earle, J. (2017) Assessment forces economists to get in or get out. Research Fortnight, Issue No. 498,
12 April, 21.Elton, L. (2000). The UK research assessment exercise: unintended consequences. Higher Education Quarterly,
54(3), 274–282.Geuna, A. and Martin, B. R. (2001) University research evaluation and funding: an international comparison.
Science and Technology Policy Research, Paper 71.HEFCE (2008) http://www.hefce.ac.uk/pubs/rereports/year/2009/rae2008accountabilityreview/Hicks, D. (2012). Performance-based university research funding systems. Research Policy, 41(2), 251–261.Johnston, J. and Reeves, A. (2015a) The rise of elitism in the study of economics: has it happened and if it has
does it really matter? Royal Economics Society Newsletter, Issue No. 169.Johnston, J., & Reeves, A. (2015b). Is economics becoming an elite subject for elite UK universities? London:
London School of Economics: Politics and Policy Blog.Johnston, J., Reeves, A., & Talbot, S. (2014). Has economics become an elite subject for elite UK universities?
Oxford Review of Education, 40(5), 590–609.Johnston, J., & Reeves, A. (2017). Assessing research performance in UK universities using the case of the
economics and econometrics unit of assessment in the 1992–2014 research evaluation exercises. ResearchEvaluation, 26(1), 28–40.
Jump, P. (2014) The REF: how was it for you? Times Higher Education, 27 February.Lee, F. S. (2007). The research assessment exercise, the state and the dominance of mainstream economics in
British universities. Cambridge Journal of Economics, 31, 309–325.Lee, F. S., Pham, X., & Gu, G. (2013). The UK research assessment exercise and the narrowing of UK
economics. Cambridge Journal of Economics, 37, 693–773.Lodewijks, J., & Stokes, T. (2014). Is academic economics withering in Australia? Agenda—a Journal of Policy
Analysis and Reform, 21(1), 69–88.Lucas, L. (2006). The research game in academic life. Maidenhead: SRHE and Open University Press.Maesse, J. (2017). The elitism dispositive: hierarchization, discourses of excellence and organizational change in
European economics. Higher Education, 73(6), 909–927.Matthews, D. (2016). REF should include all academics, says University of Cambridge. Times Higher Education,
May P.13.Office for Fair Access (2010). What more can be done to widen access to highly selective universities? Bristol:
OFFA.Otley, D. (2010). Research Assessment in the UK: An Overview of 1992–2008. Australian Accounting Review,
20, 3–13. https://doi.org/10.1111/j.1835-2561.2010.00074.x.Pidd, M. and Broadbent, J. (2015). Business and Management Studies in the 2014 Research Excellence
Framework. British Journal of Management, 26, 569–581. https://doi.org/10.1111/1467-8551.12122.RAE (1992) Research Assessment Exercise 1992: The Outcome. Retrieved from: http://www.rae.ac.uk/1992
/index.html (Accessed 3.9.16).RAE (1996) 1/96 1996 Research Assessment Exercise: The Outcome (December 96). Retrieved from:
http://www.rae.ac.uk/1996/index.html (Accessed 4.9.16).RAE (2001) Results. Retrieved from: http://www.rae.ac.uk/2001/results/ (Accessed 2.10.16).RAE (2008) Quality Profiles. Retrieved from: http://www.rae.ac.uk/results/ (Accessed 12.10.16).Radice, H. (2013). How we got here: UK higher education under neo-liberalism. ACME: An International
Journal for Critical Geographies, 12(2), 407–418.Rebora, G., & Turri, M. (2013). The UK and Italian research assessment exercises face to face. Research Policy,
42(9), 1657–1666.REF 2014a Results and Submissions. Available at: http://results.ref.ac.uk/ (Accessed 18.10.14).
High Educ (2018) 76:589–614 613
Research Excellence Framework 2014: Overview report by Main Panel C and Sub-panels 16 to 26. Retrieved from:http://www.ref.ac.uk/media/ref/content/expanel/member/Main%20Panel%20C%20overview%20report.pdf(Accessed 1.1.15)
Robertson, J. (2007). Beyond the research/teaching nexus: exploring the complexity of academic experience.Studies in Higher Education, 32(5), 541–556.
Sayer, D. (2015). Rank hypocricies: the insult of the REF. London: Sage.Siegfried, J. (2014). Trends in undergraduate economics degrees, 1991-2013. The Journal of Economic
Education, 45(4), 398–391.Sharp, S., & Coleman, S. (2005). Ratings in the research assessment exercise 2001—the patterns of university
status and panel membership. Higher Education Quarterly, 59(2), 153–171.Smith, S., Ward, V., & House, A. (2011). ‘Impact’ in the proposals for the UK’s research excellence framework:
shifting the boundaries of academic authority. Research Policy, 40(10), 1369–1379.Talbot, S., Reeves, A., & Johnston, J. (2014). Observations on the re-emergence of a binary system in UK
universities for economics degree programmes. Perspectives: Policy and Practice in Higher Education,18(1), 14–19.
Visser-Wijnveen, G. J., Van Driel, J. H., Van der Rijst, R. M., Verloop, N., & Visser, A. (2010). The idealresearch-teaching nexus in the eyes of academics: building profiles. Higher Education Research &Development, 29(2), 195–210.
614 High Educ (2018) 76:589–614