An Investigation into the Feasibility of Establishing a ... Investigation into the Feasibility of...
132
CONFIDENTIAL TO THE NATIONAL BIOFUELS TASK TEAM i NATIONAL BIOFUELS STUDY An Investigation into the Feasibility of Establishing a Biofuels Industry in the Republic of South Africa PREPARED TO ASSIST THE DEVELOPMENT OF AN INDUSTRIAL STRATEGY FINAL REPORT FINAL DRAFT WITH COMMENTS BY NATIONAL BIOFUELS TASK TEAM ADDRESSED 6 October 2006
Transcript of An Investigation into the Feasibility of Establishing a ... Investigation into the Feasibility of...

CONFIDENTIAL TO THE NATIONAL BIOFUELS TASK TEAM
i
NATIONAL BIOFUELS STUDY
An Investigation into the Feasibility of Establishing a Biofuels Industry in the
Republic of South Africa
PREPARED TO ASSIST THE DEVELOPMENT OF AN INDUSTRIAL STRATEGY
FINAL REPORT
FINAL DRAFT WITH COMMENTS BY NATIONAL BIOFUELS TASK TEAM ADDRESSED
6 October 2006

CONFIDENTIAL TO THE NATIONAL BIOFUELS TASK TEAM
ii
TABLE OF CONTENTS
1 INTRODUCTION .................................................................................................1 1.1 Background ....................................................................................................1 1.2 An Introduction to Biofuels ...........................................................................1 1.3 International Situation....................................................................................3 1.4 Previous Work ...............................................................................................4 1.5 Study Objectives ............................................................................................4 1.6 Methodology in Answering these Questions .................................................5
2 POSITIONING ON ISSUES OF RELEVANCE TO BIOFUELS........................7 2.1 Renewable Energy White Paper ....................................................................7 2.2 Supply Security and Diversity .......................................................................9 2.3 Agricultural and Rural Development...........................................................11 2.4 Jobs ..............................................................................................................11 2.5 SMME's and Emerging Farmers..................................................................12 2.6 Second Economy Integration into First Economy .......................................12
3 COMMERCIAL VIABILITY OF ENTERPRISES (PROJECTS) �– RELATIVE FOCUS.........................................................................................................................13
3.1 Introduction..................................................................................................13 3.2 Basic Assumptions for the Analysis ............................................................14 3.3 Value Chain Overview.................................................................................14 3.4 Crop Variety.................................................................................................16 3.5 Feedstock Production...................................................................................16 3.6 Biofuels Production Facilities......................................................................17 3.7 Biofuels Production Co-products.................................................................19 3.8 Environmental Impact of Biofuel Production..............................................20 3.9 Production Costs ..........................................................................................21 3.10 Biofuel Selling Price ....................................................................................22 3.11 Job Creation .................................................................................................24 3.12 Risk of Exposure to External Factors ..........................................................24 3.13 Comparison with International Experience .................................................27 3.14 Proposed Way Forward................................................................................29
4 INCENTIVE OPTIONS ......................................................................................31 4.1 International approaches ..............................................................................31 4.2 Aims.............................................................................................................32 4.3 Options Available in South Africa...............................................................32 4.4 Trade side incentives....................................................................................33 4.5 SWOT of Possible Incentives ......................................................................34 4.6 Incentives Recommended for Further Examination ....................................34
5 DEMAND ASPECTS..........................................................................................35 5.1 Market suitability of Bioethanol and Biodiesel ...........................................35 5.2 Specifications �– Including Denaturant.........................................................37 5.3 Volumes .......................................................................................................37 5.4 Offtake Options............................................................................................37 5.5 Prevention of Malpractices �– Taxes.............................................................38
6 MACRO-ECONOMIC IMPACT OF BIOFUELS PRODUCTION ...................40 6.1 Introduction..................................................................................................40 6.2 Economic Growth ........................................................................................41 6.3 Job Creation .................................................................................................43 6.4 Household Income Generation ....................................................................44

CONFIDENTIAL TO THE NATIONAL BIOFUELS TASK TEAM
iii
6.5 Impact on National Accounts.......................................................................44 6.6 Risks.............................................................................................................46 6.7 Trade Policy Impact .....................................................................................47 6.8 The Sugar Act ..............................................................................................47
7 AGRICULTURE AND SMALL SCALE FARMERS........................................51 7.1 Agricultural and Rural Development Supporting Land Reform..................51 7.2 Energy Crops versus Other Crops................................................................51 7.3 Food Security ...............................................................................................53 7.4 Additional Land Use for Biofuels................................................................55 7.5 The small scale farming sector ....................................................................56 7.6 Subsistence Farming ....................................................................................57 7.7 Suitability ..................................................................................................59 7.8 Land Availability, Restitution and Redistribution ......................................61 7.9 Strategies......................................................................................................63 7.10 Conclusions..................................................................................................65
8 ENVIRONMENTAL ISSUES IN THE INDUSTRIAL BIOFUELS STRATEGY 66
8.1 Introduction..................................................................................................66 8.2 Water and Environmental Health and Quality.............................................66 8.3 Health Issues ................................................................................................69 8.4 Climate Change............................................................................................69 8.5 Climate change and agriculture ...................................................................71 8.6 Soil Fertility .................................................................................................72 8.7 Animal Draught ...........................................................................................76 8.8 Biodiversity..................................................................................................80 8.9 Conclusions..................................................................................................83
9 BIOFUELS INDUSTRY COMMUNICATION STRATEGY ...........................85 9.1 Immediate Actions/ Tasks............................................................................86 9.2 Stakeholder Analysis ...................................................................................87
10 CONCLUSIONS..............................................................................................91 11 RECOMMENDATIONS.................................................................................96 12 POLICY : INCENTIVE RECOMMENDATIONS......................................101
12.1 Offtake security..........................................................................................101 12.2 Pricing ........................................................................................................102 12.3 Fiscal Incentives for biofuels .....................................................................103 12.4 Oil Price Volatility.....................................................................................106 12.5 Impact on Fiscus ........................................................................................107
ATTACHMENTS......................................................................................................108 A. Mass Balance per feedstock and process ...........................................................109 B. Energy Balance Per Feedstock And Process .....................................................110 C. Models and macro-economic assumptions and scenarios .................................111 D. Biofuels : Frequently Asked Questions .............................................................113

CONFIDENTIAL TO THE NATIONAL BIOFUELS TASK TEAM
iv
INDEX OF TABLES
Table 1: How Ethanol and Biodiesel can Contribute to the RE Target of 10 000 GWh by 2013 ...............................................................................................8
Table 2: Total Capital Expenditure for bio-ethanol production from sugar cane, maize, soybean or sunflowers.........................................................................19
Table 3: Total benefits generated by co-product sales .......................................20 Table 4: Saving of GHG emissions and associated value to credit the
production process............................................................................................21 Table 5: Estimated 2006 production costs ............................................................21 Table 6: Biofuels selling price summary ................................................................22 Table 7: ROCE for Agricultural Sector and Biofuels Producers for Sugar Cane
to Ethanol............................................................................................................25 Table 8: ROCE for Agricultural Sector and Biofuels Producers for Maize to
Ethanol ................................................................................................................26 Table 9: ROCE for Agricultural Sector and Biofuels Producers for Soybean to
Diesel ..................................................................................................................26 Table 10: Total Biofuel Industry Output .................................................................42 Table 11: Gross Domestic Product Sources.........................................................42 Table 12: Total Jobs Created ..................................................................................43 Table 13: Total Household Income ........................................................................44 Table 14: Impact on the Current Account..............................................................44 Table 15: Impact of E10 on Fiscus .........................................................................45 Table 16: Impact on E10 and B2 on Fiscus ..........................................................46 Table 17: More maize on less land ........................................................................54 Table 18: Cost of energy embodied in fertiliser in relation to the value of the crop ..55 Table 19: Oil yields from potential and existing SA crops and perennials .......60 Table 20: Area of irrigated land available in small-scale farming areas..........62 Table 21: The job creation potential of biofuels ...................................................64 Table 22: Communication Task Framework .........................................................86 Table 23: Biofuel Industry Stakeholder Analysis..................................................88 Table 24 : Fuel Levy Reduction: Cost of Job Creation .....................................105

CONFIDENTIAL TO THE NATIONAL BIOFUELS TASK TEAM
v
INDEX OF FIGURES
Figure 1: Diagrammatic Value Chain .............................................................15 Figure 2: Production Flowsheet of ethanol from sugar cane..........................17 Figure 3: Production Flowsheet of ethanol from maize ..................................18 Figure 4: Production Flowsheet of diesel from oilseed...................................18 Figure 5: Bio-ethanol Sustainable Production Cost........................................28 Figure 6: Life Cycle Assessment....................................................................70 Figure 7: South Africa�’s ecological foot print over time ..................................80
CONFIDENTIAL TO THE NATIONAL BIOFUELS TASK TEAM
vi
GLOSSARY, ACRONYMS AND ABBREVIATIONS LIST
ARC Agricultural Research Commission AsgiSA Accelerated and Shared Growth Initiative South Africa bbl barrel (oil), 159 litres BFP Bulk Fuel Price. The import parity marker prices of petrol
and diesel in South Africa that are used to calculate the pump prices, and/or wholesale prices.
BFAP Bureau for Food and Agricultural Policy Research, based at University of Pretoria, Department of Agricultural Economics
BTEX benzene, toluene, ethylbenzene and xylene B�”x�” Diesel with �“x�” % biodiesel blended in. Up to B5 blends
require no special marking of fuel pumps in South Africa CMA Catchment Management Areas (Water) CO Carbon monoxide CO2 Carbon dioxide cpl South African cents per litre (100 SA cents is 1 SA Rand) diesohol an emulsion of hydrous ethanol in diesel; also known as
�‘e-diesel�’ DEAT Department of Environmental Affairs DME Department of Minerals and Energy DLA Department of Land Affairs DoA Department of Agriculture DST Department of Science and Technology DTI Department of Trade and Industry DWAF Department of Water Affairs ERU Emission reduction unit, or Carbon credits ETBE ethyl tertiary butyl ether EU European Union E�”x�” Petrol with �“x�” % anhydrous ethanol. E10, 10 % ethanol
in petrol is the international major grade suitable for conventional vehicles
FFV Flexible fuel vehicle. A typical type can run on conventional petrol and up to 100 % ethanol
GDP Gross Domestic Product GHG greenhouse gas ML megalitres (millions of litres) kPa Kilopascal kt Kilo (1000) tonnes kWhr Kilowatt hours LPG liquefied petroleum gas LSD low-sulphur diesel (less than 500 ppm Sulphur) ML megalitres (millions of litres) MON Motor octane number MTBE methyl tertiary butyl ether Mtoe Million tonnes oil equivalent NAAMSA National Association of Automobile Manufacturers South

CONFIDENTIAL TO THE NATIONAL BIOFUELS TASK TEAM
vii
Africa NOx nitrogen oxides pa Annually (per year) PAH polycyclic aromatic hydrocarbon PM10 particulate matter with an aerodynamic diameter of less
than 10 micrometres ppm parts per million R South African Rand (R1 is 7.2 US$ used as base case in
this study) RON Research octane number RVP Reid vapour pressure SAM Social Accounting Matrix SANERI South African National Energy Research Institute TIPS Trade and Industrial Policy Strategies TTW tank-to-wheel TWhr Terra (1012) Watt hours ULP unleaded petrol ULSD ultra low-sulphur diesel (less than 50 ppm Sulphur) UNFCC United Nations Federation for Climate Change US $ United States Dollar (based at 1:7.2 SA Rand for this
report) US EPA United States Environmental Protection Agency VOC�’s volatile organic compounds WTW well-to-wheel

CONFIDENTIAL TO THE NATIONAL BIOFUELS TASK TEAM
Executive Summary i
Executive Summary
If South Africa creates a biofuels industry, considerable investment will be necessary and a number of interrelated, and in cases longer term, impacts may arise. Whether a biofuels industry should be created, thus should require careful consideration.
Given that crude oil, from many sources globally, has a low actual cost of supply, often only a few US dollars per barrel, some form of government support is necessary to establish and support a biofuels industry. The level thereof may be reduced or removed if oil, and hence petrol and diesel, prices remain high or rise.
Precisely due to the fact that Government must create a favourable regime, it is necessary to justify whether the costs of the regime are warranted by the benefits of biofuels. The benefits, and costs, must include full costs and externalities, as well as addressing social and environmental aspects.
The objectives of this study are to determine:
1) Is a biofuels industry in South Africa justified? 2) If so, what magnitude and nature thereof is optimum? 3) What incentives and regulatory environment is needed to support
the creation and ongoing operation of such an optimum size industry, and in an optimal manner, so as to maximise the national benefits?
The findings of the study must be the basis for the development of a Biofuels Industrial Policy. The answer to the above questions is determined as follows: 1) By an examination of the issues that would justify the creation of the
biofuels industry, such as environmental benefits, supply security and job creation.
2) By examining what a South African biofuels industry could look like, and comparing South Africa (with a biofuels industry) with South Africa (without a biofuels). The current position is that South African liquid fuels contain insignificant levels of biofuels. The key to a biofuels industry is what is achievable as regards the production of feedstock (the growing of crops), and the costs thereof. The analysis follows a narrowing focus as follows:
I. Identifying land availability for growing energy crops �–
This is extracted from a report to the DoA (Department of Agriculture) by the ARC (Agricultural Research Commission) : Overview of Land Suitability for Biofuel Crops, March 2006

CONFIDENTIAL TO THE NATIONAL BIOFUELS TASK TEAM
Executive Summary ii
II. Yields for various potential energy crops �– This is extracted from a confidential report to the National Biofuel Task team by the DoA : Suitability of Crops for Production of Biofuels in South Africa, September 2006.
III. Transport to a biofuels processing (conversion) plant IV. Conversion plant costs expressed as operating costs and
capital repayment �– This is based on a combination of international actuals, local costs and local quotations for new operations, which are confidential.
These first four steps enable the calculation of the pure economic costs of producing biofuels, i.e. as SA cents per litre. To simplify comparisons, this can be expressed on a crude oil equivalent price basis in US$ per barrel (bbl). This is calculated by correlating the South African BFP (bulk fuel price , the import parity marker, for petrol and diesel with the relative value of biofuel substitutes. Then follows:
V. Establishing what incentives could and need to apply to
make these plants and the supporting agriculture viable, by establishing:
VI. The blending impact and hence value that the oil industry, or motorist, places on the produced biofuel
VII. Macro-economic effects are then be calculated from the above six outputs using a macro-economic multiplier model. A simple cost benefit analysis then determines optimum levels of industry or investment.
Once optimal economic scenarios have been determined, more detailed social and environmental benefit maximisation analyses can be conducted, in this case with particular emphasis on land reform and emerging farmer opportunities and support.
The objective of such an analysis is to determine optimum biofuel levels for South Africa.
The industrial strategy then needs to consider how such optimum investment and industry levels can be created to maximise benefits to society. This includes determining an appropriate level of incentives and supporting regulatory framework, which will be the basis for government policy interventions.
Findings
a. Based on international targets by developed countries, with Kyoto commitments, and given South Africa�’s limited agricultural capacity, a biofuels target of 3.4 % of liquid fuels (by energy) by 2013 �– equating to 50 % (by energy) of the total Renewable Energy target (of 10 000 GWh by 2013) �– seems reasonable.

CONFIDENTIAL TO THE NATIONAL BIOFUELS TASK TEAM
Executive Summary iii
b. Biodiesel from soybeans is viable, generating commercial returns, without subsidies, for South African farmers and investors in local processing plants, for a crude oil price of the order of $ 65/bbl (assuming that BFP pricing is achieved). The price needed increase as the penetration starts to exceed B2 (2 % biodiesel based on national diesel volumes) in the short term as the animal feed sector has a limited capacity to absorb an increase in the supply of oilcake, the dominant (of the order of 70 % by overall mass yield) co-product.
c. Bioethanol from maize and sugar cane �– both of which South Africa
does produce in excess (in �“average�” yield years) �– can together roughly meet E10 demand �– is viable (generating acceptable returns to growers and plants for the present, without any subsidies) at an oil price of the order of $65/bbl (assuming 95 % of BFP price is achieved).
d. Limited South African biofuels production, viable at $65/bbl, typically
requires $40/bbl equivalent to be paid for feedstock (eg. to farmers), $15/bbl equivalent for operating costs and maintenance etc, and generating $ 10/bbl equivalent to pay back capital and contribute to profits.
e. South African costs of supply are similar to the USA, much lower
than the EU (using wheat to ethanol as baseline, almost half), and about 50 % higher than for Brazil. The main differences would be due to agricultural yields, efficiencies, support for agricultural (food) products and alternative land values.
f. At a biofuels selling price of 95% and 100% of Basic Fuel Price for
fuel alcohol and biodiesel respectively, the profitability of biofuel producers, and their ability to pay farmers a sustainable price, will be marginal for oil prices below $ 65 per bbl. Additional financial support will be required, possibly in the form of combinations of fuel tax reductions, an equalization mechanism linked to low and high oil prices, capital subsidies, and accelerated depreciation allowances to encourage investment.
g. The establishment of a biofuels industry with E8 and B2 blend
targets seems practically and economically viable given a moderate (equal to current biodiesel fuel tax exemption) level of support and assuming an average oil price of $55/bbl. This average price going forward is a reasonable assumption, but fluctuations, that could result in prices as low as $ 35/bbl, means that this risks would need to be negated by investors, probably by some form of hedging. E8 and B2 level of biofuel production equates to 75 % of the 2013 Renewable Energy target, and represents 4.5 % of total liquid fuels use.

CONFIDENTIAL TO THE NATIONAL BIOFUELS TASK TEAM
Executive Summary iv
h. Establishment of such a biofuel industry (E8 and B2) would generate:
R1 700 million in domestic product, which constitutes 0, 11% of
the current GDP, or ca. 6 % of the AsgiSA target of a 2 % increase in economic growth pa.
55 000 additional jobs, or a reduction in unemployment of 1.25
%.
A net increase of ±R1 700 million per annum in household income throughout the South African economy.
A net reduction of the current account deficit to the value of ca.
R3 700 million per annum.
The total investment made in biofuels production capacity would be about R 4 000 million.
This would have a significant impact on the Fiscus, if fuel tax
reductions were allowed. For a 40 % fuel levy reduction the nett loss to the Fiscus would be of the order of R 350 mil pa. This depends on specific scenarios, such as the oil price and the tax impacts thereof. This is ca R 6600 per job, and would increase for a 100 % fuel levy reduction to ca R 22 000 per job. To ensure the Fiscus is no worse off, the fuel tax could be increased by 1.75 % (ca 2 SA cpl) for the current 40 % fuel levy reduction, and 5.6 % (ca 6 SA cpl) for a 100 % fuel levy reduction.
i. The current fuel levy exemption for biodiesel of 40 % equates to
direct support of jobs at a cost of R 10500 per job. The current 100 % fuel levy reduction for small producers (less than 300 000 litres pa) equates to R 12000 direct support per job. To equalise the cost-benefit as regards jobs, the fuel levy reduction for larger biodiesel plants should be increased to 50 %.
j. Motorists, that are mainly upper income 1st economy participants,
support fuel retail attendant jobs at a cost of R 20 000 per job pa. To provide the same level of support for jobs for biofuels would equate to raising the fuel levy exemption for biodiesel to 75 %.
k. Bioethanol has roughly 70 % of the energy content of biodiesel, on
a per litre basis for which fuel levy exemptions apply, so given fairness as regards support to renewable energy, the fuel levy reduction of bio-ethanol should be 70 % of that for biodiesel.
l. Indigenous biofuel production should not be unfairly supported over
other indigenous renewable energy projects, such as wind, wave and cogeneration of electricity using biomass, which have similar externality benefits. A fuel levy exemption of 50 % for biodiesel,

CONFIDENTIAL TO THE NATIONAL BIOFUELS TASK TEAM
Executive Summary v
which corresponds to roughly $ 10/bbl crude oil, is also equal to support for renewable electricity of 13.5 SA c/kWh over fossil- or coal-based electricity. (This level can be compared to the CDM credit that could apply for a biofuel plants, but has not yet been agreed at the UNFCC, which varies from under 1$/bbl for maize to 4$/bbl for sugar cane.)
m. A 4.5 % biofuel contribution to total liquid fuels use would do little for
supply security, as consumption growth typically cancels this out in a matter of two years.
n. Neighbouring SADC countries have a greater biofuel production
potential, as they have more arable land and more available water. Biofuel production in SADC will improve the regional economy and provide improved regional supply security and diversity. South Africa is the leader in the region and represents the major market. A national biofuel programme would be supportive of a regional biofuel programme, and this should include harmonisation of regional fuel specifications.
o. Future fuel specifications development should integrate
opportunities for biofuels via a supportive framework, and must be an integral part of determining future clean fuels programmes.
p. Given South Africa�’s limited agricultural land and water availability,
it is important to guard against an over-investment in biofuel production. Rather, a healthy balance between the production of food and fuel is needed, and this should guide the level of incentives provided. A biodiesel fuel tax exemption of 50 % ($ 10/bbl crude oil equivalent) appears justified based on the direct tax incentive cost of creating a job of R 12 000, and a level of up to 75 % ($ 15/bbl crude oil equivalent) based on a cost of jobs of R 20 000, of the same level as the cost of petrol retail forecourt jobs, is also justified. Given the need to avoid over-investment, and excessive costs of support to the Fiscus, and that the level of incentive, of 40 % or the proposed 50 % fuel levy exemption, may not be sufficient to support the establishment of an optimum level (based on macro-economics) biofuels industry, the level of fuel levy exemption incentive should be gradually raised (at the annual budget) until such optimum investment (or biofuels industry size) is achieved.
q. However, once investments are made, and particularly when capital
is paid off and operating efficiencies are improved, the level of fuel tax incentive can be reduced, for example as part of the annual budget. To encourage the formation of an infant biofuels industry, the incentives should be fixed for period, of say 5 years for investors. This could be tied to particular targets and the reaching thereof.

CONFIDENTIAL TO THE NATIONAL BIOFUELS TASK TEAM
Executive Summary vi
r. There is a natural opportunity to hedge between South African fuel users and biofuel producers when oil prices (in Rands) are high or low and this beneficial opportunity could be utilised. This will reduce risk for investment in biofuels production by providing a hedge. This is an additional option and a very powerful means for supporting the establishment of biofuels production.
s. Internationally, waste-cooking oil is generally the first and most
economic source for production of biodiesel. (Given the generally poorer stability and propensity to polymerise that leads to deposits this production requires more stringent controls.) This has limited application in South Africa, as used cooking oil, despite its certain carcinogenic risks, is often sold as �“new�” oil to the poor in the townships, at high (relative to the value as biodiesel feedstock) prices.
t. The use of illuminating paraffin is subsidised as the fuel is exempt
from fuel taxes and VAT. This subsidisation ignores the massive externality costs of between R 1 billion to R 100 billion pa incurred in the use of the fuel due to ingestion (of the order of 20 %) and fires (of the order of 70 % contribution to externality costs). The externality cost penalty on illuminating paraffin should therefore be between R 2/liter to R 200/liter. As a result of the absence of such an externality cost on illuminating paraffin, ethanol as gel fuel is not receiving the favourable and equitable treatment it deserves.
u. Any incentive for biofuels works its way down the value chain, as
consumers are not offered biofuels at cheaper prices than mineral based fuels, given that they are substitutes (at least at the up to E10 and B5 levels that may be realised in South Africa in the short to medium term). They thus are mainly agricultural incentives, where of the order of 65 % of the value is captured.
v. It will be difficult to develop a programme that enables significant
amounts of biofuels to be produced by small-scale subsistence farmers unless changes to farming practices and specific programmes are implemented. This has challenges, as interventions over the past decade aimed at increasing yields of crops like maize on communally owned land have been dogged with problems and failures
w. Internationally successful biofuels programme implementations
have had government co-ordination generally, including communication, and review.
Recommendations
On the basis of the findings, the following recommendations are made.

CONFIDENTIAL TO THE NATIONAL BIOFUELS TASK TEAM
Executive Summary vii
1. Develop incentives and regulations that enable biofuels producers in regions to be able to supply the oil industry, that then blend up to E10 and up to B5 market penetration levels. This support to continue until the fledgling biofuels production industry obtains a 5 % market share (based on national volumes of petrol and diesel). This can be supported by selective niche uses at higher levels, such as E85 and B100, where there are additional benefits, such as indoor forklifts and underground mining, where the reduced emissions result in health benefits.
2. Ethanol Gel fuel as safe IP substitute
An additional example of a niche application, may be ethanol gel programmes to replace IP, where major health benefits can arise. This should be tackled as a separate intervention as part of an existing Ministerial Directive aimed at reducing the health harm of domestic IP use. At the least, in the absence of an illuminating paraffin (IP) tax, a mechanism should be created to incentivise ethanol for ethanol gel use, thereby giving it the same advantage over petrol as IP enjoys. To assist the mainly low-income users of IP, this could be covered by adding a small tax to petrol and diesel sales, mainly used by the more wealthy. The oil industry should provide inputs to such a scheme. For instance, to favour ethanol , for ethanol gel, over IP, to the same degree as ethanol over petrol, would involve a 1 cpl increase in the petrol and diesel fuel levies allocated to ethanol gel or to safe IP alternatives. Given that the Road Accident Fund, which caters for three times as many deaths as are due to IP use, receives a 36.5 cpl tax, a tax of up to 12 times (or 12 SA cpl) would be equitable for supporting safe alternatives to IP.
3. Government should avoid over-subsidising energy crops and
biofuel production, and incentives should be able to be adjusted as part of the annual budget. It is, however, proposed that where possible that these mechanisms be fixed for five years to provide more certainty to investors, as part of the kick-start to establish the industry. The fuel levy exemption for biodiesel should be raised from 40 to 50 %, based on equitable support of job creation compared to small plants. This can over time justifiably be raised, if this is necessary to stimulate investment to reach a 5 % biofuels target, to a 75 % fuel levy exemption. The costs of such support, could be recovered by the Fiscus to be nett neutral, by adding to the fuel levy 0.6 cpl per 10 % fuel levy increase for biofuels penetration up to 5 %.
4. Bioethanol and biodiesel selling prices should be regulated at
95% and 100% of Basic Fuel Price respectively until invested capital has been recovered, and market access has been provided by the oil industry at up to 5 % biofuels on a national basis. Oil depots (wholesalers) retain 5 % of the petrol BFP for ethanol handling to cover costs. Oil company wholesalers should accommodate and pay for ethanol and biodiesel according to their national market shares. A condition of wholesale and depot licences

CONFIDENTIAL TO THE NATIONAL BIOFUELS TASK TEAM
Executive Summary viii
should be to take up to B5 and up to E10. A pilot programme, ideally involving PetroSA, where figures are made transparent should confirm that these numbers are reasonable. The numbers can be adjusted, where warranted, when significant history is built up. The intention is to later move towards a free market situation, once biofuels can stand on their own feet and have become an integral and normal feature of liquid fuels.
5. Mandated blending of biofuels in regions of local supply
To minimise duplication of infrastructure, maximise efficiencies and ensure equitable and fair treatment of stakeholders, biofuels upliftment should be restricted to refineries and depots in the proximity of the biofuels producers. To further ensure that there are minimal changes in fuel type supply to consumers, this should be done on a regional basis. This programme must be developed with the organised oil industry, many of whom have extensive experience, particularly internationally, with biofuels integration into the existing fuel pools. A condition of licence for petroleum refineries should be to adjust their supply to depots, so that it can be blended with ethanol up to E10, where receiving depots request BOB (basestock for oxygenate, ethanol, blending) and are part of the ethanol region. Refiners also have the option to negotiate different ways to uplift and use the ethanol.
6. The same, regulated pump price should apply to blends up to
E10 as for standard (E0 or mineral only) petrol. Where ethanol is supplied and the region is an ethanol region, the ethanol blend must be taken by all oil companies in that region. The ethanol may perhaps only be added to one of the grades of petrol. An E10 ethanol blend should be used as the basis for incentives and policy development. Nevertheless the oil industry should be free to choose alternative ways of upliftment and use of the ethanol in the regions.
7. Implementation staging and regionalization
The implementation of biofuels should be staged on a regional basis to allow all stakeholders to iron out initial production and logistic issues to ensure a steady build up to best practice. This will build the confidence to accommodate the biofuel industry as a productive part of the South African economy. Certain regions that are not competitive producers of biofuels, and where no investment in biofuel production takes place may never be included. This staging can be managed as part of the licence conditions of biofuels production plants.
8. Financial support to biofuel producers
Financial support to biofuels producers, especially in the first five years of production, cannot be sourced only by means of a regulated biofuel transfer price from the current oil industry. Government intervention in the form of tax reductions and capital incentive schemes are needed as well. Incentives to ensure the profitability of

CONFIDENTIAL TO THE NATIONAL BIOFUELS TASK TEAM
Executive Summary ix
the biofuel enterprise should factor in the impact that crude oil price fluctuations have on profitability. This can be done as a hedge with motorists via the existing CEF Act that reduces price risk to biofuels producers and fuel consumers in an equitable way and with very low costs to consumers. The mechanisms hereof are discussed in the Incentives Proposal section of this report.
9. Tariffs
Import tariffs on energy crops ((i.e. sugar, molasses, maize, soybeans, vegetable oils etc.) are not advised as they normally degenerate into artificially shaped economic structures that may spill over to other agricultural sub-sectors. The existence of such tariffs would also unfairly discriminate against biofuel producers compared to crude oil refiners, as crude oil carries no import tariff, and produces a directly substitutable product. Similarly, in the absence of taxes on refined petrol and diesel imports, biofuel imports should not face import tariffs. However, biofuels incentives, such as fuel tax reductions and any hedge mechanisms, that are justified by the macro benefits, should only apply to local biofuels production from locally grown crops. The capital depreciation incentive would apply to biofuels plant investment, whether local or imported feedstock is used.
10. SADC and Clean Fuels Integration
Biofuels have opportunity for SADC fuel security and diversity improvements. South Africa should play a pro-active role in leading and supporting regional fuel standards harmonization that improves air quality (clean fuels) and that is supportive of the use of biofuels.
11. Control of bioethanol tax avoidance and use in potable market All bioethanol producers need to be licensed with the DME and SARS, and subject to audits applicable to potable alcohol producers, irrespective of production volumes. They should also pay the full fuel tax (but not the excise tax applicable to potable alcohol) and claim back the exemption part, based on oil company depot or wholesale company proof of receipts, and proof of quality. Small bioethanol producers should not be incentivised, as occurs for small biodiesel (< 300 m3 pa). To avoid fuel alcohol illegally entering the potable market, it must be denatured on site and stored with a bittering agent and a suitable level of denaturant, such as 5 % petrol. This practice must be developed and agreed with stakeholders.
12. Emerging Farmer Development
Develop a separate strategy for the small-scale farmer based on low input, low cost practices that first addresses poverty alleviation and only later encourages surplus production for the market. This should include an assessment of the ability of perennial crops, co-products, institutional arrangements and innovations to contribute to local community energy security and local rural economic development. Irrigation schemes need to be given special consideration. Any

CONFIDENTIAL TO THE NATIONAL BIOFUELS TASK TEAM
Executive Summary x
energy crop production subsidy should be extended to the small-scale sector. Studies and research into assisting farmers to adopt Conservation Agriculture, such as drip irrigation and conservation tillage, should be undertaken.
13. Government Agencies as Drivers Government agencies, such as IDC, CEF, PetroSA and the Land Bank should be tasked to implement biofuels programmes that serve as an example of what can be achieved, and focus on maximising national benefits. These should include a minimum of 30 % participation by previously disadvantaged across the full value chain. Another way that government can facilitate biofuels use, is by examining where dedicated and niche fleets can be established that use E85 and B100. This could be government fleets or driven by incentives, such as for public service transport providers. This should be done in conjunction with available licensed biofuels manufacturers and suppliers.
14. Research on Crops and Alternative Technologies for the Future
Further research and studies to assess the suitability of perennial crops and other alternatives for the biofuel market is advised. This is covered in a report by the DST (Department of Science and Technology).
15. International Alignment and Co-operation
Alignment and use of available Brazilian, Indian and Chinese experience should be made as this represents world leading practice and is also more suited to an emerging market focussing on job creation.
16. Water Conservation
Reliable water supply is essential for energy crop production. Catchment Management Agencies need to be capacitated on issues related to the cultivation and processing of energy crops. Further scoping regarding projected water use in the expansion areas of energy crop cultivation should be undertaken. Biofuels processing needs to be carefully assessed for its impact on the water reserves in a given catchment. Water efficiency needs to be promoted within the cultivation of energy crops and the biofuels processing sector. This is part of ongoing DWAF (Department of Water Affairs) and DoA (Department of Agriculture) strategies.
17. Energy Efficiency and Lifecycle Impacts
The fossil energy input for some bio-fuels (e.g. ethanol from maize) is significant and can nullify the environmental benefits of bio-fuels. In future, the life cycle approach should be used when considering support for programmes that are chosen based on their capacity to mitigate climate change. This will require development, as is happening internationally within the UNFCC, so that then a

CONFIDENTIAL TO THE NATIONAL BIOFUELS TASK TEAM
Executive Summary xi
differentiated and equitable fuel levy reduction formula can apply to different producers.
18. Used Cooking Oil Health Harm
The substantial health costs of using used cooking oil as new oil requires a value chain approach analysis to minimise harmful impacts. This requires a separate investigation. For instance, a levy could be introduced on new cooking oil to subsidise the collection of used cooking oil for processing into biodiesel rather than for use as new oil or for animal feed. A suitable interdepartmental Government programme should lead such an initiative.
19. Co-ordination and Communication Stakeholders, including consumers should be allowed to comment and to assist the achievement of the benefits of the limited (up to 5 %) biofuels industry in South Africa. Elements of a communication strategy that should be developed further in a workshop, and rolled out are included in the report. The National Biofuels Taskforce should continue as a smaller inter-departmental biofuels co-ordination body, still chaired by the DME Renewable Energy Directorate.

CONFIDENTIAL TO THE NATIONAL BIOFUELS TASK TEAM
Page 1 of 116
1 INTRODUCTION 1.1 Background
This document is the final and second phase of a two-phase Study that investigates:
a. The desirability of a national biofuels industry from a national
perspective, accounting for all benefits and costs, according to sustainability, namely:
Social, Economic, and Environmental.
Job creation and upliftment of the so-called second economy are the prime benefits or objectives.
b. What is required (of Government) to support the development and
sustainability of a biofuels industry, and are such measures justified by the overall cost-benefits (including the costs of the measures).
Based on initial technical considerations, supported by international experience, the study assumes:
i. Ethanol blended into petrol at up to 10 % (vol/vol), or so-called E10. It shall also consider the use of E85 (ethanol denatured with petrol, as ethanol is �“alcohol�” that people drink) and which may be used in dedicated or flexi-fuel engines.
ii. Biodiesel blended into the diesel pool at 5 % (B5), but higher blends up to B100 (neat biodiesel) are also considered.
The research does not focus on stationary uses of ethanol1, however due consideration is to be given to biodiesel for non- transportation purposes.
1.2 An Introduction to Biofuels
Worldwide there is a move to so-called renewable (clean and sustainable) energy, as opposed to (non-renewable or depleting) fossil fuels.
Liquid fuels �– mainly petrol, diesel (both marine and road) and jet fuel �– make up about 40% of world energy use, and make up 95% of transport energy use. This mainly comes from crude oil, of which 82 million barrels (159 litres per barrel) are used daily, representing ca. R40 billion expenditure (or costs) every day. South Africans use about 0.7% of world ,petrol consumption, 0.4% of world diesel, and 0.3% of world crude oil.
1 This is probably valid as ethanol has about 70 % of the energy of hydrocarbons (petroleum), and thus use would be greater in stationary applications, and this would mean lower value achieved.

CONFIDENTIAL TO THE NATIONAL BIOFUELS TASK TEAM
Page 2 of 116
(The reduced relative crude oil use is due to South Africa having synthetic crude oil production, which accounts for about 30% of petrol and diesel use, or supply.)
South Africans spend about R120 billion pa (R300 mil per day) on liquid fuels, representing almost 8 % of GDP (2006 basis). Crude oil imports supply about 65% of the input energy and, at an expenditure of ca. R45 billion pa, make up 20% of all South African imports. This is by far the biggest single item of trade, exceeding the value of gold and even platinum exports. Recent high oil prices have made this a significant contributor to inflation, which has lead to interest rate rises, and to the widening current account deficit, which has lead to a weakening exchange rate.
Liquid fuels make up about 30% of South African energy use, but constitute approximately 70% of South Africa�’s total energy expenditure, 65% of which being sourced from crude-oil imports. The massive spend on crude oils, and their harmful effects on the environment, are major motivations to finding a substitute, preferably renewable fuel source. Currently, the only significant substitute for crude oil-derived transport fuels are biofuels �– bioethanol, a petrol substitute, and biodiesel, diesel substitute.
Bioethanol is the same as the common alcohol that humans drink. It can be produced from traditional sugar-based crops, such as sugar cane, sweet sorghum and sugar beet, as well as from starch-rich crops, such as maize, barley, wheat and cassava. The production of both crop types is proven, having been grown and processed extensively for hundreds of years.
South Africa first produced bio-ethanol as an indigenous motor fuel in the 1930�’s. However, cheap and plentiful crude oil from the 1950�’s through to the 1970�’s made this uneconomic.
Biodiesel can be produced from oilseed crops, such as soya, rapeseed (canola) and sunflower; from used cooking oils; and from animal fats. This is typically a two-step process: first by rendering or expressing the raw oil and thereafter improving the biodiesel properties by esterification.
A feature of both types of liquid biofuels is the production of by-products (or co-products). These include animal feed and biomass, a renewable source of electricity generation.
The most important feature of biofuels, however, is that they are grown, and continue to grow, unlike depleting fossil fuels. Accordingly, the earlier production (and use) of renewable biofuels saves (replaces) more crude oil. Fossil fuels are produced (more correctly �“extracted�” or �“mined�”) either now or later, and cannot be ongoing, so the sources continue to deplete.
Biofuels costs are thus based on agricultural feedstock costs, and this comes down to alternative use of land, or value that can be achieved.

CONFIDENTIAL TO THE NATIONAL BIOFUELS TASK TEAM
Page 3 of 116
Higher prices for other crops (non energy crops) or for simply selling the land, for example for residential property, will mean that the energy crops will not be grown. As far as other commodity and resource based businesses are concerned, the key cost is the cost of the raw material, and this is no different for biofuels where the agricultural feedstock typically makes up 60 �– 70% of the cost of biofuel production.
Second-generation biofuel production technologies, which have great potential, but are not yet commercially proven, are not included in this study. These technologies include the conversion of cellulose to ethanol and syngas production from biomass, via gasification, the so-called BTL (biomass-to-liquid) process. Such processes may become proven in the future.
1.3 International Situation
Worldwide national biofuel programmes were initiated primarily for supply security and to mitigate against massive trade deficits caused in the 1973 by the oil price shocks. The leader was Brazil, which now produces about 50% of its petrol needs as ethanol from sugar cane, used either as E85 or E20-25. The USA maize-to-ethanol programme �– which produces similar volumes to Brazil, or about 1.5 times South African petrol use �– was largely driven by expanding the market for maize beyond food and industrial alcohol use, and to provide air quality benefits and supply security.
Biofuel programmes are now gaining popularity as, apart from replacing imported crude oil, they reduce global greenhouse gas emissions. Accordingly, they have received massive fiscal support, primarily through reduced fuel levies. Fuel levies of up to R4.50 per litre are common in Europe, and exemptions of up to 100% are typical. Germany, a European biofuel (biodiesel) leader, has reached 2% biofuels market penetration. However, due to rising tax losses, Germany has recently re-introduced tax on biodiesel.
Biofuels have a far higher job-creation potential, of up to 100 times that for refining of imported crude oil. In South Africa, E10 has the potential to create about 50 000 direct jobs, mostly in rural areas, in addition to saving on foreign exchange expenditure. The sustainable nature of biofuel production, of �“growing your own fuel from sunlight�”, can support rural development and initiatives such as land reform. However, caution must be exercised that there is sufficient water and that biodiversity is not compromised. Further, biofuels may cost the country and consumers much more than crude oil imports in the event of a low oil price scenario. This Study needs to examine these diverse issues in a holistic and clear manner.

CONFIDENTIAL TO THE NATIONAL BIOFUELS TASK TEAM
Page 4 of 116
1.4 Previous Work
Phase 1 covered the compilation of an up-to-date bibliography of all reports or investigations done by or commissioned by Government (both national and provincial), nongovernmental agencies (where possible) and parastatal institutions on any aspect concerning the establishment of a biofuels industry in South Africa. This included: SA Sugar Association, SA Biofuels Association, IDC, CEF, Agricultural Research Council, UKZN, Grain SA, University of Pretoria, BFAP, CSIR, technology suppliers, Sugar Beet RSA, DTI (tariff information, incentives, Sugar Act, trade information), DEAT (Environmental Impact Assessment requirements), DoA, DWAF, the Designated National Authority, DLA, DoT, RFA, Petronet (for pipeline logistics), DST, oil companies, National Automobile Association, ITAC, Water Research Commission, Land Bank, DME, and Archives, including those belonging to parts of the state infrastructure such as the Central Economic Advisory Services, the National Energy Council, Board on Tariffs and Trade and others that investigated biofuels, particularly in the 1970s and early 1980s.
This literature review identified gaps in the knowledge base that may require responses through further research or investigation. A comprehensive list of the �“hanging�” issues was tabulated and presented to the national Biofuels Task Team for consideration and further processing. These hanging issues address the questions posed for responses in Phase 2 �– this Report.
During Phase 2, the issues agreed on by the national Biofuels Task Team for further research were studied.
1.5 Study Objectives
Considerable investment is required for the build up of bioethanol and biodiesel production capacity and this requires long-term planning.
Given that crude oil has a low actual cost of supply, often only a few US dollars per barrel, subsidies, or some form of government support, are necessary to establish and support a biofuels industry, even though it may be argued that their overall level should be reduced if oil, petrol and diesel prices remain high or rise.
Precisely due to the fact that Government must create a favourable regime, it is necessary to justify whether the costs of the regime are warranted by the benefits of biofuels. The benefits, and costs, must include full costs and externalities and also address social and environmental aspects.
The objectives of this study are to determine:
1. Is a biofuels industry in South Africa justified?
CONFIDENTIAL TO THE NATIONAL BIOFUELS TASK TEAM
Page 5 of 116
2. If so, what magnitude and nature is optimum? 3. What incentives and regulatory environment is needed to create this
optimum size industry, and in an optimum manner?
The findings must be the basis for the development of a Biofuels Industrial Policy.
1.6 Methodology in Answering these Questions
The answer to the first question needs an examination of the issues that would justify the creation of the biofuels industry. This follows in section 2.
The second question is answered by examining what a South African biofuels industry could be, and then comparing South Africa with that biofuels industry, with South Africa without biofuels, the current position or status quo. The key to a biofuels industry is what is achievable as regards the production of feedstock, for example the growing of crops, and the costs thereof. This follows a narrowing focus as follows:
I. Land availability for growing energy crops.
II. Yields for various potential energy crops. III. Transport to a biofuels processing (conversion) plant. IV. Conversion plant costs expressed as operating costs and
capital repayment.
These first four steps enable the calculation of the pure economic costs of producing biofuels, which can be expressed as SA cents per litre, or on a crude oil equivalent basis in US$ per barrel.
V. To establish what incentives could and need to apply to
make these plants viable, and the supporting agriculture, by establishing, as step:
VI. The value that the oil industry, or motorist, places on the produced biofuel.
VII. Macro-economic effects can then be calculated from the above six outputs using a macro-economic multiplier model. A simple cost benefit analysis then determines the optimum level of industry or investment.
Once optimal economic scenarios have been determined, more detailed social and environmental benefit maximisation analyses can be conducted, with a particular emphasis on land reform.
The objective of such an analysis is to determine optimum biofuel levels for South Africa.
The industrial strategy then considers how such optimum investment and industry levels can be created to maximise benefits to society. This includes determining an appropriate level of incentives and supporting

CONFIDENTIAL TO THE NATIONAL BIOFUELS TASK TEAM
Page 6 of 116
regulatory framework, which will be the basis for government policy interventions.

CONFIDENTIAL TO THE NATIONAL BIOFUELS TASK TEAM
Page 7 of 116
2 POSITIONING ON ISSUES OF RELEVANCE TO BIOFUELS
Biofuels can assist South Africa achieve certain objectives, which are already included in existing government policies. How these objectives relate to biofuels is examined below.
2.1 Renewable Energy White Paper
The Renewable White Paper (November 2003) sets a target of new renewable energy supply of 10 000 GWh pa (0.8 Mtoe) to be achieved in 2013. This report does not examine energy other than liquid fuels �– petrol and diesel. These constitute 50% of total South African energy use, as calculated by value, or 20%, as calculated by energy content. As a result, the renewable target for these two products could range from 2 000 to 5 000 GWh.
The Table below sets out how these 20% and 50% targets can be achieved. If only ethanol is used, an E2.5 or E6 blend would be needed to achieve the target, whereas for biodiesel a B3 of B7.5 blend would be required. Alternatively, meeting the target based on energy content requires E1.4 and B1.4, or 1.4% of petrol and diesel being biofuels �– this represents approximately one world-scale production plant for each of ethanol and biodiesel. To achieve the renewable target based on energy content would require ca E3.4 and B3.4, or 3.4% of petrol and diesel being biofuel.
These can be compared to the EU target (non mandatory) arising from a first Directive in 1985 and being finalised in 2003 of 2% biofuels by 2005 and 5.75% by 2010 (effectively growth at 0.75% pa). In 2005, the average market penetration in the EU, despite massive fuel tax exemptions, was 1.4 %, with 10 of the 25 EU countries not achieving the target. This was due to many countries probably not seeing the EU targets in their national interest.
Recently due to the high subsidy (fuel tax exemption of up to 400 SA cpl or $ 80/bbl equivalent) and high oil prices, biofuel production has increased and some countries are doing away with the tax support, despite even initial communication that this would only start in 2009.
National targets vary, for example the UK set a target of 5% by 2020. Other examples of 2010 targets are Japan 1%; Thailand 2%; and Canada 3.5%. The USA set a target of 2.78 % by 2006 (smaller refineries, of less than 75 000 bbl/day exempted until 2011) and 4.5 % by 2010. High oil prices, subsidies and the banning of MTBE, coupled to an oxygen requirement, will lead to this target being exceeded. The USA target applies to refiners, importers and blenders of fuel.

CONFIDENTIAL TO THE NATIONAL BIOFUELS TASK TEAM
Page 8 of 116
China has set a target moving from 3 % to 10 % biofuels by 2020, but such long term targets may mean little, given that circumstances and drivers change significantly over time. In addition, the growth in annual use in China and net oil import growth over one year cancels out any reduced supply achieved by an increase in biofuel supply over 20 years.
Table 1: How Ethanol and Biodiesel can Contribute to the RE Target of 10 000 GWh by 2013
% of RE Target Ethanol Biodiesel E"x" mil l pa B"x" mil l pa
20% (1) 2.5 300 0 0 2 240 0.6 50 1 120 1.9 150 0 0 3 240
Equiv. (3) 1.4 168 1.4 112 50% (2) 6.3 750 0 0
4.6 550 2 160 2.1 250 5 400 0 0 7.5 600
Equiv. (3) 3.4 408 3.4 272 (1) correct by share of national energy use (2) correct by share of costs (expenditure) of national energy use (3) refers to pro-rata as a equal "x" for ethanol and biodiesel
Achieving the 3.4 % biofuel target by 2013 (assuming the higher, by value target applies) will require a number of steps and can vary by region, mainly depending on fuel offtake and supply systems. For instance, E10 supplied in a region accounting for 20 % of the country�’s petrol consumption would effectively amount to a national E2. Similarly, B5 introduced in a region responsible for 40 % of national diesel consumption, would be an effective E2 nationally.
The key factors determining whether and how biofuels are introduced will be investment in biofuels production, as without it there is no biofuels, i.e. this will be supply driven. Given that the fuel (petrol and diesel) market is broadly spread (mainly linked to economic activity, particularly in the 1st economy and the richer LSM1 and 2 households), accommodation of offtake can be provided. (This is not to state that this will be without challenges and costs, but it can be done.)
It is thus recommended to start from production levels that are feasible, and which are the best and first choice investments. In addition, given skills and capacity levels and associated development requirements, a phased approach is recommended. This will enable skills development, minimising imports of skills, and improving efficiency as well as help reduce risks. An earlier, and slower, build-up is therefore advisable.
CONFIDENTIAL TO THE NATIONAL BIOFUELS TASK TEAM
Page 9 of 116
This approach may require potential biofuels investors to subject their investments to an examination to obtain approval and possibly to receive the needed fiscal incentives. This approach is further necessitated by biofuel projects�’ major impact on arable land use �– a typical 100 mil litre pa plant would force a certain land use on 100 000 ha (ca. 40 x 40 km land). This may be necessary given that South Africa has limited arable land. Thus to ensure indigenous food security, no more than about 5 mil ha (3 mil ha underutilised land; and 2 mil ha of existing farmland) can be set aside for energy crops. This is enough for 50 plants, or enough to meet about 50 % of South African liquid fuel needs.
In practice, investment in large biofuel plants generally requires a high density of energy crop planting. If this is not done, feedstock logistic costs will reduce returns to plant and/or farmers, and hence also reduce the real availability of land, given market economics and competition with the food market. Nevertheless, it is expected that investors would address this and, if subsidies are not excessive or are temporary, then overinvestment (possibly harming food security) would not occur. In any case, initial biofuels investment and subsidies would support an agricultural turn-around, and increased planting �– and this could be positive for food security.
Conclusion 1. Based on international targets by developed countries and
given South Africa�’s limited agricultural spare capacity, a liquid biofuels target of 3.4 % by 2013 seems reasonable.
This would, however, do little for supply security given annual consumption growth of similar levels. Over-investment in biofuels production should not be encouraged. Rather a healthy balance should be achieved between food and fuel production. Government must avoid over-subsidising energy crops and biofuel production. Indigenous biofuel production should not be unfairly supported over other indigenous energy projects, such as wind, wave and co-generation of electricity using biomass. Biofuels plants (projects) should be positioned so as to support the national interest. (These represent �“either or�” choices.) While the free market should ensure that these are well positioned, care should be taken that this does not benefit historical and/or vested interests. Given that public funds are supporting biofuels, and other renewable energies, and that the public ultimately pays as the fuel consumer price takers, some regulatory checks and balances are required. 2.2 Supply Security and Diversity
The apartheid government faced UN oil sanctions, and hence �“invested�” in indigenous fuel production, storage and infrastructure, such that South

CONFIDENTIAL TO THE NATIONAL BIOFUELS TASK TEAM
Page 10 of 116
Africa had by far the world�’s leading (over �“invested�”) liquid fuels infrastructure. This lead to the economic folly of South Africa importing crude oil yet exporting refined products in competition with nations not subject to this double transport cost (importing 90 % of the value of oil products; then exporting the same material, albeit in a different, but very small value added, form.) The natural position of South Africa, given the limited oil reserves, should be as a net importer of refined product, and not over �“investing�” in production. South Africa is still a net exporter of liquid fuels by energy content. Well-chosen projects would increase the use of these excess heavy oils and reduce their production. As is the case in the US, South Africa�’s white product consumption (mainly petrol and diesel) is among the highest in the world. Contributors to the volume (and quality) of these products are critical. This is an advantage of biofuels, in that just petrol, as ethanol, or diesel, as biodiesel, is produced. Biofuels thus have a favourable balancing effect on South Africa�’s demand profile versus achievable yields from crude oils and particularly from far cheaper heavier crude oils. In this regard, more expensive white product imports, or proportionally greater imports of crude oil, can be replaced. Nevertheless, given South Africa�’s relatively high liquid fuels consumption (tons oil per capita income) and relatively low agricultural capability (as regards arable land and water), biofuels can only make a small impact on supply security. Economically viable supply diversity of biofuels will only reach about 7 % in the medium term (5 to 10 years), and given that market demand is nearing GDP growth of about 4 %, the country�’s position may still worsen, even with substantial biofuels production.
Nevertheless, as about 35 % (and declining) of SA petrol and diesel comes from indigenous sources (produced from coal and gas), biofuels can help maintain indigenous supply at the same relative level. Put another way, 15 years of biofuels production of 5 % of national demand replaces a year�’s imports (ca R 50 billion at current oil prices). The trade deficit improvement (forex saving) is similar.
For SADC, an earlier move into biofuels has substantial opportunities as regards regional supply security and diversity.
Globally, earlier investments in biofuels delays and lessens the impact of peak oil.
Conclusions 2. Biofuels will have limited impact on liquid fuels supply
security. For instance, the 50 % of renewable energy target of 2013 being met by biofuels equates to 3.4 % biofuels market penetration (2005), and by 2013 will have done very little for supply security given annual liquid fuels consumption growth of similar levels.

CONFIDENTIAL TO THE NATIONAL BIOFUELS TASK TEAM
Page 11 of 116
3. Earlier investment in biofuels will have a greater impact on overall supply security.
4. The opportunity for SADC is supported to have a far more
substantial impact on regional supply security.
South Africa should try to leverage biofuels to better position partnerships with countries that may become net oil exporters such as Brazil, the Middle East, and in particular SADC countries.
2.3 Agricultural and Rural Development
Despite the many advantages of biofuels, such as supply security and meeting Kyoto commitments, agricultural support ultimately emerges as the primary driver of biofuel assistance in all cases (except countries with a very limited capacity to increase agricultural production). Biofuels are produced in rural areas and increase the demand for agricultural products. They typically replace imported petroleum products or crude oil, which is refined in large refineries in or near cities or large ports. The demand for fuel products is typically higher than for foodstuffs, for instance one SUV in the USA consumes as much maize as 25 people. This creates a virtually limitless market for agricultural products and mitigates the threat of excess supply suppressing prices. Nevertheless, the fuel market means that agricultural products, that require land and labour to produce, must compete with crude oil, which can be produced at low costs in oil-rich regions. It also exposes agricultural products to oil price fluctuations. Oil price volatility has historically been greater than that of agricultural and other commodities. For this reason, biofuel production has only been created with government support, including incentives. The question is whether these incentives are justified, and whether the costs of agricultural development via biofuels are more efficient than alternatives. Ultimately though a biofuel programme cannot make an inefficient or high cost agricultural sector work �– all it can do is assist with demand security.
2.4 Jobs
The agricultural component of biofuel production obviously gives it a higher job creation potential than crude oil production �– in the order of 50 times. For South Africa, a crude oil importer, jobs per unit of biofuels are typically 100 times those of refining imported crude oil and even higher than if final products, namely petrol and diesel are imported. This study needs to establish how many jobs can be created in South Africa, and what the cost of this is relative to other programmes.
CONFIDENTIAL TO THE NATIONAL BIOFUELS TASK TEAM
Page 12 of 116
2.5 SMME's and Emerging Farmers
The oil refining industry is capital-intensive involving massive economies of scale. It provides limited opportunities for SMME�’s, which are more labour intensive. This study needs to establish the extent to which a displacement of crude oil refined products can create opportunities and jobs for SMME�’s and, as 90 % of the jobs for biofuels are located in the agricultural sector, for emerging farmers in particular.
2.6 Second Economy Integration into First Economy
For biofuels this entails linking the:
Transport energy sector �– which has been growing at GDP in volume terms and far higher as regards price and hence turnover with the oil price (in Rand terms). Transport energy expense represents about 10 % of GDP, yet employs, at the production level, just 0.05 % of South Africans.
Agricultural sector �– which has been declining at ca 10 % pa, whilst making up 2.5 % of GDP and employing 10 % of South Africans.
A shift from local crude oil refining to biofuel production can increase jobs and move development from cities to rural areas. It can also shift spending from the first economy to the second economy, which is dominated by poorer rural dwellers and farmworkers. This report needs to examine whether biofuels will help shift emerging farmers from a subsistence existence to commercial production.
The use of petrol and diesel whether directly or indirectly, is highest, as a percentage of per capita income for the highest income LSM 7 and 8 groups. These tend to own and drive motorcars and any support for biofuels via a fuel tax therefore constitutes a progressive tax that shifts the tax burden on to the rich.
CONFIDENTIAL TO THE NATIONAL BIOFUELS TASK TEAM
Page 13 of 116
3 COMMERCIAL VIABILITY OF ENTERPRISES (PROJECTS) �– RELATIVE FOCUS
In determining a feasible level for the South African biofuel industry, we first examine commercial viability in the absence of subsidies.
3.1 Introduction
Various discussions involving the Biofuels Task Team and stakeholders emphasised repeatedly that the proposed biofuels industry must be economically viable enterprise and sustainable in the long term. Special interventions, by way of financial assistance and mandated regulations, should not be tolerated indefinitely, unless there are social and environmental benefits that justify this �– such as a general level of support for all indigenous renewable energy forms. This does not mean that certain special arrangements, e.g. tax reductions and capital incentives, should not be used to establish a biofuel industry. Such incentive schemes are perfectly normal for establishing an infant industry, provided that the incentives do not constitute structural support, which may distort economic activity, and social and environmental effects in the long term.
To facilitate decisions on the type and magnitude of initial support required to establish the biofuels industry, it is first necessary to determine the micro-economic sustainability of the industry. The methodology adopted by the Biofuels Task Team to determine such sustainability, at the so-called commercial or enterprise level, is based on a detailed simulation of the agriculture and petroleum refining sectors. This simulates the impacts of energy crop and manufacturing process selection as well as the final blending of biofuel products. The results of the simulation models all reflect dynamic equilibrium of all activities and links of the various sectors.
The results of the enterprise simulations are presented in the following discussion on the various elements in the value chain. A brief description of the value chain in section 3.3 highlights the salient aspects to be addressed in this report. The elements of the value chain will be addressed in sequence of the production process. The factors required to add value along the value chain are addressed in subsequent sections.
The direct and indirect impacts of agricultural crop production and use are discussed in sections 3.4 and 3.5. The consumption of co-products from the manufacturing of biofuels into the agriculture sector is also addressed. The results indicate a dynamic equilibrium balance of all the crops and livestock impacts.
The biofuels manufacturing processes are introduced in section 3.6 and the major production factors are discussed in sections 3.7 and 3.8. The manufacturing process is a crucial element in the value chain and attracts
CONFIDENTIAL TO THE NATIONAL BIOFUELS TASK TEAM
Page 14 of 116
the main focus when potential incentives to the enterprise are proposed, based on varying costs of production.
The risk of exposure to external uncontrollable input factors of the biofuels industry is addressed. The expected job creation potential of the proposed industry is also estimated.
3.2 Basic Assumptions for the Analysis
It is assumed for this analysis that the target blends for bioethanol and biodiesel would be E10 and B5 respectively, as these levels are technically possible for standard pump fuels, and may represent some vehicle application and associated fuel formulation optimum levels. The impacts on agriculture and the petroleum manufacturing industry are evaluated at these fuel market penetration levels. Furthermore, it is assumed that the baseline crude oil price is $ 67/bbl and the exchange rate is R 7,20 per US$.
3.3 Value Chain Overview
The biofuels industry can be described in basic terms by way of the diagrammatic value chain shown in Figure 1. The product flow starts with the agriculture sector producing energy crops suitable for bioethanol and biodiesel production facilities.
The respective plants receive the crop feedstock and process it to a state that would allow conversion into the required biofuel. Although the manufacturing processes differ for the production of bioethanol and biodiesel, each process essentially converts the bio-material into the desired fuel products and co-products.
The fuel products are blended into the existing petrol and diesel inventory for distribution into the market, while the co-products are recycled to the agriculture sector, predominantly as animal feed. Blending of biofuels into existing stocks is expected to be done at current depot facilities, rather than the crude oil and syncrude refineries. The biofuel blend components and the based petrol, as well as the resultant blended final market fuel product, will be subject to quality control and assurance to ensure the appropriate specifications and qualities for internal combustion fuels are met.
The distributed blends of bio-based and standard fuels will then be delivered and ready for purchase at the existing filling stations. This will limit the new infrastructure, such as fuel pumps, pipelines, storage tanks etc., which will be needed.

CONFIDENTIAL TO THE NATIONAL BIOFUELS TASK TEAM
Page 15 of 116
With regard to logistics along the value chain, it is extremely important to ensure timeous delivery of feedstock to the biofuels plants, as well as timeous dispatch of the biofuel products to the current depots. Various forms of agricultural crop storage are being considered and storage of final product is essential to match demand and supply of the biofuel blends.
Figure 1: Diagrammatic Value Chain
AGRICULTURE (Feedstock production)
- Sugar cane - Maize - Soya - Sunflower
MANUFACTURE (Produce biofuels)
- Feed preparation - Reaction / purification - Chemicals / Utilities - Maintenance
BLENDING (Introduce Biofuels into distribution channels) - Quality assurance - Infrastructure - Additives - Value - Costs
MARKET (Fuel Consumption) - Value - Costs - Impact on vehicles
LOGISTICS
Product distribution
- Feed and product storage - Feed and product transport

CONFIDENTIAL TO THE NATIONAL BIOFUELS TASK TEAM
Page 16 of 116
3.4 Crop Variety
A wide variety of crops have potential as energy crops, e.g. bioethanol can be produced from sugar cane, maize, wheat and even cellulosic material such as wood chips, while biodiesel can be produced from soybeans, canola, peanuts, jatropha, sunflower seeds, castor beans, cotton plants and palm oil. The South African climate, however, is not conducive to the cultivation of some of these crops, and average-to-poor soil conditions constrain crop choices further. This analysis has further focussed on existing South African commercial crops and technologies to reduce uncertainty. This focus also covers the main commercial crops with biofuel potential. This does not mean that non-commercial crops, whether in South Africa or internationally, may not be better energy crops for South Africa. Rather the data available on these crops is too limited for modelling purposes. Commercial projects would no doubt examine such alternatives and bring them into play when justified. The quantification and examination of such developments can be supported by DoA, DST, SANERI and other institutions with suitable development mechanisms for energy crops.
Two crops are considered for the production of bioethanol, viz. sugar cane and maize. Currently each of these each represent close to 50 % of worldwide fuel-grade bioethanol production. The results to be obtained from these two crops are considered representative of the majority of bioethanol enterprise scenarios that could be generated for South Africa. Similarly, soybean and sunflower seed crops are considered for the potential production of biodiesel in South Africa, as these are respectively the major oilseed crops internationally and in South Africa. Tropical palm oil is excluded from the considerations of this report, as it is not suited to South African climatic conditions.
3.5 Feedstock Production
The promotion of crop cultivation for biofuel production will have a significant impact on the agricultural sector: Land use will be affected �– commercially active land will be subject to
crop switching and crop rotation programmes will be altered, while new land will be put to use for crop production, depending on its suitability.
The pricing structure of various sectors in agriculture will be affected as supply and demand balances will be shifted substantially while many consumers may be forced to adopt changes in their food preference.
The impact will not be limited to sugar cane and maize production, but will spill over to other crops in the grain, livestock and dairy sectors. For instance, if the production of yellow maize is stimulated for biofuel production, white maize production will decline and prices of this basic foodstuff will increase. The stimulated yellow maize production will also affect wheat, barley, sunflower, sorghum, canola, soybean and other crops directly or indirectly. Besides the impact on grain production, the

CONFIDENTIAL TO THE NATIONAL BIOFUELS TASK TEAM
Page 17 of 116
livestock and (subsequently) the dairy sectors will be affected as co-products from biofuel manufacture will be accommodated primarily in these sectors as feed.
All cross-interactions in the agriculture sector will be subject to a change in their elasticity. The crops produced for biofuel production are all linked back to (alternative) food production value chains, ultimately driven by consumer preferences.
In this analysis the dynamics of the agriculture sector was simulated and checked against best practice obtained from the University of Missouri in the USA. The results obtained describe a dynamic equilibrium rather than a set of static scenarios. Shocks to the system can be introduced to see what the direct and indirect impact would be of crop production for biofuels production.
3.6 Biofuels Production Facilities
A variety of biofuels manufacturing technologies exist. The technologies considered in this analysis are generic and do not reflect any specific technology provider design. Two types of crop conversion plants are indicated for the production of bioethanol, i.e. (i) sugar cane to ethanol and (ii) maize to ethanol. The typical plant design for the production of biodiesel need not distinguish between the two types of oilseed feed, i.e. soybean and sunflower. The basic flowsheet for the production of ethanol from sugar cane can be depicted as follows:
Figure 2: Production Flowsheet of ethanol from sugar cane
Cleaning Crushing
Juice Extraction
Sugar Cane
Bagasse
Steam Generation
(Boiler)
Fermentation
Juice
Distillation Dehydration
Steam
Ethanol
CO2
Water
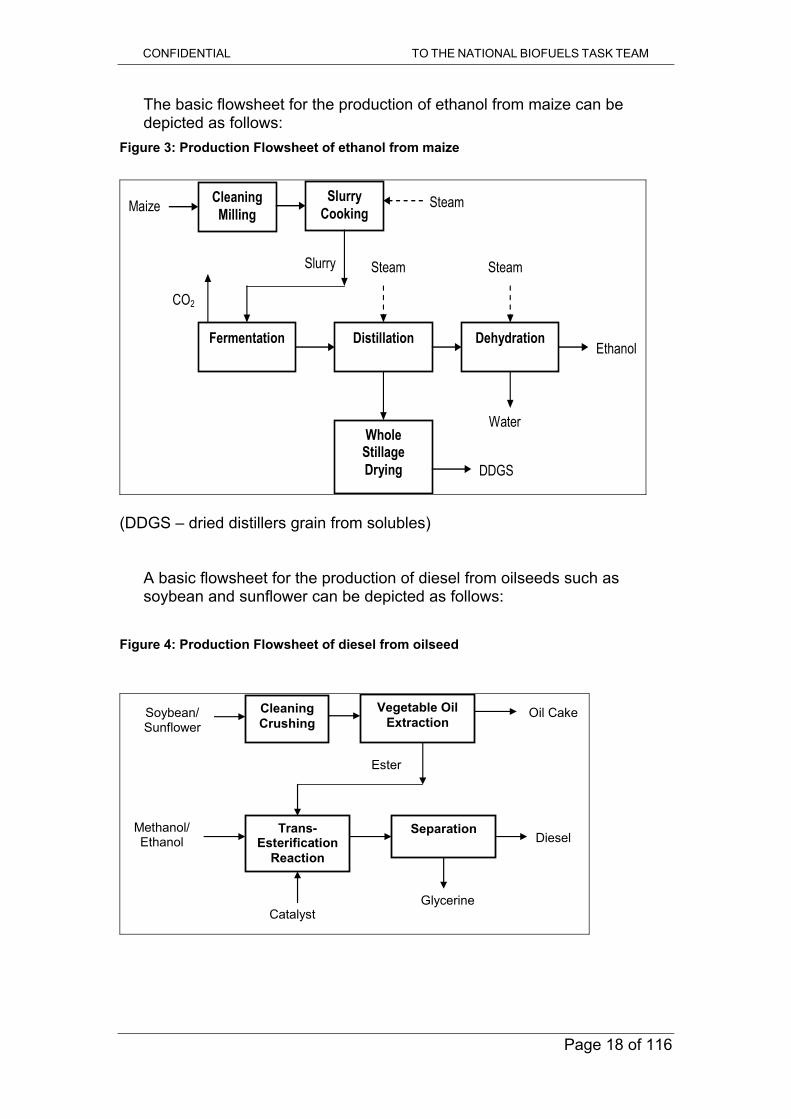
CONFIDENTIAL TO THE NATIONAL BIOFUELS TASK TEAM
Page 18 of 116
The basic flowsheet for the production of ethanol from maize can be depicted as follows:
Figure 3: Production Flowsheet of ethanol from maize
Cleaning
Milling Slurry
Cooking Maize
Fermentation
Slurry
Distillation Dehydration
Steam
Ethanol
CO2
Water Whole
Stillage Drying DDGS
Steam
Steam
(DDGS �– dried distillers grain from solubles)
A basic flowsheet for the production of diesel from oilseeds such as soybean and sunflower can be depicted as follows:
Figure 4: Production Flowsheet of diesel from oilseed Cleaning
Crushing Vegetable Oil
Extraction Soybean/ Sunflower
Oil Cake
Trans-Esterification
Reaction
Ester
Separation Diesel
Glycerine
Methanol/ Ethanol
Catalyst

CONFIDENTIAL TO THE NATIONAL BIOFUELS TASK TEAM
Page 19 of 116
Assuming an E5 capacity required for bioethanol from sugar cane, E5 from maize and B2 from soybean or sunflower seeds, the total capital expenditure required for the above designs are:
Table 2: Total Capital Expenditure for bio-ethanol production from sugar cane, maize, soybean or sunflowers
E5 Sugar Cane Plant
E5 Maize Plant
B2 Soybean Plant
Production capacity kt/a 466 466 164Capex R million 1 845 1 438 330
These capital expenditures reflect the �“greenfield�” erection of conversion plants and include site preparation costs. In practice it is possible to integrate the proposed sugar cane plants with current sugar mills, which will cut out the feed preparation section of crushing and juice extraction. Facilities for utilities production would typically already exist in such cases, but would require upgrading. In a conservative approach, it is prudent to rather consider the erection of totally new facilities as it would be the most expensive option and provide a ceiling breakeven price for the biofuels produced.
3.7 Biofuels Production Co-products
Two co-products generated by the above processes are suitable for animal consumption and are sold back into the agriculture sector. This applies to the DDGS from maize and the oilcake from soybeans or sunflower. Glycerine, another co-product from biodiesel production, is sold into a variety of markets as a feedstock for soap and resin manufacture, urethane foams, drugs and cosmetics, explosives. Bagasse from sugar cane can be used as a heating fuel or pulp for paper manufacture. CO2 may be sold as a compressed gas product required in specialised markets. In this analysis, the oilcake co-product turned out to be the main factor in the decision to limit biodiesel production to B2 rather than the B5 limit that was proposed initially. This is because an oilcake surplus will reduce by-product prices, thereby raising biodiesel prices and so rendering the economics of the biodiesel production process less viable beyond B2.
Conclusion 5. The biofuels task team concluded that the penetration of
biodiesel would be limited to B2 in the short term due to the fact that the oilcake co-product will saturate the available livestock feed market.
The total benefits generated by co-product sales amount to:

CONFIDENTIAL TO THE NATIONAL BIOFUELS TASK TEAM
Page 20 of 116
Table 3: Total benefits generated by co-product sales
E5 Sugar Cane Plant
E5 Maize Plant
B2 Soybean Plant
Co-products sales income R million /a 101 406 107cent/litre 17.3 69.4 53.6
3.8 Environmental Impact of Biofuel Production
Biofuels constitute converted carbon that originates from atmospheric CO2, which is converted via photosynthesis into plant material (biomass). Both biodiesel and ethanol contain oxygen and this makes them cleaner burning fuels for internal combustion engines compared to mineral fuels (hydrocarbons only).
However, the process of unlocking the carbon in crops requires energy input, which is normally consumed as fossil-based hydrocarbons, again generating CO2. This energy is required in farming activities, transport of crops to conversion plants, the conversion plant production, and transport of the final biofuel to the consumer market. The ultimate combustion of biofuels also releases CO2 into the atmosphere. The use of biofuels obviously provides for a much more attractive carbon balance in the biosphere. Biofuels doe not rely on some concealed source for their hydrocarbon energy content, as is the case with fossil fuels, but essentially extract CO2 from the atmosphere.
Agricultural growth processes are successful to varying degrees in embedding the carbon contained in atmospheric CO2. This normally determines the leverage obtained when balancing the input of CO2 from the atmosphere and output into the atmosphere. A positive balance is desired, i.e. one would prefer to generate less CO2 in the process of obtaining the biofuels than in the final release of CO2 from the use of biofuels in internal combustion engines.
Subsequent to the Kyoto Protocol of 1997, it became possible for developed countries and economies in transition to undertake cross-border investments in projects aimed at reducing greenhouse gas (GHG) emissions. The investor provides financial and/or technical assistance to achieve cost-effective GHG emission reductions in host countries in exchange for emission reduction units (ERU), also known as �“carbon credits�”. These credits can then be applied by the investor toward meeting its obligations under the Protocol or sold in a derivatives market. A number of markets for ERU's have been established worldwide and hence a
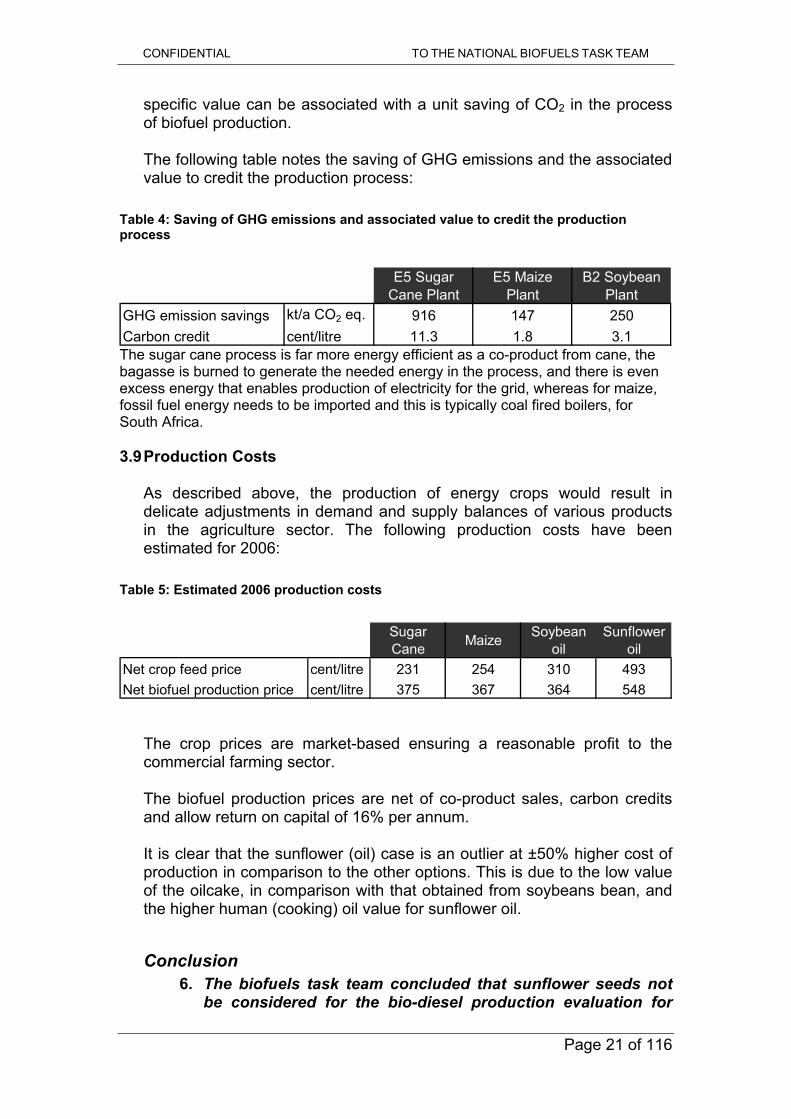
CONFIDENTIAL TO THE NATIONAL BIOFUELS TASK TEAM
Page 21 of 116
specific value can be associated with a unit saving of CO2 in the process of biofuel production.
The following table notes the saving of GHG emissions and the associated value to credit the production process:
Table 4: Saving of GHG emissions and associated value to credit the production process
E5 Sugar Cane Plant
E5 Maize Plant
B2 Soybean Plant
GHG emission savings kt/a CO2 eq. 916 147 250Carbon credit cent/litre 11.3 1.8 3.1 The sugar cane process is far more energy efficient as a co-product from cane, the bagasse is burned to generate the needed energy in the process, and there is even excess energy that enables production of electricity for the grid, whereas for maize, fossil fuel energy needs to be imported and this is typically coal fired boilers, for South Africa. 3.9 Production Costs
As described above, the production of energy crops would result in delicate adjustments in demand and supply balances of various products in the agriculture sector. The following production costs have been estimated for 2006:
Table 5: Estimated 2006 production costs
Sugar Cane Maize Soybean
oilSunflower
oilNet crop feed price cent/litre 231 254 310 493Net biofuel production price cent/litre 375 367 364 548
The crop prices are market-based ensuring a reasonable profit to the commercial farming sector.
The biofuel production prices are net of co-product sales, carbon credits and allow return on capital of 16% per annum.
It is clear that the sunflower (oil) case is an outlier at ±50% higher cost of production in comparison to the other options. This is due to the low value of the oilcake, in comparison with that obtained from soybeans bean, and the higher human (cooking) oil value for sunflower oil.
Conclusion 6. The biofuels task team concluded that sunflower seeds not
be considered for the bio-diesel production evaluation for
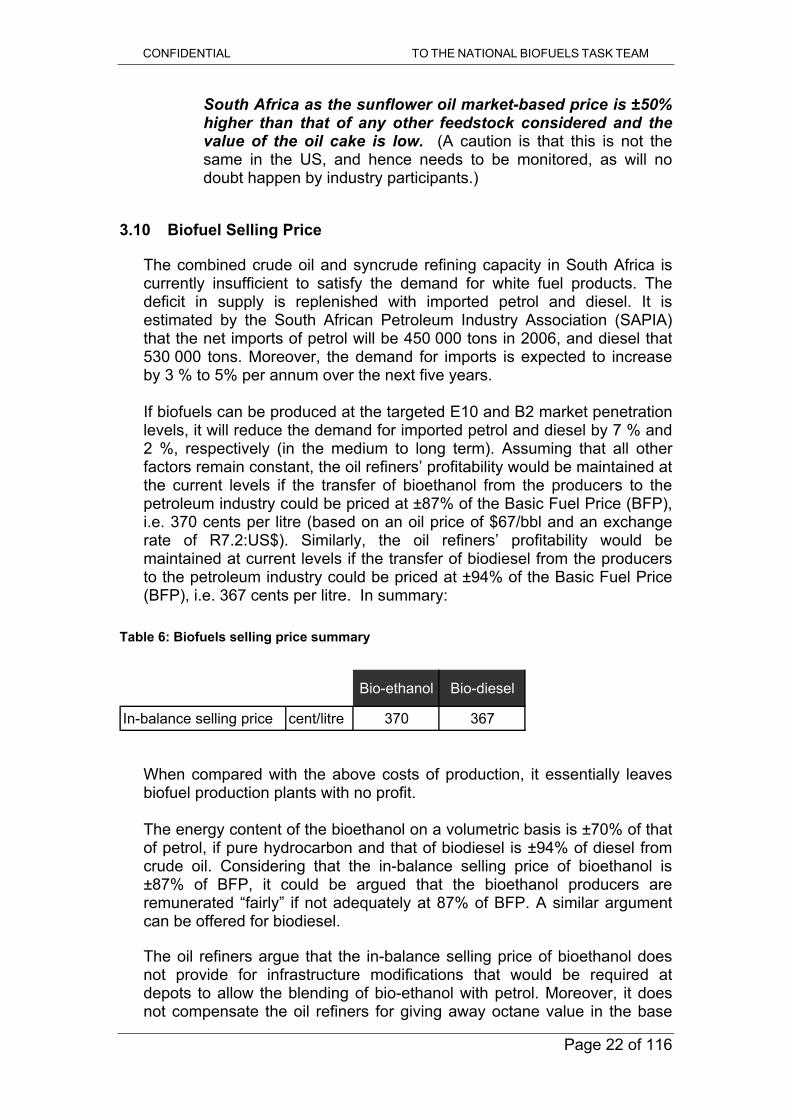
CONFIDENTIAL TO THE NATIONAL BIOFUELS TASK TEAM
Page 22 of 116
South Africa as the sunflower oil market-based price is ±50% higher than that of any other feedstock considered and the value of the oil cake is low. (A caution is that this is not the same in the US, and hence needs to be monitored, as will no doubt happen by industry participants.)
3.10 Biofuel Selling Price
The combined crude oil and syncrude refining capacity in South Africa is currently insufficient to satisfy the demand for white fuel products. The deficit in supply is replenished with imported petrol and diesel. It is estimated by the South African Petroleum Industry Association (SAPIA) that the net imports of petrol will be 450 000 tons in 2006, and diesel that 530 000 tons. Moreover, the demand for imports is expected to increase by 3 % to 5% per annum over the next five years.
If biofuels can be produced at the targeted E10 and B2 market penetration levels, it will reduce the demand for imported petrol and diesel by 7 % and 2 %, respectively (in the medium to long term). Assuming that all other factors remain constant, the oil refiners�’ profitability would be maintained at the current levels if the transfer of bioethanol from the producers to the petroleum industry could be priced at ±87% of the Basic Fuel Price (BFP), i.e. 370 cents per litre (based on an oil price of $67/bbl and an exchange rate of R7.2:US$). Similarly, the oil refiners�’ profitability would be maintained at current levels if the transfer of biodiesel from the producers to the petroleum industry could be priced at ±94% of the Basic Fuel Price (BFP), i.e. 367 cents per litre. In summary:
Table 6: Biofuels selling price summary
Bio-ethanol Bio-diesel
In-balance selling price cent/litre 370 367
When compared with the above costs of production, it essentially leaves biofuel production plants with no profit.
The energy content of the bioethanol on a volumetric basis is ±70% of that of petrol, if pure hydrocarbon and that of biodiesel is ±94% of diesel from crude oil. Considering that the in-balance selling price of bioethanol is ±87% of BFP, it could be argued that the bioethanol producers are remunerated �“fairly�” if not adequately at 87% of BFP. A similar argument can be offered for biodiesel.
The oil refiners argue that the in-balance selling price of bioethanol does not provide for infrastructure modifications that would be required at depots to allow the blending of bio-ethanol with petrol. Moreover, it does not compensate the oil refiners for giving away octane value in the base

CONFIDENTIAL TO THE NATIONAL BIOFUELS TASK TEAM
Page 23 of 116
stock that they supply to the depots to be blended with bioethanol. This is due to the fact that the blending Research Octane Number (RON) of ethanol (typically 115) is substantially higher than that required for the final petrol blend (typically 93 or 95). Furthermore, the Reid Vapour Pressure (RVP) of ethanol in petrol blends is ±7kPa higher than that of conventional petrol. To maintain the required specification of the petrol blend, oil refiners need to remove butane from the base stock petrol and sell it at a discount in the LPG-market, but they would also be able to optimise the octane of the blendstock, if they were assured of it being used in E10.
Biodiesel works as a lubricity-improving additive, so its addition can enable some savings for refineries, assuming they optimise and ensure the addition always takes place at the depots that receive lower lubricity basestock. In addition, since biodiesel production is at first insignificant when compared to the total diesel produced from crude oil, little additional costs would be incurred to accommodate biodiesel in the current market.
If the bioethanol producers are allowed 95% of BFP as selling price and biodiesel producers 100 %, the transfer or selling prices are 404 and 390 SA cpl (SA cents per litre) respectively. This would clearly provide some profit to biofuel producers.
The producer-selling price of biofuels is an issue of debate globally and in many instances it is determined by supply and demand. This is typically the case in Brazil and the USA, the two largest producers of bio-ethanol. In the USA, the equivalent discount to BFP has been ±5% over the last three years. Taking its cue from the USA, the Biofuels Task Team recommends that the transfer price for bioethanol be regulated at 95% of BFP until the invested capital has been recovered. Once capital servicing has been completed, the regulation can be reviewed. To simplify the practical regulation of biofuels selling prices, it is recommended that the same apply to biodiesel produced, but at 100 % of BFP.
Conclusions 7. The Biofuels Task Team concluded that the biofuels selling
price for bioethanol and biodiesel be regulated at 95% and 100% respectively of the Basic Fuel Price for petrol and diesel until invested capital has been recovered.
8. The Biofuels Task Team concluded that even at a biofuel
selling price of 95% and 100% of Basic Fuel Price the profitability of biofuel producers will be marginal and that additional financial support will be required in the form of fuel tax reductions and/or capital subsidies or accelerated depreciation allowances.

CONFIDENTIAL TO THE NATIONAL BIOFUELS TASK TEAM
Page 24 of 116
3.11 Job Creation
The total impact on direct, indirect and induced jobs created by the biofuel producers and in the agriculture sector will be addressed in detail in the macro-economic impact study in section 5 of this report.
The number of direct jobs that are created by biofuel producing plants can be estimated at 40-45 per 100 kt/a plant. However, as the nameplate capacity of conversion plants increases, the increased number of jobs will diminish.
If the E10 and B2 targets are to be achieved, the number of jobs created to operate the plants is estimated at ±450. These would obviously have an indirect impact on other industries as well. Based on the job multiplier difference between the transport and the petroleum industries it is assumed that the transport industry would create ± 1 050 jobs in response. In total, the number of direct and indirect jobs created is estimated at ±4 500.
If oil refinery output decreases to accommodate biofuels need, oil refiners may be expected to shed some jobs. Based on the expected job multiplier impact applicable to the oil refiners, the expected loss in direct and indirect jobs is estimated at 1 800. It is however, the view of the Biofuels Task Team that this number would be too high as biofuels will essentially replace import products. For that reason the number of direct and indirect jobs lost due to reduced oil refining output is expected to be ± 200, and even this may be too high, as refiners may still produce, and export any excess caused by biofuels upliftment.
The agriculture sector is expected to create ±30 000 direct and indirect jobs due to the introduction of the biofuels enterprise, assuming that new crops are planted on new lands to make up the increased demand. The net result of jobs created in the value chain is estimated at ±34 300.
It has to be emphasised that these estimates only include direct and indirect jobs and NOT any jobs that would be created by having individuals spending additional income. Such additional spending will inflate the above estimated number of jobs to be created further. This will be addressed in section 5.
3.12 Risk of Exposure to External Factors
The profitability of the biofuels enterprise is dependent on a variety of conditions. Certain conditions will be influenced by Government action, legislation, the oil industry, biofuel production management, farming practices, etc. These are characteristically endogenous to the local economy. Other factors, such as climatic changes, exchange rate and oil

CONFIDENTIAL TO THE NATIONAL BIOFUELS TASK TEAM
Page 25 of 116
price movements are exogenous to the South African economy and all participants in the economic system have to adapt to such factors.
The volatility in exogenous factors can be severely disruptive in planning for the future or estimating expected outcomes. This is also applicable in the feasibility analysis of a potential biofuels industry. To illustrate the impact of such exogenous factors on the economic viability of the proposed biofuels enterprise, the following table presents the return on capital employed (ROCE) by the agriculture sector and the biofuels producers in relation to varying crude oil prices and R/US$ exchange rates:
Table 7: ROCE for Agricultural Sector and Biofuels Producers for Sugar Cane to Ethanol Sugar Cane-to-ethanol:-
40 52 64 76 88 100 1126.20 -22% -9% 3% 15% 27% 39% 51%6.36 -20% -8% 5% 17% 30% 42% 55%6.53 -19% -6% 7% 20% 32% 45% 58%6.69 -18% -4% 9% 22% 35% 48% 61%6.85 -16% -3% 11% 24% 38% 51% 65%7.02 -15% -1% 13% 27% 40% 54% 68%7.18 -13% 1% 15% 29% 43% 57% 71%7.35 -12% 2% 17% 31% 46% 60% 74%7.51 -11% 4% 19% 34% 48% 63% 78%7.67 -9% 6% 21% 36% 51% 66% 81%7.84 -8% 7% 23% 38% 54% 69% 84%8.00 -6% 9% 25% 41% 56% 72% 88%
Crude Oil price (US$/bbl)
Exc
hang
e ra
te (R
/US
$)
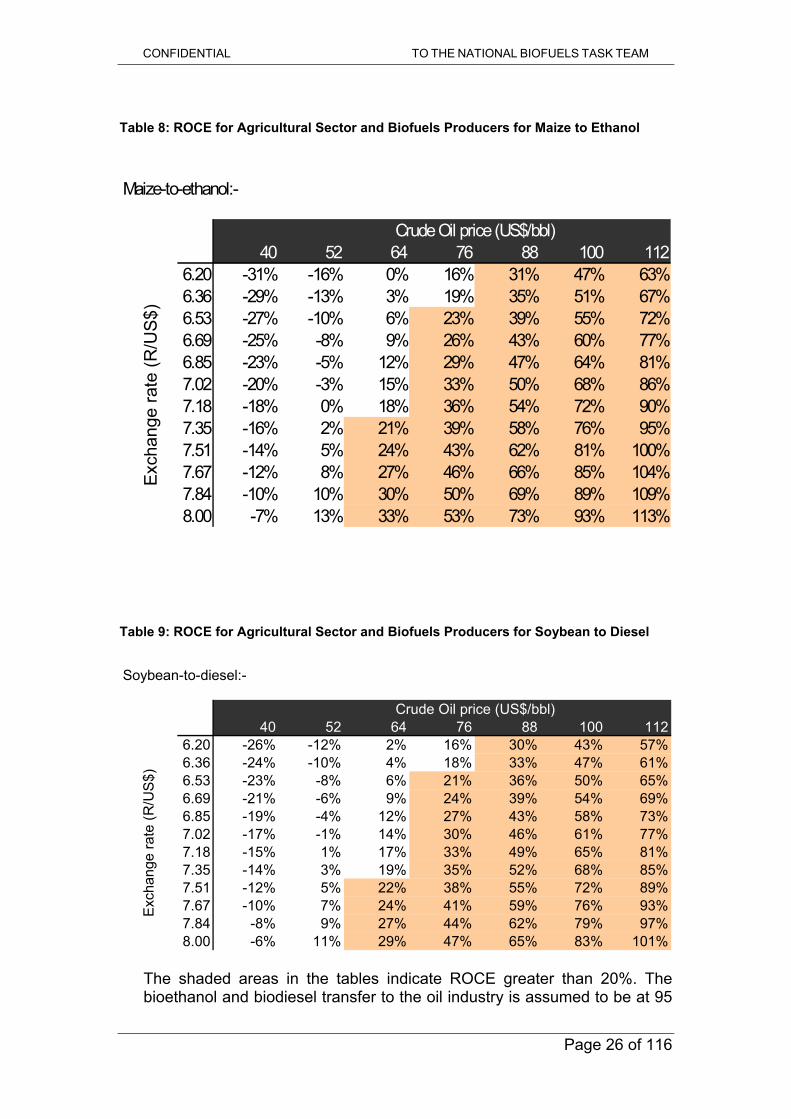
CONFIDENTIAL TO THE NATIONAL BIOFUELS TASK TEAM
Page 26 of 116
Table 8: ROCE for Agricultural Sector and Biofuels Producers for Maize to Ethanol Maize-to-ethanol:-
40 52 64 76 88 100 1126.20 -31% -16% 0% 16% 31% 47% 63%6.36 -29% -13% 3% 19% 35% 51% 67%6.53 -27% -10% 6% 23% 39% 55% 72%6.69 -25% -8% 9% 26% 43% 60% 77%6.85 -23% -5% 12% 29% 47% 64% 81%7.02 -20% -3% 15% 33% 50% 68% 86%7.18 -18% 0% 18% 36% 54% 72% 90%7.35 -16% 2% 21% 39% 58% 76% 95%7.51 -14% 5% 24% 43% 62% 81% 100%7.67 -12% 8% 27% 46% 66% 85% 104%7.84 -10% 10% 30% 50% 69% 89% 109%8.00 -7% 13% 33% 53% 73% 93% 113%
Exch
ange
rate
(R/U
S$)
Crude Oil price (US$/bbl)
Table 9: ROCE for Agricultural Sector and Biofuels Producers for Soybean to Diesel
Soybean-to-diesel:-
40 52 64 76 88 100 1126.20 -26% -12% 2% 16% 30% 43% 57%6.36 -24% -10% 4% 18% 33% 47% 61%6.53 -23% -8% 6% 21% 36% 50% 65%6.69 -21% -6% 9% 24% 39% 54% 69%6.85 -19% -4% 12% 27% 43% 58% 73%7.02 -17% -1% 14% 30% 46% 61% 77%7.18 -15% 1% 17% 33% 49% 65% 81%7.35 -14% 3% 19% 35% 52% 68% 85%7.51 -12% 5% 22% 38% 55% 72% 89%7.67 -10% 7% 24% 41% 59% 76% 93%7.84 -8% 9% 27% 44% 62% 79% 97%8.00 -6% 11% 29% 47% 65% 83% 101%
Crude Oil price (US$/bbl)
Exc
hang
e ra
te (R
/US
$)
The shaded areas in the tables indicate ROCE greater than 20%. The bioethanol and biodiesel transfer to the oil industry is assumed to be at 95

CONFIDENTIAL TO THE NATIONAL BIOFUELS TASK TEAM
Page 27 of 116
% and 100 % of BFP, respectively, and no tax reductions have been incorporated. It is clear that the profitability of the biofuels enterprise has significant sensitivities to the exogenous impact of exchange rate and crude oil price movements. It is also possible to interpolate the required crude oil price at any specific exchange rate to allow a reasonable ROCE of 20%. For example, at R7,35/US$ sugar cane-based ethanol production will only be sufficiently profitable at a crude oil price of 66,6 US$/bbl. It is evident that the weaker the Rand against the US$, the lower the �“break-even�” oil price required to sustain profitability in the biofuels industry.
Incentive strategies for the biofuels industry need to factor in the variable impact of exogenous factors such as exchange rates and crude oil prices. It would not be prudent to incentivise the biofuels enterprise beyond conditions that would ensure reasonable profitability.
Conclusions 9. The Biofuels Task Team recommends that incentives (to
ensure profitability or sustainability) factor in the joint impact of crude oil prices and the R/US$ exchange rate fluctuations.
10. Similar sensitivity tables could be devised to illustrate the
impact extreme climatic conditions would have on the supply of crop feedstock to biofuel producers. A reduction in crop production would increase the producers�’ input costs as the crop selling prices reflect food alternative values. However, as crop supply to biofuels production increases, the price impact is alleviated, particularly if stocks are built up. This dynamic would require extensive modelling but the sensitivities to be obtained based on historic volatility is overshadowed by the impacts of the crude oil price and exchange rate.
11. The Biofuels Task Team is of the opinion that the impact of
extreme climatic conditions on biofuels production profitability be ignored when evaluating incentive schemes to sustain profitability of the biofuels industry.
3.13 Comparison with International Experience
It is not always possible to view South African biofuels economics against a comparable global background as conditions for the analysis may vary significantly, especially endogenous factors such as legislation, regulation, incentives, factor cost inclusion, economies of scale, transfer pricing, etc. The level of detail to which the analyses are conducted is rarely available or deductible. Nevertheless, it would be comforting to check the above figures generated for South Africa against some form of benchmark, despite the fact that the benchmark may not be absolutely applicable.

CONFIDENTIAL TO THE NATIONAL BIOFUELS TASK TEAM
Page 28 of 116
The following graph indicates the comparative situation for South Africa with regard to bioethanol production:
Figure 5: Bio-ethanol Sustainable Production Cost
BIO-ETHANOL SUSTAINABLE PRODUCTION COSTBaseline comparison: 2005
154
75 74 72
51 4632
0
20
40
60
80
100
120
140
160
180
EU - Wheat
USA - Corn
RSA -Sugar cane
RSA -Maize
AUS -Sugar cane
THAI -Sugar cane
BRAZ -Sugar cane
US$
/bbl
International production costs were sourced from a presentation by NJH Moreira, Vice-Minister of Mines and Energy in Brazil, which he shared at a workshop titled �“The Brazilian Experience�”, conducted in Johannesburg on 25 August 2006. It is evident that South African production of bioethanol from sugar cane is significantly higher than that of Australia, Thailand and Brazil. However, the cost of production from maize appears to be comparable to that of the USA. It needs to be noted that South African soil and climate conditions are relatively poor when compared to most of the others, thus providing rather stringent agricultural constraints on production capability.
The above figures for South Africa exclude tax reductions or other incentives that may reduce the �“break-even�” cost of production.
Unfortunately, similar comparative data could not be obtained to illustrate the benchmark against which the production cost of South African bio-diesel from soybeans could be judged. However, it is noted that South Africa imports large percentages of soya protein cake and cooking oil, despite an effective import tariff of almost 5 % (6.5 % on the oilcake, which represents 80 % of production by mass.)
Conclusions
12. The biofuels task team concluded that the estimated production cost of South African bioethanol from maize compares favourably with that of sophisticated agriculture

CONFIDENTIAL TO THE NATIONAL BIOFUELS TASK TEAM
Page 29 of 116
economies such as that of the USA. This is due to a balancing of lower yields versus lower cost farming. The estimated production cost from sugar cane is significantly higher than that of countries such as Australia and Brazil. As South Africa has a competitive sugar industry, that exports, this may be due to the use of figures supplied by the local sugar industry for the economic model, where an average price of cane is used, rather than the marginal export sugar price equivalent.
3.14 Proposed Way Forward
Considering the above assessment of the economic viability and job opportunities that would be created by a biofuel industry, the Biofuels Task Team is of the opinion that the biofuels industry can be established in South Africa, provided that the maturing process is managed meticulously. Projects to erect the required plants will need to be well defined and implemented. In the agriculture sector, it would be imperative to ensure sustainability of crop production and the channelling thereof to ensure as few disruptions in the biofuels production process as possible. The following are recommended:
Recommendations
13. Target E8 and B2 national market penetration levels for
bioethanol and bio-diesel respectively.
14. Stage the implementation, particularly on a regional basis, such that the targets are reached in 5 years�’ time. The staging of the targeted implementation will allow all stakeholders in the value chain to iron out initial production and logistic issues to ensure a steady build up to best practice. This will build the confidence to accommodate the biofuels industry as a productive part of the South African economy.
15. Financial support to biofuel producers, especially in the first
five years of production, cannot be sourced only by means of a regulated biofuels transfer price from the current oil industry. Government intervention in the form of tax reductions and capital incentive schemes need to be introduced as well. The detailed proposal is discussed in section 3 of this report.
16. Import tariffs on crops destined for biofuel production is not
advised as it normally degenerates into artificially shaped economic structures that may spill over to other agricultural sub-sectors.

CONFIDENTIAL TO THE NATIONAL BIOFUELS TASK TEAM
Page 30 of 116
17. Mandated blending of biofuels can be restricted to refineries and depots in the proximity of the producers to ensure distribution to specific dedicated consumers of bioethanol and biodiesel blends.

CONFIDENTIAL TO THE NATIONAL BIOFUELS TASK TEAM
Page 31 of 116
4 INCENTIVE OPTIONS 4.1 International approaches
The international approach, for oil importing nations, and mostly developed nations has been to transfer the cost of oil from payments to OPEC, mainly developing nations, to increased taxes, i.e. national incomes. This is why the tax portion of petrol and diesel prices in most EU countries is of the order of $ 80/bbl, and until recently the OPEC nations received ca. 23 �– 28 $/bbl. Under such circumstances they developed biofuels support incentives that allow, according to WTO, and generally had full (100 %) tax exemptions, i.e. they favoured local oil (biofuels) by $ 80/bbl over imports. Recently with high oil prices, of the order of $70/bbl, and the associated negative impact on trade deficit, the EU countries have seen that this level of support is excessive, as biofuels producers effectively sell at $ 150/bbl equivalent. The associated increased biofuels production (market share penetration) has meant that the Fiscus has also lost a significant portion of their revenue, and they are starting to tax biofuels, as for normal petrol and diesel. The USA, a large producer of biofuels, also has a significant biofuels fuel tax exemption, of the order of $ 20/bbl, or of the order of a SA fuel levy reduction of 100 %. This, like most EU exemptions, is not �“bio�”, as such, but only for �“indigenous bio�”, as imported biofuels, such as bio-ethanol from Brazil, which carry a tariff equal to the fuel tax levy exemption. The support is thus for local farmers. It is also clear that supply security is not directly improved by supporting bio-fuels production in other countries, e. by importing, as if there was a global supply crisis, any country that produced biofuels would withdraw their export volumes. As no country has any excess biofuels production, i.e., production that exceeds local fuel usage, no country would export biofuels under a global oil shortage crisis. A world traded biofuels market is therefore unlikely to realise given pure economics.
However, the Kyoto protocol requires certain developed countries to reduce their GHG emissions, and that is why they may mandate or provide incentives to import biofuels. These incentives will ultimately not exceed other ways of reducing GHG emissions, or the costs of non-compliance. Given the current best ways of producing biofuels, as regards GHG emission reduction, i.e. bio-ethanol from sugar cane, for a CO2 price of $ 10/ton, this is about 10 SA cpl, or equivalent to $2/bbl for oil price. This also shows that the current EU incentives of $ 80/bbl oil equivalent reflect a CO2 price of ca $400/ton, and are excessive. This would correspond to a subsidy (price support) for renewable electricity, over fossil based, of 107 SA c/kWh, i.e. if the Eskom coal based electricity feed-in price was 20 c/kWh, a renewable producer of electricity would be able to get 127 c/kWh. This again shows that it is excessive.
An acceptable level for support for renewable energy, that is indigenously produced and adds local jobs and improves supply security, would probably be more of the order of 20 c/kWh, or equivalent to oil price

CONFIDENTIAL TO THE NATIONAL BIOFUELS TASK TEAM
Page 32 of 116
support of $15/bbl, or SA 80 cpl, expressed as the petrol BFP price equivalent, or would be about a 70 % fuel levy exemption, assuming the fuel levy is R1.16 per litre, as is current.
In addition to the excessive fuel tax exemptions, developed countries provide additional support to biofuels production, as regards supply side incentives and support to farmers, as well as some demand side incentives, such as effective blend mandates in the USA and in Brazil.
Additionally, there are capital investment incentives for biofuels plants.
An indirect benefit of biofuels incentives, from a global perspective, is that the demand for crude oil is reduced, and this may reduce global oil prices. This effect in the medium term is extremely limited, as we have recently witnessed where crude oil prices exceeded the cost of production of many biofuels, without any incentives, as world oil demand continues to grow at a rate, given that to just maintain existing crude oil production requires replacement of reserves at 5 % pa, that makes biofuels a marginal contributor. A larger impact is that biofuels prices and production lead to increased prices for agricultural products (foods) and thus favour many developing nations that are near the equator and have sufficient water, such as in sub-Saharan Africa. For instance, the Brazilian switch of sugar to ethanol has meant an approximate doubling of world sugar prices in the past year, without having much effect on oil prices, and sugar exporters such as South Africa, Swaziland, Malawi, Mauritius, India and the Caribbean have benefited,
4.2 Aims
Any incentives for liquid biofuels should be based on its real benefits. The benefits are a combination of contributions from: renewable energy supply as GHG emission reduction (maybe worth ca
$ 2/bbl) supply security forex saving local job creation, and economic spin-offs
The objective of the next section is to examine the macro-economic effects to quantify the level of support that may be justified. This should not differ from other indigenous energy alternatives.
4.3 Options Available in South Africa
Clearly the fuel levy tax exemption option exists and has already been utilised as regards a general 40 % exemption for biodiesel production (ca. $ 8/bbl), and 100 % for production up to 300 000 litre pa (ca. $ 20/bbl).

CONFIDENTIAL TO THE NATIONAL BIOFUELS TASK TEAM
Page 33 of 116
In addition biofuels producers qualify for an accelerated depreciation allowance of 50:30:20. Assuming an investment of ca R4/liter annually, this adds a tax exemption of ca, 50 cpl in year one (assuming tax at 25 %), 30 cpl in year 2, and 20 cpl in year 3. Given that a new biofuels producer may not be profitable and be able to utilise this benefit as easily as existing profitable operations, it may be advisable to rather provide this as an addition to the fuel levy exemption in these years.
DME also has available a number of incentives to renewable energy producers, that favour smaller producers, for biofuels, it may be simpler and create more certainty to provide this a higher percentage of the fuel levy based on criteria used to evaluate, such as smaller plants (more jobs; better supply security; SMME upliftment), BEE participation.
4.4 Trade side incentives
In line with South Africa�’s objectives in SADC and SACU, it is expected of South Africa to play a significant economic and development role in the region. This can be achieved and facilitated by creating some links between the domestic and regional economies. Keeping tariffs on goods from the region as low could be one of the ways that South Africa can encourage production and manufacturing of goods in the region as it is already the major market in the region. South Africa is already offering duty-free access to over 90% of goods originating from the region, and therefore is already exceeding is commitments in terms of the SADC trade protocol. What is required is to ensure that the rules of origin are applied to avoid goods trade deflection. This will ensure that goods from outside the region do not benefit from preferences that are due to SADC members. From the few products that still have tariffs levied on them, included is Chapter 17, sugar and sugar products. This is because the SADC trade in sugar arrangement recognizes that the world sugar market is highly distorted and therefore requires a special dispensation for preferential trade in sugar in SADC. Given that sugar is such an essential input in the production of bioethanol, the current access into the SACU market is on non-reciprocal basis but controlled through a quota provided a member is net producer of sugar. This alone appears to be an incentive enough for members to produce enough before they apply for a quota.
However, overtime it is envisaged that more members would apply for even higher quotas, to the detriment of domestic small scale and the previously disadvantaged farmers. Therefore, there is a need to be a bit cautious about how South Africa can play a developmental role in the region and still meet domestic developmental challenges such as those of bringing the small scale farmers into the mainstream economic participation. It is therefore important that further phase down of tariffs in this chapter be thoroughly implemented. Nevertheless, whatever measures taken for the biofuel industry will be for short- to medium-term as the objective for full liberalization of trade in sugar is tabled for 2012.
CONFIDENTIAL TO THE NATIONAL BIOFUELS TASK TEAM
Page 34 of 116
4.5 SWOT of Possible Incentives
This is left until the macro-economic analysis is completed, and will be subject to discussion with National Treasury and SARS.
4.6 Incentives Recommended for Further Examination
It is advisable if all incentives be worked out a cpl comparative basis, or for instance as crude oil price equivalent, or kWhr equivalent basis. This will make the comparison and decision as to actual levels simpler.

CONFIDENTIAL TO THE NATIONAL BIOFUELS TASK TEAM
Page 35 of 116
5 DEMAND ASPECTS 5.1 Market suitability of Bioethanol and Biodiesel
Ethanol, because it has similar volatility to petrol and because of its high octane number, is suitable as a spark ignition internal combustion engine fuel. Its use in diesel-powered, or compression ignition engines, typically as diesohol, is not favoured due to its lower energy content, low cetane number, and due to miscibility difficulties, and is not examined further here. The choice is whether to use ethanol as a petrol blend component, such as up to E10, or as a standalone fuel, such as E85, with some hydrocarbon petrol added to avoid it being used in the potable market.
Prior experience on the Highveld has shown that vehicles can operate on E10. This was sold at the same regulated price as petrol without ethanol by all the oil companies. Motorists did not discern a difference. This, coupled with extensive USA experience of E10, and the fact that the Worldwide Fuel Charter of all the vehicle manufacturers accepts E10, makes this acceptable. Blends in excess of E10 often require vehicle modifications or specialised vehicles. E85 will thus be an option for special or dedicated fleets, and is not taken further as the base case.
Conclusion 18. The Biofuel Task Team recommends that E10 be the format in
which ethanol is used for the basis of incentives and policy development.
Ethanol, being an oxygenate, has less energy than a pure hydrocarbon, and thus if used as stand-alone fuel would need to be discounted to standard petrol by 70 %. For an E10 blend, based on the 3.5 % oxygen content, the energy content reduction would apply similarly to other oxygenates, such as ethers. Existing fuels do contain such oxygenates and motorists pay the same price as for non-oxygenate containing petrol products.
Conclusion 19. The Biofuel Task Team recommends that the same price
applies at the pump for blends up to E10 as for standard petrol, and that no labelling discrimination applies.
Ethanol petrol blends, such as E10 can provide negative market acceptance issues to oil companies, particularly if E10 is sold alongside E0 petrol. The simplest way to overcome this, and to support maximum uptake of ethanol at lowest logistic cost, is to declare a supply region, i.e. serviced by depots, as an ethanol region, in which all oil companies are to market the same ethanol blended petrol, up to E10. This should be the

CONFIDENTIAL TO THE NATIONAL BIOFUELS TASK TEAM
Page 36 of 116
major grade in any region, i.e. would be the R93 unleaded for inland regions and the R95 unleaded for coastal regions.
Conclusion 20. Where ethanol is produced and available in a fuel supply
region, it is sold by all oil companies in that region on the same basis.
Oil company depots and their distribution will have added costs to accommodate ethanol, such as tanks, blending, fire fighting changes, water removal at retail sites and possible handling of phase separation. They should be compensated for these costs. Historically in South Africa, the amount allowed for such costs at depots was a few cpl. In the USA, the differential for ethanol below the petrol rack price is typically about 5 %. This same price should be paid, i.e. 95 % of BFP for ethanol delivered to the nearest depot, to be used to blend E10.
Recommendation 21. 95 % of BFP should be the price of ethanol to depots, and
they can retain the 5 % to cover costs.
Oil company depots (wholesalers) in an ethanol region maybe advantaged or disadvantaged, yet overall the national motorist pays for ethanol in petrol at BFP.
Recommendation 22. Oil company wholesalers should pay for ethanol according to
their national market share.
Refineries are able to supply a BOB (blendstock for oxygenated blending) to go with the ethanol. This should still be supplied at current agreed prices to depots for wholesalers, as it fluctuates with BFP. Refiners may be able to adjust this relative to straight petrol to take advantage of the ethanol octane. The current 2 MON penalty for ethanol is illogical and is not required by worldwide motor vehicle manufacturers. Refiners have a potential disadvantage in that they may need to reduce the vapour pressure of the petrol, by removing C4�’s to LPG. The matter of a potential RVP waiver of ca 7 kPa for E10 needs to be negotiated, and may lead to regional waivers linked to where ethanol is used. In certain countries studies have found that the addition of ethanol with a raised vapour pressure did not raise the risk of smog formation. Regions with higher ambient temperatures may also not raise the vapour pressure limit if there are vehicle performance issues. A major issue is for refineries that already contain oxygenates from own blend components, as they will only be able to add ethanol additional up to the oxygen limits.
Refineries supplying depots that will blend ethanol, with E10 preferred, to provide a BOB. These refineries, that are now established players, have in the past directly and indirectly benefited from BFP, and earlier the higher

CONFIDENTIAL TO THE NATIONAL BIOFUELS TASK TEAM
Page 37 of 116
IBLC, and thus to support the emerging bioethanol industry, they should provide the BOB that can accommodate the ethanol at E10. If they so desire, they may use the ethanol to make ethers, but subject to this being used up to an oxygen equivalent of E10.
Recommendation 23. A condition of licence for refiners must that they adjust to
blend with ethanol to E10, if receiving depots request BOB, or handle this in some other optimum way that equates to E10 maximum.
Biodiesel has about 94 % of the energy of straight hydrocarbon diesel, but has benefits as regards better lubrication properties and lower sulphur. It can be sold as a neat diesel, so any price lower than BFP to biodiesel producers may result in them going to the end market in parallel. This may lead to duplication of distribution and has increased quality risks. Oil companies have experience and knowledge as regards handing fuel quality, including with biodiesel blending.
Recommendation 24. Biodiesel producers should receive a diesel BFP price for
biodiesel delivered to oil company depots, and depots should take up to B5, and ensure that the end marketed diesel is of quality as per the national standards.
5.2 Specifications �– Including Denaturant
SANS 465:2005 exists for bioethanol as fuel ethanol component and suppliers must meet this quality standard. SANS 1935:2005 exists for biodiesel to be used as B5, and higher, and manufacturers must ensure compliance. Licensed requirements to uplift (use) biofuels in the petrol and diesel markets, and thus for them to receive incentives, should be based on compliance with these specifications. This should be included in regulations and rules that are developed.
5.3 Volumes
Depots must take bioethanol at up to E10 in ethanol regions for the ethanol grade petrol(s), which are the major grade used in the supply region. Similarly, depots must take biodiesel up to B5 according to their diesel volumes.
5.4 Offtake Options
Manufacturers of bioethanol and biodiesel are able to supply to other users, i.e. at B100 or E85, if they can get better prices. Another option is

CONFIDENTIAL TO THE NATIONAL BIOFUELS TASK TEAM
Page 38 of 116
the heating oil or industrial market, but here the emission benefits are not maximised, and these represent lower value markets. It is expected that the E10 and up to B5 option are likely to be the highest value options and will for the foreseeable future be the targeted off-takes as regards the petrol and diesel markets. Nevertheless licensed wholesalers may handle such niche supply, subject to them informing consumers properly as to the type and quality of the fuels.
Bioethanol can be used for a gel fuel that can replace unsafe illuminating paraffin (IP), and in this case does not qualify for an advantage as IP carries no fuel levy, nor VAT. Supply to ethanol-gel producers should qualify for the same fuel levy advantage over IP, as applies to ethanol over petrol. An issue is how to achieve this, and who pays. It is not advisable to raise the price of IP, as this is largely used by the poorer LSM 2-3 households. The only mechanism then can be a subsidy to ethanol gel producers or a reduction in price for ethanol that they purchase. This involves risks that the ethanol may be sold into the potable market. As fuel ethanol producers need to be licensed, it is recommended that they can claim a fuel levy reduction equal to their ethanol sales to gel producers, and deductible against their fuel levy payments owed, similar as to applies to users of diesel.
5.5 Prevention of Malpractices �– Taxes
Biodiesel involves low risks as regards shifting to higher tax off-take options. However, the risk exists that biodiesel quality may cause market problems, so it is recommended that producers be licensed and pay their fuel levy tax, as any fuel producer does, and then claim the applicable reduction that is conditional on their quality being to standard, as regards being SABS mark holders. It should be borne in mind that a small batch of sub-standard bio-diesel can irreversibly spoil a large batch of diesel blend. An alternative where small-scale producers only extract oil, which would be then converted to bio-diesel in large bio-diesel refineries, should be considered. This would also eliminate the risks of handling methanol and caustic soda in small plants.
For bioethanol, the risk is higher, as it can displace potable alcohol that carries a far higher tax.
Recommendations 25. All bioethanol producers need to be licensed with the DME
and SARS, and subject to audits, as for potable alcohol producers. This must be for any volumes of production. They should also pay the full fuel tax and claim back the exemption part, based on oil company depot receipts. Small bioethanol producers should not be encouraged by any greater fuel levy exemptions than would apply for large plants.

CONFIDENTIAL TO THE NATIONAL BIOFUELS TASK TEAM
Page 39 of 116
26. For biodiesel production health considerations, handling and access to caustic soda and methanol must be properly controlled. In addition proper quality control is critical. For this reason, all biodiesel producers should be licensed and have to pay the fuel tax, and receive the rebate, even whether 100 %, only on condition of proof of proper quality and safety of operations.
27. To avoid fuel alcohol entering the potable market, it must be
denatured on production site and stored with a bittering agent and a suitable level of denaturant, such as 5 % petrol. Such a programme needs to be a condition of licence.
CONFIDENTIAL TO THE NATIONAL BIOFUELS TASK TEAM
Page 40 of 116
6 MACRO-ECONOMIC IMPACT OF BIOFUELS PRODUCTION 6.1 Introduction
The micro-economic assessment of the biofuels industry provides insight into the feasibility of the proposed enterprise. It is, however, prudent to consider the macro-economic impact of such an enterprise as no such enterprise can operate in isolation �– cross interaction between all industries is natural in a wide-spread economy. The interaction of the various industrial sectors and consumers is also noteworthy. In an economic impact study such as this, the approach is normally to estimate the various factors of interest by means of an input-output model and associated multipliers. For that purpose an input-output model was devised from data provided by the Trade and Industrial Policy Strategies institution based on their version of a social accounting matrix (SAM) for South Africa, valid for the year 2003. As SAMs are difficult datasets to compile, requiring huge amounts of resources, time and money, one assumes that this version would still be valid at present. This 2003 version is the latest that the Biofuels Task Team could acquire for assessing the biofuel industry�’s macro-economic impact. There is no reason to suspect that the 2003 version is not applicable in this case.
Input-output tables present a database to analyse the economy. In its simplest form it is possible to use the input-output table to describe the economy. More relevant for our purposes, input-output analysis attempts to quantify the backward linkages of a final demand impulse in the economy. As such it only focuses on demand side effects and assumes that production technologies as well as prices remain constant. A number of variables are solved simultaneously in the system. In particular, economic growth, household income and job creation are endogenous to the SAM model. A number of additional variables are solved in a recursive linear fashion such as government income, imports and employment. Higher government income could result in higher government expenditure, however, feedback from a balanced budget multiplier and ignored in our SAM application.
An important assumption of SAM based modelling is that the production structure remains constant. Thus, our analysis is comparative static by nature and ignores any dynamic effects, such as substitution between production factors labour and capital and between domestic and imported intermediates. SAM based modelling therefore has a very modest approach in that it can answer �“what if�” type questions while holding most other economic conditions constant, i.e. ceteris paribus. This approach is adequate for our purposes since we are focusing on a small sector relative to the total GDP and that may or may not fundamentally change the structure of the economy at hand.

CONFIDENTIAL TO THE NATIONAL BIOFUELS TASK TEAM
Page 41 of 116
For all other sectors that will indirectly receive a boost as a result of the operational activities and construction expenditure, the assumption is made that, average employment/output ratios of the relevant industry apply. This will lend an upward bias to the impact on employment and to a lesser degree on household income and output. The reason is that the assumption essentially argues that if production increases by 50%, employment will also increase by 50%. It is not easy to get around the average employment/output assumption, since this would require extensive analysis of investment and employment decision-making processes of the relevant entrepreneurs during the various stages of the business cycle. Even if we would know what has happened in the past we would still have to determine at what the current position is in the business cycle. Past behaviour may also have been influenced by sudden spurts in technical change and a careful decomposition is therefore required in order to derive any clues from historical trends. The following sections on economic growth, job creation, household income, and the national accounts provide a number of different angles to the overall impact that the biofuels industry would have on the South African economy.
The figures presented in this section are all associated with an exchange rate of R7,20/US$ (assumed typical for mid-2006). As indicated in section 3 on the commercial viability of the biofuels industry, the R/US$-exchange rate has a significant impact on the cash flow generated in the proposed biofuels industry. For that reason it will also affect the outcome of the macro-economic impact assessment.
In all cases presented below a transfer value of 95% and 100 % of BFP is assumed for the bioethanol and biodiesel, respectively, which would flow between the biofuel producers and the oil refiners that take up the product. The oil refiners are assumed to cut back production, and lose refining margins and cutback jobs in a proportional manner. This assumption is probably overly conservative, as oil companies have moved to an importing position for petrol and diesel, and declare that they make no margin on imports (or on the crude oil imported).
6.2 Economic Growth
Three scenarios are evaluated, i.e. an E10 petrol blend, a B2 diesel blend, and a combination of the two. The combination provides the joint impact that the bio-ethanol and biodiesel production would have. Intuitively the two biofuels can be assumed to be independent and the E10 plus B2 scenario would be expected to be simply a linear combination thereof. This was found to be largely the case, but since bioethanol and biodiesel affect the same oil refining industry, the joint effect appears to be slightly off the expected linearity characteristics.

CONFIDENTIAL TO THE NATIONAL BIOFUELS TASK TEAM
Page 42 of 116
The figures presented in this subsection all exclude tax reduction and other incentives that may be introduced as the proposed options expounded in section 4.
The production impact of the refining and biofuels industries, as well as the agriculture sector, is presented in the following table. Note that the figures imply the direct, indirect and induced impacts generated by any production change in each of these industries.
Table 10: Total Biofuel Industry Output
Refining Biofuels Agriculture Net ImpactE10 -14 973 7 278 9 356 1 661B2 -723 483 1 904 1 664
E10 + B2 -15 772 7 829 11 259 3 316
Total Industry Output (Rm/a)SourcesScenario
Note that the biofuels and agriculture industries are expected to experience an increase in output while the refining industry will have to reduce turnover due to biofuels having to be accommodated at the cost of refining or import margins.
A more familiar explanation of output can be presented as the gross domestic product (GDP). The following table illustrates the impact of the various scenarios on GDP. The patterns are similar to the above output table but the magnitudes are different.
Table 11: Gross Domestic Product Sources
Refining Biofuels Agriculture Net ImpactE10 -6 156 2 992 4 127 963B2 -297 199 840 742
E10 + B2 -6 485 3 219 4 967 1 701
ScenarioGross Domestic Product (Rm/a)
Sources
Considering that the expected GDP for 2006 would be ±1 600 R billion, the combined impact of E10 and B2 would be 0,11% of GDP. Assuming AsgiSA targets a growth increase from 4 % to 6 %, i.e. 2 %, this represents 5.5 % of the needed change, or ca. 1/20th. Although a modest contribution towards the AsgiSA growth target, it is a useful one that complements the other benefits of job creation and energy supply security.
Conclusion 28. The biofuels task team concluded that the establishment of a
biofuels industry with E10 and B2 blend targets would

CONFIDENTIAL TO THE NATIONAL BIOFUELS TASK TEAM
Page 43 of 116
generate R1 700 million in domestic product, which constitutes 0,11% of the current GDP.
6.3 Job Creation
The figures presented in this subsection all exclude tax reduction and other incentives that may be introduced as the proposed options expounded in section 4.
The following table illustrates the contribution to jobs that can potentially be created if the biofuels industry is established:
Table 12: Total Jobs Created
Refining Biofuels Agriculture Net ImpactE10 -4 771 11 025 40 216 46 470B2 -1 095 732 8 183 7 820
E10 + B2 -4 952 11 859 48 399 55 306
ScenarioTotal Jobs Created
Sources
The figures in this table differ from those discussed in section 3.11. The major reason for the differences is that the above job counts include all direct, indirect and induced numbers, while figures in section 3.11 only cover the direct and indirect impact. The macro-economic impact including the induced impact is the appropriate way to view the changes as it is based on an economy which includes household spending, i.e. it allows the spending of households (especially those that would benefit from new or additional income due to employment in the biofuels and related industries) to generate new jobs elsewhere in the economy as well. The services sectors would typically benefit from such additional spending.
As output is increased in any sector, job counts would be affected. In section 5.5 the impact of fuel tax reductions would be translated in additional output for the biofuels industry with associated changes in GDP and job counts.
Conclusion 29. The biofuels task team concluded that the establishment of a
biofuels industry with E10 and B2 blend targets would generate at least 60 000 new jobs while terminating only 5 000 throughout the South African economy.

CONFIDENTIAL TO THE NATIONAL BIOFUELS TASK TEAM
Page 44 of 116
6.4 Household Income Generation The figures in this subsection all exclude tax reduction and other incentives that may be introduced as the proposed options expounded in section 4. The impact of the proposed biofuels industry on household incomes is presented in the following table:
Table 13: Total Household Income
Refining Biofuels Agriculture Net ImpactE10 -3 986 1 937 3 191 1 142B2 -192 129 649 586
E10 + B2 -4 199 2 084 3 841 1 726
Total Household Income (Rm/a)SourcesScenario
This adjustment is expected to filter through to all households affected directly or indirectly by the biofuels industry. Note that the reduction in income for the refining sector would indicate an average for the total payroll, a portion of which is ascribed to the termination of jobs as indicated in section 5.3.
Conclusion 30. The biofuels task team concluded that the establishment of a
biofuels industry with E10 and B2 blend targets would generate a net increase of ±R1 700 million per annum in household income throughout the South African economy.
6.5 Impact on National Accounts The domestic production of fuels would fundamentally reduce the exposure of South Africa to imports of crude oil (which constitutes ±17% of total imports, by far the largest import item) and petroleum products. As explained in section 3, South Africa has a deficit in the supply of motor fuel in South Africa, and this deficit is expected to grow over the next five years. The immediate impact that he introduction of either an E10 blend, a B2 blend, or a combination on the current account is presented in the following table: Table 14: Impact on the Current Account
Current Account(Rm/a)
E10 2 697B2 972
E10 + B2 3 693
Scenario
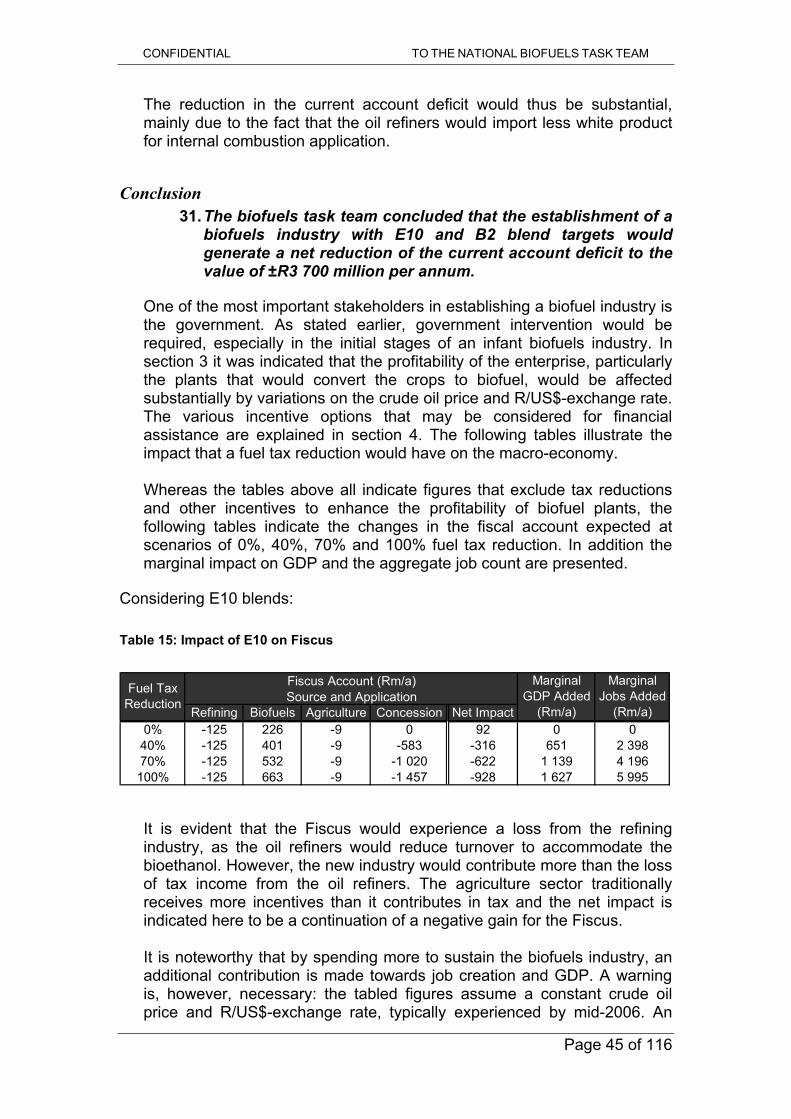
CONFIDENTIAL TO THE NATIONAL BIOFUELS TASK TEAM
Page 45 of 116
The reduction in the current account deficit would thus be substantial, mainly due to the fact that the oil refiners would import less white product for internal combustion application.
Conclusion 31. The biofuels task team concluded that the establishment of a
biofuels industry with E10 and B2 blend targets would generate a net reduction of the current account deficit to the value of ±R3 700 million per annum.
One of the most important stakeholders in establishing a biofuel industry is the government. As stated earlier, government intervention would be required, especially in the initial stages of an infant biofuels industry. In section 3 it was indicated that the profitability of the enterprise, particularly the plants that would convert the crops to biofuel, would be affected substantially by variations on the crude oil price and R/US$-exchange rate. The various incentive options that may be considered for financial assistance are explained in section 4. The following tables illustrate the impact that a fuel tax reduction would have on the macro-economy.
Whereas the tables above all indicate figures that exclude tax reductions and other incentives to enhance the profitability of biofuel plants, the following tables indicate the changes in the fiscal account expected at scenarios of 0%, 40%, 70% and 100% fuel tax reduction. In addition the marginal impact on GDP and the aggregate job count are presented.
Considering E10 blends: Table 15: Impact of E10 on Fiscus
Refining Biofuels Agriculture Concession Net Impact0% -125 226 -9 0 92 0 0
40% -125 401 -9 -583 -316 651 2 39870% -125 532 -9 -1 020 -622 1 139 4 196100% -125 663 -9 -1 457 -928 1 627 5 995
Marginal GDP Added
(Rm/a)
Marginal Jobs Added
(Rm/a)
Fiscus Account (Rm/a)Source and Application
Fuel Tax Reduction
It is evident that the Fiscus would experience a loss from the refining industry, as the oil refiners would reduce turnover to accommodate the bioethanol. However, the new industry would contribute more than the loss of tax income from the oil refiners. The agriculture sector traditionally receives more incentives than it contributes in tax and the net impact is indicated here to be a continuation of a negative gain for the Fiscus.
It is noteworthy that by spending more to sustain the biofuels industry, an additional contribution is made towards job creation and GDP. A warning is, however, necessary: the tabled figures assume a constant crude oil price and R/US$-exchange rate, typically experienced by mid-2006. An

CONFIDENTIAL TO THE NATIONAL BIOFUELS TASK TEAM
Page 46 of 116
increase in tax relief for the biofuels producers would be required if the oil price drops and the R/US$-exchange rate strengthens. The above table merely indicates the hypothetical impact that additional tax reductions would have on the economy.
The following tables illustrate the impact of a B2 scenario: Table 16: Impact of B2 on Fiscus
Refining Biofuels Agriculture Concession Net Impact0% -57 18 -2 0 -41 0 0
40% -57 30 -2 -40 -69 48 17770% -57 39 -2 -70 -90 84 310100% -57 48 -2 -100 -111 120 442
Fuel Tax Reduction
Fiscus Account (Rm/a)Source and Application
Marginal GDP Added
(Rm/a)
Marginal Jobs Added
(Rm/a)
Similarly the combined effect of E10 and B2 scenario is presented: Table 16: Impact on E10 and B2 on Fiscus
Refining Biofuels Agriculture Concession Net Impact0% -184 251 -11 0 57 0 0
40% -184 426 -11 -583 -351 730 3 50070% -184 557 -11 -1 020 -657 1 254 5 431100% -184 688 -11 -1 457 -963 1 778 7 362
Marginal GDP Added
(Rm/a)
Marginal Jobs Added
(Rm/a)
Fuel Tax Reduction
Fiscus Account (Rm/a)Source and Application
Conclusion 32. The biofuels task team concluded that the establishment of a
biofuels industry with E10 and B2 blend targets would have a significant impact on the Fiscus if tax reductions were allowed. The real impact of such an incentive to biofuel producers should rather be assessed for specific cases and should be applied on a sliding scale. Reduced profitability of producers would reduce their tax income.
6.6 Risks
The main risk for the development of a biofuels industry is the volatility of the oil price and exchange rate, leading to possible massive changes in revenue. This coupled to agricultural feedstock price volatility makes investment in biofuels risky.

CONFIDENTIAL TO THE NATIONAL BIOFUELS TASK TEAM
Page 47 of 116
In contrast to this, all the risk of high oil prices, and associated high petrol and diesel prices, are carried by South African consumers, most of whom have fixed income and no manner of hedging against such risk.
Conclusion 33. There exists a natural opportunity to hedge between South
African fuel users and biofuels producers when oil prices (in Rands) are high or low.
6.7 Trade Policy Impact
Currently diesel and petrol are imported without tariffs, as are the additives and components used in producing diesel and petrol. It would thus be unfair to impose a duty on biodiesel or bioethanol. However, the fuel tax levy exemption should only apply to locally produced biofuels, as imports do not create the macro-economic benefits to justify the fuel levy reduction.
Biofuels opportunities exist in our SADC neighbours, and development and investment in such opportunities can be positive for the region. Such production may likely have a location advantage to supply South Africa. And South Africa represents the largest market for such products, making up more than 50 % of total SADC petrol and diesel usage. The development of the South African biofuels industry and use, coupled with alignment of SADC fuel specifications, should provide opportunities for neighbouring producers, and will ultimately improve supply security and diversity.
An issue is imports of feedstock for biofuel production and the tariffs that such imports may face. This would relate to agricultural products. Given that crude oil has no tariff, fairness would dictate that biofuel feedstocks also carry no duty. It is recommended that crude oil tariffs and agricultural feedstocks for biofuels be aligned.
6.8 The Sugar Act
The Sugar Act of 1978 has been reviewed several times with the view to align it to the industry strategy development by the department of trade and industry (DTI). It I is also sets out the regulatory framework for sugar production and marketing with the view to promote competition and participation in the domestic sugar industry. The strategy development was motivated by the continuing distortion in the world sugar market as well as the situation in SACU and SADC that consequently affects the domestic market. We therefore highlight areas for government intervention where necessary and possible government action. The government has shared views on the Act as follows:

CONFIDENTIAL TO THE NATIONAL BIOFUELS TASK TEAM
Page 48 of 116
Tariffs can be used as protection against low and subsidized
imports. However at the same time, SADC member states are given preferential market access subject to a quota. The current tariff is dollar based, implying that it is intended to deal directly with world sugar prices.
As one of the least cost producers, South Africa�’s offensive interest must be enhanced, however the nature of the market globally makes it difficult for South Africa to take advantage. Nonetheless, South Africa�’s tariff scenario, in particular on sugar is also not helping the global market situation. By intentionally setting a protective and distortive tariff, by consistently and deliberately excluding sugar industry from liberalization, is a clear sign that South Africa is content with status quo of the sugar industry or doubts its capacity to take leadership in changing the situation, even in the regional context. On the other hand, the argument for protecting the sector may be justified on the basis of involving small scale farmers, even though that can be done through different mechanisms.
It would be in the interest of the industry if it is exposed to international markets, as that would enhance competition. However, competition against Swaziland, and about 50 000 tons (quota) from the rest of SADC members, does not provide enough exposure or competition. And it can be argued that all these are possible due to South Africa�’s defensive interest in the industry.
This may be an opportune time to allow the sugar produced in the country to support and ensure a viable bioethanol production. In addition, in the short- to medium term, sugar protection against SADC members will disappear as countries move towards a higher form of integration like Customs Union. That is expected to be in place by 2010, whereby no forms of tariff barriers will be imposed against members of the customs union. And that would ensure that members states with capacity and potential to provide substantial and consistent supply of sugar would do so, and thereby supporting the move to bioethanol in this country. The SADC Sugar Cooperation which has since been incorporated in to the SADC Trade Protocol aims to achieve some of the issues mentioned above, but also to allow South Africa to contribute to the development of the industry in the region by creating a stable environment for investment, encouraging competitiveness, and developing small and medium sugar enterprises. The co-operation aspect of the agreement includes training, research and development, infrastructure development, customs administration and small holder development. An opportunity exists for the region, as nett sugar producers, and giving declining sugar usage per capita with increasing income for developed markets, to support moves to bioethanol, and thus increase the value of sugar. The Amendment of the Sugar Act of 1978 has seen it changing form, with relevant changes affecting:

CONFIDENTIAL TO THE NATIONAL BIOFUELS TASK TEAM
Page 49 of 116
Control and regulation of production, marketing and exportation of sugar. This does not apply anymore
An end to control and regulation of sugar transportation Replaced setting of maximum prices with notional prices.
The deregulation of the industry under the Sugar agreement of 1999 resulted in the removal of quota restrictions on cane production, relaxation of entry requirements for new millers and growers, removal of registration of land quota and mandatory delivery by growers to certain mills. Although it is argued that competition was the driver of all these changes, however, there is no contest to the fact that there was also a paradigm shift that enforced that such changes take place to accommodate the previously disadvantaged, face international challenges and yet still protect the interest of then industry. However, this move should allow more production, should that be necessary. Another agreement of 2000 had the following outcomes:
Fixed domestic and export quotas, which were allocated to millers, were changed to flexible market shares. The flexible market shares is a system were milling companies are allowed to sell more on the domestic market than the pro rated total production, however, if they sold more, then they will have to pay back a certain amount to South African Sugar Association (SASA) which is worked according to the notional price and export realization.
The pricing of sugar was adjusted from free-on-rail Durban basis to an ex-mill basis, i.e., worked between the mill and the final destination.
The maximum price was replaced by notional price in sharing proceeds between millers and growers. However, the notional price is also open to abuse.
Cane payment which was not based on sucrose content, has changed to recoverable value. The system rewards better performance in terms of quality of sugar cane.
Millers are allowed to export refined and raw sugar, which was the responsibility of SASA under the previous dispensation (except refined sugar in 25 kg bags and less)
Some of the issues that government is keen to address include:
removal of protection that results in uncompetitive domestic environment,
domestic sugar requirements or demand as set by the market. The market should be able to adjust to excess supply,
the industry �‘s ability to determine supply, and exploit the situation in their favour,
competition from Swaziland and SADC quotas. Apparently Swaziland�’s exports to South Africa increased by more than 500% in the past five years while Zimbabwe has free duty access to markets in Botswana and Namibia, and therefore directly competes

CONFIDENTIAL TO THE NATIONAL BIOFUELS TASK TEAM
Page 50 of 116
with South Africa, and technically can find way in the South African market
millers can still determining notional pricing so as to influence the prices, since sales below the price accrue to the miller and are not shared with the growers.
In conclusion, there is acknowledgment from government that the world sugar market is highly imperfect, and so is the domestic market. The Sugar Act of 1978 has been amended and reviewed several times, but there does not seem to be a balanced level that allows South African industry to operate in a less distortive environment. The continued protection of the industry from uncompetitive imports leaves the industry in isolation from international exposure, apart from SACU and SADC. This inevitably results in a less competitive local market with high level of government intervention. It is furthermore unfortunate that this must still be balanced against new entrants, mainly small growers who were previously disadvantaged.
Conclusion 34. For the potential use of sugar cane for bioethanol
production, and for those cases where current excess sugar production capacity is diverted to fuel alcohol supply, it is recommended that the Sugar Act implications be examined and modified where necessary in affair and equitable manner. A principal that should apply is that whilst there is export sugar, that the feed for bioethanol production should be treated on the same basis as for export sugar, and receive benefits that arise from protection of the domestic sugar market.

CONFIDENTIAL TO THE NATIONAL BIOFUELS TASK TEAM
Page 51 of 116
7 AGRICULTURE AND SMALL SCALE FARMERS 7.1 Agricultural and Rural Development Supporting Land Reform Agriculture�’s relatively small contribution to South Africa�’s gross domestic product (3.4% in 2005) belies its importance as a generator of jobs and to act as a catalyst to stimulate rural development. About 70% of the country�’s poorest households live in rural areas (Human Sciences Research Council: 2004). These areas are characterised by unemployment, poverty and marginalisation leading to a high level of migration into urban areas. While agriculture has substantial potential to generate incomes in rural areas, many rural poor fail to earn a living from farming. A recent survey in Flagstaff, Eastern Cape showed that whereas 42.7% of rural dwellers on communal land felt that agriculture was important, only 8.6% of their income was actually derived from agriculture. A staggering 69.9% was derived from government grants. Nevertheless, despite its importance role in facilitating economic development, agriculture�’s contribution to GDP is declining �– having dropped steadily over the past decade. The reasons for this are common to agriculture in other countries. They include an overall decline in international farm-gate prices and the worldwide trend towards the deregulation of agricultural sectors. Growth in the sector is also stymied by the limited market for local agricultural produce. Aids has had a major impact on the ability of the local market to absorb increased production. The Bureau for Economic Research has calculated that 12 % less maize meal, and 7 % less wheat, will be sold in 2011 than would have been sold in the absence of the pandemic. Locally-produced commodities also cannot compete on international markets due to prices there being distorted by subsidies and surpluses. As a result, it is difficult for new entrants, in particular land reform beneficiaries and emerging farmers, to establish themselves as commercial farmers.
Conclusion 35. The introduction of biofuels will increase the demand for
locally produced agricultural commodities, thereby making otherwise nonexistent commercial opportunities available to land reform beneficiaries and emerging farmers. This in turn will increase the chances of Black Economic Empowerment succeeding in the sector.
7.2 Energy Crops versus Other Crops Commercial energy crops are typically low value, commodity crops with limited job creation potential. On average energy crops create 0.1 jobs/ha,

CONFIDENTIAL TO THE NATIONAL BIOFUELS TASK TEAM
Page 52 of 116
compared to approximately 3 jobs/ha for higher value cash crops, such as tomatoes. But energy crops are nevertheless suited to the stimulation of rural economies �– they generate high volumes and have relatively low production risks. The long history of production of these crops also gives them an edge over unfamiliar crops such as sweet sorghum and jatropha, whose production parameters still need to be determined. In addition, energy crops are not as perishable as higher value cash crops such as fruit and vegetables. This allows for more room for error in the production process and obviates the need for expensive and management-intensive cold chain management. Energy crops can be stored with relative ease and cost effectiveness. This reduces the pressure on farmers to access markets immediately after harvest and allows them to keep crops from the market when producer prices are low. Energy crops have a further advantage of lending themselves to large-scale regional production. This allows for the grouping of a number of emerging farmers, farming on pockets of land too small to individually warrant capital investment, so that they approximate large-scale farming enterprises. This arrangement unlocks economies of scale previously denied individual small-scale farmers, such as the ability to negotiate better farm-gate and input prices. It is also easier to extend farm management and extension services to a group of farmers producing identical crops under similar conditions than it is to individual farmers growing different crops. As a result, the likelihood of emerging farmers consistently, and more efficiently, producing higher volumes than they would individually increases. The grouping of small-scale farmers is a mechanism through which otherwise marginalised small-scale farmers can obtain access to the first economy. This access can be further facilitated if the farmers become dedicated suppliers to an industry with an established and growing demand. A new industry, such as a biofuels industry, is ideally suited to this purpose �– it will create demand for additional agricultural commodities to be supplied by new entrants without eating into the market share of existing commercial farmers. Biofuel offtakers are likely to be major oil companies, which will provide market security for small-scale farmers especially in the event of mandatory blending being introduced. Energy crops can therefore act as anchor projects for rural development. Once a producer base of emerging farmers is established, higher value cash crops can be introduced as rotation crops. Such crops can unlock agro-processing opportunities in economically depressed rural areas and can also contribute to household food security. Typically new farmers struggle to produce higher value agro-processing crops as their perishable nature requires greater farm management skills and greater capital expenditure, particularly with regard to investments in cold chain management, traceability etc. Emerging farmers also often fail to obtain

CONFIDENTIAL TO THE NATIONAL BIOFUELS TASK TEAM
Page 53 of 116
the production loans typically needed for higher value crop cultivation due to a lack of security and poor asset bases. However, the likelihood of emerging energy-crop farmers obtaining production loans is increased by the fact that energy crops generate a stable income stream in a liquid market at lower risk.
Conclusion 36. Energy crop production can help establish an agro-
processing foundation in marginalised rural areas allowing for the introduction of the cultivation of higher value cash crops and agro-processing activities. The higher risk entailed in producing higher value cash crops can be offset by the lower risk entailed in producing bulk commodities for dedicated and reliable offtakers such as the liquid fuel industry.
7.3 Food Security Concerns have been raised that energy crop production could contribute to food insecurity in particular rural areas and nationally because land and water that would otherwise be used for food production would be diverted into growing energy crops. This is a concern that has been raised by the Food and Agricultural Organisation:
�“It is important for resource-constrained developing countries wanting to produce biofuel to assess the cost of drawing resources away from food and feed production against the expected benefit from lower crude oil imports. For example, the OECD study of the impact of oil prices on bioenergy production looked at the resource requirement in terms of land. It estimated that the EU would need to convert about 70 % of its agricultural land to provide 10 % of its energy needs, while the United States, Brazil, and Canada would require about 30 %, 3 %, and 0.3 % of agricultural land, respectively. The rate of such conversion varies across countries and is dependent on feedstocks used to produce bioenergy and per capita transport fuel consumption: the higher the latter, the greater the land requirement, given current technology.�” FAO Outlook June 2006
But the FAO also states that �“technology advances and productivity gains could allow the use of less land per unit of energy produced�”. In South Africa this is already noticeable in respect of maize production where more maize is produced on less land (see table 1). This has been attributed to improved production practices �– such as crop rotation, conservation tillage and precision farming �– and improved cultivars.

CONFIDENTIAL TO THE NATIONAL BIOFUELS TASK TEAM
Page 54 of 116
Table 17: More maize on less land
1988/89 2004/05 Tons 11.6m 11.5m Hectares 3.8m 2.8m T/ha 3.1t/ha 4.1t/ha
32.3% increase in yield Source: Grain SA
South Africa also has unutilised arable land, whose potential can be unlocked by placing it under energy crops. A study conducted by the Agricultural Research Council estimated this at 11 million ha, most of which exists in the former homeland areas. Food security concerns also stem from the fear that the increased demand for carbohydrate and oilseed crops will increase the prices of underlying raw materials in the food sector. Shell has calculated that in 2005, biodiesel feedstock crops will constitute 2.6% of world vegetable oil production, increasing to 8% in 2010. Major vegetable oil feedstocks are palm oil (31 %), soya (29 %), canola (14 %) and sunseed (9 %). Canola for biodiesel use already constitutes 18 % of world canola oil production and is expected to increase to 56 % in 2010. Already food sector, notably margarine manufacturers in the EU have expressed concern. In Australia in particular, the Livestock Feed Grain Users Group has also expressed concern that the increased demand for grain crops brought on by biofuel production will raise livestock input costs, which in turn will be passed on to the consumer. BFAP has modelled the impact of biofuels on the food and feed sector. Preliminary calculations show a marginal price increase as a result of the increased demand; namely 7.5 % for milk, 2 % for chicken, 9.6 % for beef and 2.5 % for eggs per annum until 2015. These increases are not as severe as those predicted in other countries, the reason being that largely surplus or export-directed production will be utilised for biofuel feedstocks. Future food price increases will further be mitigated by improvements in biofuel plant processing technologies to enable the cheaper production of biofuels. In particular it is expected that technological advancements will reduce biofuel plants�’ reliance on the revenue streams generated from selling by-products such as distillers dried grains from solubles (DDGS) and oilcake into the animal feed market. Attenuating this reliance will reduce price pressures on oilcakes and DDGS, in turn contributing to lower animal feed prices. Conclusion
37. The cultivation of energy crops does not pose a substantial threat to food security or food prices, as the industry matures, it is expected that the impact on food prices will diminish even further.

CONFIDENTIAL TO THE NATIONAL BIOFUELS TASK TEAM
Page 55 of 116
7.4 Additional Land Use for Biofuels BFAP�’s modelling, however, shows that the increased demand created by the introduction of biofuels will impact only marginally on land under cultivation in the established farming sector. This is due to a number of factors, such as the diversion of sugar from export markets into bioethanol production, the existing area under maize cultivation being used to its full potential and biodiesel feedstock demand initially being met from imported oilseeds. A number of innovative project models have emerged pointing at ways in which the farming base can be structured in order to be more competitive with imports. To stimulate rural economic development, it is crucial that alternative project structuring models are investigated.
Conclusion 38. In order to stimulate rural economic growth, biofuel projects
would have to be innovatively structured, to ensure farmers are incentivised to expand production and/or switch from other crops to biofuel crop production.
Table 18: Cost of energy embodied in fertiliser in relation to the value of the crop
Crop Yield t/ha Energy in fertilizer used (Kg
of oil)
Energy used per ton of crop (Kg oil)
Current price of oil used per
ton of crop
Current price per
ton of crop
Ratio of price of oil used to crop price
Maize 2.5 dry and 5 irr 113 45.2 and 22.6 258 and 129 775 1:3 and 1:6
Wheat 2 dry and 6 irr 70 35 and 11.6 200 and 66 1450 1:7 and 1:22
Sunflower 2 35 17.5 100 1510 1:15
Soybeans 2dry and 3.5 irr 23 11.5 and 6.6 66 and 38 1428 1:22 and 1:37
Sugar cane 66 dry and 100 irr
217 3.3 and 2.17 19 and 12 250 1:13 and 1:20
Cotton 0.15- 0.3 75 500 and 250 2850 and 1425 1720 1:0.6 and 1:1.2
Groundnuts 0.7 402 574 3272 2500 1:0.8
Vegetables 30 392 13 74.1 2000 1:30
Potatoes 30 370 12 69 1459 1:21
Table 20 shows the sensitivity of selected commercial crops to oil price increases �– taken as R5.7/kg, the equivalent at the time of $70 per barrel. It

CONFIDENTIAL TO THE NATIONAL BIOFUELS TASK TEAM
Page 56 of 116
will be seen that the cost of the oil or gas used to make just the fertiliser required to grow maize can be as much as a third of the price at which the maize is sold. Source: data from Combud, FSSA and FAO.
7.5 The small scale farming sector
The small-scale farming sector includes growers with a range of approaches �– those farming purely for subsistence purposes through to those that are commercialising. Small-scale commercialising farms share all the characteristics of their bigger counterparts except that their limited area under cultivation denies them economies of scale. We will therefore distinguish between commercial (and commercialising) farms, which may be large or small, and subsistence farms, which are almost always small. The key differences between subsistence farmers and commercial farmers are: The extent to which external inputs are used: In particular, commercial farming uses much more energy than the subsistence sector, energy in the form of fertiliser and sprays, embodied in its equipment such as tractors and pumps, and as the motive power for that equipment. The motive for farming: The high energy use is intended to maximise the income going to the owner of the commercial farm. The subsistence farmer may only wish to supplement an income from other sources and to provide food for her/his household. Security is a much more important consideration. The quality of the land used and its location: Many subsistence farmers use poor, degraded land, in a remote location, with no access to irrigation schemes. In this regard, DWAF has produced a position paper that advises on ploughing crops that are drought resistance for marginal areas, and the recommendations should be included is farming programmes. The yields obtained. Yields per hectare and per person-hour are often very much lower on a subsistence farm than those on a commercial one, although this is not always the case. These differences enable one to conclude that, if yields of the biofuel crop per person hour are low, and the price paid for that crop when it reaches the processing plant is based on the price of oil, as is likely to be the case, and the cost of trucking the bulky biofuel crop from the point of production to the processing factory is high. As a result the subsistence farmer will get a very small return for her/his time. This return is unlikely to be sufficiently attractive for them to devote any effort to biofuel production.
Conclusion 39. The subsistence farmer will get a very small return for her
/his time if yields of the biofuel crop per person hour are low,

CONFIDENTIAL TO THE NATIONAL BIOFUELS TASK TEAM
Page 57 of 116
the price paid is low and the cost of trucking is high. This return will unlikely encourage them to produce biofuel crops.
It will be difficult to develop a programme in the short to medium term to produce significant amounts of biofuels by the small scale farming sector. The ownership of small land units by different households in a village is major hurdle to be overcome if biofuel production is to be carried out on the large tracts of underutilised land. One solution might be to turn the low-external input aspect of the subsistence sector into a positive advantage, by devising a system of biofuel production that requires few external inputs, and in particular, little direct or indirect use of fossil energy. Such systems exist and are called Conservation Agriculture. In that way, as the price of fossil energy rises in future, either in response to increasing global demand for a depleting resource, or as a result of restrictions on fossil fuel use to limit climate change, the subsistence sector will gain an advantage over the large commercial farms whose costs will rise more rapidly because of their heavy dependence on fossil energy inputs. Such a low external input system is likely to involve different crops and different processing methods. It would also mean that a much higher proportion of the revenue from external sales stay within the rural community. This report�’s point of departure is therefore that a biofuel programme for the small-scale farming sector must differ from that devised for the larger commercial farms if it is to contribution to alleviate poverty and stimulate a rural local economy. In the short term, such a programme will unlikely bring about the merging of the first and second agricultural economies. For that, an intensive long-term intervention is required.
Conclusions 40. It will be difficult to develop a programme that enables
significant amounts of biofuels to be produced by the subsistence farmer unless changes to farming practice are implemented.
7.6 Subsistence Farming Subsistence farming in South Africa is characterised by poverty and a lack of services and infrastructure. Most of the people living in rural areas are �“rural dwellers�” rather than farmers, and subsistence agriculture is practiced as a survival strategy. Their income is substantially from old age pensions, child support grants and the often infrequent unreliable remittances from family members working in the cities. Some limited income is derived from economic activity locally. Agro-climatic conditions in the former homelands are not the best for crop production in general, with some lands under constant decline from erosion. A recent survey in Flagstaff in the Eastern Cape showed that whereas 42.7% of all rural dwellers on communally owned land felt that agriculture was
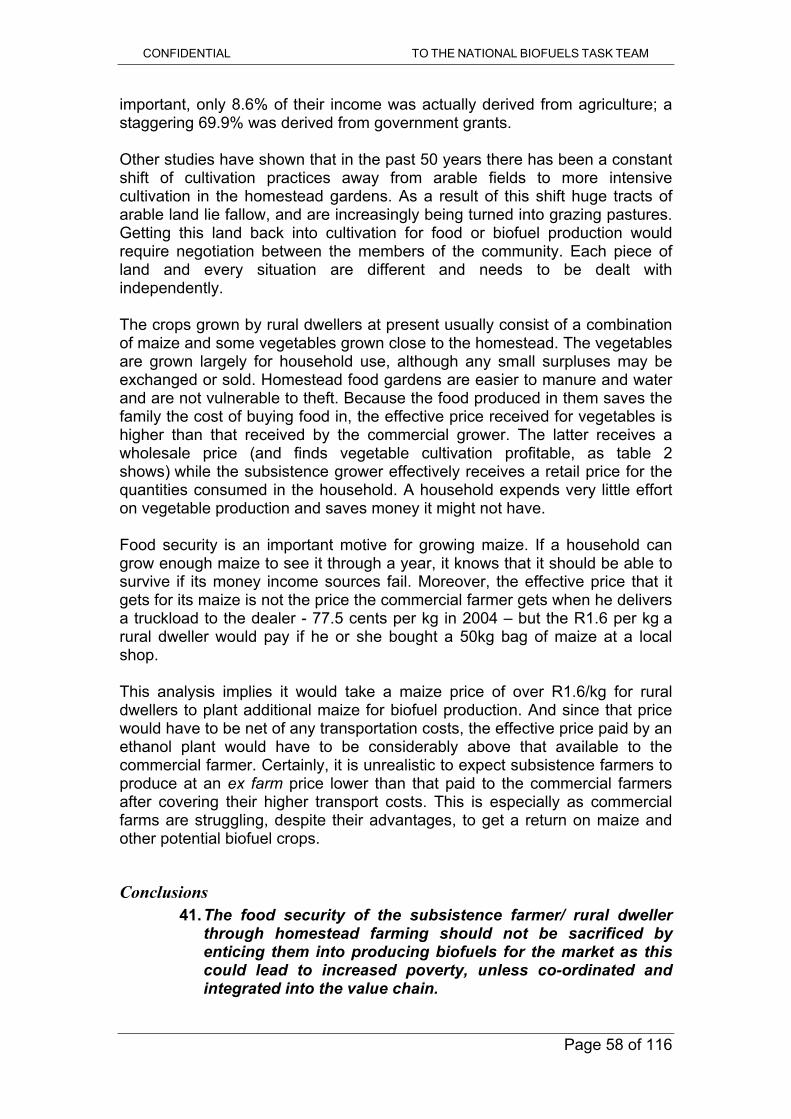
CONFIDENTIAL TO THE NATIONAL BIOFUELS TASK TEAM
Page 58 of 116
important, only 8.6% of their income was actually derived from agriculture; a staggering 69.9% was derived from government grants. Other studies have shown that in the past 50 years there has been a constant shift of cultivation practices away from arable fields to more intensive cultivation in the homestead gardens. As a result of this shift huge tracts of arable land lie fallow, and are increasingly being turned into grazing pastures. Getting this land back into cultivation for food or biofuel production would require negotiation between the members of the community. Each piece of land and every situation are different and needs to be dealt with independently. The crops grown by rural dwellers at present usually consist of a combination of maize and some vegetables grown close to the homestead. The vegetables are grown largely for household use, although any small surpluses may be exchanged or sold. Homestead food gardens are easier to manure and water and are not vulnerable to theft. Because the food produced in them saves the family the cost of buying food in, the effective price received for vegetables is higher than that received by the commercial grower. The latter receives a wholesale price (and finds vegetable cultivation profitable, as table 2 shows) while the subsistence grower effectively receives a retail price for the quantities consumed in the household. A household expends very little effort on vegetable production and saves money it might not have. Food security is an important motive for growing maize. If a household can grow enough maize to see it through a year, it knows that it should be able to survive if its money income sources fail. Moreover, the effective price that it gets for its maize is not the price the commercial farmer gets when he delivers a truckload to the dealer - 77.5 cents per kg in 2004 �– but the R1.6 per kg a rural dweller would pay if he or she bought a 50kg bag of maize at a local shop. This analysis implies it would take a maize price of over R1.6/kg for rural dwellers to plant additional maize for biofuel production. And since that price would have to be net of any transportation costs, the effective price paid by an ethanol plant would have to be considerably above that available to the commercial farmer. Certainly, it is unrealistic to expect subsistence farmers to produce at an ex farm price lower than that paid to the commercial farmers after covering their higher transport costs. This is especially as commercial farms are struggling, despite their advantages, to get a return on maize and other potential biofuel crops.
Conclusions 41. The food security of the subsistence farmer/ rural dweller
through homestead farming should not be sacrificed by enticing them into producing biofuels for the market as this could lead to increased poverty, unless co-ordinated and integrated into the value chain.

CONFIDENTIAL TO THE NATIONAL BIOFUELS TASK TEAM
Page 59 of 116
7.7 Suitability
If biofuels are to be grown to any significant extent in the subsistence areas, the crops chosen will have to give a good return on the time invested cultivating them. They will also have to be drought and pest resistant and tolerant of poor, degraded soil. The crops should also be processed locally, at least in part, to reduce transport volumes. If the waste left behind can be used as fuel or animal feed, benefits to the community would be enhanced. a) Getting a good return on labour input. The drawback with annual crops such as maize is that they have to be re-planted each year and, in a low external-input agriculture, this can involve a lot of labour, even if "no-till" methods are used. Perennial crops are therefore more likely to be attractive. b) Drought resistance. Perennials are likely to have deeper roots than most annuals, and can thus bring water up from greater depths. c) Pest resistance. This can be enhanced by growing different species and different cultivars of the same species together. While the overall yield may be lower with this approach, the yield in any year is more reliable, an important factor in any community with few resources upon which to fall back. Rather than maize, sorghum, soya, canola, or sugar beet, crops that are better suited to rural dwellers may include sugar cane, and shrubs and trees such as Jatropha Curcas, Moringa and the two indigenous plums, Xiemenia Caffra (sour plum) and Papia Capensis (jacket plum). These crops stabilise degraded land through strong rooting processes, most are drought resistant particularly after the first few years and are happily rain-fed on average South African rainfall levels. Besides these significant environmental benefits, the crops need little care and can bring worthwhile economic returns. Several organisations are exploring this approach in South Africa. For example, Mafikeng Biodiesel is attempting to consolidate 60 000 ha of communally owned land in Mafikeng in the North West province. It is a company owned 25% by government (20% through Northwest Invest, an arm of the provincial government and 5% through the Mafikeng Industrial Development Zone), 45% by the tribe as landowners and 30% by the private sector. The 20% owned by Northwest Invest will be sold to an investor after the development stage. Money obtained through the Clean Development Mechanism set up under the Kyoto Protocol will be used to pay for seeds and for planting and the government has funded the nursery, which will provide planting material. About 13 000 part-time jobs will be created when the project has been fully developed.
Conclusion 42. Perennial crops maybe more suitable for small scale farmers
even within the livelihoods and poverty alleviation approach. A study to assess the suitability of perennial crops for the biofuels market should be undertaken.
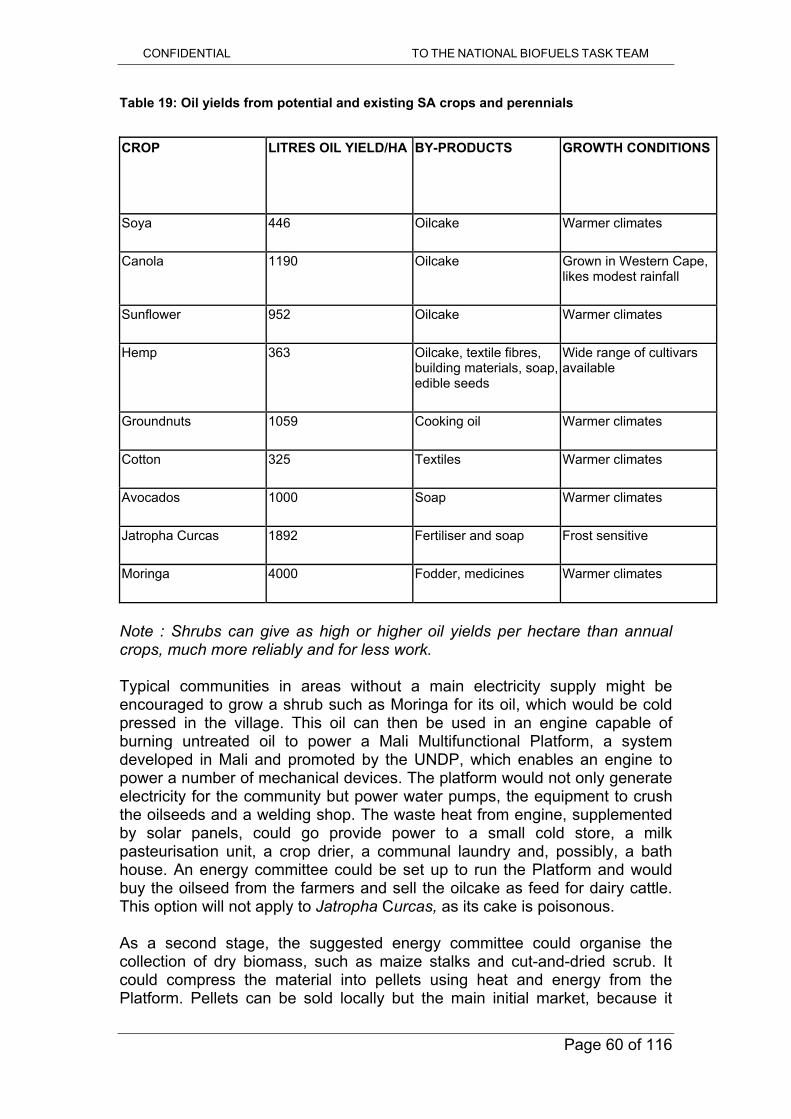
CONFIDENTIAL TO THE NATIONAL BIOFUELS TASK TEAM
Page 60 of 116
Table 19: Oil yields from potential and existing SA crops and perennials
CROP LITRES OIL YIELD/HA
BY-PRODUCTS GROWTH CONDITIONS
Soya 446 Oilcake Warmer climates
Canola 1190 Oilcake Grown in Western Cape, likes modest rainfall
Sunflower 952 Oilcake Warmer climates
Hemp 363 Oilcake, textile fibres, building materials, soap, edible seeds
Wide range of cultivars available
Groundnuts 1059 Cooking oil Warmer climates
Cotton 325 Textiles Warmer climates
Avocados 1000 Soap Warmer climates
Jatropha Curcas 1892 Fertiliser and soap Frost sensitive
Moringa 4000 Fodder, medicines Warmer climates
Note : Shrubs can give as high or higher oil yields per hectare than annual crops, much more reliably and for less work. Typical communities in areas without a main electricity supply might be encouraged to grow a shrub such as Moringa for its oil, which would be cold pressed in the village. This oil can then be used in an engine capable of burning untreated oil to power a Mali Multifunctional Platform, a system developed in Mali and promoted by the UNDP, which enables an engine to power a number of mechanical devices. The platform would not only generate electricity for the community but power water pumps, the equipment to crush the oilseeds and a welding shop. The waste heat from engine, supplemented by solar panels, could go provide power to a small cold store, a milk pasteurisation unit, a crop drier, a communal laundry and, possibly, a bath house. An energy committee could be set up to run the Platform and would buy the oilseed from the farmers and sell the oilcake as feed for dairy cattle. This option will not apply to Jatropha Curcas, as its cake is poisonous. As a second stage, the suggested energy committee could organise the collection of dry biomass, such as maize stalks and cut-and-dried scrub. It could compress the material into pellets using heat and energy from the Platform. Pellets can be sold locally but the main initial market, because it

CONFIDENTIAL TO THE NATIONAL BIOFUELS TASK TEAM
Page 61 of 116
would be the most lucrative, would be to the urban middle-class as a charcoal substitute for braai use, or for burning in pellet stoves. When competition from other communities brings the price down, a pellet market could also develop in the townships Some farmers could then start growing special biomass crops to be cut and dried for sale to the energy committee. Ideally these would be trees or shrubs, which responded well to coppicing and whose leaves make good fodder for animals such as goats. Research is needed to establish which trees and shrubs would fare best in which areas, taking their non fuel uses into account.
Conclusion 43. Cultivation of perennial crops by small scale farmers may
contribute positively to local energy security, local economic development, and improved soil and environmental quality especially if applied to simple technology, low capital intensive programmes. A biofuel strategy for small scale farmers should include an assessment of the ability of perennial crops, co-products, institutional arrangements and innovations to contribute to local community energy security and local rural economic development.
7.8 Land Availability, Restitution and Redistribution The typical arable farm in the former homelands is between one and three hectares. This greatly limits the energy-crop production potential, particularly as studies have shown that, with maize, the yield per hectare is 200-300kg, enough for a family but around a tenth of that achieved on the commercial farms. Although there is a lot of seemingly idle land in some of small-farm areas, it will be difficult for it to be used for biofuel production under the present land tenure arrangements. While there are a wide variety of land tenure systems (trust tenure, quitrent, freehold informal), trust tenure is the dominant tenure form. Traditional leaders usually have some role in land administration. Attempts to allow the �“owners�” to be granted loans against the value of the land have proven difficult. Land tenure in the former homelands is characterised by overlapping rights, lack of clarity of rights and conflicting rights. Presently the Communal Land Rights Act, which seeks to secure land rights for people living in communal areas, is being piloted in KZN. Similar tenure complications impact on irrigation schemes that are located in four provinces, where just over 50 000 ha of irrigated land falls under this land tenure system.

CONFIDENTIAL TO THE NATIONAL BIOFUELS TASK TEAM
Page 62 of 116
Table 20: Area of irrigated land available in small-scale farming areas.
Area in ha Province No of schemes
28 280 Limpopo 179
11,900 Mpumulanga 19
6 600 KwaZulu Natal 36
9 600 Eastern Cape 75
The best approach to using communal land for shrub cultivation might be for a co-operative to handle the planting and the harvesting and to share out the proceeds. Apart from the communal land, additional land is likely to become available to small-scale (not necessarily subsistence) farmers in the near future as a result of land restitution and redistribution, both of which are being pushed forward at at the highest political level. Where people were removed from land after 1913, claimants have the right to restitution of their land. It is envisaged that all claims will be settled by March 2008. This is the largest land reform category and makes up much of the land in the former homelands. The 3 million ha of underutilised available land identified as potential land for the industrial biofuels strategy is mostly found in these areas under this land tenure regime. There are no reliable figures of the number of hectares in this category, but the Commission on the restitution of Land Rights is involved in verification of claims. To give an idea of the extent of the land claims, it has been estimated that 70% of the land in the Limpopo province is under claim. Large tracts of restituted land will be rural in character and located in former homelands. Redistribution involves land purchased through the willing-buyer willing-seller approach in the open market. It is geared to bringing emerging and small-scale farmers into the land market and agricultural sector. Government�’s target is to redistribute 30 % of high potential agricultural land by 2015. The total land in this programme will be 25 million ha. Given that only 13 million ha of land is currently under commercial production, with a further 3 million ha estimated to be of high arable potential, this land is not all arable land.

CONFIDENTIAL TO THE NATIONAL BIOFUELS TASK TEAM
Page 63 of 116
Conclusion 44. Land reform beneficiaries will soon have improved tenure
arrangements as well as additional land, possibly improving their ability to engage with a higher production strategies, but will need extensive support for this to be successful.
7.9 Strategies
It would be a missed opportunity if a biofuels strategy aimed at rural dwellers and small scale commercial farmers did not learn from the mixed experiences of past programmes. One such programme is the Massive Food Production Programme (MSSP) in the Eastern Cape that, in the 2004/5 growing season, had R 60 million available for mechanisation grants and a further R 60 million to subsidise input costs. A case study by Umhlaba Consulting Group focused on the maize programme in Oliver Tambo District municipality (Manona, 2005). In the programme, subsistence farmers were given capital grants for mechanisation and annual grants which reduced year by year for five years to help pay for their inputs. The grants were conditional upon the farmers using agricultural practices set down by government.
The study showed that maize grown under the programme consistently failed to recover the cost of the inputs used to grow it. It concluded that:
The government's prescribed farming system replaced traditional
intercropping farming practices with monocropping. This exposed the farm family to a much greater risk of crop failure.
Various government driven maize schemes replaced the traditional practice of low input- low risk farming with high input- high risk agricultural systems, which were often unaffordable and unsustainable
Government mechanisation programmes have no sound economic basis in the small scale farming sector.
Conclusion 45. Interventions in the past aimed at increasing yields of crops
like maize on communally owned land have been dogged with problems. A strategy aimed at the small scale subsistence farmer would consider past experiences and learn from them.
CONFIDENTIAL TO THE NATIONAL BIOFUELS TASK TEAM
Page 64 of 116
Table 21: The job creation potential of biofuels
Fuel Jobs per TWh
Biodiesel 16,318
Bioethanol 3,770
Biogas 1,341
Coal 700
Gas 130
Nuclear 80
Table 22: Renewable energy production offers much more scope for creating employment than fossil fuel use. Source: Earthlife Africa/SECCP report 2003 An independent report commissioned by Earthlife Africa in 2003 gave detailed indications of the potential for renewable energy to create jobs. The report shows that the number of jobs created from the biofuels industry are higher than from traditional fossil fuel based technologies like coal, gas and nuclear. The table above gives the figures and biodiesel has the greatest potential for creating jobs at 16 318 jobs/TWh versus coal at 330 jobs/TWh, gas 130 jobs/TWh, nuclear 80 jobs/TWh and bioethanol at 3 778 jobs/TWH. The study also looked at the number of jobs created if a particular target were reached. If 15% of all the diesel and petrol used in South Africa was replaced with biofuels, this would create 180 000 direct jobs. Weaknesses of the study are that it does not detail where these jobs would be created in the biofuels cycle, and the assumptions varied for the different alternatives. But what is clear is that the biofuels sector, even at a low target can create a substantial number of jobs. The same report also show that other renewable energy technologies can support job creation, with the total number of jobs, directly and indirectly being 700 000 by 2020 with about 20% of South Africa total energy demand being produced through renewable energy.
Conclusion 46. An industrial strategy for biofuels will create more jobs
creation than the production of fossil fuels, but we need to know more about the types of jobs and levels of skills
CONFIDENTIAL TO THE NATIONAL BIOFUELS TASK TEAM
Page 65 of 116
required. Piloting will assist to better determine the types of jobs that can be created from an industrial biofuels strategy.
7.10 Conclusions In the short-and medium-term, it will be very difficult for subsistence farmers to produce significant amounts of energy crops for the mainstream economy. Indeed, they should not be asked to do so in the absence of proper support, because their communities are income and energy poor and the government's first target should be to have them produce enough bio-energy to meet their own needs. This would, at the very least, raise their living standards as it would save money used to purchase kerosene and other fuels for other purchases. It would also make the rural areas, and South Africa as a whole, more energy-secure because, while subsistence farmers might not be producing energy for general sale, they would reduce the amount of imported fossil energy required by the country overall. Communities and individuals in the rural areas have neither the collateral nor the income streams to enable them to borrow commercially. Any programme to produce bio-energy for local use therefore has to make grants available to the communities to purchase diesel engines that can run on untreated vegetable oil to power generators, welding sets and similar equipment. Since the commercial production of biofuels is already being encouraged through tax and duty concessions, it seems only fair that the government should devote similar amounts to benefit rural dwellers. Such spending, by providing an electricity supply to districts, which it will never be economic to serve through the grid, could do a lot to transform rural life and make it more diverse and more sustainable.
Conclusions 47. Government should exercise caution when involving small-
scale subsistence farmers as energy crop producers. A strategy needs to be developed that addresses the rural poor�’s primary needs for food security and infrastructure and service provision as well as regenerating the rural economy.
48. Any energy-crop production subsidy should be extended to
small-scale farmers so that energy-crop production can help alleviate poverty, revitalise rural economies and improve energy and food security.
49. Where small scale farmers do cultivate energy crops, the
production and supply of energy for their own community should be given priority.

CONFIDENTIAL TO THE NATIONAL BIOFUELS TASK TEAM
Page 66 of 116
8 ENVIRONMENTAL ISSUES IN THE INDUSTRIAL BIOFUELS STRATEGY
8.1 Introduction The roll out of an industrial biofuels strategy could involve the expansion of cultivated land into areas previously uncultivated and in order to increase the profitability and production levels of farmers, the use of more chemicals and new technologies might be applied during this process. This in turn could increase the environmental burden on land, air and water resources in South Africa. It could also encroach on land set aside for biodiversity either formally or informally. While there are air pollution and climate change benefits from a biofuels programme, these need to be offset against other impacts and the overall impact should be assessed in an integrated and holistic manner. This section deals with some of the impacts and the benefits that can accrue from such a programme without making a final judgment based on the analysis. Some intensive examination should be initiated for any roll out. This may require programme research, and South Africa has excellent research agencies well equipped to deal with this in SANBI, WRC, CSIR and universities amongst others. 8.2 Water and Environmental Health and Quality South Africa is not a water-rich country. The UN states that it is adequate if a country has a resource of 1700m3 of water per person per year but South Africa only has 1200m3. A country is defined by the UN as water scarce if its water use exceeds 40% of the amount available annually. South Africa�’s water withdrawal is higher than that in dry years and 62% of that water is used by the agricultural sector. In comparison to the rest of the world this may not be excessive as a recent IWMI reports indicates that the global average use of water by agriculture is 74% of all water used by mankind. Most of the water used by agriculture in SA goes to 1.3 million hectares of irrigated land (ca 36 by 36 km square), representing a 10 % of agriculturally cultivated land, and which produces a quarter of the country�’s agricultural output. 95% of this irrigated land is owned by large scale commercial farmers and only 5% of the water is used by small scale farmers. Competition for water between agriculture and other sectors, particularly for urban needs, is intensifying and some catchments are already over-allocated and water stressed. There is therefore very little opportunity for the expansion of irrigation for biofuels, and then only in a limited number of �‘unstressed�’ catchments. A further potential 500 000 ha of such land has been identified (ca. 22 by 22 km square). Further water allocations are not allowed in certain over stressed catchments. Agriculture that is rain fed can also be a drain on the resource as it may use the resource before it can drain into the catchment area. For this reason all agricultural practices should be assessed in terms of water use even if rain fed.
CONFIDENTIAL TO THE NATIONAL BIOFUELS TASK TEAM
Page 67 of 116
Water quality issues arise from industrial agricultural practices where chemicals are applied on the land, which can wash, into rivers and into the ground water. Poor farming practices can also impact on water quality through salination.
Conclusion 50. Increased cultivation of energy crops could further increase
pressure on South Africa�’s limited water resources, not only for irrigated production but also with rain fed production of both annual and perennial crops.
The South African legislation and policy is aimed at seeking to balance the need to use natural resources, like water, for social and economic development with the need to ensure that natural resources are not unacceptably degraded and rendered of diminished value and utility for future generations. The South African National Water Act of 1998 (NWA) recognizes the need to address the prevailing and often wasteful use of water to ensure that the quality and quantity of the water remaining in the resource is sufficient to ensure its long term health, utility and availability. The NWA has allowed for the establishment of Catchment Management Agencies (CMAs), 19 in total generally abiding generally by the hydrological boundaries. CMAs are responsible for managing, using, conserving, protecting, controlling and development of water resources in each of the Water management areas. DWAF has information on the availability of water in these areas, and it is therefore necessary that DWAF and these agencies are engaged with respect to an industrial biofuels strategy in order that they can assess the impacts on their resources. DWAF is currently in the process of Water Allocation Reform Programme (WAR), which is addressing how the provisions of the National Water Act could be used to allocate, and if necessary re-allocate water to achieve greater equity, and the impact and link to this must also be integrated in proposed biofuels investments and feedstock growing. Additionally, The Water Research Commission (WRC) should conduct research into the impacts of both commercial biofuels production and small-scale production on both water quality and quantity prior to the roll out of the strategy.
Conclusions 51. CMAs need to be capacitated on issues related to the
cultivation and processing of energy crops.
52. Further scoping regarding projected water use in the expansion areas of energy crop cultivation should be undertaken. Specific attention should be given to perennials.
Biofuels will use water at both ends of process. Water will be used in the cultivation process, whether rain fed farming or irrigation farming is practiced and biofuel processing plants can be large users of water. For instance in

CONFIDENTIAL TO THE NATIONAL BIOFUELS TASK TEAM
Page 68 of 116
sugar cane processing to bioethanol, 87% of the water use takes place in four processes: sugar cane washing; condenser/multijet in evaporation and vacuum, fermentation cooling; and alcohol condenser cooling. India and Brazil has made large advancements in their water use in the biofuels industry and this indicates that water use efficiency can be improved with new technologies. Maize to ethanol plants has even high water needs.
Conclusion 53. Biofuels processing needs to be carefully assessed for its
impact on the water reserves in a given catchment. The �“more crop per drop�” approach should be adopted in South Africa for all agriculture, but especially for energy crop production if it is to involve a far greater area of cultivated land than is currently under production. Current irrigation methods are water wasteful and can be vastly improved, with drip irrigation methods being a preferred method. Rain fed schemes can also have improved water efficiency through water harvesting, swaling and improved absorption surfaces. The three S�’s can be applied across the agricultural sector: Stop, Store and Sink.
Conclusion 54. Water efficiency needs to be promoted within the cultivation
of biofuels energy crops and the biofuels processing sector.
One possibility for irrigated biofuel production for the small scale farming sector is the irrigation schemes described in the small scale farmers�’ section. These were state farms in the past, cultivated for the benefit of the former homeland governments. Ownership of and benefits from these schemes are now systematically being transferred to the surrounding communities. The Joint Venture (JV) model used for the transfer of such a scheme has been relatively successful and apportions shares and profits amongst the community (through a community trust), the workers in the scheme and a strategic partners (a commercial company). However, this has been the exception rather than the rule. There is no doubt that both the irrigated and rain fed fields in the communal tenure areas are physically capable of improved output, and could grow feedstock for manufacturing of biofuels. However, without the development of suitable institutional arrangements, which need to take full cognisance of the range of social and psychological factors at play, success is unlikely.
Conclusion 55. Irrigation schemes need to be given special consideration
within the small scale farmer�’s biofuels interventions. Water quality issues also need to be considered within the industrial strategy. Some aspects of the biofuels processing can be quite toxic. Vinasse (the waste product of the bioethanol processing from sugar cane), for instance, if discharged into rivers can impact the aquatic environment seriously. Special attention needs to be addressed to the specific issues related to biofuels. Guidelines for waste effluents from biofuel processing will need to put in

CONFIDENTIAL TO THE NATIONAL BIOFUELS TASK TEAM
Page 69 of 116
place. There is an opportunity here to try and close the waste loop. Vinasse can be used on certain soils, but not all soils, as a fertiliser. Technology also exists to limit the quantity and type of Vinasse effluent, and best practices should be applied. Other effluents can be equally damaging, particularly if concentrated, like the chemicals that are used in processing. A full scale analysis of the chemicals used during processing, and the effluents produced needs to be done and measured against the existing legislation in order to determine its adequacy and whether or not changes or additions need to be made to the laws.
Conclusion 56. Biofuels processing needs to be assessed against industrial
pollution regulations to determine whether the processes are adequately covered.
8.3 Health Issues Human health issues need also be considered, especially in the production of biodiesel. Methanol is frequently used during the transesterification process and this is highly toxic to humans causing amongst other things, blindness. Industrial health regulations should be assessed for their ability to deal adequately with these chemicals. The small scale decentralised sector could provide specific and difficult challenges in this regard. While regulations are there to protect, you also do not want to discourage small scale entrepreneurship. Ethanol production is well regulated within South African law yet we there are illegal stills in every part of the country. There is a potential for alcohol abuse arising from the bioethanol processing, but this is less likely for the large scale commercial processing sector. Again it is the small scale sector that is most at risk. Ethanol used currently in energy programmes around the world is denatured to make it not palatable for humans. Ethanol gel, used in the energy poverty programmes of South Africa in replacement of paraffin also make it difficult to imbibe the energy product as an intoxicant as it is in gel form.
Conclusion 57. Health and safety regulations need to be assessed for their
ability to adequately deal with the challenges of the small scale processing plants.
8.4 Climate Change South African agriculture is fossil fuel intensive and is thus a major contributor to the build-up of greenhouse gases in the atmosphere, a build-up that threatens its own future. The Fertiliser Society of South Africa (FSSA) estimates that 1.5% of the country�’s greenhouse emissions come from fertiliser use alone. A Recent report for the Department of agriculture

CONFIDENTIAL TO THE NATIONAL BIOFUELS TASK TEAM
Page 70 of 116
conservatively estimates that agriculture uses 12.5 % of the total energy demand of South Africa if you include all the backward and forward linkages as well as include embodied energy in the inputs. There is a misperception that biofuels are innocuous and emit nothing, whereas in fact you get almost the same CO2 emissions from a motor vehicle run on biofuels as you get from fossil fuel driven vehicles. Emissions of some pollutants from biofuels are less than those from fossil fuels like the SOx emission, which are zero from biofuels, and particulate matter from biofuels is far reduced, typically by almost 50%. For ethanol, hydrocarbon and CO emissions are reduced, whereas NOx are increased. Some are pollutants are INCREASED from biofuels compared to fossil fuels. It is expected that overall the impact will be slightly positive to neutral, but not likely to be that significant to impact on biofuels strategy and policy decisions in the short term. The impacts could be better analysed as part of the overall clean fuels strategy. The CO2 emissions at the point of combustion are considered carbon neutral as the carbon dioxide is again taken up by the plants that are grown to produce the fuel. However this is not the complete picture, as calculating CO2 emissions from biofuel production cannot be limited to the combustion process itself and when you do a full life cycle analysis (LCA), biofuels are not carbon neutral. Figure 6: Life Cycle Assessment
Other CO2 emissions come from processes that are outside of the combustion process and include the emissions from the production process, like
Life Cycle Assessment (or LCA) is a technique to quantitatively assess the environmental impact and the energy requirements of a product or service from its initial raw materials to its final disposal (i.e. cradle to grave). This assessment takes into account any other products or services that may be required to facilitate its use and/or production. One of the key advantages of using LCA is it allows a direct and fair comparison between two products or services with regards to the environmental and energy impact. Due to this kind of comparative assessment LCA is an excellent tool to weigh costs and benefits and is therefore a useful aid in decision-making and policy analysis. When considering LCA for biofuels, it must take into account the evaluation of the energy and global warming costs of producing biodiesel from energy crops in SA and comparing this with other fuels and relevant energy saving measures.
Representative Carbon Dioxide Outputs for Biodiesel by Conventional Production from Oilseed Rape in the United Kingdom
CONFIDENTIAL TO THE NATIONAL BIOFUELS TASK TEAM
Page 71 of 116
cultivation, processing and the fertiliser and other inputs used in the farm. The diagram below details the source of carbon emissions from the entire biofuels cycle. While energy balances tell you whether or not you are getting a net energy gain from producing your biofuels based on a full LCA, we need to look at this differently for climate change benefits. If the biofuels programme is being supported as a climate change mitigation programme then careful analysis of the carbon emissions based on the LCA needs to be done. To get carbon credits through the Clean Development Mechanism (CDM), this process is required in any event. Some crops will give better climate mitigation benefits than others, particularly those that require less fossil fuel inputs in the entire process (cradle to grave) than others. These crops are largely those of a perennial nature, what are technically termed short rotation woody crops (SRWC) in the biofuels jargon. Additionally, if farming practice is changed to adopt conservation agriculture techniques (described below), the amount of fossil fuel used in the cultivation side can be reduced. Many of these ideas not only make sense for climate change but also could represent significant reductions in the overall cost of the production of the biofuels as much of the inputs are made using oil (or gas), which may be ever increasing in price. Interestingly and perhaps important from the CDM perspective, recent studies indicate that even greater carbon sequestration benefits are gained from using SRWCs than previously thought that comes from long term carbon sequestration below ground. These studies indicate that of every 100 green tonnes of energy crop harvested, 63 tonnes of biomass will be sequestered underground, so in essence the more you harvest the more you sequester. This gives further support to the view that perennial crops provide the greatest benefit for climate change mitigation techniques than any other energy crops.
Conclusion 55. The life cycle approach should be used when considering support
for programmes that are chosen based on their capacity to mitigate climate change.
8.5 Climate change and agriculture The preliminary findings of a research project done by the University of Pretoria into the likely impacts of climate change on South African agriculture suggests that climate change is already happening and, because of unpredicted changes, will have a negative affect on agriculture throughout the country, although some parts will be worse hit than others. This negative impact is largely as a result of the fact that farmers need a reasonably predictable climate for high yields and accurate prediction enables them to choose the right crops for their particular climate. The report states: �“Most farmers were of the view that they have observed increased temperature and indication of changes in precipitation, such as the reduced volume of the rainfall, shift in the timing of the rainfall and the shortened period of the rain, especially in the summer season.�” As a result, the farmers were changing their methods in the summer by
increased chemical application,
CONFIDENTIAL TO THE NATIONAL BIOFUELS TASK TEAM
Page 72 of 116
increased irrigation; provision of shelter and shade for crops; soil conservation practices; and Insurance policies and other sources of income to cover their risks.
The most common adaptation options across all types of farming activities in the country in response to higher temperatures and lower rainfall were found to be changes in the variety of crops and livestock breeds and increased irrigation. The increased irrigation needs were most worrying as the country is already suffering from water scarcity. But increased application of chemicals is also of environmental concern as already agriculture is having negative impacts on environmental quality. The report suggested that new crop varieties more suitable for the changed climatic conditions should be identified. The difficulty with this is that with the climate variability being unpredictable, how do the farmers know what crops to shift to? These findings were supported by scientific research done by the Water Research Commission led by Professor Roland Schultz from the University of Pietermaritzburg. The research, using modelling simulators, indicates that there could be a general decrease in winter rainfall over the typical winter rainfall regions of SA, but that the Eastern regions will experience an increase in early summer rains. There will also be a general decrease in late summer rains with the exception of the western interior, which may become wetter. The major focus for concern was the Western Cape where the winter rainfall is expected to drop. The report also looked at climate records over the past 50 years and concluded that elements of climate change can already be clearly detected in some areas. The report highlights the need to find adaptation strategies for the more vulnerable communities that are already stressed enough without having to deal with climate variability outside of their own experience. The small scale farmer will be the most impacted by this climate variability, as she/he does not have access to the data and information that the commercial farmers may have. However, it should be stressed that climate change is unpredictable. The past ten years have seen significant improvements in technologies that allow us to predict climate variability but this is not an exact science and mostly we will have to deal with impacts as they occur.
Conclusion 56. Ways to assist small scale farmers to have increased access to
climate change and weather information need to be explored. 8.6 Soil Fertility Mechanisation, artificial and chemical means of managing weeds and pests enabled the time taken to farm a hectare of a typical arable crop to be cut from about 1000 hours to 12 hours. Doubtlessly this has helped with increasing the profitability of farms and the world�’s agricultural output but it
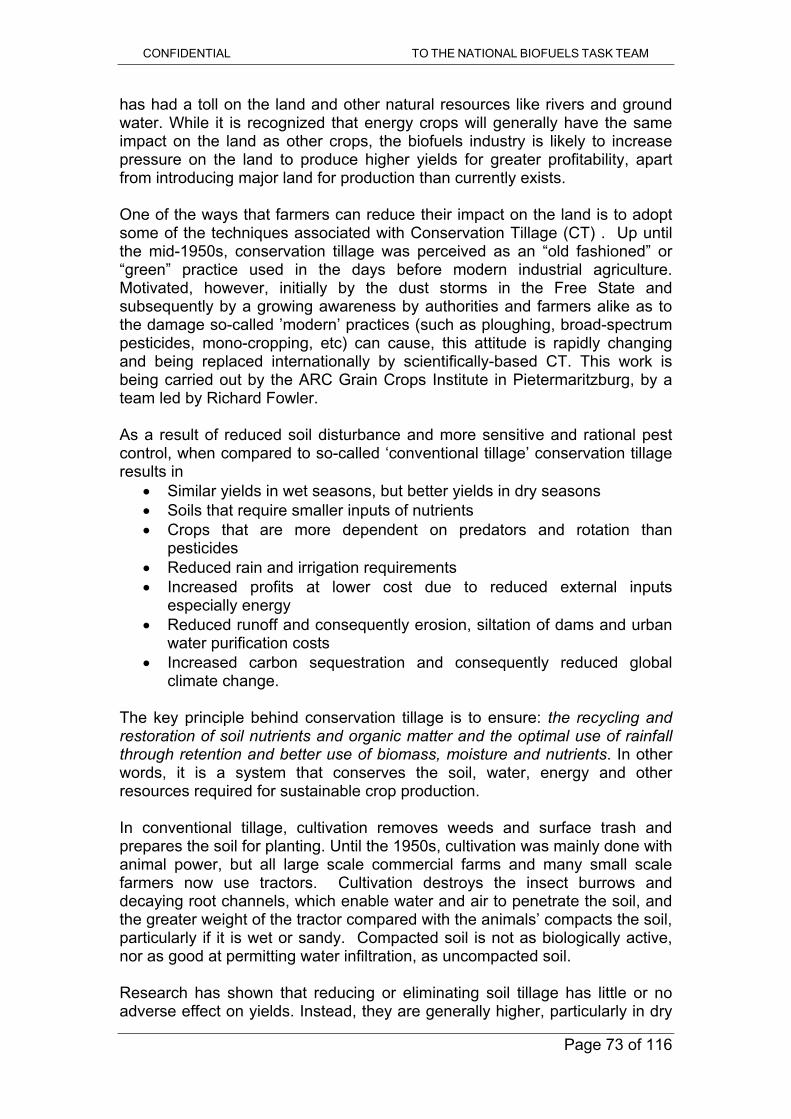
CONFIDENTIAL TO THE NATIONAL BIOFUELS TASK TEAM
Page 73 of 116
has had a toll on the land and other natural resources like rivers and ground water. While it is recognized that energy crops will generally have the same impact on the land as other crops, the biofuels industry is likely to increase pressure on the land to produce higher yields for greater profitability, apart from introducing major land for production than currently exists. One of the ways that farmers can reduce their impact on the land is to adopt some of the techniques associated with Conservation Tillage (CT) . Up until the mid-1950s, conservation tillage was perceived as an �“old fashioned�” or �“green�” practice used in the days before modern industrial agriculture. Motivated, however, initially by the dust storms in the Free State and subsequently by a growing awareness by authorities and farmers alike as to the damage so-called �’modern�’ practices (such as ploughing, broad-spectrum pesticides, mono-cropping, etc) can cause, this attitude is rapidly changing and being replaced internationally by scientifically-based CT. This work is being carried out by the ARC Grain Crops Institute in Pietermaritzburg, by a team led by Richard Fowler. As a result of reduced soil disturbance and more sensitive and rational pest control, when compared to so-called �‘conventional tillage�’ conservation tillage results in
Similar yields in wet seasons, but better yields in dry seasons Soils that require smaller inputs of nutrients Crops that are more dependent on predators and rotation than
pesticides Reduced rain and irrigation requirements Increased profits at lower cost due to reduced external inputs
especially energy Reduced runoff and consequently erosion, siltation of dams and urban
water purification costs Increased carbon sequestration and consequently reduced global
climate change. The key principle behind conservation tillage is to ensure: the recycling and restoration of soil nutrients and organic matter and the optimal use of rainfall through retention and better use of biomass, moisture and nutrients. In other words, it is a system that conserves the soil, water, energy and other resources required for sustainable crop production. In conventional tillage, cultivation removes weeds and surface trash and prepares the soil for planting. Until the 1950s, cultivation was mainly done with animal power, but all large scale commercial farms and many small scale farmers now use tractors. Cultivation destroys the insect burrows and decaying root channels, which enable water and air to penetrate the soil, and the greater weight of the tractor compared with the animals�’ compacts the soil, particularly if it is wet or sandy. Compacted soil is not as biologically active, nor as good at permitting water infiltration, as uncompacted soil. Research has shown that reducing or eliminating soil tillage has little or no adverse effect on yields. Instead, they are generally higher, particularly in dry

CONFIDENTIAL TO THE NATIONAL BIOFUELS TASK TEAM
Page 74 of 116
years. Most soil parameters are improved by less intensive tillage. Soil erosion is reduced, water infiltration and retention increased and farmers have the option of planting earlier if they wish. Moreover, no-till gives plants a firmer anchorage in the soil so that they are less affected by flooding or heavy winds. Especially with increased fuel prices, costs are markedly lower, so the system is more profitable. On the other hand, problems can arise with no till. One is that pests and diseases can survive over winter on the crop residues but build-ups can be avoided by using crop rotation. Weeds can also become a problem, and detractors say that minimum till results in the greater use of herbicides. However, mulching can smother weeds and hand hoeing, pulling or slashing with or without directed, target-specific herbicides can keep problems under control until the system is properly established and the natural control processes that were damaged by industrial farming are fully restored. A conversion period may be necessary for this. Conservation Agriculture (CA) is based on recognizing the living nature of soil and developing its full potential. Many modern farming practices, including mono-cropping and the application of fertilisers and pesticides, alter the balance of the micro-organisms in the soil, and intensive irrigation can cause leaching or a build-up of salinity. Physical and chemical soil limitations, such as: compaction; drainage; pH; P and K levels, should be corrected before conservation agriculture methods are fully applied. This is especially true in highly degraded or depleted soils where some sort of amelioration investment might be necessary to rehabilitate them. Things that need to be done might include: subsoiling to remove compaction; levelling; liming to neutralise the pH; planting green manure crops; and natural (such as guano or rock phosphate (preferable) or synthetic (only if unavoidable) fertilizers incorporated to correct nutrient deficiencies. Soils under Conservation Agriculture improve with time. This means the rate of degradation and erosion is less than the rate of soil build-up. For this reason even highly degraded soils improve and become productive under Conservation Agriculture. Soil cover is an important component of conservation farming. As two of the most important determinants of crop yield are soil moisture and temperature, the interaction between the two needs to be carefully managed to avoid extreme fluctuations. Providing soil cover not only prevents water evaporation but also builds up the soil's biological life and fertility and prevents soil erosion. Better soil cover can be achieved by two methods often practiced in tandem. In the first, crop residues left after harvest decompose during the fallow period, building up the nutrients in the soil while preventing the wind causing soil and drying out the soil. In the second, farmers plant green manure cover crops which can not only convert atmospheric nitrogen into forms available to crops, break compaction and �‘pump up�’ nutrients which have leached below crop rooting zones, etc, but also provide living and subsequently dead biomass which adds to the crop residue mulch. There are some surprising benefits, not least the ability of some mulches to reduce pest infestations. An example of this is the use of sunflower stalks with sugar cane.
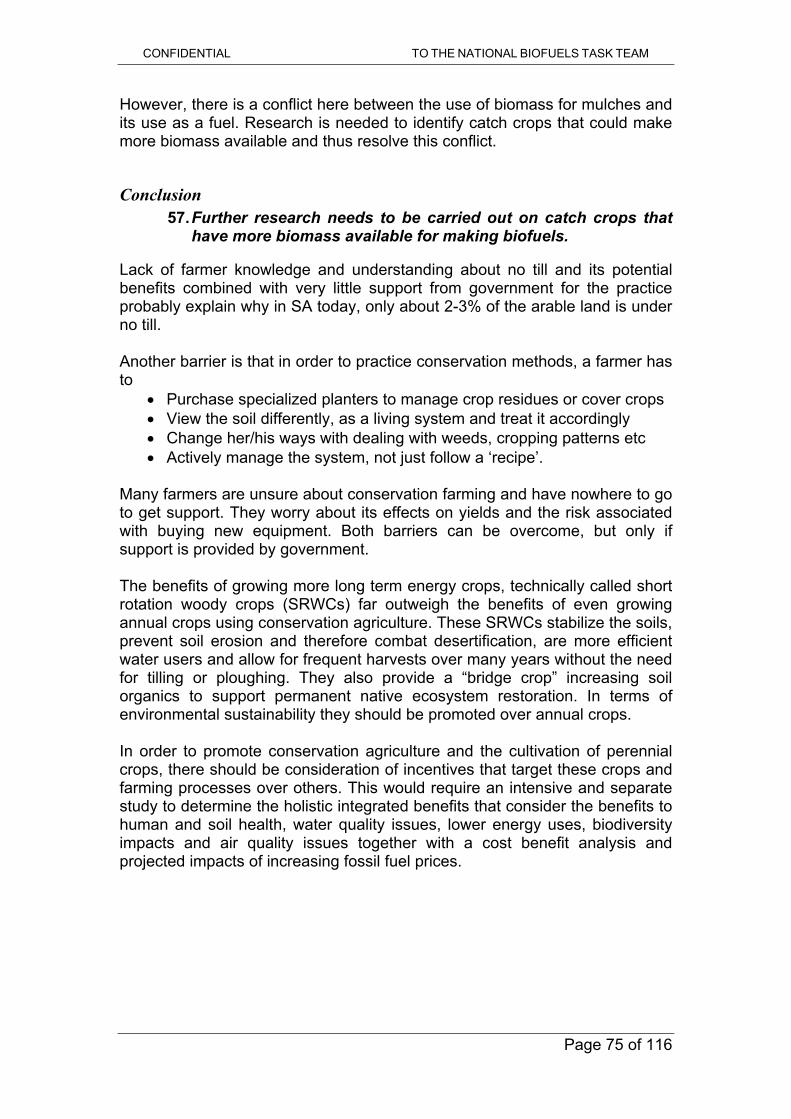
CONFIDENTIAL TO THE NATIONAL BIOFUELS TASK TEAM
Page 75 of 116
However, there is a conflict here between the use of biomass for mulches and its use as a fuel. Research is needed to identify catch crops that could make more biomass available and thus resolve this conflict.
Conclusion 57. Further research needs to be carried out on catch crops that
have more biomass available for making biofuels. Lack of farmer knowledge and understanding about no till and its potential benefits combined with very little support from government for the practice probably explain why in SA today, only about 2-3% of the arable land is under no till. Another barrier is that in order to practice conservation methods, a farmer has to
Purchase specialized planters to manage crop residues or cover crops View the soil differently, as a living system and treat it accordingly Change her/his ways with dealing with weeds, cropping patterns etc Actively manage the system, not just follow a �‘recipe�’.
Many farmers are unsure about conservation farming and have nowhere to go to get support. They worry about its effects on yields and the risk associated with buying new equipment. Both barriers can be overcome, but only if support is provided by government. The benefits of growing more long term energy crops, technically called short rotation woody crops (SRWCs) far outweigh the benefits of even growing annual crops using conservation agriculture. These SRWCs stabilize the soils, prevent soil erosion and therefore combat desertification, are more efficient water users and allow for frequent harvests over many years without the need for tilling or ploughing. They also provide a �“bridge crop�” increasing soil organics to support permanent native ecosystem restoration. In terms of environmental sustainability they should be promoted over annual crops. In order to promote conservation agriculture and the cultivation of perennial crops, there should be consideration of incentives that target these crops and farming processes over others. This would require an intensive and separate study to determine the holistic integrated benefits that consider the benefits to human and soil health, water quality issues, lower energy uses, biodiversity impacts and air quality issues together with a cost benefit analysis and projected impacts of increasing fossil fuel prices.
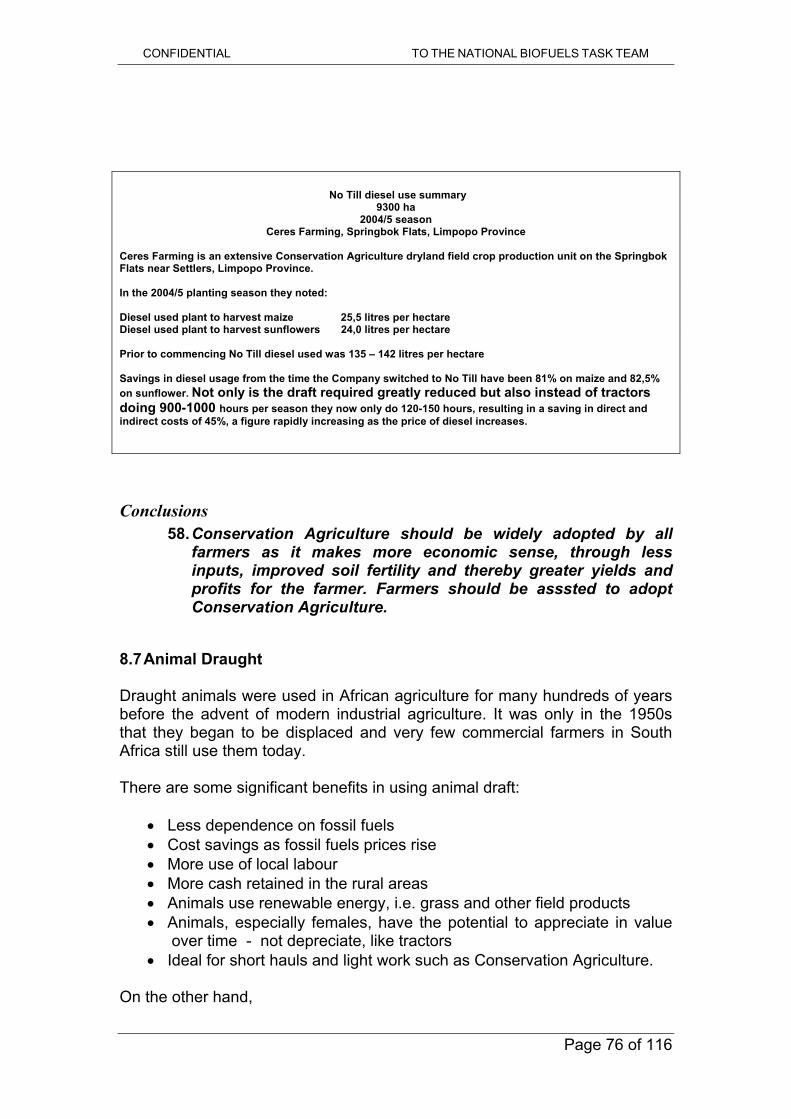
CONFIDENTIAL TO THE NATIONAL BIOFUELS TASK TEAM
Page 76 of 116
No Till diesel use summary
9300 ha 2004/5 season
Ceres Farming, Springbok Flats, Limpopo Province
Ceres Farming is an extensive Conservation Agriculture dryland field crop production unit on the Springbok Flats near Settlers, Limpopo Province. In the 2004/5 planting season they noted: Diesel used plant to harvest maize 25,5 litres per hectare Diesel used plant to harvest sunflowers 24,0 litres per hectare Prior to commencing No Till diesel used was 135 �– 142 litres per hectare Savings in diesel usage from the time the Company switched to No Till have been 81% on maize and 82,5% on sunflower. Not only is the draft required greatly reduced but also instead of tractors doing 900-1000 hours per season they now only do 120-150 hours, resulting in a saving in direct and indirect costs of 45%, a figure rapidly increasing as the price of diesel increases.
Conclusions 58. Conservation Agriculture should be widely adopted by all
farmers as it makes more economic sense, through less inputs, improved soil fertility and thereby greater yields and profits for the farmer. Farmers should be asssted to adopt Conservation Agriculture.
8.7 Animal Draught Draught animals were used in African agriculture for many hundreds of years before the advent of modern industrial agriculture. It was only in the 1950s that they began to be displaced and very few commercial farmers in South Africa still use them today. There are some significant benefits in using animal draft:
Less dependence on fossil fuels Cost savings as fossil fuels prices rise More use of local labour More cash retained in the rural areas Animals use renewable energy, i.e. grass and other field products Animals, especially females, have the potential to appreciate in value
over time - not depreciate, like tractors Ideal for short hauls and light work such as Conservation Agriculture.
On the other hand,

CONFIDENTIAL TO THE NATIONAL BIOFUELS TASK TEAM
Page 77 of 116
The time taken to perform an operation is longer and therefore needs
more labour In the ploughing season the animals are stretched to their limits and
their condition deteriorates. Minimum till would rectify this. Now that costs are changing, commercial farmers interested in moving to animal power are likely to look to work done in Western Europe where a range of new specialised horse machinery is being developed and produced for sale, and South America, where a number of animal drawn planters have been developed for no till. Some of these machines are purpose-built, single function implements such as rowcrop equipment or timber handing machinery and others, such as the hitchcart, provide a means of linking the horse or horses to existing tractor tooling. In many cases, this adaptation, like some of the new European developments, involves the use of small petrol or diesel engines to operate an implement while a team of horses actually pulls it along. This is instead of using "ground drive transmission", the rotation of the wheels to power the mechanism as traditional horse machinery used to do. This seemingly contradictory or even illogical combination of living and mechanical horsepower actually works very well. The size of the power unit involved is considerably smaller - and cheaper to buy and run and less polluting than the engine unit that would need to be used in a heavy, complex tractor which has to haul itself along as well as the implement to which it is attached.
Charlie Pinney, who pioneered the development of auxiliary-engine powered horse-drawn equipment on British farms, points out that �“The tractor is a single, indivisible device, capable of performing only one task, however complex, at a time. A big team of horses can together perform startling amounts of work one day and on the next, be subdivided into much smaller units to carry out a large number of different tasks at the same time, provided of course there are sufficient drivers available. The inherent flexibility offered by the big hitch system could be of immense value to future developments in horse farming. It is not too difficult to imagine local groups of small farms, each equipped with their own horse numbers adequate for the routine work on the individual holdings, combining those horses together to work as big teams to cover large tracts of land at key moments in the farming calendar such as harvest time or when big acreages have to be ploughed and sown.�”
The subsistence sector in South Africa uses more animals than the commercial one and a 1994 study done by the Development Bank of South Africa estimated that 500,000 oxen and 300 000 horses, donkeys and mules were being used by 40-80% of functional rural households. A study in the same year indicated that roughly 50% of functional rural households owned animal draft equipment. This made, and still makes sense because animal draft can provide good economic solutions for short hauls of 5-10kms and for light work like planting and weeding. For instance, for a rural South African household cultivating 1-5 hectares, it could today cost R 20 000/ha to buy a

CONFIDENTIAL TO THE NATIONAL BIOFUELS TASK TEAM
Page 78 of 116
tractor, R 400 �– R 2000 to hire a tractor and only R 4000 to buy an oxen and donkeys. In Europe and some other countries in Africa one of the main sources of animal traction is cows. These animals provide not only draft power when required but milk and calves as well. Ideally suited to the reduced draft requirements of Conservation Agriculture, utilisation of females would both reduce the pressure on often scarce grazing resources but could provide owners with draft power as and when required (obviating the need to wait for a contractor) at a possible negative cost.
Cow-power In 1992, members of the South African Network for Animal Traction SANAT attending an Animal Traction Network of Eastern & Southern Africa ATNESA Conference in Tanga, Tanzania, visited a small scale farmer using animal draft power. This gentleman, recognising the limited extent to which draft power is required on many farms, had bought two crossbred dairy heifers, which he was stall feeding (using bana grass grown on the farm and hauled to the stall by the heifers themselves). When required to plough, harrow or weed his 5 hectares; haul feed for themselves; or take produce to market, the family to go shopping, or whatever, they would do so, but for the rest of the time (most of the year) they produced milk and calves, more than paying for their keep as they did so and resulting in a NETT PROFIT for their owner, even when he included no cost for the farm work that they did.
R.M.Fowler
In the small scale farming sector, those who use tractors generally hire them from local contractors. These contractors do not have set fees for a particular size field or specific operation and their prices vary widely, often anywhere between R400 and R3000 per hectare per operation, and even at these prices contractors, due to limited areas etc, seldom cover both variable and fixed costs. In the analysis of the Eastern Cape�’s Massive Food Programme, described in the small scale farming section, the use of these contractors is seen as one of the hurdles small scale farmers have to clear to become profitable. A tractor uses most of its fuel when turning and travelling and, as most of the small scale farmers are producing on small pieces of land often far apart from one another and totalling only 1 �– 5 ha, this makes them less energy efficient than when used on the bigger fields of a commercial farm. With the increase in the price of fossil fuels, the use of tractors on small plots will become more expensive making it more attractive to use no-till techniques or draft animals. Some barriers will have to be overcome for animal draft to become acceptable, however. Among them are:
The lack of a commonly-accepted hiring system for animal-powered farm work like the one used with the tractors in the communally farmed areas.

CONFIDENTIAL TO THE NATIONAL BIOFUELS TASK TEAM
Page 79 of 116
The frequent unwillingness by and lack of an accepted financing system for animal draft power units in relevant institutions
Expertise in animal draft is dying out and government is not supporting its further development
Cultural/gender issues related to the using of some animal species by women
The widespread negative opinion of animal draft. In addition, the opinion is often expressed that there is insufficient grazing available for the animals, which would be required. However when it is
remembered that much of the biomass produced on our grazing areas is currently being burnt in winter; and
that much of the balance is being consumed in summer by unproductive castrates;
proper soil/crop husbandry (especially if incorporating Conservation Agriculture) in many areas could quadruple crop and hence biomass production
It will be appreciated that there could be, if there is not already, more than sufficient biomass for animal feed and crop mulching. If its benefits were taken more seriously and negative perceptions removed, therefore, animal power could provide a cost effective solution to higher energy prices for all farmers, large and small. With cheap energy, tractor farming was the only profitable way to farm but, as energy prices have risen, the least cost combination of labour, energy and capital equipment (which can be considered to be embodied energy) will change too and farmers will need to adjust their inputs to stay in business. This will apply even if a commercial farm or a farming community can produce all its own energy from its own resources, because the energy it produces will have an off-farm value, an opportunity cost, and if it is not used on the farm it will find a market elsewhere. In general, farms and farming communities will move towards lower-external-input types of agriculture as energy prices increase. They will do more for themselves, with the result that a higher proportion of the income that they receive from sales will stay on the farm or within the local area. This extra income retention will allow more labour to be employed. Key to this will be the rapid adoption by South African farmers, large and small, of Conservation farming i.e. the adoption and practice of livestock production (i.e. Conservation Husbandry) in tandem with cropping (i.e. Conservation Tillage). Whereas Conservation Tillage can be said to include all those systems which aim to conserve natural and/or other resources required for crop production, Conservation Agriculture has been defined as all those cropping systems which involve minimal soil disturbance, permanent soil cover and different plant species (preferably in rotation). The simultaneous incorporation of these three principles has resulted in Conservation Agriculture being accepted internationally as the optimum cropping system.
Conclusion

CONFIDENTIAL TO THE NATIONAL BIOFUELS TASK TEAM
Page 80 of 116
59. Animal draught could be revitalized in South Africa as a possible means to improve farming profitability.
8.8 Biodiversity
The Convention on Biological Diversity to which South Africa is a signatory, seeks to ensure the preservation and sustainable use of the biodiversity in the world. This is a challenge when faced with increased needs to develop land for human occupation and additionally for other human activities. The world will need to feed an additional 3 billion people by 2050 if the rate of population growth projects accurately into the future. The WWF has developed a sophisticated tool that enables us to determine people impact on earth. It is called ecological footprinting and it gives an idea of how we as humans are overusing the earth�’s resources in keeping up our lifestyles.
Figure 7: South Africa�’s ecological foot print over time
Ecological footprinting The ecological foot print is a resource management tool that measures how much land, water and atmosphere a human population requires to produce the resources it consumes and to absorb its waste with the existing technologies it has. A fair share of the earth resources was estimated by WWF to be 1.8 ha /per person of arable land in the world. The average South African footprint shows that every person is using 4.02 ha/per person, which is more than double the earth�’s carrying capacity. In other words, if everyone on earth lived like the average South African we would need two earths to support those people. Today humanity�’s total ecological footprint is 23% larger than what the planet can provide. When we measure the ecological footprint of a country we can estimate its overshoot and so devise strategies to reduce the footprint. In a country like South Africa it is important to do ecological footprints of different areas in order to determine the equitable distribution and use of resources and thus devise equitable strategies. For instance a recent Cape Town study showed that the footprint of some of the wealthiest suburbs is 14 times what the earth can provide whereas the poorer suburbs had footprints that indicated that they were living within their fair share of the earth�’s resources. Planet Earth�’s Productive Capacity: this is the amount of the land we have to use for our own purposes. We need to leave land and water aside for nature, the ecological good.
Demand
2.0

CONFIDENTIAL TO THE NATIONAL BIOFUELS TASK TEAM
Page 81 of 116
We could view biodiversity and the challenges it brings as an opportunity rather than and opportunity loss or cost. For instance, diversified farms, where a variety of crops are grown, are usually more economically and ecologically resilient. Monoculture farming has advantages in terms of efficiency of harvesting and ease of management, the loss of the crop in any one year could put a farm out of business and/or seriously disrupt the stability of a community dependent on that crop. Diversifying your crop base by growing a variety of crops can assist a farmer to spread her/his economic risk. It also makes the farmer less susceptible to the radical price fluctuations associated with changes in supply and demand.
Diversity can also assist with adopting conservation agriculture described in a section above and in this way buffer a farm in a biological sense. As mentioned, in annual cropping systems, crop rotation can be used to suppress weeds, pathogens and insect pests and cover crops can have stabilizing effects on the agro-ecosystem by holding soil and nutrients in place, conserving soil moisture and increasing the water infiltration rate and soil water holding capacity. Cover crops of trees and short rotation woody crops can buffer the system against pest infestations by increasing beneficial arthropod populations and can therefore reduce the need for chemical inputs. Using a variety of cover crops is also important in order to protect against the failure of a particular species to grow and thus attract and sustain a wide range of beneficial arthropods.
Optimum diversity may be obtained by integrating both crops and livestock in the same farming operation. This was the common practice for centuries until the mid-1900s when technology, government policy and economics compelled farms to become more specialized. Mixed crop and livestock operations have several advantages. First, growing row crops only on more level land and pasture or forages on steeper slopes will reduce soil erosion. Second, pasture and forage crops in rotation enhance soil quality and reduce erosion; livestock manure, in turn, contributes to soil fertility. Third, livestock can buffer the negative impacts of low rainfall periods by consuming crop residue that in

CONFIDENTIAL TO THE NATIONAL BIOFUELS TASK TEAM
Page 82 of 116
"plant only" systems would have been considered crop failures. Finally, feeding and marketing are flexible in animal production systems. This can help cushion farmers against trade and price fluctuations and, in conjunction with cropping operations, make more efficient use of farm labour.
Conclusion 60. Diversified farming is better than monocropping as it protects
the farmer economically and protects her natural resource base on which the faming systems depends. It should be promoted over monocropping both at a farm level and at the field level.
This type of farming is particularly useful for the small scale farmer. It allows the farmer to maintain her household food security while at the same time diversifying her range of farming products. Jatropha curcas for instance, makes a suitable �“living hedge�” as the leaves are poisonous and so it can keep animals within enclosed areas. Diversification of crops enables diversification of co-products, which as we saw in the small scale farmers�’ section is critical to the ability for biofuels to provide benefits to the farmer. These benefits do not accrue in a mono-crop situation. Examples could include crops not considered within this strategy such as hemp that not only provides some oil, more biomass per ha than other crops but also its co-products are textiles, building materials that are stronger than cement, medicines, soaps and many more.
Studies also need to be carried out to determine the extent of loss of land that is currently not protected under the conservation laws, but nonetheless has conservation and biodiversity value. If we extend the biofuels industry to land that is not arable through the perennial crops strategy, we may encroach on such land and impact on other sensitive areas like wetlands and riparian areas. SANBI should be authorised to carry out these studies on an integrated basis.
The greatest diversity in a farm can be created by establishing patches of �“food forest�” a type of permaculture promoted by Robert Hart but known for centuries in peasant communities around the world. The forest consists of seven layers 1. Large fruit and nut trees.
2. Lower trees 3. Layer of shrubs 4. Layer of herbs 5. Root layer 6. Ground cover layer 7. Vertical layer - climbing vines
In this way you avoid monocropping and encourage muticropping that benefits more than just the energy buyer but also the household and the local community.

CONFIDENTIAL TO THE NATIONAL BIOFUELS TASK TEAM
Page 83 of 116
Biodiversity may be more threatened through the development of the so called �“second generation�” of biofuels, such as those from the cellulosic-lignin technologies. In the case grasslands could become targets for energy crops like elephant grass or indeed our own native grasses already growing in these areas.
The use of genetically modified crops should be carefully considered within this process. Although farmers report increased yields, this is often accompanied by increased use of pesticides, a side effect of the pesticide resistant genes cloned into the crops. This can increase the ecological impacts of industrial agriculture and in this way affect water quality in rural areas. As GM seeds need to be purchased each year, this moves farmers away from the indigenous practice of saving seeds and there are some that say that this is starting to impact on biodiversity as we are losing seed varieties that have been suitable for growing in the region for centuries. These varieties may turn out to be important in the future as drought resistant crops, varieties with greater biomass potential or even hardier crops that can withstand the climate variability we expect to encounter over the next couple of decades. There is a growing movement of people that wants to avoid ingesting food derived from GM crops and despite the fact that energy crops are processed to make biofuels, the co-products are generally used as animal feed and thus will end up in the food chain. If standardized labelling for GM carrying food stuffs becomes mandatory, this will make for a very complicated separation process for farmers and feedstock providers.
Conclusion 61. Biodiversity can be threatened by the way an industrial
biofuels strategy is rolled out. Monocropping, use of pesticides, release of GM crops into the environment, all impact negatively from current agricultural practices and an expansion of cultivation will expand the problem.
Recommendation 62. Analysis of the potential impact of expansion of the cultivation
areas in South Africa on biodiversity should be undertaken.
8.9 Conclusions The greatest threat the biofuels industry will have on our environment is the potential to expand our cultivated land hectarage. Assuming that this expanded land will be cultivated using industrial agricultural practices; this will mean that the existing problems caused by these practices will be increased. These include, but are not limited to: air quality issues from the use of pesticides; soil erosion from the overuse of chemical fertilizers; wastage of water through poor irrigation practices; and other issues like salination and ground water pollution which result in a diminishment of our natural resources and biodiversity in quality and quantity. Apart from this, it is likely that expansion will take place into areas that are currently rich with biodiversity and part of our ecological reserve. An industrial biofuels strategy will also mean that more processing plants will be developed and while this may have

CONFIDENTIAL TO THE NATIONAL BIOFUELS TASK TEAM
Page 84 of 116
social and economic benefits, the ecological impacts need to be managed carefully. But over the past few decades we have researched these impacts sufficiently to be able to find ways to manage them. Research is indicating that farming methods like conservation agriculture and conservation tillage have far reaching benefits over and above the ecological benefits. We need to consider adopting these farming techniques generally. This will mean that we use less energy on our farms thereby improving both profitability and reduce greenhouse gas emissions as well as the other benefits mentioned above.
Conclusions 63. EIA�’s to continue to be mandatory for industrial biofuels
processing plants. However, a simplified and/or standardised process could be developed, and this could include ceratin exemptions, particularly for small plants.

CONFIDENTIAL TO THE NATIONAL BIOFUELS TASK TEAM
Page 85 of 116
9 BIOFUELS INDUSTRY COMMUNICATION STRATEGY As part of the introduction of the Biofuels Industry a Communication Plan has to be formulated. The purpose of this document is to commence planning and implementation of the Communication Strategy supporting the roll-out of the Biofuels Industrial Strategy. Once a Cabinet position is approved, the Biofuels Task Team, chaired by DME, should establish a communication team to share the national strategy and to facilitate input by stakeholders. This task team should address the following:
The target audience:
Oil companies, including refineries and wholesalers Fuel Retailers Motor vehicle manufacturers and marketers The Automobile Association Motorists Taxi Associations Civil Society Logistics providers, including Petronet for pipelines, depots and transport groupings Feed stock producers Construction, equipment, suppliers & maintenance
The media for sending messages:
Newsletters Internet Road shows Workshops
The content of the messages:
Awareness of Biofuels Understanding the advantages attached to the use of Biofuels Contribution of Biofuels towards environmental management Explanation of the macro and micro economic advantages of Biofuels Job creation possibilities The dangers of alcohol abuse and measures to avoid this
Timeframes:
The following messages are proposed as of immediate and urgent priority to be communicated at a high-level of detail:

CONFIDENTIAL TO THE NATIONAL BIOFUELS TASK TEAM
Page 86 of 116
Current industrial strategy study finding and recommendations, including job creation, economic growth support, incentives, environmental issues
The above messages are proposed as medium-term (next 6 months) priorities. They are to be communicated with a greater level of detail. Ongoing messages to be communicated in terms of a schedule still to be developed that is coordinated with the overall Biofuels implementation plan.
9.1 Immediate Actions/ Tasks The table hereunder depicts a framework within which the most immediate actions or tasks should be undertaken in. The trigger for each action is the message to be communicated. This is followed by the chosen target audience, the relevant content, the applicable sender, the required media to be used to convey the message and finally the timeframe for each message to be delivered. Table 22: Communication Task Framework
Aim of Message Target
Audience Content Sender Media Timeframe
To inform the SA Community of the need and relevancy of Biofuels Industry
SA Community General press statement on the need and relevancy of the Biofuels Industry
Minister of Minerals and Energy
To be decided
To be decided
To inform the SA Energy Community of the need and relevancy of Biofuels Industry
Oil companies Refineries Wholesalers Retailers Motor vehicle manufacturers
Details of the need, technical aspects, economic prospects, financial management issues, job creation and potential impact upon the Energy Community
Cabinet, Minister of Minerals and Energy, Biofuels Task Team
To be decided
To be decided
To inform the SA Commercial Agricultural Community of the need and relevancy the of Biofuels Industry
Commercial feed stack growers
Details of the need, technical aspects, economic prospects, financial management issues, job creation and potential impact upon the SA Commercial Agricultural Community
Minister of Minerals and Energy and Minister of Agriculture
To be decided
To be decided
To inform the SA Emerging Agricultural Community of the need and relevancy of the Biofuels Industry
Emerging feed stack growers
Details of the need, technical aspects, economic prospects, financial management issues, job creation and potential impact upon the SA Commercial Agricultural Community
Minister of Minerals and Energy and Minister of Agriculture
To be decided
To be decided

CONFIDENTIAL TO THE NATIONAL BIOFUELS TASK TEAM
Page 87 of 116
Aim of Message Target Audience
Content Sender Media Timeframe
To inform the end-user of energy of the need and relevancy of the Biofuels Industry
Motor vehicle manufacturers The Automobile Association Motorists Taxi Associations
Details of the need, technical aspects, economic prospects, financial management issues, job creation and potential impact upon the SA Commercial Agricultural Community
Cabinet, Minister of Minerals and Energy, Biofuels Task Team
To be decided
To be decided
To debrief FM Stakeholders on issues covered in previous communication initiatives Regular messages on developments, linked to messages from the Cabinet and other senior government policy makers
SA Community SA Community
Trough meetings, debriefing sessions and focus group meetings, determining message uptake and comprehension of a simple sample of adequate statistical relevancy
Cabinet, Minister of Minerals and Energy, Minister of Agriculture, Biofuels Task Team
To be decided To be decided
To be decided To be decided
9.2 Stakeholder Analysis The table hereunder reflects an overview of the Biofuels Stakeholders. The matrix indicates the various stakeholders, followed by some relevant comments of their role within the Biofuels industry, as well as the impact thereof on them. The final column deals with proposed actions relating to each Stakeholder, which will have a positive effect and obtain buy-in for the industry.

CONFIDENTIAL TO THE NATIONAL BIOFUELS TASK TEAM
Page 88 of 116
Table 23: Biofuel Industry Stakeholder Analysis
Stakeholder Comments Actions Required
1 Oil companies Need to manage, and need DME support.
2 Refineries Overcapacity of petrol, Sasol Secunda & PetroSA, means that they could be commercially harmed. Note: LPO January 2006 has major negative impact on their profitability, as SA incorrectly has BFOP for leaded that is much cheaper to make, the same as for unleaded.
Need to agree equal misery (loss of refining margins) by all SA refineries. Needs DME support. The major change of January 2006 and perceptions need to be managed, and ethanol can be used both positively and negatively. The risk is high that oil companies will be negatively effected - as lower refining throughput (margins) and government & others gets more input & insight into their industry.
3 Wholesalers Will need to blend at depots. Some minor cost, of cpl. Some minor costs with water ingress control and fire fighting foams & systems in cases.
4 Retailers No impact Must prevent water ingress and dip for water when converting. Cleans systems and reduces corrosion, but may require some initial cleaning handling, such as filters.
5 Motor manufacturers (NAAMSA)
World Wide Fuel Charter accepts E10. They have some reluctance to accept fuel changes and ethanol, but reluctance is far greater for MMT and ferrocene.
Need to manage them and need DME support.
6 Automobile Association (AA of SA)
Will support local production. Need to be involved in communication.

CONFIDENTIAL TO THE NATIONAL BIOFUELS TASK TEAM
Page 89 of 116
7 Motorists No negatives. Should also support local production & jobs. Note: Motorists are negatively impacted by LPO as of Jan 2006, due to paying more at the pump overall �– and at present they are concerned about the impact the new fuels will have on their old motor cars. This will be a major source of problems if the realities, perceptions, and expectations are not very carefully managed. Clearly the Oil Companies will be jockeying for marketing positions as well as trying to slice more refining margins into their pockets, so we can expect they will be lobbying this group extensively both collectively as well as against each other.
Inform them of octane benefit, i.e. clean & locally produced ethanol for lead. �– they will pay more
8 Taxi Associations No negative impact. Perhaps try and link incentives.
DoT support
9 Citizens (people) Take care to avoid drinking. Need to denature (blend with petrol) and also ensure controls from bio-ethanol plant to fuel blenders. This can be achieved by linking to the fuel levy payback.
10 Logistics Distributed plants so short logistics to closest depots.
11 Pipeline Can be transported. May need initial flush as removes rust/corrosion particles.
Need to involve in optimizing logistics.
12 Depots Will do blending. Needs some systems
13 Transport groupings
Increased transport to plants & ex plants to depots
14 Feed stock producers
Increased demand, so more crops and jobs.
15 Construction, equipment suppliers & maintenance
Some increased local jobs
16 DME Cleaner fuels supported Supply security Renewables �– creates ethanol available for gel fuel too

CONFIDENTIAL TO THE NATIONAL BIOFUELS TASK TEAM
Page 90 of 116
17 DST Reduces crude oil reliance Increases technology �– processing, crops Support
18 The dti Increases economy, so support 19 DEAT Improves local air quality &
reduces GHG so support
20 National Treasury
BOP improved Reduced impact of high oil prices
Need to get incentives supported based on macro-economic gains & that Fiscus no worse off.
21 SABS Biofuels can be off-specification and can cause vehicle damage.
Establish a network of biofuel testing and plant certification inspectors, or quality programmes.
22 SARS Ensure registration and control of fuel ethanol producers, and in fact all ethanol producers.
23 DoH Methanol and ethanol consumption can have negative health effects.
Ensure that producers have licences and control access to ethanol and methanol.
24 D Labour Jobs, so support 25 D Agric More demand, so jobs more
secure, good prices - hence support
Make sure that benefit accrues to small growers, and support emerging growers to become suppliers.
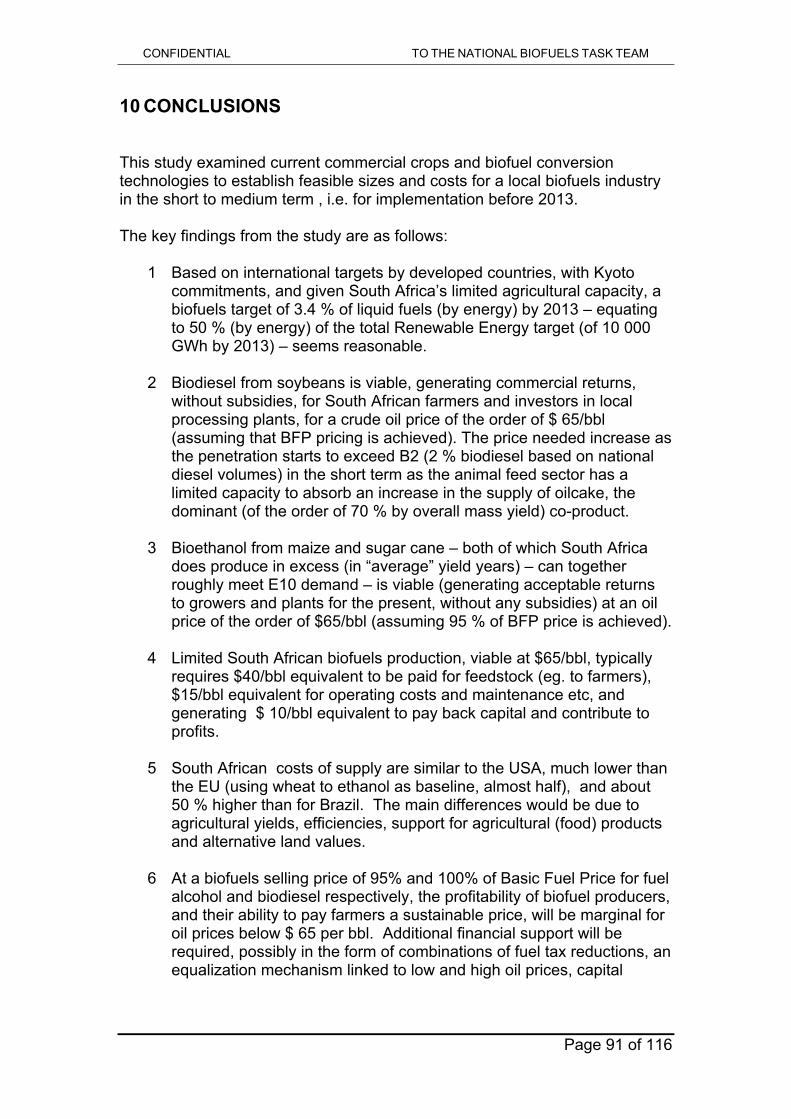
CONFIDENTIAL TO THE NATIONAL BIOFUELS TASK TEAM
Page 91 of 116
10 CONCLUSIONS This study examined current commercial crops and biofuel conversion technologies to establish feasible sizes and costs for a local biofuels industry in the short to medium term , i.e. for implementation before 2013. The key findings from the study are as follows:
1 Based on international targets by developed countries, with Kyoto commitments, and given South Africa�’s limited agricultural capacity, a biofuels target of 3.4 % of liquid fuels (by energy) by 2013 �– equating to 50 % (by energy) of the total Renewable Energy target (of 10 000 GWh by 2013) �– seems reasonable.
2 Biodiesel from soybeans is viable, generating commercial returns,
without subsidies, for South African farmers and investors in local processing plants, for a crude oil price of the order of $ 65/bbl (assuming that BFP pricing is achieved). The price needed increase as the penetration starts to exceed B2 (2 % biodiesel based on national diesel volumes) in the short term as the animal feed sector has a limited capacity to absorb an increase in the supply of oilcake, the dominant (of the order of 70 % by overall mass yield) co-product.
3 Bioethanol from maize and sugar cane �– both of which South Africa
does produce in excess (in �“average�” yield years) �– can together roughly meet E10 demand �– is viable (generating acceptable returns to growers and plants for the present, without any subsidies) at an oil price of the order of $65/bbl (assuming 95 % of BFP price is achieved).
4 Limited South African biofuels production, viable at $65/bbl, typically
requires $40/bbl equivalent to be paid for feedstock (eg. to farmers), $15/bbl equivalent for operating costs and maintenance etc, and generating $ 10/bbl equivalent to pay back capital and contribute to profits.
5 South African costs of supply are similar to the USA, much lower than
the EU (using wheat to ethanol as baseline, almost half), and about 50 % higher than for Brazil. The main differences would be due to agricultural yields, efficiencies, support for agricultural (food) products and alternative land values.
6 At a biofuels selling price of 95% and 100% of Basic Fuel Price for fuel
alcohol and biodiesel respectively, the profitability of biofuel producers, and their ability to pay farmers a sustainable price, will be marginal for oil prices below $ 65 per bbl. Additional financial support will be required, possibly in the form of combinations of fuel tax reductions, an equalization mechanism linked to low and high oil prices, capital

CONFIDENTIAL TO THE NATIONAL BIOFUELS TASK TEAM
Page 92 of 116
subsidies, and accelerated depreciation allowances to encourage investment.
7 The establishment of a biofuels industry with E8 and B2 blend targets
seems practically and economically viable given a moderate (equal to current biodiesel fuel tax exemption) level of support and assuming an average oil price of $55/bbl. This average price going forward is a reasonable assumption, but fluctuations, that could result in prices as low as $ 35/bbl, means that this risks would need to be negated by investors, probably by some form of hedging. E8 and B2 level of biofuel production equates to 75 % of the 2013 Renewable Energy target, and represents 4.5 % of total liquid fuels use.
8 Establishment of such a biofuel industry (E8 and B2) would generate:
R1 700 million in domestic product, which constitutes 0, 11% of
the current GDP, or ca. 6 % of the AsgiSA target of a 2 % increase in economic growth pa.
55 000 additional jobs, or a reduction in unemployment of 1.25
%.
A net increase of ±R1 700 million per annum in household income throughout the South African economy.
A net reduction of the current account deficit to the value of ca.
R3 700 million per annum.
The total investment made in biofuels production capacity would be about R 4 000 million.
This would have a significant impact on the Fiscus, if fuel tax
reductions are allowed. For a 40 % fuel levy reduction the nett loss to the Fiscus would be of the order of R 350 mil pa. This depends on specific scenarios, such as the oil price and the tax impacts thereof. This is ca R 6600 per job, and would increase for a 100 % fuel levy reduction to ca R 22 000 per job. To ensure the Fiscus is no worse off, the fuel tax could be increased by 1.75 % (ca 2 SA cpl) for the current 40 % fuel levy reduction, and 5.6 % (ca 6 SA cpl) for a 100 % fuel levy reduction.
9 The current fuel levy exemption for biodiesel of 40 % equates to direct
support of jobs at a cost of R 10500 per job. The current 100 % fuel levy reduction for small producers (less than 300 000 litres pa) equates to R 12000 direct support per job. To equalise the cost-benefit as regards jobs, the fuel levy reduction for larger biodiesel plants should be increased to 50 %.

CONFIDENTIAL TO THE NATIONAL BIOFUELS TASK TEAM
Page 93 of 116
10 Motorists, that are mainly upper income 1st economy participants, support fuel retail attendant jobs at a cost of R 20 000 per job pa. To provide the same level of support for jobs for biofuels would equate to raising the fuel levy exemption for biodiesel to 75 %.
11 Bioethanol has roughly 70 % of the energy content of biodiesel, on a
per litre basis for which fuel levy exemptions apply, so given fairness as regards support to renewable energy, the fuel levy reduction of bio-ethanol should be 70 % of that for biodiesel.
12 Indigenous biofuel production should not be unfairly supported over
other indigenous renewable energy projects, such as wind, wave and cogeneration of electricity using biomass, which have similar externality benefits. A fuel levy exemption of 50 % for biodiesel, which corresponds to roughly $ 10/bbl crude oil, is also equal to support for renewable electricity of 13.5 SA c/kWh over fossil- or coal-based electricity. (This level can be compared to the CDM credit that could apply for a biofuel plants, but has not yet been agreed at the UNFCC, which varies from under 1$/bbl for maize to 4$/bbl for sugar cane.)
13 A 4.5 % biofuel contribution to total liquid fuels use would do little for
supply security, as consumption growth typically cancels this out in a matter of two years.
14 Neighbouring SADC countries have a greater biofuel production
potential, as they have more arable land and more available water. Biofuel production in SADC will improve the regional economy and provide improved regional supply security and diversity. South Africa is the leader in the region and represents the major market. A national biofuel programme would be supportive of a regional biofuel programme, and this should be include harmonisation of regional fuel specifications.
15 Future fuel specifications development should integrate opportunities
for biofuels via a supportive framework, and must be an integral part of determining future clean fuels programmes.
16 Given South Africa�’s limited agricultural land and water availability, it is
important to guard against an over-investment in biofuel production. Rather, a healthy balance between the production of food and fuel is needed, and this should guide the level of incentives provided. A biodiesel fuel tax exemption of 50 % ($ 10/bbl crude oil equivalent) appears justified based on the direct tax incentive cost of creating a job of R 12 000, and a level of up to 75 % ($ 15/bbl crude oil equivalent) based on a cost of jobs of R 20 000, of the same level as the cost of petrol retail forecourt jobs, is also justified. Given the need to avoid over-investment, and excessive costs of support to the Fiscus, and that the level of incentive, of 40 % or the proposed 50 % fuel levy exemption, may not be sufficient to support the establishment of an optimum level (based on macro-economics) biofuels industry, the level
CONFIDENTIAL TO THE NATIONAL BIOFUELS TASK TEAM
Page 94 of 116
of fuel levy exemption incentive should be gradually raised (at the annual budget) until such optimum investment (or biofuels industry size) is achieved.
17 However, once investments are made, and particularly when capital is
paid off and operating efficiencies are improved, the level of fuel tax incentive can be reduced, for example as part of the annual budget. To encourage the formation of an infant biofuels industry, the incentives should be fixed for period, of say 5 years for investors. This could be tied to particular targets and the reaching thereof.
18 There is a natural opportunity to hedge between South African fuel
users and biofuel producers when oil prices (in Rands) are high or low and this beneficial opportunity could be utilised. This will reduce risk for investment in biofuels production by providing a hedge. This is an additional option and a very powerful means for supporting the establishment of biofuels production.
19 Internationally, waste cooking oil is generally the first and most
economic source for production of biodiesel. (Given the generally poorer stability and propensity to polymerise, which leads to deposits, this production requires more stringent controls.) This has limited application in South Africa, as used cooking oil, despite its certain carcinogenic risks, is often sold as �“new�” oil to the poor in the townships, at high (relative to the value as biodiesel feedstock) prices.
20 The use of illuminating paraffin is subsidised as the fuel is exempt from
fuel taxes and VAT. This subsidisation ignores the massive externality costs of between R 1 billion to R 100 billion pa incurred in the use of the fuel due to ingestion (of the order of 20 %) and fires (of the order of 70 % contribution to externality costs). The externality cost penalty on illuminating paraffin should therefore be between R 2/liter to R 200/liter. As a result of the absence of such an externality cost on illuminating paraffin, ethanol as gel fuel is not receiving the favourable and equitable treatment it deserves.
21 Any incentive for biofuels works its way down the value chain, as
consumers are not offered biofuels at cheaper prices than mineral based fuels, given that they are substituted (at least at the up to E10 and B5 levels that may be realised in South Africa in the short to medium term). They thus are mainly agricultural incentives, where of the order of 65 % of the value is captured.
22 It will be difficult to develop a programme that enables significant
amounts of biofuels to be produced by small-scale subsistence farmers unless changes to farming practices and specific programmes are implemented. This has challenges, as interventions over the past decade aimed at increasing yields of crops like maize on communally owned land have been dogged with problems and failures.

CONFIDENTIAL TO THE NATIONAL BIOFUELS TASK TEAM
Page 95 of 116
23 Internationally successful biofuels programme implementation have had government co-ordination generally, including communication, and review.

CONFIDENTIAL TO THE NATIONAL BIOFUELS TASK TEAM
Page 96 of 116
11 RECOMMENDATIONS
On the basis of the findings, the following recommendations are made. 1. Develop incentives and regulations that enable biofuels
producers in regions to be able to supply the oil industry. The oil industry to then blends up to E10 and up to B5 market penetration levels. This support to continue until the fledgling biofuels production industry obtains a 5 % market share (based on national volumes of petrol and diesel). This can be supported by selective niche uses at higher levels, such as E85 and B100, where there are additional benefits, such as indoor forklifts and underground mining, where the reduced emissions result in health benefits.
2. Ethanol Gel fuel as safe IP substitute
An additional example of a niche application, may be ethanol gel programmes to replace IP, where major health benefits can arise. This should be tackled as a separate intervention as part of an existing Ministerial Directive aimed at reducing the health harm of domestic IP use. At the least, in the absence of an illuminating paraffin (IP) tax, a mechanism should be created to incentivise ethanol for ethanol gel use, thereby giving it the same advantage over petrol as IP enjoys. To assist the mainly low-income users of IP, this could be covered by adding a small tax to petrol and diesel sales, mainly used by the more wealthy. The oil industry should provide inputs to such a scheme. For instance, to favour ethanol , for ethanol gel, over IP, to the same degree as ethanol over petrol, would involve a 1 cpl increase in the petrol and diesel fuel levies allocated to ethanol gel or to safe IP alternatives. Given that the Road Accident Fund, which caters for three times as many deaths as are due to IP use, receives a 36.5 cpl tax, a tax of up to 12 times (or 12 SA cpl) would be equitable for supporting safe alternatives to IP.
3. Government should avoid over-subsidising energy crops and
biofuel production, and incentives should be able to be adjusted as part of the annual budget. It is, however, proposed that where possible that these mechanisms be fixed for five years to provide more certainty to investors, as part of the kick-start to establish the industry. The fuel levy exemption for biodiesel should be raised from 40 to 50 %, based on equitable support of job creation compared to small plants. This can over time justifiably be raised, if this is necessary to stimulate investment to reach a 5 % biofuels target, to a 75 % fuel levy exemption. The costs of such support, could be recovered by the Fiscus to be nett neutral, by adding to the fuel levy 0.6 cpl per 10 % fuel levy increase for biofuels penetration up to 5 %.
4. Bioethanol and biodiesel selling prices should be regulated at
95% and 100% of Basic Fuel Price respectively until invested capital has been recovered, and market access has been

CONFIDENTIAL TO THE NATIONAL BIOFUELS TASK TEAM
Page 97 of 116
provided by the oil industry at up to 5 % biofuels on a national basis. Oil depots (wholesalers) retain 5 % of the petrol BFP for ethanol handling to cover costs. Oil company wholesalers should accommodate and pay for ethanol and biodiesel according to their national market shares. A condition of wholesale and depot licences should be to take up to B5 and up to E10. A pilot programme, ideally involving PetroSA, where figures are made transparent should confirm that these numbers are reasonable. The numbers can be adjusted, where warranted, when significant history is built up. The intention is to later move towards a free market situation, once biofuels can stand on their own feet and have become an integral and normal feature of liquid fuels.
5. Mandated blending of biofuels in regions of local supply
To minimise duplication of infrastructure, maximise efficiencies and ensure equitable and fair treatment of stakeholders, biofuels upliftment should be restricted to refineries and depots in the proximity of the biofuels producers. To further ensure that there is minimal changes in fuel type supply to consumers, this should be done on a regional basis. This programme must be developed with the organised oil industry, many of whom have extensive experience, particularly internationally, with biofuels integration into the existing fuel pools. A condition of licence for petroleum refineries should be to adjust their supply to depots, so that it can be blended with ethanol up to E10, where receiving depots request BOB (basestock for oxygenate, ethanol, blending) and are part of the ethanol region. Refiners should also have the option to negotiate different ways to uplift and use the ethanol.
6. The same, regulated pump price should apply to blends up to
E10 as for standard (E0 or mineral only) petrol. Where ethanol is supplied and the region is an ethanol region, the ethanol blend must be taken by all oil companies in that region. The ethanol may perhaps only be added to one of the grades of petrol. An E10 ethanol blend should be used as the basis for incentives and policy development. Nevertheless the oil industry should be free to choose alternative ways of upliftment and use of the ethanol in the regions.
7. Implementation staging and regionalization
The implementation of biofuels should be staged on a regional basis to allow all stakeholders to iron out initial production and logistic issues to ensure a steady build up to best practice. This will build the confidence to accommodate the biofuel industry as a productive part of the South African economy. Certain regions that are not competitive producers of biofuels, and where no investment in biofuel production takes place may never be included. This staging can be managed as part of the licence conditions of biofuels production plants.

CONFIDENTIAL TO THE NATIONAL BIOFUELS TASK TEAM
Page 98 of 116
8. Financial support to biofuel producers Financial support to biofuels producers, especially in the first five years of production, cannot be sourced only by means of a regulated biofuel transfer price from the current oil industry. Government intervention in the form of tax reductions and capital incentive schemes are needed as well. Incentives to ensure the profitability of the biofuel enterprise should factor in the impact that crude oil price fluctuations have on profitability. This can be done as a hedge with motorists via the existing CEF Act, which reduces price risk to biofuels producers and fuel consumers in an equitable way, and with very low costs to consumers. The mechanisms hereof are discussed in the Incentives Proposal section of this report.
9. Tariffs
Import tariffs on energy crops ((i.e. sugar, molasses, maize, soya beans, vegetable oils etc.) are not advised as they normally degenerate into artificially shaped economic structures that may spill over to other agricultural sub-sectors. The existence of such tariffs would also unfairly discriminate against biofuel producers compared to crude oil refiners, as crude oil carries no import tariff, and produces a directly substitutable product. Similarly, in the absence of taxes on refined petrol and diesel imports, biofuel imports should not face import tariffs. However, biofuels incentives, such as fuel tax reductions and any hedge mechanisms, that are justified by the macro benefits, should only apply to local biofuels production from locally grown crops. The capital depreciation incentive would apply to biofuels plant investment, whether local or imported feedstock is used.
10. SADC and Clean Fuels Integration
Biofuels have opportunity for SADC fuel security and diversity improvements. South Africa should play a pro-active role in leading and supporting regional fuel standards harmonization that improves air quality (clean fuels) and that is supportive of the use of biofuels.
11. Control of bioethanol tax avoidance and use in potable market All bioethanol producers need to be licensed with the DME and SARS, and subject to audits applicable to potable alcohol producers, irrespective of production volumes. They should also pay the full fuel tax (but not the excise tax applicable to potable alcohol) and claim back the exemption part, based on oil company depot or wholesale company proof of receipts, and proof of quality. Small bioethanol producers should not be incentivised, as occurs for small biodiesel (< 300 m3 pa). To avoid fuel alcohol illegally entering the potable market, it must be denatured on site and stored with a bittering agent and a suitable level of denaturant, such as 5 % petrol. This practice must be developed and agreed with stakeholders.
CONFIDENTIAL TO THE NATIONAL BIOFUELS TASK TEAM
Page 99 of 116
12. Emerging Farmer Development Develop a separate strategy for the small-scale farmer based on low input, low cost practices that first addresses poverty alleviation and only later encourages surplus production for the market. This should include an assessment of the ability of perennial crops, co-products, institutional arrangements and innovations to contribute to local community energy security and local rural economic development. Irrigation schemes need to be given special consideration. Any energy crop production subsidy should be extended to the small-scale sector. Studies and research into assisting farmers to adopt Conservation Agriculture, such as drip irrigation and conservation tillage, should be undertaken.
13. Government Agencies as Drivers Government agencies, such as IDC, CEF, PetroSA and the Land Bank should be tasked to implement biofuels programmes that serve as an example of what can be achieved, and focus on maximising national benefits. These should include a minimum of 30 % participation by previously disadvantaged across the full value chain. Another way that government can facilitate biofuels use, is by examining where dedicated and niche fleets can be established that use E85 and B100. This could be government fleets or driven by incentives, such as for public service transport providers. This should be done in conjunction with available licensed biofuels manufacturers and suppliers.
14. Research on Crops and Alternative Technologies for the Future
Further research and studies to assess the suitability of perennial crops and other alternatives for the biofuel market is advised. This is covered in a report by the DST (Department of Science and Technology.)
15. International Alignment and Co-operation
Alignment and use of available Brazilian, Indian and Chinese experience should be made as this represents world leading practice and is also more suited to an emerging market focussing on job creation.
16. Water Conservation
Reliable water supply is essential for energy crop production. Catchment Management Agencies need to be capacitated on issues related to the cultivation and processing of energy crops. Further scoping regarding projected water use in the expansion areas of energy crop cultivation should be undertaken. Biofuels processing needs to be carefully assessed for its impact on the water reserves in a given catchment. Water efficiency needs to be promoted within the cultivation of energy crops and the biofuels processing sector. This is part of ongoing DWAF (Department of Water Affairs) and DoA (Department of Agriculture) strategies.

CONFIDENTIAL TO THE NATIONAL BIOFUELS TASK TEAM
Page 100 of 116
17. Energy Efficiency and Lifecycle Impacts The fossil energy input for some bio-fuels (e.g. ethanol from maize) is significant and can nullify the environmental benefits of bio-fuels. In future, the life cycle approach should be used when considering support for programmes that are chosen based on their capacity to mitigate climate change. This will require development, as is happening internationally within the UNFCC, so that then a differentiated and equitable fuel levy reduction formula can apply to different producers.
18. Used Cooking Oil Health Harm
The substantial health costs of using used cooking oil as new oil requires a value chain approach analysis to minimise harmful impacts. This requires a separate investigation. For instance, a levy could be introduced on new cooking oil to subsidise the collection of used cooking oil for processing into biodiesel rather than for use as new oil or for animal feed. A suitable interdepartmental Government programme should lead such an initiative.
19. Co-ordination and Communication Stakeholders, including consumers should be allowed to comment and to assist the achievement of the benefits of the limited (up to 5 %) biofuels industry in South Africa. Elements of a communication strategy that should be developed further in a workshop, and rolled out are included in the report. The National Biofuels Taskforce should continue as a smaller inter-departmental biofuels co-ordination body, still chaired by the DME Renewable Energy Directorate.

CONFIDENTIAL TO THE NATIONAL BIOFUELS TASK TEAM
Page 101 of 116
12 POLICY : INCENTIVE RECOMMENDATIONS South Africa has adopted a policy to support development of renewable energies and to investigate economic options that factor in externality costs and benefits, namely social and environmental aspects. To that effect, fiscal incentives have been provided for biodiesel, and the intention is to extend this to bio-ethanol (and other renewable energy alternatives). This study has shown that such support is justified, at least in the short term, to establish a (sustainable) biofuels industry. Key issues for biofuels producers (investors), and for successfully kick-starting this industry, are:
Offtake agreement (demand security); Price (reference or baseline); Incentives ; and Oil price volatility management
Any mechanisms to address these, need to be applied to ensure that motorists, the oil companies, the general population and the Fiscus are not treated unfairly, and that the national interest is served. To address these, based on the analysis, some options were examined. This leads to the recommended positions being proposed as below. The general approach is to:
1. Provide a favourable position for biofuels investment, until a target of 5 % renewables is achieved for petroleum products. This is based on achieving E8 and B2 nationally, respectively, but in practice may realise as different levels depending on investors.
2. Enable a window of opportunity time to cater for investment in a biofuels plant and for capacity expansion for 5 years from commissioning.
12.1 Offtake security The current environment, globally, is supportive of the use of ethanol in petrol of up to 10 %, i.e. E10, and the blending of biodiesel with mineral diesel of up to B5. South Africa has adopted biofuel standards that enable (support) this, and the Petroleum Products Amendment Act 58 of 2003, section 12C, enables the Minister to be able to require the upliftment and sale of indigenous products from biomass, or biofuels. Biofuels produced locally should ideally be consumed locally. To support capital efficiency, It is recommended, that, that a new distribution channel not be created. Hence, upliftment and distribution by existing oil industry players is preferred. The oil industry participation, as regards upliftment, may be achieved through incentives and/or by mandates. It is recommended that initially, and until the targeted market share of biofuels is established, that such upliftment by the largely regulated oil industry is

CONFIDENTIAL TO THE NATIONAL BIOFUELS TASK TEAM
Page 102 of 116
included as a licence requirement for wholesalers according to individual company�’s national market share. This would be linked to licences provided to biofuels producers. The oil industry, as a group, should be allowed to find the most favourable ways to achieve this for given licensed biofuels producers. The principle that must apply is that the oil industry fairly shares the costs and benefits (equal of misery). A system of credits and swaps would most likely apply for deliveries to individual depots that are allocated (invoiced as per individual company national market share.) It is proposed that the PetroSA supply area be considered as a possible pilot to develop working arrangements. In any case, arrangements would need to be developed for individual supply regions, depending on factors such as depots, and refinery optimization. In cases where agreement cannot be reached, the Controller of Petroleum Products would provide conditions, so as to assist the reaching of supply (offtake) agreements. This is effectively a mandate, based on licensed biofuels production, and should fall away when the targeted (optimal) penetration of biofuels is achieved. This target is 4.5 % of national fuel usage, and corresponds to E8 and B2, or variations thereof. Such a market share penetration may, or may not occur by 2013, and would depend on investment made in biofuels plants that would be affected by the level of incentives. 12.2 Pricing Nett costs of accommodating biofuels can be provided for by the regulatory framework. In the absence of better real data, prices are proposed at 95 % of BFP for fuel alcohol and 100 % of BFP for biodiesel. This will apply up to 5 % renewables purchased by the oil industry. Volumes of either bought in excess can be priced by negotiation (willing buyer �– willing seller). These percentages can be revised when better data nationally justifies changes, or can be incorporated in any planned changes to BFP and/or fuel pricing. The intention is to allow this to move to a free market scenario, ideally linked to achievement of the 4.5 % renewables liquid fuels target, by removing the effective mandates based on licensed biofuels producers and linked to wholesale licence conditions. The 5 % of BFP benefit, for an E8 scenario, provides for a benefit of R 170 mil pa (21 cpl) for oil wholesalers. (This could equate to an operating cost of 5 cpl and an investment of 16 cpl, or R 860 million at 15 %., excluding any biofuels accelerated capital depreciation incentive, currently 50:30:20.) The way in which oil marketers apply the ethanol and the incentive is at their own discretion. They would need to ensure fit for market product, including additives. The refineries supplying the BOB (blendstock for oxygenate blending) could adjust to take benefit of octane and to minimise any losses due to volatility.

CONFIDENTIAL TO THE NATIONAL BIOFUELS TASK TEAM
Page 103 of 116
For biodiesel, the 100 % of BFP is recommended so as to avoid biodiesel producers going direct (in parallel) to market, as diesel enjoys discounts in the market (not regulated). This also places a check by oil companies that biodiesel quality is to standard, and the consumer risk of poor quality products is reduced. Similarly, for bioethanol, the supply via oil company depots enables the oil companies to apply their expertise and ensure that the bioethanol supplied, and the resulting final fuel product is market compliant and supported by them. 12.3 Fiscal Incentives for biofuels Petrol and diesel, as well as biodiesel, are classified as fuel levy goods in terms of the Customs and Excise Act No.91 of 1964. The General Fuel Levy is determined annually by the national budget. The revenue is used to finance general government expenditure programmes. Currently a tax of 116 cpl applies to petrols and 100 cpl to biodiesel. The fuel levy generates about R 20 billion pa of tax revenue or almost 10 % of total tax revenue, and 70 % of environmentally-related taxes in South Africa. The National treasury has indicated that they want to normalise the taxes for diesel and petrol, on a per litre basis. This would still favour diesel marginally, as it has about 14 % more energy (mass) per litre. The Government has an objective to utilise taxes to support achievement of environment as well as other socio-economic benefits. The objective of this approach is to minimise market and/or policy failures, and be equitable when allowing for all externalities. A tax based approach is useful when influencing society to choose between two or more options that are all allowable, as opposed to bans or permits. For biofuels, government has already chosen, for biodiesel, to intervene and support biodiesel over fossil fuels by means of a reduction on the General Fuel Levy of 40 % (Budget 2006), increased from 30 % as originally introduced (Budget 2003), and 100 % for small producers (own use) of under 300 000 liters pa (Budget 2006). This tax is certain, simple to administer (via duty at source for producers). In addition, as fuel usage is linked to income per capita, the fuel levy tax is also equitable and is progressive. Government has stated that it intends to extend this to bioethanol used as fuel alcohol, and such a move is equitable as regards producers of fuel from biomass (renewables). This study has found that bioethanol fuel alcohol investment is at least as likely, and has more potential, for South Africa, and that the macro-economic benefits are comparable. Internationally, the fuel levy exemption is the most favoured mechanism for incentivising biofuels production and typically ethanol and biodiesel are treated equally (based on energy). The energy content of ethanol is typically about 70 % of that of biodiesel, so the fuel levy exemption for bioethanol should be 70 % of that for

CONFIDENTIAL TO THE NATIONAL BIOFUELS TASK TEAM
Page 104 of 116
biodiesel, to ensure equitable treatment of producers of renewable energy on an energy basis.
Conclusions 64. (Continue to) Utilise fuel levy exemption to incentivise
production of biofuels. 65. Include bioethanol incentive as part of the fuel levy exemption,
but make this 70 % of the biodiesel fuel levy incentive, i.e. if biodiesel incentive is 40 % fuel tax exemption, as current (40 cpl), then ethanol fuel levy exemption should be 28 % (of the petrol fuel levy), or currently would be 32.5 cpl .
Based on neutrality considerations, a similar tax benefit should apply to other renewable fuels that have similar societal benefits. An issue is what level of incentive is justified, and here comparison should be based on other incentives provided to other activities that provide similar societal benefits, such as cleaner air, jobs, and trade balance improvements. A 40 cpl tax benefit for diesel equates to $ 8/bbl crude oil equivalent and 12 c/kWh for renewable electricity. This study examined the macro-economic benefits of biofuels and mainly relates these to trade balance improvements and job creation. The cost of a job based on a 40 % fuel levy reduction, and other multiples, for different size biofuels producers, is compared to other mechanisms that support job creation in the table 24, so as to treat costs of jobs equally for biodiesel. To incentivise jobs equally for small and large biodiesel producers, the 40 % levy reduction for large producers should be raised to 45 %. A new class of plants below 10 million litres pa could be incentivised by 52 %. It appears that a fuel levy exemption of 75 %, or almost double the current level is acceptable, if we can accept a job cost of R 20 000, along lines as provided for by retail margins for fuel attendants. But we have also proposed an off-take mandate, worth perhaps 10 - 30 cpl, as one of the alternatives would be to export at lower netbacks, and the capital investment incentive of 50:30:20 adds an additional ca 10 cpl of effective support, so the incentive level should be lowered by 30 cpl, and thus 50 % fuel levy exemption seems fair.

CONFIDENTIAL TO THE NATIONAL BIOFUELS TASK TEAM
Page 105 of 116
Table 24 : Fuel Levy Reduction: Cost of Job Creation
Fuel Levy
Exemption, or other mechanism
Cost of Job Expressed as Rands fuel levy exemption, or other incentive provided
Comment
V. Large biodiesel producer (> 100 mil l pa, assumed 150)
40 % 45 % 75 %
R 10 480 R 11 790 R 20 000
Already in existence
Large biodiesel producer (50 - 100 mil l pa, assumed 75 mil l pa)
45 % 50 %
R 11708 R 13 000
Medium biodiesel producer (< 50 mil l pa, assumed 30 mil l pa)
47 % R 12 000
Small biodiesel producer (< 10 mil l pa, assumed 5 mil l pa)
52% R 11 954
V. small biodiesel producer (< 0.3 mil l pa)
104 % (effective) R 11 885 Already in existence
Petrol attendants job preservation
Mandate no self service, but linked to SA retail site margins being 10 cpl higher than comparative international
R 20 000 Exists
A similar reducing scale benefit of increasing jobs, better supply security and better rural and SMME benefit is provided by ethanol plants, so a similar ratio benefits could be considered, ie. 70 % for very small plants and 32 % for large plants. The issue of whether to support small bioethanol production, with the attendant risk of misuse of some product in the potable market, would need further examination.
Conclusion 66. Based on job creation benefits, an exemption of the General
Fuel Levy of 50 % is justified for large biodiesel producers.
CONFIDENTIAL TO THE NATIONAL BIOFUELS TASK TEAM
Page 106 of 116
67. Very small plants (own use) that create more jobs should continue to qualify for an effective 100 % fuel levy exemption for biodiesel. This should not be extended to bioethanol, without further study.
12.4 Oil Price Volatility Despite the General Fuel Levy exemption of 40 % ($7/bbl), investment in biofuels has been insignificant. A problem for investors is that this is not sufficient for times of low oil prices. Some form of additional price support for low oil prices may assist biofuels investment. This could be in the form of a hedge whereby biofuels producers pay in for high prices, to receive increasing support for lower oil prices. Given that consumers could benefit from such a hedge, it is proposed that the state intervene and adjust the support in times of high and low oil prices, respectively. The consumer should benefit and pay for this. Such a mechanism is easy to administer, as there are few fuels producers, and as government determine the BFP price monthly, and can adjust this exemption and the amount refunded to biofuels producers monthly based on the past month. This is an equalization levy and in fact has such an effect, whilst reducing risks for local producers/investors and through to the farming communities. The proposed fuel levy exemption of 50 % (current 40 %) ensures a fair return on capital at 55 $/bbl (current 57 $/bbl), as opposed to ca 65 $/bbl for the base case with no fuel levy exemption. It is proposed that the range of BFP where no change happens be set and that the change for lower and higher oil prices be balanced annually, if necessary, based on oil price projections so that the treatment of biofuels producers and consumers is fair. As an example: If it is assumed that the current year ahead oil price forecast is within a range from 40 �– 70 $/bbl, the mid range is 55 $/bbl. The 50 % fuel levy exemption (for biodiesel) should then apply for oil prices from 45 to 65 $/bbl (BFP equivalent, calculated assuming the R:$ forecast range is 6.5 �– 7.5 gives an average of 7). So from 45 to 55 $/bbl biofuels producers fund the �“losses�” by the additional profits they make from 55 to 65 $/bbl. Beyond $65 per bbl, the biofuel producers should pay in (to an equalization fund �– that can be used to reduce pump price increases), on the condition that below 45, they receive an additional margin (from the equalization fund �– that can be funded by a levy on the pump price). Beyond $65 per bbl, the profit probably increases at about 70 % of the increase in oil price, ie. 1.4 $/bbl profit per 2 $/bbl. It is proposed that 50 % of this additional profit be paid into the equalization levy, ie. 35 % slope, or 0.35 $ per 1$/bbl oil price increase. If the oil price went from 65 to 75 $/bbl, the

CONFIDENTIAL TO THE NATIONAL BIOFUELS TASK TEAM
Page 107 of 116
levy payable would be 3.5 $/bbl equivalent. This could be used to reduce the pump price based on the proportion of biofuels produced, ie. If a biofuels market share penetration of 5 % is achieved, then the motorists would benefit by 0.175 $/bbl (or 0.875 cpl) per 10 $/bbl oil price change (or ca 50 cpl). To make up for this hedge to motorists (consumers), below $ 45/bbl, biofuels producers should qualify for an equalization levy payment at the same slope, ie. 0.35 $.bbl for each drop in oil price of 1 $/bbl. Hence, if the oil price dropped to $35/bbl, they would receive an effective 38.5 $/bbl. This could result in a higher pump price to fund this mechanism, of 0.875 cpl per 50 cpl price drop for a 5 % biofuels scenario. It is proposed that this mechanism, as catered for by the CEF Act, be fixed for 5 years for individual biofuels producers as they are licensed. The exact numbers would depend on oil price projections, with the intention to making it balanced risk with consumers, a form of zero cost hedge. The level of this support provided, and in effect per job, would depend on the oil price. However, assuming over the longer term, the lows and highs of the oil price balance out, and that this support mechanism can be varied, as regards levels based on projections, the nett cost to the consumer would be zero.
Conclusion 68. Create a price hedge between fuel users and biofuel producers
for high and low oil prices (probably below $ 45 /bbl and greater than $65/bbl converted to BFP at projected exchange rate). This has minimal effect on motorists, whilst biofuels market penetration is at low levels (up to 5 %). This can be managed as an equalization levy. This can be fixed for one year at a time during the annual budget, based on projected oil prices. Biofuels producers who sign up (or it can be mandated) can receive this fixed level for 5 years from commissioning.
12.5 Impact on Fiscus The Fiscus is worse off due to the fuel levy exemption (40 %), and the volumes (or market share) of biofuels produced. For each one percent biofuels market share, the Fiscus loses about R 60 million pa. to recover this on the portion that is non-biofuels, the increase in tax needs to be 0.35 cpl. For a target of 5 %, the fuel levy would thus need to be raised by 1.8 cpl on the 95 % non-bio part. This increase could be adjusted at the annual budget based on projected biofuels volumes.
Conclusion 58. The General Fuel Levy should be increased by 0.35 cpl for
each percentage biofuels production projected per anum.

CONFIDENTIAL TO THE NATIONAL BIOFUELS TASK TEAM
Page 108 of 116
ATTACHMENTS A. Mass Balance per feedstock and process B. Energy Balance C. Models and macro-economic assumptions and scenarios D. Biofuels : Frequently Asked Questions E. Bibliography �– separate Exel spreadsheet available F. Existing projects and reasons for failure or success �–
lessons learnt - separate documentation

CONFIDENTIAL TO THE NATIONAL BIOFUELS TASK TEAM
Page 109 of 116
A. Mass Balance per feedstock and process For the purpose of the feasibility study, the following mass balances are associated with the various processes of manufacturing bio-ethanol and bio-diesel. As indicated in Section 3 of the report, two energy crops are considered for the production of bio-ethanol, i.e. sugar cane and maize, while the production of bio-diesel is considered from only soybean crops. Biofuel product Diesel
Units
Crop productionLand use ha/t crop 0.015 0.250 0.532
Biofuel productionFeed: Crop material t crop 1.000 1.000 1.000Feed: Methanol 0.224Co-product: Bagasse t/t crop 0.280Co-product: DDGS t/t crop 0.304Co-product: Oil cake t/t crop 0.680Co-product: Glycerine t/t crop 0.215Co-product: CO2 t/t crop 0.231 0.329
Biofuel produced l/t crop 81.4 402.3 171.4
SoybeanEnergy source Sugar cane Maize
Ethanol

CONFIDENTIAL TO THE NATIONAL BIOFUELS TASK TEAM
Page 110 of 116
B. Energy Balance Per Feedstock And Process For the purpose of the feasibility study the following concise energy balances are associated with the various processes of manufacturing bio-ethanol and bio-diesel. As indicated in Section 3, two energy crops are considered for the production of bio-ethanol, i.e. sugar cane and maize, while the production of bio-diesel is considered from only soybean crops. The (lower) average crop yields associated for South Africa are 66 t/ha for sugar cane, 4 t/ha for maize and 1.88 t/ha for soybeans. Biofuel product Diesel
Units
Crop production MJ/MJ biofuel 0.117 0.380 0.171Agricultural operations MJ/MJ biofuel 0.060 0.238 0.091Fertilisers MJ/MJ biofuel 0.035 0.127 0.064Transportation MJ/MJ biofuel 0.022 0.015 0.016
Biofuel production MJ/MJ biofuel 0.026 0.612 0.489Conversion process MJ/MJ biofuel 0.026 0.612 0.489Product transportation MJ/MJ biofuel 0.038 0.038 0.038
Total energy input MJ/MJ biofuel 0.181 1.030 0.698
Co-product energy credit MJ/MJ biofuel 0.088 0.396 0.674Total energy output MJ/MJ biofuel 1.088 1.396 1.674
Energy ratio 6.02 1.36 2.40
Energy source
Ethanol
Sugar cane Maize Soybean
Table 25: Energy balances for variety of feedstock and production processes

CONFIDENTIAL TO THE NATIONAL BIOFUELS TASK TEAM
Page 111 of 116
C. Models and macro-economic assumptions and scenarios Since this is essentially a study to investigate the feasibility of establishing a biofuels industry in South Africa, the three dominant current energy crops applicable for South African use are considered, i.e. sugar cane and maize for bio-ethanol production and soybean for bio-diesel production. Although this might not be a comprehensive list of feedstock types to consider for biofuel production, it provides for the major benefits to be derived from minimum intervention in the current agricultural and oil industry structures. As indicated in Section 6, the generated economic impact in this feasibility study refers to the following factors, judged to be typical of mid-2006 conditions in South Africa, and those expected to prevail in future at the time of production plant construction:
Economic and Financial Factors Units Value
Estimated current Gross Domestic Product Rmillion 1 607 000
Average R/US$ exchange rate at which the biofuels production plants would be erected R/US$ 7,5
Expected weighted average cost of capital required for biofuel production plant investment returns % 14,75%
Average R/US$ exchange rate at which the biofuels break-even crude oil price is determined R/US$ 7,2
Company tax rate % 29%
Secondary tax on companies % 12,5%
Clean Development Mechanism credit for greenhouse gas emissions reduction
US$/ton CO2 eq. 10,0
Average crop price (fob): Sugar cane R/ton 188
Average crop price (fob): Maize R/ton 1 022
Average crop price (fob): Soybean R/ton 527
Output multiplier: Agricultural industry X 3,30
Output multiplier: Petroleum industry X 2,92
Private income multiplier: Agricultural industry X 1,13
Private income multiplier: Petroleum industry X 0,78
Employment multiplier: Agricultural industry X 14,2
Employment multiplier: Petroleum industry X 4,42
Table 26: Basic economic and financial assumptions

CONFIDENTIAL TO THE NATIONAL BIOFUELS TASK TEAM
Page 112 of 116
The various economic multipliers quoted in table 26 above reflect the direct, indirect and induced effect that shocks in the various industries would have on the South African macro-economic environment, i.e. the widest possible impact. Models Applied in this Feasibility Study The current economic and climatic conditions formed the background against which the current demand and supply of agricultural products were determined. This demand-supply equilibrium formed the baseline against which the various adjustments in crop production for biofuel purposes were compared. The agricultural sector model used in this feasibility assessment was developed by the Bureau for Food and Agricultural Policy (BFAP). It allows for dynamic adjustments to demand-supply equilibrium when any shock is introduced to the baseline case, e.g. increased maize production for bio-ethanol application. It simulates not only the grain sector, but also the dairy and livestock sectors to obtain adjusted equilibriums in response to biofuels production, including the impact of the co-production of livestock feed material. The BFAP-model can also be applied stochastically to incorporate climatic risks. The petroleum industry model was developed jointly by two independent consultancies, Prevision CC and Sustainable Progressive Solutions CC. This model simulates the impact of adjustments in demand and supply of products for the total South African petroleum industry. One of the outcomes that it generates is the impact such adjustments would have on the National Accounts as well as the accounts of each producer of petroleum products. In this simulation, oil refineries are allowed to optimise on quality and quantity of the full spectrum of petroleum products produced for crude and synoil sources to accommodate the supply of biofuels into the petrol and diesel markets. The implications of blending bio-ethanol and bio-diesel are simulated extensively to allow for the subtle quality complications that emerge when these biofuels are blended into the crude-based products. In order to determine the macro-economic impact of the introduction of the biofuels industry, an input-output economic model was constructed by Prevision CC from data supplied by the Trade and Industrial Policy Strategies (TIPS) institution. The input-output model was based on TIPS�’s version of a social accounting matrix (SAM) for South Africa, based on 2003 economic activity. Since this is the latest version of a SAM that could be acquired, and the fact that TIPS believe the 2003-SAM is still a valid reflection of 2006 economic activities, it was used to derive a variety of economic multipliers.
CONFIDENTIAL TO THE NATIONAL BIOFUELS TASK TEAM
Page 113 of 116
D. Biofuels : Frequently Asked Questions As part of the Biofuels communication strategy, some typical questions and answers should be established. A basis and contribution for this is provided here below.
1. Is a biofuels industry justifiable for South Africa?
Biofuels can contribute to achieving the national renewable energy target, and a level of 5 % of liquid fuels is achievable without excessive incentives. Macro-economic analysis has shown that such an industry is justified based on job creation benefits, economic growth support and foreign exchange savings. The establishment of a biofuels industry is positive for the agricultural sector, for rural areas, and provides demand to better enable emerging farmer development. 2. What incentives, if any, should be applied to the biofuels
industry?
Government should avoid over-subsidising energy crops and biofuel production, and incentives should be able to be adjusted as part of the annual budget. It is, however, proposed that where possible that these mechanisms be fixed for five years to provide more certainty to investors, as part of the kick-start to establish the biofuels industry. An incentive of an exemption from the fuel levy is justifiable. Further support for biofuels producers could be an equalization mechanism to cater for extremes of crude oil prices.
3. Will biofuel prices be regulated?
The current, regulated pump price, as for petrol should also apply to ethanol blended in petrol, up to E10, that is sold as a direct substitute for conventional mineral petrol. Oil companies take biodiesel at the same BFP price basis, as applied to conventional diesel. For bioethanol, oil companies receive a discount to cater for added handling costs.
4. Where will the biofuel products be supplied?
Biofuels are blended at low levels into conventional mineral petrol as close as possible to the source of biodiesel manufacture, and for such areas the petrol or diesel sold will contain biofuels. As biofuels production expands, the area where fuels containing biofuels are sold expands. 5. What should the role of the government be in the biofuel
industry?

CONFIDENTIAL TO THE NATIONAL BIOFUELS TASK TEAM
Page 114 of 116
The Government creates a dispensation that is supportive of the use of biofuels, so as to assist the realisation of the macro-economic benefits. This intention is to ensure that all stakeholders are treated fairly.
6. Will biofuels producers be licensed?
All bioethanol and biodiesel producers, that sell products, need to be licensed with the DME and SARS, and subject to audits that they are paying fuel taxes and that there products are of acceptable quality.
7. What steps will be taken to avoid illegal alcohol to enter the
market in South Africa?
To avoid fuel alcohol illegally entering the potable market, it must be denatured on site and stored with a bittering agent and a suitable level of denaturant, such as 5 % petrol.
8. What is being done to facilitate the role of the agricultural sector
within the biofuels industry, especially the small-scale farmer?
Biofuels per se cannot uplift emerging farmers. A separate strategy must be developed for small-scale emerging farmers.
9. Does South Africa have adequate water resources to develop a
viable biofuels industry?
Crops are major users of water. The level of biofuels industry envisaged, at 5 %, can be produced from crops that can be grown giving due consideration to water supply.
10. Has the fossil-energy input within the biofuel industry been
considered?
The fossil energy input for bio-fuels has been considered, and all the crops provide increased liquid fuels supply, with differing levels of energy consumption. In the longer term, the life cycle approach should be used when considering support for programmes that are chosen based on their capacity to mitigate climate change. This will require development, as is happening internationally within the UNFCC.
11. What environmental management precautions will be undertaken?
Biofuels are generally positive as regards global warming and localised air quality. Environmental impact assessments will be included as part of the process to set up biofuels manufacturing plants. Over time biofuels production and use enables further improvements to the environment to be achieved.