An Investigation into the Effects of Mn-Promotion on the ...
27
S1 Supporting Information An Investigation into the Effects of Mn-Promotion on the Activity and Selectivity of Co/SiO 2 for Fischer-Tropsch Synthesis: Evidence for Enhanced CO Adsorption and Dissociation Gregory R. Johnson a , Sebastian Werner a , Alexis T. Bell a,b, * a Department of Chemical and Biomolecular Engineering, University of California, Berkeley, CA 94720, USA b Chemical Sciences Division, Lawrence Berkeley National Laboratory, Berkeley, CA 94720, USA Table of Contents Supplemental Description of Experimental Procedures ............................................................................. S2 Figure S1: Nanoparticle Composition Histograms ...................................................................................... S5 Figure S2: CO Temperature Programmed Desorption................................................................................ S6 Figure S3: Transient FTIR Spectra ............................................................................................................... S8 Figure S4: Cobalt time-yields ...................................................................................................................... S9 Figure S5: Turnover Frequencies .............................................................................................................. S11 Figure S6: Activity Parity Plots .................................................................................................................. S13 Figure S7: Low Pressure Product Selectivities .......................................................................................... S15 Figure S8: Methane Selectivities .............................................................................................................. S16 Figure S9: C 2 -C 4 Selectivities...................................................................................................................... S18 Figure S10: C 5+ Selectivities ....................................................................................................................... S20 Figure S11: X-Ray Diffraction Patterns ...................................................................................................... S22 Table S1: Indexed X-Ray Diffraction Peaks ............................................................................................... S23 Scheme S1: Hypothesized Co–Mn Nanoparticle Structures ..................................................................... S24 Scheme S2: Hypothesized Co–CO–Mn Interaction .................................................................................. S27 *corresponding author: [email protected]
Transcript of An Investigation into the Effects of Mn-Promotion on the ...

S1
Supporting Information
An Investigation into the Effects of Mn-Promotion on the Activity
and Selectivity of Co/SiO2 for Fischer-Tropsch Synthesis: Evidence for
Enhanced CO Adsorption and Dissociation
Gregory R. Johnsona, Sebastian Werner
a, Alexis T. Bell
a,b,*
a Department of Chemical and Biomolecular Engineering, University of California, Berkeley, CA
94720, USA
b Chemical Sciences Division, Lawrence Berkeley National Laboratory, Berkeley, CA 94720, USA
Table of Contents Supplemental Description of Experimental Procedures ............................................................................. S2
Figure S1: Nanoparticle Composition Histograms ...................................................................................... S5
Figure S2: CO Temperature Programmed Desorption ................................................................................ S6
Figure S3: Transient FTIR Spectra ............................................................................................................... S8
Figure S4: Cobalt time-yields ...................................................................................................................... S9
Figure S5: Turnover Frequencies .............................................................................................................. S11
Figure S6: Activity Parity Plots .................................................................................................................. S13
Figure S7: Low Pressure Product Selectivities .......................................................................................... S15
Figure S8: Methane Selectivities .............................................................................................................. S16
Figure S9: C2-C4 Selectivities...................................................................................................................... S18
Figure S10: C5+ Selectivities ....................................................................................................................... S20
Figure S11: X-Ray Diffraction Patterns ...................................................................................................... S22
Table S1: Indexed X-Ray Diffraction Peaks ............................................................................................... S23
Scheme S1: Hypothesized Co–Mn Nanoparticle Structures ..................................................................... S24
Scheme S2: Hypothesized Co–CO–Mn Interaction .................................................................................. S27
*corresponding author: [email protected]

S2
Supplemental Description of Experimental Procedures
Catalyst Synthesis
To determine appropriate volumes for the impregnation solution, N2 adsorption isotherms
were collected with a Gemini VII 2390 adsorption apparatus using silica as the sample. It was
found that the silica had a BET surface area of 283 m2/s, a pore volume of 2.5 cm
3/g, and an
average pore diameter of 35 nm.
The initial pretreatment of the dried catalyst precursor involved placing about 1 g of catalyst
into a quartz glass reactor. The temperature of the reactor was increased at 4 K/min from room
temperature to 673 K in a 100 ml/min flow of H2 (Praxair, 99.999 % purity). The temperature of
the reactor was held at 673 K for 2 h, after which it was cooled at 10 K/min. Upon the reactor
reaching room temperature, the flow of gases was switched from H2 to 500 ppm O2 in He
(Praxair, 99.999 % purity) to passivate the metallic Co. After at least 30 min of passivation, the
catalyst was removed from the reactor and placed into vials for storage in a desiccator.
TEM Imaging
The passivated catalysts were prepared for analysis by electron microscopy by grinding 5 mg of
catalyst in a mortar for 30 s. The ground material was then suspended in 1 ml of ethanol,
loaded into a test tube, and ultrasonicated for 1 min. Agglomerates of catalyst particles were
allowed to settle for 1 min, and 5 µl of the suspension were drop-cast onto a lacey carbon Cu
TEM grid (Ted Pella). The sample grids were dried at 393 K for 1 h in a vacuum oven to remove
the ethanol solvent.
STEM-EDS Elemental Mapping
Elemental maps were created by measuring the fluorescent X-rays at each position as the
electron beam rastered over the sample in STEM mode. The X-ray spectrum at each pixel was
measured from 0-20 keV with an energy resolution of 140 eV and a dispersion of 10 eV per
channel. High-angle annular dark field (HAADF) images were collected before and after the
mapping to check for beam damage to the sample. For each map, multiple frames were
acquired using active drift compensation and combined.
Quantification of the catalyst composition was done using the Bruker Esprit software program
with the Cliff-Lorimer method using the Co Kα (6.93 keV) and Kβ (7.6 keV) peaks and the Mn Kα
(5.89 keV) and Kβ (6.49 keV) peaks.1 To improve the accuracy of the quantification, Fe and Cu
were deconvoluted from the Co and Mn peaks and Si was treated as SiO2.
1 Cliff, G.; Lorimer, G. W. J. Microsc. 1975, 103, 203-207.
Chemisorption and Titration Characterizations:
The pretreatment conditions involved heating a catalyst in a sample tube at 4 K/min to 673 K
while flowing 100 ml/min of H2. After holding at 673 K for 2 h, the catalyst was evacuated at
0.01 mbar for 2 h and then cooled at 10 K/min to 373 K under vacuum. An automated leak test
was performed before measuring the first isotherm. The initial adsorption isotherm, from which

S3
total H2 uptake was determined, was followed by evacuation for 1 h to remove physisorbed H2.
A repeat H2 adsorption isotherm was then collected. Following the completion of the second
isotherm, an estimate of the effective sample tube volume was made using He backfilling.
For the O2 titration measurements, the catalyst samples were reduced at 673 K for 2 h with 4
K/min ramp rates in a 100 ml/min flow of H2. Upon completion of the reduction step, the
reactor was flushed with 100 ml/min He to remove any traces of H2. After the H2 signal
returned to its baseline value, a series of dry air pulses were delivered to the reactor via a 6-
port valve with a calibrated sample loop. Subsequent pulses were not delivered until the O2
signal returned to its baseline value. Due to the high flow rate of the He carrier gas, the change
in volumetric flow through the reactor due to consumption of the O2 was assumed to be
negligible.
X-Ray Diffraction
Passivated catalyst samples were reduced in a quartz glass reactor by heating from 293 K to 673
K at 4 K/min in a 100 ml/min flow of H2 and then holding the temperature at 673 K for 2 h. The
reactor was then rapidly cooled to 298 K while flushing with He. Shutoff valves installed
upstream and downstream of the reactor were closed to isolate the catalyst under inert gas,
and the whole apparatus was then transferred to a N2-filled glove box. Catalyst material was
removed from the reactor and placed inside Kapton sample tubes. The sample tubes were then
sealed on both ends with epoxy and placed inside aluminum-lined vacuum-sealer bags to
prevent oxidation during transit from the University of California, Berkeley to the Argonne
National Laboratory.
X-Ray Absorption Spectroscopy
The beamline at which the XAS experiments were conducted had a Si(111) crystal
monochromator that was used to scan through the desired ranges of X-ray energies. The
monochromator was detuned to reject higher harmonics. Two ion chamber detectors were
used to measure the absorption spectra of samples, and a reference foil was placed in between
the second and a third detector to calibrate energies. Catalysts samples were ground with a
mortar and pestle and pressed into cylindrical pellets with masses yielding an X-ray absorbance
of 2.5. Boron nitride was added to the sample material as an X-ray transparent binder to give
the pellets mechanical stability.
Various samples of Co and Mn oxides and precursor salts (Sigma-Aldrich) were used as
standards of known oxidation states. Co and Mn metal foils served as standards for the zero-
valent oxidation state. XANES spectra of these standards were measured at ambient conditions.
Catalytic Reactions
The experimental setup consisted of quartz tube reactors for atmospheric pressure
experiments and 316 stainless steel reactors for high pressure experiments. Mass flow
controllers regulated the flow of gases into the reactor, which was heated using a tube furnace
attached to a PID controller. The catalyst bed temperature was measured using a K-type

S4
thermocouple positioned in the bed center. The reactor pressure was measured with an
electronic pressure transducer (Omega) and controlled with a diaphragm-based back pressure
regulator (Equilibar). A 150 ml sample collection vessel filled with glass beads was located
immediately downstream of reactor for collecting the wax product fraction. An Agilent 6890N
gas chromatograph was used to monitor the chemical composition of the reactor effluent. The
gas chromatograph was equipped with a capillary column connected to a flame ionization
detector for measuring hydrocarbons and a packed column connected to a thermal
conductivity detector for measuring H2, Ar, and CO. The chromatographic response factors for
the C1 through C4 hydrocarbons were measured over the expected concentration range; the
response factors for higher molecular weight hydrocarbons were determined by extrapolation
assuming a linear relationship between the response factor and the number of carbon atoms in
the analyte.2
2 Perkins, Jr., G.; Laramy, R. E.; Lively, L. D. Anal. Chem. 1963, 35, 360-362.

S5
A) B)
C) D)
Figure S1. Histograms of nanoparticle compositions for the Co-Mn catalysts with bulk Mn/Co
atomic ratios of (A) 0.01, (B) 0.05, (C) 0.1, and (D) 0.5. The dashed curve in each plot is a
Gaussian function fitted to the data, and the vertical lines indicate the mean nanoparticle
compositions (thin dotted) and the bulk catalyst compositions (thick dashed).

S6
A)
B)

S7
Figure S2. CO Temperature Programmed Desorption.
(A) TCD signal (solid black line) as a function of temperature for the catalyst with Mn/Co = 0.1.
The TCD signal was fitted using four log-normal peaks, which are shown as the dashed, colored
lines, and the dashed, black line is the summation of the fitted peaks. The first peak (blue) was
attributed to physisorbed CO, and the second (red) and third (green) peaks were attributed to
chemisorbed CO. The fourth peak (purple), which appears as a shoulder of the third peak, was
combined with third peak for the peak area analysis in Figure S2B.
(B) For various loadings of Mn, the ratio of the sum of the third and fourth CO chemisorption
peak area to the second CO chemisorption peak area was calculated. This expression quantifies
the amount of CO bound through stronger adsorption modes, including those involving
interactions with MnOx, to linearly adsorbed CO. In the figure below, these data are plotted in
red using the left axis. The positive slope of these data indicates that higher promoter loading
was associated with a larger fraction of the adsorbed CO being bound at sites with an affinity
for CO that was stronger than that of the unpromoted sites.
Additionally, the ratio of H chemisorption molar uptake to the area of linearly adsorbed CO
desorption peak was calculated for these catalysts using the equation below. Here, a
normalization was performed using the ratio for the unpromoted catalyst so that the
unpromoted catalyst had a normalized ratio of 1. This procedure is equivalent to assuming a 1:1
CO:Co adsorption stoichiometry for the unpromoted catalyst. The flat slope of the normalized H
to low temperature CO (i.e. the second TPD peak) data suggests that the CO:Co adsorption
stoichiometry did not change as a function of promoter loading.
�������� ��� ��� ����� =
��ℎ����������������� ��������� ∗ ��� ��������������� � !
"#$%

S8
A) B)
Figure S3. FTIR measurements of hydrogenation over a CO-saturated Mn-promoted
catalyst (Mn/Co = 0.1). After reducing the catalyst at 673 K in H2 , the in situ cell was
flushed with He and cooled to 493 K. CO was then flushed through the reactor to
saturate the catalyst surface with carbonyl adsorbates. The flow through the in situ cell
was then switched to H2 and FTIR measurements were collected at various times. The
spectra are referenced in minutes elapsed after switching to H2 flow. (A) The peak at
1588 cm-1
decreased in intensity as time elapsed. At intermediate times (~3 min), this
peak was distinguishable from a peak centered at 1619 cm-1
. The peak at 1619 cm-1
remained visible after long durations of exposure to H2. (B) IR spectra of carbonyl
adsorbates as a function of exposure time to H2. In this figure, the spectrum after 1 h of
exposure to H2 was subtracted as a background removal. This removed the peak at 1619
cm-1
, which was inactive toward hydrogenation. Linearly adsorbed CO, bridging CO, and
the species giving rise to the peak at 1588 cm-1
were all labile under hydrogenation.

S9
A) B)
C) D)

S10
E)
Figure S4. Cobalt-time yields for the Co-Mn catalysts with bulk Mn/Co atomic ratios of (A)
Mn/Co = 0, (B) Mn/Co = 0.01, (C) Mn/Co = 0.05, (D) Mn/Co = 0.1, and (E) Mn/Co = 0.5. The data
are based on CO consumption and were extrapolated to 0 % conversion. The curves in each plot
correspond to the rate law from Eqn. (3) fitted to the data at a given temperature.

S11
A) B)
C) D)

S12
E)
Figure S5. Turnover frequencies for the Co-Mn catalysts with bulk Mn/Co atomic ratios of (A)
Mn/Co = 0, (B) Mn/Co = 0.01, (C) Mn/Co = 0.05, (D) Mn/Co = 0.1, and (E) Mn/Co = 0.5. The data
are based on CO consumption and were extrapolated to 0 % conversion. The curves in each plot
correspond to the rate law from Eqn. (3) fitted to the data at a given temperature.

S13
A) B)
C) D)

S14
E)
Figure S6. Parity plots for the Co-Mn catalysts with bulk Mn/Co atomic ratios of (A) Mn/Co = 0,
(B) Mn/Co = 0.01, (C) Mn/Co = 0.05, (D) Mn/Co = 0.1, and (E) Mn/Co = 0.5.

S15
Figure S7. Product selectivities for the Co-Mn catalysts at atmospheric pressure and 493 K as a
function of Mn loading. The data were extrapolated to 0 % conversion. The curves in the plot
are cubic splines intended for visual aid.

S16
A) B)
C) D)

S17
E)
Figure S8. CH4 selectivities for the Co-Mn catalysts with bulk Mn/Co atomic ratios of (A) Mn/Co
= 0, (B) Mn/Co = 0.01, (C) Mn/Co = 0.05, (D) Mn/Co = 0.1, and (E) Mn/Co = 0.5. The data were
extrapolated to 0 % conversion. The curves in each plot are cubic splines intended for visual aid.

S18
A) B)
C) D)
S19
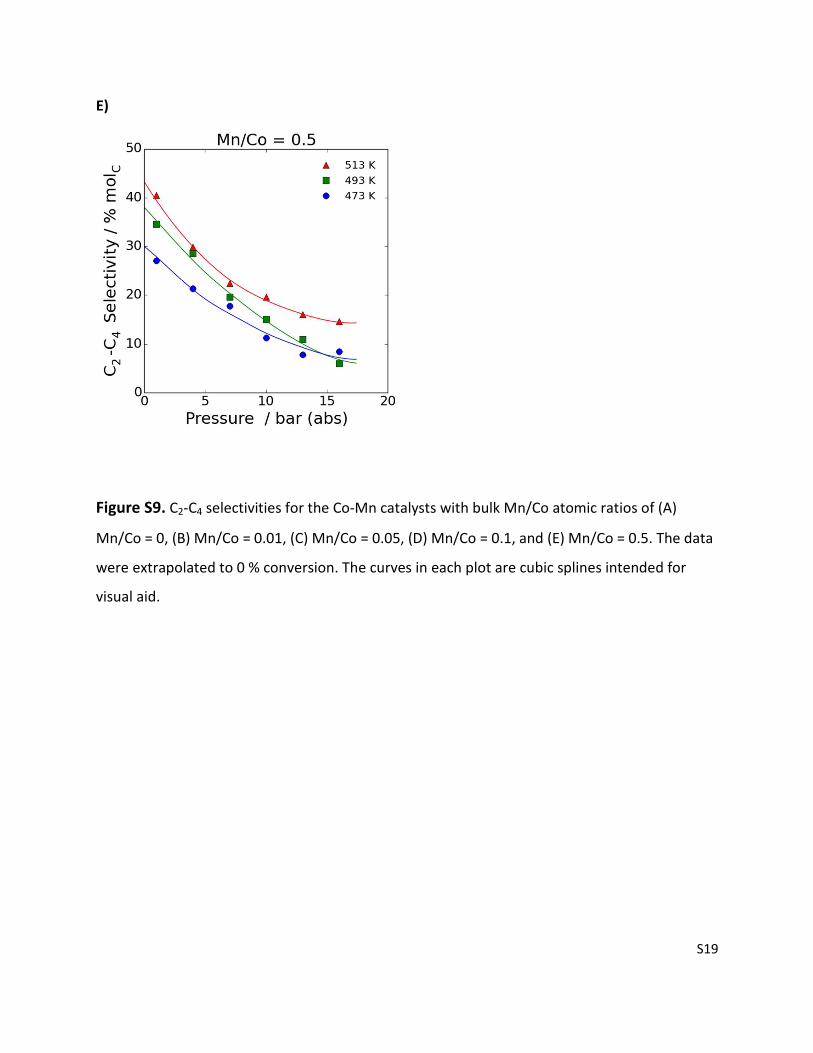
E)
Figure S9. C2-C4 selectivities for the Co-Mn catalysts with bulk Mn/Co atomic ratios of (A)
Mn/Co = 0, (B) Mn/Co = 0.01, (C) Mn/Co = 0.05, (D) Mn/Co = 0.1, and (E) Mn/Co = 0.5. The data
were extrapolated to 0 % conversion. The curves in each plot are cubic splines intended for
visual aid.

S20
A) B)
C) D)

S21
E)
Figure S10. C5+ selectivities for the Co-Mn catalysts with bulk Mn/Co atomic ratios of (A)
Mn/Co = 0, (B) Mn/Co = 0.01, (C) Mn/Co = 0.05, (D) Mn/Co = 0.1, and (E) Mn/Co = 0.5. The data
were extrapolated to 0 % conversion. The curves in each plot are cubic splines intended for
visual aid.

S22
Figure S11. X-ray diffraction patterns for the unpromoted, Mn/Co = 0.1, and Mn/Co = 0.5
catalysts. The catalyst samples were reduced in H2 at 493 K and sealed in Kapton tubes under
inert gas. The data were collected at ambient temperature using 28.3 keV X-rays over a 2θ
range of 0.5 ° to 50 ° with a 0.001 ° step size. Data at 2θ < 10 ° were difficult to interpret owing
to a rapidly changing background signal in this region. Peak assignments for the 10 ° ≤ 2θ ≤ 50 °
region are given in Table S1.
S23
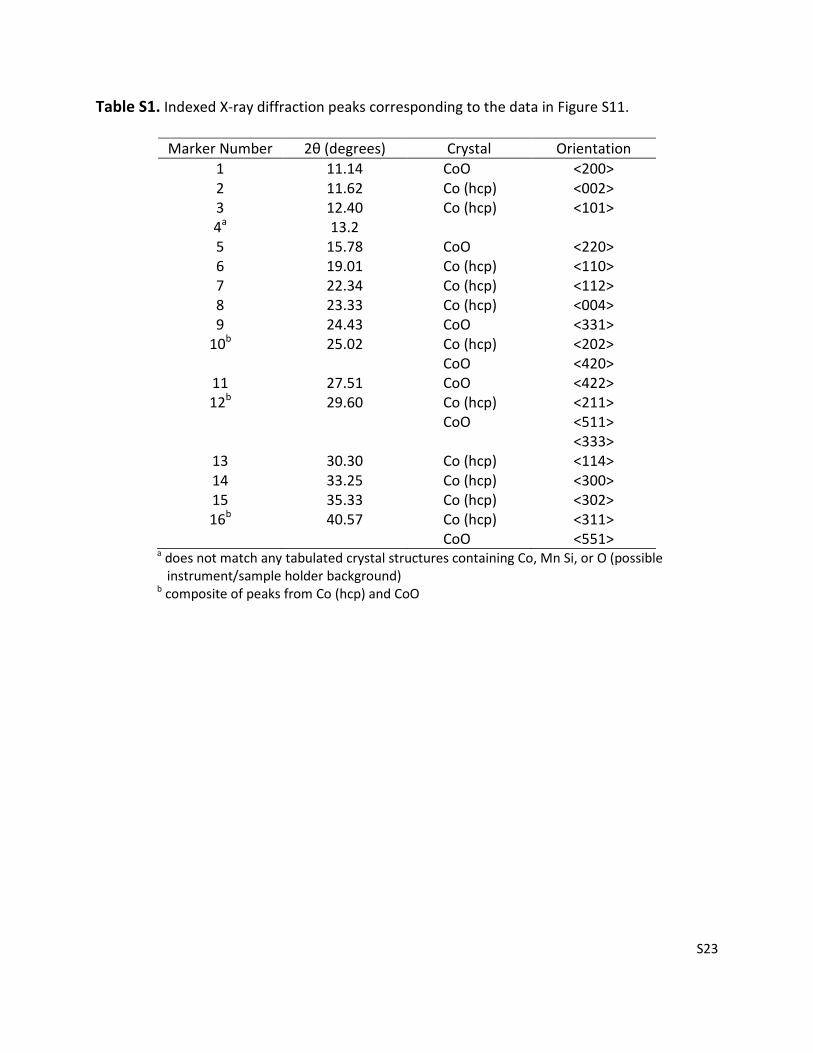
Table S1. Indexed X-ray diffraction peaks corresponding to the data in Figure S11.
Marker Number 2θ (degrees) Crystal Orientation
1 11.14 CoO <200>
2 11.62 Co (hcp) <002>
3 12.40 Co (hcp) <101>
4a 13.2
5 15.78 CoO <220>
6 19.01 Co (hcp) <110>
7 22.34 Co (hcp) <112>
8 23.33 Co (hcp) <004>
9 24.43 CoO <331>
10b 25.02 Co (hcp) <202>
CoO <420>
11 27.51 CoO <422>
12b 29.60 Co (hcp) <211>
CoO <511>
<333>
13 30.30 Co (hcp) <114>
14 33.25 Co (hcp) <300>
15 35.33 Co (hcp) <302>
16b 40.57 Co (hcp) <311>
CoO <551>
a does not match any tabulated crystal structures containing Co, Mn Si, or O (possible
instrument/sample holder background)
b composite of peaks from Co (hcp) and CoO

S24
BLACK = MnOx and Co1-xMnxOy
BLUE = unpromoted active sites not adjacent to oxide overlayer
RED = promoted active sites adjacent to oxide overlayer
A) Mn/Co = 0
• 85% of the nanoparticle surface is available for catalysis
• All active sites are unpromoted
B) Mn/Co = 0.01
• Mn accumulates as highly dispersed MnOx on the nanoparticle surface
• 77% of the nanoparticle surface is available for catalysis
• The majority of active sites remain unpromoted so catalyst selectivity and
activity are similar to those of the Mn/Co = 0 catalyst

S25
C) Mn/Co = 0.05
• Mn continues to deposit onto the nanoparticle surface
• 52% of the nanoparticle surface is available for catalysis
• Catalyst turnover frequency and selectivity improve as the promoted active sites
constitute a substantial fraction of the total active sites
D) Mn/Co = 0.1
• Mn continues to deposit onto the nanoparticle surface
• Lower extent of reduction indicates incorporation of Co into a Co1-xMnxOy phase
• 44% of the nanoparticle surface is available for catalysis
• Nearly all active sites are promoted by being adjacent to the surface oxide layer

S26
E) Mn/Co = 0.5
• Co1-xMnxOy on nanoparticle surface grows outward rather than completely
encapsulates the Co nanoparticle
• MnOx deposits on the SiO2 support
• 15% of the nanoparticle surface is available for catalysis
• Nearly all active sites are promoted by being adjacent to the MnOx
• Selectivity remains the same as the Mn/Co = 0.1 catalyst because active sites are
all promoted in both catalysts, but the fewer sites in the Mn/Co = 0.5 catalyst
results in a much lower activity per gCo
Scheme S1. Hypothesized structures of the Co-Mn catalysts with promoter loadings of (A)
Mn/Co = 0, (B) Mn/Co = 0.01, (C) Mn/Co = 0.05, (D) Mn/Co = 0.1, (E) Mn/Co = 0.5. These
cartoons are drawn as 2D cross-sections through nanoparticles. The black particles decorating
the surface of the Co nanoparticles are MnOx. The outer layers of the Co nanoparticles are
color-coded according to whether the Co active sites are separate from (blue) or adjacent to
(red) the promoter.

S27
Scheme S2. Hypothesized interaction between a CO adsorbate and the Mn promoter. Mn
cations may participate as Lewis acids and withdraw electron density from the CO oxygen. This
phenomenon would result in a weakening of the C-O bond and a facilitation of CO dissociation.