An investigation in to the breeding biology and nestling diet of the House Sparrow in urban Britain...
23
An investigation in to the breeding biology and nestling diet of the House Sparrow in urban Britain Dr Kate Vincent, Dr Will Peach and Dr Jim Fowler
-
Upload
eric-bridges -
Category
Documents
-
view
251 -
download
1
Transcript of An investigation in to the breeding biology and nestling diet of the House Sparrow in urban Britain...

An investigation in to the breeding biology and nestling diet of the House Sparrow in urban Britain
Dr Kate Vincent, Dr Will Peach and Dr Jim Fowler

• Methodology
• Fieldwork
• Key results
• Summary of findings


Methodology
• Record nesting success along gradient
• Investigate diet and invert. abundance
• L.C.C. - pollution data

Fieldwork
• Census/survey at 9 study sites
• No. boxes used = 100 [500+ chicks ringed]
• Monthly foraging obs. in 44 locations
• Provisioning watches - 55 completed
• Habitat mapping around used boxes
• Aphid abundance in home ranges
• Over-winter survival

Biometrics/Nesting success
• Weight • Tarsus length• Fat score • Muscle score• Faecal samples (400+) • Colour ringing

Foraging Observations
• Does foraging change across season/area type?
• Initial visit recorded habitat type
• Made monthly visits to 44 transects
• Recorded no. of adults/juvs and habitat

Habitat Mapping
• Compare habitat around all used boxes
• Used 13 habitat category system
• Took radius of 70m around each nest (80-100 gardens in suburbia)
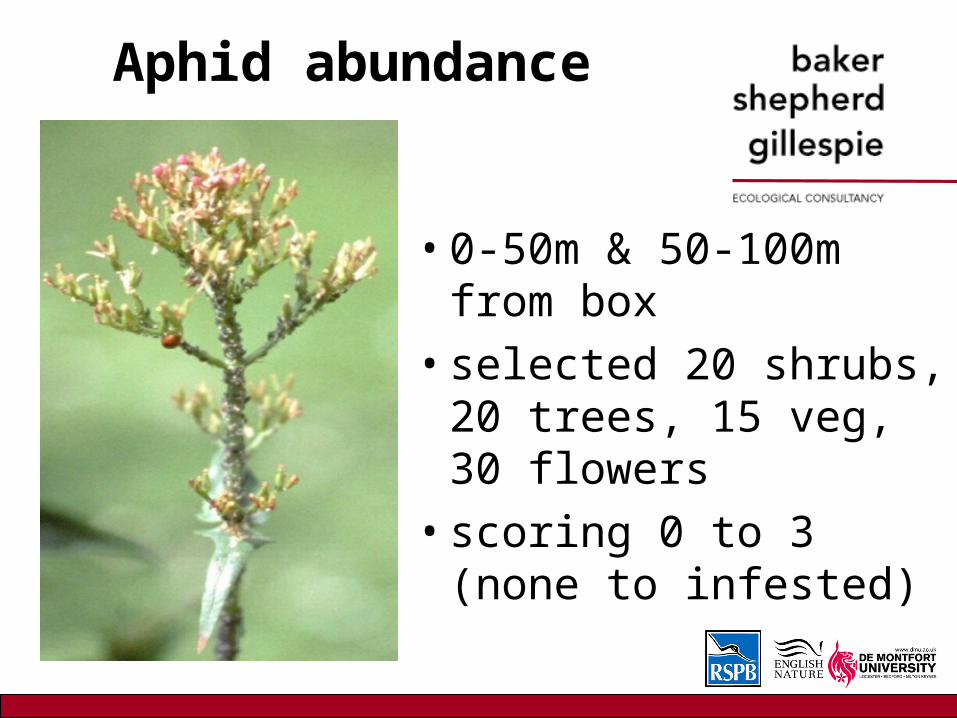
Aphid abundance
• 0-50m & 50-100m from box
• selected 20 shrubs, 20 trees, 15 veg, 30 flowers
• scoring 0 to 3 (none to infested)

Key Results
• Diet of nestlings
• Productivity/nesting success
• Chick condition
• Habitat utilisation/selection

Diet composition (175 samples from 2001, 2002 & 2003)
Others5%
Larvae 5%
Flies14%
Spiders11%
Ants8%
Hymenoptera2%
Aphids35%
Beetles20%
Thanks to Del Gruar for helping analyse samples

Nestling Diet
• Spiders, Aphids, Diptera & Beetles = 80% of all remains
• Beetles & Diptera prominent in April/May
• Aphids most prominent in June
• Ants most prominent in July/August

Nestling Diet
• Aphids - urban>suburban>rural broods
• Diptera - rural>suburban>urban broods
ants in broods that died plant material during July/August
& in broods that died

Productivity/nesting success
• No. fledged late summer No. fledged in home ranges with
grass/deciduous shrubs/trees & concrete.
No. fledged from broods fed a plant-dominated diet
• High rate of chick starvation in June/July

0
0.01
0.02
0.03
0.04
0.05
0.06
0.07
0.08
0.09
0 0.2 0.4 0.6 0.8 1proportion of plant material in diet
pre
dic
ted
da
ily w
ho
le n
est
failu
re r
ate
2002 2003
= 70% : 14 day chick period I
I
I
I
I
I
= 20% : 14 day chick period
I
I

Brood survival
Suburban nests = 75% (whole nest period) Rural nests = 78%• All habitats BTO (2002) = 96.5%• Lack of food causing complete or partial brood
failure– inadequate provision of food poor quality
habitat – provision of unsuitable food nutritional
deficiency/starvation

Productivity
• Mean no. fledged per attempt– suburban = 1.98 BTO = 2.6– rural = 2.37 BTO = 2.9
• Seasonal Productivity– 4.21 young per year (suburban)– 4.67 young per year (rural)– Oxford 1990s study = 5.68
• productivity in this study is low due to high complete/partial brood failures

Chick condition
• chicks fed beetle had higher body condition indices
grass, deciduous shrubs & trees, concrete = brood biomass invert availability is sensitive to the habitat quality
around nest
NO2 levels = brood mass at fledging
post-fledging survival– fledging in polluted areas = survival disadvantage

Habitat utilisation/selection
• 227 transects - 4555 foraging observations • most used = deciduous shrub• least = evergreen/ornamental shrub • Key habitats = deciduous shrubs, tilled land,
grassy areas & trees • Monthly effects grass being intensively used
in May but less in July
• In July: urban areas; concrete = 50%

Summary
• No. fledging & brood biomass in home ranges with grass/deciduous shrubs/trees suggests invert. availability sensitive to habitat quality
fledged from broods fed a plant-dominated diet evidence linking veg. dominated diet with complete brood failures
chick starvation during June/July not been reported before
NO2 levels = lower brood mass at fledging

Conclusions
• nestling survival rate & no. young fledging are low
• links between;– poor habitat quality/insect availability/nestling
diet/brood condition
• indicates direct effect of food limitation during the breeding season
causing productivity in suburbia

Conclusions
productivity demographic mechanism causing decline
demographic model - test if productivity levels are low enough to cause declines
incorporated suburban & rural productivity levels and known survival rates (adult, first-year, post-fledge)
showed suburban productivity is low enough to cause 10% decline p.a

A BIG THANKYOU TO • RSPB, EN & DMU • Dr Will Peach & Dr Jim Fowler• Derek Gruar (RSPB)• Phil Grice (EN)• All RSPB research assistants • CJ Wildbird Foods (nestboxes)• Householders that have nestboxes • Denis Summers-Smith• Ken Goodrich & LROS• Leicester City Council
• My website: www.katevincent.org