An Introduction to the Principles of Performance Management · Principles of Performance Management...
65
An Introduction to the Principles of Performance Management Presented to the International Association of Commercial Administrators Copyright © 2000-2014 by Thomas A. Bishop All Rights Reserved.
Transcript of An Introduction to the Principles of Performance Management · Principles of Performance Management...

An Introduction to the Principles of Performance Management
Presented to the International Association of Commercial Administrators
Copyright © 2000-2014 by Thomas A. Bishop
All Rights Reserved.

2
The Theory of
Performance Management
by
Dr. Walter A. Shewhart
and
Dr. W. Edwards Deming
The Shewhart and Deming Performance Management Theory

3
The Shewhart and Deming Performance Management Theory
In 1931, Dr. Walter A. Shewhart introduced a powerful, new theory of management aimed at optimizing the control of manufacturing processes. This event occurred with the publication of his seminal book
“Economic Control of Quality of Manufactured Product”
Over the next 60 years Dr. W. Edwards Deming extended the development and application of Shewhart’s optimization theory to service and administrative processes.
4
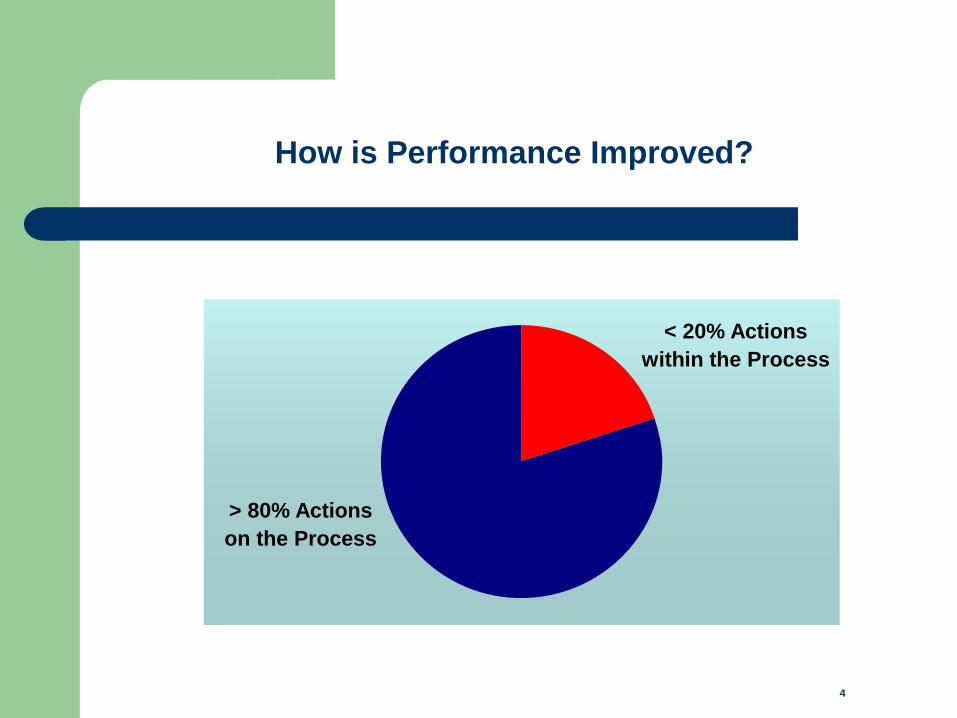
How is Performance Improved?
> 80% Actions
on the Process
< 20% Actions
within the Process

5
The Three Fundamental Axioms of Management
The Axiom of Responsibility
“The primary responsibility of management in any organization is to
create means of producing products and services that meet the wants
and needs of their customers with the minimum amount of human
effort and investment in capital resources.”
In order to meet this responsibility, management must tap and
optimize the inherent capability of the human and capital resources
that have been entrusted to their leadership.

6
The Axiom of Action
“In managing systems and people, data are collected and analyzed
to generate knowledge and insights to form a rational basis for action.”
The Three Fundamental Axioms of Management

7
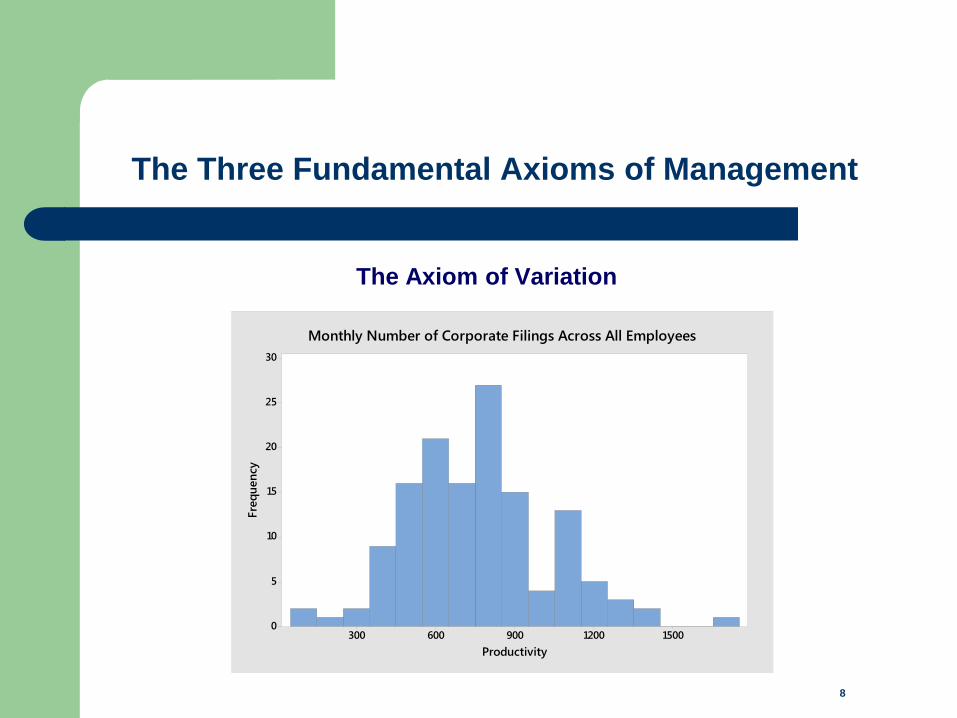
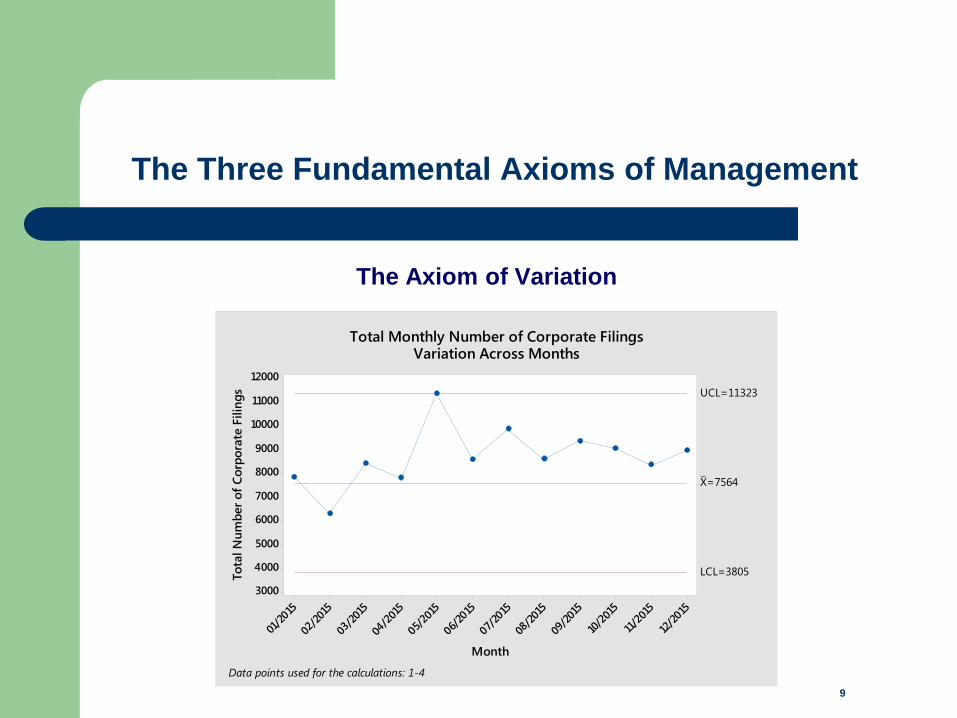
The Axiom of Variation
“Whenever an individual or organization attempts to produce products or
services, their performance will vary over time.”
Therefore, there is inherently a cause system of variation
associated with, and a statistical component to, the
management of both human and fixed assets.
The Three Fundamental Axioms of Management
8
The Axiom of Variation
The Three Fundamental Axioms of Management
15001200900600300
30
25
20
15
10
5
0
Productivity
Fre
qu
en
cy
Monthly Number of Corporate Filings Across All Employees
9
The Axiom of Variation
The Three Fundamental Axioms of Management
12/2
015
11/2
015
10/2
015
09/2
015
08/2
015
07/2
015
06/20
15
05/2
015
04/2
015
03/2
015
02/2
015
01/2
015
12000
11000
10000
9000
8000
7000
6000
5000
4000
3000
Month
To
tal N
um
ber
of
Co
rpo
rate
Filin
gs
_X=7564
UCL=11323
LCL=3805
Total Monthly Number of Corporate FilingsVariation Across Months
Data points used for the calculations: 1-4

The Bead Box Experiment
Understanding Unexplainable
Random Variation

The Bead Box Experiment
The most famous experiment that demonstrates the effects
of pure common causes of variation, and that also helps us
understand the behavior of constant cause systems of variation,
is Dr. Deming’s bead box experiment.
11

The Components of the Bead Box Experiment
The experiment consists of a box containing beads and a paddle used to draw beads from the box.
There are 1000 beads in the box.
Ten percent of the beads are red
and the remainder are white.
The paddle contains 50 holes.
12

The Experimental Procedure
The beads are thoroughly mixed by hand prior to inserting the paddle.
The paddle is inserted into the box and 50 beads are drawn from the box.
The percent of red beads in the paddle is recorded.
The beads are then returned to the box, the beads are thoroughly mixed again and the experiment is repeated.
This procedure is repeated a large number of times.
13

The Basis for Predictability in the Bead Box Experiment
Why is there such predictability hidden within the
random behavior of the data?
It is due solely to the design of the cause system of variation produced by
the experiment – that is the mechanical process of mixing the beads
thoroughly by hand prior to inserting the paddle.
1009080706050403020101
35
30
25
20
15
10
5
0
Draw
Perc
ent R
ed B
eads
Variation Associated with the Bead BoxData from the First 100 Trials
23%
10%
14
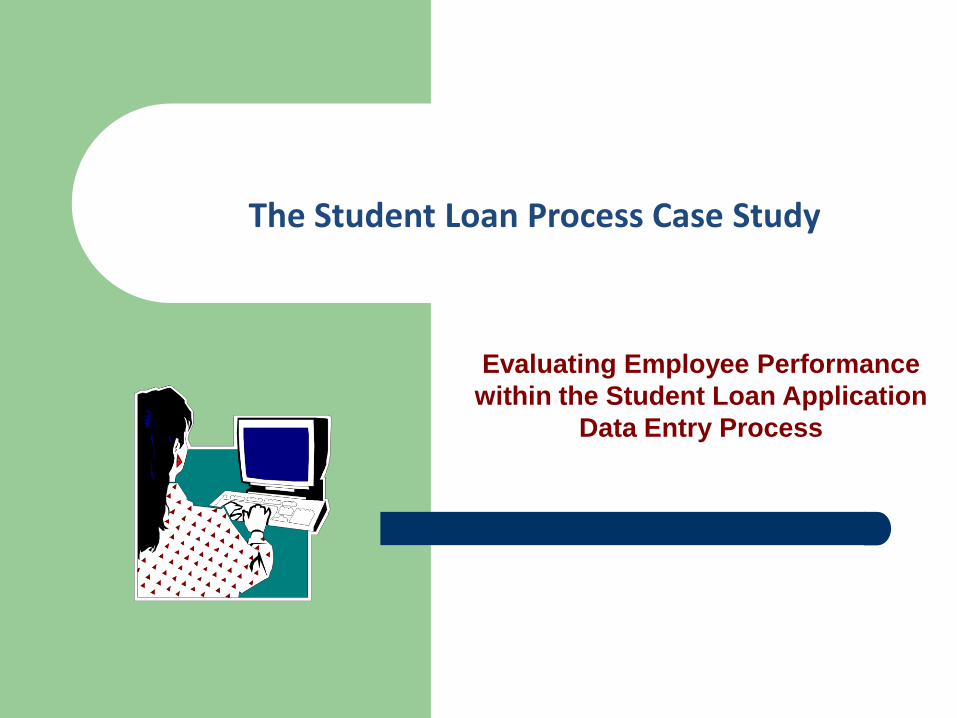
The Student Loan Process Case Study
Evaluating Employee Performance
within the Student Loan Application
Data Entry Process
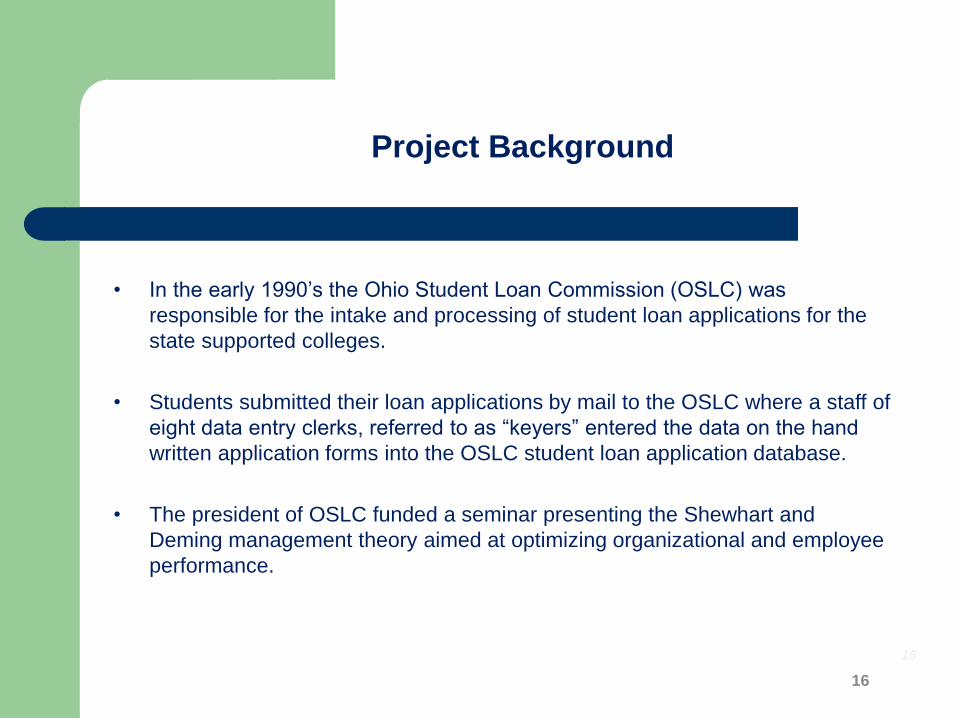
• In the early 1990’s the Ohio Student Loan Commission (OSLC) was
responsible for the intake and processing of student loan applications for the
state supported colleges.
• Students submitted their loan applications by mail to the OSLC where a staff of
eight data entry clerks, referred to as “keyers” entered the data on the hand
written application forms into the OSLC student loan application database.
• The president of OSLC funded a seminar presenting the Shewhart and
Deming management theory aimed at optimizing organizational and employee
performance.
Project Background
16
16

• During the seminar the supervisor over the data entry process raised
objections to the validity of the concepts being presented relative to the
management and improvement of human performance within administrative
processes.
• This particular supervisor managed the eight keyers who were responsible
for keying the data contained on the student application forms into the OSLC
application database.
• The eight keyers were State of Ohio unionized employees.
Project Background
17
17
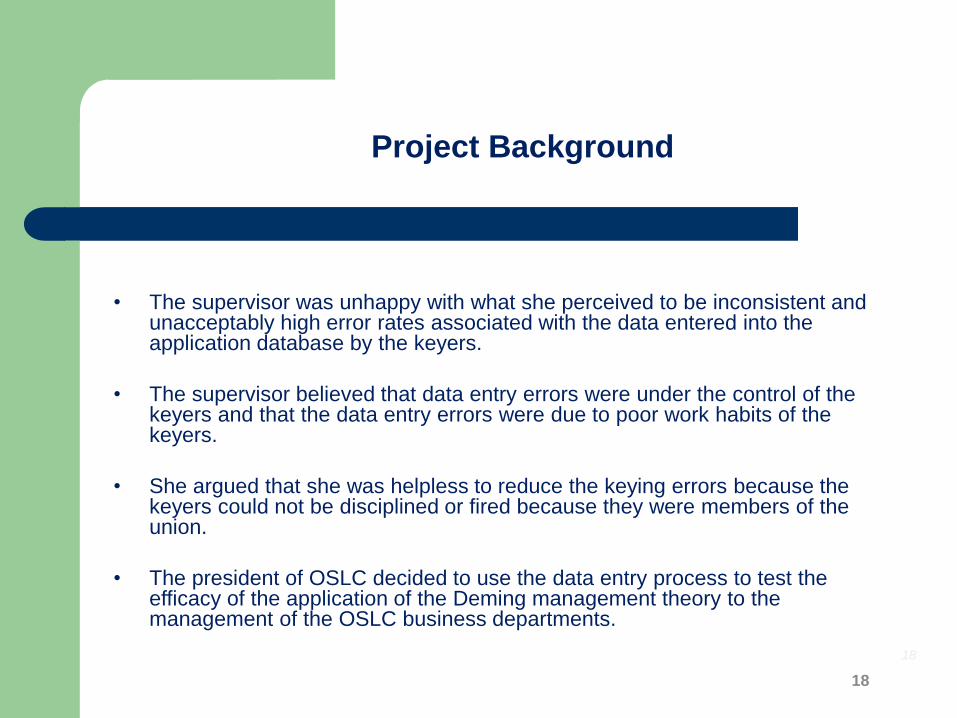
• The supervisor was unhappy with what she perceived to be inconsistent and unacceptably high error rates associated with the data entered into the application database by the keyers.
• The supervisor believed that data entry errors were under the control of the keyers and that the data entry errors were due to poor work habits of the keyers.
• She argued that she was helpless to reduce the keying errors because the keyers could not be disciplined or fired because they were members of the union.
• The president of OSLC decided to use the data entry process to test the efficacy of the application of the Deming management theory to the management of the OSLC business departments.
Project Background
18
18

• The goal of this project is to
improve the overall accuracy of
the data entered into the student
loan application database.
• The specific project objectives
include:
the creation of a process analysis
and monitoring system aimed at:
the assessment of the stability of
the process error rates over time
the identification of the causes of
data entry errors
the determination of the appropriate
local and global actions to take to
remove causes of data entry errors
from the process.
Project Goals and Objectives
19
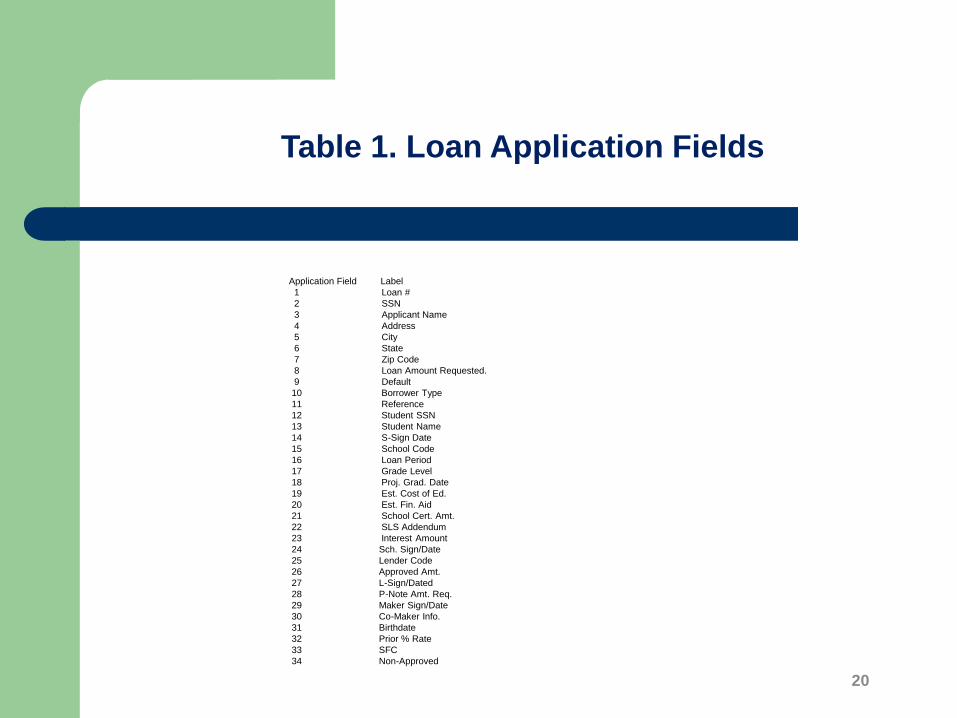
Table 1. Loan Application Fields
20
Application Field Label
1 Loan #
2 SSN
3 Applicant Name
4 Address
5 City
6 State
7 Zip Code
8 Loan Amount Requested.
9 Default
10 Borrower Type
11 Reference
12 Student SSN
13 Student Name
14 S-Sign Date
15 School Code
16 Loan Period
17 Grade Level
18 Proj. Grad. Date
19 Est. Cost of Ed.
20 Est. Fin. Aid
21 School Cert. Amt.
22 SLS Addendum
23 Interest Amount
24 Sch. Sign/Date
25 Lender Code
26 Approved Amt.
27 L-Sign/Dated
28 P-Note Amt. Req.
29 Maker Sign/Date
30 Co-Maker Info.
31 Birthdate
32 Prior % Rate
33 SFC
34 Non-Approved

• Q1: Is the process daily error rate stable over time?
• Q2: Are the keyer daily error rates {ERkd} stable over time?
• Q3: Are there detectable differences in the average daily error rate across the eight keyers?
• Q4: Are there any detectable differences in the volume of keyer errors across the 34 loan application fields?
• Q5: What local and/or global actions can be taken to reduce the future number of application field errors and the keyer daily error rates?
Management Questions of Interest
21 Source: Arial 9 pt. Flush left; Source, e.g. publication name. Title of source document. Date. URL if needed.

Cause System Design Diagram
22
MAIL ROOM
SUPERVISOR
KEYER
VERIFIER
YES
1
Mail Room
Delivers
Application to
Data Entry
2
Keyer Keys
in Data
3
Keyer Passes
Application to
the Verifier
4
5
Verifier Rekeys
Application.
Errors Detected?
6 7
Verifier
Corrects
Application
Error Log
Report
Created
8
Supervisor Reviews
Errors with Each
Keyer Weekly
NO
Data Entry
Supervisor Randomly
Distributes
50 Applications
to Each Keyer
Example of local action
on the individual keyer by
the supervisor in an
attempt to reduce the
errors.
Clear evidence of the
implicit assumption by
the supervisor that the
keying errors are under
the control of the
individual keyers.
22
The control of application
errors is based on an
inspection system.
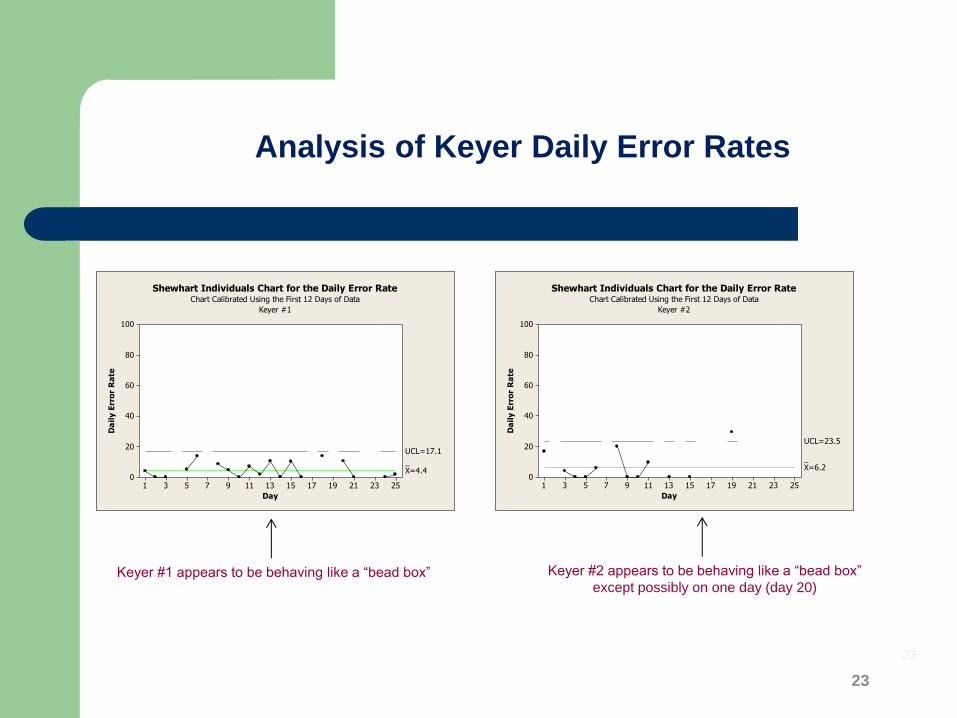
Analysis of Keyer Daily Error Rates
23
Keyer #1 appears to be behaving like a “bead box” Keyer #2 appears to be behaving like a “bead box”
except possibly on one day (day 20)
252321191715131197531
100
80
60
40
20
0
Day
Da
ily E
rro
r R
ate
_X=4.4
UCL=17.1
Shewhart Individuals Chart for the Daily Error RateChart Calibrated Using the First 12 Days of Data
Keyer #1
252321191715131197531
100
80
60
40
20
0
Day
Da
ily E
rro
r R
ate
_X=6.2
UCL=23.5
Shewhart Individuals Chart for the Daily Error RateChart Calibrated Using the First 12 Days of Data
Keyer #2
23

Analysis of Keyer Daily Error Rates
24
Keyer #3 appears to be behaving like a “bead box” Keyer #4 appears to have an upward trend in the
error rate over days 8-13, but then the error rate
drops to 0 on days 14 and 15. And despite this
possible trend, this keyer has the lowest overall
average error rate.
252321191715131197531
100
80
60
40
20
0
Day
Da
ily E
rro
r R
ate
_X=8.0
UCL=24.6
Shewhart Individuals Chart for the Daily Error RateChart Calibrated Using the First 12 Days of Data
Keyer #3
252321191715131197531
100
80
60
40
20
0
Day
Da
ily E
rro
r R
ate
_X=3.1UCL=8.6
Shewhart Individuals Chart for the Daily Error RateChart Calibrated Using the First 12 Days of Data
Keyer #4
24
252321191715131197531
100
80
60
40
20
0
Day
Da
ily E
rro
r R
ate
_X=12.1
UCL=22.8
LCL=1.3
Shewhart Individuals Chart for the Daily Error RateChart Calibrated Using the First 12 Days of Data Excluding Day 7
Keyer #5
25
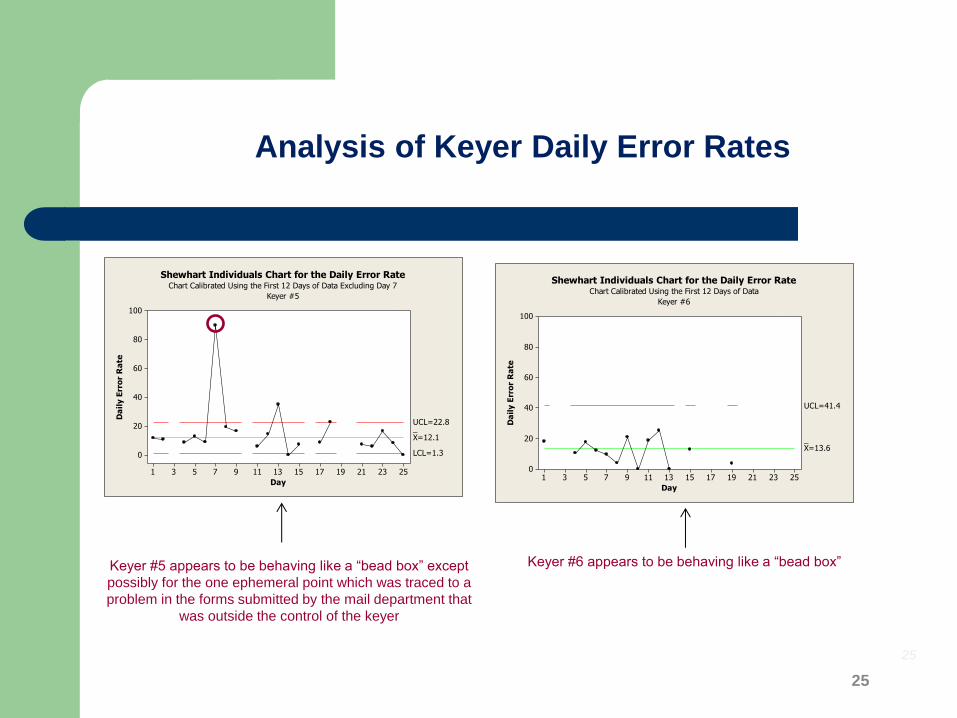
Analysis of Keyer Daily Error Rates
Keyer #5 appears to be behaving like a “bead box” except
possibly for the one ephemeral point which was traced to a
problem in the forms submitted by the mail department that
was outside the control of the keyer
Keyer #6 appears to be behaving like a “bead box”
252321191715131197531
100
80
60
40
20
0
Day
Da
ily E
rro
r R
ate
_X=13.6
UCL=41.4
Shewhart Individuals Chart for the Daily Error RateChart Calibrated Using the First 12 Days of Data
Keyer #6
25

26
Analysis of Keyer Daily Error Rates
Keyer #7 appears to be behaving like a “bead box” Keyer #8 appears to be behaving like a “bead box”
252321191715131197531
100
80
60
40
20
0
Day
Da
ily E
rro
r R
ate
_X=4.1
UCL=13.3
Shewhart Individuals Chart for the Daily Error RateChart Calibrated Using the First 12 Days of Data
Keyer #7
252321191715131197531
100
80
60
40
20
0
Day
Da
ily E
rro
r R
ate
_X=6.9
UCL=27.4
Shewhart Individuals Chart for the Daily Error RateChart Calibrated Using the First 12 Days of Data
Keyer #8
26
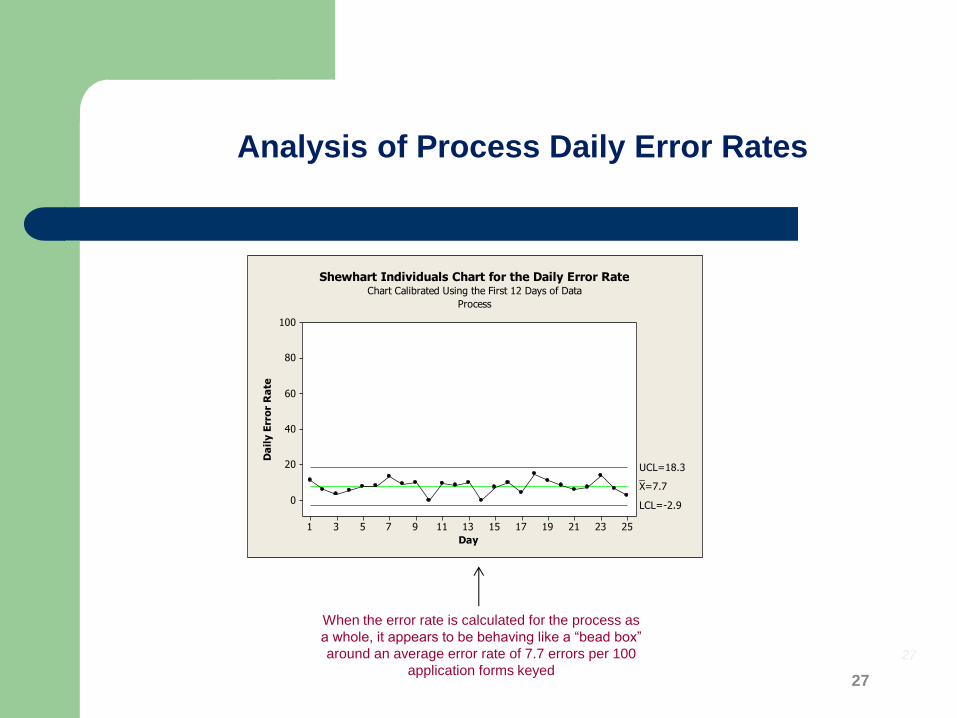
Analysis of Process Daily Error Rates
27
When the error rate is calculated for the process as
a whole, it appears to be behaving like a “bead box”
around an average error rate of 7.7 errors per 100
application forms keyed
252321191715131197531
100
80
60
40
20
0
Day
Da
ily E
rro
r R
ate
_X=7.7
UCL=18.3
LCL=-2.9
Shewhart Individuals Chart for the Daily Error RateChart Calibrated Using the First 12 Days of Data
Process
27
28
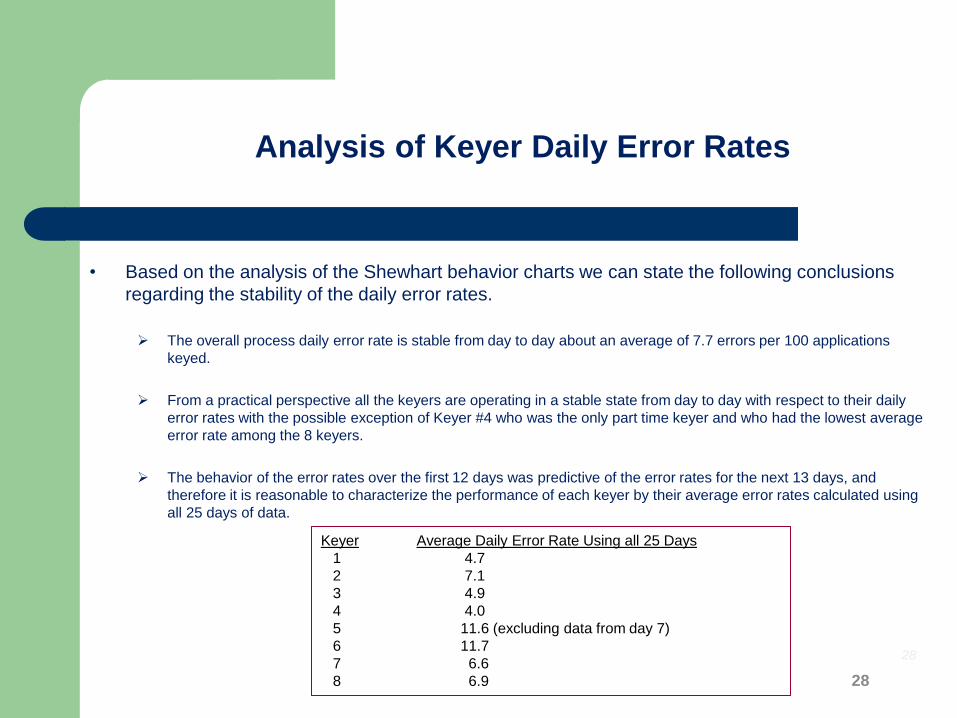
• Based on the analysis of the Shewhart behavior charts we can state the following conclusions
regarding the stability of the daily error rates.
The overall process daily error rate is stable from day to day about an average of 7.7 errors per 100 applications
keyed.
From a practical perspective all the keyers are operating in a stable state from day to day with respect to their daily
error rates with the possible exception of Keyer #4 who was the only part time keyer and who had the lowest average
error rate among the 8 keyers.
The behavior of the error rates over the first 12 days was predictive of the error rates for the next 13 days, and
therefore it is reasonable to characterize the performance of each keyer by their average error rates calculated using
all 25 days of data.
Analysis of Keyer Daily Error Rates
Keyer Average Daily Error Rate Using all 25 Days
1 4.7
2 7.1
3 4.9
4 4.0
5 11.6 (excluding data from day 7)
6 11.7
7 6.6
8 6.9 28
• Given that the keyers daily error rates appear to be stable over days, it is legitimate to ask if
there are any detectable differences in their overall average error rates.
It appears that keyers # 5 and #6 are operating outside the normal system with average error rates that
are greater than those for the remaining six keyers.
• This question can be answered by creating a Shewhart behavior chart using the daily error
rates as the response and the keyer as the rational subgroup.
Comparison of Average Keyer Error Rates
29

87654321
14
12
10
8
6
4
2
0
Keyer
Ave
rag
e E
rro
r R
ate
__X=5.68
UCL=11.07
LCL=0.29
Comparison of Keyer Average Error RatesChart Calibrated Excluding Keyer 5 and Keyer 6 Data
Comparison of Average Keyer Error Rates
30
Source: Arial 9 pt. Flush left; Source, e.g. publication name. Title of source document. Date. URL if needed.
Based on this analysis
there is evidence that
keyer #5 and keyer #6
average error rates are
detectably higher than
the other six keyers.
That is, these two keyers
are operating outside the
capability of the keying
process.
30
• With the analysis of the daily error rates completed, attention was turned to an analysis of the
volume of errors produced by each of the 34 fields on the application form.
• The method of Pareto analysis was used to analyze the volume of errors across the 34 fields
for the process as a whole and by the individual keyers.
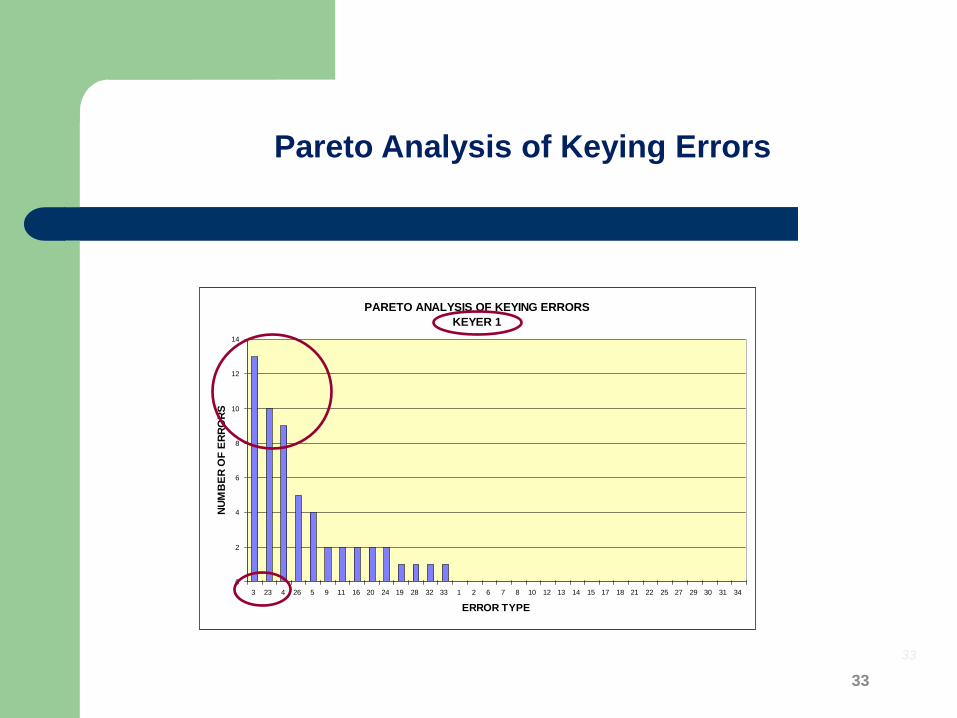
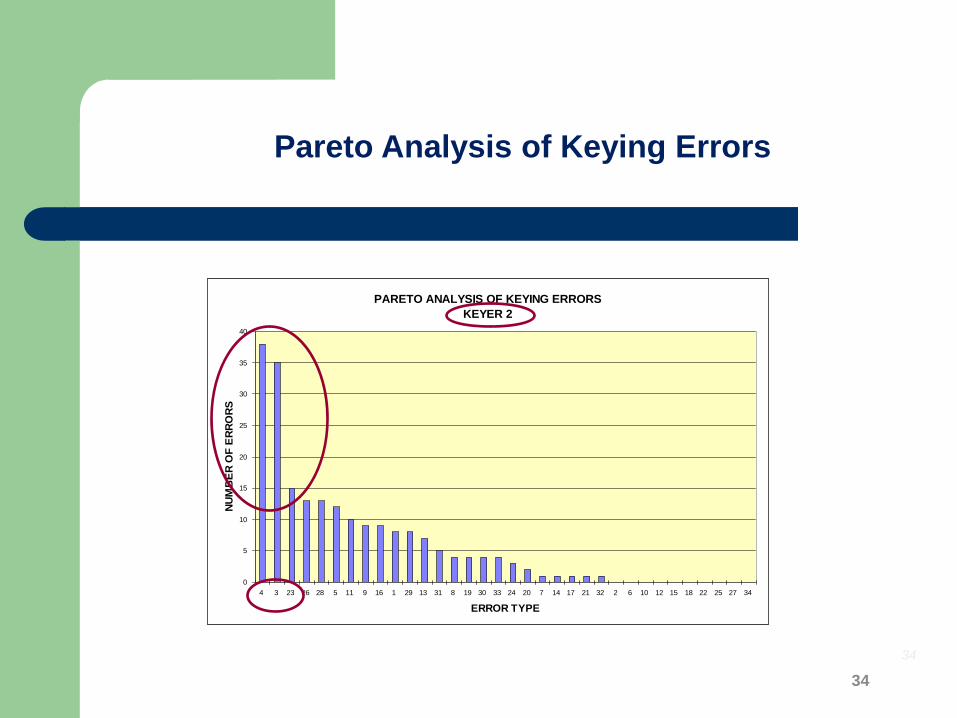
• The following Pareto charts indicate that in all cases, except for keyer #4, who was the only
part-time keyer, the dominate errors occurred for application form fields 3, 4 and 23 which
where the name, address and interest amount fields.
Analysis of Keying Errors by Application Field
31

32
Pareto Analysis of Keying Errors
PARETO ANALYSIS OF KEYING ERRORS
PROCESS
0
20
40
60
80
100
120
3 4 23 26 5 16 11 28 13 1 29 9 31 19 33 7 21 24 8 27 20 2 17 30 32 18 10 14 12 15 22 34 6 25
ERROR TYPE
NU
MB
ER
OF
ER
RO
RS
The Pareto analysis for the process
as a whole demonstrates that
there are 3 of the 34 fields
producing high error volumes.
These are fields 3, 4, and 23.
32
33
Pareto Analysis of Keying Errors
PARETO ANALYSIS OF KEYING ERRORS
KEYER 1
0
2
4
6
8
10
12
14
3 23 4 26 5 9 11 16 20 24 19 28 32 33 1 2 6 7 8 10 12 13 14 15 17 18 21 22 25 27 29 30 31 34
ERROR TYPE
NU
MB
ER
OF
ER
RO
RS
33
34
Pareto Analysis of Keying Errors
PARETO ANALYSIS OF KEYING ERRORS
KEYER 2
0
5
10
15
20
25
30
35
40
4 3 23 26 28 5 11 9 16 1 29 13 31 8 19 30 33 24 20 7 14 17 21 32 2 6 10 12 15 18 22 25 27 34
ERROR TYPE
NU
MB
ER
OF
ER
RO
RS
34

35
Pareto Analysis of Keying Errors
PARETO ANALYSIS OF KEYING ERRORS
KEYER 3
0
2
4
6
8
10
12
14
16
3 23 4 5 26 9 11 13 16 18 2 10 20 31 1 6 7 8 12 14 15 17 19 21 22 24 25 27 28 29 30 32 33 34
ERROR TYPE
NU
MB
ER
OF
ER
RO
RS
35
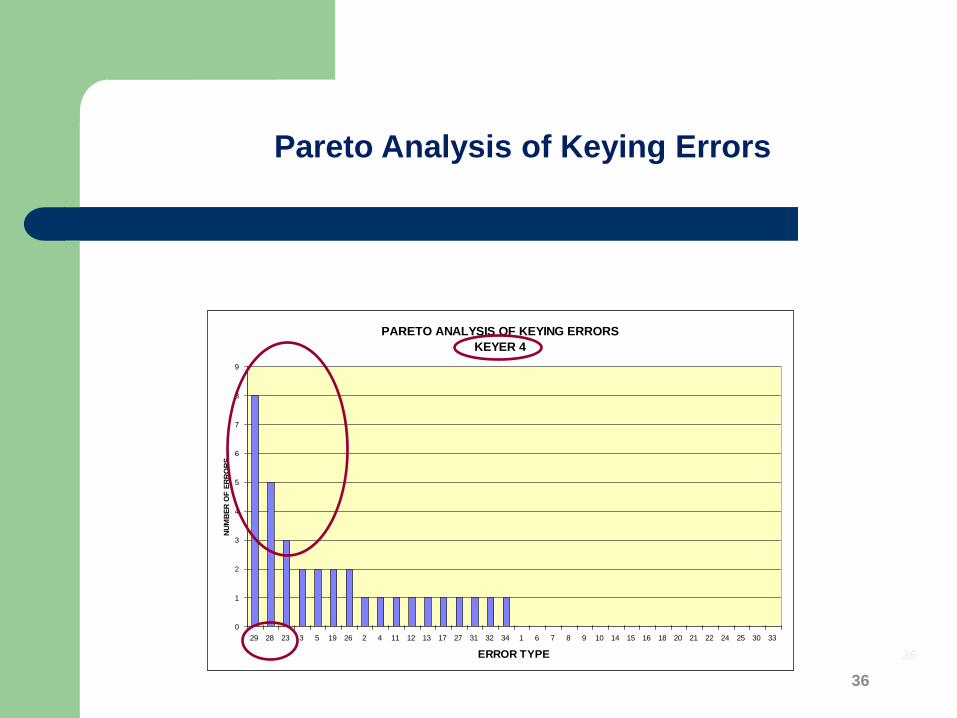
36
Pareto Analysis of Keying Errors
PARETO ANALYSIS OF KEYING ERRORS
KEYER 4
0
1
2
3
4
5
6
7
8
9
29 28 23 3 5 19 26 2 4 11 12 13 17 27 31 32 34 1 6 7 8 9 10 14 15 16 18 20 21 22 24 25 30 33
ERROR TYPE
NU
MB
ER
OF
ER
RO
RS
36

37
Pareto Analysis of Keying Errors
PARETO ANALYSIS OF KEYING ERRORS
KEYER 5
0
0.5
1
1.5
2
2.5
3
3.5
4
4.5
3 26 4 16 5 23 24 27 1 2 6 7 8 9 10 11 12 13 14 15 17 18 19 20 21 22 25 28 29 30 31 32 33 34
ERROR TYPE
NU
MB
ER
OF
ER
RO
RS
37

38
Pareto Analysis of Keying Errors
PARETO ANALYSIS OF KEYING ERRORS
KEYER 6
0
2
4
6
8
10
12
14
16
23 4 3 26 11 5 13 31 7 16 19 21 27 28 29 1 8 9 18 33 2 6 10 12 14 15 17 20 22 24 25 30 32 34
ERROR TYPE
NU
MB
ER
OF
ER
RO
RS
38

39
Pareto Analysis of Keying Errors
PARETO ANALYSIS OF KEYING ERRORS
KEYER 7
0
2
4
6
8
10
12
14
16
18
3 23 1 4 5 16 13 26 7 9 28 31 2 19 21 27 33 8 10 11 15 17 22 24 29 32 6 12 14 18 20 25 30 34
ERROR TYPE
NU
MB
ER
OF
ER
RO
RS
39

40
Pareto Analysis of Keying Errors
PARETO ANALYSIS OF KEYING ERRORS
KEYER 8
0
2
4
6
8
10
12
14
16
18
20
4 3 23 13 16 11 26 28 29 1 5 9 21 31 14 17 19 2 6 7 8 10 12 15 18 20 22 24 25 27 30 32 33 34
ERROR TYPE
NU
NB
ER
OF
ER
RO
RS
40
41
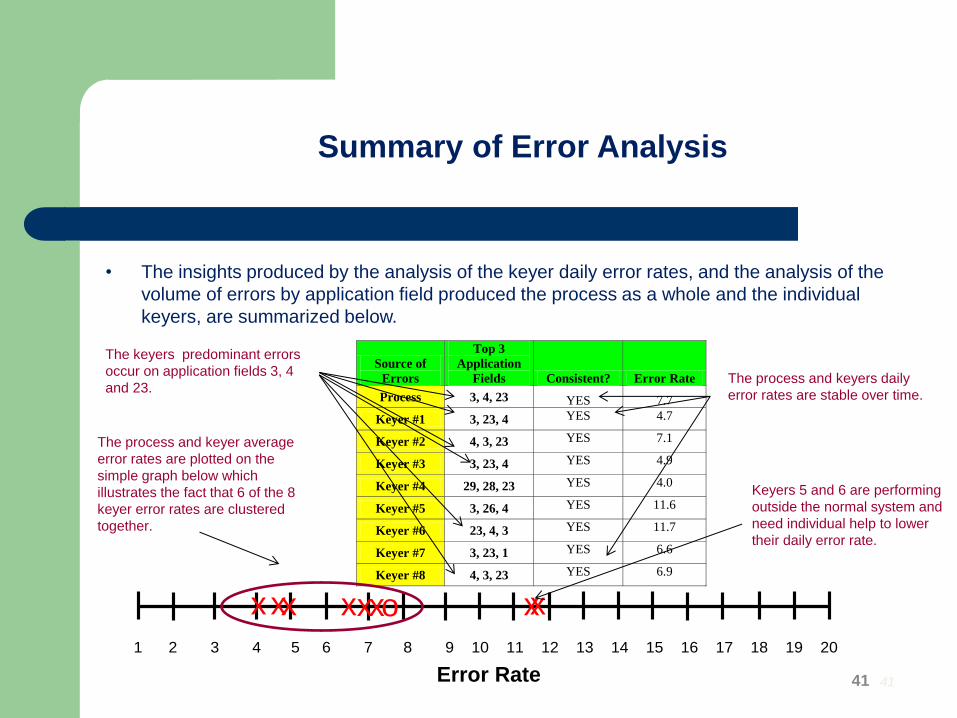
Summary of Error Analysis
• The insights produced by the analysis of the keyer daily error rates, and the analysis of the
volume of errors by application field produced the process as a whole and the individual
keyers, are summarized below.
1 2 3 4 5 6 7 8 9 10 11 12 13 14 15 16 17 18 19 20
Error Rate
o x x x x x x x x
Source of
Errors
Top 3
Application
Fields Consistent? Error Rate
Process 3, 4, 23 YES 7.7
Keyer #1 3, 23, 4 YES 4.7
Keyer #2 4, 3, 23 YES 7.1
Keyer #3 3, 23, 4 YES 4.9
Keyer #4 29, 28, 23 YES 4.0
Keyer #5 3, 26, 4 YES 11.6
Keyer #6 23, 4, 3 YES 11.7
Keyer #7 3, 23, 1 YES 6.6
Keyer #8 4, 3, 23 YES 6.9
The process and keyer average
error rates are plotted on the
simple graph below which
illustrates the fact that 6 of the 8
keyer error rates are clustered
together.
The process and keyers daily
error rates are stable over time.
The keyers predominant errors
occur on application fields 3, 4
and 23.
Keyers 5 and 6 are performing
outside the normal system and
need individual help to lower
their daily error rate.
41

Conclusions
42
• C1: In general, the keyers are performing in a stable manner over time.
• C2: Keyers 5 and 6 appear to be operating with higher error rates than the other six keyers
and may need local help to improve their error rates.
• C3: In general the keyers are making the same common errors on fields 3,4, and 23 which
must be due to process design problems because the process design is the only thing the
keyers have in common.
• Fields 3 and 4 are name and address fields which are free form
• Field 23 is the loan interest amount field that is currently manually calculated by
the keyer using daily interest rate tables provided by management.
42

• Q1: Is the process daily error rate stable over time? - Yes
• Q2: Are the keyer daily error rates {ERkd} stable over time? - Yes
• Q3: Are there detectable differences in the average daily error rate across the eight keyers? - Yes, Keyer #5 and Keyer #6 are operating outside the normal system.
• Q4: Are there any detectable differences in the volume of keyer errors across the 34 loan application fields? - Yes, fields 3, 4 and 23 are the dominant fields producing keying errors.
• Q5: What local and/or global actions can be taken to reduce the future number of application field errors and the keyer daily error rates? – See recommendations
Answers to the Research Questions
43

Recommendations
44
• R1: Management should immediately take action to remove the causes of the
errors for application fields 3, 4, and 23 that are common to all keyers.
Fields 3 and 4 are Applicant Name and Address which are currently free text fields.
The application form should be redesigned to block the name and address fields to
force the applicant to print their name and address.
Field 23 is the Loan Interest Amount field that is currently manually calculated by the
keyer using daily interest rate tables provided by management. This calculation should
be automated which will eliminate this error category entirely.
44

Recommendations
45
• R2: Because the keyers are operating in a stable manner over time, and are
subject to making the same common errors associated with application fields 3,
4, and 23, the weekly counseling sessions involving the supervisor are
ineffective at reducing the error rates and should be discontinued.
• These sessions are an attempt to take local action to remove common
causes of variation and will not be successful.
• R3: Management should take local action on Keyer 5 and Keyer 6 in an attempt
to help them reduce their average error rates because although their daily error
rates are stable over time, they are operating at an average error rate that is
outside the capability of the system.
45

Recommendations
46
• R4: Management should use the performance measurement database to create
a monitoring system capable of capturing and analyzing the keyer error rates on
a daily basis.
46

47
12/2
015
11/2
015
10/2
015
09/2
015
08/2
015
07/2
015
06/20
15
05/2
015
04/2
015
03/2
015
02/2
015
01/2
015
12000
11000
10000
9000
8000
7000
6000
5000
4000
3000
Month
To
tal N
um
ber
of
Co
rpo
rate
Filin
gs
_X=7564
UCL=11323
LCL=3805
Total Monthly Number of Corporate FilingsVariation Across Months
Data points used for the calculations: 1-4

48
15001200900600300
30
25
20
15
10
5
0
Productivity
Fre
qu
en
cy
Distribution of Employee Monthly Corporate Filings

49
12/2
015
11/2
015
10/2
015
09/2
015
08/2
015
07/2
015
06/2
015
05/2
015
04/2
015
03/2
015
02/2
015
01/2
015
1400
1200
1000
800
600
400
200
0
Month
To
tal N
um
ber
of
Co
rpo
rate
Filin
gs
_X=619
UCL=1253
LCL=-15
Number of Monthly Corporate FilingsEmployee - 1

50
12/2
015
11/2
015
10/2
015
09/2
015
08/2
015
07/2
015
06/2
015
05/2
015
04/2
015
03/2
015
02/2
015
01/2
015
1400
1200
1000
800
600
400
Month
To
tal N
um
ber
of
Co
rpo
rate
Filin
gs
_X=824
UCL=1301
LCL=346
Number of Monthly Corporate FilingsEmployee - 2

51
12/2
015
11/2
015
10/2
015
09/2
015
08/2
015
07/2
015
06/2
015
05/2
015
04/2
015
03/2
015
02/2
015
01/2
015
1200
1000
800
600
400
200
0
Month
To
tal N
um
ber
of
Co
rpo
rate
Filin
gs
_X=586
UCL=1181
LCL=-9
Number of Monthly Corporate FilingsEmployee - 3

52
12/2
015
11/2
015
10/2
015
09/2
015
08/2
015
07/2
015
06/2
015
05/2
015
04/2
015
03/2
015
02/2
015
01/2
015
1200
1100
1000
900
800
700
600
500
400
Month
To
tal N
um
ber
of
Co
rpo
rate
Filin
gs
_X=770.3
UCL=1127.8
LCL=412.7
Number of Monthly Corporate FilingsEmployee - 4

53
12/2
015
11/2
015
10/2
015
09/2
015
08/2
015
07/2
015
06/2
015
05/2
015
04/2
015
03/2
015
02/2
015
01/2
015
1600
1400
1200
1000
800
600
400
200
Month
To
tal N
um
ber
of
Co
rpo
rate
Filin
gs
_X=843
UCL=1448
LCL=239
Number of Monthly Corporate FilingsEmployee - 5
54
12/2
015
11/2
015
10/2
015
09/2
015
08/2
015
07/2
015
06/2
015
05/2
015
04/2
015
03/2
015
02/2
015
01/2
015
1500
1250
1000
750
500
Month
To
tal N
um
ber
of
Co
rpo
rate
Filin
gs
_X=906
UCL=1372
LCL=441
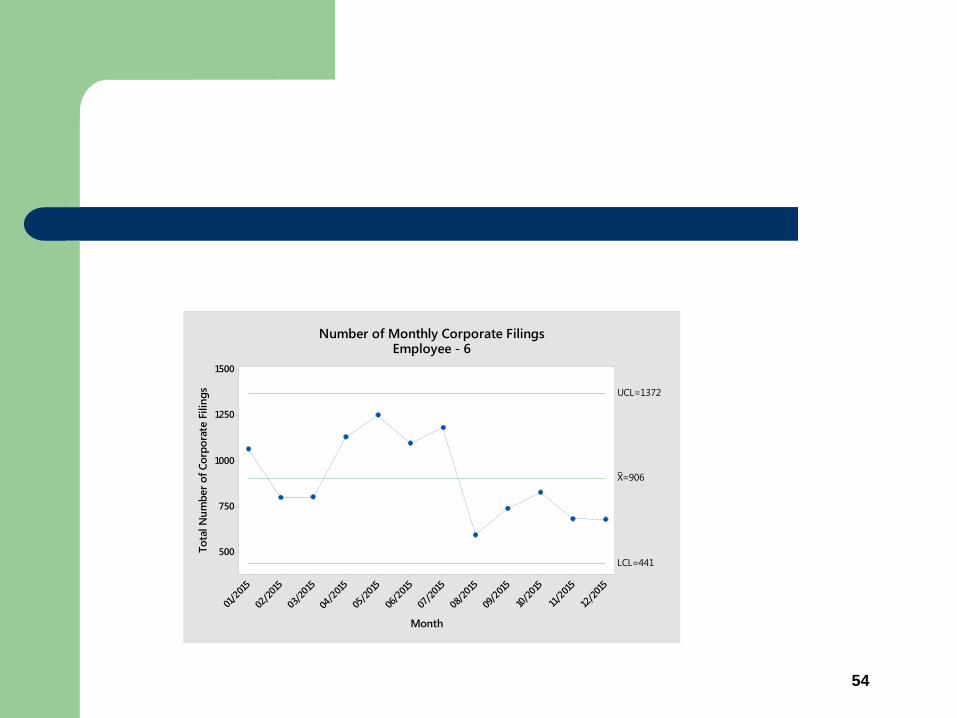
Number of Monthly Corporate FilingsEmployee - 6

55
12/2
015
11/2
015
10/2
015
09/2
015
08/2
015
07/2
015
06/2
015
05/2
015
04/2
015
03/2
015
02/2
015
01/2
015
1200
1000
800
600
400
200
0
Month
To
tal N
um
ber
of
Co
rpo
rate
Filin
gs
_X=589
UCL=1128
LCL=51
Number of Monthly Corporate FilingsEmployee - 7

56
12/2
015
11/2
015
10/2
015
09/2
015
08/2
015
07/2
015
06/2
015
05/2
015
04/2
015
03/2
015
02/2
015
01/2
015
1000
800
600
400
200
0
Month
To
tal N
um
ber
of
Co
rpo
rate
Filin
gs
_X=529
UCL=1029
LCL=30
Number of Monthly Corporate FilingsEmployee - 8

57
12/2
015
11/2
015
10/2
015
09/2
015
08/2
015
07/2
015
06/2
015
05/2
015
04/2
015
03/2
015
02/2
015
01/2
015
1600
1400
1200
1000
800
600
400
200
0
Month
To
tal N
um
ber
of
Co
rpo
rate
Filin
gs
_X=755
UCL=1537
LCL=-27
Number of Monthly Corporate FilingsEmployee - 9

58
12/2
015
11/2
015
10/2
015
09/2
015
08/2
015
07/2
015
06/2
015
05/2
015
04/2
015
03/2
015
02/2
015
01/2
015
1800
1600
1400
1200
1000
800
600
400
200
0
Month
To
tal N
um
ber
of
Co
rpo
rate
Filin
gs
_X=912
UCL=1646
LCL=178
Number of Monthly Corporate FilingsEmployee - 10

59
12/2
015
11/2
015
10/2
015
09/2
015
08/2
015
07/2
015
06/2
015
05/2
015
04/2
015
03/2
015
02/2
015
01/2
015
1400
1200
1000
800
600
400
200
Month
To
tal N
um
ber
of
Co
rpo
rate
Filin
gs
_X=798
UCL=1385
LCL=212
Number of Monthly Corporate FilingsEmployee - 11

60
12/2
015
11/2
015
10/2
015
09/2
015
08/2
015
07/2
015
06/2
015
05/2
015
04/2
015
03/2
015
02/2
015
01/2
015
1800
1600
1400
1200
1000
800
600
400
200
0
Month
To
tal N
um
ber
of
Co
rpo
rate
Filin
gs
_X=791
UCL=1451
LCL=132
1
Number of Monthly Corporate FilingsEmployee - 12
61
12/2
015
11/2
015
10/2
015
09/2
015
08/2
015
07/20
15
06/2
015
05/2
015
04/2
015
03/2
015
02/2
015
01/2
015
1500
1400
1300
1200
1100
1000
900
800
700
Month
To
tal N
um
ber
of
Co
rpo
rate
Filin
gs
_X=1111.4
UCL=1465.8
LCL=757.0
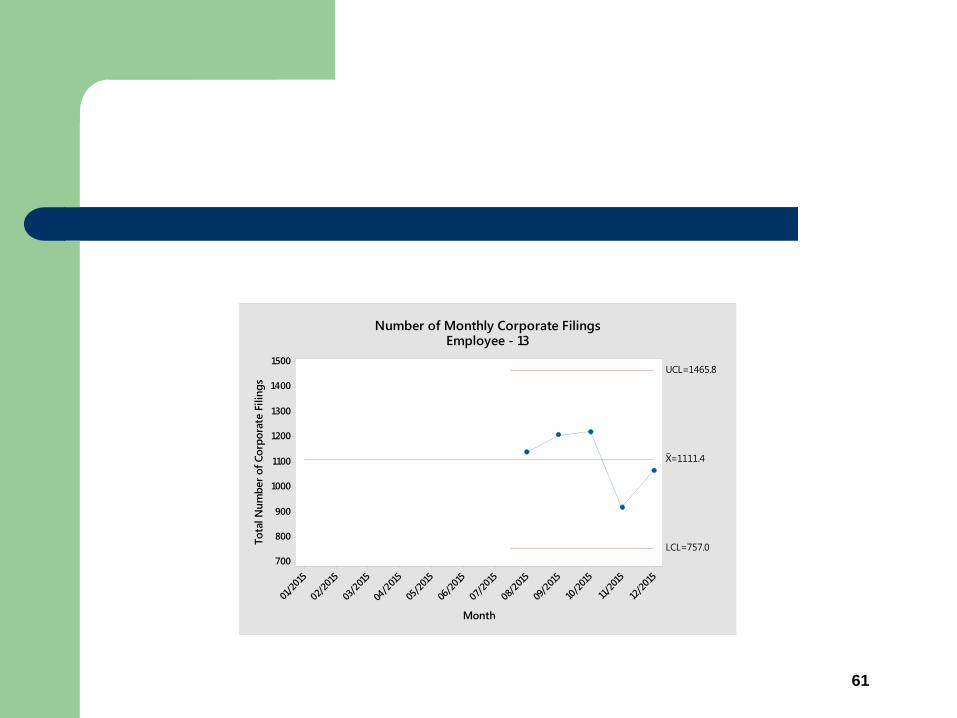
Number of Monthly Corporate FilingsEmployee - 13
62

63
13121110987654321
1200
1000
800
600
400
Employee ID
Mo
nth
y A
vera
ge C
laim
s P
roce
ssed
__X=760.5
UCL=1076.5
LCL=444.6
13121110987654321
400
300
200
100
0
Employee ID
Mo
nth
y A
vera
ge C
laim
s P
roce
ssed
_S=221.4
UCL=462.4
LCL=0
1
1
Comparison of Employee Productivity Rates
Tests are performed with unequal sample sizes.

64
10
5
01
51
02
52
03
003 006 009 0021 005
N
yc
ne
uq
erF
sgniliF etaroproC fo rebmu
P
elbairaV
ytivitcudorP detsujdA eeyolpmE
ytivitcudor
H ytivitcudorP detsujdA eeyolpmE ,ytivitcudorP fo margotsi

65
How is Performance Improved?
> 80% Actions
on the Process
< 20% Actions
within the Process