An Introduction to South African Accident...
10
41 An Introduction to South African Accident Statistics Many workers have an intuitive feeling that work in South African factories and mines is dangerous. For a union wanting to take action over hazardous work, accident statistics can be very useful to help focus campaigns on the most dangerous industries and jobs. They are vital for analysing trends and for making comparisons with other countries and thus can assist unions in their negotiations around specific health and safety issues. But for the inexperienced analyst at least three problems may be encountered: 1. Where to find accident statistics; 2. What are the problems with the raw statistics. Do the available statistics accurately represent what is happening on the shop floor, in the trucking industry, or underground in the mines? 3. How 10 make sense of the statistics. What statistics - or indices - actually provide a meaningful indication of danger and accident trends. This article provides a simplified and critical guide to published South African accident statistics and points out some of the ways in which the statistics are misused. In the last part, the minimum requirements for ihe adequate reporting of accident statistics are outlined. Hopefully with the help of this article - and a little perseverance - any person will be able to get to grips with the statistics. Where to find accident statistics There are four important sources of accident statistics: 1. The Annual Reports of the Departments of Manpower (DOM) - previously the Department of Labour. These reports cover manufacturing and general industry. 2. The Annual Reports of the Department of Mineral and Energy Affairs (DMEA) and their annual Statistics reports which cover the mines. 3. The Chamber of Mines publish detailed mine accident statistics for their member mines. 1 1. Chamber of Mines of South Africa, Annual Reports; and Mine Safety Division Chamber of Mines of South Africa, Death and Injury Rate Tables Gold, Coal and Other Mineral Mines.
Transcript of An Introduction to South African Accident...

41
An Introduction to South African Accident
Statistics Many workers have an intuitive feeling that work in South African factories and mines is dangerous. For a union wanting to take action over hazardous work, accident statistics can be very useful to help focus campaigns on the most dangerous industries and jobs. They are vital for analysing trends and for making comparisons with other countries and thus can assist unions in their negotiations around specific health and safety issues. But for the inexperienced analyst at least three problems may be encountered: 1. Where to find accident statistics; 2. What are the problems with the raw statistics. Do the available statistics accurately represent what is happening on the shop floor, in the trucking industry, or underground in the mines? 3. How 10 make sense of the statistics. What statistics - or indices - actually provide a meaningful indication of danger and accident trends.
This article provides a simplified and critical guide to published South African accident statistics and points out some of the ways in which the statistics are misused. In the last part, the minimum requirements for ihe adequate reporting of accident statistics are outlined. Hopefully with the help of this article - and a little perseverance - any person will be able to get to grips with the statistics.
Where to find accident statistics
There are four important sources of accident statistics: 1. The Annual Reports of the Departments of Manpower (DOM) - previously the Department of Labour. These reports cover manufacturing and general industry. 2. The Annual Reports of the Department of Mineral and Energy Affairs (DMEA) and their annual Statistics reports which cover the mines. 3. The Chamber of Mines publish detailed mine accident statistics for their member mines.1
1. Chamber of Mines of South Africa, Annual Reports; and Mine Safety Division Chamber of Mines of South Africa, Death and Injury Rate Tables Gold, Coal and Other Mineral Mines.
42 Accident statistics
4. The statistics of the Workmen's Compensation Commissioner (WCC) which cover all accidents that have been compensated.2
What statistics do these reports have and what are their shortcomings?
Which reports you use depend on what industry you are interested in. The Annual Reports of the DOM have figures of reported injuries and fatalities since the early 1920's. The Machinery and Occupational Safely Act (MOSA, 1983) defines a reportable accident as one in which a person - either through using machinery or a hazardous working condition - dies, becomes unconscious, loses part of a limb, or is otherwise injured so that for at least 14 days he or she is off work or cannot continue with the activity at the time of the accident. MOSA applies to all employees including agricultural workers with the following exceptions: - mines and works (covered by the Mines and Works Act (MWA 1956)}; - the SA Transport Services; - explosives factories and magazines (covered by the Explosives Act of 1956); - domestic workers; - MOSA also excludes traffic accidents on public roads (for example to truck drivers) and accidents in private houses (for example injuries to domestic workers).
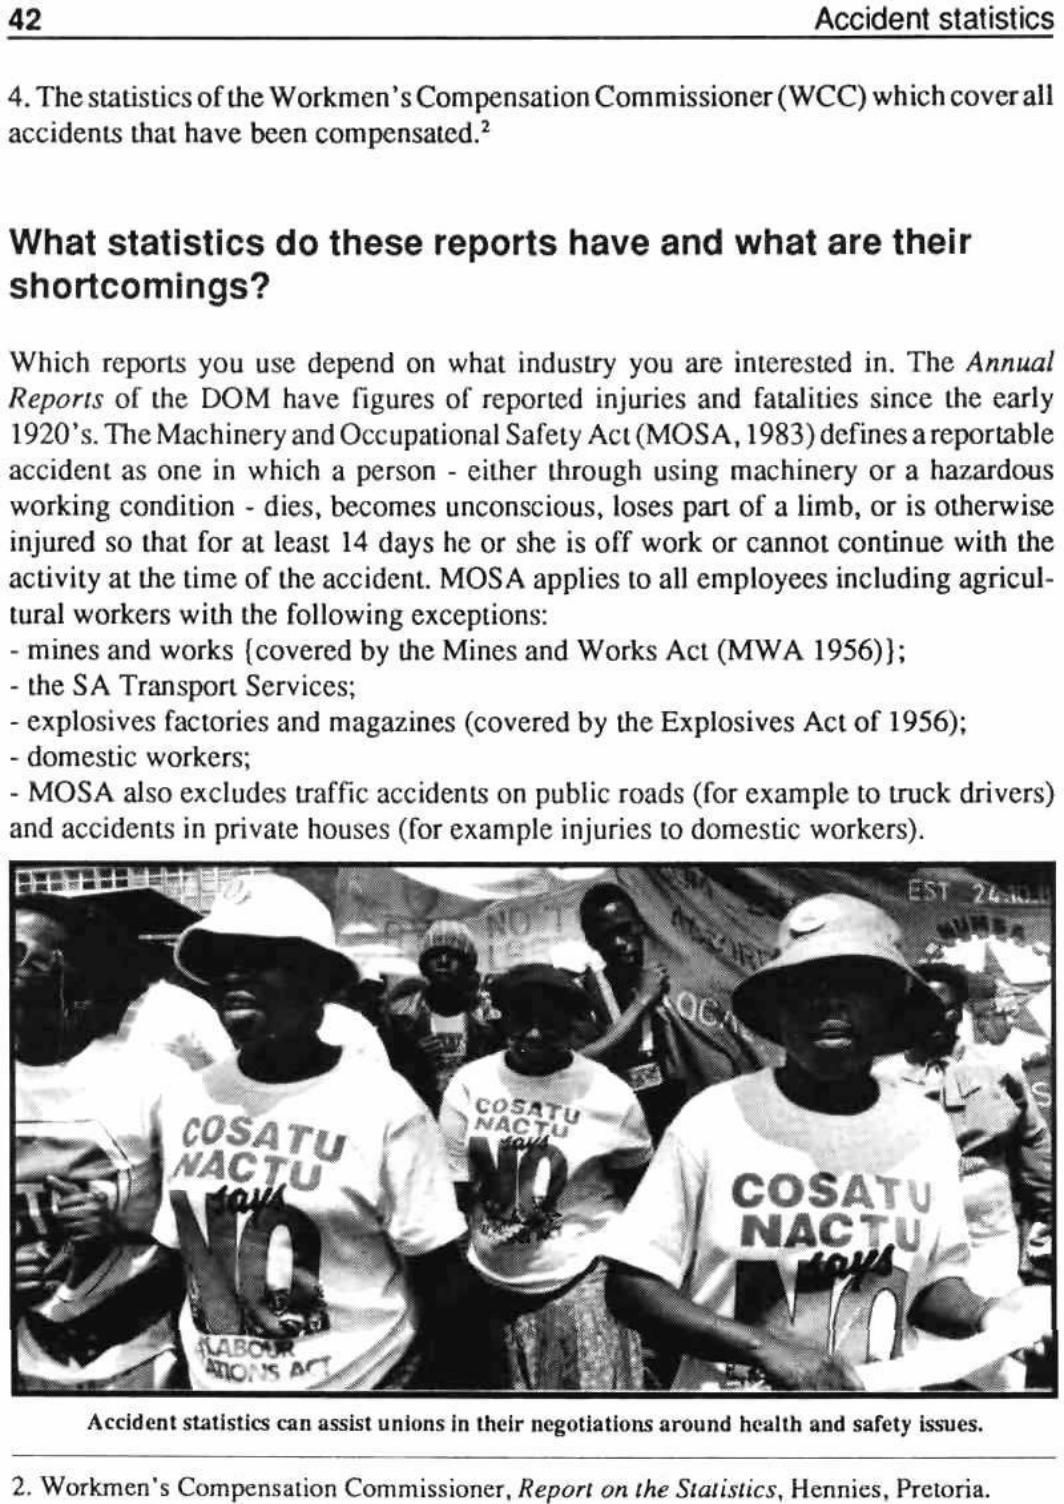
Accident statistics can assist unions in their negotiations around health and safety issues.
2. Workmen's Compensation Commissioner, Report on the Statistics, Hennies, Pretoria.

Accident statistics 43
DOM statistics
There are three main problems with the DOM statistics. • The most important is that since 1983, the DOM no longer publish employment data so it is not possible to calculate incidence rates (the rate of injuries per 1000 workers per year). • Secondly, the exclusion of traffic accidents means that the single greatest cause of work related fatalities is neglected. Road traffic accidents are responsible for approximately one third of all occupational fatalities as shown in Table 1 derived from WCC data. This exclusion means that fatalities incurred by transport drivers, one of the occupational groups at greatest risk of fatal accidents, do not appear in the DOM statistics.
YEAR
1983
1984
1985
COMPENSATED AUTOMOBILE FATALITIES
571
610
553
TOTAL COMPENSATED
FATALITIES
1873
1691
1551 _ 1
AUTOMOBILE FATALITIES AS A PERCENTAGE OF ALL FATALITIES
30%
36%
36%
Table I: Compensated automobile fatalities as a proportion of all compensated fatal accidents.
• Thirdly, the 14 days off work threshold for defining an accident is absurdly long and leads to under-reporting. A wide range of factors, such as accident and sick leave benefits, affect the time workers lake off. The time taken also relates to economic and managerial pressures to return to work.3Certainly it is much easier to shorten a 14-day recovery period by one day to 13 days (when the accident becomes non-reportable) than to do the same with a 1 -day or 3-day period. Preferably, all accidents which lead to one (or possibly three) days off work should be reported.
DMEA statistics
Similarly to the DOM, the DMEA publishes statistics of all accidents in mines and works that result in fatalities, permanent disability, an absence from work of at least 14 days, unconsciousness, electrocution or heat stroke. There are four major problems in the DMEA data:
3. Robens Committee of Inquiry, 1972. Safety and Health at Work. HMSO Cmnd. 5034, p 135.

44 Accident statistics
• Firstly, as in the case of the DOM, the excessively long time threshold of 14 days for reportable accidents. • Secondly, separate rates are not given for surface and underground accidents. Instead they are all just lumped together. This gives a much more favourable rate than the actual underground rate justifies. The actual underground rate is die one usually published in other countries. Table 2 provides examples for the gold and coal mines. • Thirdly, the DMEA since 1983 has simply stopped publishing their annual Statistics* While overall figures are given in the Annual Reports, these do not provide any of die breakdowns necessary for meaningful analysis.
Tabic 2: Comparison of underground, surface and "overall" (underground and surface) fatality rates for gold and coal mines for 1988 (Chamber of Mines members).
The Chamber of Mines accident statistics
Fortunately, the Chamber of Mines publish a fairly detailed breakdown of accidents on their member mines. The Chamber has heeded criticisms of their earlier statistics. In recent years they have made a number of improvements to their statistics, including publication of separate underground and surface statistics.
WCC statistics
The WCC's annual Report on the Statistics is the most frequently quoted source of statistics. These include motor vehicle accidents arising out of or in the course of employment. The WCC report covers all WCA compensated accidents, including government departments, SATS, construction and the mines. Persons employed on a casual basis and domestic workers are not covered by the WCA, nor are employees whose incomes exceed the earnings limit of R36 000 per year.

Accident statistics 45
The accident experiences of different industries are reported to different degrees in the WCC report. The WCC's "Accident Fund" is analysed in a reasonable amount of detail. However, the mutual associations (private assurance companies like the Rand Mutual of the Chamber of Mines), municipalities and state departments each have their own compensation arrangements. These are not analysed to the same degree and much critical data is not published at all, for example employment figures. Also, accident figures of the mutual associations are lumped together in some cases, thus preventing analysis of the accident experience of individual industries. For example, in some tables die Rand Mutual (covering mines). Federated Employers Mutual Association (covering building and construction) and the local authorities are combined, making it impossible to calculate accident incidence, severity, extent of disability, cause of injury, body part injured, etc, for any of these industries individually. This information is particularly important for the mining and building and construction industries as they have high accident rates. If unions had access to the information for particular industries in which they are organising, it would place them in a stronger position to negotiate specific health and safety issues.
Disabling accident rates should be compared to fatality figures because, on their own, accidents rates may appear misleading!y Favourable.
46 Accident statistics
Another major limitation in the WCC data again concerns the Rand Mutual. All Rand Mutual cases involving three or fewer days off work are not reported to the WCC. Since mines covered by the Rand Mutual have the highest accident rates in the country, this omission results in the WCC publishing a misleadingly favourable figure for the total South African disabling injury frequency rate (DIFR). Yet it is precisely this figure which is widely publicised by safety organisations such as NOSA.
The WCC statistics include motor vehicle accidents but these are lumped together with other accidents except in one table. This makes it impossible to separate vehicle related accidents from * 'factory floor*' accidents. Since transport related accidents make up about a third of all fatalities (Table 1), their inclusion or exclusion can considerably alter the accident profile of any sector.
NOSA statistics
In addition to the above, the National Occupational Safety Association (NOSA) collects figures for "disabling injuries" (accidents resulting in one shift or more off work) and hours of exposure from affiliated companies. These statistics are of limited value. No details are collected about the severity of injury, for example whether an accident resulted in one day off work or death, the cause of injury, the location of injury, etc. Further, the NOSA data are limited only to 4 727 out of a total of 60 196 industrial enterprises. NOSA targets large companies for their schemes and claims that their affiliates have lower accident rates than the average. This is hardly surprising because it is a well established fact that larger companies have lower accident rates than smaller ones! NOSA keep their data confidential making it impossible to undertake any meaningful assessment of accident trends at the enterprises concerned or the claims made by NOSA.4
Measuring accident rates: how to avoid confusing terms?
To examine accident trends, it is necessary to work out accident rates. There are basically two approaches: the more accurate straightforward approach, or the inaccurate confusing approach!
The straightforward approach is to express injuries, permanent disabilities or fatalities as the number that occur per thousand workers per year. This is called the incidence rate. It is a measure that anyone can easily understand and work out on a pocket calculator. All you need to know is the number of accidents and the number of workers who work in the industry or factory concerned. For example, if two workers are killed
4. NOSA, 1988. Annua! Report 1987-8, Pretoria, pp 35 and 50.
47 Accident statistics
at a factory that employs 20 000 workers, ihen the fatality incidence rate is worked out as follows:
2 fatalities x 1 000 _ 0 j fata]j tjes per thousand workers per year. 20 000 workers
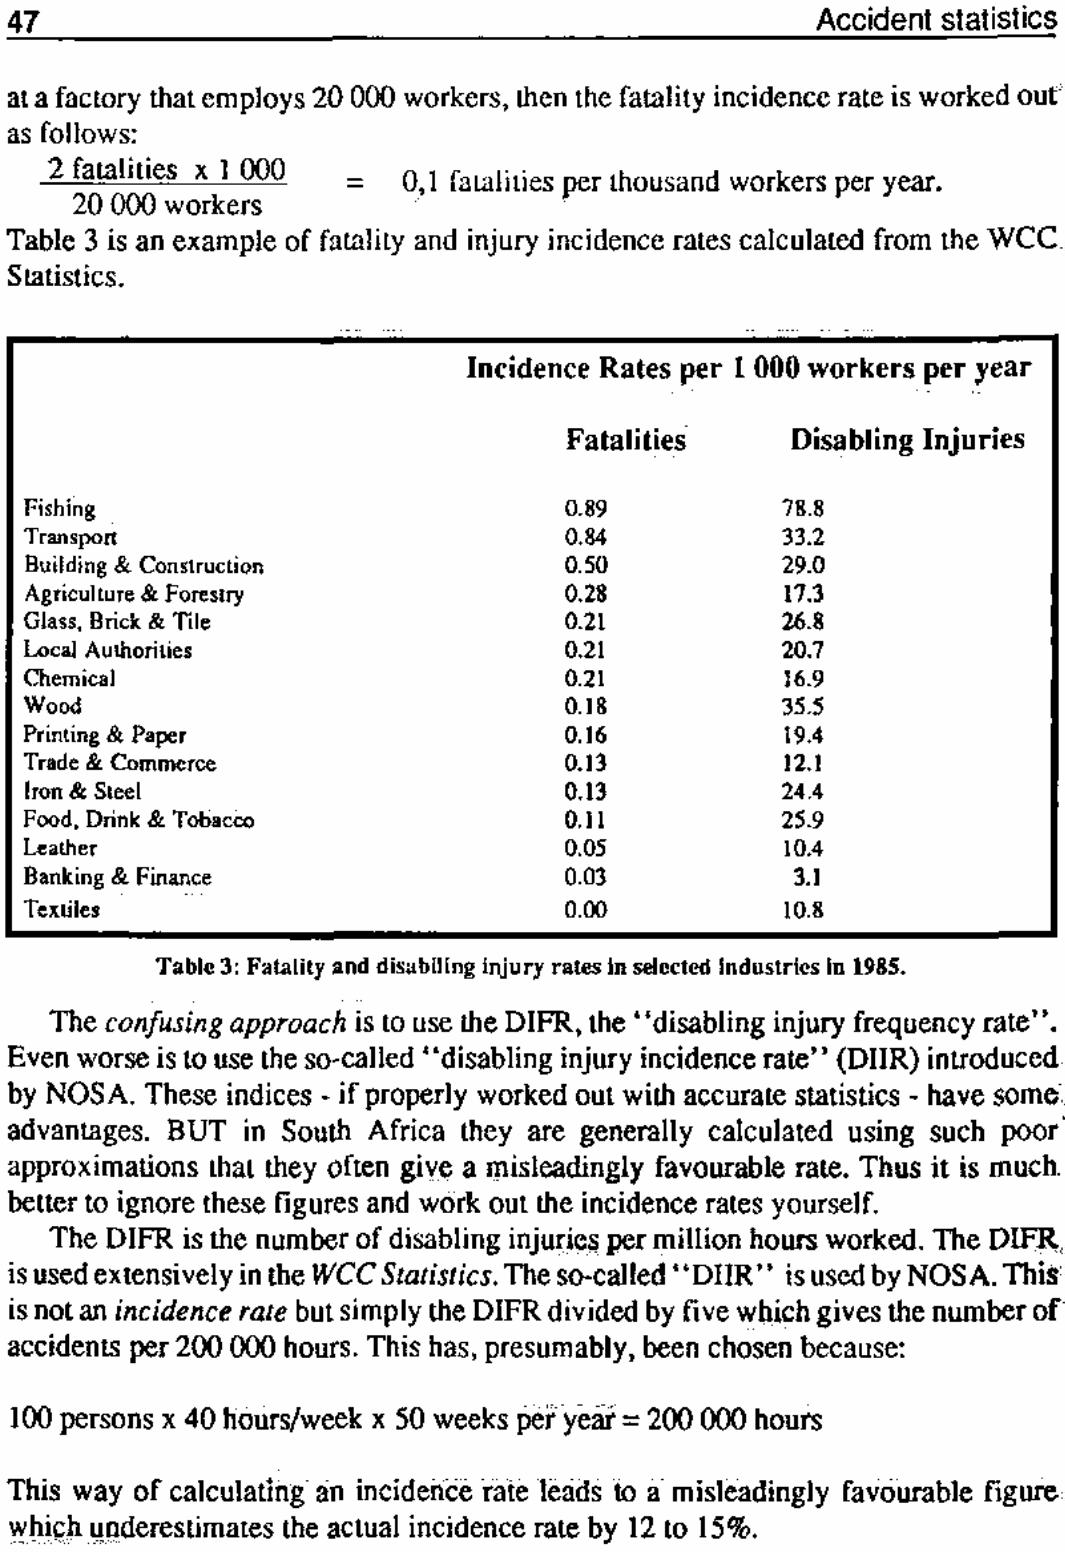
Table 3 is an example of fatality and injury incidence rates calculated from the WCC Statistics.
Fishing Transport Building & Construction Agriculture & Forestry Glass, Brick & Tile Local Authorities Chemical Wood Printing & Paper Trade & Commerce Iron & Steel Food, Drink & Tobacco Leather Banking & Finance Textiles
Incidence Rates per
Fatalities
0.89 0.84 0.50 0.28 0.21 0.21 0.21 0.18 0.16 0.13 0.13 0.11 0.05 0.03 0.00
1 000 workers per year
Disabling Injuries
78.8 33.2 29.0 17.3 26.8 20.7 16.9 35.5 19.4 12.1 24.4 25.9 10.4 3.1
10.8
Tabic 3: Fatality and disabling injury rates in selected Industries In 1985.
The confusing approach is to use the DIFR, the"disabling injury frequency rate". Even worse is to use the so-called "disabling injury incidence rate" (DIIR) introduced by NOS A. These indices - if properly worked out with accurate statistics - have some advantages. BUT in South Africa they are generally calculated using such poor approximations that they often give a misleadingly favourable rate. Thus it is much better to ignore these figures and work out the incidence rates yourself.
The DIFR is the number of disabling injuries per million hours worked. The DIFR is used extensively in the WCC Statistics. The so-called i4DIIR" is used by NOSA. This is not an incidence rate but simply the DIFR divided by five which gives the number of accidents per 200 000 hours. This has, presumably, been chosen because:
100 persons x 40 hours/week x 50 weeks per year = 200 000 hours
This way of calculating an incidence rate leads to a misleadingly favourable figure which underestimates the actual incidence rate by 12 to 15%.

48 Accident statistics
Meaningful statistics: fatality versus injury rates
When discussing accident trends, managements and safety organisations lend to concentrate on reportable or disabling accident rates. This is often very convenient for them because disabling accident rates have declined greatly in the last few decades. However we do not know to what extent this decline has been due to improved safety, or due to other social and economic factors such as increased pressures to return to work (within 14 days so that the accident need not be reported) or improved factory health services.
If instead we examine fatality rates, rather different pictures emerge. An example is the gold mines where the reportable injury rate (14-days) has improved consistently since 1968 as shown in Figure 1, but there has been little improvement in the fatality rate illustrated in Figure 2. The lesson from this example is: Do not be fooled by people who quote injury statistics. Ask them for fatality figures and assess both, side by side.
irw"**pef t00frwc*fc*f9* setter
Soorc* CMEAArtno* ft*pO*B
Figure 1: Gold mine iryury rates (underground and surface combined)
F«l*t*4*ptr iOO0w»**** i
Stf^M DUEAArtfWHTOHS
Figure 2; Gold mine fatality rates (underground and surface combined)

Accident statistics 49
Refining your analysis: long term trends and analysis of individual sectors
To complete the analysis of accidents, three further points are important. Firstly, it is very helpful to look at long term trends. Are accident rales staying the same, improving, or getting worse? It is best to obtain data for a number of years, rather than just the last two or three years. Do not fall into the trap of so many accident authorities who claim that rates are improving because this year's rate is better than last year's. Look critically to see how the latest figures compare with the last ten or twenty years.
Secondly, look at sectors individually wherever possible. For example, do consider manufacturing as a whole, but examine individual sectors of interest to you. An analysis of fatality rates in manufacturing over the period 1961 to 1982 found that fatality rates deteriorated in the wood industry; remained unchanged in food, drinks and tobacco; textiles; printing and paper; chemicals; and leather; and improved in iron and steel. Clearly very little was done to improve safety in most manufacturing sectors over this period.
A final point is to break down statistics even further. For example younger and inexperienced workers usually suffer more accidents than experienced workers. Truck drivers in a transport company are at much greater risk than the clerks. To properly assess risks and plan proper prevention strategies, this kind of detailed information is vital. Unfortunately it is rarely possible to get such statistics.
How to improve accident reporting
An accident reporting system must allow us to: 1. Measure safety performance at the national, regional and sector levels. 2. Identify causes of accidents and exposure to risk of various groups in the worker population. 3. Provide information for the design of accident prevention programmes by trade unions, management and the safety inspectorates.
To achieve the above, an accident reporting system must have: 1. Clear definitions of which accidents arc to be reported; 2. A profile of each reportable accident (how, when, where, why, severity, etc.) matched with a profile of the worker who suffered the accident (age, service, occupation, shift, etc.); 3. Current data on the aggregate number of workers (by firm and by industry) within defined worker sub-groups such as age, service, occupation and shift. These data are required to calculate accident rates for sub-groups so as to identify those who may be at high risk.

50 Accident statistics
None of the published accident statistics presently available meet these requirements, particularly points 2 and 3.
Conclusion
In interpreting accident statistics, less emphasis should be placed on injuries defined in terms of time off work thresholds and the DIFR. Calculate incidence rates for individual sectors yourself, placing greater stress on fatality rates and serious permanent disabilities.
Crucial to any discussion of accident statistics is their practical application in the workplace. In this regard the proper collection, use and presentation of statistics at plant level will stimulate safety awareness as well as facilitate an understanding of accidents and how to prevent them.
By: Jean Leger, Sociology of Work Program, University of the Witwatersrand and Ian Macun, Department of Sociology, University of Cape Town.
Where to obtain more information about accident statistics?
Gold and coal mine accident statistics are discussed in: Eisner, H.S. and Leger, J-P., 1988. Safety in South African mines: An analysis of accident statistics, J SA Instil Mining Metallurgy, £8(1): 1-7. Permanently disabling mine accident statistics are investigated in: J-PLeger and RS Arkles, 1989. Permanent disability in black mineworkers: A critical analysis, South African Medical Journal, 26:557-561. A detailed analysis of manufacturing accident statistics will be found in: J-PLeger and IA Macun, 1990. Safety in South African industry: An analysisof accident statistics, Journal of Occupational Accidents, jjL 197-220. If you want accident statistics for other countries, the best source of data is the ILO Yearbook of Labour Statistics.
If you have any difficulty in obtaining any of these articles t or would like further information, please feel free to contact the authors, Jean Leger, at Sociology of Work Program, University of the Witwatersrand, P.O. Wits,2050,or Ian Macun, Department of Sociology, University of Cape Town, Rondebosch, 7700.