An introduction in crystal structure solution and refinementcci.lbl.gov/~phzwart/Talks/SMB.pdf ·...
47
Transcript of An introduction in crystal structure solution and refinementcci.lbl.gov/~phzwart/Talks/SMB.pdf ·...
Outline
Introduction Structure solution methods
Molecular placement Molecular replacement Experimental phasing Direct methods
Phase improvement Model building Refinement Maps
Introduction
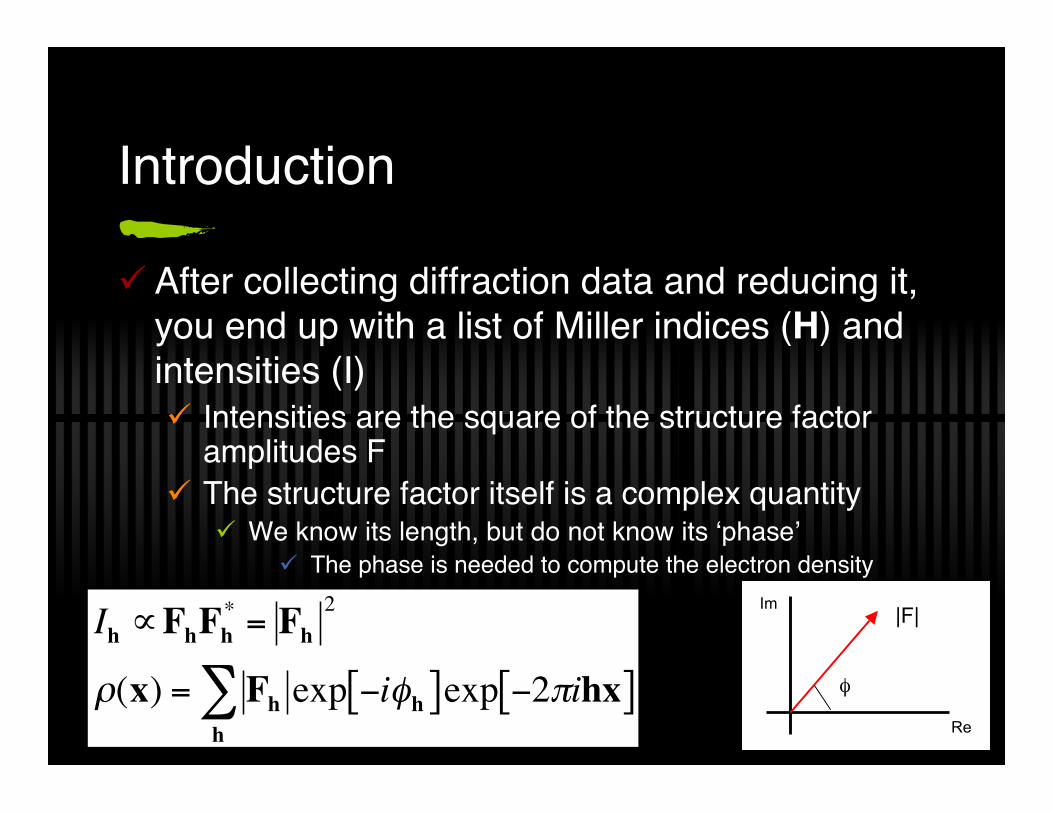
After collecting diffraction data and reducing it,you end up with a list of Miller indices (H) andintensities (I) Intensities are the square of the structure factor
amplitudes F The structure factor itself is a complex quantity
We know its length, but do not know its ‘phase’ The phase is needed to compute the electron density
!
Ih"F
hFh
* = Fh
2
#(x) = Fh
h
$ exp %i&h[ ]exp %2'ihx[ ]
Re
Im |F|
φ
Introduction
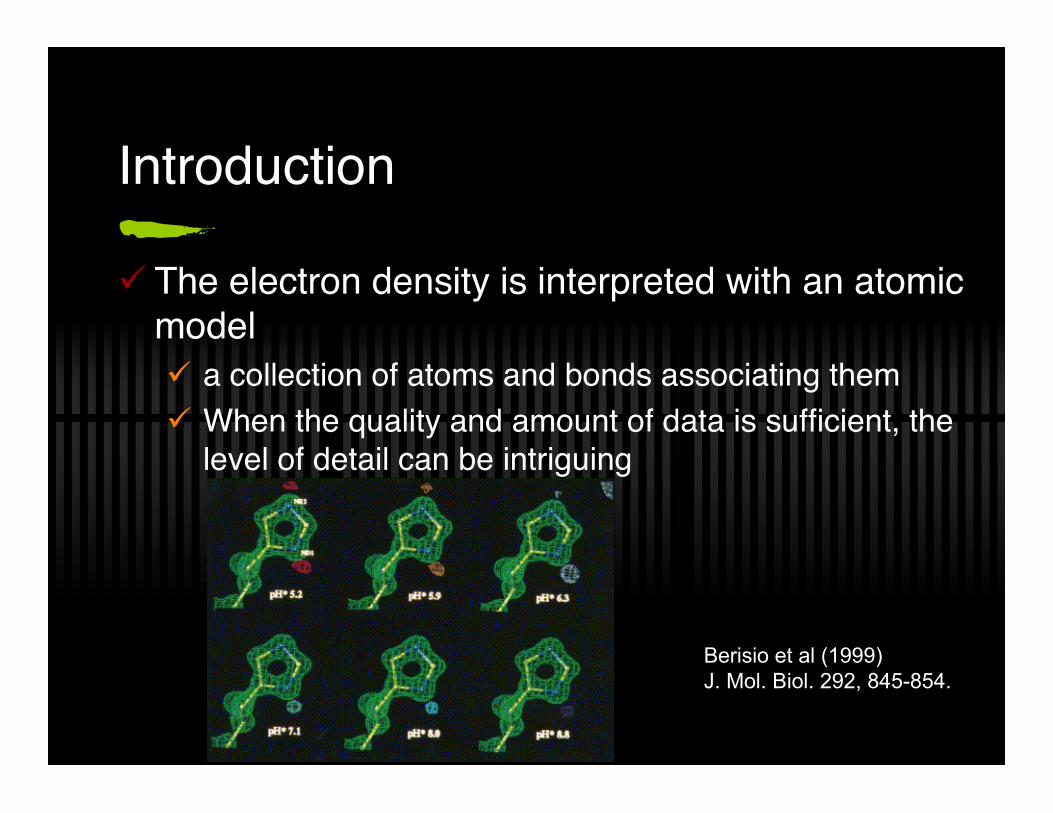
The electron density is interpreted with an atomicmodel a collection of atoms and bonds associating them When the quality and amount of data is sufficient, the
level of detail can be intriguing
Berisio et al (1999)J. Mol. Biol. 292, 845-854.

Introduction
The measured intensities contain a wealth of structural information How to obtain the structure that correspond to the given data set ? Crystal structure determination is an iterative two stage procedure
Obtaining a rough guess of the phases by using the best modelavailable. Improve and extend the atomic model by checking theelectron density maps Model building
Changing the parameters of the model so that it fits best to the data Refinement
Iterate these steps How to get the initial phases though?
Phase problem
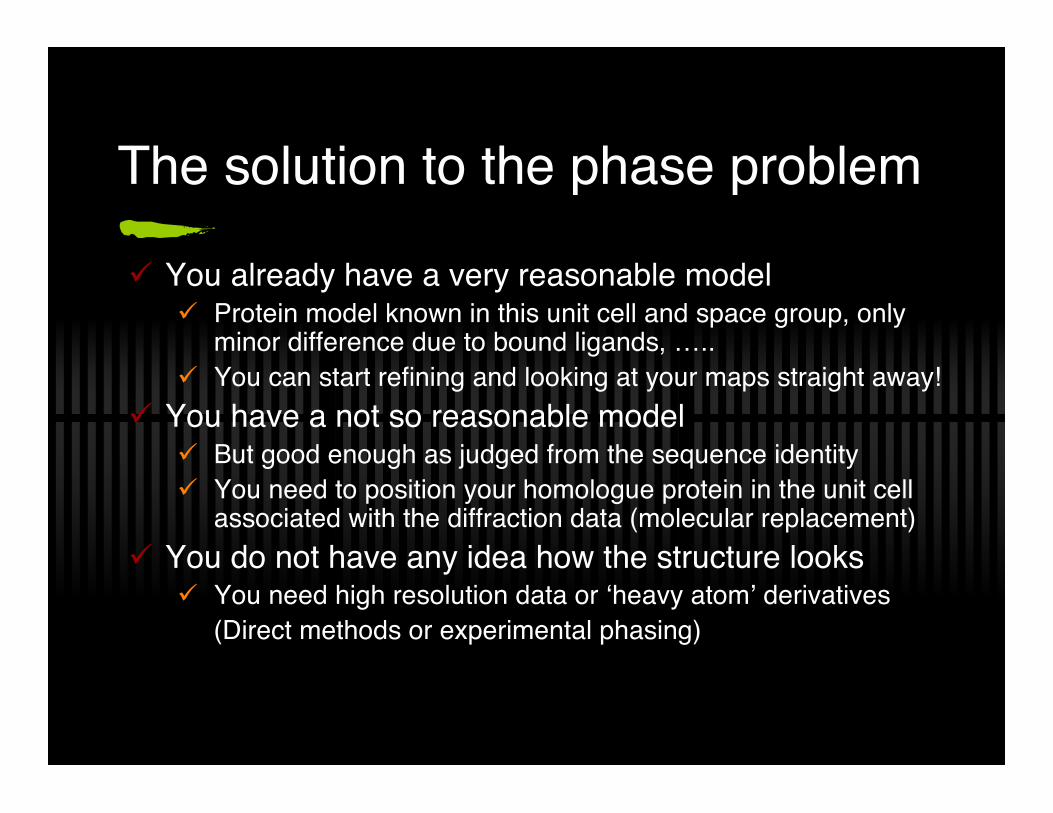
The solution to the phase problem
You already have a very reasonable model Protein model known in this unit cell and space group, only
minor difference due to bound ligands, ….. You can start refining and looking at your maps straight away!
You have a not so reasonable model But good enough as judged from the sequence identity You need to position your homologue protein in the unit cell
associated with the diffraction data (molecular replacement) You do not have any idea how the structure looks
You need high resolution data or ‘heavy atom’ derivatives(Direct methods or experimental phasing)

“Molecular placement”
You already have a very reasonable model Protein model known in this unit cell and space group, only
minor difference due to bound ligands
The data you collected comes from a protein structurethat has previously been crystallized under similarconditions
It’s unit cell and space group in the new data are veryclose to what it was previously The model you have is probably good enough as an initial
starting point. No ingenuity required: you can start refinement straight away!
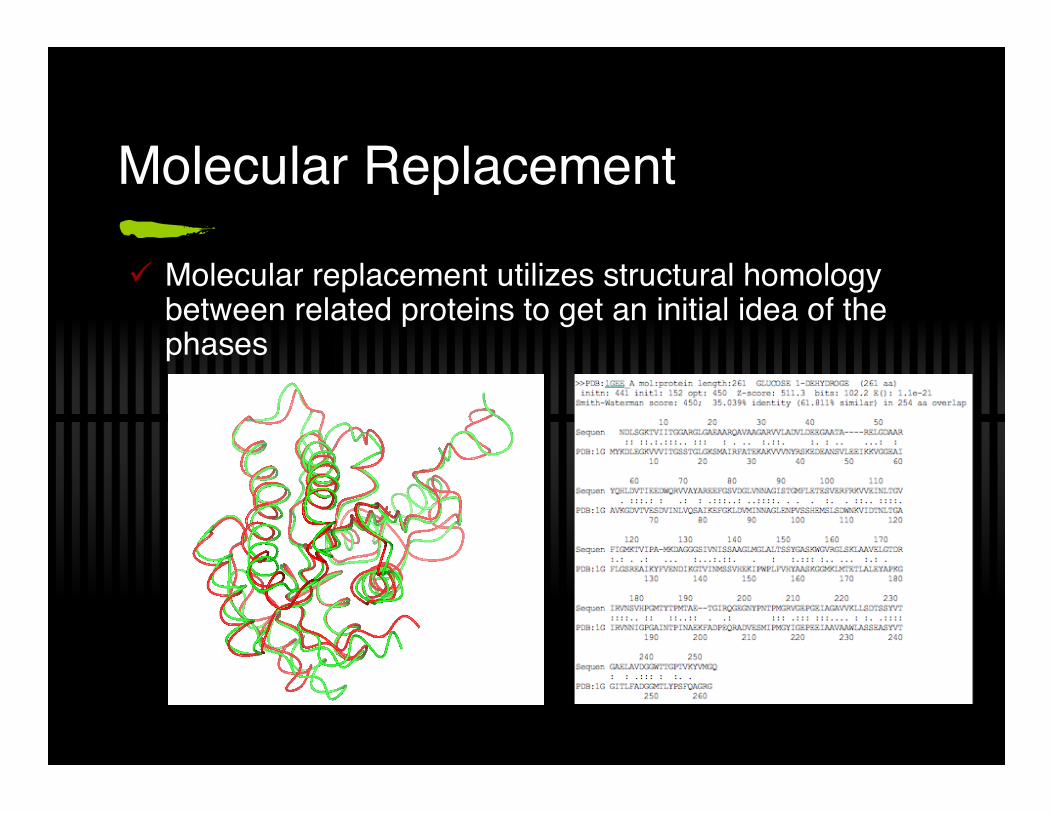
Molecular Replacement
Molecular replacement utilizes structural homologybetween related proteins to get an initial idea of thephases

Molecular Replacement
The solution strategy is to take the model you think looks most likethe protein structure of interest, and place it in the unit cell Use sequence alignment tools to find a template for your molecule
In most cases, you need to determine 6 parameters 3 parameters describing the orientation 3 parameter describing the location A six dimensional search is very time consuming
As it turns out, your can split the search into two different subproblems: Rotation function to find the orientation Translation function (with a fixed orientation) to find the location

The Patterson Function
The Patterson function can be computed from theexperimental data No phase information is needed
The Patterson function is a 3 dimensional ‘map’ withmaxima corresponding to inter atomic vectors Huh? If you have an atom at x1 and x2, The Patterson function will
have peaks at 0,0,0 (x1-x1 ; x2 -x2 ) x1-x2 x2-x1 x1-(Rx1 +T) (symmetry related peaks) x1-(Rx2 +T) (symmetry related peaks) ….

The Patterson Function
The origin peak of the Patterson is due tointeratomic vectors to itself And because there are lots of those, this peak is
realy big The vector length of the location of Patterson
peak is equal to the inter atomic distance The area of the Patterson close to the origin is
mostly populated by inter atomic vectors fromatoms within a molecule
Further away from the origin you get inter atomicvectors from atoms in different (possibly symmetryrelated) molecules

The Rotation Function
The rotation function determines the orientation of the search modelin the unit cell of the crystal structure under investigation
3 parameters need to be determined The basis of the rotation function lies in the Patterson function
Modern implementations of the rotation function involve rather complexmathematics, mostly based on spherical harmonics (brrrr)
A ‘real space’ version is however easy to understand
Model Patterson
Trial orientations
Trial Pattersons

The Translation Function
The translation function describes the fit of amolecule to the data as a function of itsposition in the unit cell
It can be computed relatively fast (FFT’s areinvolved)
Various scoring functions are possible CC on I (AMORE, MOLREP) CC on F (AMORE, MOLREP) Likelihood (PHASER)

The Translation Function
For each rotation function solution, atranslation function has to be computed If the solution to the rotation function is ambiguous,
you end up calculating a lot of translation function This can get complicated and costly when you are
looking for multiple copies in the ASU Good book keeping is essential
PHASER does an excellent job here

Experimental phasing
Sometimes molecular replacement will not work andother approaches are needed
Experimental phasing is the only alternative in 99% of the cases at least
Experimental phasing relies on the introduction of‘heavy atoms’ in crystal
Two routes Isomorphous replacement (SIR , MIR) Anomalous scattering (SAD , MAD)
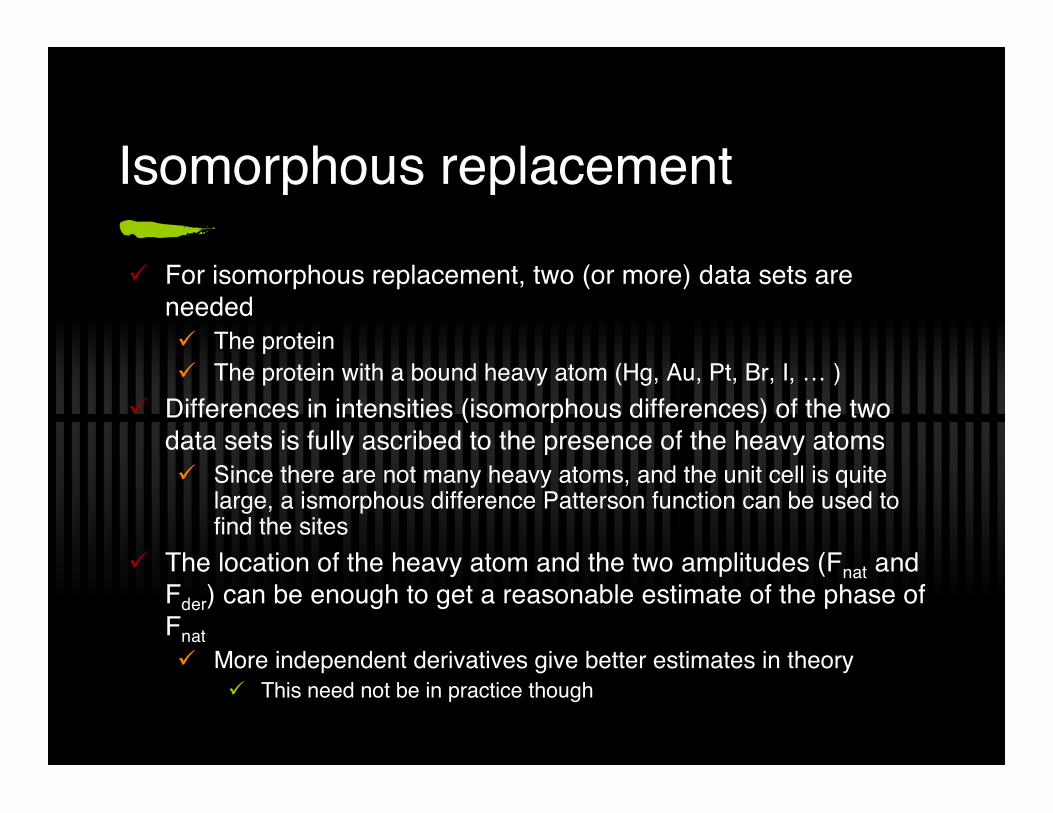
Isomorphous replacement
For isomorphous replacement, two (or more) data sets areneeded The protein The protein with a bound heavy atom (Hg, Au, Pt, Br, I, … )
Differences in intensities (isomorphous differences) of the twodata sets is fully ascribed to the presence of the heavy atoms Since there are not many heavy atoms, and the unit cell is quite
large, a ismorphous difference Patterson function can be used tofind the sites
The location of the heavy atom and the two amplitudes (Fnat andFder) can be enough to get a reasonable estimate of the phase ofFnat More independent derivatives give better estimates in theory
This need not be in practice though

Isomorphous replacement
For isomorphous replacement, two (or more) data setsare needed The protein (FP) The protein with a bound heavy atom (Hg, Au, Pt, Br; FPH )
FP
FPH
From two amplitudes and aheavy atom position, twophase choices can beobtained (phase ambiguity)
The average of those is agood start
A third data set would nail thephase down unambigously
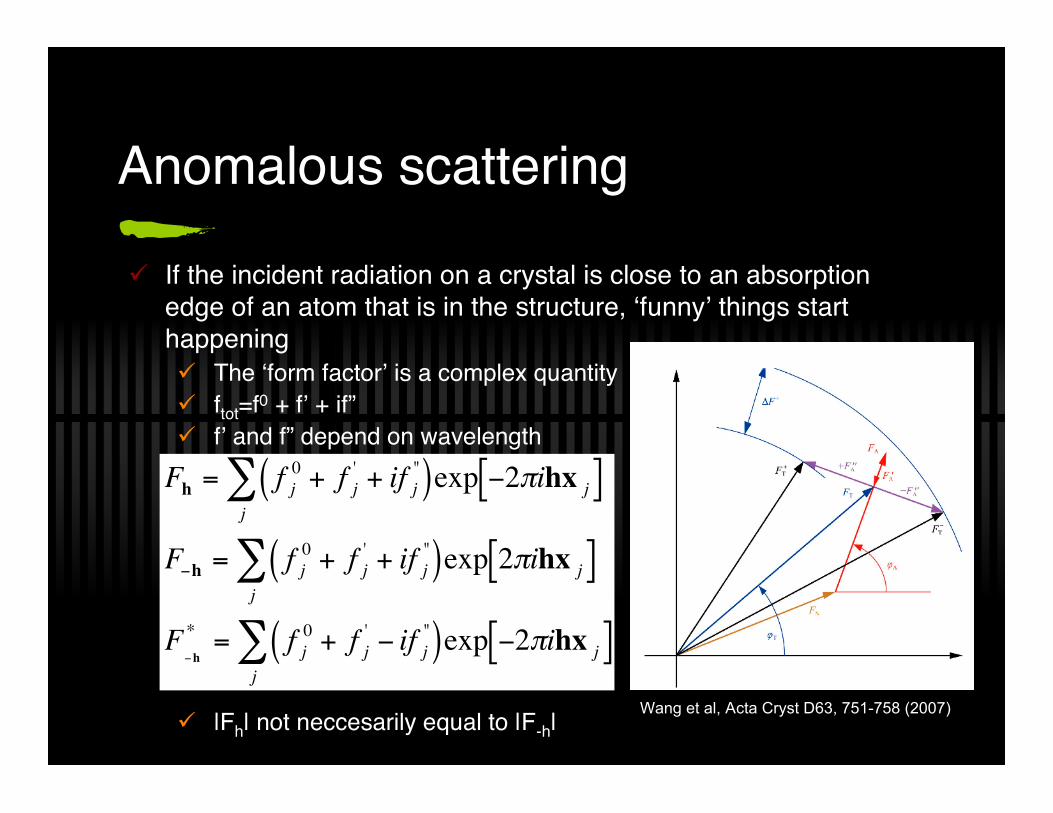
Anomalous scattering
If the incident radiation on a crystal is close to an absorptionedge of an atom that is in the structure, ‘funny’ things starthappening The ‘form factor’ is a complex quantity ftot=f0 + f’ + if” f’ and f” depend on wavelength
|Fh| not neccesarily equal to |F-h|
!
Fh
= f j0 + f j
' + if j"( )exp "2#ihx j[ ]
j
$
F"h = f j0 + f j
' + if j"( )exp 2#ihx j[ ]
j
$
F"h
* = f j0 + f j
' " if j"( )exp "2#ihx j[ ]
j
$
Wang et al, Acta Cryst D63, 751-758 (2007)
Anomalous scattering
Under ‘normal’ circustances, Friedel’s law holds:
When the ‘heavy’ atoms are present and the wavelength is close to theabsorption edge, Friedels law doesn’t hold
The anomalous differences are approximately proportional to theamplitude of the heavy atom structure that is causing it:
Patterson methods can be used to find the sites
!
Fheavy " F+# F
#
!
Ih
= Ih
!
Ih" I
h
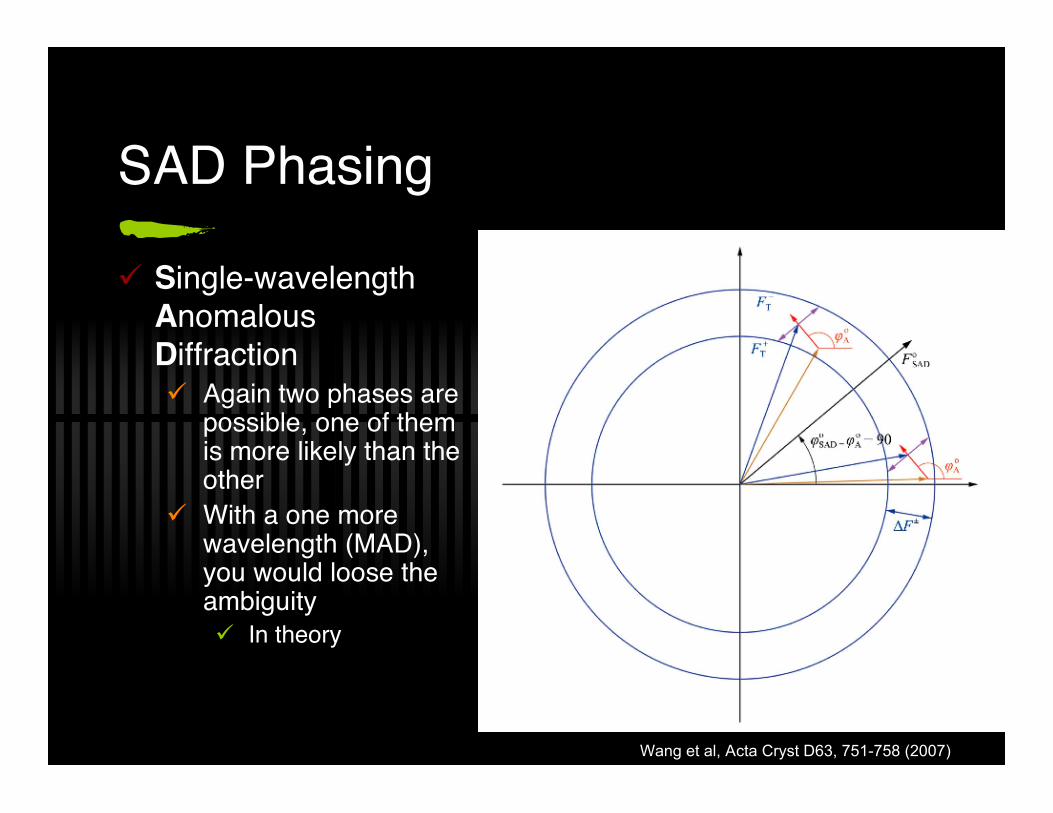
SAD Phasing
Single-wavelengthAnomalousDiffraction Again two phases are
possible, one of themis more likely than theother
With a one morewavelength (MAD),you would loose theambiguity In theory
Wang et al, Acta Cryst D63, 751-758 (2007)

SIRAS
ISO ANO ISO+ANO
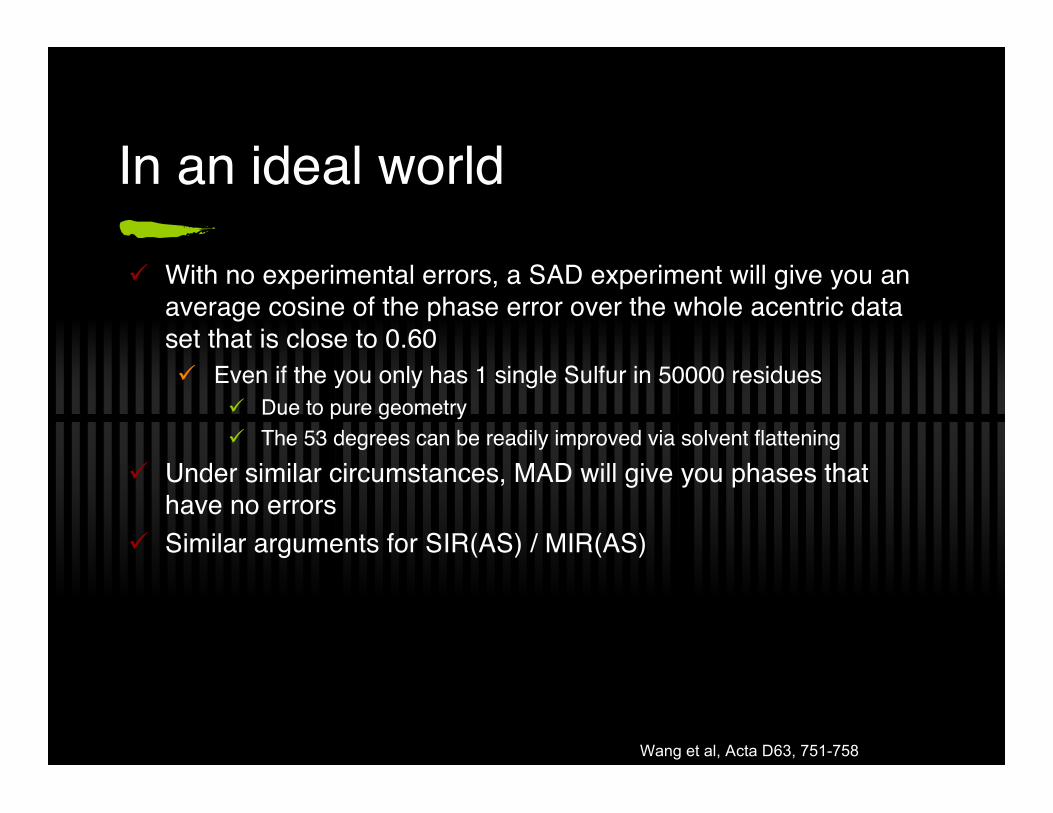
In an ideal world
With no experimental errors, a SAD experiment will give you anaverage cosine of the phase error over the whole acentric dataset that is close to 0.60 Even if the you only has 1 single Sulfur in 50000 residues
Due to pure geometry The 53 degrees can be readily improved via solvent flattening
Under similar circumstances, MAD will give you phases thathave no errors
Similar arguments for SIR(AS) / MIR(AS)
Wang et al, Acta D63, 751-758
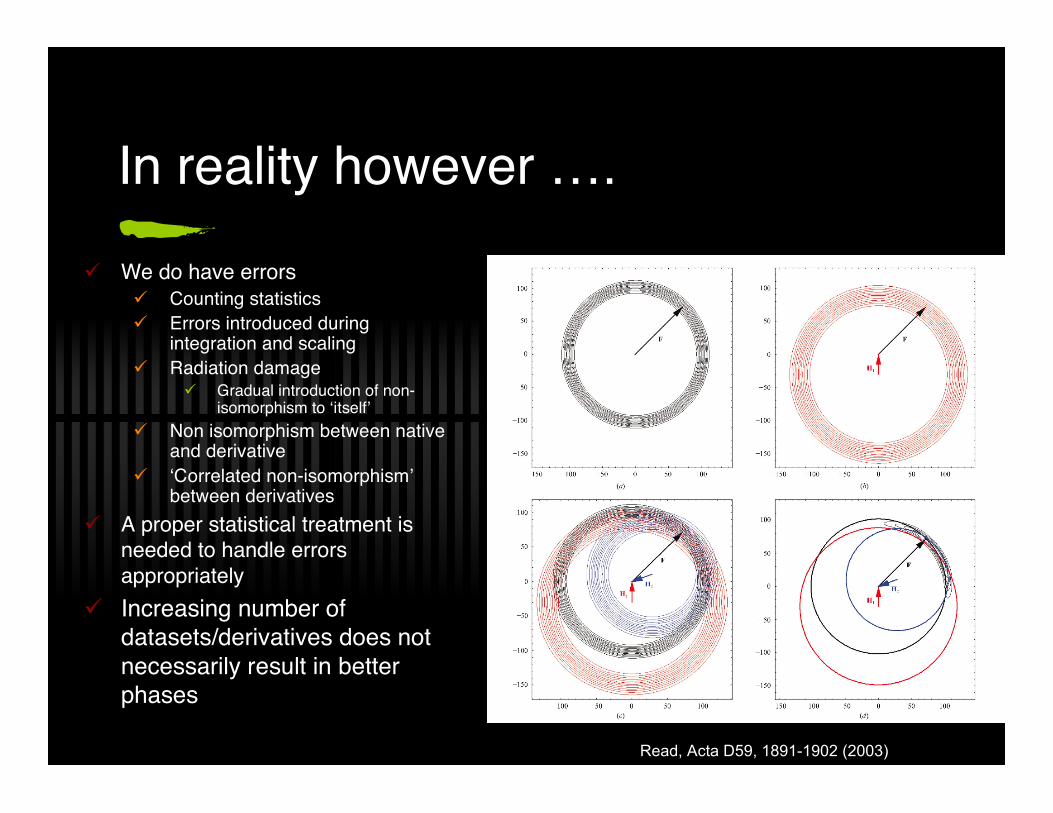
In reality however …. We do have errors
Counting statistics Errors introduced during
integration and scaling Radiation damage
Gradual introduction of non-isomorphism to ‘itself’
Non isomorphism between nativeand derivative
‘Correlated non-isomorphism’between derivatives
A proper statistical treatment isneeded to handle errorsappropriately
Increasing number ofdatasets/derivatives does notnecessarily result in betterphases
Read, Acta D59, 1891-1902 (2003)
Direct methods
Direct methods is a class of solutiontechniques that generates good startingphases using only experimental intensities asa source of phase information
The basis of direct methods are (in mostcases) Approximately equal atoms Non-negativity of the electron density Atomicity of density
a few well-defined, non overlapping peaks

Direct methods
When previous conditions are met, we have
Basic structure solution scheme: 0. Take random starting phases, compute map with Fobs 1. Square the observed map, back transform to get new
phases 2. Combine phases with Fobs, compute new map 3. Go to 1; Cycle until done Pick peaks and find model
Multiple random starts are needed Step 1 can be done more efficiently via a an
expression called the tangent formula
!
"(x) # k"2(x)
Direct methods
Direct methods can be combined with Pattersontechniques to get better than random phases Higher success rate for each trial
You can pick peaks in intermediate maps as well anduse an atomic model to compute phases Faster convergence of iterative procedure
Not only can you solve ‘regular’ structures this way,but substructures as well! Direct methods are now the main vehicle for solving
substructures from anomalous/isomorphous data
SnB, SHELXD and phenix.hyss use these methods

Phase improvement
Often, starting phases (from EP or MR) can beimproved by changing the phases in such a way thatcertain prior knowledge about how protein electrondensity is satisfied. Flatness of bulk solvent Histogram of protein region NCS relations between density
Very powerful Relations between different crystal form
Very powerful This procedure is called density modification
One of the most powerful tools for improving phases whenno atomic model is present
Phase improvement
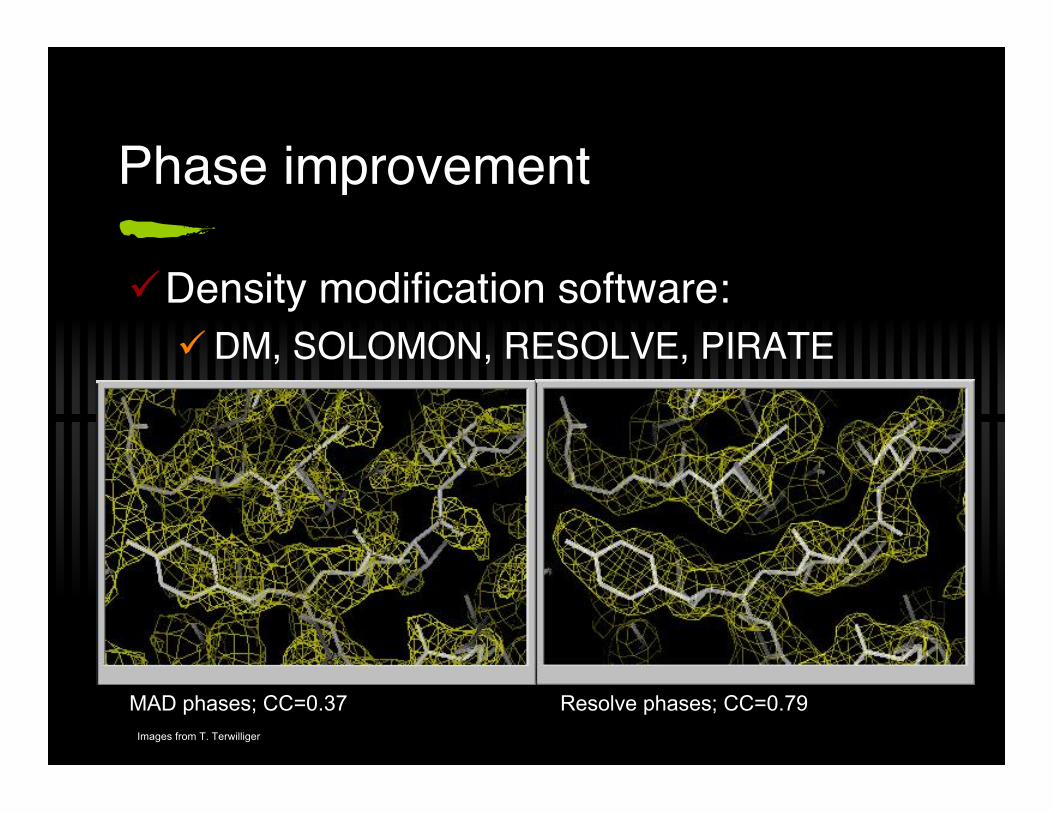
Density modification software: DM, SOLOMON, RESOLVE, PIRATE
MAD phases; CC=0.37 Resolve phases; CC=0.79Images from T. Terwilliger

Model building
Model building can be done by hand O, COOT, XtalView, TurboFRODO, MIFIT
Model building can be done automatically ARP/wARP, RESOLVE It is an iterative process that mixes interpretation of density
with refinement of model / phase improvement by densitymodification
Automated model building can give you a completemodel at when the resolution of your model isreasonable (say 2.5A or better) It also depends on the solvent content and quality of initial
phases
Refinement
Refinement is the part of the structure solutionprocedure where you ‘finish up’ your model
The model is parameterized by atoms whichhave Positional parameters (3) Atomic displacement parameters (1, or 6)
Besides Fobs you have a preconceived notionof bond lengths and angles: restraints The restraints act as an additional set of
observations

Refinement
Refinement optimizes the functionQ(model) = Q(data | model) + Q(model | restraints)
Model has parameters (x,y,x) Biso (or Baniso) Scale factor
Use standard numerical techniques to changeparameters of model as to improve Q(model)
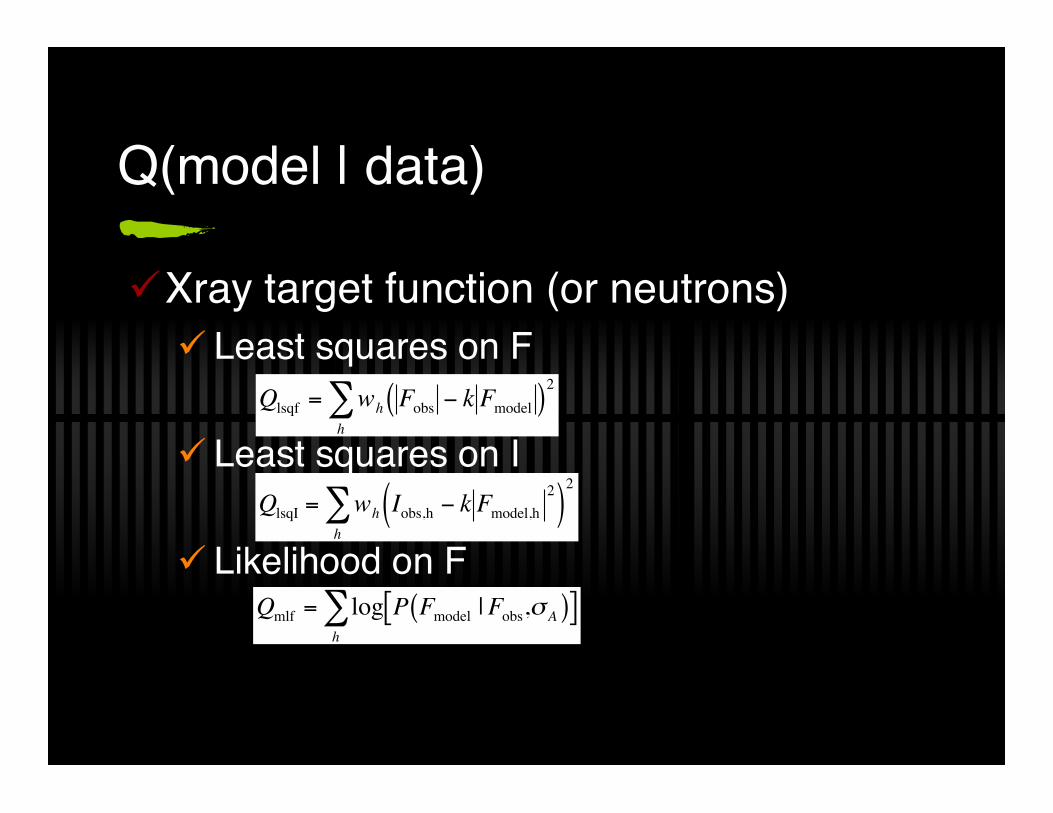
Q(model | data)
Xray target function (or neutrons) Least squares on F
Least squares on I
Likelihood on F!
Qlsqf = wh Fobs " k Fmodel( )2
h
#
!
QlsqI = wh Iobs,h " k Fmodel,h2
( )2
h
#
!
Qmlf = log P Fmodel |Fobs,"A( )[ ]h
#
Likelihood based refinement
Likelihood based refinement has proven to have alarger radius of convergence than least square targetfunction
Likelihood based refinement takes into account thecurrent quality of the model during refinement It automatically weights down data that is not supposed to fit
well due to model error (high reso mainly) When the model gets better, the high resolution data
becomes more important This variable weighting is the reason why ML refinement
works well. If likelihood based weights are introduced in LSrefinement, very similar results are obtained

Likelihood based refinement
The presence of anomalous data can further enhancerefinement Phase probability distributions obtained from
experimental phasing can be used as observationsand increase the stability of the refinement
MLHL target REFMAC, CNS, phenix.refine
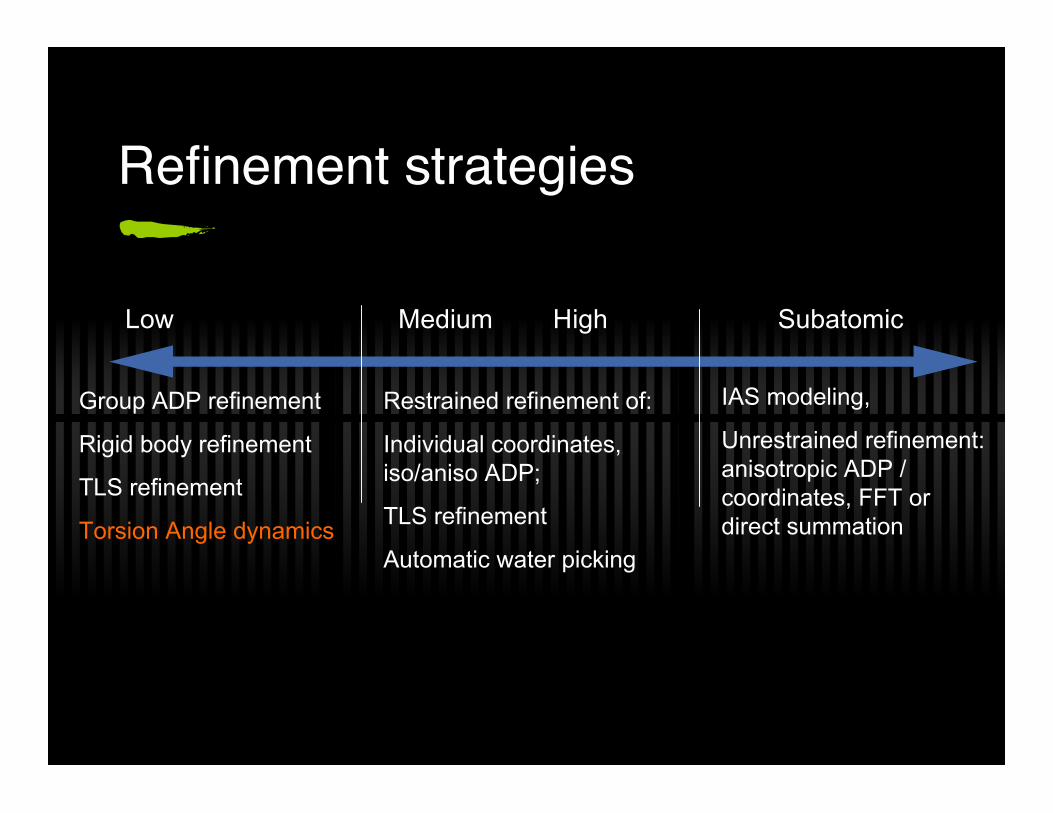
Refinement strategies
Low Medium High Subatomic
Group ADP refinement
Rigid body refinement
TLS refinement
Torsion Angle dynamics
Restrained refinement of:
Individual coordinates,iso/aniso ADP;
TLS refinement
Automatic water picking
IAS modeling,
Unrestrained refinement:anisotropic ADP /coordinates, FFT ordirect summation

Refinement strategies
Optimization of placement of large, fixed bodies Rigid body refinement. 6 parameters per domain
Optimisation of coordinates 3 parameters (or less) per atom
Optimisation of ADP’s Isotropic: 1 parameter per atom (a sphere) Anisotropic: 6 or less parameters (an elipsoid)
Occupancies 1 parameter per atom/group
f’/f” 2 parameters per atom / group
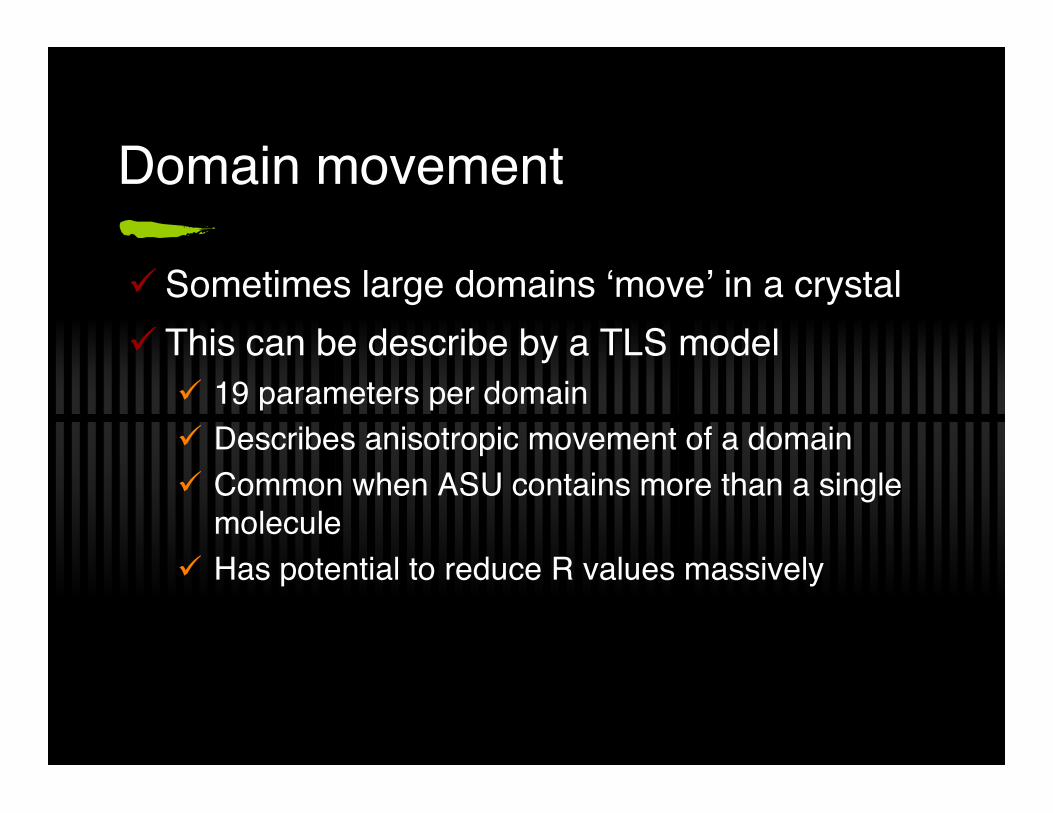
Domain movement
Sometimes large domains ‘move’ in a crystal This can be describe by a TLS model
19 parameters per domain Describes anisotropic movement of a domain Common when ASU contains more than a single
molecule Has potential to reduce R values massively
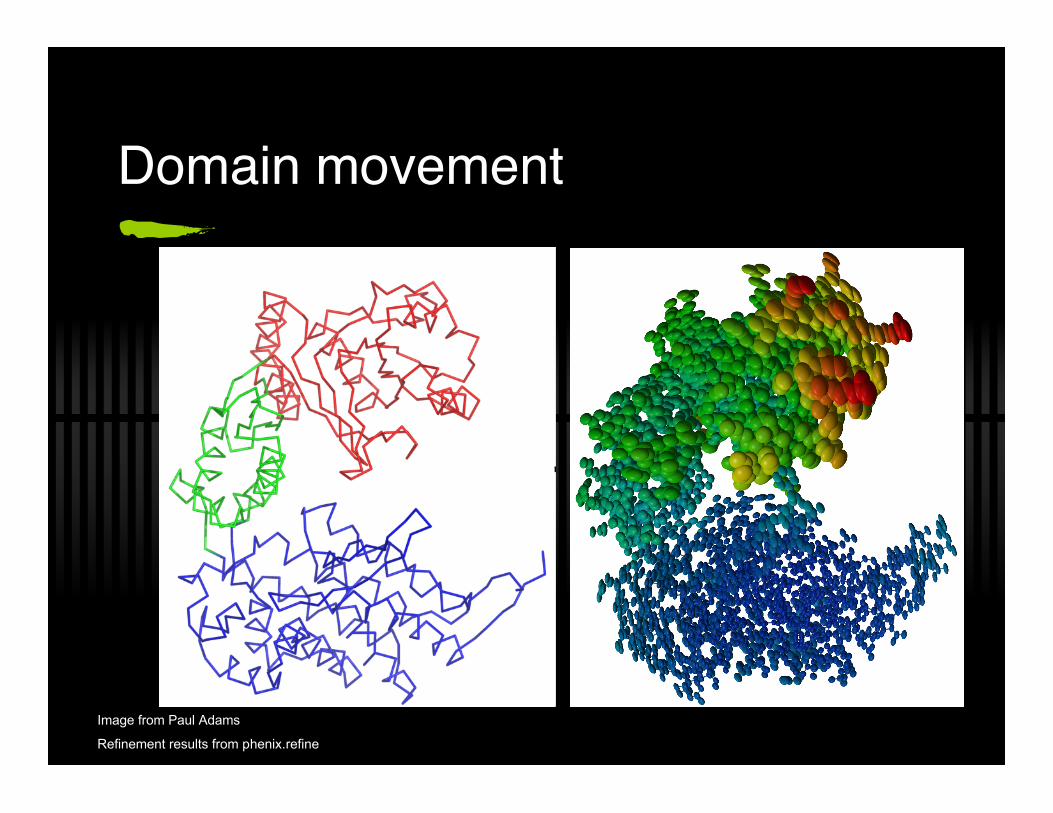
Domain movement
Image from Paul Adams
Refinement results from phenix.refine
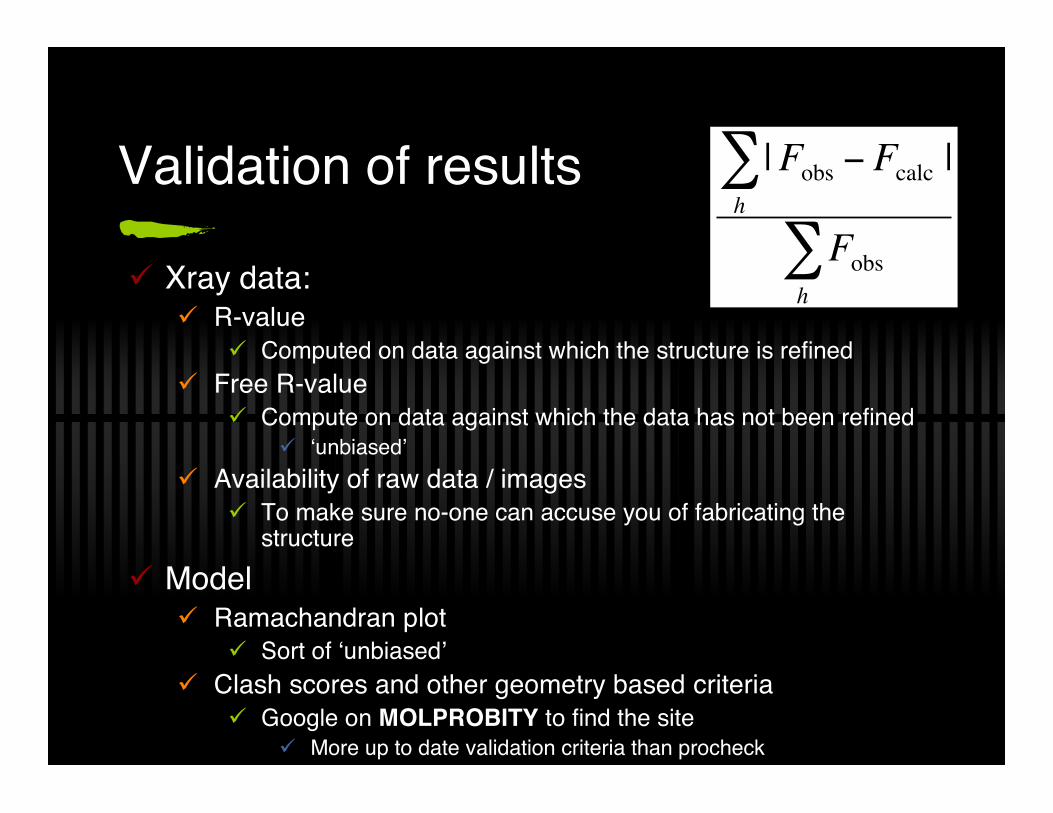
Validation of results
Xray data: R-value
Computed on data against which the structure is refined Free R-value
Compute on data against which the data has not been refined ‘unbiased’
Availability of raw data / images To make sure no-one can accuse you of fabricating the
structure Model
Ramachandran plot Sort of ‘unbiased’
Clash scores and other geometry based criteria Google on MOLPROBITY to find the site
More up to date validation criteria than procheck
!
|Fobs" F
calc|
h
#
Fobs
h
#

Maps
Electron density maps describe how manyelectrons are sitting where in the unit cell Low resolution maps do not reveal much High resolution maps give loads of information
1Å 2.5 Å 3Å 4Å Images by Phil Evans, as hosted on the structural medicine crystallography course pages

Maps
Coefficients Electron density
2Fo-Fc, PHIc (Fo,PHIC)-(Fo-Fc,PHIc)
2mFo - DFc, PHIc (mFo,PHIc)-(mFo-DFc,PHIc)
Difference map Fo-Fc,PHIc / mFo-DFc, PHIc
Indicates the where the current model lacks electrons (positivepeaks) or has too many electrons (negative peaks)
m : expected cosine of the phase error D : The fraction of Fcalc that is correct
M and D are correlated and estimated by a simple numericalprocedure sigmaA estimation

MapsBlue: 2mFo-DFcPink: positive mFo-DFc
Sucrose (C&H)ALS BL5.0.2
Refined with hydrogen contribution
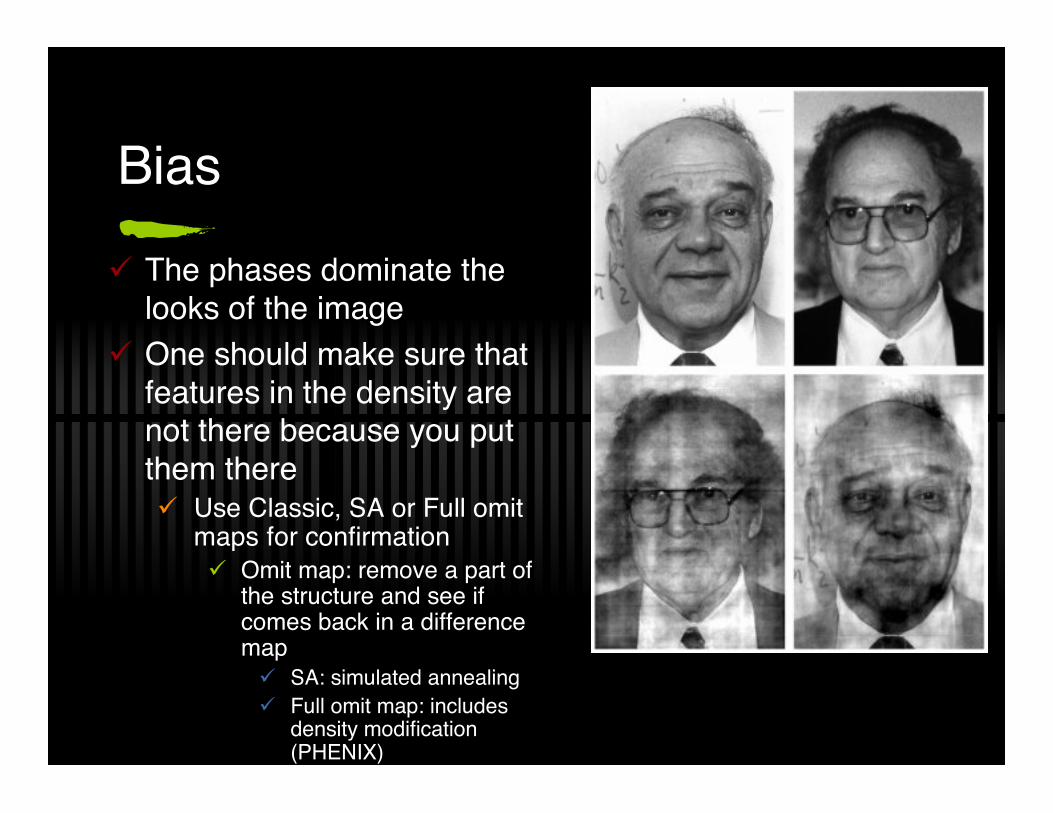
Bias The phases dominate the
looks of the image One should make sure that
features in the density arenot there because you putthem there Use Classic, SA or Full omit
maps for confirmation Omit map: remove a part of
the structure and see ifcomes back in a differencemap SA: simulated annealing Full omit map: includes
density modification(PHENIX)
Software suites
CCP4 http://www.ccp4.ac.uk
CNS http://cns.csb.yale.edu/v1.2
PHENIX http://www.phenix-online.org
SHELX http://shelx.uni-ac.gwdg.de/SHELX

Example Phenix applications
Refinement phenix.refine mydata.sca mymodel.pdb
Structure solution phenix.autosol mydata.sca seq.txt
Twinned refinement phenix.refine mydata.sca mymodel.pdb twin_law=“k,h,-l”
Data analyses Phenix.xtriage mydata.mtz

Some pointers
http://www-structmed.cimr.cam.ac.uk/course.html Google on ‘structural medicine course’
Stout and Jensen; Drenth Molecular replacement basics
Crowther, R. A. and Blow, D. M. (1967) Acta Crystallogr. 23, 544-548.
Rossmann, M. G. and Blow, D. M. (1962). Acta Cryst. 15, 24-31. Density modification
Terwilliger, Acta Cryst., (2000). D56, 965–972 Refinement
G.N. Murshudov, A.A.Vagin and E.J.Dodson, (1997). Acta Cryst.D53, 240-255
This talk http://cci.lbl.gov/~phzwart/Talks/SMB.pdf

AckowledgementsGurussaakshaath param brahma tasmai shree gurave namaha
Henk Schenk Rene Peschar Victor Lamzin Zbigniew Dauter Garib Murshudov Eleanor Dodson Tom Terwilliger Randy Read Gerard Bricgne Paul Adams Ralf Grosse-Kunstleve And many others