An Introduction Dmitri Kavetski, Michael Leonard, Mark Thyer, June 2009.
19
An Introduction Dmitri Kavetski, Michael Leonard, Mark Thyer, June 2009
-
Upload
louise-allen -
Category
Documents
-
view
216 -
download
0
Transcript of An Introduction Dmitri Kavetski, Michael Leonard, Mark Thyer, June 2009.

An Introduction Dmitri Kavetski, Michael Leonard, Mark Thyer,
June 2009

www.rfortran.org
• Fortran 90/95 (F95) is a well established language– many legacy programs written in F95– users may be attracted to F95 advantages
(speed, memory, object handling, etc.)
• R is open-source graphical/statistical package– Many statistical algorithms– Good support for generating plots– Fast growing list of packages
• RFortran is an open source software library that links to R from Fortran
Introduction
www.rfortran.org
• Fortran has very limited graphics functionality
• This is especially frustrating when:– interactively analysing/simulating data– generating numerous diagnostic plots
• Typically Fortran users dump outputs to file and plot later
• RFortran provides Fortran users with ability to produce high quality R graphics directly from their code
Motivation 1 – R Graphics

www.rfortran.org
• Many researchers are releasing packages of their latest statistical/numerical algorithms work via the R platform
• Number of R packages is constantly increasing
• RFortran provides Fortran users with ability to utilise these algorithms in their own code
• Enables researchers to trial and incorporate the latest algorithms
• Expedites research results
Motivation 2 – R Functions

www.rfortran.org
• Why not just use Fortran?– you want graphics or functions in R
• Why not just use R then?– R is slower (scripted)– Large amount of F95 Legacy Code
• Why not just plug a F95 DLL into R?– User convenience, DLLs can be tricky at times– Some programs are hard to package as DLLs
• Aimed at users who have significant F95 code and wish to use some of R’s graphics and packages to make life a little easier!
Why use RFortran?

www.rfortran.org
• RFortran is a suite of modules that are compiled with a Fortran program
• Uses the Component Object Model (COM) interface developed by Microsoft
• RFortran is Windows only. • Currently can only be used with Compaq
(CVF6.6) or Intel Visual Fortran (IVF) compiler– Planned to investigate if a compiler independent
version can be developed
RFortran Overview
www.rfortran.org
• RFortran has 3 essential functions:– Rinit: initialise R, COM interface, etc.– Rput: put data/commands from F95 to R– Rget: get data from R into F95
• Numerous other functions for string handling, error logging, missing values, etc.
Core Functionality
www.rfortran.org
Example: Simple Graph
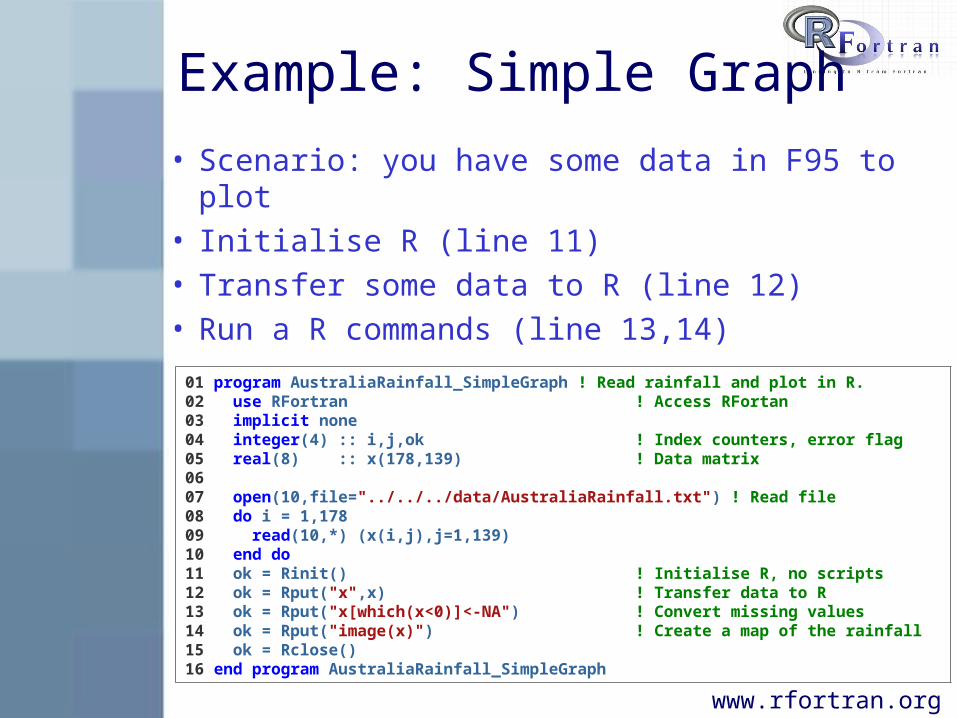
• Scenario: you have some data in F95 to plot• Initialise R (line 11)• Transfer some data to R (line 12)• Run a R commands (line 13,14)01 program AustraliaRainfall_SimpleGraph ! Read rainfall and plot in R.02 use RFortran ! Access RFortan03 implicit none04 integer(4) :: i,j,ok ! Index counters, error flag05 real(8) :: x(178,139) ! Data matrix 0607 open(10,file="../../../data/AustraliaRainfall.txt") ! Read file08 do i = 1,17809 read(10,*) (x(i,j),j=1,139)10 end do11 ok = Rinit() ! Initialise R, no scripts12 ok = Rput("x",x) ! Transfer data to R 13 ok = Rput("x[which(x<0)]<-NA") ! Convert missing values14 ok = Rput("image(x)") ! Create a map of the rainfall15 ok = Rclose() 16 end program AustraliaRainfall_SimpleGraph

www.rfortran.org
Example: Simple Graph
• A basic plot
www.rfortran.org
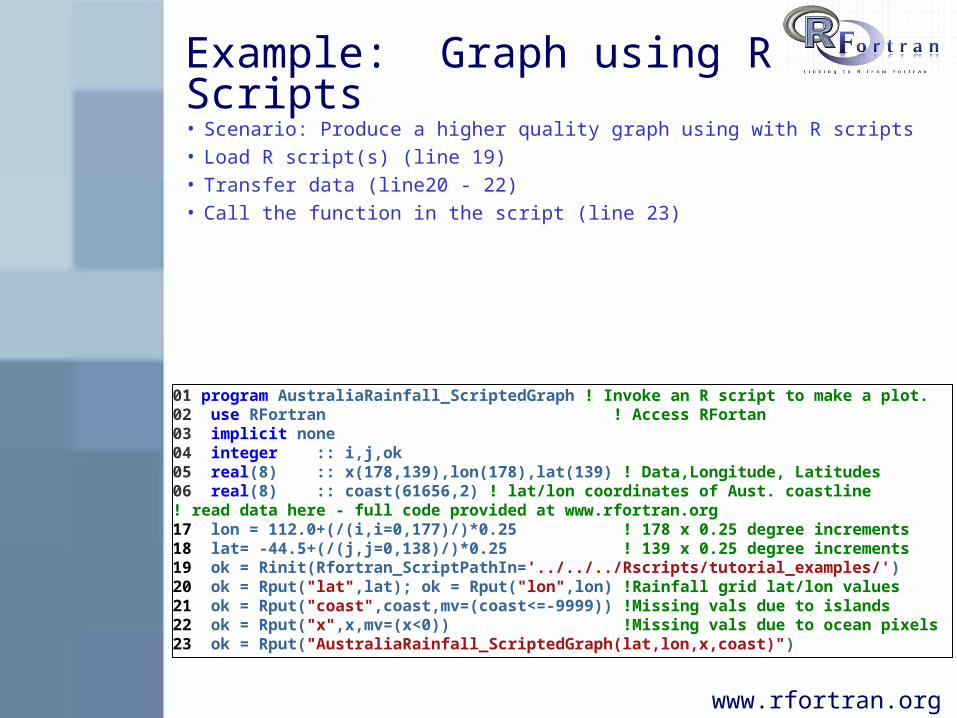
Example: Graph using R Scripts• Scenario: Produce a higher quality graph using with R scripts• Load R script(s) (line 19)• Transfer data (line20 - 22)• Call the function in the script (line 23)
01 program AustraliaRainfall_ScriptedGraph ! Invoke an R script to make a plot.02 use RFortran ! Access RFortan03 implicit none04 integer :: i,j,ok05 real(8) :: x(178,139),lon(178),lat(139) ! Data,Longitude, Latitudes06 real(8) :: coast(61656,2) ! lat/lon coordinates of Aust. coastline! read data here - full code provided at www.rfortran.org17 lon = 112.0+(/(i,i=0,177)/)*0.25 ! 178 x 0.25 degree increments18 lat= -44.5+(/(j,j=0,138)/)*0.25 ! 139 x 0.25 degree increments19 ok = Rinit(Rfortran_ScriptPathIn='../../../Rscripts/tutorial_examples/')20 ok = Rput("lat",lat); ok = Rput("lon",lon) !Rainfall grid lat/lon values21 ok = Rput("coast",coast,mv=(coast<=-9999)) !Missing vals due to islands22 ok = Rput("x",x,mv=(x<0)) !Missing vals due to ocean pixels23 ok = Rput("AustraliaRainfall_ScriptedGraph(lat,lon,x,coast)")

www.rfortran.org
Example: Graph using R Scripts• Scripting allows detailed command sequences01 AustraliaRainfall_ScriptedGraph<-function(lat,lon,x,coast){02 image(lon,lat,x, xlab="Longitude",ylab="Latitude",cex.lab=1.5,cex.axis=1.5,03 breaks=c(100,200,500,1000,2000,5000),col=topo.colors(5)[5:1])04 contour(lon,lat,x,levels=c(100,200,500,1000,2000,5000),add=TRUE,labcex= 1)05 lines(coast)06 site.x<-c(115.9,138.6,147.3,145.0,151.0,153.1,130.9)07 site.y<-c(-31.95,-34.92,-42.87,-37.78,-34.0,-27.48,-12.47)08 names<-c("Perth","Adelaide","Hobart","Melb.","Sydney","Brisbane","Darwin")09 text(site.x,site.y,names,cex=1.2)10 }
Simple Graph HQ Graph using R Scripts
www.rfortran.org
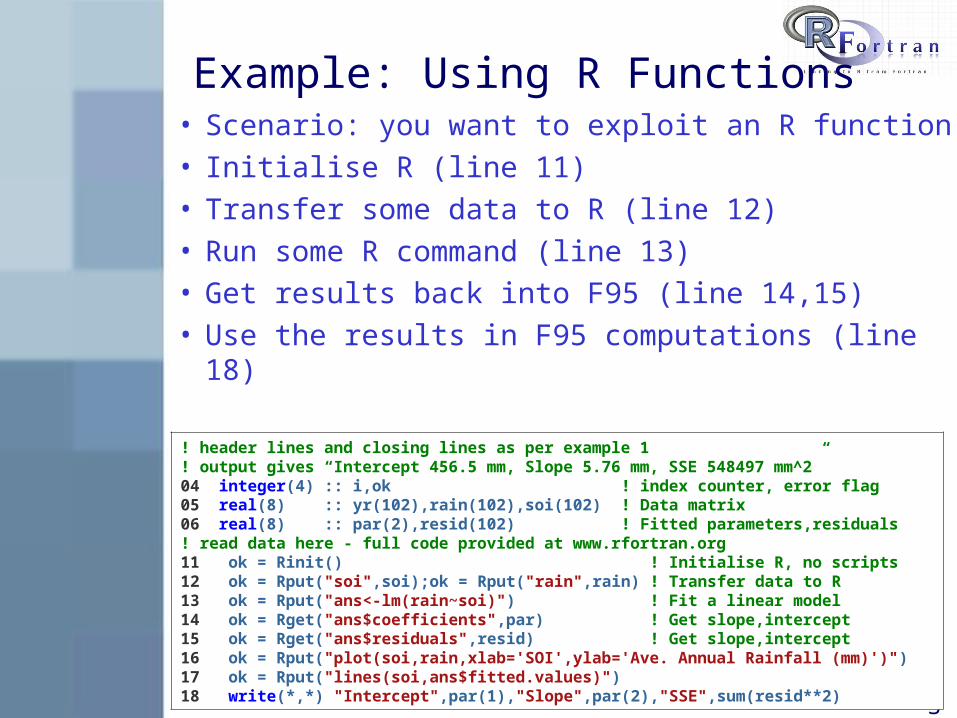
Example: Using R Functions• Scenario: you want to exploit an R function• Initialise R (line 11)• Transfer some data to R (line 12)• Run some R command (line 13)• Get results back into F95 (line 14,15)• Use the results in F95 computations (line 18)! header lines and closing lines as per example 1! output gives “Intercept 456.5 mm, Slope 5.76 mm, SSE 548497 mm^2”04 integer(4) :: i,ok ! index counter, error flag05 real(8) :: yr(102),rain(102),soi(102) ! Data matrix 06 real(8) :: par(2),resid(102) ! Fitted parameters,residuals! read data here - full code provided at www.rfortran.org11 ok = Rinit() ! Initialise R, no scripts12 ok = Rput("soi",soi);ok = Rput("rain",rain) ! Transfer data to R 13 ok = Rput("ans<-lm(rain~soi)") ! Fit a linear model14 ok = Rget("ans$coefficients",par) ! Get slope,intercept15 ok = Rget("ans$residuals",resid) ! Get slope,intercept16 ok = Rput("plot(soi,rain,xlab='SOI',ylab='Ave. Annual Rainfall (mm)')")17 ok = Rput("lines(soi,ans$fitted.values)")18 write(*,*) "Intercept",par(1),"Slope",par(2),"SSE",sum(resid**2)

www.rfortran.org
Example: Using R Functions
• The main point is getting data back to F95• Intercept = 456.5 mm, Slope = 5.76 mm
www.rfortran.org
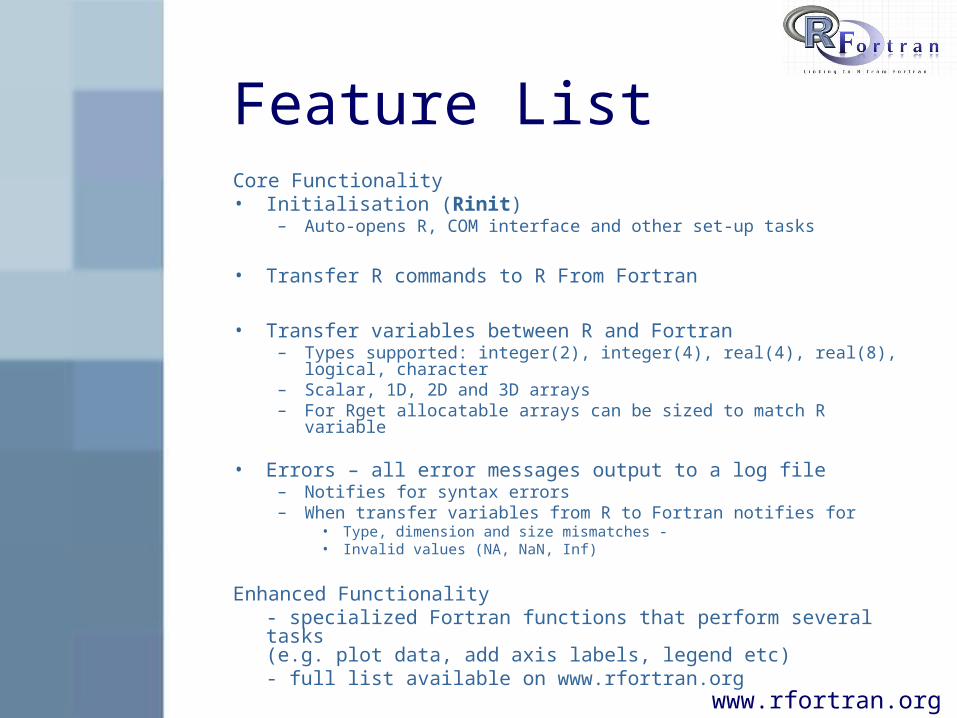
Feature ListCore Functionality• Initialisation (Rinit)
– Auto-opens R, COM interface and other set-up tasks
• Transfer R commands to R From Fortran
• Transfer variables between R and Fortran– Types supported: integer(2), integer(4), real(4),
real(8), logical, character – Scalar, 1D, 2D and 3D arrays – For Rget allocatable arrays can be sized to match R variable
• Errors – all error messages output to a log file – Notifies for syntax errors– When transfer variables from R to Fortran notifies for
• Type, dimension and size mismatches - • Invalid values (NA, NaN, Inf)
Enhanced Functionality- specialized Fortran functions that perform several tasks (e.g. plot data, add axis labels, legend etc)- full list available on www.rfortran.org

www.rfortran.org
Case Study 1 – BATEA
• Used to automatically generate large numbers of diagnostic plots stored in a .pdf file
www.rfortran.org
Case Study 1 – BENEFITS
• Removes tedium of writing/reading output files
• Single pdf file with minimal user intervention simplifies archiving, enables quick comparison
• Open source software means diagnostics can be shared between all users.

www.rfortran.org
Case Study 2 – Joint Probability
• Used to exploit functionality in R to speed up research output
• A catchment model is written in F90 with boundary values from a statistical model in R
||| ||||||| || || | |||| |||||||||||| |||||||| |||||| ||||||| | ||| | | || ||||||||||||| ||||| | | | |||| | | | | ||| | || | || || ||
Ocean height (H)
Freshwater flow (Q)
Water depth y(x,Q,H) Location (x)

www.rfortran.org
Case Study 2 – BENEFITS
• Exploited strength of each platform, numerical model in F90, new statistical aspects in R (copula package)
• Saved the user having to write a F90 copula package or port the F90 model to R.
• Were able to quickly calibrate and evaluate different copula models without investing time. Important if you are not sure of usefulness.

www.rfortran.org
Summary• RFortran provides an easy-to-use useful means for linking to R
• RFortran can have numerous benefits, primarily:– access to graphics facilities available– access to numerical/statistical algorithms
• Current Status– Beta Release of Version 1.0 is currently available– Download installer from www.rfortran.org, test it and provide
feedback.
• Visit www.rfortran.org for further information– Information for Users
• Feature List • Requirements• Download and Installation • Describes how to use RFortran• Tutorial examples (with source code)• FAQ
– Other Information for Developers • How does RFortran Work, What is COM? etc