AN INTERNATIONAL COMPARISON - British Council · Many leadership qualities are part of the nature...
24
THE EDUCATIONAL PATHWAYS OF LEADERS AN INTERNATIONAL COMPARISON
-
Upload
truongduong -
Category
Documents
-
view
213 -
download
0
Transcript of AN INTERNATIONAL COMPARISON - British Council · Many leadership qualities are part of the nature...

THE EDUCATIONAL PATHWAYS OF LEADERS AN INTERNATIONAL COMPARISON


THE EDUCATIONAL PATHWAYS OF LEADERS | AN INTERNATIONAL COMPARISON
3
THE EDUCATIONAL PATHWAYS OF LEADERS AN INTERNATIONAL COMPARISON
CONTENTS Leading the way . . . . . . . . . . . . . . . . . . . . . . . . . . . . . . . . . . . . . . . . . . . . . . . . . . . . . . . . . . 4
Our research questions . . . . . . . . . . . . . . . . . . . . . . . . . . . . . . . . . . . . . . . . . . . . . . . . . . . . . . 5
Our approach . . . . . . . . . . . . . . . . . . . . . . . . . . . . . . . . . . . . . . . . . . . . . . . . . . . . . . . . . . . . . . 5
Findings . . . . . . . . . . . . . . . . . . . . . . . . . . . . . . . . . . . . . . . . . . . . . . . . . . . . . . . . . . . . . . . . . 7
What leaders studied: undergraduate degrees . . . . . . . . . . . . . . . . . . . . . . . . . . . . . . . . . . . 8
What leaders studied: graduate degrees . . . . . . . . . . . . . . . . . . . . . . . . . . . . . . . . . . . . . . . . . 12
Educational pathways and career outcomes . . . . . . . . . . . . . . . . . . . . . . . . . . . . . . . . . . . . . . 13
International experience . . . . . . . . . . . . . . . . . . . . . . . . . . . . . . . . . . . . . . . . . . . . . . . . . . . . 15
Importance of non-academic higher education experiences . . . . . . . . . . . . . . . . . . . . . . . . . . 20
Conclusions . . . . . . . . . . . . . . . . . . . . . . . . . . . . . . . . . . . . . . . . . . . . . . . . . . . . . . . . . . . . . . . 22

THE EDUCATIONAL PATHWAYS OF LEADERS | AN INTERNATIONAL COMPARISON
4
LEADING THE WAY
Creating effective solutions to global challenges will require a range of skills from leaders in the public and private spheres. But how do we define this type of leadership? “Leadership is inspiring others to pursue a vision within the parameters you set, to the extent that it becomes a shared effort, a shared vision and a shared success.”1 “Leadership is a process of social influence, which maximises the efforts of others, towards the achievement of a goal.”2
In the context of this study, where the focus is professional leadership, we are defining successful leaders as those who are in positions of influence within their organisation and their sectors more broadly.
“[Leadership is] having the ability to listen to people and your staff and wanting to motivate them and do the right thing for them.” —Sam Smith (UK), CEO of finnCAP
Many leadership qualities are part of the nature and personality of the individual.3 However, leadership is also a skill learned through experience and education.4
“Some skills were acquired during education, for example analytical skills. But then other skills were acquired in the process of leadership. I learnt how to speak in public, talking to people with authority and confidence, and I also acquired problem solving skills.” —Professor Jacob Kaimenyi (Kenya), Cabinet Secretary for Education
In the modern workplace, innate qualities or technical skills are no longer sufficient to lead in an increasingly complex and inter-connected world. Humanistic and social science skills such as multicultural awareness, critical thinking, and the ability to express complex ideas clearly, are equally necessary. 5
1 Helmrich, B. “30 Ways to Define Leadership.” Business News Daily. http://www.businessnewsdaily.com/3647-leadership-definition.html
2 Kruse, K. “What is Leadership?” Forbes. http://www.forbes.com/sites/kevinkruse/2013/04/09/what-is-leadership/
3 Rowe, W. Glenn and Guerrero, Laura. The Ivey Leadership Series: Cases in Leadership. SAGE Publications. 2015. http://www.sagepub.com/upm-data/33554_Chapter1.pdf
4 Ibid.
5 Van Velsor, E. and Wright, J. Expanding the Leadership Equation: developing next-generation leaders. http://insights.ccl.org/wp-content/uploads/2015/04/ExpandingLeadershipEquation.pdf British Council and Ipsos. Mobilising the Humanities: the development perspective. http://www.britishcouncil.us/programmes/education/higher/policy-dialogue/research-reports/mobilizing-humanities

THE EDUCATIONAL PATHWAYS OF LEADERS | AN INTERNATIONAL COMPARISON
5
“Education allows you the flexibility, allows you openness, allows you to question… that has been most significant in developing the person I am and the career choices I have made.” —Nandita Das (India), Actress, Director and Businesswoman
OUR RESEARCH QUESTIONS
Education, broadly defined by a set of learned skills, techniques and understanding of a particular area of knowledge, is an integral part of leadership.6 A leader’s education can be observed, measured, classified and to some extent, rated. But other than establishing a level of competency in their field, in what ways does higher education contribute to a leader’s professional success?
As the focus of our research, we consider higher education from a wider perspective to address the following questions:
•What are the higher educational pathways of leaders from around the world?
•Are there any profiling characteristics among specific educational pathways, such as age, gender or geography?
•Among leaders around the world, to what extent do specific educational pathways lead to careers in specific sectors?
•What are the attributes of higher education other than direct learning that contribute to the success of leaders?
By investigating the higher education pathways of leaders around the world and discussing with leaders how they feel this experience has contributed to their careers, some understanding is developed of which degree types, subjects studied and other educational experiences can benefit professional success.
OUR APPROACH
The literature widely recognises cultural differences or biases in defining leadership, and so our study targeted professional leaders with higher education qualifications from 30 countries.7 The country selection was chosen to align with the organisational framework provided by the GLOBE study on leadership.8 For practical purposes, we limited the geographic scope to the three countries within each grouping with the highest GDP measured in Purchasing Power Parity (PPP), while ensuring there was enough information and economic diversity within the country to support the research.9
6 Lee, M. “Where are Global Leaders Educated?” International Higher Education. https://www.academia.edu/6723689/Where_are_global_leaders_educated_INTERNATIONAL_HIGHER_EDUCATION
7 For the most part, only leaders with higher education qualifications were considered for this study in order to determine how higher education contributes to professional success.
8 House, R. Culture, Leadership, and Organizations: The GLOBE Study of 62 Societies. 2004. Brodbeck, F., Chhokar, J. and House, R. Culture and Leadership across the World: the GLOBE book of in-depth studies of 25 Societies. 2007.
9 There were two exceptions to this –Angola (the 3rd largest GDP in Sub-Saharan Africa) was replaced with Kenya, and Iran (the 2nd largest GDP in South Asia) was replaced with Thailand. We conducted those replacements because of lack of publicly available information on individuals from those countries.

THE EDUCATIONAL PATHWAYS OF LEADERS | AN INTERNATIONAL COMPARISON
6
TABLE 1: COUNTRY GROUPINGS
COUNTRY GROUPINGS COUNTRIES INCLUDED
Anglo Countries Canada, United States, United Kingdom
Confucian Asia China, Japan, South Korea
Eastern Europe Poland, Russia, Ukraine
Germanic Europe Austria, Germany, the Netherlands
Latin America Argentina, Brazil, Mexico
Latin Europe France, Italy, Spain
Middle East Egypt, Turkey, Saudi Arabia
Nordic Europe Denmark, Norway, Sweden
Southern Asia India, Indonesia, Thailand
Sub-Saharan Africa Kenya, Nigeria, South Africa
The goal of the research was to see what higher education and leadership looked like for a range of sectors and demographics. Targets were set for each country grouping to achieve balance on gender, age (under 45 and 45 and over) and the private, public, and not-for-profit sectors. The non-representative nature of the sample prevents the study findings from being applied universally to ‘leaders’. However, this balanced approach enabled us to obtain a large and diverse sample of leaders which allowed us to provide key insights about country groupings, demographics and sectors.
With the sample structure determined, the team collected data relating to the careers and higher education of 1,709 individuals – variables such as college/university attended, country attended, degree subject and level, time at current job, job title, number of previous positions at current organisation, headquarters of current organisation, number of previous jobs, number of countries of employment and size of LinkedIn network.
TABLE 2: DEMOGRAPHIC AND PROFESSIONAL TARGETS
CATEGORY TARGET PERCENT OF SAMPLE
Male 50%
Female 50%
Under 45 50%
45 and older 50%
Private sector 50%
Public sector 25%
Non-profit sector 25%

THE EDUCATIONAL PATHWAYS OF LEADERS | AN INTERNATIONAL COMPARISON
7
We referenced published articles and sources to compile lists of individuals and supplemented (or cross-referenced) their biographical information from their profiles on LinkedIn, Wikipedia, or corporate and government websites. When there was insufficient information on an individual, we replaced the individual by referencing the suggested ‘Similar People’ option on LinkedIn, performing pre-set keyword searches that individuals use to tag their profiles to a specific industry (for instance, ‘oil & energy’, ‘government relations’ or ‘civic and social organisation’) and filtering the search by country and seniority level.
TABLE 3: LIST OF EDUCATIONAL ATTAINMENT CATEGORIES AND ABBREVIATIONS
CATEGORY DEGREE INCLUDED
Undergraduate Degree Bachelor of Arts (BA, AB), Bachelor of Science (BSc)
Masters’ Degree Master of Arts (MA), Master of Science (MSc)
Professional Degree Master of Business Administration (MBA), Advanced Law Degree (LLM, JD), Master of Public Policy (MPP, MPA), Master in Theological or Divinity Studies (MTheo, MDiv), Master of Education (ME), Advanced Medical Degree (MD), Master of Public Health (MPH)
Doctoral Degree Doctor of Philosophy (PhD)
To follow-up on the quantitative piece, in-depth interviews were conducted with ten leaders, one from each country grouping. These interviews provided insights into the ways in which leaders appreciated the impact and contribution of higher education experiences on their career.
FINDINGS
The top three findings are:
•Most leaders have degrees in social sciences and humanities, with over half holding an advanced degree. The prevalence of social sciences continues into post-graduate education with half of the leaders holding advanced-level degrees. However, for advanced degrees, the humanities constitute a smaller proportion.
•Leaders have international educational or professional experience: one third of professional leaders surveyed have international work experience and one third have international education experience – a quarter have both international work and education experience. International study increases with degree level – approximately one fifth of leaders have bachelor’s degrees from another country and one third have advanced degrees that they received overseas. For all degree levels, this sample contains a much higher proportion of those with international experience, in comparison to graduates globally.
•Extracurricular experiences, including exposure to a multicultural environment, international experiences and networks developed during their higher education, have continued into leaders’ professional lives.

THE EDUCATIONAL PATHWAYS OF LEADERS | AN INTERNATIONAL COMPARISON
8
WHAT LEADERS STUDIED: UNDERGRADUATE DEGREES
Undergraduate courses of study were classified into ten categories, plus a ‘not applicable’ classification for subjects in the sample who did not obtain an undergraduate degree. In our 30-country sample, the number of leaders with undergraduate degrees in social sciences (44 per cent) is at least three times as large as any other course of study (e.g. business, 14 per cent; engineering, 12 per cent; humanities, 11 per cent).
TABLE 4: UNDERGRADUATE COURSE OF STUDY
UNDERGRADUATE COURSE OF STUDY
SUBJECTS INCLUDED BUT NOT LIMITED TO: PERCENTAGE OF OVERALL SAMPLE
Social Sciences Economics, International Relations, Political Science, Anthropology, Psychology, Communications, Law
44%
Business Fields Business, Marketing, Management 14%
Engineering Fields Electrical Engineering, Civil Engineering, Mechanical Engineering, Agricultural Engineering and Architecture
12%
Humanities Languages, Literature, History, Philosophy, Religion, Journalism, the Arts
11%
Maths, Biological and Physical Sciences
Maths and all Sciences (including zoology and botany) except Social Sciences and those that fall under Health Fields
6%
Computer and Information Sciences
Computer Science, Informatics, Information Technology, Programming
4%
Health Fields Medicine, Pharmacology, Nursing Studies, Surgery 4%
Education Education, English as a Second Language, Pedagogy 2%
Military Military Sciences and specific areas such as Ammunitions, etc.
1%
General Studies and Other Interior Design, Entrepreneurship, Occupational Studies. 2%
Not Applicable Did not obtain a BA degree. Less than 1%
The sample frame is designed to get a balanced mix of age groups, gender and job titles, with firm sector quotas, while collecting information about a set number of individuals in each of the ten country groupings. The first avenue of investigation is to examine how the education pathways are distributed among these input variables.

THE EDUCATIONAL PATHWAYS OF LEADERS | AN INTERNATIONAL COMPARISON
9
With few exceptions, the data provide compelling evidence that both age and gender are differentiators across specific courses of study at the undergraduate level. Compared to the younger cohort, more leaders in our sample over the age of 45 have their undergraduate degrees in engineering, mathematics and sciences, health and military. Undergraduate degrees in computer and information sciences tilt towards the younger cohort of leaders, not surprising considering the prevalence of digital technology and the subsequent popularity of related disciplines in recent decades. There are no observable differences in the distribution of older and younger age groups in the fields of social sciences, business, humanities and education.
TABLE 5: UNDERGRADUATE COURSE OF STUDY BY AGE GROUP
Social Sciences
Business Fields
Engineering Fields
Humanities
Maths, Biological and Physical Sciences
Computer and Information Sciences
Health Fields
Education
Military
General Studies and Other
43% 46%
12% 15%
14% 10%
10% 12%
8% 4%
2% 6%
5% 3%
2% 1.5%
2% .1%
1.5% 2%
Age 45 and over
Age Under 45
Gender differences are also apparent in the distribution of undergraduate courses of study. Compared to men, women leaders are over-represented among undergraduate degrees held in social sciences and humanities, but they are under-represented in the fields of engineering and computer and information sciences. These gender disparities broadly align with the gender distribution of disciplines studied in the general population.

THE EDUCATIONAL PATHWAYS OF LEADERS | AN INTERNATIONAL COMPARISON
10
TABLE 6: UNDERGRADUATE COURSE OF STUDY BY GENDER
Social Sciences
Business Fields
Engineering Fields
Humanities
Maths, Biological and Physical Sciences
Computer and Information Sciences
Health Fields
Education
Military
General Studies and Other
Male
Female
42% 48%
14% 14%
17% 6%
7% 17%
7% 5%
6% 2%
4% 4%
1% 3%
1%0%
1% 2%
There is very little evidence to suggest that the distribution of undergraduate courses of study by title (Top, Senior and Middle Management) is in any way different from that of our overall sample.
TABLE 7: UNDERGRADUATE COURSE OF STUDY BY JOB TITLE
Social Sciences
Business Fields
Engineering Fields
Humanities
Maths, Biological and Physical Sciences
Computer and Information Sciences
Health Fields
Education
Military
General Studies and Other
Top Management
Senior Management
Middle Management
42% 47% 44%
14% 14% 13%
14% 9% 13%
10% 11% 13%
6% 8% 5%
5% 3% 5%
4% 4% 4%
1.5% 1% 2%
0.5% 1% 0.5%
2% 1% 2%
THE EDUCATIONAL PATHWAYS OF LEADERS | AN INTERNATIONAL COMPARISON
11
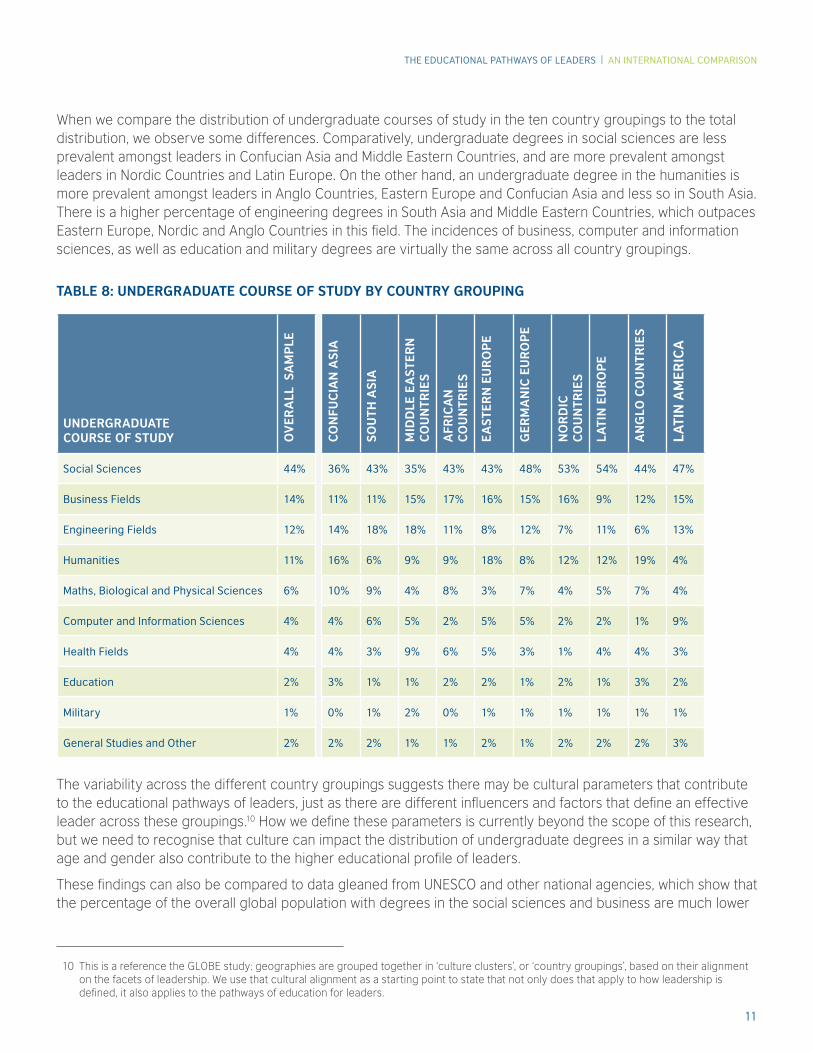
When we compare the distribution of undergraduate courses of study in the ten country groupings to the total distribution, we observe some differences. Comparatively, undergraduate degrees in social sciences are less prevalent amongst leaders in Confucian Asia and Middle Eastern Countries, and are more prevalent amongst leaders in Nordic Countries and Latin Europe. On the other hand, an undergraduate degree in the humanities is more prevalent amongst leaders in Anglo Countries, Eastern Europe and Confucian Asia and less so in South Asia. There is a higher percentage of engineering degrees in South Asia and Middle Eastern Countries, which outpaces Eastern Europe, Nordic and Anglo Countries in this field. The incidences of business, computer and information sciences, as well as education and military degrees are virtually the same across all country groupings.
TABLE 8: UNDERGRADUATE COURSE OF STUDY BY COUNTRY GROUPING
UNDERGRADUATE COURSE OF STUDY O
VE
RA
LL S
AM
PLE
CO
NFU
CIA
N A
SIA
SO
UTH
AS
IA
MID
DLE
EA
STE
RN
C
OU
NTR
IES
AFR
ICA
N
CO
UN
TRIE
S
EA
STE
RN
EU
RO
PE
GE
RM
AN
IC E
UR
OP
E
NO
RD
IC
CO
UN
TRIE
S
LA
TIN
EU
RO
PE
AN
GLO
CO
UN
TRIE
S
LATI
N A
ME
RIC
A
Social Sciences 44% 36% 43% 35% 43% 43% 48% 53% 54% 44% 47%
Business Fields 14% 11% 11% 15% 17% 16% 15% 16% 9% 12% 15%
Engineering Fields 12% 14% 18% 18% 11% 8% 12% 7% 11% 6% 13%
Humanities 11% 16% 6% 9% 9% 18% 8% 12% 12% 19% 4%
Maths, Biological and Physical Sciences 6% 10% 9% 4% 8% 3% 7% 4% 5% 7% 4%
Computer and Information Sciences 4% 4% 6% 5% 2% 5% 5% 2% 2% 1% 9%
Health Fields 4% 4% 3% 9% 6% 5% 3% 1% 4% 4% 3%
Education 2% 3% 1% 1% 2% 2% 1% 2% 1% 3% 2%
Military 1% 0% 1% 2% 0% 1% 1% 1% 1% 1% 1%
General Studies and Other 2% 2% 2% 1% 1% 2% 1% 2% 2% 2% 3%
The variability across the different country groupings suggests there may be cultural parameters that contribute to the educational pathways of leaders, just as there are different influencers and factors that define an effective leader across these groupings.10 How we define these parameters is currently beyond the scope of this research, but we need to recognise that culture can impact the distribution of undergraduate degrees in a similar way that age and gender also contribute to the higher educational profile of leaders.
These findings can also be compared to data gleaned from UNESCO and other national agencies, which show that the percentage of the overall global population with degrees in the social sciences and business are much lower
10 This is a reference the GLOBE study: geographies are grouped together in ‘culture clusters’, or ‘country groupings’, based on their alignment on the facets of leadership. We use that cultural alignment as a starting point to state that not only does that apply to how leadership is defined, it also applies to the pathways of education for leaders.

THE EDUCATIONAL PATHWAYS OF LEADERS | AN INTERNATIONAL COMPARISON
12
than among the leaders in this study.11 While noting that the mix of countries is not identical and the sample frame for this research is structured with quotas relative to sectors and job titles, the observable gap in social sciences and business educational backgrounds is at least 20 percentage points in favour of sampled leaders over the total population. This indicates the importance of an educational background in the social sciences and business among leaders relative to the overall population. It could also suggest that individuals with a social science or business degree are more likely to take on leadership roles during their careers. In both cases, determining causality between social science and business backgrounds and career leadership requires further research.
WHAT LEADERS STUDIED: GRADUATE DEGREES
Nearly two in five leaders included in this research (38 per cent) have a masters-level degree and a further 22 per cent have a professional degree. Fewer than one in ten (nine per cent) leaders in the sample have a PhD degree. The input variables of these educational pathways suggest holders of masters’ degrees include a larger proportion of leaders under the age of 45, as well as a larger contingent of women compared to the overall sample profile.
By comparison, more men in our sample received a MBA or MSc degree than women, while women in our sample represent a greater proportion of those that obtained JD/LLM degrees. There is no evidence to suggest any major difference in job title levels among masters and professional degree holders. PhD holders tend to be over-represented by men, those 45 and older and those in more top-level management positions than the overall sample of leaders.
TABLE 9: ADVANCED DEGREES BY AGE, GENDER, AND JOB TITLE
AGE GENDER TITLE
45 AND OVER
UNDER 45
MALE FEMALE TOP MGMT
SENIOR MGMT
MIDDLE MGMT
Overall Sample (n=1709)
42% 58% 55% 45% 27% 32% 41%
Type of Master’s Degree
MA (n=470) 35% 65% 48% 52% 24% 31% 46%
MSc (n=182) 42% 56% 62% 39% 26% 34% 40%
Professional Course of Study
MBA (n=236) 42% 59% 60% 40% 23% 37% 40%
JD or LLM (n=63) 41% 59% 46% 54% 26% 40% 34%
Doctoral Degree
PhD (n=153) 60% 41% 65% 35% 36% 31% 33%
11 UNESCO Institute of Statistics. “Distribution of Tertiary Graduates by Field of Study.” http://data.uis.unesco.org/index.aspx?queryid=163
Statistics Canada. “Number and proportion of adults aged 25 to 64 by top 10 fields of study, for selected levels of educational attainment.” 2011. http://www12.statcan.gc.ca/nhs-enm/2011/as-sa/99-012-x/99-012-x2011001-eng.cfm

THE EDUCATIONAL PATHWAYS OF LEADERS | AN INTERNATIONAL COMPARISON
13
The pattern of advanced degrees across country groupings indicates a relatively smaller proportion of leaders in Confucian Asia and African Countries with MA degrees, especially compared to leaders in South Asia and Eastern and Latin Europe. There are more MSc, JD, and doctoral degree holders in Middle Eastern Countries compared to the overall sample. Again compared to the sample, MBA degrees are more prevalent among leaders in African countries and less so among leaders in the Nordic countries.
TABLE 10: ADVANCED DEGREES BY COUNTRY GROUPING
% OF SAMPLE WITH THE FOLLOWING ADVANCED DEGREES O
VE
RA
LL
SA
MP
LE
CO
NFU
CIA
N A
SIA
SO
UTH
AS
IA
MID
DLE
EA
STE
RN
C
OU
NTR
IES
AFR
ICA
N
CO
UN
TRIE
S
EA
STE
RN
E
UR
OP
E
GE
RM
AN
IC
EU
RO
PE
NO
RD
IC
CO
UN
TRIE
S
LA
TIN
EU
RO
PE
AN
GLO
C
OU
NTR
IES
LA
TIN
AM
ER
ICA
MA 28% 14% 40% 21% 20% 40% 25% 31% 36% 21% 26%
MSc 11% 10% 9% 17% 10% 11% 14% 16% 6% 8% 6%
MBA 14% 12% 16% 19% 23% 11% 9% 7% 15% 13% 14%
JD or LLM 4% 2% 3% 9% 4% 1% 5% 2% 4% 5% 2%
PhD 9% 15% 8% 15% 6% 11% 13% 2% 6% 5% 6%
EDUCATIONAL PATHWAYS AND CAREER OUTCOMES
Approximately 11 per cent (189 leaders) of the sampled population of leaders work at a global Fortune500 company. While the demographic breakdown of the sub-sample of leaders working at Fortune500 companies is very similar to the overall sample, their educational pathways contrast somewhat from that of the overall sample of leaders. The findings show that those working at Fortune500 companies have a larger share of business and engineering degrees and a smaller proportion of degrees in humanities than among our overall sample of leaders. While this could suggest that leaders in top companies are more likely to have business and engineering qualifications, the research shows that leaders in different sectors tend to have differing educational backgrounds (and not just business and engineering backgrounds).
As the sample was structured with fixed quotas across sectors, we will examine the characteristics of each sector independently to assess the educational pathways of leaders within each industry.

THE EDUCATIONAL PATHWAYS OF LEADERS | AN INTERNATIONAL COMPARISON
14
TABLE 11: UNDERGRADUATE COURSE OF STUDY – FORTUNE500 EMPLOYEES AND TOTAL SAMPLE
UNDERGRADUATE DEGREE 30 COUNTRY SAMPLE WORKING AT A FORTUNE 500
Social Sciences 44% 38%
Business Fields 14% 20%
Engineering Fields 12% 17%
Humanities 11% 6%
Maths, Biological and Physical Sciences 6% 4%
Computer and Information Sciences 4% 6%
Health Fields 4% 5%
Education 2% 1%
Military 1% 0%
General Studies and Other 2% 2%
Within our sample, 89 per cent of leaders within the legal sector, 56 per cent of politicians and civil servants, and 50 per cent of non-profit sector leaders have a social science undergraduate degree. Leaders in financial services and consulting, as well in education, also have a relatively high proportion of undergraduate degrees in social sciences (42 per cent in both fields).
Compared to the sample across all sectors, leaders in the communications and sports and entertainment sectors hold larger proportions of undergraduate degrees in the humanities (21 per cent and 26 per cent, respectively). Leaders in these two sectors also have a higher number of undergraduate degrees in business and engineering, at approximately twice the rate of the overall sample.
Beyond undergraduate degrees, however, the contribution from each sector towards MA and MBA degrees provides an additional window into the educational pathways of leaders. Across all sectors, leaders in the defence and security sector have the highest proportion of MA or MSc degrees (41 per cent), whereas the incidence of MBAs is more widely shared across a number of sectors.

THE EDUCATIONAL PATHWAYS OF LEADERS | AN INTERNATIONAL COMPARISON
15
TABLE 12: UNDERGRADUATE COURSE OF STUDY BY SECTOR
SECTOR OV
ER
ALL
SA
MP
LE
LA
W A
ND
LEG
AL
SE
RV
ICE
S
ED
UC
ATI
ON
AN
D T
RA
ININ
G
FIN
AN
CIA
L S
ER
VIC
ES
AN
D
CO
NSU
LTIN
G
CO
NSU
ME
R P
RO
DU
CTS
CO
MM
UN
ICA
TIO
NS
SP
OR
TS A
ND
EN
TER
TAIN
ME
NT
TEC
HN
OLO
GY
AN
D I
NN
OV
ATI
ON
HE
ALT
H
EN
ER
GY
AN
D E
NV
IRO
NM
EN
T
DE
FEN
CE
AN
D S
ECU
RIT
Y
PO
LITI
CIA
NS
CIV
IL S
ER
VA
NTS
NO
N-P
RO
FIT
EM
PLO
YE
ES
Undergraduate Course of Study
Social Sciences 44% 89% 42% 42% 36% 34% 34% 29% 22% 20% 19% 57% 55% 50%
Business Fields 14% 4% 16% 28% 28% 15% 23% 17% 18% 30% 16% 4% 7% 8%
Engineering Fields 12% 0% 12% 16% 21% 16% 2% 18% 4% 22% 38% 7% 8% 9%
Humanities 11% 2% 17% 6% 3% 21% 26% 6% 7% 7% 3% 12% 9% 18%
Advanced Degrees
MA or MSc 28% 30% 20% 18% 9% 20% 14% 13% 14% 18% 41% 17% 17% 31%
MBA 14% 1% 26% 24% 24% 11% 9% 16% 20% 19% 14% 2% 23% 8%
INTERNATIONAL EXPERIENCE
International experience is defined both within the educational pathway (for example, obtaining an undergraduate degree in a country other than their home country) as well as among the outcome variables from the educational pathway (for example, international work experience).
Overall, 793 leaders, or 46 per cent of our sample, had some kind of international experience. We split this into three categories:
•International education experience: those that obtained their bachelor’s, master’s, professional or doctoral degree(s) in a country other than their home country. Of the overall sample of leaders, 16 per cent received their bachelor’s degree outside of their home countries. The figure is higher in Middle Eastern countries (24 per cent) and lower in Germanic Europe (4 per cent) and Latin America (9 per cent).
•International work experience: those who work for a company whose headquarters is in a different country from their home country, and those who have worked in a different country from their home country.
•Any international experience: those that fall into either or both of the above categories.

THE EDUCATIONAL PATHWAYS OF LEADERS | AN INTERNATIONAL COMPARISON
16
WHY PURSUE INTERNATIONAL EDUCATION?
The qualitative research on international experience suggests that the decision to study in a university outside their home country is driven by a number of needs. As students, these leaders may have been looking to study courses or subject areas not available to them in their home country, to pursue their education in another language or to study at an institution with a stronger reputation.12
“[Learning English] was one of the reasons I decided to go to London. I knew that I would be learning when I was outside the classroom as well.” —Danillo Cersosimo (Brazil), OSLO-IN Marketing and Strategic Planning Consultant
PROFILE OF LEADERS WITH INTERNATIONAL EXPERIENCE
Younger and older, men and women: there is virtually no difference between age categories or gender in terms of the type and extent of international experience.
TABLE 13: INTERNATIONAL EXPERIENCE BY AGE AND GENDER
AGE GENDER
% of Overall sample who have Over 45 Under 45 Male Female
International Education 29% 30% 30% 29%
International Work 32% 34% 32% 35%
Total International Experience 45% 47% 47% 45%
Geography (and to an extent culture) does matter, however, when we look at the extent of international experience. Ranked from highest to lowest percentages, leaders from Middle Eastern countries have the most international experience, while those from Anglo countries had the least, in either international work or education experience. While leaders from Anglo countries had a lower percentage compared to the sample (14 per cent), this is still considerably higher than the overall global population,13 thus highlighting the value of international experience for career advancement.
12 British Council. Broadening Horizons 2015: the value of the overseas experience. 2015. https://ei.britishcouncil.org/reports/products/macro-trends-analysis
13 UNESCO Institute of Statistics. “Global Flow of Tertiary-Level Students.” http://data.uis.unesco.org/index.aspx?queryid=163

THE EDUCATIONAL PATHWAYS OF LEADERS | AN INTERNATIONAL COMPARISON
17
TABLE 14: INTERNATIONAL EXPERIENCE BY COUNTRY GROUPING
COUNTRY GROUPING INTERNATIONAL EDUCATION EXPERIENCE
INTERNATIONAL WORK EXPERIENCE
ANY INTERNATIONAL EXPERIENCE
Middle Eastern Countries 55% 48% 71%
South Asia 48% 29% 55%
Confucian Asia 35% 30% 52%
Germanic Europe 12% 46% 50%
Latin Europe 25% 46% 50%
Nordic Countries 25% 33% 47%
African Countries 38% 32% 46%
Eastern Europe 25% 27% 36%
Latin America 17% 25% 32%
Anglo Countries 14% 19% 25%
PROFILE OF UNDERGRADUATE DEGREES EARNED OUTSIDE THE HOME COUNTRY
Among the leaders who received their bachelor’s degree outside of their home country (16 per cent of our sample), there are no real differences in the types of undergraduate degrees they earned compared to all bachelor’s degrees in each specific country grouping. Even when considered alongside the overall sample, the only major difference among the top fields of undergraduate courses is the proportion of business degrees earned outside of the home country (particularly in the case of European countries).
“Good universities give you a good starting point. The top universities attract truly the best people from the world with various talents.” —Dimitri Podoliev (Ukraine), Co-founder of iHUB, Chairman of Seed Forum Ukraine Foundation

THE EDUCATIONAL PATHWAYS OF LEADERS | AN INTERNATIONAL COMPARISON
18
TABLE 15: INTERNATIONAL EDUCATIONAL EXPERIENCE BY COURSE OF STUDY AND COUNTRY GROUPING
UNDERGRADUATE (UG) COURSES
SOCIAL SCIENCES BUSINESS FIELDS ENGINEERING FIELDS HUMANITIES
Country Groupings
UG abroad (N)
UG UG abroad UG UG abroad UG UG abroad UG UG abroad
Middle Eastern Countries
41 35% 34% 15% 12% 18% 20% 9% 10%
African Countries
36 43% 36% 17% 19% 11% 14% 9% 8%
Eastern Europe
32 43% 28% 16% 41% 8% 3% 18% 9%
Nordic Countries
32 53% 44% 16% 22% 7% 0% 12% 22%
South Asia 32 43% 46% 11% 12% 18% 21% 6% 3%
Confucian Asia 29 36% 31% 11% 24% 14% 7% 16% 17%
Latin Europe 26 54% 36% 9% 24% 11% 0% 12% 24%
Anglo Countries
19 44% 36% 12% 11% 6% 16% 19% 5%
Latin America 15 47% 47% 15% 13% 13% 13% 4% 7%
Germanic Europe
7 48% 22% 15% 0% 12% 33% 8% 22%
TOTAL sample 269 44% 38% 14% 20% 12% 11% 11% 12%
Indeed, while leaders from Anglo countries tend to have lower levels of international educational or work experience, leaders from other country groupings seek out an international education experience in these Anglo countries. This speaks to the importance of English as the primary language of business as well as the sheer number of highly ranked higher education institutions in Anglo countries and their international reputations.

THE EDUCATIONAL PATHWAYS OF LEADERS | AN INTERNATIONAL COMPARISON
19
TABLE 16: INTERNATIONAL EXPERIENCE BY COUNTRY GROUPING OF UNDERGRADUATE INSTITUTION
COUNTRY GROUPING WHERE BA INSTITUTION IS LOCATED
INTERNATIONAL EDUCATION EXPERIENCE
INTERNATIONAL WORK EXPERIENCE
ANY INTERNATIONAL EXPERIENCE
Middle Eastern Countries 42% 45% 63%
Anglo Countries 52% 42% 60%
Germanic Europe 11% 47% 51%
South Asia 38% 20% 46%
Latin Europe 20% 38% 46%
Confucian Asia 24% 26% 42%
Nordic Countries 14% 32% 40%
African Countries 25% 19% 32%
Latin America 10% 22% 27%
Eastern Europe 12% 17% 24%
EDUCATION PATHWAYS AND INTERNATIONAL EXPERIENCE
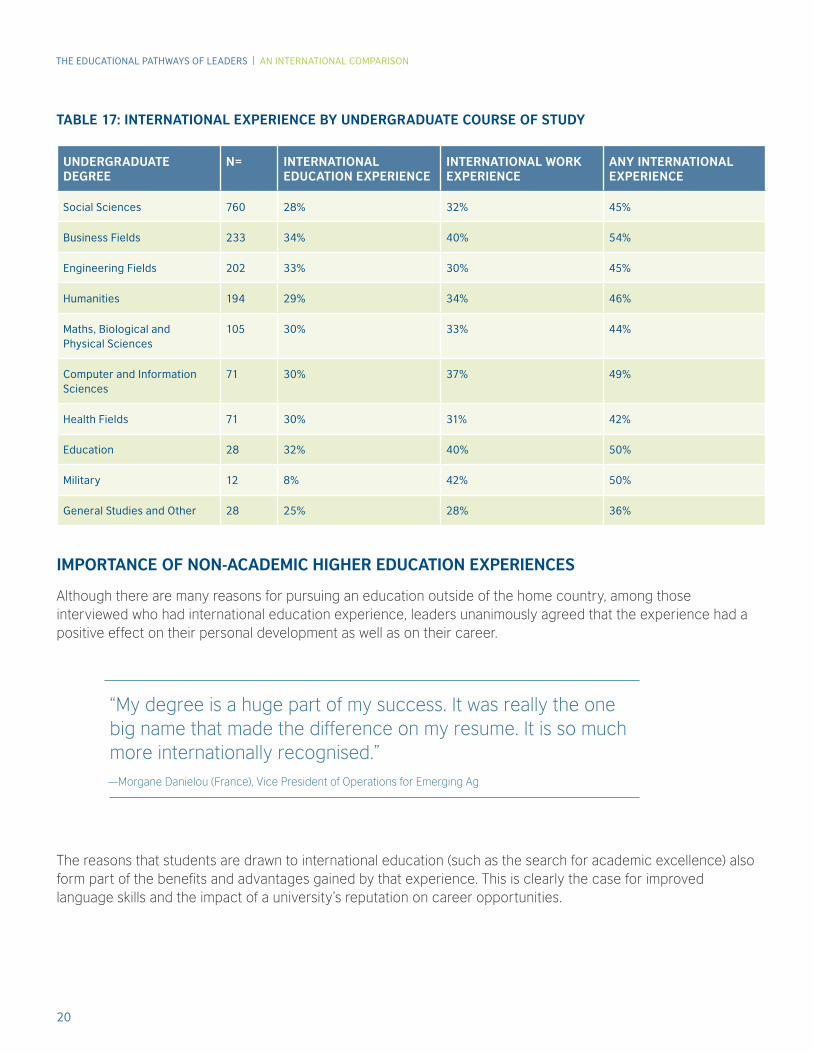
The level of international experience is highest among leaders with an undergraduate degree in business, both in terms of international education and international work experiences. The international education results reflect UNESCO figures demonstrating that business-related subjects are the most popular with globally mobile students.14 This trend might be attributed to several interconnected factors: the global nature of many businesses (particularly at the Fortune500 level), the availability of business programs around the world, and the importance of gaining a business degree at an internationally renowned institution. Each of these factors increases the opportunity to gain international experience in business, as well as the attractiveness of doing so.
14 UNESCO Institute of Statistics. “Distribution of Tertiary Graduates by Field of Study.” http://data.uis.unesco.org/index.aspx?queryid=163
THE EDUCATIONAL PATHWAYS OF LEADERS | AN INTERNATIONAL COMPARISON
20
TABLE 17: INTERNATIONAL EXPERIENCE BY UNDERGRADUATE COURSE OF STUDY
UNDERGRADUATE DEGREE
N= INTERNATIONAL EDUCATION EXPERIENCE
INTERNATIONAL WORK EXPERIENCE
ANY INTERNATIONAL EXPERIENCE
Social Sciences 760 28% 32% 45%
Business Fields 233 34% 40% 54%
Engineering Fields 202 33% 30% 45%
Humanities 194 29% 34% 46%
Maths, Biological and Physical Sciences
105 30% 33% 44%
Computer and Information Sciences
71 30% 37% 49%
Health Fields 71 30% 31% 42%
Education 28 32% 40% 50%
Military 12 8% 42% 50%
General Studies and Other 28 25% 28% 36%
IMPORTANCE OF NON-ACADEMIC HIGHER EDUCATION EXPERIENCES
Although there are many reasons for pursuing an education outside of the home country, among those interviewed who had international education experience, leaders unanimously agreed that the experience had a positive effect on their personal development as well as on their career.
“My degree is a huge part of my success. It was really the one big name that made the difference on my resume. It is so much more internationally recognised.” —Morgane Danielou (France), Vice President of Operations for Emerging Ag
The reasons that students are drawn to international education (such as the search for academic excellence) also form part of the benefits and advantages gained by that experience. This is clearly the case for improved language skills and the impact of a university’s reputation on career opportunities.
“I came back with experience from a different society and an independence and knowledge of languages that were very much considered assets early on in my career.”- Anne Folkvord, Norway, Deputy Director General at Ministry of Children, Equality, and Social Inclusion

THE EDUCATIONAL PATHWAYS OF LEADERS | AN INTERNATIONAL COMPARISON
21
“One benefit is actually the network—the social network—and the opportunity to interact with teachers, professors, faculty members, colleagues, and students from all around the world.”—Dr. Rintaro Mori (Japan), Director for the Department of Health Policy, National Center for Child Health and Development
International education and work experience also provide other benefits that may not have been fully considered when leaders were deciding to leave their home country. Beyond the expanded scope of specialised knowledge, exposure to a different education and evaluation system, as well as experiencing a new social and cultural environment, higher education compels the individual to become increasingly adaptable to a different way of doing things. Contact with other students and professionals in a multicultural setting increases awareness and promotes flexibility and adaptability in successful interactions. These are all qualities of leadership considered necessary to motivate others in executing a shared vision.
“I learned more in that first year studying [abroad] than all the years afterwards. You’re in a completely different environment. You have no structure to fall back on, and so you really need to make sure that you’re successful on your own.” —Jan-Willem Middelburg (Netherlands), Director for Education and Consulting at Pink Elephant
Finally, as evidenced through the qualitative analysis, extracurricular activities do advance leaders’ careers. These experiences contribute to one’s career through less tangible benefits, including establishing large social and professional networks and building confidence and self-esteem.

THE EDUCATIONAL PATHWAYS OF LEADERS | AN INTERNATIONAL COMPARISON
22
CONCLUSIONS
In recent years there has been a focus on encouraging students to study STEM subjects during their higher education experience, corresponding with a critique of the humanities which queries whether humanities graduates are well-prepared for the workplace15, and whether they are able to contribute fully to innovation and progress in the global economy. Past British Council research has demonstrated the value of an education in the humanities to employers in all sectors16, and there is an increasing body of literature demonstrating that interdisciplinary higher education best prepares graduates for the workplace, ensuring that they have the soft and intercultural skills to succeed.17
The research presented in this report reinforces the notion that successful leaders come from a variety of higher education backgrounds, and that the social sciences and humanities are extremely important contributors to all sectors, in every region of the world, for men and women, and for leaders of all ages.
British Council USA, recognising that many development issues are grounded in local cultural context requiring expertise across disciplines, is exploring a new programme which will foster interdisciplinary and multinational research collaboration to address specific challenges.
“It’s not just about the skills. I would give equal weight to issues of self-esteem, self-worth, and confidence that comes with education. Because you interact with different people, you learn to develop those aspects of yourself, you discover yourself. Education is a journey of self-discovery that impacts who you are going forward.” —Nandita Das (India), Actress, Director and Businesswoman
In addition, the research shows that experiences gained in higher education other than the learning itself is critical to the development of successful leaders. The value of international experiences is further highlighted by high percentages of those achieving professional success with an international background compared to the general population. Through interviews, leaders described how international experience is crucial in developing strong networks and the skills needed to navigate an increasingly multicultural and fluid workplace.

THE EDUCATIONAL PATHWAYS OF LEADERS | AN INTERNATIONAL COMPARISON
23
Governments and other international education organisations recognise the importance of international education and work experiences in developing an economically-productive workforce. With initiatives such as Generation Study Abroad in the US, Science without Borders in Brazil and the Outward Mobility Strategy in the UK, encouraging students to obtain international experiences to further their career prospects is a priority that must be pursued further. Utilising the data presented, higher education institutions can develop more robust international recruitment and partnership strategies which target international students and study abroad and exchange agreements in specific regions and disciplines.
15 Cohan, P. “To Boost Post-College Prospects, Cut Humanities Departments.” Forbes. 2012. http://www.forbes.com/sites/petercohan/2012/05/29/to-boost-post-college-prospects-cut-humanities-departments/ Jaschick, S. “Obama vs. Art History.” Inside Higher Education. 2014. https://www.insidehighered.com/news/2014/01/31/obama-becomes-latest-politician-criticize-liberal-arts-discipline Klenbnikov, S. “Liberal Arts vs. STEM: the right degrees, the wrong debate.” Forbes. 2015.http://www.forbes.com/sites/sergeiklebnikov/2015/06/19/liberal-arts-vs-stem-the-right-degrees-the-wrong-debate/
16 British Council and Ipsos. Mobilising the Humanities: the development perspective. http://www.britishcouncil.us/programmes/education/higher/policy-dialogue/research-reports/mobilizing-humanities
17 Jackson-Hayes, L. “We don’t need more STEM majors. We need more STEM majors with liberal arts training.” Washington Post. 2015. https://www.washingtonpost.com/posteverything/wp/2015/02/18/we-dont-need-more-stem-majors-we-need-more-stem-majors-with-liberal-arts-training/ Dolling, L. “Humanities and Science Must Work Together.” New York Times. 2014. http://www.nytimes.com/roomfordebate/2013/11/04/the-fate-of-the-humanities/humanities-and-science-must-work-together Fitzgerald, D. “At MIT, the humanities are just as important as STEM.” The Boston Globe. 2014. https://www.bostonglobe.com/opinion/2014/04/30/mit-humanities-are-just-important-stem/ZOArg1PgEFy2wm4ptue56I/story.html#

Founded in 1934, the British Council is the United Kingdom’s
international organisation for cultural relations and
international opportunities. With offices in more than 100
countries, we are the largest and oldest cultural relations
organisation in the world. We build trust and understanding
between the people of the UK and other countries.
We provide educational opportunities to students and
teachers in English language learning and study abroad,
and support cultural exchange in the arts. We also work
closely with communities through programmes that help
them achieve positive change in education, skills, and civil
society. Working in partnership with governments, donors and
businesses, we provide effective, value for money solutions
and build sustainable relationships to create a more secure,
prosperous world.
For more information, please visit www.britishcouncil.us Connect with us at www.facebook.com/britishcouncilusa
or @usaBritish
About Ipsos
Ipsos is an independent market research company
controlled and managed by research professionals.
With offices in 87 countries, Ipsos Public Affairs
conducts strategic research in partnership with
clients from government, public, corporate, and
not-for-profit sectors. We understand and manage
issues, advance reputations, determine and pinpoint
shifts in attitude and opinion, enhance
communications, and evaluate policy.
For more information, please visit www.ipsos.com.
© British Council 2015