
An integrated system approach for swine manure … integrated system approach for swine manure ......
60
An integrated system approach for swine manure management at the farm level Marie-Ève Lenghan-Sauriol Samuel Leduc Presented to Dr G.S.V. Raghavan BREE 495 – Design III Date presented: April 14 th , 2009 McGill University, MacDonald Campus Faculty of Agriculture and Environmental Sciences Department of Bioresource Engineering Room MS1-027, Macdonald-Stewart Building, 21,111 Lakeshore Rd. Ste. Anne de Bellevue, Quebec H9X 3V9 Tel.: 514-398-7773 | Fax: 514-398-8387
Transcript of An integrated system approach for swine manure … integrated system approach for swine manure ......

An integrated system approach
for swine manure management
at the farm level
Marie-Ève Lenghan-Sauriol Samuel Leduc
Presented to Dr G.S.V. Raghavan
BREE 495 – Design III Date presented: April 14th, 2009
McGill University, MacDonald Campus Faculty of Agriculture and Environmental Sciences
Department of Bioresource Engineering Room MS1-027, Macdonald-Stewart Building, 21,111 Lakeshore Rd.
Ste. Anne de Bellevue, Quebec H9X 3V9 Tel.: 514-398-7773 | Fax: 514-398-8387

2
EXECUTIVE SUMMARY Swine production becomes more and more an environmental problem because of the over
application of nutrients. Farms located near water bodies or where the nutrient loads of the soil
is high have huge manure management problems: they are stuck with an excess of manure that
cannot be spread. This manure surplus leads to important economic costs and therefore, has
repercussion on the totality of the farm.
This project presents a farm system that would allow the manure produced on farm to be
treated, concentrated and reused. The objective of the farm system is to come up with the best
manure management scenario in terms of both economical and environmental considerations.
Moreover, the farm system will be designed in order to reduce as much as possible the need for
exterior inputs and outputs, that is to say, the farm system will be an integrated soil‐crop‐animal
system.
This project will demonstrate how the principles of systems engineering can be used to develop
management strategies for using animal manure, focusing on its resource value. The design
used is a medium size growing‐finishing swine farm doing a corn‐soybean crop rotation. Our
analysis of the integrated system is focused on the reduction of the amount of manure to be
spread on a farm by the concentration of the essential nutrients present in manure.

3
Table of Content EXECUTIVE SUMMARY ........................................................................................................ 2
Table of Content ................................................................................................................. 3
List of Figures ...................................................................................................................... 5
List of Tables ....................................................................................................................... 5
1‐ Problem Statement ......................................................................................................... 6
2‐ Objectives and Scope ...................................................................................................... 7
3‐ Context ............................................................................................................................ 9
4‐ Literature review .......................................................................................................... 11
Manure management for swine production systems ....................................................... 11
Manure valorisation .......................................................................................................... 11
Essential nutrient content of swine manure ..................................................................... 12
Nitrogen ............................................................................................................................. 13
Phosphorus ........................................................................................................................ 14
Potassium .......................................................................................................................... 15
Applications on land .......................................................................................................... 15
Separation solid‐liquid ....................................................................................................... 17
Solid manure ...................................................................................................................... 18
Liquid manure .................................................................................................................... 18
Concentration of nutrient ................................................................................................. 19
Reverse Osmosis ................................................................................................................ 19
Treated water .................................................................................................................... 21
Composting ........................................................................................................................ 22
5‐ Methodology ................................................................................................................ 25
5.1 The design approach ....................................................................................................... 25
5.2 Expected results .............................................................................................................. 32
6‐ Evaluation of reverse osmosis technique ..................................................................... 33

4
6.1 Parameters for best nutrient concentrations ................................................................. 33
6.2 Energy consumption ....................................................................................................... 35
6.3 Best pilot parameter set‐up ............................................................................................ 37
7‐ Design details ................................................................................................................ 37
7.1 Farm system .................................................................................................................... 37
7.2 Implementation of the reverse osmosis ......................................................................... 38
Separation solid‐liquid ................................................................................................... 38
Treatment of manure .................................................................................................... 38
Storage of liquid parts ................................................................................................... 38
Storage of solid part ...................................................................................................... 38
Nutrient loads ................................................................................................................ 40
Energy requirements ..................................................................................................... 40
Grey water uses ............................................................................................................. 40
Crops yield ..................................................................................................................... 41
Feed requirements ........................................................................................................ 41
8‐ Economic analysis ......................................................................................................... 41
8.1 Farm with reverse osmosis system ................................................................................. 41
8.2 Comparison with conventional farming ......................................................................... 42
9‐ Conclusion ..................................................................................................................... 43
Acknowledgements ........................................................................................................... 44
References ........................................................................................................................ 45
Figure References ............................................................................................................. 48
Annexes ............................................................................................................................. 49
Design details calculations ................................................................................................ 53

5
List of Figures Figure 1 ‐ Separation of animal and crop production enterprise and the resultant animal waste and soil quality problems. ............................................................................................................................................ 7
Figure 2 – Integrated system flow chart ......................................................................................................... 9
Figure 3 – Chart of Quebec production type ................................................................................................ 11
Figure 4 – Nitrogen Cycle.............................................................................................................................. 14
Figure 5 – Phosphorous cycle ....................................................................................................................... 15
Figure 6 – Physical Separation: Belt system ................................................................................................. 17
Figure 7 – Reverse Osmosis Diagram ........................................................................................................... 20
Figure 8 – Influence du pH sur la dissociation de l’ammoniac en solution aqueuse (eau pure) .................. 21
Figure 9 – Composting Facility ...................................................................................................................... 24
Figure 10 –Location of St‐Étienne de Beauharnois ...................................................................................... 26
Figure 11 – Whole‐mount reverse osmosis system of Airablo ..................................................................... 28
Figure 12 – Diagram of two scale of the reverse osmosis system used for the experimentation ............... 29
Figure 13 – Bar graph nutrients concentration in concentrate .................................................................... 35
Figure 14 – Energy cost of different trials .................................................................................................... 36
Figure 15 – Plan view of pilling building ....................................................................................................... 39
List of Tables Table 2 – Parameter of energy consumption during trials ........................................................................... 36
Table 3 – System comparison of nutrients ................................................................................................... 42
Table 4 ‐ Factors to be considered in the design of the integrated swine‐crop‐soil manure management system .......................................................................................................................................................... 49
Table 5 ‐ Recommended conditions for rapid composting. ......................................................................... 50
Table 6 ‐ Typical composting times for selected combinations of methods and materials. ........................ 51
Table 7 – Airablo systems specifications ...................................................................................................... 52

6
1‐ Problem Statement Swine production is a major agricultural enterprise in Quebec and the environmental
effects of swine manure storage systems and application methods are a concern. The biggest
environmental concern with respect to swine manure is currently surface and ground water
quality and phosphorus runoff which is responsible of the current eutrophication of Quebec’s
water systems.
The issue of swine manure is becoming an issue of point source production, especially as
it relates to livestock ownership and responsibility for the collected material.
Since much of the province’s swine manure can be collected, stored, and spread on the
land surface, this manure can be used as a substantial nutrient source for crops. Swine manure
is handled as solid, semi‐solid slurry, or liquid, depending on the type of housing and manure
handling system used. Each of these systems has some unique features that add complexity to
the manure handling, transportation and use (Kofoed, A.D. et al, 1986).
One drawback of the traditional use of manure is that land for application is physically
limited and is also restricted by the Ministry. Therefore, at a certain farm‐site, manure produced
must often be stored and cannot be used to its full extent.
As of today, swine production units are not geared toward retaining nutrients in swine
manure. However, several techniques of volume reduction of manure and concentration of
nutrients contained in manure have been developed by decreasing its water content. Thus, the
cost of storage and amount of spreading on land can be reduced without a significant loss of the
nutrients important for the growth of plants, especially nitrogen and phosphorous compounds.
Also, the water taken out of the manure can be reused on farm for cleaning and watering
purposes, therefore, limiting water consumption by recycling water and the associated cost of
water consumption. The use of manure as a fertilizer as opposed to regular inorganic fertilizers
is also a great way to reduce the energy consumption of fertilizer manufacture. Combine to
other agricultural industries, fertilizer manufactures energy consumption accounts for up to 3%
of Canada’s total commercial fossil fuels consumption (McLaughlin, N.B, 2000).
An integrated manure management system adapted to the specific needs of a farm‐site
could be an interesting approach to use manure at its maximum potential, in the most efficient

7
way and by limiting its negative impacts on the environment without compromising its fertilizing
value.
2‐ Objectives and Scope The main objective of this project is to design a farm scale system aimed at improving
the use of manure on the farm and at reducing the quantity of waste at the same time.
This system will help to enhance the manure value of today’s farm industries. The
designed system will be used to close the loop opened by the use of inorganic fertilizers by
recovering the resource value of the manure.
Figure 1 ‐ Separation of animal and crop production enterprise and the resultant animal waste and soil
quality problems.
In order to create a semi closed system, we also took into consideration the other aspect of the
farm:
‐ food production (we focused only on corn)
- Soil requirements and fertilizing applications
- Hog‐farming techniques and process
- Manure handling, storage and possibility of a new manure treatment to concentrate the
nutrients in the manure.

8
Subsequently, the size of the different parts of this system, the quantity of manure
produced each year and the size of the different manure tanks, the composting type and area
and the scale up of the integrated farm system will be evaluated.
Finally, the integrated farm system along with the use of the reverse osmosis technology will be
economically and environmentally evaluated. The approximate budget for the equipment,
buildings and operations required for the implementation of this farm‐system will be calculated
and compared to conventional hog farms. The advantages, benefits and feasibility of the system
will be assessed and discussed.

9
3‐ Context This project will be designed for a region of Quebec facing a surplus of swine manure.
The design will consist of manure management integrated system for a medium‐sized growing‐
finishing swine farm. This system will include an initial physical manure solid‐liquid separator.
The solid part of the manure will be partly spread on the field and the remaining will be
composted. The liquid part will be treated with a reverse osmosis system in order to
concentrate the nutrients present in the manure and to remove the water from it. The water
removed from that liquid manure will be kept for farm cleaning purposes and for pesticides
spreading. The concentrated part will be spread partly on the field and the rest could be
exported to other regions of Quebec at a lower cost on a nutrient basis.
Figure 2 – Integrated system flow chart
The efficiency of the reverse osmosis system will be evaluated in collaboration with
Agriculture and Agri‐food Canada under the supervision of Ph.D. Lucie Masse, researcher at the
Dairy and Swine Research and Development Centre at Sherbrooke.

10
Agriculture and Agri‐food Canada (AAFC) is a governmental agency working to improve
possibilities for farmers and Canadians. They have been in the industry for more than a century
through and are specialized in the agricultural researches and innovation. AAFC has 19 research
centres, more than 2,300 employees including about 600 scientists and experts.
The Dairy and Swine Research and Development Centre is one of the AAFC’s national
network. It is the only research center specialized on the Canadian dairy and swine production.
The Center is also responsible for the Beef Research Farm based in Kapuskasing, Ontario. This
Farm develops improvements in the cost efficiency of beef production for northern regions of
Eastern Canada.
Researcher Lucie Masse is presently working on many projects on membrane filtration
for the production of nutrient concentrates from animal waste. She also works on the
production of potable water at the farm level and the effect of physico‐chemical characteristics
and environmental factors on solid liquid separation of manure using organic and inorganic
coagulants and flocculants.

11
4‐ Literature review Manure management for swine production systems
Swine farming operations fall into one of three general categories: Farrowing, finishing
and farrow‐to‐finish. Farrowing farms own many sows to give birth to as many farrows as
possible. When the farrows are weaned, the producers can sell them to a finishing farm. This
second type of farm, buy the farrows and feed them until they weight near 100 kilograms. At
that time, they can sell the hogs to a slaughterhouse. The last category of production combines
the two previous types of operation. The producers own a small number of sows to produce a
quantity of farrows, which take into account a death rate. They take care of those farrows until
they are ready to be sold to the slaughterhouse. In Quebec, 50% of the production is in farrow‐
to‐finish production (Fédération des Producteur de porc, 2006).
Figure 3 – Chart of Quebec production type
Manure management varies from one production type to another. It depends mainly on the
manure composition. Since the manure composition depends on the stage of growth of the pigs,
it can explain the large variety of management. Swine manure varies from about 85% liquid for
sows to 95% liquid for finishing hogs (Manure Management Handbook, 1982).
Manure valorisation
Throughout the world, the inevitable decrease in the availability of fossil fuels coupled
with the increased in price of inorganic fertilizer has driven an interest in the development of
sustainable agricultural practices. The agricultural industry is highly dependent upon fertilizers

12
to supply the nutrients required by crops to achieve maximal crop yields. Production of
inorganic fertilizers represents a large energy consumer (McLaughlin, N.B, 2000). Combined with
the increasing concern about the environmental problems associated with animal manure, the
interests in using manure as efficiently as possible is currently rising (Klausner, S., 1995).
Furthermore, detailed studies have been performed to quantify the savings that could be
achieved through the utilization of manure fertilizers as opposed to inorganic fertilizers and
have demonstrated that the greatest impact on reducing economical and energical
requirements is made only when maximizing the use of manure nutrients (McLaughlin, N.B,
2000).
Still today, there are social dilemmas over the use of manure because of the odour
problems and costs of application and handling of manure compared to commercial fertilizers.
Essential nutrient content of swine manure
Despite from the presence of bedding, swine manure tends to be a relatively
homogeneous material from production unit to production unit, unlike manure collected from
ruminant animals. This is why it is a good test manure to conduct experimental procedures and
design applications on.
Manure is a great substantial nutrient source for crops. In fact, some studies have
shown that for the production of grain corn, inorganic fertilizer could be successfully substituted
by manure (McLaughlin, N.B, 2000). Other studies argue that if all U.S swine manure was
recovered and applied without loss of nutrients, it could supply the nation’s corn crop with one‐
eight of its N needs and one‐fourth of its P and K needs (Hensler, R.F., et al., 1970).
Ammonia‐nitrogen and potassium are found in the liquid phase, while phosphorus is
largely found in the solid fraction of the manure (Thorneby et al., 1999).
The recycling of the nutrients from the animal to the land cannot be solely done in
regards to maximizing crop yield. It has to be balanced in regards to the nutrient and fertilizing
value of the manure and the type of soils it is land‐spread on. The concentration of farms in a
certain region and the amount of fertilizing spread can also represent a negative impact on the
environment by the over application of the essential nutrients (N‐P‐K) (Hatfield, J.L. & B.A
Stewart,1998).

13
At the moment, the efficiency of the manure management systems at retaining the
nutrients is very low. There is a lot of manure not used to its full extent and even worse, a great
amount of manure is not even used, therefore, not returned to the natural system.
Also, animal management accounts for a lot in the nutrient cycles. For example, only
3.6% to 10% of the potassium of the hog food diet is retained by the animal. For nitrogen and
phosphorus, 18 to 40 % of the nutrients of the food ingested are retained (de Lange, 1997).
However, there are only few studies on the digestibility of nutrients in animal feeds regarding to
different food diet. Therefore, the effects of different type of diets on the composition of
manure are negligible (Hatfield, J.L. & B.A Stewart, 1998).
Animal manures, particularly poultry and swine manure, contain relatively high
concentrations of heavy metals, such as arsenic, copper and zinc. These metals are normally
high in manure because concentrations in the diets are high. High concentrations of heavy
metals have been documented in runoff water from soils fertilized with animal manure
(Hensler, et al., 1970). However, in this project, we will only focus on the nitrogen, potassium
and phosphorus nutrients.
Nitrogen
Nitrogen is excreted from the pig as urea in the urine and organic N forms in the feces. A
large proportion of the nitrogen in animal manure is present as uric acid and urea. Shortly after
excretion, uric acid and urea are hydrolyzed to ammonia, which can be lost through
volatilization. While ammonia emissions from animal manure are dependent on several factors,
manure pH has the largest effect. Nitrogen loss from animal manure is a function of
management. During storage, the composition of urea is rapidly hydrolyzed to ammonia (NH3)
and carbon dioxide (CO2) and further storage converts the ammonia form to ammonium‐
nitrogen (NH4‐N).
Ammonia emissions from animal manures to the atmosphere can cause several different
problems, ranging from human health reduction problems to environmental problems. Due to
their very high solubility, nitrates can enter groundwater. Where groundwater recharges stream
flow, nitrate‐enriched groundwater can contribute to eutrophication, a process leading to high
algae, especially blue‐green algae populations and the death of aquatic life due to excessive
demand for oxygen. Also, elevated nitrate in groundwater is a concern for drinking water use.

14
Both humans and livestock are sensitive to high levels of ammonia; exposure can result
in poor animal performance and negative impacts on health. The conversion of nitrogen from
the atmosphere into a form readily available to plants and hence to animals and humans is an
important step in the nitrogen cycle, that determines the supply of this essential nutrient.
Figure 4 – Nitrogen Cycle
Phosphorus
Phosphorus is excreted as phytic acid, an organic compound derived from the
undigested P in cereal grains and other complexes that result from growth and digestion
processes. Phosphorus is excreted in both the feces and urine. However, 80% of the total
phosphorus in manure is found in the solid part (Masse, L. et al., 2007).
Phosphorus is an essential nutrient for plants and animals in the form of ions PO43‐ and
HPO42‐ . It normally occurs in nature as part of a phosphate ion. Phosphates may be effective in
such ways but they also cause pollution problems in lakes and streams.
Since manure typically has a low nitrogen‐to‐phosphorus ratio, it causes a buildup in soil
phosphorus, which may lead to high phosphorus runoff. However, even when soil tests P levels
are not high, phosphorus concentrations in runoff water can be high. The majority (80‐90%) of
phosphorus in runoff from pastures fertilized with manure is in the soluble form, which is the
form most readily available for algal uptake. In fact, research has shown that the dominant

15
variable affecting P runoff is the soluble phosphorus concentration in the manure
(Loeffer et al., 2003).
Figure 5 – Phosphorous cycle
Potassium
In swine manure, potassium is only found in the liquid part. While manure handling and
storage systems may remove a significant amount of N, K is not likely to be significantly affected
by treatment. As of today, few manure treatment systems deal with excess potassium, mostly
because it is not yet legislated by environmental regulations. However, due to accumulations in
fertilized soils, potassium may become another problematic nutrient. Some studies have shown
that it can cause a decrease in the immune system of some vulnerable herbivores
(Masse, L. et al., 2007). Potassium ion is an essential component of plant nutrition and is found
in most soil types.
Applications on land
Decisions on the best ways to apply swine manure to land are complicated by
compromises between achieving best soil erosion control and best conservation of nutrients in

16
manure and use of these nutrients by growing crops. When spreading manure, the farmer has
to consider the amount of nutrients he is adding to the land.
Spreading of manure in the springtime is generally considered to improve the utilization
of ammonia‐nitrogen by 4 or 5 times compared with spreading in the autumn. Also, because the
plant uptake is better at that period of the year, it also reduces the run‐off and leaching of the
nutrients. For this reason, it is usually necessary for a farmer to be able to store the manure for
the greater part of the year (Thorneby et al., 1999). However, since most farms will have
approximately the same amount of manure the year after, they will, most of the time, try to get
rid of the excess manure and export it. Moreover, the distribution of nitrogen and phosphorus
decreases during storage (Van der Meer, H.G, 1987).
Surface water quality impact of land‐applied manure is affected primarily by factors
influencing runoff and erosion. This includes the type of soil, rainfall intensity and duration,
roughness characteristics of the surface, and topography (Zhang, R.H. et al., 2004). Loading rate
and application timing are other factors that can also have a significant impact. The negative
impacts, especially when excessive quantities of pollutants and coliforms are transported to
surface waters, include health and sanitation problem and aquatic wildlife deterioration. The
impact on groundwater will be dependent upon subsurface transport and is thus dependent on
the hydraulic characteristics of the soil as well as the amounts and forms of potential pollutants
present.
The major problem regarding to the overloading of nutrients to the soil arise because
the applications of manure to soils at rates that supply adequate N for crops almost always
result in P accumulations that exceed crop needs (Christie, 1987; Sharpley et al., 1984).
Therefore, the farmer has to reduce the amount of fertilizer to be spread on a given area. In
Quebec, the amount of manure to be spread on a certain area is legislated by Le Règlement sur
les exploitations agricoles (REA) by Le Ministère du Développement Durable, de
L’Environnement et des Parcs (MDDEP). In order to determine how much manure can be spread
on a certain agricultural area, farmers need to draw up a fertilizing plan (PAEF) which basically
consists of a plan of the farm and the characteristics of the soil. This plan is mandatory in order
to supply adequate amounts of fertilizing that will yield optimal production without overloading
the soils of nutrients.
17
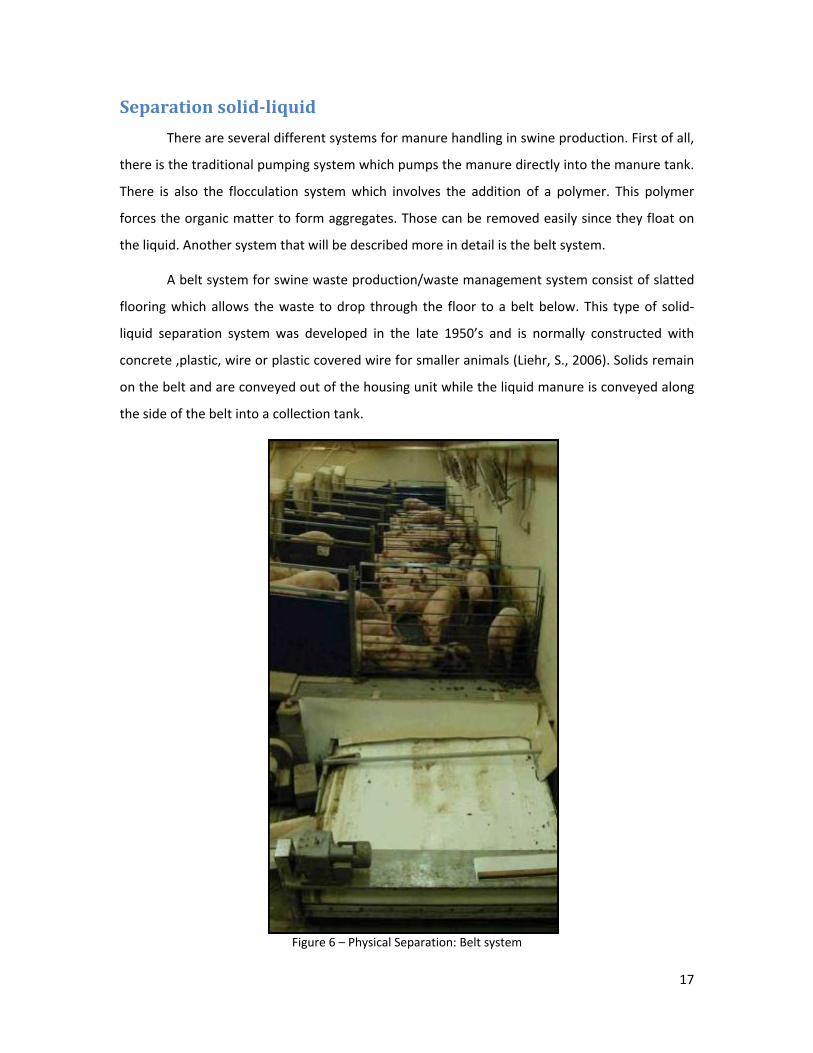
Separation solidliquid
There are several different systems for manure handling in swine production. First of all,
there is the traditional pumping system which pumps the manure directly into the manure tank.
There is also the flocculation system which involves the addition of a polymer. This polymer
forces the organic matter to form aggregates. Those can be removed easily since they float on
the liquid. Another system that will be described more in detail is the belt system.
A belt system for swine waste production/waste management system consist of slatted
flooring which allows the waste to drop through the floor to a belt below. This type of solid‐
liquid separation system was developed in the late 1950’s and is normally constructed with
concrete ,plastic, wire or plastic covered wire for smaller animals (Liehr, S., 2006). Solids remain
on the belt and are conveyed out of the housing unit while the liquid manure is conveyed along
the side of the belt into a collection tank.
Figure 6 – Physical Separation: Belt system

18
Maintaining the manure and urine separated increases the availability of the nutrients in
the manure, mostly because the microbial activity is limited. Therefore, the metabolization of
urea in urine to ammonia and carbon dioxide is decreased.
Also, the separation of solids and liquid has the potential benefits of reductions of odour
and ammonia volatilization.
Techniques of solid‐liquid separation also have the advantages to reduce the volume of
wastewater to be managed on farm since it does not require a pit flush system
(Dufour, V. et al., 2005).
Solid manure
The term “solid” manure was historically meaning that the manure was handled as a
solid deposited directly by grazing animals. However, today this term refers to the manure that
is collected in bedding placed on solid shelter floors to absorb the urine. Manure deposited on
solid floors is typically stored where it falls, with more bedding added as needed to maintain a
dry floor. Liquid drains away from the manure dropped on an outside lot and must be collected
in a storage tank, leaving the solid manure behind. The manure composts in place somewhat
and is removed every few months. Fertilizer value is recovered by spreading on cropland to
complete the nutrient cycle. Solid manure is normally surface applied, but in some cases may be
incorporated into the soil with subsurface applicator. Composting is another option for solid
manure management.
Liquid manure
In most farms, swine manure is handled as a liquid. It is stored in storage pits varying in
size and may either be constructed on the soil directly or out of steel or concrete. These tanks
are usually sized large enough to hold at least six months of manure production. This avoids the
need to apply manure during the crop growing season and when weather conditions are
unsuitable. Unsuitable conditions can be when the soil is too wet that application vehicles could
compact and damage the soil or when the soil is frozen.
Liquid manure is either applied to the soil surface or is incorporated. Incorporation is
very effective at controlling runoff of manure nutrients and reducing odour from land
application. However, it is most of the time more expensive and it requires a soil injector. This

19
immediate contact between the manure and soil is highly effective at controlling odour and
reduces runoff (Van der Meer, H.G, 1987).
Concentration of nutrient
Concentration of manure implies that the slurry is separated into a liquid and a
concentrated fraction. Several techniques of membrane filtration represent suitable
technologies for the production of high nutrient concentrated liquid manure. These include the
microfiltration, ultra‐filtration, nano‐filtration and the reverse osmosis. These techniques vary
from one another but all aim at reducing the total volume of liquid manure, concentrate a liquid
fraction so that it could be reused on the farm and produce reusable water (Masse, L., 2007).
These objectives are all positively correlated to each other: the more nutrients in the
concentrated liquid fraction, the more clear the water taken out of the manure.
Reverse Osmosis
The reverse osmosis is the membrane filtration treatment that yields the higher quality
liquid fraction (Pieters, J.G, 1999). However, it also requires extensive manure pre‐treatment
since it requires a quite great flux. Most of the time, before the manure goes into the reverse
osmosis treatment, it is micro‐filtrated through ceramic membranes in order to remove the
larger and unwanted particles such as sand or pig hair. The removal of particles larger than
10µm is sufficient to obtain a high quality liquid manure fraction (Hamel, D. et al., 2004). This
allows an increased flux of the liquid manure in the reverse osmosis system. The microfiltration
also prevents the fouling of the reverse osmosis membrane and maximises its life since the
particles that could scratch or perforate the membrane were being removed (Masse, L., 2007).
The biological principle behind this system is that pressure is used on a membrane to
force a solution, here liquid manure, to go through it. This membrane retains the liquid manure
on one side and allows the solvent, which is water in this case, to pass to the other side. More
formally, it forces the water from a region of high solute concentration through a membrane to
a region of low solute concentration by applying a pressure in excess which is what is called an
osmotic pressure. This is the reverse of the normal osmosis process, which is a natural
movement.

20
Figure 7 – Reverse Osmosis Diagram
Here the membrane is a semi‐permeable osmotic one, meaning it allows the passage of
solvent but not of solute. The solvent should be less than 1 angstrom (10‐10m).
As is known from literature, the efficiency of the reverse osmosis process is influenced
first by the quality of the liquid manure before it is processed, the temperature, pH and velocity
of the liquid along the membrane, the quality of the membrane and operating pressure during
the process (Bilstad et al., 1992). Also, the liquid manure characteristics that will undergo the
reverse osmosis process depend on livestock parameters such as environmental factors while
handling, diet composition and animal management (Hamel, D. et al., 2004).
Studies show that concentrated liquid manure can approach one tenth of the original
manure volume (Bilstad et al., 1992).
One of the major challenges of the use of the reverse osmosis is to remove the Total
Available Nitrogen (TAN) from the water part. TAN is all the nitrogen found in a substance. It
includes every single form of nitrogen. It is not an easy task to strip the ammonia from the water
because it is very soluble in water and is yield by the equilibrium of proportions of ammonium
and ammonia:
[NH3][H+] = Ka
[NH4+]
The rate of transfer of TAN is highly dependent on pH and temperature.
(Masse, L., 2007) Acidification of manure improves TAN retention by the membrane and
increased temperature improves the removal of ammonia (Liehr, S., 2006). However, the
challenge resides in the manure high buffering capacity and excessive acid requirements. NH4+

21
and NH3 try to attain equilibrium. Also, the absolute concentration of ammonia also increases as
manure is being concentrated.
Figure 8 – Influence du pH sur la dissociation de l’ammoniac en solution aqueuse (eau pure)
For stripping to be effective, the ammonia nitrogen must be in the form of NH3, which is
formed at high pH:
NH4+ +OH‐ = H2O + NH3
However, for the reverse osmosis process, the molecule NH3 passes through the
membrane and reduce the quality of the permeate. In that way, we should acidify the solution
and try to optimize the quantity of NH4+. Furthermore, nitrogen volatilization occurs with NH3. It
is another reason why should consider to acidify the manure and reduce the loss of nitrogen to
the atmosphere.
Cleaning of the membranes is usually performed with a nitric acid and an alkaline
detergent in order to prevent clogging of the membrane and eliminates formation of bacteria
(Rice, J.M et al., 2005). The membrane flux is usually fully recovered after one or more chemical
cleaning.
Treated water
Treated water, used water, grey water: there is many way to name this product but all
refer to the same thing: water that is used but partially loaded. In a domestic environment, it is
the water from bath tubs, hands, clothes and dishes washing. From a farm environment, it could
be the milk house wastewater or, as in our design, the water from the treated liquid manure by
reverse osmosis.

22
Applications
It might seem illogic or insalubrious to use water that was taken out of manure. In fact,
in some part of the world, domestic grey water is used to irrigate home garden and any
non‐edible plants (CMHC, 2003). This kind of water can be use because of its low level of
nitrogen and pathogens (Madungwe, E., 2007). Present studies on uses of farm grey
water are more difficult to find. Unless that fact, we can find publications on subsurface
irrigations of field with wastewater (Stone, K. C. et al., 2008).
Legislation and environmental requirements
In 2002, Quebec Ministry made a policy to reduce the water abuse. In this policy, they
put restrictions for many part of the economy. A main objective for the agriculture is
that, by 2010, we should achieve a state of equilibrium in term of phosphorous‐support
limit. Furthermore, this policy provides regulation on the buffer zone. This is a three‐
meter strip along the water course or a one‐metre along drainage trenches.
(Quebec Government, 2002)
Composting
Composting is a simple, economical and fast approach to the treatment of manure. It
allows recovering the organic matter of the manure without significant work needed.
Spontaneous composting occurs in nature but these processes are slow. It basically consists of
the decomposition of organic matter by aerobic organisms. Composting manure is a great way
to reduce the volume of potential pollution and therefore, the pollution potential. Composting
also produces a stable material that could be used as a soil amendment and can easily be
stored.
To make composting suitable for the industry of waste disposal and to allow the
maximum recovery of the resource values of manure, composting must be controlled and
maintained at the best process conditions (Comeau, Y., 2006). It also leads to reduction of odour
and decreases the concentration of pathogens. In order to reach maximum process efficiency,
the microbial population growth and activity of the manure has to be managed properly.
Nutrient balance is determined by the ratio of carbon to nitrogen in the compost pile.
Composting usually is successful when the pile contains 20 to 40 parts of carbon per 1 part of
nitrogen. The ideal ratio is 25:1 to 30:1. If the ratio is too low, excess nitrogen is converted to

23
ammonia and escapes into the atmosphere, causing undesirable odors. If the ratio is too high,
the rate of composting decreases (Mid‐West Plan Service, 1993).
In order to do so, many factors have to be taken into consideration and optimized.
These factors include the oxygen supply, pH, Carbon to Nitrogen ratio, moisture content and
temperature control.
In composting for waste management purposes, odour control and cost‐effective design
and operation are both served by maximizing the rate of decomposition. This is obviously
accomplished through heat removal, most of the time by ventilation.
Usually, a bulking agent is added to the manure to reduce the moisture content or to
increase the carbon to nitrogen ratio. As it is mentioned, the ideal ratio should be between 25:1
and 30:1 otherwise problem can occur in the compost pile. Also, the ideal moisture content
should be between 40% and 60%. If the moisture content is too high, the oxygen has difficulty to
move inside the compost pile. On the other hand, if it is too low, the decomposition rate
decreases.
A practical means of removing heat from the composting mass is through ventilation.
Two main ventilation‐associated mechanisms can be taken to ventilate a composting mass. The
material can either be forced to pass through air which can be done by agitation of the mass, or
the air can be forced to pass through the waste with the use of a blower
(Finstein & Miller, 1984). However, the type of ventilation system influences the cost of the
exercise. Obviously, the larger the amount of mechanical energy involved, the more expensive
the operation of the composting facility will be.
Also, the capital and operating costs is strongly influenced by the decomposition rate of
the waste. Composting time depends on the biological cycles of the microorganisms involved
(Somani, L.L., 1990). In part, this is because the need for facility space and volume is inversely
related to rate, as is the weight and volume of process residue that must be handled. Moreover,
for any given processing duration, the higher the rate, the more stable and easily handled the
residual waste will be. Increasing the height of the composting mass seems to also offer a means
of decreasing the processing area required. However, this approach quickly encounters physical
and biological constraints.

24
In addition, composting is also greatly influenced by the availability of oxygen present in
the composting mass. With respect to the different design available for providing aeration, the
cost of the composting facility will vary. Open composting systems such as windrow or piles
represent the cheapest designs.
They can either be aerated by agitation of by forced aeration (Bertoldi, et al. 1984). If no
significant improvement of the process and its product over that accompanies the use of a
mechanized system, then an open, naturally aerated system should be adopted because it is the
best economical approach.
Figure 9 – Composting Facility
For the purpose of our design project, we will use the covered aerated static pile
composting method. This method does not include mechanical agitation. The pile is loaded on a
perforated concrete slab to avoid leaching of the compost load in the soil. Also, the slab is
perforated and constructed below a perforated dome to allow warm air from the material to
vent outside. Aeration is will be accomplished either by forcing or drawing air through the holes
of the concrete slab.
The monitoring equipment will determine the timing, duration and direction of air flow.
The optimum size of pile will be calculated in function of to the manure’s characteristics.
Aerated static piles require additional equipment and infrastructure investment.
However, the dome prevents the composted manure from being contaminated by water from
precipitations.

25
5‐ Methodology 5.1 The design approach
Throughout the entire engineering design process, environmental and economic
requirements and implications associated with all possible design will be addressed to
conceptualize and develop the best possible design. Ultimately, tradeoffs among alternatives
will be examined and decisions made.
When livestock production enterprises are being separated from crop production
enterprises, retention of nutrient in the manure is often not an important goal for large swine
production units. Also, the amount of land available for manure application is often limited.
Consequently, loss of nutrients to the environment may be encouraged to reduce the quantity
of manure that must be handled. With a holistic approach to the manure management practice,
the production system would take into consideration each of these parameters and therefore
enhance the fertilizing value of the manure.
In general, it requires fewer acres to balance the available manure nutrients for the
farm’s nitrogen needs. However, applying manure nutrients at the nitrogen needs rate generally
over applies P2O5 by two to four times the crop needs. This poses an environmental risk due to
the high application of P2O5 at one time and the buildup of phosphorus in the soil. Also, applying
manure nutrients at their optimal nitrogen needs level can very rapidly increase potassium
levels in soil, which can contribute to animal‐health problems (Masse, L. et al., 2007).
A farm can sustain itself for a short time by balancing for nitrogen. However, this will
significantly increase phosphorus and potassium levels in the soil. The goal of our integrated
manure management system is to operate a livestock enterprise in a manner that can sustain
the cycling of manure nutrients indefinitely while minimizing the risk of nitrogen and
phosphorus leaching and runoff.
Farm sizing
The context of this project will be defined by a medium‐size growing‐finishing swine
farm located in Saint‐Etienne de Beauharnois, Quebec.

26
Figure 10 –Location of St‐Étienne de Beauharnois
We chose this area because the type of soil and fertilizing requirements of land are
known and also that there is little opportunity for manure gathering from other producers in
that region. The cultivated lands of our design system will be based on the case study of the
Jacques Leduc et fils inc. Farm. It is a cash crop farm with a size of approximately 535 hectares
(1322 acres). The type of soil is mainly Ste‐Rosalie clay, which is rich in potassium. After talking
with Patrick Leduc, head‐agronomist in Quebec for Pioneer, the fertilization requirements for
inorganic chemical fertilizers were determined to be 190kg of nitrogen (N) per hectare, 85 kg of
phosphorus (P2O5) per hectare and no input of potassium (K2O) required.
For the purpose of the design project, we will focus only on the production of corn.
However, the cultivated lands work under crop rotation of corn and soybean based on a three
years period. This mean that on a same field, during two consecutive years, they cultivate corn
and the third year, this field is under soybean.
We will suppose that in the swine facility unit, there is no bedding involved and that pigs
rest on slatted floor. Also, we will presume that the swine farm manure management system
consists of a solid‐liquid belt separation system with an efficiency to separate the manure in
approximately 60% solid, 40% liquid.

27
Estimating Quantity of manure produced and its nutrient content
The first step of the design of the integrated manure management system is to
determine the quantity of manure produced on the farm and the manure nutrient content. In
order to do so, a manure analysis will be conducted to calculate information on the amount of
nitrogen, phosphorus, and potassium available in the manure.
The manure analysis of the farm system will be conducted using the American Society of
Agricultural Engineers standard tables included in annexes. In order to have a good estimate of
the manure nutrients available on the farming operation, we will:
‐ Estimate manure and nutrient production for each animal type
‐ Add the nutrient amounts for each animal type
‐ Add the nutrient amounts for each animal
Also, knowing the manure load of the farm, we will calculate the size and specifications
of the manure storage pit. We will try to follow the nutrients content throughout the design to
minimize the losses to the environment.
Estimating Crop Nutrient Needs
The next step is to determine the farm’s crop nutrient needs. This highly depends on the
type of soil and type of crop grown on the farm. However, some theoretical values of the
recommended amount of nutrients per crop are available in literature. When consulting these,
we can calculate the nutrient required by the crops to be grown on our case study farm and
compare it to the nutrient content of the manure.
Evaluation of the farm system Nutrient Balance
The third step is to estimate the farm nutrient balance. It involves measuring or
estimating total manure nutrient production compared to whole farm crop nutrient utilization.
It can easily be done using this equation:
Manure Nutrient Inputs – Crop Nutrient Needs = Losses to Environment

28
The loss to environment is the difference between the inputs and the managed outputs.
This imbalance accounts for both the direct environmental loss and the accumulation of
nutrients in the soil. In our design system, manure nutrients are recycled for crop production.
The goal of the design is to achieve a balance of inputs with managed nutrient outputs a on the
farm itself.
Airablo
Airablo is a family enterprise working at manufacturing and designing equipment in the
maple syrup production industry. It is one of the main leaders in the maple syrup business by
selling an average of 50% of all the farming equipment of the industry in Canada and United‐
States. Among its several equipments, Airablo has developed several reverse osmosis system
aimed a treating maple sap. The machine concentrates the sugar of maple sap by removing
excess water. This practice is done before the boiling step of the maple syrup process to reduce
the energy requirement. Since maple syrup is a seasonal business, the enterprise is willing to
enlarge its domain of activity and considers research as an important field for the
implementation of their systems. As of today, this orientation is highly promising for the future
because the company has already obtained several patent certificates for different reverse
osmosis design system.
Figure 11 – Whole‐mount reverse osmosis system of Airablo

29
Reverse Osmosis system
Since the reverse osmosis stage is made in partnership with AAFC, we will focus on that
part of our design to gather and analyse the data. The system used to create the samples on
which the different tests will be made, is one of semi‐commercial scale. The machine itself looks
very complicated, but is in fact quite simple. It is made of three pumps, two filters, many valves
and some sensors to records different pressures and temperature. First, the liquid manure is put
in a refrigerated bulk tank which helps to keep the temperature constant. Then, the manure is
pumped from that tank to the system by the first pump, the priming pump. This pump builds‐up
the pressure for the second pump, the pressure pump. Between these two pumps there is a
filter that removes particles bigger than ten micrometres to avoid, as we said earlier, damage to
the osmotic membrane. On each side of this filter, there are pressure sensors that are used to
determine the degree of fouling of the filter and to stop the system if the pressure does not
build‐up. The pressure pump pushes the liquid into the third pump, the turbo pump, which
creates turbulence into the osmotic membrane container where the reverse osmosis occurs. At
the exit of this container, there are two pipes: one leads into a barrel on a balance and the other
return to the bulk tank. The first pipe contains the permeate which consists of grey water, which
is used to measure the flow of the membrane at different time. The second pipe carries the
concentrated part of the manure, the concentrate, and has a pressure sensor and a valve
connected to it. These two parts are used to control the pressure inside the system because all
the liquid that does not pass through the membrane has to go through that pipe. On both of
these pipes, after the pressure valve for the concentrate, there are valves. They are used to take
samples of the concentrate and permeate.
Figure 12 – Diagram of two scale of the reverse osmosis system used for the experimentation

30
To keep an experimental strictness, we have to follow a certain procedure. Before
starting the experimentation, we have to circulate the manure for at least five minutes to make
it homogeneous. Then we take a sample which will represent the reference sample for the
experiment. After the sample is taken, we can put pressure on the system and start measuring
time. During the experiment, we take samples, of both the concentrate and permeate, at
regular time and we evaluate the flow of the osmotic membrane with the weight of water into
the barrel. When the desire time or concentration is reached, we take a last sample of each part
and we stop the machine. We can then proceed to the washing steps if necessary.
For washing purposes there is a 25‐L container connected to the priming pump. Before
washing, we have to do an experiment with water for 15 to 20 minutes, to compare the flow of
the membrane before and after the manure experimentation. After that, we can proceed to the
washing. We achieve that by filling the container with water and adding a quantity of acid or
alkaline product to attain a pH. We start the system in simple circulation for about an hour.
During that process, we record pH quantity of product added and time. After the washing,
recirculation of an experiment with water is required and depending on the results we either
can wash the membrane again or start a new experiment.
The reverse osmosis pilot used in our design project is manufactured by the company
Airablo. According to the amount of liquid to be treated, we will determine the size of the
machine required with the tables provided by the company Airablo. The tables containing the
specifications of the various apparatus available are included in annexes.
Quality evaluation of the samples
To determine the quality of the permeate and the concentrate, we will conduct different
tests on the samples collected. We will measure the alkalinity of the samples to determine the
buffer capacity of both end products. This is done with an alkalimeter which injects and
measures the quantity required to reduce the pH of a substance at value of 4.2. We will also test
for pH and conductivity. The pH is to determine where we are on the equilibrium graph of
ammonium and ammonia. However, the conductivity is a good test to determine approximately
the degree of concentration. The real quality of the products of the reverse osmosis will be
based on three tests: total available nitrogen (TAN), phosphorus and potassium. The last two
tests are quite complex. They involve acid digestion before the test. For the TAN test, we need
samples that have been acidified at the sampling time to avoid any loss from volatilisation. The

31
machine doing the test inject alkaline product to transform all the nitrogen present in the
sample into ammonia and measure the quantity present in the gas form.
Objective of the experimentation
The research goal is to determine if the reverse osmosis system is efficient for the
concentration of manure and the separation of grey water from the liquid part of the manure
and if it can be applied in an integrated manure management system at the farm level. The
efficiency is determined by the quality of the permeate. To achieve that goal, we will test at
different combinations of pressure and percentage of concentration. We will look at three
different pressures, 700psi, 800psi and 900psi, and also at three different concentrations, 20%,
30% and 40% of the initial volume.
Composting of solid part
The goal of the part of this project is to compost only the solid fraction of swine manure
and to determine whether or not it is feasible to process to this type of composting in farm
where bulking agents may not be available. Since the pig slurry to be used in the composting
unit is already solid, we might add a dewatering section prior to the composting stage itself or
not. This will depend on the economic feasibility of the total system. However, since we assume
the manure to be at least 30% moisture content dry basis and to reduce the costs of the
process, we will not add any bulking agent. Mixing the solid fraction of the manure with bulking
agents would for sure improve the characteristics of the process. However, the economic
advantages and the simplicity of the process is a significant benefit to farmers.
Effective composting is affected by four major factors:
• Aeration
• Nutrient balance
• Moisture content
• Temperature
If these four factors are properly controlled, composting will take place at a very rapid pace.
Also because of cost limitation, aeration will most probably be done by agitation of the
solid waste. Turning is important for good aeration of wind rows that don’t have forced air
running through them. It restores pore space so that air can move through the pile more easily.

32
It also mixes in the sections of the pile that have not reached the desired temperature. Compost
will be produced by natural aeration, over long periods of time.
Passive composting piles are a very low‐cost approach: the material to be composted is
collected, piled and remains untouched.
The moisture content of the compost pile will be assumed to be around 60 percent after
the original mixing. When the moisture content exceeds 60 percent, oxygen movement is
inhibited and the process becomes more anaerobic. Below 40 percent moisture, the rate of
decomposition decreases rapidly. The general recommendation is to keep moisture content
between 40 and 65 percent. It may be necessary to add water if the compost becomes too dry
or to cover it in the winter if it is too wet. As a general rule, a mixture with 50 percent moisture
will feel damp to the touch but not soggy.
5.2 Expected results
The expected result of this project is to enhance the manure value of swine farm by
mean of an integrated system of manure treatment. This is done in the goal of reducing the
environmental impact of the nutrients.
Since the government has imposed to the agricultural industry to balance its
phosphorous import with the plant nutrients demand by 2010, new ways to treat manure
should be developed. It is another goal that this project is trying to achieve with its physical
separation section.
Another important part of this design is to determine if the grey water created by the
reverse osmosis element could be used on the farm. This could reduce a lot the use of
freshwater and increase the sustainability of the farm.
Every farm has already a big mortgage and this design incur other investments. To
minimize these investments, the economic perspective as well as the advantages and
disadvantages of each part will be evaluated to determine the best combination. By testing and
comparing different options with the model, those offering the greatest economic benefit with
acceptable environmental impact will be found.

33
6‐ Evaluation of reverse osmosis technique
The integrated swine manure system proposed in the scope of this project has the
particularity that it integrates the technology of reverse osmosis to concentrate the nutrient of
the liquid fraction of the manure produced on the farm. Since this technology is still at the
experiment level and under several researches conducted at Agriculture and Agri‐food Canada,
further evaluations on the reverse osmosis pilot to be used in the proposed farm system design
had to be done. The outcome of seven different settings of the reverse osmosis pilot have been
analyzed in order to assess which one was the most efficient, that is to say, which setting
yielded the best concentrate in terms of nutrient concentration.
The different settings varied in their pressure applied on the membrane and the concentration
of the initial manure to be treated. Pressure settings were evaluated at 700, 800 and 900 psi
while concentration of the initial manure was monitored for 60%, 70% and 80% of final
concentration of treated manure.
Also, the energy requirement in terms of electricity consumption of each setting was also
recorded to compare and evaluate the different settings. Analyzing both results of the quality of
the concentrate and its associated permeate and the energy requirement of the pilot, the best
reverse osmosis setting revealed will be the one used in the integrated farm system design.
6.1 Parameters for best nutrient concentrations The pressure applied on the membrane has an influence on the amount of water that is
going to be taken out of the reverse osmosis membrane. Reasonably, the more pressure applied
on the membrane, the easier it will be to take the water out of the manure. However, this could
be true only to a certain extent: if a threshold pressure is achieved, an increase in the pressure
applied on the membrane could not significantly alter the quality of the permeate.
Trials were run at different pressures until the wanted final concentration of treated
manure was achieved. The final concentration of the concentrate was obtained using a volume
ratio.
34
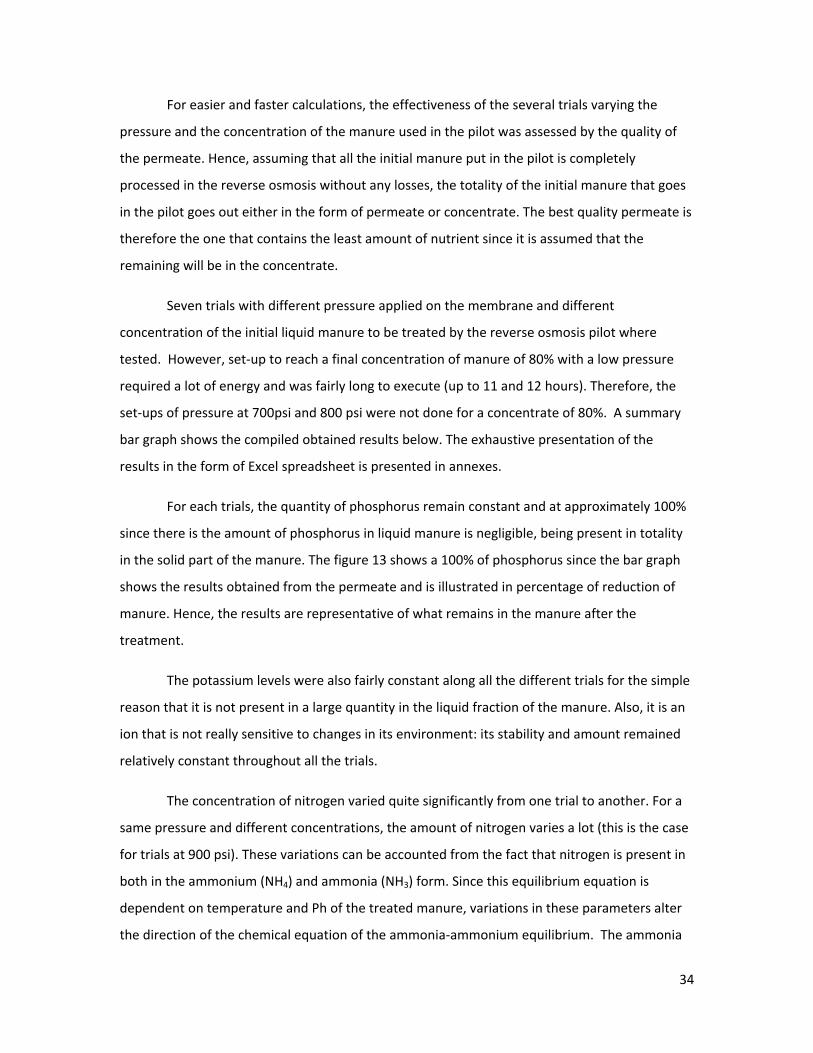
For easier and faster calculations, the effectiveness of the several trials varying the
pressure and the concentration of the manure used in the pilot was assessed by the quality of
the permeate. Hence, assuming that all the initial manure put in the pilot is completely
processed in the reverse osmosis without any losses, the totality of the initial manure that goes
in the pilot goes out either in the form of permeate or concentrate. The best quality permeate is
therefore the one that contains the least amount of nutrient since it is assumed that the
remaining will be in the concentrate.
Seven trials with different pressure applied on the membrane and different
concentration of the initial liquid manure to be treated by the reverse osmosis pilot where
tested. However, set‐up to reach a final concentration of manure of 80% with a low pressure
required a lot of energy and was fairly long to execute (up to 11 and 12 hours). Therefore, the
set‐ups of pressure at 700psi and 800 psi were not done for a concentrate of 80%. A summary
bar graph shows the compiled obtained results below. The exhaustive presentation of the
results in the form of Excel spreadsheet is presented in annexes.
For each trials, the quantity of phosphorus remain constant and at approximately 100%
since there is the amount of phosphorus in liquid manure is negligible, being present in totality
in the solid part of the manure. The figure 13 shows a 100% of phosphorus since the bar graph
shows the results obtained from the permeate and is illustrated in percentage of reduction of
manure. Hence, the results are representative of what remains in the manure after the
treatment.
The potassium levels were also fairly constant along all the different trials for the simple
reason that it is not present in a large quantity in the liquid fraction of the manure. Also, it is an
ion that is not really sensitive to changes in its environment: its stability and amount remained
relatively constant throughout all the trials.
The concentration of nitrogen varied quite significantly from one trial to another. For a
same pressure and different concentrations, the amount of nitrogen varies a lot (this is the case
for trials at 900 psi). These variations can be accounted from the fact that nitrogen is present in
both in the ammonium (NH4) and ammonia (NH3) form. Since this equilibrium equation is
dependent on temperature and Ph of the treated manure, variations in these parameters alter
the direction of the chemical equation of the ammonia‐ammonium equilibrium. The ammonia

35
ion is more volatile and also more soluble. Consequently, when the direction of the equation
favors the formation of ammonia, more nitrogen passes through the membrane into the
permeate and more nitrogen is volatized. Hence, nutrient concentration in the concentrate is
higher when the chemical reaction favors the synthesis of ammonium.
Also, it is important to keep in mind that manure composition and nutrient concentration
changes from time to time and is never completely uniform since it is dependent on many
factors (environment, animal health, feed, etc…).
Figure 13 – Bar graph nutrients concentration in concentrate
6.2 Energy consumption For each trial, the energy required and associated costs were evaluated in order to find
the best setting combination of the reverse osmosis pilot in terms of the cost and energy related
to its functioning. The results are shown in the bar graph of figure 14. Reasonably, at high
pressures, the pilot energy requirements are higher but the desired concentrations are also
achieved faster. However, this is true only to a certain extent. When the final wanted

36
concentration is highly concentrated (70% and 80%), it takes up more time to take out the last
liters of water. We can then assume that the pressure and time to reach a certain concentration
of nutrients in the treated manure is not proportionally dependent since it somehow reaches a
plateau which varies according to the pressure applied on the pilot, the concentration of final
manure to achieve and the time required.
Hence, in terms of costs, even though the higher concentrations of nutrients might seem
favorable in terms of the quality of the concentrate, the time needed to achieve these high
concentrations and the energy required to maintain the high pressure on the membrane
increase the cost and overall, these high costs encompasses the benefits of the high nutrients.
Figure 14 – Energy cost of different trials
Table 2 – Parameter of energy consumption during trials
Pressure Concent. Average consumption
Time elapsed
Total consumption (2 m3) Cost ($/r 2 m3)
Cost for concentration ($/m3) kWh/m3
% kWh/h hour kWh 0.07 2900 psi 60 4.77 5.50 26.22 1.84 0.92 13.11900 psi 70 4.77 8.33 39.72 2.78 1.39 19.86900 psi 80 4.77 10.00 47.67 3.34 1.67 23.83800psi 60 4.38 6.27 27.42 1.92 0.96 800psi 70 4.38 8.43 36.90 2.58 1.29 18.45700psi 60 4.00 7.68 30.73 2.15 1.08 700psi 70 4.00 9.52 38.07 2.66 1.33 19.03
$0.00$0.25$0.50$0.75$1.00$1.25$1.50$1.75
60% 70% 80%Concentration (%)
700 psi 800 psi 900 psi
Cos
t ($/
m 3 )
Energy cost

37
6.3 Best pilot parameter setup According to the results obtained from the experiment, the best scenario both in terms
of nutrient retention and energy consumption appears to be the setting of the reverse osmosis
pilot at 60% concentration of the initial manure with a pressure of 900 psi applied on the
membrane. At this set‐up, the permeate reaches its lowest concentration of nutrients: 128 mg/l
of NH3 and 9mg/l of potassium, meaning that at this set‐up, the concentrate has the highest
nutrient concentration.
In terms of energy requirement, this trial is also the one that consumes the least amount of
electricity. When calculated, the cost of the trial at this optimal set‐up is of $0.92 /m³. This low
cost is achieved because this set‐up is the one that takes up the least amount of time. Hence,
even though the pressure applied on the pilot is higher (implying a higher amount of energy) the
required concentration is obtained faster, therefore reducing the electricity costs.
7‐ Design details
7.1 Farm system
As determined earlier, our system is considered as a medium one. In Quebec, a medium
growing‐finishing hog farm produces around 1800 hog per year. During its growth, an animal
can produce 560 kg of manure, excluding dilution. We have to manage 1008 m³ of manure on
our farm. The dilution comes from the washing of the building which uses, in our design,
approximately 88 m³ of water. The total volume of manure can then be round up to 1100 m³ per
year.
Each animal reject 4.7 kg of nitrogen, 0.76 kg of phosphorous and 2.0 kg of potassium.
Over the year, we will have, from the animals, 8460 kg of nitrogen, 1368 kg of phosphorous and
3600 kg of potassium.
On the 535 hectares of the farm, 327 ha are in corn and the remaining is in soybean. The
nutrient requirements of the corn for this field are 190 kg of nitrogen per hectare, 85 kg of

38
phosphorous per hectare and no potassium required. Overall, 67 830 kg of nitrogen and
30 345 kg of phosphorous are required.
A net nutrient requirement of 59 370 kg of nitrogen, 28 977 kg of phosphorous and a
surplus of 3600 kg of potassium is obtain in our system.
7.2 Implementation of the reverse osmosis
Separation solidliquid
Our design uses the reverse osmosis as treatment for the manure. To achieve this, we
need a physical separation prior to the reverse osmosis. This separation is assumed to be 60%
liquid and 40% solid. With these proportions, we can determine that 660 m³ of liquid as to be
treated and 440 m³ of solid as to be stored.
Treatment of manure
With the evaluation of the reverse osmosis we determined that it was more efficient to
do it at 900 psi and 60% concentration. The volume of grey water collected from the treatment
is 396 m³ and the remaining of the 660 m³, 264 m³, is the treated manure.
Storage of liquid parts
The grey water and the treated manure have to be stored into circular tank. To
determine the size of the tanks, we first increased the volume to store by 1.5 and set a wall
height of 12 feet (3.6576m). Then we solve for the diameter in the equation of the volume of a
cylinder. We then round the answer to the next even number in foot. This gave us 48 ft
(14.63 m) for the grey water and 39 ft (11.89 m) for the treated manure.
Storage of solid part
For the solid part of the manure, we decide to compost it. We considered two different
possibilities: passive windrows or pilling. For the passive windrows we considered an active
period of six months after the four months of accumulation and two months of curing. We set a
wall height of 1.2m with a useful height of 0.9m, a width of 3.6m and a height of manure in the
middle of the width of 2m. With all those parameters we can find the cross‐sectional area by
doing the integral of the parabola that can be between those points (0,0.9 ; 1.8,2 ; 3.6,0.9). The
area from this is 5.88 m². Dividing the volume of manure produced over the four months by the
area we can find the length of windrow required which is 25m (83ft). To find the width of the

39
building we have to add the four windrow required (3.6m), the concrete walls (0.2m) and the
spacing between the rows (1.2m) for a total of 21.4m (71ft). As well the length of the building is
not exactly the length of the windrow to protect the compost. To it we add twelve feet to be
able to pass with tractor or machineries at both ends for a total of 32.3m (106ft).
The second type of storage is pilling assuming ten months of active period and two
months of curing also with a four months of accumulation. To design it, we assumed that it was
a cone over a square. We set the same wall height with the same useful height as the windrow
(0.9m), and a peak height of 7.6m (25ft). Based on these numbers we can determine the width
of the square by solving the equation:
V = d²h1 + d²h2 / 12
h1 : useful height
h2 : peak height minus the useful height
d : bottom width
The solution gives us a width of 7.43m (25ft). As for the windrow building we have to consider
spacing to protect the compost and to allow passage of machinery in the center of the building.
We set a central alley of 3.7m (13ft), concrete wall of 0.2m (8 inches), ends spacing and spacing
between squares of 1.2m (4ft) for building dimensions of 19.3m by 21.8m (64x72 ft).
Figure 15 – Plan view of pilling building

40
Nutrient loads
When using the reverse osmosis, the nutrients present in the liquid are concentrated.
Assuming that the nitrogen and the potassium are in totality in the liquid part and using the
reduction percentage due to the reverse osmosis, we can compute the concentration of these
nutrients and the quantity required for spreading. We know that we have 8460 kg of N in
241.92m³ of treated manure and a reduction of 93.5%. Doing the calculations we end up with a
concentration of 29.96 kg/m³ and require 6.34 m³/ha to meet the nitrogen requirements. Doing
the same calculations with the potassium we get a concentration of 13.57 kg/m³ and a surplus
of 86.04 kg/ha at the application rate of the nitrogen.
We saw that the phosphorous from the manure is required in totality so we have to
spread it all on the corn fields. So for our design we do not have to compost but we still need a
storage area which can be one or the other system describe earlier.
Energy requirements
From the evaluation of the reverse osmosis, we found that it requires 13.11 kWh/m³
and 2.75 h/m³ to obtain a concentration of 60%. So to treat 660 m³ of manure it will require
8652.6 kWh and 1815 hours per year to treat it. Since the electricity bills are on a monthly basis,
the energy required is 721.05 kWh per month. Also, we cannot treat manure that is not already
produced so we need about 5 hours per day to treat the manure produced.
Grey water uses
Grey water produced on the farm can be reused to reduce the use of clean water. The
two main on farm use are the building washing and the pesticides application. The washing of
the pens uses 88.38 m³ of water. It comes from an average of 6 hr/room for 3 rooms with an
average water flow of 6 gallons/min.
In average, pesticides require an application rate of 12 gal US/acre of mix. An average
mix is one liter of pesticide for three liters of water. The water represents then three quarter of
the mix and knowing the area cultivated, we can compute the volume of water required which is
45.05 m³/yr of water.
These two give us a total of 133.43 m³ and a surplus of 262.58 m³ which can be use for
irrigation during hot periods or treated through filter beds. Unless already installed for
irrigation, these two methods will incur new investments.

41
Crops yield
As determine earlier in our Farm sizing, the farm is situated in Montérégie and as a
cultivated area of 535 ha on a basis of one third in soybean and two third in corn. On those
fields, the average yield of corn is around 9 tons/ha and for soybean it is 2.8 tons/ha. Based on
these average yields we can calculate a corn yield of 3213 tons and 498.4 tons for soybean.
Feed requirements
We determined with a hog farmer the diet requirements. This farmer uses a diet of fifty
percent corn and fifty percent nutrient and gives 75 kg of feed per hog through its growth. Our
design requires 67.5 tons of corn.
8‐ Economic analysis
8.1 Farm with reverse osmosis system
To achieve the implementation of the reverse osmosis system we need to buy different
things. First of all is the system itself, which cost $6300 and can treat as much as 80 gph (7.268
m³/day). It is the smallest system that the company produces. We choose this one even if our
design requires only 20.14 gph (1.83m³/day) because it will allow future expansion of the farm.
To run the system we need osmotic membrane which cost $1000 per membrane and we
estimate that the farm will need six of them to go through the year. Also, we need filters before
the membrane to remove particles before the membrane to avoid damage. Each filters cost
$5.95 and it will require one or two filters per month depending on the quantity of particles in
the manure. The cost for filters is $142.80 per year. The membrane has to be washed at the end
of every one or two days to avoid sealing of the membrane. The soaps needed are one acidic
and one basic at approximately $75 for one 5‐gallon. We assume that we will use only one of
each per year for a cost of $150.
Also, the structure for the storage of manure, both solid and liquid, has to be taken into
account. Even if a farm change from conventional to this system and already has a circular tank,
it will need a second one to separate the grey water from the treated manure. The main
structure that could incur a cost is the one for the storage of the solid manure. MegaDome®

42
structures are made of pre‐galvanized steel or hot galvanized steel covered by a membrane. The
second type of steel is stronger but more expensive. The structure for the windrows costs
$42587.82 for pre‐galvanized and $45552.47 for the hot galvanized. The structure for pilling
costs $30786.38 and 35210.37$ for pre‐galvanized and hot galvanized respectively. The
company will choose the type of structure based on its capacity to pay, but it will be preferable
to choose the structure to do windrow since it makes compost faster and better. Since our
design needs only storage we considered the pre‐galvanized structure for pilling; it is the
cheapest of the four choices.
All those costs are taken into account in the first year, since we need to install the
system, for a total of $41379.18. The reverse osmosis system costs $4292.80 to run every year.
There is no revenue linked to this system and is not viable except if the farm had to pay to
export its surplus of manure, it could save on the cost of transportation.
8.2 Comparison with conventional farming
The main difference between a conventional and an implemented farm is the volume of
manure that they have to spread or export. If we suppose that both farms export all of their
manure because they are in an area in surplus, we can determine the cost of transport that they
have to pay on a nutrient basis. The cost for transportation of liquid manure is $75 per hour
including a tanker truck and the driver. If we assume that we export liquid manure from St‐
George de Beauce to the region of Montreal, we could do two truckloads (54.4m³) per
day (8 hours). This transport costs $600 or $11.03/m³. The cost of transport drops between the
conventional and the implemented farm since the nutrients are more concentrated except for
the phosphorous because the solid manure is more expensive to transport.
Table 3 – System comparison of nutrients

43
9‐ Conclusion In respect to this project proposal, there has been enlightenment on the situation of
manure management practices in Quebec and the impact that it has on the environment.
The objective of this design project was to come up with an integrated swine manure
system that incorporates the experimental technology of reverse osmosis to concentrate the
nutrients present in the manure. One of the associated goals of the manure valorization on farm
was to create a semi‐close system that minimizes the input and output coming in and out of the
farm. Also, this integrated system was designed to minimize its short and long‐term negative
impacts on the environment.
Quantifying and comparing the benefits and costs of alternative technologies and management
strategies in farming is not easy. A production system that performs well under one set of crop
and weather conditions may not perform well under other conditions. Several components of
the farm system were analyzed. These include choices in the number and type of animals, land
area, crop mix, animal facilities, manure‐handling options, and much more.
Although our results showed that our farm design was not economically profitable since it was
not making any profit, interesting results in term of cost saving for manure exports, water
recycling and other environmentally friendly practices were revealed in the analysis. Also, it is
notable to say that our farm sizing scenario was based on a large area of cultivated crops with
no significant limitation of phosphorus or nitrogen applications.
Long‐term studies would be needed to quantify the benefits and costs over a wide range of
conditions. Changes in one component of the farm often affect other components, and this
interaction can cause changes in the performance, environmental impact, and profitability of
the farm that are not obvious or easily understood.

44
Acknowledgements We would like to express our gratitude towards the following people:
PhD Lucie Masse, Agriculture and Agri‐food Canada
Dr. G.S.V. Raghavan, Department of Bioresource Engineering
Dr. S. Barrington, Department of Bioresource Engineering
Mr. Patrick Leduc, agronomist, Pioneer
Airablo‐Dominion & Grimm inc.
Valérie Bisson, Hog Farmer
Marc‐André Isabel, Hog Farmer
45
References Airablo web site, visited on November 20th, 2008, http://www.airablo.com/filtramemb.php
Bertoldi, M, G. Vallini & A. Pera (1984). Technological Aspects of Composting including Modelling and Microbiology. In Composting of Agricultural and and other wastes. J.K.R. Gasser. Elsevier Applied Science Publishers. London. 27‐41
Bilstad, T., M. Madland, E. Espedal & P.H. Hanssen (1992) Membrane separation of raw and anaerobically digested pig manure. Water Science Technology 25(10), 19‐26
Canada Mortgage and Housing Corporation (CMHC) (2003) Rainwater Harvesting and Grey Water Reuse
Comeau, Y. (2006). Programme de Recherche et d’adaptation technologiques sur le traitement des fumiers. Rapport final. Ecole polytechnique de Montreal. 126 p.
De Lange, C.F.M (1997) Manipulation of Diest to Minimize the Contribution of Private Pigs to Environmental Pollution. 1997 Canadian BASF Tour. La nutrition porcine, Seminaire Technique BASF. St‐Hyacinthe Quebec, 15 p.
Dufour, V., F. Pouliot, B. Leclerc, S. Godbout, L.A Larose & M. Trahan (2005) Evaluation technique et economique d’un système d’isolement des feces avec courroie sous les lattes dans un batiment porcin commercial quebecois. Centre de developpement du porc du Quebec inc. 68 pages.
Fédération des producteurs de porcs du Québec web site, visited on November 28th, 2008, http://www.leporcduquebec.qc.ca/index.php
Finstein, M.S & F.C. Miller (1984). Principles of composting leading to maximization of decomposition rate, odor control, and cost effectiveness. In Composting of Agricultural and other wastes. J.K.R. Gasser. Elsevier Applied Science Publishers. London. 13‐26
Hamel, D., F. Pouliot, A. Leblanc, S. Godbout & J. Hill (2004) Evaluation technico‐economique d’un systeme de separation liquide‐solide des dejections a la source dans un batiment porcin et les impacts sur l’environnement. Centre du developpement du porc du Quebec inc. 59 p.
Hatfield, J.L. & B.A Stewart (1998) Animal waste utilization: Effective use of manure as a soil resource. Ann Arbor Press. Michigan. 320 pages.
Hensler, R.F., R.J. Olsen, S.A. Wiltzel, et al. (1970) Effect of methods of manure handling on crop yields, nutrient recovery and runoff losses. ASABE Transaction 13, 726‐731
Klausner, S. (1995). Nutrient Management Planning: Animal Waste and the Land‐Water Interface. K. Steele (Editor). Lewis Publishers: New York, 383‐392

46
Kofoed, A.D., J.H. Williams & P. L’Hermite (1986) Efficient land use of sludge and manure. Elsevier Applied Science Publishers: New York, 24‐37
Lanyon, L. E.& D. B. Beegle. (1993). A Nutrient Management Approach for Pennsylvania: Plant Nutrient Stocks and Flows. Agronomy Facts 38‐B. The Pennsylvania State University.
Leduc, Patrick, Pioneer Quebec head agronomist, consulted on November 17th, 2008
Liehr, S, J.J. Classen, F.J Humenik, C. Baird & M. Rice (2006) Ammonia Recovery from Swine Belt Separated Liquid. 2006 ASABE Annual International Meeting, Portland, Oregon, 10 p.
Livestock Waste Facilities Handbook. (1993) Mid‐West Plan Service. MWPS‐18, third edition. Northeast Regional Agricultural Engineering Service.
Loeffler, P.A & T.A van Kempen. (2003) Evaluation of Ammonia Recovery Waste Treatment for Swine urine. The Ninth International Animal, Agricultural and Food Processing Wastes Proceedings Symposium, 568‐575
Madungwe, E. & Sakuringwa, S. (2007) Greywater reuse: A strategy for water demand management in Harare?, Elsevier ScienceDirect.com
Manure Management Handbook (1982) Ontario Soil & Crop Improvement Association, Ontario Ministry of Agriculture & Food.
Masse, L., D.I Masse, V. Beaudette & M. Muir (2005) Size Distribution and Composition of Particles in Raw and Anaerobically Digested Swine Manure. ASABE Transaction 48(5), 1943‐1949
Masse, L., D.I. Massé & Y. Pellerin. (2007) The use of membranes for the treatment of manure: a critical literature review. Biosystems Engineering 98,371‐380
McLaughlin, N.B, A. Hiba, G.J. Wall & D.J. King (2000) Comparison of energy inputs for inorganic fertilizer and manure based corn production. Canadian Agricultural Engineering 42(1),201‐213
On‐Farm Composting Handbook (1992) Natural Resource, Agriculture, and Engineering Service. Fig. p.49,
Pieters, J.G, G.G.J. Neukermans & M.B Colanbeen (1999) Farm‐scale Membrane Filtration of Sow Slurry. J. Agric. Engng Res. 73, 403‐409
Pouliot, F., S. Godbout, V. Dufour, R.D. Von Bernuth & J. Hill (2005) Evaluation de l’efficacite d’un systeme de separation feces‐urine sous caillebotis en engraissement: bilan de masse et caracterisation des sous‐produits. Journees Recherche Porcine 37, 45‐50
Quebec Government (2002), Quebec Water Policy, Chapter 6

47
Rice, J.M, C. Baird, J. Classen, F.J. Humenik, S. Liehr, K. Zering & E.Van Heugten (2005) Belt System for swine waste management. 2005 Animal Waste Management Symposium, 227‐232
Somani, L.L., K.K. Vyas, S.C. Bhandari & S.N. Saxena (1990) Biofertilizers. Shastri Indo‐Canadian Institute. New Delhi. 187‐185
Stone, K. C., Hunt, P. G., Millen, J. A., Johnson, M. H., Matheny, T. A., Vanotti, M. B., Burns, J. C. (2008), Forage Subsurface Drip Irrigation Using Treated Swine Wastewater, Transactions of the ASABE Vol. 51(2): 433‐440
Thorneby, L. K. Perssoon & G. Tragardh. (1999) Treatment of Liquid Effluents from Dairy Cattle and Pigs using Reverse Osmosis. J. Agric. Engng. Res. 73, 159‐170
Van der Meer, H.G, R.J. Unwin, T.A Van Dijk & G.C Ennik (1987) Animal Manure on Grassland and Fodder Crops. Fertilizer or Waste? Martinus Nijhoff Publishers. Lancaster. 388 pages.
Zhang, R.H., P. Yang, Z. Pan, T.D Wolf & J.H. Turnbull (2004) Treatment of Swine wastewater with biological conversion, filtration, and reverse osmosis: a laboratory study. ASABE Transaction 47 (1), 243‐250

48
Figure References Figure 1: Hatfield, J.L. & B.A Stewart (1998) Animal waste utilization: Effective use of manure as
a soil resource. Ann Arbor Press. Michigan. 320 pages.
Figure 3: Fédération des producteurs de porcs du Québec web site, visited on November 28th, 2008, http://www.leporcduquebec.qc.ca/fppq/prod‐2_2.html
Figure 4: University of Wisconsin web page, visited on November 28th, 2008, http://www.uwsp.edu/geo/faculty/ritter/geog101/textbook/earth_system/nitrogen_cycle_EPA.jpg
Figure 5: Mississippi State University web page, visited on November 28th, 2008, http://msucares.com/crops/soils/images/phosphorus.gif
Figure 6: North Carolina State University, Animal Science Department web site, visited on November 26th, 2008, http://mark.asci.ncsu.edu/swinereports/2004‐2005/Facilities/images/grinfig6.jpg
Figure 8: Université Laval, Département des sols et de Génie Agroalimentaire, Master Thesis of Daniel Guilmette, visited on November 21st, 2008, www.theses.ulaval.ca/2008/25088/25088.pdf
Figure 9: Clear Span web site, visited on December 1st, 2008, http://www.clearspan.com/fabric/structures/cat1a;cs1_compost_buildings.html
Figure 10: Google Maps, visited on November 26th, 2008
Figure 11: Airablo web page, visited on November 20th, 2008, http://www.airablo.com/filtramemb.php?c=osmera4
Figure 12: Masse, Lucie, Summer 2008, article not published yet

49
Annexes Table 4 ‐ Factors to be considered in the design of the integrated swine‐crop‐soil manure
management system
Product composition
Manure characteristics - Source - Nutrients content - Volumes - Solid and liquid states - Physical and chemical properties (Ph,
Moisture content, etc… )
Processing factors
Volume reductions Concentration of nutrients Composting Reuse of gray water
Technological feasibility
Airablo reverse osmosis pilot Piling for Solid manure composting under a dome
Reuse of gray water on farm
Agronomic factors
Crops nutrient requirements
Land application retrictions
Soil and air quality impacts of manure composting
Economic factors Quantitative and Qualitative costs Cost – benefit analysis
Environmental factors
Reduce pollutant runoff Reduce the energy consumption Increase the resource value of manure Recycle water
Legal factors
Provincial legislation – use of gray water on farm - Land application - Handling of manure - Specifications of composting facilities

50
Table 5 ‐ Recommended conditions for rapid composting.
Condition Reasonable rangea Preferred range
Carbon to nitrogen (C:N) ratio 20:1–40:1 25:1–30:1
Moisture content 40–65%b 50–60%
Oxygen concentration Greater than 5% Much greater than 5%
Particle size (diameter in inches) 0.12–0.5 Variesb
pH 5.5–9.0 6.5–8.0
Temperature (°F) 110–150 130–140
aThese recommendations are for rapid composting. Conditions outside these ranges also can
yield successful results.
bDepends on the specific materials, pile size, and/or weather conditions.

51
Table 6 ‐ Typical composting times for selected combinations of methods and materials.
Method Materials Active composting time Curing time
Range Typical
Windrow—
infrequent turninga
Leaves
Manure + amendments
6 months–1 year 9 months 4 months
Windrow—
frequent turningb
Manure + amendments 1–4 months 2 months 1–2 months
Aerated static pile Sludge + wood chips 3–5 weeks 4 weeks 1–2 months

52
Table 7 – Airablo systems specifications
MODÈLE MEMBRANE CAPACITÉ GPH MEMBRANE PI 2
DE SURF POMPE
D’AMORÇAGE POMPE À
PRESSION AMP.
TOTAL DIMENSIONS (L x P
x H) PRE-FILTRE
AE114430 1 x 150 80 75 1 CV /230 Volt. 3 CV 26 28 ² x25 ² x52 ² 1x10 ²
AE124430 2 x 150 160 75 1 CV /230 Volt. 3 CV 26 28 ² x25 ² x52 ² 1x10 ²
AE114450 1 x 150 150 75 1CV/230 Volt. 5CV 26 29''x34''x69'' 1X20''
AE124450 2 X 150 300 150 1CV/230 Volt. 5CV 26 29''x34''x69'' 1x20''
AE134450 3 x 150 450 225 1CV/230 Volt. 5CV 26 29''x34''x69'' 1X20''
AE118450 1 X 600 500 400 1CV/230 Volt. 5 CV 26 29''x34''x69'' 2x20''
AE118475 1 X 600 600 400 1CV/230 Volt. 7.5 CV 37 29''x34''x69'' 2X20''
AE318475 1 X 600 600 400 3 CV/230 Volt. 7.5 CV 44 33''x37''x72'' 2x20''
AE328475 2 X 600 1000 800 3 CV/230 Volt. 7.5 CV 44 33''x37'''x72'' 2X20''
AE5384D75 3 X 600 1600 1200 5 CV/230 Volt. 2 x 7.5 CV 81 29''x50''x72'' 4x20''
AE5484D75 4 X 600 2000 1600 5 CV/230 Volt. 2x 7.5 CV 81 29''x70''x72'' 4x20''
AE118675 1 X 800 700 600 1 CV/230 Volt. 7.5 CV 37 29''x34''x77'' 2x20''
AE318675 1 X 800 800 600 3 CV/230 Volt. 7.5 CV 44 33''x37''x77'' 2x20''
AE518675-E2 1 X 800 800 600 5 CV/230 Volt. 7.5 CV 51 à 81 29''x50''x77'' 2x20''
AE7518675-E3 1 X 800 800 600 7.5 CV/230Volt. 1 x 7.5 CV 60 à 120 29''x78''x77'' 2x20''
AE5286D75 2 X 800 1600 1200 5 CV/230 Volt 2 x 7.5 CV 81 29''x50''x77'' 4x20''
AE75286D75-E3 2 X 800 1600 1200 7.5 CV/230 Volt 2 x 7.5 CV 90 à 120 29''x78''x77'' 4x20''
AE75286D75-E4 2 X800 1600 1200 7.5 CV/230 Volt 2 x 7.5 CV 90 à 150 29''x90''x77'' 4x20''
AE75386T75 3 X 800 2400 1800 7.5 CV/230 Volt 3 x 7.5 CV 120 29''x78''x77'' 6x20''
AE75386T75-E4 3 X 800 2400 1800 7.5 CV/230 Volt 3 x 7.5 CV 120 à 150 29''x90''x77'' 6x20''
AE75486Q75 4 X 800 3200 2400 7.5 CV/230 Volt 4 x 7.5 CV 150 29''x90''x77'' 8x20''
AG118420 1 X 600 600 400 1 CV 7.5 CV 29''x60''x71'' 2x20''
AG328420 2 X 600 1000 800 3 CV 7.5CV 29''x60''x71'' 2x20''
AG318620 1 X 800 800 600 3 CV 7.5 CV 29''x60''x71'' 2x20''
Séparateur avec 2 ième membrane en série pour traiter à 10 degré brix MODÈLE MEMBRANE CAPACITÉ GPH MEMBRANE PI 2
DE SURF. POMPE
D’AMORÇAGE POMPE À
PRESSION AMP.
TOTAL DIMENSIONS (L x P
x H) PRE-FILTRE
AE328475B 2 x 600 1000 800 3CV/230 Volt. 7.5CV 64 29''x50''x77'' 2X20''
AE518418675B 1 X 600 1200 1000 5CV/230 Volt. 7.5CV 26 29''x50''x69'' 2x20''
1 X 800
AE75284286D75B 2 x 600 2000 2000 7.5CV/230 Volt. 2X7.5CV 26 29''x78''x77'' 4X20''
2 X 800
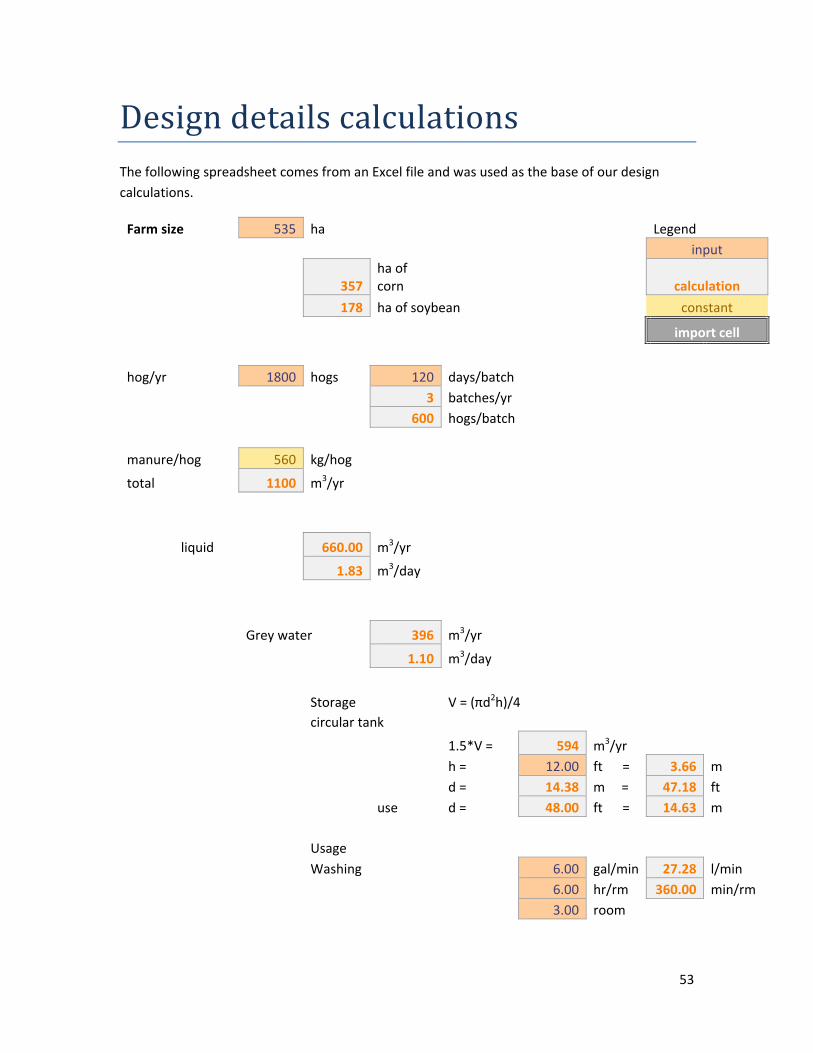
53
Design details calculations The following spreadsheet comes from an Excel file and was used as the base of our design calculations.
Farm size 535 ha Legend input
357ha of corn calculation
178 ha of soybean constant
import cell
hog/yr 1800 hogs 120 days/batch 3 batches/yr
600 hogs/batch
manure/hog 560 kg/hog
total 1100 m3/yr
liquid 660.00 m3/yr
1.83 m3/day
Grey water 396 m3/yr
1.10 m3/day
Storage V = (πd2h)/4 circular tank
1.5*V = 594 m3/yr h = 12.00 ft = 3.66 m d = 14.38 m = 47.18 ft
use d = 48.00 ft = 14.63 m
Usage Washing 6.00 gal/min 27.28 l/min
6.00 hr/rm 360.00 min/rm 3.00 room

54
V = 88376 l/yr
Pesticid application 12 gal/ac 0.75 L H2O/L mix 0.4047 ha/ac 45.43 l/ac 112.27 l/ha
V = 45049 l/yr
V = 133425 l/yr of grey water Surplus 262575 l/yr
Treated manure 264 m3/yr
0.73 m3/day
Storage V = (πd2h)/4 circular tank
1.5*V = 396 m3/yr h = 12.00 ft = 3.66 m d = 11.74 m = 38.52 ft
use d = 39.00 ft = 11.89 m
solid 440.00 m3/yr
1.22 m3/day
Storage/Composting
Accumulate 4 months for both methods
Windrows Assume 6 months of active period and 2 months of curing
Conc. wall height 1.20 m
Manure height 2.00 m see 'area windrow'
Width 3.60 m for those values
Area c/s 5.88 m2
Length V/A 25.00 m 83.0 ft
Require 3 windrows ; Design 4 windrows Assume 1.2m btw rows, wall of 0.2m thick

55
and 0.9m space btw ext. Wall and row wall
Space btw 1.2 m Wall 0.2 m Windrow 4.0 m Space 0.9 m ends space 12.0 ft 3.66 m
Building width 21.4 m 71.0 ft length 32.3 m 106.0 ft
Pilling Assume 10 months of active period and 2 months of curing
Conc. wall height 1.20 m Manure height = h 25 ft 7.60 m
Assume manure form a cone over a rectangular prisme
h1 = 0.9 m
h2 = 6.7 m
V = d2h1 + (πd2h2)/12
d2 = 55.26 m2 d = 7.43 m 25.0 ft
Require 4 squares Assume wall of 0.2m thick, 3.7m central alley and 1.2m space btw ext. Wall and square wall
Central 3.7 m 13.0 ft Wall 0.2 m 1.0 ft Square 7.4 m Space 1.2 m 4.0 ft

56
Building width 21.8 m 72.0 ft length 19.3 m 64.0 ft
Nutrient content
Nitrogen 4.7 kg/finished hog 190 kg/ha
Potassium 2.0 kg/finished hog 0.0 kg/ha
Phosphorous 0.76 kg/finished hog 85 kg/ha
Manure content
N = 8460 kg K = 3600 kg P = 1368 kg
Corn requirements
N = 67830 kg K = 0 kg P = 30345 kg
Net requirements
N = ‐59370 kg K = 3600 kg P = ‐28977 kg
Spreading details
[N] = 0.0320 kg/L
Assuming 0.935 reduction during RO
TM [N] 0.0300 kg/L

57
=
V/ha = 6341.26 L/ha
6.34 m3/ha
[K] = 0.0136 kg/L
Assuming 0.995 reduction during RO
TM [K] = 0.0136 kg/L
V/ha = 86.039 kg/ha in surplus
Reverse Osmosis
Energy required
5.5 h / (2m3) 2.75 h/m3
13.11 kWh/m3
55 m3/mo 721.05 kWh/mo 0 kWh/mo in addition to RO 8652.60 kWh/year
Cost of energy
small company $/kWh kWh $ Cost/month Cost/year
First 15090 kWh 0.0872 721.05 62.88 62.88 $ 754.51 $ rest 0.0448 0 0
avg 0.07 50.47 $ 605.68 $
medium company $/kWh kWh $ Cost/month Cost/year
First 210000 kWh 0.0448 721.05 32.30 32.30 $ 387.64 $ rest 0.0293 0 0
avg 0.04 28.84 $ 346.10 $

58
Crops yield
Corn 9 t/ha Soybean 2.8 t/ha
Area corn 0.67 357 ha Area soybean 0.33 178 ha
Yield corn 3213 tons Yield soybean 498.4 tons
Feed
75 kg feed/finished
hog 0.5 corn/kg feed
corn required 67.5 tons
Transport of manure
Assuming export from St‐George de Beauce to Montreal region 306 km
liquid: 2 truck load / day solid: 0 to 9.9 km 0.999 $/km/t 8 h/day 10 to 29 km 0.984 $/km/t
75 $/h 30 to 64 km 0.935 $/km/t
27.2 m³/truck load 65 to 159,9 km 0.905 $/km/t
600 $/day 160 and more 0.894 $/km/t 11.03 $/m³
Cost of nutrients
Treated manure
[N] 29.96 kg/m³ [K] 13.57 kg/m³

59
0.37 $/kg N 0.81 $/kg K
Total cost 2911.76 $
Solid manure 1.33 t/m³ 585.2 t/yr 0.894 $/km/t
160089.65 $ 117.02 $/kg P
Conventional
[N] 7.69 kg/m³ [K] 3.27 kg/m³ [P] 1.24 kg/m³
1.43 $/kg N 3.37 $/kg K 8.87 $/kg P
Total cost 12132.35 $

60
Cross‐sectional area of windrow width useful height x (m) y (m)
0 0.9
1.8 2 3.6 0.9
A = ∫ (‐0.3395x2 + 1.2222x + 0.9) dx = {‐ 0.1132x3 + 0.6111x2 + 0,9x} from 0 to 3.6 = 5.88 m2
y = ‐0.3395x2 + 1.2222x + 0.9
0
1
2
3
0 0.5 1 1.5 2 2.5 3 3.5 4


