An integrated network visualization framework towards...
13
SOFTWARE Open Access An integrated network visualization framework towards metabolic engineering applications Alberto Noronha 1 , Paulo Vilaça 1,2 and Miguel Rocha 1* Abstract Background: Over the last years, several methods for the phenotype simulation of microorganisms, under specified genetic and environmental conditions have been proposed, in the context of Metabolic Engineering (ME). These methods provided insight on the functioning of microbial metabolism and played a key role in the design of genetic modifications that can lead to strains of industrial interest. On the other hand, in the context of Systems Biology research, biological network visualization has reinforced its role as a core tool in understanding biological processes. However, it has been scarcely used to foster ME related methods, in spite of the acknowledged potential. Results: In this work, an open-source software that aims to fill the gap between ME and metabolic network visualization is proposed, in the form of a plugin to the OptFlux ME platform. The framework is based on an abstract layer, where the network is represented as a bipartite graph containing minimal information about the underlying entities and their desired relative placement. The framework provides input/output support for networks specified in standard formats, such as XGMML, SBGN or SBML, providing a connection to genome-scale metabolic models. An user-interface makes it possible to edit, manipulate and query nodes in the network, providing tools to visualize diverse effects, including visual filters and aspect changing (e.g. colors, shapes and sizes). These tools are particularly interesting for ME, since they allow overlaying phenotype simulation results or elementary flux modes over the networks. Conclusions: The framework and its source code are freely available, together with documentation and other resources, being illustrated with well documented case studies. Keywords: Metabolic network visualization, Metabolic engineering, Open-source software Background Within the field of Systems Biology, the analysis of different types of biological networks is an important task in understanding the underlying biological pro- cesses. For this endeavour, a mathematical framework is provided by graph theory, which has allowed to verify that a multitude of organisms share relevant properties when analysing the topology of their networks [1]. Additionally, being able to capture the network in a visual form can provide useful insights. While, in the pre- genomic era, the analysis and visualization of these net- works were approached as independent computational problems, it is desirable that these two levels are well integrated [2]. Together with their regulatory [3] and signalling counter- parts [4,5], metabolic networks represent a vastly studied class of biological networks. These are typically composed of two entities: metabolites and reactions. Metabolites can be converted by the cell into building blocks or decom- posed to generate energy or other compounds. Metabolic Engineering (ME) aims to rationally pin- point genetic changes in selected host microbes that can optimize the production of compounds of industrial interest and, thus, it heavily makes use of computational analyses of metabolic networks. However, in many cases, the static view of metabolic systems provided by these networks is insufficient, and there is the need to recon- struct genome scale metabolic models (GSMMs) [6] with simulation capabilities, which are increasingly being created given the availability of genome sequences, anno- tation tools and omics data. * Correspondence: [email protected] 1 Centre of Biological Engineering (CEB), School of Engineering, University of Minho, Campus de Gualtar, Braga, Portugal Full list of author information is available at the end of the article © 2014 Noronha et al.; licensee BioMed Central. This is an Open Access article distributed under the terms of the Creative Commons Attribution License (http://creativecommons.org/licenses/by/4.0), which permits unrestricted use, distribution, and reproduction in any medium, provided the original work is properly credited. The Creative Commons Public Domain Dedication waiver (http://creativecommons.org/publicdomain/zero/1.0/) applies to the data made available in this article, unless otherwise stated. Noronha et al. BMC Bioinformatics (2014) 15:420 DOI 10.1186/s12859-014-0420-0
Transcript of An integrated network visualization framework towards...
Noronha et al. BMC Bioinformatics (2014) 15:420 DOI 10.1186/s12859-014-0420-0
SOFTWARE Open Access
An integrated network visualization frameworktowards metabolic engineering applicationsAlberto Noronha1, Paulo Vilaça1,2 and Miguel Rocha1*
Abstract
Background: Over the last years, several methods for the phenotype simulation of microorganisms, under specifiedgenetic and environmental conditions have been proposed, in the context of Metabolic Engineering (ME). Thesemethods provided insight on the functioning of microbial metabolism and played a key role in the design ofgenetic modifications that can lead to strains of industrial interest. On the other hand, in the context of SystemsBiology research, biological network visualization has reinforced its role as a core tool in understanding biologicalprocesses. However, it has been scarcely used to foster ME related methods, in spite of the acknowledgedpotential.
Results: In this work, an open-source software that aims to fill the gap between ME and metabolic networkvisualization is proposed, in the form of a plugin to the OptFlux ME platform. The framework is based on an abstractlayer, where the network is represented as a bipartite graph containing minimal information about the underlyingentities and their desired relative placement. The framework provides input/output support for networks specifiedin standard formats, such as XGMML, SBGN or SBML, providing a connection to genome-scale metabolic models.An user-interface makes it possible to edit, manipulate and query nodes in the network, providing tools to visualizediverse effects, including visual filters and aspect changing (e.g. colors, shapes and sizes). These tools are particularlyinteresting for ME, since they allow overlaying phenotype simulation results or elementary flux modes over the networks.
Conclusions: The framework and its source code are freely available, together with documentation and other resources,being illustrated with well documented case studies.
Keywords: Metabolic network visualization, Metabolic engineering, Open-source software
BackgroundWithin the field of Systems Biology, the analysis ofdifferent types of biological networks is an importanttask in understanding the underlying biological pro-cesses. For this endeavour, a mathematical framework isprovided by graph theory, which has allowed to verifythat a multitude of organisms share relevant propertieswhen analysing the topology of their networks [1].Additionally, being able to capture the network in avisual form can provide useful insights. While, in the pre-genomic era, the analysis and visualization of these net-works were approached as independent computationalproblems, it is desirable that these two levels are wellintegrated [2].
* Correspondence: [email protected] of Biological Engineering (CEB), School of Engineering, University ofMinho, Campus de Gualtar, Braga, PortugalFull list of author information is available at the end of the article
© 2014 Noronha et al.; licensee BioMed CentrCommons Attribution License (http://creativecreproduction in any medium, provided the orDedication waiver (http://creativecommons.orunless otherwise stated.
Together with their regulatory [3] and signalling counter-parts [4,5], metabolic networks represent a vastly studiedclass of biological networks. These are typically composedof two entities: metabolites and reactions. Metabolites canbe converted by the cell into building blocks or decom-posed to generate energy or other compounds.Metabolic Engineering (ME) aims to rationally pin-
point genetic changes in selected host microbes that canoptimize the production of compounds of industrialinterest and, thus, it heavily makes use of computationalanalyses of metabolic networks. However, in many cases,the static view of metabolic systems provided by thesenetworks is insufficient, and there is the need to recon-struct genome scale metabolic models (GSMMs) [6]with simulation capabilities, which are increasingly beingcreated given the availability of genome sequences, anno-tation tools and omics data.
al. This is an Open Access article distributed under the terms of the Creativeommons.org/licenses/by/4.0), which permits unrestricted use, distribution, andiginal work is properly credited. The Creative Commons Public Domaing/publicdomain/zero/1.0/) applies to the data made available in this article,
Noronha et al. BMC Bioinformatics (2014) 15:420 Page 2 of 13
Given the lack of kinetic information to provide forlarge-scale dynamical models, stoichiometric models arethe most common. The information about the metabo-lites and reactions from the metabolic network, togetherwith stoichiometry, are the starting points for their re-construction [7], being mathematically represented by aset of equations that describe the chemical transforma-tions [8].GSMMs are often used to simulate the metabolism of
the cell using constraint-based approaches, where typic-ally a pseudo steady state is assumed [9]. Using thesemodels and specifying environmental conditions (e.g.media), it is possible to perform the calculation of fluxdistributions. The most used method is Flux BalanceAnalysis (FBA), where a flux (e.g. a biomass flux) tomaximize (or minimize) is chosen to obtain an optimalflux distribution [10].In this work, an integration of network visualization
with ME methods is proposed, which demands thatmany issues related with the visualization of metabolicnetworks must be addressed. While the scalability of thenetworks is successfully addressed by generic visualizationpackages, usually the generic layouts available produce un-satisfactory results for metabolic networks. This is mostlydue to the fact that the majority of layout algorithms donot take into consideration any biological knowledge, suchas cell localization or molecular functions. Another prob-lem comes with the filtering of the networks. It is neces-sary to have an easy way to query the network and visuallyfiltering it to specific sets of nodes of interest in a givencontext. To address these problems, a visualization toolshould offer some basic features: layout algorithms, agraphical notation, integration with analysis tools byproviding information about the network and an userinterface to allow interaction [7].There are a myriad of software tools for ME, able to
use metabolic models to perform phenotype simulationsand implement strain optimization methods, being someof the best known examples: OptFlux [11], the COBRAToolbox [12,13], CellNetAnalyzer [14] and FASIMU [15].There are also several tools that perform visualization ofmetabolic (and other types) of biological networks.There are not, however, many examples of successfulintegration of these two distinct types of applications.CellDesigner [16,17], for instance, is one of the mostpopular tools for editing and visualizing biochemicalnetworks, but it lacks specific methods for constraint-based approaches and does not deal well with large-scaleGSMMs.Cytoscape [18] became a standard tool for the inte-
grated analysis and visualization of biological networks.One of its many plugins, FluxViz [19], provides featuresfor the visualization of flux distributions in networks.FluxViz was primarily developed for FASIMU, a software
for flux-balance computation, and it uses the generatedresult files as input for visualization.Another tool worth mentioning is VANTED [20], an
application for the visualization and analysis of networkswith related experimental data. The usefulness of thistool for ME purposes is provided by two of the availableplugins, FluxMap, that allows the visualization of mea-sured or simulated fluxes in the network, and FBASim-Vis for constraint-based analysis of metabolic models,with a special focus on the dynamics and visual explor-ation of metabolic flux data resulting from model analysis.It supports wild type and knock-out FBA simulations.Both the COBRA toolbox and CellNetAnalyzer are based
on the commercial software Matlab, and therefore are notfreely available for the community. COBRA already inclu-des some network visualization tools in the originalrelease, but the generated maps are static built-in maps,that can be exported in a single format (SVG), optionallyincluding overlaps with simulation results. An extension,Paint4Net [21], that allows some editing features (mainlynode dragging), has been recently proposed. However,editing is limited to the models and layouts from therelated BiGG database, editing options are quite limitedand layouts can only be exported as images and notreused. On the other hand, CellNetAnalyzer only enablesthe visualization of small or medium scale biological net-works. More recently, MetDraw [22], that is capable ofgenerating layouts for large metabolic models, was pub-lished providing the means to visualize “omics” data over-laid in the network. However, it does not support editinglayouts, requiring the use of an external tool for that aim,and is not integrated with any ME tool.In the majority of these tools, biological entities/ inter-
actions are represented as shapes/ lines, with differentcolours/formats standing for their classes. Although thisseems a reasonable solution, the complexity of the inte-grated information and the range of possible interactionsmotivated the development of standard notations. Themost successful was the Systems Biology GraphicalNotation (SBGN) [23], where networks are modelledin a state-transition way. Another successful standardformat is the Systems Biology Markup Language (SBML)[24], which aims at storing and exchanging biologicalmodels. Combined with the development of the SMBLLayout package, this makes up a very promising effort innetwork visualization as well. The full support to thesestandards is not guaranteed by most of the tools and thiswould be an advantage in the interoperability of thesetools with other relevant software.Overall, and in spite of the aforementioned tools,
network visualization has been traditionally apart fromME-related methods. Some notable exceptions werealready mentioned, but an effective framework, whichwould facilitate the agile integration of simulation results
Noronha et al. BMC Bioinformatics (2014) 15:420 Page 3 of 13
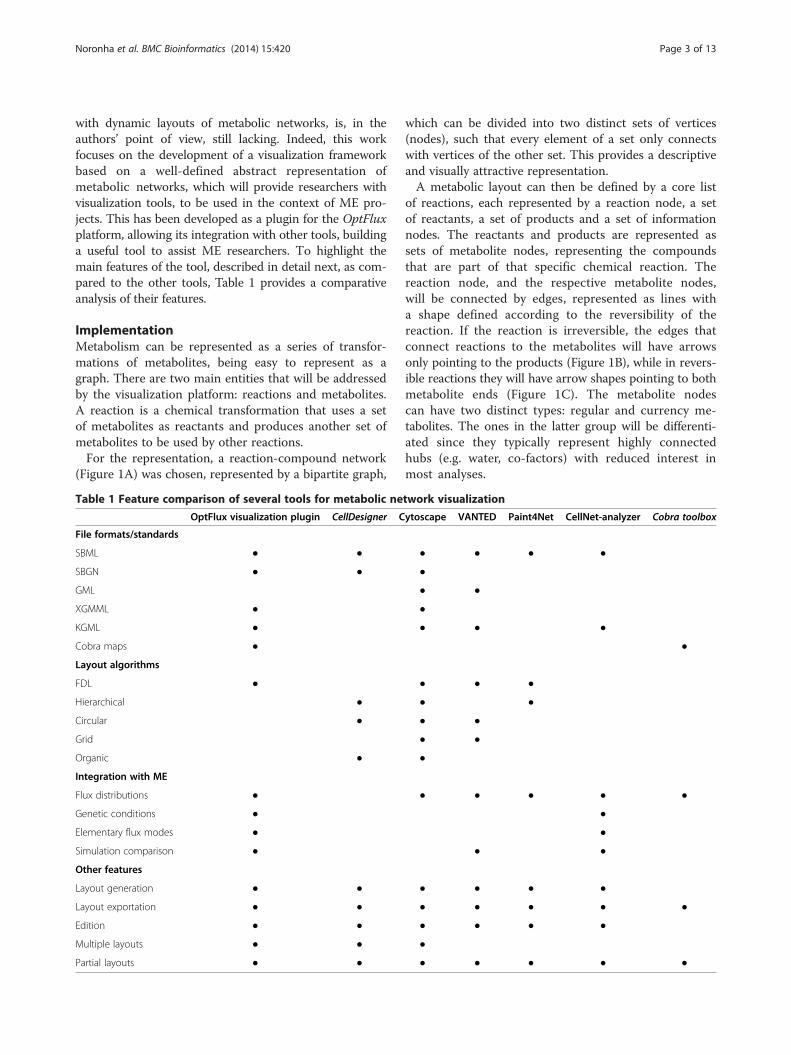
with dynamic layouts of metabolic networks, is, in theauthors’ point of view, still lacking. Indeed, this workfocuses on the development of a visualization frameworkbased on a well-defined abstract representation ofmetabolic networks, which will provide researchers withvisualization tools, to be used in the context of ME pro-jects. This has been developed as a plugin for the OptFluxplatform, allowing its integration with other tools, buildinga useful tool to assist ME researchers. To highlight themain features of the tool, described in detail next, as com-pared to the other tools, Table 1 provides a comparativeanalysis of their features.
ImplementationMetabolism can be represented as a series of transfor-mations of metabolites, being easy to represent as agraph. There are two main entities that will be addressedby the visualization platform: reactions and metabolites.A reaction is a chemical transformation that uses a setof metabolites as reactants and produces another set ofmetabolites to be used by other reactions.For the representation, a reaction-compound network
(Figure 1A) was chosen, represented by a bipartite graph,
Table 1 Feature comparison of several tools for metabolic ne
OptFlux visualization plugin CellDesigner C
File formats/standards
SBML ● ●
SBGN ● ●
GML
XGMML ●
KGML ●
Cobra maps ●
Layout algorithms
FDL ●
Hierarchical ●
Circular ●
Grid
Organic ●
Integration with ME
Flux distributions ●
Genetic conditions ●
Elementary flux modes ●
Simulation comparison ●
Other features
Layout generation ● ●
Layout exportation ● ●
Edition ● ●
Multiple layouts ● ●
Partial layouts ● ●
which can be divided into two distinct sets of vertices(nodes), such that every element of a set only connectswith vertices of the other set. This provides a descriptiveand visually attractive representation.A metabolic layout can then be defined by a core list
of reactions, each represented by a reaction node, a setof reactants, a set of products and a set of informationnodes. The reactants and products are represented assets of metabolite nodes, representing the compoundsthat are part of that specific chemical reaction. Thereaction node, and the respective metabolite nodes,will be connected by edges, represented as lines witha shape defined according to the reversibility of thereaction. If the reaction is irreversible, the edges thatconnect reactions to the metabolites will have arrowsonly pointing to the products (Figure 1B), while in revers-ible reactions they will have arrow shapes pointing to bothmetabolite ends (Figure 1C). The metabolite nodescan have two distinct types: regular and currency me-tabolites. The ones in the latter group will be differenti-ated since they typically represent highly connectedhubs (e.g. water, co-factors) with reduced interest inmost analyses.
twork visualization
ytoscape VANTED Paint4Net CellNet-analyzer Cobra toolbox
● ● ● ●
●
● ●
●
● ● ●
●
● ● ●
● ●
● ●
● ●
●
● ● ● ● ●
●
●
● ●
● ● ● ●
● ● ● ● ●
● ● ● ●
●
● ● ● ● ●
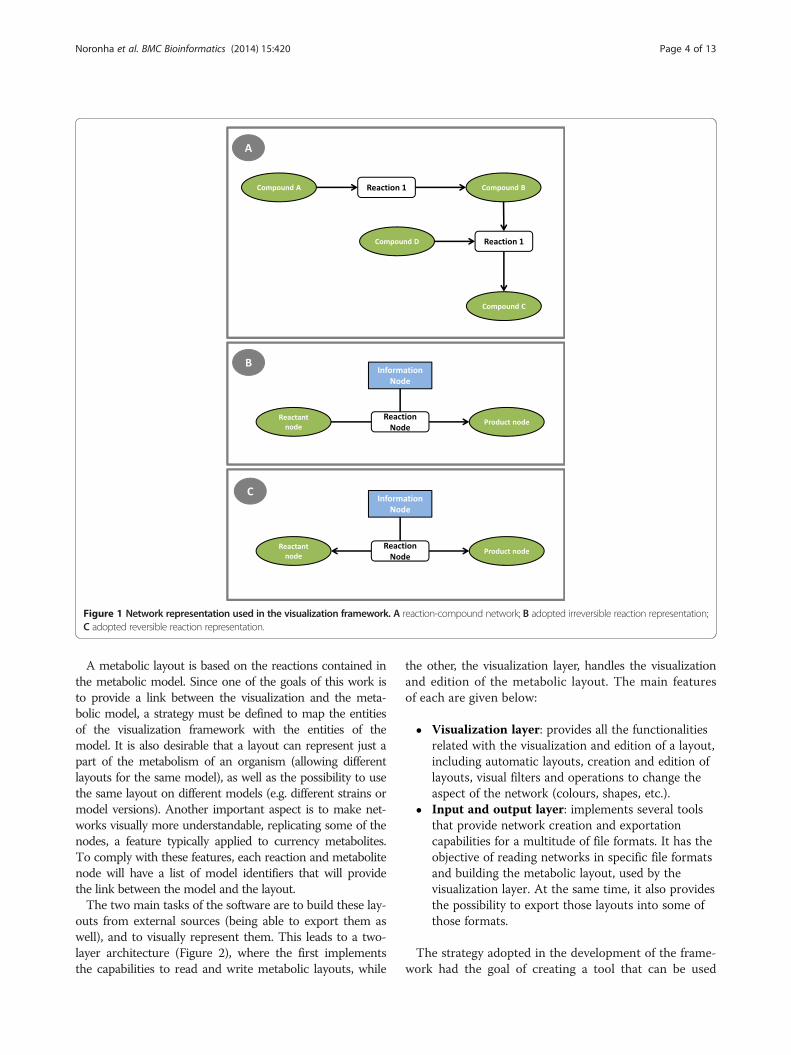
Figure 1 Network representation used in the visualization framework. A reaction-compound network; B adopted irreversible reaction representation;C adopted reversible reaction representation.
Noronha et al. BMC Bioinformatics (2014) 15:420 Page 4 of 13
A metabolic layout is based on the reactions contained inthe metabolic model. Since one of the goals of this work isto provide a link between the visualization and the meta-bolic model, a strategy must be defined to map the entitiesof the visualization framework with the entities of themodel. It is also desirable that a layout can represent just apart of the metabolism of an organism (allowing differentlayouts for the same model), as well as the possibility to usethe same layout on different models (e.g. different strains ormodel versions). Another important aspect is to make net-works visually more understandable, replicating some of thenodes, a feature typically applied to currency metabolites.To comply with these features, each reaction and metabolitenode will have a list of model identifiers that will providethe link between the model and the layout.The two main tasks of the software are to build these lay-
outs from external sources (being able to export them aswell), and to visually represent them. This leads to a two-layer architecture (Figure 2), where the first implementsthe capabilities to read and write metabolic layouts, while
the other, the visualization layer, handles the visualizationand edition of the metabolic layout. The main featuresof each are given below:
� Visualization layer: provides all the functionalitiesrelated with the visualization and edition of a layout,including automatic layouts, creation and edition oflayouts, visual filters and operations to change theaspect of the network (colours, shapes, etc.).
� Input and output layer: implements several toolsthat provide network creation and exportationcapabilities for a multitude of file formats. It has theobjective of reading networks in specific file formatsand building the metabolic layout, used by thevisualization layer. At the same time, it also providesthe possibility to export those layouts into some ofthose formats.
The strategy adopted in the development of the frame-work had the goal of creating a tool that can be used
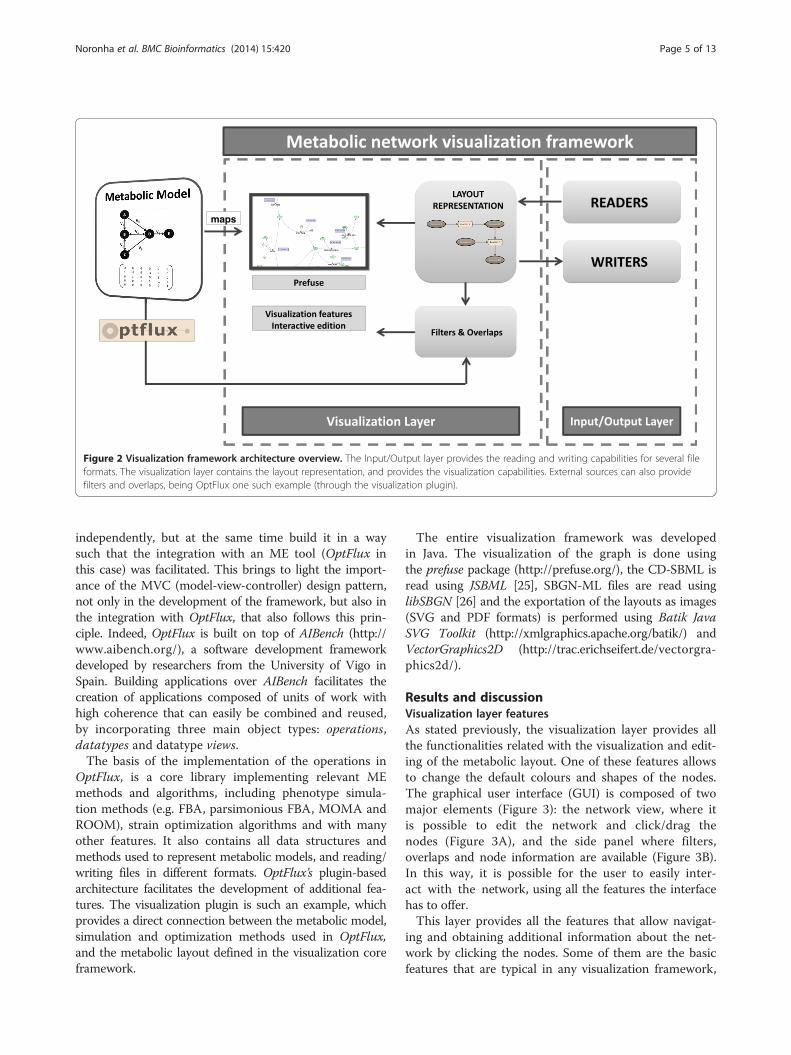
Figure 2 Visualization framework architecture overview. The Input/Output layer provides the reading and writing capabilities for several fileformats. The visualization layer contains the layout representation, and provides the visualization capabilities. External sources can also providefilters and overlaps, being OptFlux one such example (through the visualization plugin).
Noronha et al. BMC Bioinformatics (2014) 15:420 Page 5 of 13
independently, but at the same time build it in a waysuch that the integration with an ME tool (OptFlux inthis case) was facilitated. This brings to light the import-ance of the MVC (model-view-controller) design pattern,not only in the development of the framework, but also inthe integration with OptFlux, that also follows this prin-ciple. Indeed, OptFlux is built on top of AIBench (http://www.aibench.org/), a software development frameworkdeveloped by researchers from the University of Vigo inSpain. Building applications over AIBench facilitates thecreation of applications composed of units of work withhigh coherence that can easily be combined and reused,by incorporating three main object types: operations,datatypes and datatype views.The basis of the implementation of the operations in
OptFlux, is a core library implementing relevant MEmethods and algorithms, including phenotype simula-tion methods (e.g. FBA, parsimonious FBA, MOMA andROOM), strain optimization algorithms and with manyother features. It also contains all data structures andmethods used to represent metabolic models, and reading/writing files in different formats. OptFlux’s plugin-basedarchitecture facilitates the development of additional fea-tures. The visualization plugin is such an example, whichprovides a direct connection between the metabolic model,simulation and optimization methods used in OptFlux,and the metabolic layout defined in the visualization coreframework.
The entire visualization framework was developedin Java. The visualization of the graph is done usingthe prefuse package (http://prefuse.org/), the CD-SBML isread using JSBML [25], SBGN-ML files are read usinglibSBGN [26] and the exportation of the layouts as images(SVG and PDF formats) is performed using Batik JavaSVG Toolkit (http://xmlgraphics.apache.org/batik/) andVectorGraphics2D (http://trac.erichseifert.de/vectorgra-phics2d/).
Results and discussionVisualization layer featuresAs stated previously, the visualization layer provides allthe functionalities related with the visualization and edit-ing of the metabolic layout. One of these features allowsto change the default colours and shapes of the nodes.The graphical user interface (GUI) is composed of twomajor elements (Figure 3): the network view, where itis possible to edit the network and click/drag thenodes (Figure 3A), and the side panel where filters,overlaps and node information are available (Figure 3B).In this way, it is possible for the user to easily inter-act with the network, using all the features the interfacehas to offer.This layer provides all the features that allow navigat-
ing and obtaining additional information about the net-work by clicking the nodes. Some of them are the basicfeatures that are typical in any visualization framework,
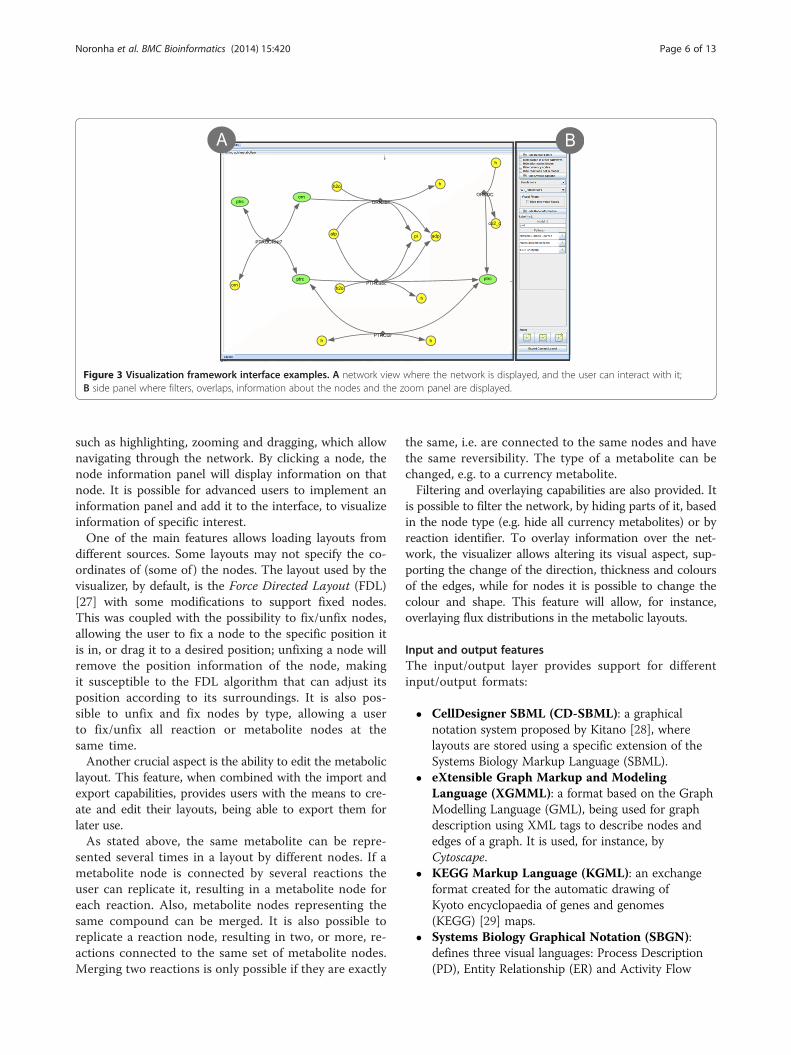
Figure 3 Visualization framework interface examples. A network view where the network is displayed, and the user can interact with it;B side panel where filters, overlaps, information about the nodes and the zoom panel are displayed.
Noronha et al. BMC Bioinformatics (2014) 15:420 Page 6 of 13
such as highlighting, zooming and dragging, which allownavigating through the network. By clicking a node, thenode information panel will display information on thatnode. It is possible for advanced users to implement aninformation panel and add it to the interface, to visualizeinformation of specific interest.One of the main features allows loading layouts from
different sources. Some layouts may not specify the co-ordinates of (some of) the nodes. The layout used by thevisualizer, by default, is the Force Directed Layout (FDL)[27] with some modifications to support fixed nodes.This was coupled with the possibility to fix/unfix nodes,allowing the user to fix a node to the specific position itis in, or drag it to a desired position; unfixing a node willremove the position information of the node, makingit susceptible to the FDL algorithm that can adjust itsposition according to its surroundings. It is also pos-sible to unfix and fix nodes by type, allowing a userto fix/unfix all reaction or metabolite nodes at thesame time.Another crucial aspect is the ability to edit the metabolic
layout. This feature, when combined with the import andexport capabilities, provides users with the means to cre-ate and edit their layouts, being able to export them forlater use.As stated above, the same metabolite can be repre-
sented several times in a layout by different nodes. If ametabolite node is connected by several reactions theuser can replicate it, resulting in a metabolite node foreach reaction. Also, metabolite nodes representing thesame compound can be merged. It is also possible toreplicate a reaction node, resulting in two, or more, re-actions connected to the same set of metabolite nodes.Merging two reactions is only possible if they are exactly
the same, i.e. are connected to the same nodes and havethe same reversibility. The type of a metabolite can bechanged, e.g. to a currency metabolite.Filtering and overlaying capabilities are also provided. It
is possible to filter the network, by hiding parts of it, basedin the node type (e.g. hide all currency metabolites) or byreaction identifier. To overlay information over the net-work, the visualizer allows altering its visual aspect, sup-porting the change of the direction, thickness and coloursof the edges, while for nodes it is possible to change thecolour and shape. This feature will allow, for instance,overlaying flux distributions in the metabolic layouts.
Input and output featuresThe input/output layer provides support for differentinput/output formats:
� CellDesigner SBML (CD-SBML): a graphicalnotation system proposed by Kitano [28], wherelayouts are stored using a specific extension of theSystems Biology Markup Language (SBML).
� eXtensible Graph Markup and ModelingLanguage (XGMML): a format based on the GraphModelling Language (GML), being used for graphdescription using XML tags to describe nodes andedges of a graph. It is used, for instance, byCytoscape.
� KEGG Markup Language (KGML): an exchangeformat created for the automatic drawing ofKyoto encyclopaedia of genes and genomes(KEGG) [29] maps.
� Systems Biology Graphical Notation (SBGN):defines three visual languages: Process Description(PD), Entity Relationship (ER) and Activity Flow

Noronha et al. BMC Bioinformatics (2014) 15:420 Page 7 of 13
(AF). For the purpose of this work, which focuseson metabolism, support was only developed for thePD language, based on Kitano’s proposal used inCellDesigner’s graphical representation, usingbipartite graphs.
� COBRA Layouts: maps developed for the COBRAToolbox. There are, currently, several maps on thisformat for many of the models hosted in the BiGGknowledgebase (http://bigg.ucsd.edu). These can beused on different models that have similar pathways,with a correct mapping of the identifiers betweenthe layout and the BiGG model.
� Pathway generation: It is possible to generate alayout by using a list of reactions from a GSMM.This can be done following two strategies: choosinga list of reactions or, in the case where the modelhas pathway information, building layouts with thereactions from a set of pathways.
OptFlux pluginThe visualization plugin for OptFlux has the main goal ofproviding a connection between the GSMMs loaded intoOptFlux, their phenotype simulation and optimizationresults, and the layouts from the visualization framework.Through the plugin’s operations, it is possible for the
user to map the identifiers of the metabolic model withthe identifiers of the reaction and metabolite nodes of thelayout. There are two different mapping methods avail-able: loading a two-column file with the explicit mappingor applying regular expressions to the identifiers in themodel and/or the layout. Another available operationallows the importation of KGML layouts, which can beautomatically downloaded from the KEGG site.The third operation allows the creation of layouts
from reactions of a metabolic model, using the pathwaylayout generation feature described above. The generationof this type of layouts can be made by selecting a pathwayfrom the model or by selecting a list of reactions manually.It is also possible to select an existing layout as a basis forthe new layout. This will allow creating new layouts oradding new reactions to existing ones.Each model can have a list of layouts associated, being
possible to navigate from one layout to another by click-ing the elements of that list. If the user clicks a metabol-ite that is present in another layout from the list, theinformation panel will display access buttons for thoselayouts.The most desired functionality of the connection
between a ME and a visualization tool, is the abilityto visualize phenotype simulation results (mainly fluxdistributions) overlaid in the network. This allows usingthe visualization tool to better understand the organism’smetabolism and design changes that can improve ittowards some defined aim.
To allow this operation, there is a conversion from asimulation result in OptFlux, to an overlap object that isused in the visualization. In OptFlux, simulation resultshave two major elements of interest for the visualization:flux distributions and genetic conditions. A flux distribu-tion contains the flux values for each reaction. To repre-sent it, a conversion of identifiers is needed. It canhappen that two or more fluxes are mapped to the samereaction node, and the methodology chosen was to sumall those values (although alternative options can be eas-ily implemented). In the end, all these flux values, nowmapped by reaction node, are normalized and used todetermine the thickness of the edges. Additionally, thelabels of the reaction nodes are also changed, adding thenumerical value of the flux after the reaction name.The genetic conditions of a simulation are defined as
all genetic changes made to the organism for that specificsimulation. It contains all knock-outs (reaction deletions),and under/over expressed reactions. For the visual repre-sentation, some node shapes and colours were adopted tohighlight these affected reactions. As seen in Figure 4A, aknocked-out reaction will be indicated by a red cross, withreaction edges also coloured red. An upward arrow willindicate an over-expressed reaction, where both the arrowand the edge are green (Figure 4B). Finally, an underex-pressed reaction is coloured orange and accompanied by adownward orange arrow (Figure 4C).Another type of overlap was also developed to visualize
the comparison of two phenotype simulation results. Themethodology followed was similar to the simulation over-laps. The genetic conditions are represented using thesame symbols, but the colours of the edges follow a differ-ent strategy. Each simulation will have a colour by default,for instance, simulation 1 will have the colour red, andsimulation 2 will have the colour green. Then, accordingto the flux for each reaction in each simulation, the col-ours will vary. If the amount of flux is larger in simulation1, the colours will vary in a gradient that spans from redto black (where black means that there is no difference influxes), and if the flux value in simulation 2 is greater, thecolours will vary from green to black. This will allow theuser to identify where flux paths differ in the simulations(pure colours) and where both share fluxes (darker col-ours). At the same time, for reversible reactions, the fluxesof the compared simulations can take different directions.In this case, edges will have the colour of the simulationthat follows the direction they are pointing, also giving theuser an easy way to understand where the simulationsdiffer. The thickness of the edges is calculated using themean of the flux values in both simulations. On top ofthis, some filters are also generated, where it is possibleto hide zero value fluxes in a simulation.OptFlux also provides a plugin that calculates the set
of Elementary Flux Modes (EFMs) of a model. EFMs are

Figure 4 Symbols used to represent genetic modifications in a phenotype simulation overlap. A knocked-out reaction; B under-expressedreaction; C over-expressed reaction.
Noronha et al. BMC Bioinformatics (2014) 15:420 Page 8 of 13
the set of all routes through the network that cannot bedecomposed to simpler routes [30], while maintainingsteady-state, so they provide a way to analyse the set ofpathways in the metabolic network. This plugin providesan interface that allows filtering these results, includingthe selection of EFMs based on presence/absence ofexternal metabolites or sorting by yield. It is possible toselect sets of EFMs browsing these results, to visualizethe EFMs in a column-wise table, and to obtain the fluxvalues for each reaction within the EFM.The visualization plugin can convert these flux distri-
butions into an overlap, in a way similar to the one usedfor the phenotype simulation results. Consideringthat, in this case, the only information available is theset of flux distributions, only the thickness and labelsof the edges are changed. A visual filter can be appliedhiding the reactions with zero value fluxes, thus al-lowing the visualization of the reactions that are part ofthe EFM.Regarding customization, the plug-in allows for the
configuration of the style of the visualization throughthe Preferences option in the Help menu. This allows topersonalize the layouts, defining parameters such as thecolour and shape of the nodes or the font, size and
colour of the labels. Perhaps more importantly, it is alsopossible to define the content of the labels of reactionand metabolite nodes, choosing which attributes to in-clude from the ones available in the model. An exampleand more details of this process are given in the OptFluxdocumentation and in the case study description avail-able in the Additional file 1.
Usage example: succinate production with E. coliTo best illustrate the main features of the proposedtool, two case studies will be used, focusing on succi-nic acid (this section) and glycine production (nextsection) with E. coli. The full description of the workflowand required materials for both case studies are providedas Additional file 1.Succinic acid is an important compound to industry
that has been produced mainly by chemical processes.Recently, there has been an effort to use microbial fer-mentation processes with anaerobic bacteria [31] andoptimizing micro-organisms to over-produce succinicacid is one goal of interest for ME researchers. For thiscase study, the E. coli metabolic model iJR904 [32] wasused. The model is available for download directly fromOptFlux’s internal repository, and it is composed of 1075
Noronha et al. BMC Bioinformatics (2014) 15:420 Page 9 of 13
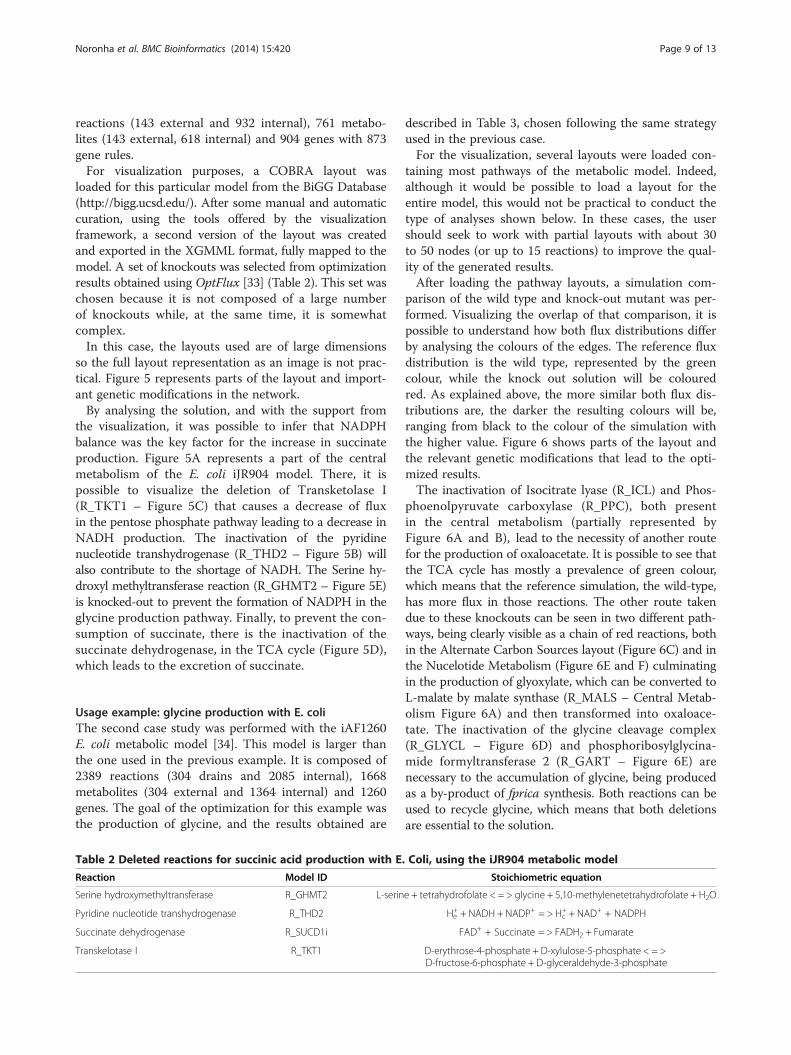
reactions (143 external and 932 internal), 761 metabo-lites (143 external, 618 internal) and 904 genes with 873gene rules.For visualization purposes, a COBRA layout was
loaded for this particular model from the BiGG Database(http://bigg.ucsd.edu/). After some manual and automaticcuration, using the tools offered by the visualizationframework, a second version of the layout was createdand exported in the XGMML format, fully mapped to themodel. A set of knockouts was selected from optimizationresults obtained using OptFlux [33] (Table 2). This set waschosen because it is not composed of a large numberof knockouts while, at the same time, it is somewhatcomplex.In this case, the layouts used are of large dimensions
so the full layout representation as an image is not prac-tical. Figure 5 represents parts of the layout and import-ant genetic modifications in the network.By analysing the solution, and with the support from
the visualization, it was possible to infer that NADPHbalance was the key factor for the increase in succinateproduction. Figure 5A represents a part of the centralmetabolism of the E. coli iJR904 model. There, it ispossible to visualize the deletion of Transketolase I(R_TKT1 – Figure 5C) that causes a decrease of fluxin the pentose phosphate pathway leading to a decrease inNADH production. The inactivation of the pyridinenucleotide transhydrogenase (R_THD2 – Figure 5B) willalso contribute to the shortage of NADH. The Serine hy-droxyl methyltransferase reaction (R_GHMT2 – Figure 5E)is knocked-out to prevent the formation of NADPH in theglycine production pathway. Finally, to prevent the con-sumption of succinate, there is the inactivation of thesuccinate dehydrogenase, in the TCA cycle (Figure 5D),which leads to the excretion of succinate.
Usage example: glycine production with E. coliThe second case study was performed with the iAF1260E. coli metabolic model [34]. This model is larger thanthe one used in the previous example. It is composed of2389 reactions (304 drains and 2085 internal), 1668metabolites (304 external and 1364 internal) and 1260genes. The goal of the optimization for this example wasthe production of glycine, and the results obtained are
Table 2 Deleted reactions for succinic acid production with E
Reaction Model ID
Serine hydroxymethyltransferase R_GHMT2 L-serin
Pyridine nucleotide transhydrogenase R_THD2
Succinate dehydrogenase R_SUCD1i
Transkelotase I R_TKT1
described in Table 3, chosen following the same strategyused in the previous case.For the visualization, several layouts were loaded con-
taining most pathways of the metabolic model. Indeed,although it would be possible to load a layout for theentire model, this would not be practical to conduct thetype of analyses shown below. In these cases, the usershould seek to work with partial layouts with about 30to 50 nodes (or up to 15 reactions) to improve the qual-ity of the generated results.After loading the pathway layouts, a simulation com-
parison of the wild type and knock-out mutant was per-formed. Visualizing the overlap of that comparison, it ispossible to understand how both flux distributions differby analysing the colours of the edges. The reference fluxdistribution is the wild type, represented by the greencolour, while the knock out solution will be colouredred. As explained above, the more similar both flux dis-tributions are, the darker the resulting colours will be,ranging from black to the colour of the simulation withthe higher value. Figure 6 shows parts of the layout andthe relevant genetic modifications that lead to the opti-mized results.The inactivation of Isocitrate lyase (R_ICL) and Phos-
phoenolpyruvate carboxylase (R_PPC), both presentin the central metabolism (partially represented byFigure 6A and B), lead to the necessity of another routefor the production of oxaloacetate. It is possible to see thatthe TCA cycle has mostly a prevalence of green colour,which means that the reference simulation, the wild-type,has more flux in those reactions. The other route takendue to these knockouts can be seen in two different path-ways, being clearly visible as a chain of red reactions, bothin the Alternate Carbon Sources layout (Figure 6C) and inthe Nucelotide Metabolism (Figure 6E and F) culminatingin the production of glyoxylate, which can be converted toL-malate by malate synthase (R_MALS – Central Metab-olism Figure 6A) and then transformed into oxaloace-tate. The inactivation of the glycine cleavage complex(R_GLYCL – Figure 6D) and phosphoribosylglycina-mide formyltransferase 2 (R_GART – Figure 6E) arenecessary to the accumulation of glycine, being producedas a by-product of fprica synthesis. Both reactions can beused to recycle glycine, which means that both deletionsare essential to the solution.
. Coli, using the iJR904 metabolic model
Stoichiometric equation
e + tetrahydrofolate < = > glycine + 5,10-methylenetetrahydrofolate + H2O
H+e + NADH + NADP+ = > H+
c + NAD+ + NADPH
FAD+ + Succinate = > FADH2 + Fumarate
D-erythrose-4-phosphate + D-xylulose-5-phosphate < = >D-fructose-6-phosphate + D-glyceraldehyde-3-phosphate

Figure 5 Visualization of parts of the iJR904 model layout representing the main genetic modifications performed over the model toproduce succinate. A part of the central metabolism; B inactivation of the pyridine nucleotide transhydrogenase (R_THD2); C deletion ofTransketolase I; D inactivation of the succinate dehydrogenase (R_SUCDli), in the TCA-cycle; E knockout of serine hydroxyl methyltransferasereaction (R_GHMT2).
Noronha et al. BMC Bioinformatics (2014) 15:420 Page 10 of 13
ConclusionsIn this work, a metabolic network visualization frameworkwas presented, which has the ability to load networks froma variety of formats and display them using a dynamic lay-out. It provides features for the straightforward creationand editing of these layouts, as well as exportation capabil-ities. On top of this, it is possible to overlay the networkwith visual changes, a functionality that allows, for in-stance, visualizing fluxes in a phenotype simulation, identi-fying the genetic conditions imposed in a simulation,addressing the comparison of two simulation results, ana-lysing results from strain optimization methods or visualiz-ing the set of elementary modes in a model.
Table 3 Deleted reactions for glycine production with E. Coli,
Reaction Model ID
Isiocitrate lyase R_ICL
Glycine cleavage R_GLYCL Glycine
Phosphoenolpyruvate carboxylase R_PPC O
Phosphoribosyglycinamide formyltrasferase 2 R_GART
The framework was integrated with OptFlux, a MEframework, by the development of a plugin. This allowsME researchers to use the visualization directly fromwithin OptFlux, and use a series of operations that willallow loading and exporting layouts with a user-friendlyinterface.This framework presents itself as a useful tool that can
help researchers involved in ME projects to have a wayof easily addressing the visualization of the metabolicnetworks they are studying. The ability to dynamicallyvisualize phenotype simulations is an important asset.The combination of visualization with simulation andoptimization processes will help researchers to achieve
using the iAF1260 metabolic model
Stoichiometric equation
Isocitrate = > Succinate + Glyoxylate
+ NAD+ + Tetrahydrofolate = > NH4+ + 5,10-Methylenetetrahydrofolate +NADH + CO2
xaloacetate + Phosphate < = > Phosphoenolpyruvate + Bicarbonate
5-phospho-ribosyl-glycineamide + Formate + ATP <= >5’-phosphoribosyl-N-formylglycineamide + ADP + Phosphate + H+
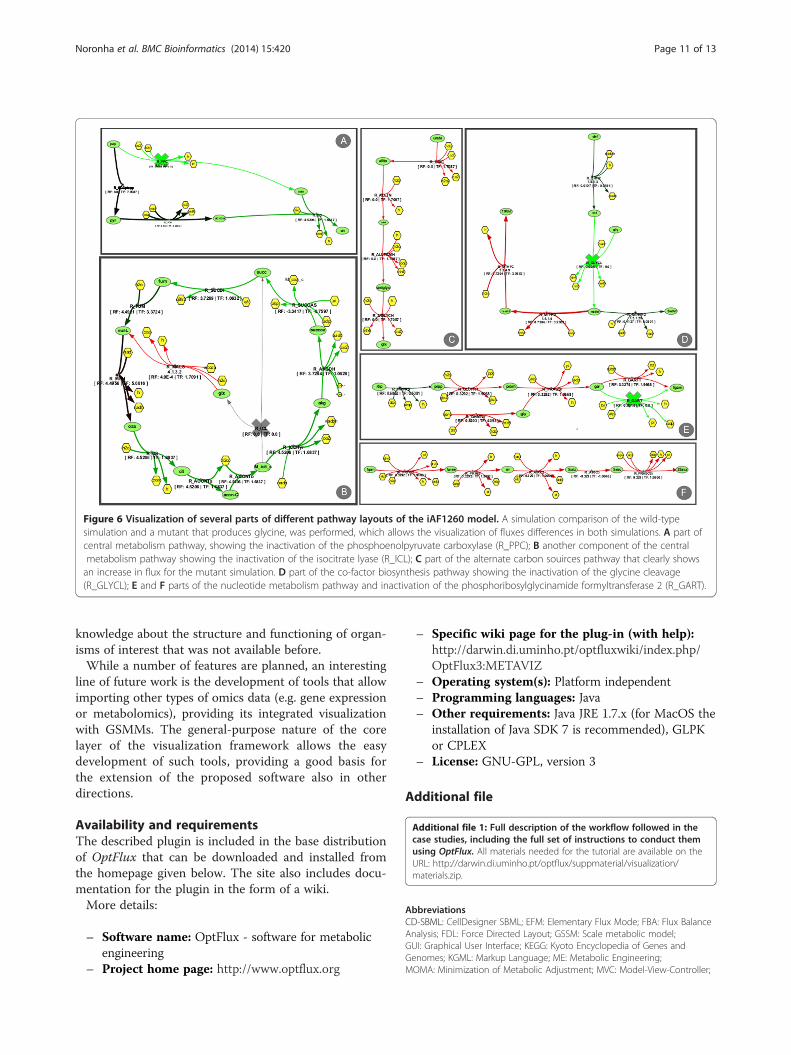
Figure 6 Visualization of several parts of different pathway layouts of the iAF1260 model. A simulation comparison of the wild-typesimulation and a mutant that produces glycine, was performed, which allows the visualization of fluxes differences in both simulations. A part ofcentral metabolism pathway, showing the inactivation of the phosphoenolpyruvate carboxylase (R_PPC); B another component of the centralmetabolism pathway showing the inactivation of the isocitrate lyase (R_ICL); C part of the alternate carbon souirces pathway that clearly showsan increase in flux for the mutant simulation. D part of the co-factor biosynthesis pathway showing the inactivation of the glycine cleavage(R_GLYCL); E and F parts of the nucleotide metabolism pathway and inactivation of the phosphoribosylglycinamide formyltransferase 2 (R_GART).
Noronha et al. BMC Bioinformatics (2014) 15:420 Page 11 of 13
knowledge about the structure and functioning of organ-isms of interest that was not available before.While a number of features are planned, an interesting
line of future work is the development of tools that allowimporting other types of omics data (e.g. gene expressionor metabolomics), providing its integrated visualizationwith GSMMs. The general-purpose nature of the corelayer of the visualization framework allows the easydevelopment of such tools, providing a good basis forthe extension of the proposed software also in otherdirections.
Availability and requirementsThe described plugin is included in the base distributionof OptFlux that can be downloaded and installed fromthe homepage given below. The site also includes docu-mentation for the plugin in the form of a wiki.More details:
– Software name: OptFlux - software for metabolicengineering
– Project home page: http://www.optflux.org
– Specific wiki page for the plug-in (with help):http://darwin.di.uminho.pt/optfluxwiki/index.php/OptFlux3:METAVIZ
– Operating system(s): Platform independent– Programming languages: Java– Other requirements: Java JRE 1.7.x (for MacOS the
installation of Java SDK 7 is recommended), GLPKor CPLEX
– License: GNU-GPL, version 3
Additional file
Additional file 1: Full description of the workflow followed in thecase studies, including the full set of instructions to conduct themusing OptFlux. All materials needed for the tutorial are available on theURL: http://darwin.di.uminho.pt/optflux/suppmaterial/visualization/materials.zip.
AbbreviationsCD-SBML: CellDesigner SBML; EFM: Elementary Flux Mode; FBA: Flux BalanceAnalysis; FDL: Force Directed Layout; GSSM: Scale metabolic model;GUI: Graphical User Interface; KEGG: Kyoto Encyclopedia of Genes andGenomes; KGML: Markup Language; ME: Metabolic Engineering;MOMA: Minimization of Metabolic Adjustment; MVC: Model-View-Controller;
Noronha et al. BMC Bioinformatics (2014) 15:420 Page 12 of 13
ROOM: Regulatory On/Off Minimization of metabolic flux changes;SBGN: Systems Biology Graphical Notation; SBML: Systems Biology MarkupLanguage; XGMML: eXtensible Graph Markup and Modeling Language.
Competing interestsThe authors declare that they have no competing interests.
Authors’ contributionsMR and PV were involved in the identification of requirements, conceptionof the software architecture and case study selection. MR, AN and PV wereinvolved in designing the software and writing the manuscript. AN and PVimplemented the software and ran the analysis. All authors read andapproved the final manuscript.
AcknowledgmentsThis work is partially funded by ERDF - European Regional DevelopmentFund through the COMPETE Programme (operational programme forcompetitiveness) and by National Funds through the FCT (PortugueseFoundation for Science and Technology) within project ref. COMPETEFCOMP-01-0124-FEDER-015079 and the FCT Strategic Project PEst-OE/EQB/LA0023/2013. The work of PV is funded by PhD grant ref. SFRH/BDE/51442/2011.
Author details1Centre of Biological Engineering (CEB), School of Engineering, University ofMinho, Campus de Gualtar, Braga, Portugal. 2SilicoLife, Lda, Braga, Portugal.
Received: 3 June 2014 Accepted: 11 December 2014
References1. Suderman M, Hallett M: Tools for visually exploring biological networks.
Bioinformatics 2007, 23(20):2651–2659. Oxford Univ Press.2. Wiback SJ, Famili I, Greenberg HJ, Palsson BØ: Monte Carlo sampling can
be used to determine the size and shape of the steady-state flux space.J Theor Biol 2004, 228(4):437–447. Elsevier.
3. MacNeil LT, Walhout AJ: Gene regulatory networks and the role ofrobustness and stochasticity in the control of gene expression.Genome Res 2011, 21(5):645–657. Cold Spring Harbor Lab.
4. Sauro HM and Kholodenko BN: Quantitative analysis of signalingnetworks. Prog Biophys Mol Bio 2004, 86(1):5–43. ISSN 0079-6107.
5. Gonçalves E, Bucher J, Ryll A, Niklas J, Mauch K, Klamt S, Rocha M,Saez-Rodriguezm J: Bridging the layers: towards integration of signaltransduction, regulation and metabolism into mathematical models.Mol Biosyst 2013, 9(7):1576–1583.
6. Patil KR, Åkesson M, Nielsen J: Use of genome-scale microbial models formetabolic engineering. Curr Opin Biotechnol 2004, 15(1):64–69. Elsevier.
7. Llaneras F, Picó J: Stoichiometric modelling of cell metabolism. J BiosciBioeng 2008, 105(1):1–11. Elsevier.
8. Ostergaard S, Olsson L, Nielsen J: Metabolic engineering of Saccharomycescerevisiae. Microbiol Mol Biol Rev 2000, 64(1):34–50. Am Soc Microbiol.
9. Stephanopoulos G, Aristidou AA, Nielsen J: Metabolic engineering:principles and methodologies. Academic Press, San Diego, CA, USA,1998.
10. Ibarra RU, Edwards JS, Palsson BO: Escherichia coli K-12 undergoesadaptive evolution to achieve in silico predicted optimal growth.Nature 2002, 420:186–189.
11. Rocha I, Maia P, Evangelista P, Vilaça P, Soares S, Pinto J, Nielsen J, Patil K,Ferreira E, Rocha M: OptFlux: an open-source software platform for insilico metabolic engineering. BMC Syst Biol 2010, 4(1):45. BioMedCentral Ltd.
12. Becker SA, Feist AM, Mo ML, Hannum G, Palsson BØ, Herrgard MJ:Quantitative prediction of cellular metabolism with constraint-basedmodels: the COBRA Toolbox. Nat Protoc 2007, 2(3):727–738. NaturePublishing Group.
13. Schellenberger J, Que R, Fleming RM, Thiele I, Orth JD, Feist AM, ZielinskiDC, Bordbar A, Lewis NE, Rahmanian S, Becker SA, Feist AM, Mo ML,Hannum G, Palsson BØ, Herrgard MJ: Quantitative prediction of cellularmetabolism with constraint-based models: the COBRA Toolbox v2.0. NatProtoc 2011, 6(9):1290–1307. Nature Publishing Group.
14. Klamt S, Saez-Rodriguez J, Gilles ED: Structural and functional analysis ofcellular networks with Cell NetAnalyzer. BMC Syst Biol 2007, 1:2.
15. Hoppe A, Homann S, Gerasch A, Gille C, Holzhutter HG: FASIMU: flexiblesoftware for flux-balance computation series in large metabolicnetworks. BMC Bioinformatics 2011, 12(1):28. BioMed Central Ltd.
16. Funahashi A, Morohashi M, Kitano H, Tanimura N: Cell Designer: a processdiagram editor for gene-regulatory and biochemical networks.Biosilico 2003, 1(5):159–162. Elsevier.
17. Funahashi A, Matsuoka Y, Jouraku A, Morohashi M, Kikuchi N, Kitano H:Cell Designer 3.5: a versatile modeling tool for biochemical networks.Proc IEEE 2008, 96(8):1254–1265. IEEE.
18. Cline MS, Smoot M, Cerami E, Kuchinsky A, Landys N, Workman C,Christmas R, Avila-Campilo I, Creech M, Gross B, Hanspers K, Isserlin R, KelleyR, Killcoyne S, Lotia S, Maere S, Morris J, Ono K, Pavlovic V, Pico AR, VailayaA, Wang P-L, Adler A, Conklin BR, Hood L, Kuiper M, Sander C, SchmulevichI, Schwikowski B, Warner GJ, et al: Integration of biological networks andgene expression data using Cytoscape. Nat Protoc 2007, 2(10):2366–2382.Nature Publishing Group.
19. König M, Holtzhünter HG: Fluxviz: cytoscape plug-in for visualization offlux distributions in networks. In Genome Informatics 2010: The 10thAnnual International Workshop on Bioinformatics and Systems Biology (IBSB2010): Kyoto University; 2010. Japan, 26–28 July 2010, 24, page 96. WorldScientific.
20. Junker BH, Klukas C, Schreiber F: VANTED: a system for advanced dataanalysis and visualization in the context of biological networks.BMC Bioinformatics 2006, 7(1):109. BioMed Central Ltd.
21. Kostromins A, Stalidzans E: Paint4Net: COBRA Toolbox extension forvisualization of stoichiometric models of metabolism. Biosystems 2012,109(2):233–239.
22. Jensen PA, Papin JA: MetDraw: automated visualization of genome-scalemetabolic network reconstructions and high-throughput data.Bioinformatics 2014, 30:btt758.
23. Le Novere N, Hucka M, Mi H, Moodie S, Schreiber F, Sorokin A, Demir E,Wegner K, Aladjem MI, Wimalaratne SM, Bergman FT, Gauges R, Ghazal P,Kawaji H, Li L, Matsuoka Y, Villéger A, Boyd SE, Calzone L, Courtot M,Dogrusoz U, Freeman TC, Funahashi A, Ghosh S, Jouraku A, Kim S, KolpakovF, Luna A, Sahle S, Schmidt E, et al: The systems biology graphicalnotation. Nat Biotechnol 2009, 27(8):735–741. Nature Publishing Group.
24. Hucka M, Finney A, Sauro HM, Bolouri H, Doyle JC, Kitano H, Arkin AP,Bornstein BJ, Bray D, Cornish-Bowden A, Cuellar AA, Dronov S, Gilles ED,Ginkel M, Gor V, Goryanin II, Hedley WJ, Hodgman TC, Hofmeyr J-H, HunterPJ, Juty NS, Kasberger JL, Kremling A, Kummer U, Le Novère N, Loew LM,Lucio D, Mendes P, Minch E, Mjolsness ED, et al: The systems biologymarkup language (SBML): a medium for representation and exchange ofbiochemical network models. Bioinformatics 2003, 19(4):524–531.Oxford Univ Press.
25. Dräger A, Rodriguez N, Dumousseau M, Dörr A, Wrzodek C, Le Novère N,Zell A, Hucka M: JSBML: a flexible Java library for working with SBML.Bioinformatics 2011, 27(15):2167–2168. Oxford Univ Press.
26. van Iersel MP, Villéger AC, Czauderna T, Boyd SE, Bergmann FT, Luna A, DemirE, Sorokin A, Dogrusoz U, Matsuoka Y, Funahashi A, Aladjem MI, Mi H, MoodieSL, Kitano H, Le Novère N, Schreiber F: Software support for SBGN maps:SBGN-ML and LibSBGN. Bioinformatics 2012, 28(15):2016–2021.
27. Fruchterman TMJ, Reingold EM: Graph drawing by force-directedplacement. Software Pract Ex 1991, 21(11):1129–1164.
28. Kitano H, Funahashi A, Matsuoka Y, Oda K: Using process diagrams for thegraphical representation of biological networks. Nat Biotechnol 2005,23(8):961–966. Nature Publishing Group.
29. Kanehisa M, Goto S, Sato Y, Furumichi M, Tanabe M: KEGG for integrationand interpretation of large-scale molecular data sets. Nucleic Acids Res2012, 40(1):109–114. Oxford Univ Press.
30. Papin JA, Stelling J, Price ND, Klamt S, Schuster S, Palsson BØ: Comparisonof network-based pathway analysis methods. Trends Biotechnol 2004,22(8):400–405. Elsevier.
31. Lee PC, Lee WG, Lee SY, Chang HN, Chang YK: Fermentativeproduction of succinic acid from glucose and corn steep liquor byAnaerobiospirillum succiniciproducens. Biotechnol Bioproc Eng 2000,5(5):379–381. Springer.
32. Reed JL, Vo TD, Schilling CH, Palsson BØ: An expanded genome-scalemodel of Escherichia coli K-12 (iJR904 GSM/GPR). Genome Biol 2003,4(9):R54.

Noronha et al. BMC Bioinformatics (2014) 15:420 Page 13 of 13
33. Rocha M, Maia P, Mendes R, Pinto JP, Ferreira EC, Nielsen J, Patil KR, Rocha I:Natural computation meta-heuristics for the in silico optimization ofmicrobial strains. BMC Bioinformatics 2008, 9:499.
34. Feist AM, Henry CS, Reed JL, Krummenacker M, Joyce AR, Karp PD,Broadbelt LJ, Hatzimanikatis V, Palsson BØ: A genome-scale metabolicreconstruction for Escherichia coli K-12 MG1655 that accounts for 1260ORFs and thermodynamic information. Mol Syst Biol 2007, 3:121.
Submit your next manuscript to BioMed Centraland take full advantage of:
• Convenient online submission
• Thorough peer review
• No space constraints or color figure charges
• Immediate publication on acceptance
• Inclusion in PubMed, CAS, Scopus and Google Scholar
• Research which is freely available for redistribution
Submit your manuscript at www.biomedcentral.com/submit