shear strengthening of pre-cracked and non pre- cracked reinforced ...
Copyright © 2013 Tech Science Press CMC, vol.33, no.1, pp.87-110, 2013
An Integrated Model for Tension Stiffening andReinforcement Corrosion of RC Flexural Members
Smitha Gopinath1,2, J. Rajasankar1, Nagesh R. Iyer1
A. Rama Chandra Murthy1
Abstract: An integrated model is proposed to describe tension stiffening in re-inforced concrete (RC) flexural members that are undergoing uniform corrosion ofreinforcement. The tension stiffening model is taken as base to incorporate the ef-fects of reinforcement corrosion. The model is developed in two steps. In the firststep, tension stiffening of concrete is modelled using an exponential stress-straincurve defined as function of a decay parameter. Modular ratio and reinforcementratio are considered in the definition of the decay parameter. In the second step,the effects of uniform corrosion of reinforcement are integrated with the tensionstiffening model. For this, fractional reduction in bar diameter is included as an ad-ditional parameter in the model. Later, global damage indicator of a structure is de-fined based on the secant stiffness calculated from its nonlinear load-displacementresponse. Performance of the proposed model is demonstrated through numericalstudies using two RC beams whose details as well as responses are available in lit-erature. Subsequently, the calculated values of damage indicator are shown usefulto quantify reduction in load-carrying capacity of the beams. Based on such quan-tification, effect of assumed corrosion rates of reinforcement bar on capacity lossof the beam is studied in detail.
Keywords: Reinforced concrete structures; Cracking; Tension stiffening; Rein-forcement corrosion; Decay parameter; Global damage indicator
List of Symbols
εsm average strain of embedded reinforcementnb no. of barsAs area of steel
1 CSIR-Structural Engineering Research Centre, CSIR Campus, Taramani, Chennai-600113, India.Telephone: 91-44-22549209; Fax: 91-44-22541508
2 Corresponding author. E-mail: [email protected] , [email protected]

88 Copyright © 2013 Tech Science Press CMC, vol.33, no.1, pp.87-110, 2013
εcm average strain in concreteAc concrete areaNcr cracking loadεicr cracking strainεy strain at which reinforcement yieldsεbc strain in concrete before crackingεac strain in concrete after crackingEcr
c effective modulus of concrete after crackingEse f effective modulus of elasticity of steelEc elastic modulus of concreteEs elastic modulus of steelD0 initial diameter of reinforcing barKinitial initial elastic stiffnessNy tensile load at yield pointf ′c maximum compressive strength of concretefct maximum tensile strength of concreten modular ratio (Es/Ec)β1 parameter for considering bond characteristics of reinforcing barβ2 parameter for considering nature of loadKc secant stiffnessKult secant stiffness at ultimate loadσscr stress in steel at which concrete cracksN tensile forceεcu ultimate strain in concreteks uniform rate of corrosionρ As/Ac
σs stress in steelσct stress in concrete after crackingDn diameter ratiod decay parameterDI Global damage indicatort age in yearsD1 diameter of rebar after corrosion
1 Introduction
Most of the tension stiffening models available in literature assume perfect bond ofreinforcing steel with concrete and modify constitutive relation of either the steelor concrete to evaluate the nonlinear response of a cracked reinforced concrete

An Integrated Model for Tension Stiffening 89
(RC) structure. For example, models proposed by Choi and Cheung (1994), C.E.B.(1990) modify constitutive relation of reinforcing steel whereas models proposedby Lin and Scordelis (1975), Collins and Vecchio (1986), Stevens et al. (1987),Massicote et al. (1990) redefine the constitutive equation of concrete. Some simpletension stiffening models make use of exponential decay curve to describe tensilestress-strain law of cracked concrete (Stramandinoli and Rovere, 2008; Gupta andMaestrini 1990).
Reinforcement corrosion is one of the major influencing factors for performancedegradation of RC structural members (Smitha et al. 2011). Age related degrada-tion of RC structural members due to corrosion causes reduction in tension stiff-ening and affect structural capacity and can also influence failure path of a struc-ture. Several parameters such as gross dimension of member, reinforcement bardiameter, reinforcement ratio, concrete elastic modulus, etc. are known to influ-ence tension stiffening in a member (Stramandinoli and Rovere 2008). Apart fromthis, corrosion of reinforcement also reduces the tension stiffening effect (Otieno etal. 2011). An effective method to numerically evaluate nonlinear response of RCstructural members is by using a suitable tension stiffening model which can alsoincorporate the effects of uniform corrosion of reinforcement.
Corrosion is simply modelled as loss in cross-sectional area of reinforcing bars(Lee et al. 1998, Yoon et al. 2000, Coronelli and Gambarova (2004). To quantifydegradation in structural stiffness due to corrosion, Kraetzig et al. (2000) have useda model proposed, Sarja and Vesikari (1996) to describe the reduction in cross-sectional area of reinforcing bar depending on the rate of corrosion. The modelproposed, Kraetzig et al. (2000) has been found to perform well when local effectof reinforcement corrosion is mapped with global performance of the structure.Local damage and deterioration at material point are mapped onto the structurallevel by means of a damage indicator. Numerical value of damage indicator is usedto identify the state of a structure with respect to its virgin condition or failure.
Investigations have been carried out in the past to show the significance of incorpo-rating corrosion in a tension stiffening model (Shayanfar et al. 2007) Such models,generally, incorporate reinforcement corrosion through modifying bond strengthbased on experimental results (Cabrera 1996, Lee et al. 2002, Chung et al. 2004).Wang and Liu (2004a, 2004b) have proposed a model for bond strength of cor-roded bar in cracked concrete. Models meant for including the effect of corrosionneed use of fictitious elements between concrete and reinforcement to representbond-slip behaviour. Recently, Shayanfer and Safiey (2008) have reaffirmed thattension stiffening models can be a medium to incorporate the effects of corrosionon structural performance. They have further developed a semi-analytical modelfor tension stiffening by including bond-slip behaviour modified as a result of re-

90 Copyright © 2013 Tech Science Press CMC, vol.33, no.1, pp.87-110, 2013
inforcement corrosion. Main advantage of using this model is elimination of thefictitious element between reinforcing bar and neighbouring concrete. Even thoughthe model (Shayanfer and Safiey 2008) shows superior performance compared toother available models, it includes a set of parameters, which are not commonlyused in related literature, to define corrosion rate. Hence scope exists to developa generalized model for nonlinear finite element analysis of RC structural mem-bers by incorporating the combined effects of tension stiffening and reinforcementcorrosion.
In this paper, a combined model is proposed for tension stiffening in RC flexuralmembers by integrating the effects of uniform corrosion in reinforcement. Degra-dation of bond between concrete and reinforcing steel is taken as basis to developthe integrated model. This is conceptually expressed in Figure 1. Developmentof the model is carried out in two steps. In the first step, post-peak segment ofthe stress-strain curve of concrete is proposed as exponentially decaying to accountfor tension stiffening effects. Perfect bond is assumed between concrete and steelwhile developing this model. A decay parameter (d) is defined as a function ofreinforcement ratio (ρ) and modular ratio (n). The stiffening effect of concretebetween the cracks is modelled by relating the tensile load and average strain incracked concrete. Average strain in steel is calculated by making use of suitableexpressions available in Shayanfer and Safiey (2008). As second step of the modeldevelopment, effects of uniform corrosion of reinforcement are incorporated intothe tension stiffening model. Diameter ratio (Dn), which denotes the degree of cor-rosion of the reinforcing bar, is introduced into the model for this purpose. A fifthorder polynomial with coefficients defined using ρ , n and Dn is proposed for thedecay parameter. The resultant stress-strain curve of concrete after incorporatingthe effects of tension stiffening and reinforcement corrosion is defined by using thedecay parameter.
Tension stiffening
Nonlinear response
behaviourDegrades Affects Influences
Reinforcement corrosion
Bond between concrete &
reinforcing steel
Figure 1: Interaction between reinforcement corrosion and tension stiffening
The proposed model is validated by analysing two simply supported RC beams fordifferent corrosion rates. The computed nonlinear responses of the beams are com-pared in relative terms to quantify the effect of uniform corrosion on load carryingcapacity of the structure. Besides this, a global damage indicator is evaluated basedon secant stiffness obtained from the load-deformation response of the beams. To

An Integrated Model for Tension Stiffening 91
the author’s knowledge, the proposed integrated model is first of its kind to inte-grate the effects of tension stiffening with that of reinforcement corrosion to evolvea unified stress-strain curve for concrete.
2 Research Significance
Tension stiffening and reinforcement corrosion are two major phenomena that sig-nificantly influence the nonlinear behaviour of RC flexural members. An integratedmodel is proposed by combing the effects of reinforcement corrosion with that ofthe tension stiffening. The degradation of bond between concrete and reinforc-ing steel is taken as basis to formulate the model. A damage indicator, which isuseful to quantify the reduction in load carrying capacity due to corrosion, is alsoproposed in the paper. Based on such quantification, effect of corrosion rates ofreinforcement bar on capacity loss of the RC flexural members can be studied indetail.
3 Proposed Tension Stiffening Model
Tension stiffening in cracked concrete is modelled by considering a relationshipbetween tensile stress and average strain of reinforcement bar. Tensile stress-straincurve of concrete similar to that reported in C.E.B (1990), (Figure 2) is taken as ba-sis to develop the relation. In Fig. 2, σscr is stress at the instant of concrete crackingand εsm is the average tensile strain in the reinforcing bar. For the stress state in theinitial linear segment up to formation of first crack, the strain in concrete is same asthat in reinforcement. Due to this, tensile force carried by the RC member is sharedby reinforcement and concrete depending on their relative stiffness. For sufficientlyhigh tensile stress (for example, beyond the point A in Figure 2), the RC membercrack intermittently thus inducing differential movement between concrete and re-inforcement. A relationship is developed between the average tensile stress in steel(σs) and average strain in the reinforcement bar to denote the stress state beyondpoint A in Figure 2. The relation is given as
σs = Ese f .εsm (1)
where Ese f is the effective modulus of elasticity of the steel bar as shown in Figure2.
Average tensile strain εsm in reinforcing steel is calculated as (Eurocode 2. 1991).
εsm =σs
Es
[1−β1 β2
(σscr
σs
)2]
(2)

92 Copyright © 2013 Tech Science Press CMC, vol.33, no.1, pp.87-110, 2013
embedded bar
naked bar
contribution of concrete
A
1
0
sefE
s
scr
sAN
sm s
l
N N
2l
2.
2ll
sm
Ten
sile
Str
ess
Mean Tensile Strain
Figure 2: Representation of tension stiffening: Average tensile stress versus tensilestrain
where Es is elastic modulus of reinforcing steel, β1 is bond coefficient that denotesthe bond characteristics (= 1 for ribbed bars and 0.5 for smooth bars), and β2 isa coefficient takes into account the nature of loads (= 1 for short term loads and0.5 for long term or repeated loads). From Eqns. (1) and (2), effective modulus ofelasticity of the steel bar is derived as
Ese f =Es
1−β1β2
(σscrσs
)2 (3)
Referring to Figure 2, the expression for Ese f is valid from point A to ultimate load.
Towards the development of proposed tension stiffening model, concrete under ten-sion is assumed to behave as a linear elastic material when the tensile stress is lessthan the tensile strength. In cracked condition, an exponential decay curve is usedto describe the stress-strain relation to incorporate tension stiffening effect. Basedon Stramandinoli and Rovere (2008), stress in cracked concrete is expressed as
σct = fct e−d(
ε
ε icr
)(4)

An Integrated Model for Tension Stiffening 93
where fct is tensile strength of concrete, εicr is concrete strain corresponding to thetensile strength of concrete and the non-dimensional exponent d is decay parameterwhose value varies from 0 to 1. In elastic range, i.e., in the range OA in Figure 2,equilibrium conditions are invoked to determine the average strain in concrete as
εbc =N
EsAs +EcAc(5)
where εbc is the average strain in concrete before cracking, N is the tensile force inthe reinforcing bar, Ec denotes elastic modulus of concrete before cracking, As isthe area of reinforcement and Ac is the sectional area of concrete.
Average tensile strain in reinforcing bar εsm after point A in Figure 2 is expressedas
εsm =σs
Ese f(6)
Using Eqn. (3),
εsm =σs
Es
[1−β1β2
(σscr
σs
)2]
(7)
where
σs =NAs
(8)
σscr =(1+nρ) fct
ρ(9)
where n is modular ratio and ρ = As/Ac.
Alternatively, tensile strain in cracked concrete is represented as (Stramandinoliand Rovere (2008))
εac =N
EsAs +Ecrc Ac
(10)
where Ecrc is equivalent elastic modulus of concrete in cracked condition, defined
as (Stramandinoli and Rovere (2008))
Ecrc =
σct
εac(11)
By making use of Eqns. (7) to (11), the expression for stress in cracked concrete isderived as
σct =Esρεac
σ2s −−β1β2
[((1+nρ)
ρfct
)]2
[β1β2
[(1+nρ)
ρfct
]2]
(12)

94 Copyright © 2013 Tech Science Press CMC, vol.33, no.1, pp.87-110, 2013
Eqns (4) and (12) give two different expressions for stress in cracked concrete. Themain difference is in respect of the decay parameter ‘d’. Therefore, the objectiveof the present study is to derive an expression for the decay parameter d in termsof other known parameters of the problem. Based on the composition of Eqns. (4)and (12), it is proposed to derive a polynomial for the decay parameter in terms ofthe product of modular ratio and reinforcement ratio. A sufficiently higher orderpolynomial with nρ as variable is considered to satisfy the requirements of a modelfor analysis of RC structural members. It is proposed to simultaneously include theeffects of uniform corrosion of reinforcement into such a polynomial expressionfor the decay parameter.
3.1 Integrated model for tension stiffening and reinforcement corrosion
Reinforcement corrosion affects the bond between concrete and reinforcing steel ina RC structural component and thus influences its nonlinear behaviour as well asload-carrying capacity. Additionally, the bond also influences the tension stiffeningeffects in the nonlinear behaviour of a cracked RC structural component. There-fore, an integrated model is proposed for tension stiffening and uniform corrosionof reinforcement similar to those proposed by Coronelli and Gambarova (2004),Okamura and Maekawa (1991), Maekawa et al. (2003), Auyeung et al. (2000).
The effect of corrosion is considered in the proposed model through reduction in theeffective contact area of the reinforcing steel with concrete. Therefore, the quantumof material loss, which is an indicative parameter for surface area reduction, istaken as the basis to integrate the corrosion effects into the tension stiffening model.Corrosion is defined by uniform rate at which the diameter of a bar reduces withtime using the parameter ks. Accordingly, for an initial diameter of reinforcementbar, D0, and uniform corrosion rate, ks, the reduced bar diameter, D1, after time t,can be written as
D1=(D0-kst) (13)
In Eqn. (13), t is the active period of corrosion. The difference in bar diameteris normalized w.r.t. the original diameter to propose a non-dimensional ‘diameterratio’, Dn,
Dn=(D0−D1)
D0(14)
The diameter ratio physically signifies the level of corrosion and can be used toquantify the reduction in reinforcement bar diameter. As an illustration, nil corro-sion is denoted by ks=0 and Dn=0 while significant corrosion over a long period

An Integrated Model for Tension Stiffening 95
is represented by kst ≈ D0 and Dn ≈ 1. By combining Eqns. (13) and (14), thediameter ratio can be expressed as
Dn=kstD0
(15)
As explained in the previous section, the tension stiffening model is proposed tobe defined as a function of the decay parameter. A polynomial expressed as prod-uct of modular ratio and reinforcement ratio is proposed for the decay parameter.Based on the discussions presented earlier and also the similarity between tensionstiffening and reinforcement corrosion in terms of influencing mechanisms, it isproposed to introduce diameter ratio into the expression for the decay parameter.A number of possible expressions are framed for the decay parameter based onthe condition that reinforcement corrosion reduces tension stiffening effect. On thebasis of extensive studies carried out using these expressions, diameter ratio hasbeen included in the exponent of the polynomial terms of the decay parameter. Asan example, exponent of the mth order term of the polynomial is proposed as m
1-Dn.
Such an expression ensures two basic requirements on the polynomial and diameterratio. These requirements are
1. For nil corrosion, i.e., Dn=0 or in the presence of only the tension stiffeningeffect, the exponent reduces to its base value m.
2. For significant corrosion, i.e., Dn≈ 1, exponents of the polynomial approachinfinity. Because of this, the decay parameter will assume a very large valuewhich corresponds to negligible effect due to tension stiffening.
Next step in the development of model is to propose a polynomial expression whichis applicable over a range of input values for the decay parameter. After a number oftrials, a fifth order polynomial is proposed for the decay parameter, d. The generalform of the polynomial for the decay parameter shall be like
d = c5 (nρ)5
1−Dn + c4 (nρ)4
1−Dn + c3 (nρ)3
1−Dn + c2 (nρ)2
1−Dn + c1 (nρ)1
1−Dn + c0 (16)
where the coefficients c0 to c5 are to be decided on proper basis.
In order to evaluate the value of the coefficients, it is required to know their validrange. In that sense, it is investigated to decide on the range of the variables in-volved with the decay parameter. It is expected that the value of modular ratio, n,can be as high as 10 while using low to medium strength concrete and high strengthreinforcing steel. Along the same lines, maximum value for the reinforcement ratio,is taken as 0.08 (Stramandinoli and Rovere, 2008). Based on these considerations,

96 Copyright © 2013 Tech Science Press CMC, vol.33, no.1, pp.87-110, 2013
it has been decided that the decay parameter expressed in Eqn. (16) has to be validfor a maximum value of n equal to 0.8.
The procedure adopted to evaluate the coefficients is explained in the following:
1. The values of strains in concrete after cracking, εac, are evaluated by usingEqn. (10) for tensile force, N, ranging from Ncr (tensile force carried byconcrete for which it cracks) and Ny (tensile force carried by steel at theinstant of reinforcement yielding).
2. For the strain values, εac, obtained in step i, corresponding stress in crackedconcrete is evaluated by using Eqn. (12).
3. By matching the stress values obtained in step ii, the Eqn. (4) is calibrated tofind the value of d for a large number of closely spaced values of stress andstrain.
4. Stress-strain values of cracked concrete are obtained for different values n.
5. The stress-strain values obtained for each n are used to fit a polynomial whichcan be used in the numerical calculations.
6. As decided in the previous section, the exponents of the polynomial arescaled by the factor (1-Dn) to take into account the effect of uniform cor-rosion in reinforcement.
By following the above procedure, the coefficients of polynomial are evaluated andgiven in Table 1.
Table 1: Value of the coefficients of the polynomial
Coefficient Valuec5c4c3c2c1c0
2.1544-6.46337.3411-3.9841.995-0.657
Therefore, the polynomial for decay parameter shall appear as
d = 2.1544(nρ)5
1−Dn −6.4633(nρ)4
1−Dn +7.3411(nρ)3
1−Dn −3.984(nρ)2
1−Dn +
+1.1995(nρ)1
1−Dn −0.0657

An Integrated Model for Tension Stiffening 97
(17)
Among the different models available for the time-dependent deterioration phe-nomena, the one proposed (Sarja and Vesikari 1996) has been considered to modelthe corrosion effect. This corrosion model is characterized by initiation time t0 anduniform rate ks. In a typical RC structural member, reduction in cross-section ofsteel, As(t), due to corrosion is expressed as
As (t) =nb π (D0− kst)
2
4(18)
where nb is the number of reinforcement bars, Do is the initial diameter of bar, ks isthe corrosion rate and t is the active period of the corrosion which is taken as sameas the age of the structural component.
In the proposed integrated model, the diameter ratio Dn contributes to the effectof corrosion by modifying the tensile stress-strain relationship of concrete throughthe decay parameter. Variation of the decay parameter with n? for different valuesof Dn is plotted in Figure 3. The figure indicates that decay parameter dependsboth on the amount of reinforcement, n?s and level of reinforcement corrosion,Dn.The dependency is, however, found to be more on the amount of reinforcement.As illustration, by ignoring the corrosion effects (i.e., Dn=0), maximum value ofthe decay parameter is found to be about 0.15. For the range of nondimensionalparameter Dn studied, only a marginal increase (approximately 0.025) in the valueof decay parameter is observed. On the other hand, for a section with high rein-forcement (i.e., n?=0.8), the decay parameter value is found to increase from about0.15 for Dn=0 to about 0.25 for Dn=0.16 .
3.2 Evaluation of the proposed model
The proposed integrated model is evaluated against the tension stiffening modelsof Gupta and Maestrini (1990) and C.E.B. (1990), using a RC structural membercontaining reinforcement of n? = 0.2. For simplicity, the evaluation is initially donewithout considering the influence of corrosion. The normalized stress-strain curvesobtained by making use of Eqns. (4) and (14) are shown in Figure 4. In the Figure 4,εy corresponds to a strain in reinforcing bar when the structural member reaches itsultimate load. Further, the tension stiffening curves have been plotted for differentage of the structure for n? = 0.2. It can be observed that for the condition of nilcorrosion, the proposed curve is matches closely with that given by CEB model.It is also very clear from Figure 4 that the model predicts considerable reductionin the tension stiffening in the structural member which will definitely affect theresponse behaviour.

98 Copyright © 2013 Tech Science Press CMC, vol.33, no.1, pp.87-110, 2013
0.00
0.05
0.10
0.15
0.20
0.25
0.30
0 0.1 0.2 0.3 0.4 0.5 0.6 0.7 0.8
d
n
Dn=0
Dn=0.04Dn=0.08
Figure 3: Variation of decay parameter wrt nρ
Figure 4: Comparison of proposed tension stiffening model for n = 0.2

An Integrated Model for Tension Stiffening 99
4 Global Damage Indicator
During service, members of a typical RC structure undergo progressive crackingwhich can be qualitatively described using a damage indicator. Such numericalquantification of damage helps to gain an understanding of the current (or degraded)state of the structure w.r.t. its original state. A simple means to quantify damageis by comparing current value of a derived response quantity with its initial value.Secant stiffness of the structure estimated from the load-deformation response is aglobal parameter that indicates the state of the structure. Any reduction in stiffnesscan be interpreted as a measure of damage due to various reasons which act at locallevel. Within the context of ideal conditions studied using the proposed model,the reasons can be pin-pointed to reinforcement corrosion which reflects throughmodification in the value of decay parameter.
In this background, values of a damage indicator are calculated using the load-deformation response of the example RC structures analysed. The damage indica-tor (DI) is expressed as Kratzig et al. (2000)
DI = 1− Kc
Kinitial(19)
where Kinitial is the initial secant stiffness in the uncracked state, Kc is the currentsecant stiffness at which the damage indicator is to be evaluated. Hence the dam-age indicators represented by Eqn. (19) can be used to study the effect of corrosionat structural level. Both the secant stiffness values are to be calculated from theload-deformation response. When DI=0, the structure is considered to be in theundamaged state. As far as the effect of corrosion is considered, any reduction inreinforcement due to corrosion will eventually lead to decrease in structural stiff-ness. The effect is more pronounced in cracked members where reinforcement isknown to play relatively larger role in deciding the structural response.
5 Numerical Examples
Two example RC beams have been analysed by using the proposed model to tracetheir load-deformation response. Analysis of the first beam is taken as validation ofthe proposed model. Analysing another RC beam serves the objective to gain betterunderstanding of the effect of reinforcement corrosion on static load-deformationresponse and capacity of the beam by using this model. For this, the beam has beenanalysed for different assumed rates of corrosion and the results of different casesare compared relatively.

100 Copyright © 2013 Tech Science Press CMC, vol.33, no.1, pp.87-110, 2013
5.1 Nonlinear response of a RC beam
A RC beam with 2.0 m effective span and simply supported end conditions is anal-ysed for its load-deformation response. The beam has a cross section of 200 mmx 250 mm. Details of the geometry and reinforcement of the beam are shown inFigure 5. The beam has been analysed for two different rates of corrosion for whichit has experimentally been studied by Lee et al. (2000). Two-point loading on thebeam is shown in Figure 5. Concrete and reinforcement properties of the beam asreported (Lee et al. 2000) are available in Table 2. Details of the beam notationused and assumed rates of corrosion are given in Table 3.
(b) Cross-section of the beam (a) Geometry of the beam 3 13
200mm
250
mm
313
2000 mm
P P
750 mm 750mm A B
200mm
500 mm 200mm
Figure 5: Details of RC beam
Table 2: Material Properties of RC beam
Concrete Reinforcementf ′c(MPa) Ec(MPa) fct(MPa) εcu εsu fy(MPa) Es(MPa)
70.1 38500 3.67 0.004 0.15 415.0 2x10⁵
Table 3: Rates of Corrosion in RC beamBeam Notation BCD2 BCD3Dn (%) 7.9 25.3
Longitudinal symmetry of the beam is taken into account in developing the finiteelement model. Accordingly, only half the length of the beam is used in the anal-ysis. The chosen segment of the beam is modelled with 10 quadrilateral multi-layered finite elements. Each finite element is geometrically described by 5 layers

An Integrated Model for Tension Stiffening 101
across thickness, 4 nodes and 5 degrees of freedom (dof) per node. Reinforce-ment is smeared into selected concrete layers. Such a representation is decidedbased on author’s previous experience (Smitha et al. 2009) in analysing similarstructures. The proposed integrated model is implemented as a new material in thenonlinear finite element package FINEART (2006). Analysis is controlled throughdisplacement imposed loading on the beam. Load is continuously applied in smallincrements till instability is encountered in the computation. By this, the completenonlinear load-deformation response of the beam has been captured in the analysis.
Figure 6: Load-deformation behaviour of beam BCD2
Load-deformation response of beam BCD2 (with 7.9% corrosion) is shown in Fig-ure 6. The computed responses are compared with the values reported by Lee et al.(2000) and Shayanfar and Safiey (2008). It is found that, the present model overestimates the ultimate load by about 10%. Load-deformation response indicatesflexible behaviour of the beam compared to experimental observation in the initialpart. This may be due to the not accounting shear reinforcement in the presentwork.
The beam BCD3 which is subjected to 25.3% corrosion showed very good agree-ment in predicting ultimate load. The load-deformation curve obtained for beamBCD3 is shown in Figure 7. The ultimate load predicted by the present modelis found to represent an error of less than 1%. Further, it can be concluded thatas severity of corrosion rate increases, there is considerable reduction in the loadcarrying capacity and ductility of the beam.

102 Copyright © 2013 Tech Science Press CMC, vol.33, no.1, pp.87-110, 2013
Figure 7: Load-deformation behaviour of beam BCD3
5.2 Effect of reinforcement corrosion on performance of a RC beam
Effect of reinforcement corrosion on the nonlinear performance of a RC beam isstudied. The chosen beam is 3.2 m long and has a cross section of 150 mm x 300mm. The beam has been studied experimentally (Smitha et al. 2009) for normalconditions without being interested with the effects of reinforcement corrosion.Measured responses from such an experiment are used initially to verify the pro-posed model. The geometric and reinforcement details of the beam are shown inFigures 8(a) and 8(b). Material properties are listed in Table 4.
150mm
10mm @ 160mm c/c
(b) Cross-section of the beam 3-20mm
300m
m
2-10mm
(a) Geometry of the beam 3.0m
P P
1m 1mA B
Figure 8: Details of beam
Only half the length of the beam has been modelled using 4-noded shell finite ele-ments for analysis. Again, as in previous analysis, each finite element is made upof six concrete layers of equal thickness. Top and bottom reinforcements present

An Integrated Model for Tension Stiffening 103
Table 4: Material properties
Concrete Reinforcementfc′(MPa) Ec(MPa) fct (MPa) εcu fy(MPa) Es(MPa)40.0 31622 4.4 0.0035 415.0 2x10⁵
in the beam are smeared within two of the concrete layers. Nonlinear analysisis carried out by applying incremental load of same magnitude at the two loca-tions shown in Figure 8(a). Nonlinear response of the beam has been obtained fortwo cases, with and without considering the tension stiffening. Comparison of theresponses of these two cases with the experiment will yield information on the ne-cessity for considering the tension stiffening effects in nonlinear analysis. Such acomparison is presented in Figure 9(a). As expected, the beam is found to showflexible behaviour in the case of ignoring the tension stiffening effect. The responseafter including the tension stiffening effects indicate significant improvement andbetter match with measures values both in linear as well as nonlinear regimes. Inabsolute terms, the finite element solution by including tension stiffening effectsrepresents stiff behaviour of the beam compared to the measured solution. Ulti-mate load carrying capacity of the beam is reported as 208 kN from experimentwhile the corresponding value is estimated in the analysis as 212 kN.
After ensuring the appropriateness of the proposed model, the beam has been anal-ysed for assumed condition in which the reinforcement is experiencing uniformcorrosion at the rate of 0.04 mm/year. The assumed corrosion rate typically repre-sents moderate corrosive environment. The beam is considered to be in-service for20, 40, 60 and 80 years in such an environment characterized by uniform corrosion.This ideal condition is assumed only as a representative and in no way limits theapplication of the model. Further, this will perfectly serve the purpose of obtainingrelative performance of the beam. The reduced diameters of the reinforcement barsat the assumed periods are calculated using Eqn. (13) and the corresponding valuesof decay parameter are also evaluated using Eqn. (16). The beam is analysed fornonlinear response under all the cases in similar manner as in the earlier situation.The calculated values of bar diameter and decay parameter are used in the analysis.
The computed responses are compared in Figure 9(b). The comparison clearlypoints out to reduction in ultimate load carrying capacity as well as maximum dis-placement capacity with duration for which the beam is assumed to be affected bycorrosion. Due to 80 years of service in the assumed ideal corrosive conditions, thebeam is seen to exhibit about 40% reduction in ultimate load carrying capacity andabout 30% reduction in maximum displacement capacity.

104 Copyright © 2013 Tech Science Press CMC, vol.33, no.1, pp.87-110, 2013
0
50
100
150
200
250
0 5 10 15 20 25Displacement (mm)
Load
(kN
)
Experiment (Smitha et al., 2009)
Present model - without tension stiffening
Present model - with tension stiffening
(a) with and without incorporating tension stiffening
(b) response curve for different age
Figure 9: Load versus central deflection of the beam
An Integrated Model for Tension Stiffening 105
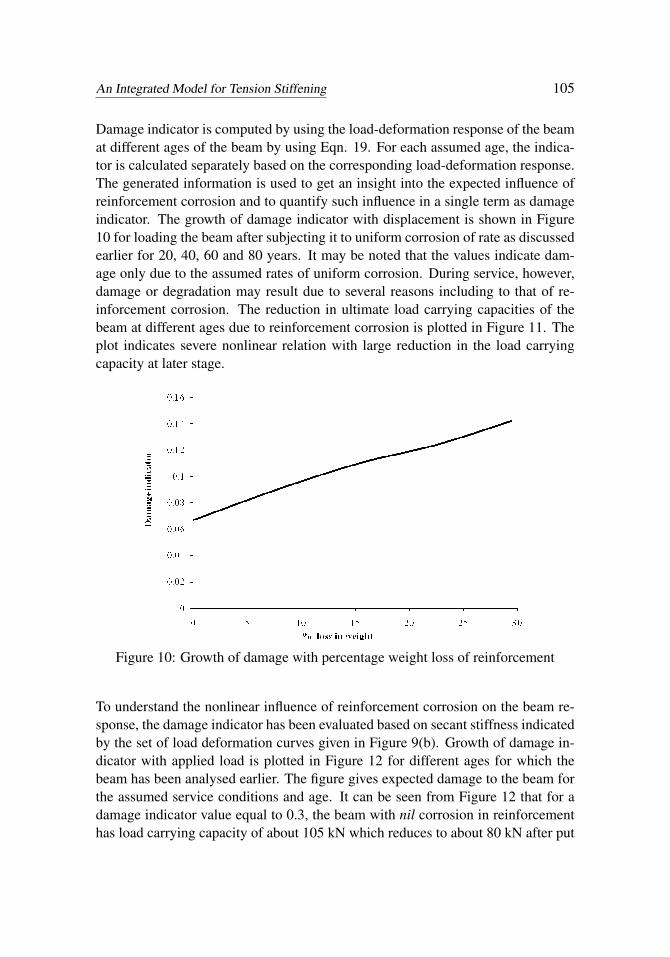
Damage indicator is computed by using the load-deformation response of the beamat different ages of the beam by using Eqn. 19. For each assumed age, the indica-tor is calculated separately based on the corresponding load-deformation response.The generated information is used to get an insight into the expected influence ofreinforcement corrosion and to quantify such influence in a single term as damageindicator. The growth of damage indicator with displacement is shown in Figure10 for loading the beam after subjecting it to uniform corrosion of rate as discussedearlier for 20, 40, 60 and 80 years. It may be noted that the values indicate dam-age only due to the assumed rates of uniform corrosion. During service, however,damage or degradation may result due to several reasons including to that of re-inforcement corrosion. The reduction in ultimate load carrying capacities of thebeam at different ages due to reinforcement corrosion is plotted in Figure 11. Theplot indicates severe nonlinear relation with large reduction in the load carryingcapacity at later stage.
Figure 10: Growth of damage with percentage weight loss of reinforcement
To understand the nonlinear influence of reinforcement corrosion on the beam re-sponse, the damage indicator has been evaluated based on secant stiffness indicatedby the set of load deformation curves given in Figure 9(b). Growth of damage in-dicator with applied load is plotted in Figure 12 for different ages for which thebeam has been analysed earlier. The figure gives expected damage to the beam forthe assumed service conditions and age. It can be seen from Figure 12 that for adamage indicator value equal to 0.3, the beam with nil corrosion in reinforcementhas load carrying capacity of about 105 kN which reduces to about 80 kN after put

106 Copyright © 2013 Tech Science Press CMC, vol.33, no.1, pp.87-110, 2013
Figure 11: Loss of ultimate load carrying capacity with age of the beam
in service for a maximum of 80 years in corroded environment. For intermediateyears of service, the beam shows skewed relation with significant reduction in loadcarrying capacity during the early years of service. The results indicate that max-imum load carrying capacity of the beam is reduced by about 50 kN from a valueof nearly 210 kN (25% reduction) after 80 years of reinforcement corrosion. Theanalysis also indicates that the maximum attainable damage indicator value of thebeam is about 0.58 for 80 year old beam while in case of nil corrosion, the beamcan reach a maximum damage indicator value of 0.62. The results confirm thatthe reinforcement corrosion has significant effect on strength and ductility charac-teristics of RC flexural members. Hence, there is a need to incorporate corrosioneffects in analysis of structures. Further, damage indicator presented in this paper iscapable of giving an indication about the global damage state for a particular loadlevel.
6 Conclusions
A new tension stiffening model to is proposed to account for the effects of corro-sion in nonlinear finite element analysis of RC flexural members. This model fol-lows a simple and generalized approach for determining the influence of corrosion

An Integrated Model for Tension Stiffening 107
Figure 12: Growth of damage indicator with load for different ages
in response behaviour. For this, an exponential decay curve which uses a decayparameter is used to define stress-strain relation of concrete in the post-crackingstage. An expression has been derived for decay parameter based on reinforcementratio, modular ratio and diameter ratio. In contrast to the other tension stiffen-ing models available in literature which incorporates stiffening effect as a singlenumerical number from experiments, proposed model is capable of predicting thetension stiffening effect due to varies reinforcement ratio fractional loss in diameterof bar due to corrosion and modular ratio. The proposed model has been validatedby tracing load-deflection response of RC flexural members for different rate ofcorrosion. It is observed that as rate of corrosion increases, there is considerablereduction in strength as well as ductility characteristics. Further, the effect of cor-rosion on structural capacity as the age of the structure progresses is also studiedin detail using the proposed model. Further, a damage indicator has been arrived atfrom a secant stiffness based approach which helps to map the local deteriorationdue to corrosion on a structural level. From the analysis it is observed that thereis considerable reduction in the load carrying capacity of the structure for differentrate of corrosion. Also, as the age of the structure progresses, the strength as wellas ductility characteristics of a structure get affected due to corrosion. Correlationwith experimental data shows that the proposed analytical model is capable of pro-viding very good estimates on ultimate load and on the response behaviour withcorroding reinforcement.
108 Copyright © 2013 Tech Science Press CMC, vol.33, no.1, pp.87-110, 2013
Acknowledgement: The authors thank their colleague Dr. G.S. Palani for hisvaluable suggestions during the work. This paper is being published with the kindpermission of the Director, CSIR-SERC.
References
Auyeung, Y.; Balaguru, P.; Chung, L. (2000): Bond behaviour of corroded rein-forcement bars. ACI Materials Journal, 97(2), pp. 214-220.
Cabrera, J.G. (1996): Determination of concrete due to reinforcement steel corro-sion. Cement and Concrete Composites., 18(1), pp. 47-59.
Choi, C.K.; Cheung, S.H. (1994): A simplified model for predicting the shearresponse of reinforced concrete membranes. Thin-Walled Structures, 19, pp. 37-60.
Chung, L.; Cho, S.H.; Kim, J.H.J.; Yi, S.T. (2004): Correction factor sugges-tions for ACI development length provisions based on flexural testing of RC slabswith various levels of corroded reinforcing bars. Engineering Structures, 26(8), pp.1013-1026.
C.E.B. (1990): Cracking and deformation, Bulletin d. information No. 158", Paris,France.
Collins, M.P.; Vecchio, F.J. (1986): The modified compression-field theory forreinforced concrete elements subjected to shear. ACI Structural Journal, 83(2), pp.219-31.
Coronelli, D.; Gambarova, P. (2004): Structural assessment of corroded rein-forced concrete beams: Modelling guidelines. Journal of Structural Engineering,ASCE, 130(8), pp.1214-1224.
Eurocode 2. (1991): Design of concrete structures – Part 1-1, General rules andrules for buildings. ENV 1992-1-1, European pre standard.
FINEART. (2006): Finite Element Engineering Analysis Using Adaptive Refine-ment Techniques (with Constituent Modules). User Manual, Version 3.0, ReportNo. CMM20-ST1- SERC-02-06, CSIR-SERC, Chennai, Tamil Nadu, India.
Gupta, A.; Maestrini, S.R. (1990): Tension-stiffness model for reinforced con-crete bars, Journal of Structural Engineering, ASCE, 116 (3), pp.769-91.
Kratzig, W.B.; Petryna, Y.S.; Stangenberg, F. (2000): Measures of Structuraldamage for global failure analysis. International Journal of Solids and structures,37, pp.7393-7407.
Lee, H.S.; Noguchi, T.; Tomosawa, F. (1998): Fundamental study on evaluationof structural performance of reinforced concrete beam damaged by corrosion oflongitudinal tensile main rebar by finite element method. Journal of structural

An Integrated Model for Tension Stiffening 109
Engineering, ACI, 506, pp.45-50.
Lee, H.S.; Noguchi, T.; Tomosawa, F. (2000): Analytical evaluation of struc-tural performance of reinforced concrete beams considering degree of reinforcingbar corrosion. Proceedings of Fourth International Conference on Repair, Reha-bilitation and Maintenance of Concrete Structures and Innovations in design andconstruction, Seoul, Korea, SP 193-46, pp. 779-789.
Lee, H.S.; Noguchi, T.; Tomosawa, F. (2002): Evaluation of the bond propertiesbetween concrete and reinforcement as a function of the degree of reinforcementcorrosion. Cement and Concrete Research, 32(8), pp.1313-1318.
Lin, C.S.; Scordelis, A.C. (1975): Nonlinear analysis of RC shells of general form.Journal of Structural Division, 101(3), pp. 523-38.
Maekawa, K.; Kishi, T.; Ishida, T. (2003): Multiscale modeling of concrete per-formance – Integrated material and structural mechanics. Journal of Advancedconcrete Technology, 1(2), pp. 91-126.
Massicote, B.; Elwi, A.E.; MacGregor, J.G. (1990): Tension stiffening modelfor planar reinforced concrete members. Journal of Structural Engineering, ASCE,106(1), pp.3039-58.
Okamura, H.; Maekawa, K. (1991): Nonlinear analysis and constitutive modelsof reinforced concrete. Gihodo press, Tokyo.
Otieno, M.B.; Beushausen, H.D.; Alexandar, M.G. (2011): Modelling corro-sion propagation in reinforced concrete structures – A critical review. Cement andConcrete Composites, 33, pp.240-245.
Sarja, A.; Vesikari, E. (1996): Durability design of concrete structures. Report ofRILEM Technical committee, 130-CSL. E &FN spon, London.
Shayanfar, M.A.; Ghalehnovi, M.; Safiey, A. (2007): Corrosion effects on ten-sion stiffening behavior of reinforced concrete. Computers and Concrete, 4(5), pp.403-424.
Shayanfar, M.A.; Safiey, A. (2008): A new approach for nonlinear finite elementanalysis of reinforced concrete structures with corroded reinforcement. Computersand Concrete, 5(2), pp.155-174.
Smitha, G.; Rajasankar, J.; Iyer, N.R.; Krishnamoorthy, T.S.; Bharatkumar,B.H.; Lakshmanan, N. (2009): A strain-based constitutive model for concreteunder tension in nonlinear finite element analysis of RC flexural members. Intl.Journal for Structural Durability and Health Monitoring, 5(4), pp.311-336.
Smitha, G.; Rama Chandra Murthy, A.; Iyer, N.R. (2011): Nonlinear finiteelement analysis of RC structures incorporating corrosion effects. Computers Ma-terials and Continua, 22 (1), pp. 55-71.

110 Copyright © 2013 Tech Science Press CMC, vol.33, no.1, pp.87-110, 2013
Stevens, N.J.; Uzumeri, S.M.; Collins, M.P. (1987): Analytical modeling of re-inforced concrete subjected to monotonic and reversed loadings. Report, CanadaUniversity of Toronto, 1987.
Stramandinoli, R.S.B.; Rovere, H.L. (2008): An efficient tension stiffening modelfor nonlinear analysis of reinforced concrete members. Engineering Structures, 30,pp.2069-2080.
Wang, X.; Liu, X. (2004a): Modelling effect of corrosion on cover cracking andbond in reinforced concrete. Magazine of Concrete Research, 56(4), pp.191-199.
Wang, X.; Liu, X. (2004b): Modelling bond strength of corroded reinforcementwithout stirrups. Cement and Concrete Research, 34(8), pp.1331-1339.
Yoon, S.; Wang, K.; Weiss, W.J.; Shah, S.P. (2000): Interaction between loading,corrosion and serviceability of reinforced concrete. ACI Materials Journal, 97(6),pp.637-644.