An integrated genomic approach to dissect the genetic ... · An integrated genomic approach to...
77
An integrated genomic approach to dissect the genetic landscape regulating the cell-to-cell transfer of a-synuclein Eleanna Kara 1,2 , Alessandro Crimi 1,15 , Anne Wiedmer 1,15 , Marc Emmenegger 1,15 , Claudia Manzoni 2, 3 , Sara Bandres-Ciga 4 , Karishma D’Sa 2 , Regina H Reynolds 2 , Juan A Botía 2, 5 , Marco Losa 1 , Veronika Lysenko 6 , Manfredi Carta 1 , Daniel Heinzer 1 , Merve Avar 1 , Andra Chincisan 1 , Cornelis Blauwendraat 4 , Sonia Garcia Ruiz 2 , Daniel Pease 1 , Lorene Mottier 1 , Alessandra Carrella 1 , Dezirae Schneider 1 , Andreia Magalhaes 1 , Caroline Aemisegger 7 , Alexandre P A Theocharides 6 , Zhanyun Fan 8 , Jordan D Marks 8,9 , Sarah C Hopp 8,10 , Patrick Lewis 2, 3 , Mina Ryten 2 , John Hardy 2,11,12,13 , Bradley T Hyman 8 , Adriano Aguzzi* 1,14 1 Institute of Neuropathology, University and University Hospital Zurich, Zurich, 8091, Switzerland 2 Department of Neurodegenerative disease, University College London, London, WC1N 3BG, United Kingdom 3 School of Pharmacy, University of Reading, Reading, RG6 6AP, United Kingdom 4 Laboratory of Neurogenetics, National Institutes of Health, Bethesda, Maryland, 20814, United States 5 Departamento de Ingeniería de la Información y las Comunicaciones, Universidad de Murcia, Murcia, 30100, Spain 6 Department of Medical Oncology and Hematology, University and University Hospital Zurich, Zurich, 8091, Switzerland 7 Center for Microscopy and Image Analysis, University of Zurich, Zurich, 8057, Switzerland 8 Department of Neurology, Harvard Medical School, Boston, MA, 02129, United States 9 Mayo Clinic Alix School of medicine, Rochester, MN, 55905, United States 10 Department of Pharmacology, UT Health San Antonio, San Antonio, 78229, United States 11 UK Dementia Research Institute at UCL and Department of Neurodegenerative Disease, UCL Institute of Neurology, University College London, London, WC1N 3BG, UK 12 Reta Lila Weston Institute, UCL Queen Square Institute of Neurology, 1 Wakefield Street, London WC1N 1PJ, UK 13 Institute for Advanced Study, The Hong Kong University of Science and Technology, Hong Kong SAR, China 14 Lead contact 15 These authors contributed equally . CC-BY-NC-ND 4.0 International license (which was not certified by peer review) is the author/funder. It is made available under a The copyright holder for this preprint this version posted December 23, 2019. . https://doi.org/10.1101/2019.12.23.886838 doi: bioRxiv preprint
Transcript of An integrated genomic approach to dissect the genetic ... · An integrated genomic approach to...

An integrated genomic approach to dissect the genetic landscape regulating the cell-to-cell transfer of
a-synuclein
Eleanna Kara1,2, Alessandro Crimi1,15, Anne Wiedmer1,15, Marc Emmenegger1,15, Claudia Manzoni 2, 3, Sara
Bandres-Ciga4, Karishma D’Sa2, Regina H Reynolds2, Juan A Botía2, 5, Marco Losa 1, Veronika Lysenko6,
Manfredi Carta1, Daniel Heinzer1, Merve Avar1, Andra Chincisan1, Cornelis Blauwendraat4, Sonia Garcia
Ruiz2, Daniel Pease1, Lorene Mottier1, Alessandra Carrella1, Dezirae Schneider1, Andreia Magalhaes1,
Caroline Aemisegger7, Alexandre P A Theocharides6, Zhanyun Fan8, Jordan D Marks8,9, Sarah C Hopp8,10,
Patrick Lewis2, 3, Mina Ryten2, John Hardy 2,11,12,13, Bradley T Hyman8, Adriano Aguzzi*1,14
1Institute of Neuropathology, University and University Hospital Zurich, Zurich, 8091, Switzerland
2Department of Neurodegenerative disease, University College London, London, WC1N 3BG, United
Kingdom
3School of Pharmacy, University of Reading, Reading, RG6 6AP, United Kingdom
4Laboratory of Neurogenetics, National Institutes of Health, Bethesda, Maryland, 20814, United States
5Departamento de Ingeniería de la Información y las Comunicaciones, Universidad de Murcia, Murcia,
30100, Spain
6Department of Medical Oncology and Hematology, University and University Hospital Zurich, Zurich, 8091, Switzerland
7Center for Microscopy and Image Analysis, University of Zurich, Zurich, 8057, Switzerland
8Department of Neurology, Harvard Medical School, Boston, MA, 02129, United States
9Mayo Clinic Alix School of medicine, Rochester, MN, 55905, United States
10Department of Pharmacology, UT Health San Antonio, San Antonio, 78229, United States
11UK Dementia Research Institute at UCL and Department of Neurodegenerative Disease, UCL Institute
of Neurology, University College London, London, WC1N 3BG, UK
12Reta Lila Weston Institute, UCL Queen Square Institute of Neurology, 1 Wakefield Street, London
WC1N 1PJ, UK
13Institute for Advanced Study, The Hong Kong University of Science and Technology, Hong Kong SAR,
China
14Lead contact
15These authors contributed equally
.CC-BY-NC-ND 4.0 International license(which was not certified by peer review) is the author/funder. It is made available under aThe copyright holder for this preprintthis version posted December 23, 2019. . https://doi.org/10.1101/2019.12.23.886838doi: bioRxiv preprint
*Corresponding author and lead contact: Adriano Aguzzi, [email protected] , Institute of
Neuropathology, University of Zurich, Schmelzbergstrasse 12, CH-8091 Zurich, Switzerland
Summary
Neuropathological and experimental evidence suggests that the cell-to-cell transfer of a-synuclein has
an important role in the pathogenesis of Parkinson’s disease (PD). However, the mechanism underlying
this phenomenon is not fully understood. We undertook an siRNA, genome-wide high throughput
screen to identify genes regulating the cell-to-cell transfer of a-synuclein. We transiently transfected
HEK cells stably overexpressing a-synuclein with a construct encoding GFP-2a-aSynuclein-RFP. The cells
expressing a-synuclein-RFP through transfection were double positive for GFP and RFP fluorescence,
whereas the cells receiving it through transfer were positive only for RFP fluorescence. The amount of a-
synuclein transfer was quantified by high content microscopy. A series of unbiased screens confirmed
the involvement of 38 genes in the regulation of a-synuclein-RFP transfer. One of those hits was ITGA8,
a candidate gene recently identified through a large PD genome wide association study (GWAS).
Weighted gene co-expression network analysis (WGCNA) and weighted protein-protein network
interaction analysis (WPPNIA) showed that the hits clustered in networks that included known PD
Mendelian and GWAS risk genes more frequently than expected than random chance. Given the genetic
overlap between a-synuclein transfer and PD, those findings provide supporting evidence for the
importance of the cell-to-cell transfer of a-synuclein in the pathogenesis of PD, and expand our
understanding of the mechanism of a-synuclein spread.
Keywords: a-synuclein, high throughput screen, siRNA, GWAS, weighted gene co-expression network
analysis, weighted protein-protein network interaction analysis, Braak hypothesis, ITGA8
Introduction
The cell-to-cell transfer of a-synuclein is thought to be an important event in the pathogenesis of
Parkinson’s disease (PD). The first evidence suggesting a possible role of this phenomenon came from
post mortem analyses of brains from patients with PD who had received neuronal grafts in the midbrain,
and showed that those healthy neurons had developed Lewy bodies (Kordower et al., 2008; Li et al.,
2008). In addition, patients with PD develop a-synuclein pathology in the brain that follows a consistent
pattern starting from the brain stem and olfactory bulb and moving up to the cortex (Braak et al., 2003),
which is consistent with the spread of an “agent” that is thought to be misfolded a-synuclein. Those
observations have been supported by experimental evidence generated through studies on mouse
models and tissue culture systems (Luk et al., 2016; Luk et al., 2012; Luk and Lee, 2014; Luk et al., 2009;
Rey et al., 2018; Rey et al., 2016; Thakur et al., 2017; Volpicelli-Daley et al., 2014; Volpicelli-Daley et al.,
2011). However, despite the accumulation of evidence supporting the fact that a-synuclein spread does
occur, the importance of this phenomenon in the pathogenesis of PD remains controversial. A
substantial proportion of PD cases do not follow the Braak staging, and the severity of the clinical
.CC-BY-NC-ND 4.0 International license(which was not certified by peer review) is the author/funder. It is made available under aThe copyright holder for this preprintthis version posted December 23, 2019. . https://doi.org/10.1101/2019.12.23.886838doi: bioRxiv preprint
presentation often does not correlate with the Braak stage (Surmeier et al., 2017). Therefore, an
alternative model that has been suggested is the selective vulnerability hypothesis, according to which
the progressive development of pathology is not because of the spread of a pathogenic species of a-
synuclein, but because of the differential vulnerability of various brain regions to the disease process
(Alegre-Abarrategui et al., 2019; Fu et al., 2018; Hardy, 2016).
The mechanism of cell-to-cell transfer of a-synuclein is incompletely understood. The species of a-
synuclein that undergoes transfer, along with the mechanism of the transfer, are unknown. Until
recently, it had been thought that the fibrillar form of a-synuclein undergoes cell-to-cell transfer in the
disease, and it is capable of inducing seeding and misfolding of the endogenous a-synuclein (Aguzzi et
al., 2007; Aguzzi and Rajendran, 2009; Guo and Lee, 2014). However, recent evidence has challenged
this hypothesis. It has been shown that oligomeric and monomeric a-synuclein can also undergo transfer
and induce the formation of pathology after intracerebral injections in mice through mechanisms other
than seeding of endogenous template (Rey et al., 2013; Sacino et al., 2013). Cell-to-cell transfer can also
occur without the presence of endogenous template (in the case of tau, another protein whose behavior
is thought to be similar to that of a-synuclein) (Wegmann et al., 2015) and can cross species barriers (Luk
et al., 2012), therefore suggesting a clear separation between true prions and prionoids.
Therefore, there are several critical questions regarding the spread of a-synuclein. First, what are the
genetic underpinnings and mechanisms underlying the a-synuclein spread, do those relate to known
genetic causes of PD, and if yes, how? Second, what is the importance of this phenomenon in the
pathogenesis of PD?
To address those questions, we performed a high throughput, siRNA genome-wide screen to find genes
regulating the cell-to-cell transfer of a-synuclein. Given the uncertainty regarding the nature of the
transferred species of a-synuclein, we used a novel genetically encoded reporter to identify the cells
that received the transferred a-synuclein, which does not make any assumptions regarding the
aggregation state of the transferred protein. The screen identified 38 genes regulating this process, one
of which was ITGA8, a PD risk gene recently identified through GWAS (Nalls et al., 2019). Genes involved
in cell signaling, protein transport and protein catabolism, among others, were enriched within the
cohort. Weighted gene coexpression network analysis (WGCNA) and weighted protein-protein network
interaction analysis (WPPNIA) showed a significant overlap between the networks formed by the 38
genes and the networks formed by PD Mendelian and risk genes. Collectively, those findings provide
insight into the mechanisms regulating the cell-to-cell transfer of a-synuclein. Our findings also suggest
an overlap between the molecular underpinnings of a-synuclein transfer and the genetic causes of PD,
indicating that the cell-to-cell transfer of a-synuclein probably has a crucial role in the pathogenesis of
PD.
.CC-BY-NC-ND 4.0 International license(which was not certified by peer review) is the author/funder. It is made available under aThe copyright holder for this preprintthis version posted December 23, 2019. . https://doi.org/10.1101/2019.12.23.886838doi: bioRxiv preprint
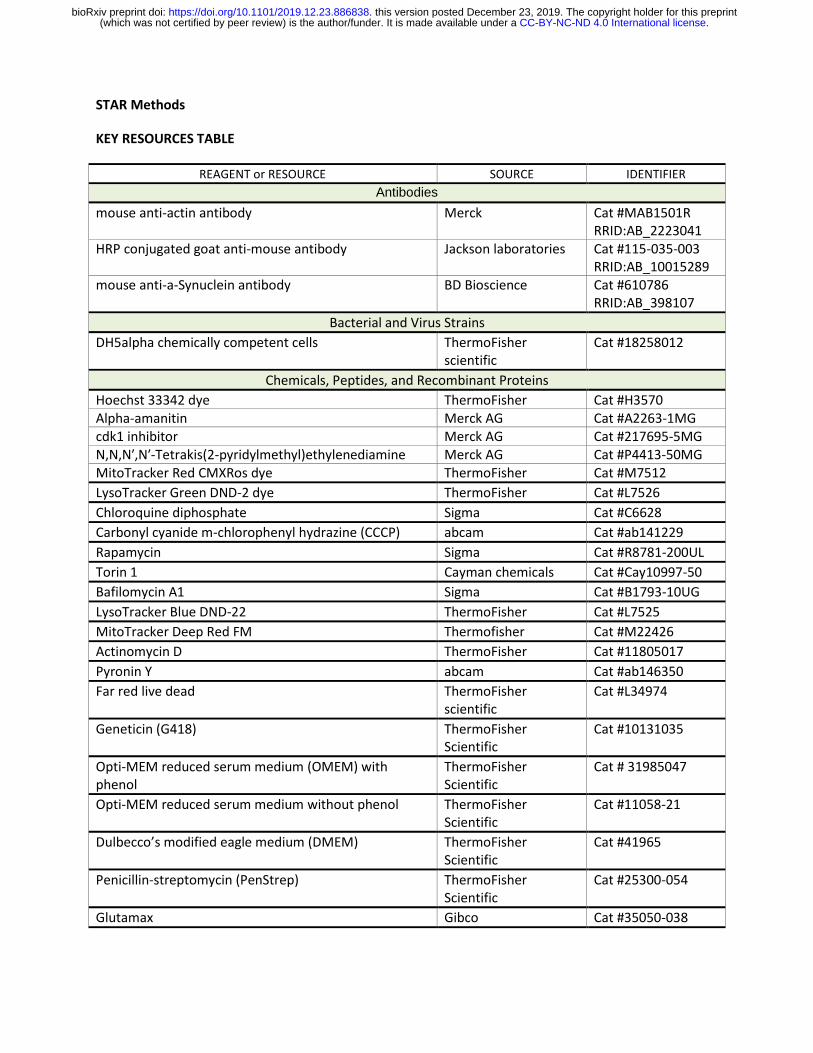
STAR Methods
KEY RESOURCES TABLE
REAGENT or RESOURCE SOURCE IDENTIFIER
Antibodies
mouse anti-actin antibody Merck Cat #MAB1501R RRID:AB_2223041
HRP conjugated goat anti-mouse antibody Jackson laboratories Cat #115-035-003 RRID:AB_10015289
mouse anti-a-Synuclein antibody BD Bioscience Cat #610786 RRID:AB_398107
Bacterial and Virus Strains
DH5alpha chemically competent cells ThermoFisher scientific
Cat #18258012
Chemicals, Peptides, and Recombinant Proteins
Hoechst 33342 dye ThermoFisher Cat #H3570 Alpha-amanitin Merck AG Cat #A2263-1MG cdk1 inhibitor Merck AG Cat #217695-5MG N,N,N′,N′-Tetrakis(2-pyridylmethyl)ethylenediamine Merck AG Cat #P4413-50MG MitoTracker Red CMXRos dye ThermoFisher Cat #M7512
LysoTracker Green DND-2 dye ThermoFisher Cat #L7526
Chloroquine diphosphate Sigma Cat #C6628
Carbonyl cyanide m-chlorophenyl hydrazine (CCCP) abcam Cat #ab141229
Rapamycin Sigma Cat #R8781-200UL
Torin 1 Cayman chemicals Cat #Cay10997-50
Bafilomycin A1 Sigma Cat #B1793-10UG
LysoTracker Blue DND-22 ThermoFisher Cat #L7525
MitoTracker Deep Red FM Thermofisher Cat #M22426
Actinomycin D ThermoFisher Cat #11805017
Pyronin Y abcam Cat #ab146350
Far red live dead ThermoFisher scientific
Cat #L34974
Geneticin (G418) ThermoFisher Scientific
Cat #10131035
Opti-MEM reduced serum medium (OMEM) with phenol
ThermoFisher Scientific
Cat # 31985047
Opti-MEM reduced serum medium without phenol ThermoFisher Scientific
Cat #11058-21
Dulbecco’s modified eagle medium (DMEM) ThermoFisher Scientific
Cat #41965
Penicillin-streptomycin (PenStrep) ThermoFisher Scientific
Cat #25300-054
Glutamax Gibco Cat #35050-038
.CC-BY-NC-ND 4.0 International license(which was not certified by peer review) is the author/funder. It is made available under aThe copyright holder for this preprintthis version posted December 23, 2019. . https://doi.org/10.1101/2019.12.23.886838doi: bioRxiv preprint
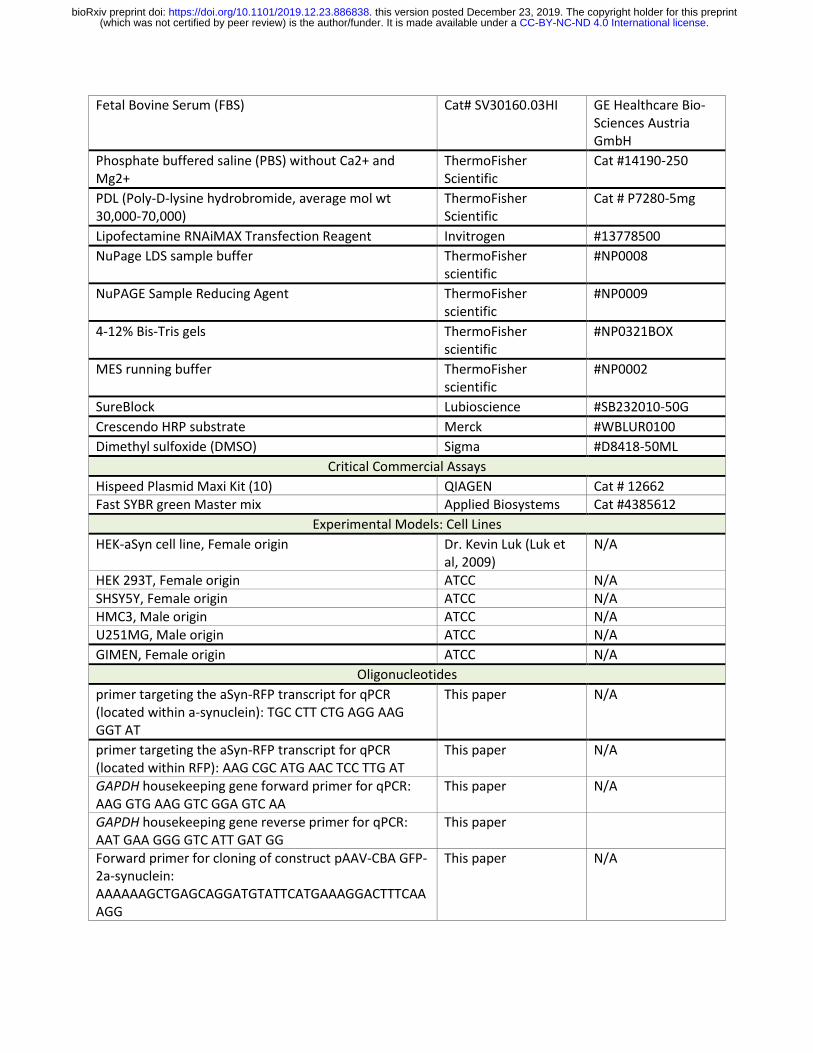
Fetal Bovine Serum (FBS) Cat# SV30160.03HI GE Healthcare Bio-Sciences Austria GmbH
Phosphate buffered saline (PBS) without Ca2+ and Mg2+
ThermoFisher Scientific
Cat #14190-250
PDL (Poly-D-lysine hydrobromide, average mol wt 30,000-70,000)
ThermoFisher Scientific
Cat # P7280-5mg
Lipofectamine RNAiMAX Transfection Reagent Invitrogen #13778500
NuPage LDS sample buffer ThermoFisher scientific
#NP0008
NuPAGE Sample Reducing Agent ThermoFisher scientific
#NP0009
4-12% Bis-Tris gels ThermoFisher scientific
#NP0321BOX
MES running buffer ThermoFisher scientific
#NP0002
SureBlock Lubioscience #SB232010-50G
Crescendo HRP substrate Merck #WBLUR0100
Dimethyl sulfoxide (DMSO) Sigma #D8418-50ML
Critical Commercial Assays
Hispeed Plasmid Maxi Kit (10) QIAGEN Cat # 12662 Fast SYBR green Master mix Applied Biosystems Cat #4385612
Experimental Models: Cell Lines
HEK-aSyn cell line, Female origin Dr. Kevin Luk (Luk et al, 2009)
N/A
HEK 293T, Female origin ATCC N/A SHSY5Y, Female origin ATCC N/A HMC3, Male origin ATCC N/A U251MG, Male origin ATCC N/A
GIMEN, Female origin ATCC N/A
Oligonucleotides
primer targeting the aSyn-RFP transcript for qPCR (located within a-synuclein): TGC CTT CTG AGG AAG GGT AT
This paper N/A
primer targeting the aSyn-RFP transcript for qPCR (located within RFP): AAG CGC ATG AAC TCC TTG AT
This paper N/A
GAPDH housekeeping gene forward primer for qPCR: AAG GTG AAG GTC GGA GTC AA
This paper N/A
GAPDH housekeeping gene reverse primer for qPCR: AAT GAA GGG GTC ATT GAT GG
This paper
Forward primer for cloning of construct pAAV-CBA GFP-2a-synuclein: AAAAAAGCTGAGCAGGATGTATTCATGAAAGGACTTTCAAAGG
This paper N/A
.CC-BY-NC-ND 4.0 International license(which was not certified by peer review) is the author/funder. It is made available under aThe copyright holder for this preprintthis version posted December 23, 2019. . https://doi.org/10.1101/2019.12.23.886838doi: bioRxiv preprint
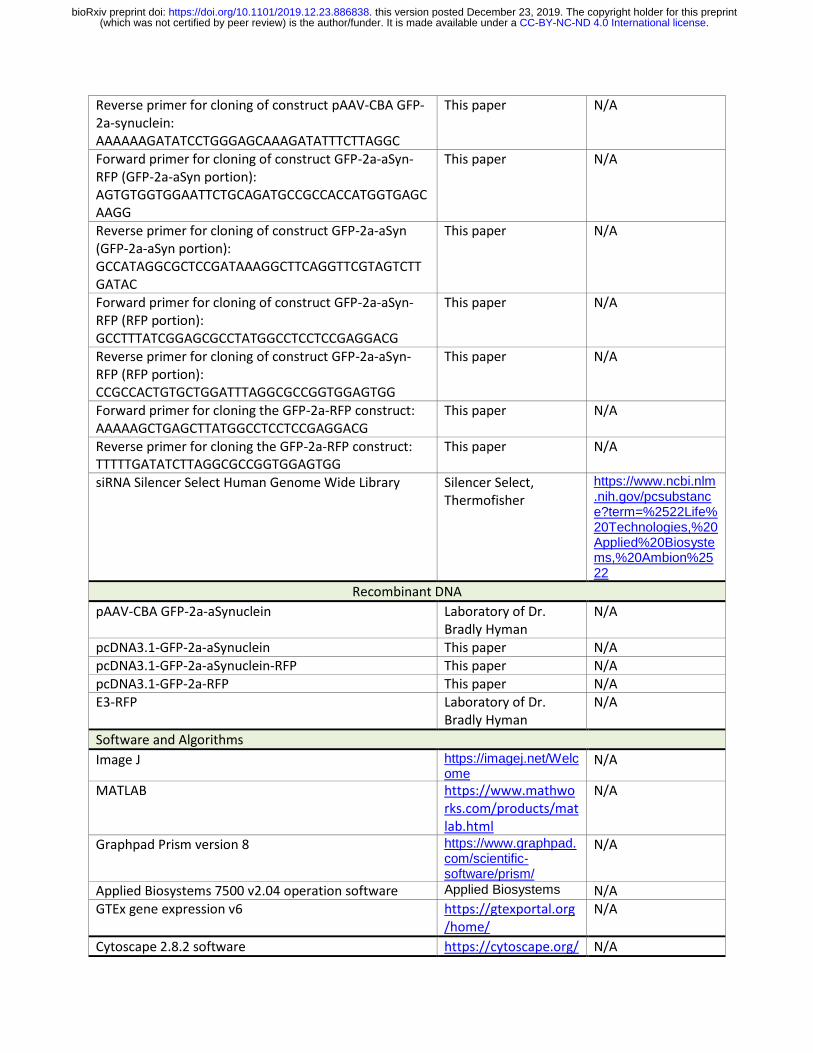
Reverse primer for cloning of construct pAAV-CBA GFP-2a-synuclein: AAAAAAGATATCCTGGGAGCAAAGATATTTCTTAGGC
This paper N/A
Forward primer for cloning of construct GFP-2a-aSyn-RFP (GFP-2a-aSyn portion): AGTGTGGTGGAATTCTGCAGATGCCGCCACCATGGTGAGCAAGG
This paper N/A
Reverse primer for cloning of construct GFP-2a-aSyn (GFP-2a-aSyn portion): GCCATAGGCGCTCCGATAAAGGCTTCAGGTTCGTAGTCTTGATAC
This paper N/A
Forward primer for cloning of construct GFP-2a-aSyn-RFP (RFP portion): GCCTTTATCGGAGCGCCTATGGCCTCCTCCGAGGACG
This paper N/A
Reverse primer for cloning of construct GFP-2a-aSyn-RFP (RFP portion): CCGCCACTGTGCTGGATTTAGGCGCCGGTGGAGTGG
This paper N/A
Forward primer for cloning the GFP-2a-RFP construct: AAAAAGCTGAGCTTATGGCCTCCTCCGAGGACG
This paper N/A
Reverse primer for cloning the GFP-2a-RFP construct: TTTTTGATATCTTAGGCGCCGGTGGAGTGG
This paper N/A
siRNA Silencer Select Human Genome Wide Library Silencer Select, Thermofisher
https://www.ncbi.nlm.nih.gov/pcsubstance?term=%2522Life%20Technologies,%20Applied%20Biosystems,%20Ambion%2522
Recombinant DNA
pAAV-CBA GFP-2a-aSynuclein Laboratory of Dr. Bradly Hyman
N/A
pcDNA3.1-GFP-2a-aSynuclein This paper N/A pcDNA3.1-GFP-2a-aSynuclein-RFP This paper N/A pcDNA3.1-GFP-2a-RFP This paper N/A E3-RFP Laboratory of Dr.
Bradly Hyman N/A
Software and Algorithms
Image J https://imagej.net/Welcome
N/A
MATLAB https://www.mathworks.com/products/matlab.html
N/A
Graphpad Prism version 8 https://www.graphpad.com/scientific-software/prism/
N/A
Applied Biosystems 7500 v2.04 operation software Applied Biosystems N/A GTEx gene expression v6 https://gtexportal.org
/home/ N/A
Cytoscape 2.8.2 software https://cytoscape.org/ N/A
.CC-BY-NC-ND 4.0 International license(which was not certified by peer review) is the author/funder. It is made available under aThe copyright holder for this preprintthis version posted December 23, 2019. . https://doi.org/10.1101/2019.12.23.886838doi: bioRxiv preprint
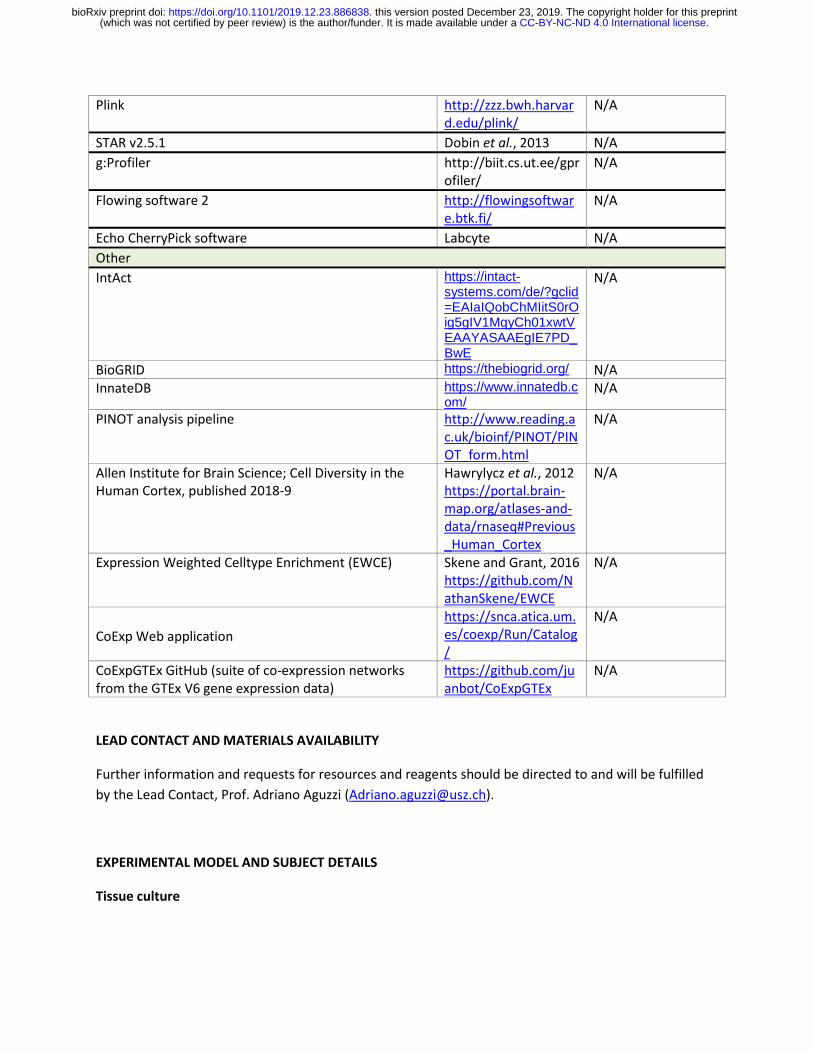
Plink http://zzz.bwh.harvard.edu/plink/
N/A
STAR v2.5.1 Dobin et al., 2013 N/A
g:Profiler http://biit.cs.ut.ee/gprofiler/
N/A
Flowing software 2 http://flowingsoftware.btk.fi/
N/A
Echo CherryPick software Labcyte N/A
Other
IntAct https://intact-systems.com/de/?gclid=EAIaIQobChMIitS0rOig5gIV1MqyCh01xwtVEAAYASAAEgIE7PD_BwE
N/A
BioGRID https://thebiogrid.org/ N/A InnateDB https://www.innatedb.c
om/ N/A
PINOT analysis pipeline http://www.reading.ac.uk/bioinf/PINOT/PINOT_form.html
N/A
Allen Institute for Brain Science; Cell Diversity in the Human Cortex, published 2018-9
Hawrylycz et al., 2012 https://portal.brain-map.org/atlases-and-data/rnaseq#Previous_Human_Cortex
N/A
Expression Weighted Celltype Enrichment (EWCE) Skene and Grant, 2016 https://github.com/NathanSkene/EWCE
N/A
CoExp Web application
https://snca.atica.um.es/coexp/Run/Catalog/
N/A
CoExpGTEx GitHub (suite of co-expression networks from the GTEx V6 gene expression data)
https://github.com/juanbot/CoExpGTEx
N/A
LEAD CONTACT AND MATERIALS AVAILABILITY
Further information and requests for resources and reagents should be directed to and will be fulfilled
by the Lead Contact, Prof. Adriano Aguzzi ([email protected]).
EXPERIMENTAL MODEL AND SUBJECT DETAILS
Tissue culture
.CC-BY-NC-ND 4.0 International license(which was not certified by peer review) is the author/funder. It is made available under aThe copyright holder for this preprintthis version posted December 23, 2019. . https://doi.org/10.1101/2019.12.23.886838doi: bioRxiv preprint
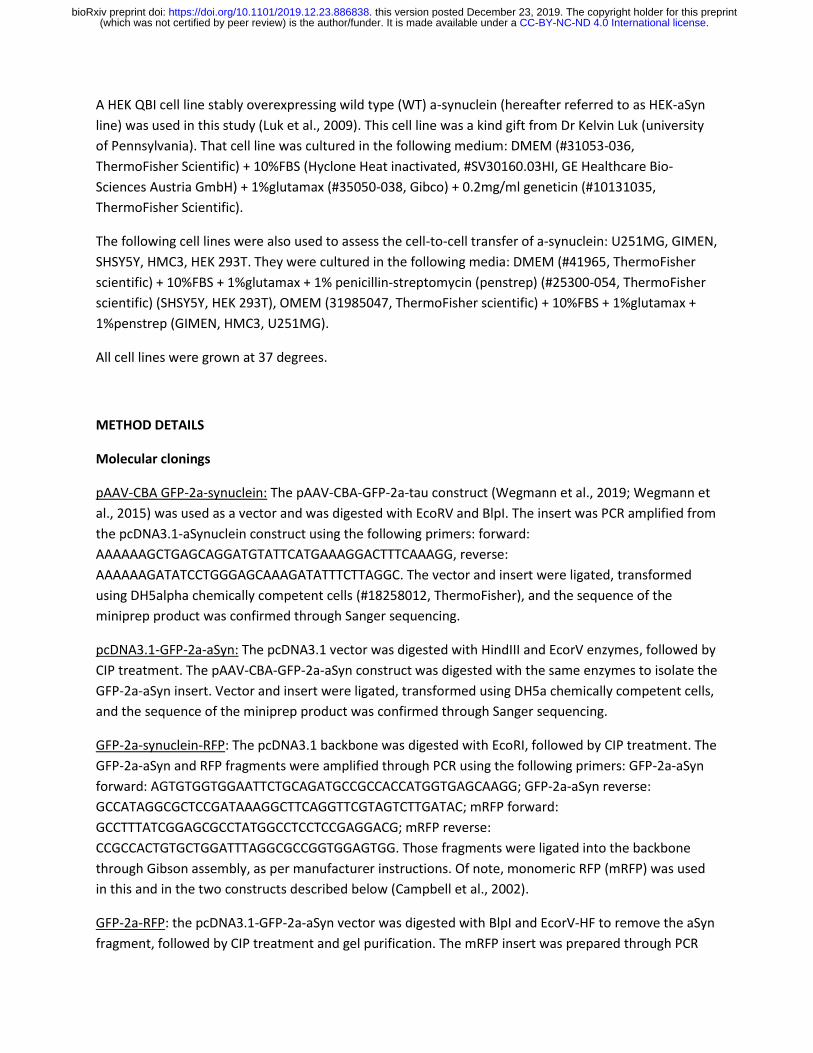
A HEK QBI cell line stably overexpressing wild type (WT) a-synuclein (hereafter referred to as HEK-aSyn
line) was used in this study (Luk et al., 2009). This cell line was a kind gift from Dr Kelvin Luk (university
of Pennsylvania). That cell line was cultured in the following medium: DMEM (#31053-036,
ThermoFisher Scientific) + 10%FBS (Hyclone Heat inactivated, #SV30160.03HI, GE Healthcare Bio-
Sciences Austria GmbH) + 1%glutamax (#35050-038, Gibco) + 0.2mg/ml geneticin (#10131035,
ThermoFisher Scientific).
The following cell lines were also used to assess the cell-to-cell transfer of a-synuclein: U251MG, GIMEN,
SHSY5Y, HMC3, HEK 293T. They were cultured in the following media: DMEM (#41965, ThermoFisher
scientific) + 10%FBS + 1%glutamax + 1% penicillin-streptomycin (penstrep) (#25300-054, ThermoFisher
scientific) (SHSY5Y, HEK 293T), OMEM (31985047, ThermoFisher scientific) + 10%FBS + 1%glutamax +
1%penstrep (GIMEN, HMC3, U251MG).
All cell lines were grown at 37 degrees.
METHOD DETAILS
Molecular clonings
pAAV-CBA GFP-2a-synuclein: The pAAV-CBA-GFP-2a-tau construct (Wegmann et al., 2019; Wegmann et
al., 2015) was used as a vector and was digested with EcoRV and BlpI. The insert was PCR amplified from
the pcDNA3.1-aSynuclein construct using the following primers: forward:
AAAAAAGCTGAGCAGGATGTATTCATGAAAGGACTTTCAAAGG, reverse:
AAAAAAGATATCCTGGGAGCAAAGATATTTCTTAGGC. The vector and insert were ligated, transformed
using DH5alpha chemically competent cells (#18258012, ThermoFisher), and the sequence of the
miniprep product was confirmed through Sanger sequencing.
pcDNA3.1-GFP-2a-aSyn: The pcDNA3.1 vector was digested with HindIII and EcorV enzymes, followed by
CIP treatment. The pAAV-CBA-GFP-2a-aSyn construct was digested with the same enzymes to isolate the
GFP-2a-aSyn insert. Vector and insert were ligated, transformed using DH5a chemically competent cells,
and the sequence of the miniprep product was confirmed through Sanger sequencing.
GFP-2a-synuclein-RFP: The pcDNA3.1 backbone was digested with EcoRI, followed by CIP treatment. The
GFP-2a-aSyn and RFP fragments were amplified through PCR using the following primers: GFP-2a-aSyn
forward: AGTGTGGTGGAATTCTGCAGATGCCGCCACCATGGTGAGCAAGG; GFP-2a-aSyn reverse:
GCCATAGGCGCTCCGATAAAGGCTTCAGGTTCGTAGTCTTGATAC; mRFP forward:
GCCTTTATCGGAGCGCCTATGGCCTCCTCCGAGGACG; mRFP reverse:
CCGCCACTGTGCTGGATTTAGGCGCCGGTGGAGTGG. Those fragments were ligated into the backbone
through Gibson assembly, as per manufacturer instructions. Of note, monomeric RFP (mRFP) was used
in this and in the two constructs described below (Campbell et al., 2002).
GFP-2a-RFP: the pcDNA3.1-GFP-2a-aSyn vector was digested with BlpI and EcorV-HF to remove the aSyn
fragment, followed by CIP treatment and gel purification. The mRFP insert was prepared through PCR
.CC-BY-NC-ND 4.0 International license(which was not certified by peer review) is the author/funder. It is made available under aThe copyright holder for this preprintthis version posted December 23, 2019. . https://doi.org/10.1101/2019.12.23.886838doi: bioRxiv preprint
amplification using pcDNA3.1-GFP-2a-aSyn-RFP as a template and the following primers: forward:
AAAAAGCTGAGCTTATGGCCTCCTCCGAGGACG, reverse: TTTTTGATATCTTAGGCGCCGGTGGAGTGG. The
digested vector and insert were ligated and transformed with DH5a chemically competent cells. The
sequence of the miniprep products was confirmed through Sanger sequencing.
The cloning of the E3-RFP construct has been previously described (Kara et al., 2017; Kara et al., 2018).
All maxipreps were done using the Hispeed plasmid Maxi Kit (#12662, Qiagen).
Flow cytometric assay to quantify the cell-to-cell transfer of a-synuclein
The HEK-aSyn cells were plated in 6 well plates at a density of 870 cells/ul. For the experiment where
siRNAs were co-transfected with the constructs, the cells were plated in 24 well plates at a density of
870 cells/ul. 48h later, the cells were transfected with the GFP-2a-aSyn-RFP or the GFP-2a-RFP
constructs, plus the siRNAs, as applicable. As single color controls for flow cytometry, the E3-RFP and
GFP-2a-aSyn constructs were used. Before transfection, the medium in the 6 well plates was replaced
with pure OMEM without phenol (#11058-21, ThermoFisher Scientific) by adding 1ml per well. The
medium in the 24 well plates was replaced with the following medium, 440ul per well: pure OMEM
without phenol plus 10%FBS plus 1%penstrep. For the transfection in 6 well plate format, 2 tubes were
prepared, with the following amounts per well: One tube containing 150ul of pure OMEM without
phenol plus 3ug of construct, and one tube containing 150ul of pure OMEM plus 9ul of RNAiMax
(#13778500, Invitrogen). After 5min of incubation at room temperature, the contents of the tubes were
mixed and 300ul of the mix was added per well. For the transfections in 24 well plate format, the
following 2 tubes were prepared per well: One tube containing 30ul of pure OMEM plus 0.4ug of
construct plus 0.5ul of stock siRNA solution with a concentration of 5uM, and a second tube containing
30ul of pure OMEM plus 1.8ul of RNAiMax. The final concentration of the siRNA in the tissue culture
medium after addition to the cells was 5nM. After 5min of incubation at room temperature, the
contents of the tubes were mixed and 60ul of the mix was added per well. 24h after transfection, the
medium in the 6 well plates was replaced with the regular growth medium mentioned above. The
medium in the 24 well plates was not replaced after transfection. On the 5th day after transfection,
where applicable, Hoechst 33342 dye (#H3570, ThermoFisher) was added to PBS -/- (#14190-250,
ThermoFisher Scientific) at a dilution of 1:2000. The medium was aspirated from the cells and was
replaced with equal volume of the diluted Hoechst staining solution, followed by incubation at 37
degrees in the dark. The staining solution was then aspirated. At the same time, the medium from all
wells that were not treated with Hoechst was also aspirated. The cells were washed with PBS -/-, trypsin
was added and incubated at 37 degrees for 3min, regular growth medium (containing FBS) was added to
inactivate trypsin, the cells were pipetted up and down to detach from the well and transferred to
sterile eppendorf tubes, centrifuged at 1500rpm for 7min, and the supernatant was aspirated. At that
point, the samples that required staining with far red live dead (#L34974, ThermoFisher scientific) were
treated as follows: the stock live dead stain was reconstituted in 50ul of Dimethyl sulfoxide (DMSO) and
diluted 1:1000 in PBS-/-. The pelleted cells were resuspended in 1000ul of that solution and incubated at
.CC-BY-NC-ND 4.0 International license(which was not certified by peer review) is the author/funder. It is made available under aThe copyright holder for this preprintthis version posted December 23, 2019. . https://doi.org/10.1101/2019.12.23.886838doi: bioRxiv preprint
room temperature, in the dark, for 30min. The samples were then centrifuged at 1500rpm for 7min. At
that point, 500ul of 2% Paraformaldehyde (PFA) (in PBS-/-) was added to the cell pellet of all samples
processed. The samples were stored at 4 degrees in the dark until analysis by flow cytometry.
Cells stained only with Hoechst or siRNA-cy5 or live dead far red were used as single color controls,
where applicable. Of note, the far red live dead staining was never combined with the siRNA-Cy5 in the
same sample because of the spectral overlap between the 2 dyes.
The siRNAs that were used were the following: a) siRNAs targeting the mRNA for a-synuclein, pooled
into a single solution (SNCA): s13204, s13205, s13206 (#4427037, Silencer Select predesigned siRNAs,
ThermoFisher), b) negative control (scrambled) siRNA: (#4390843, ThermoFisher), c) Cy5 tagged siRNA
(siRNA-cy5): MISSION® siRNA Fluorescent Universal Negative Control #2, Cyanine 5 (#SIC006-5X1NMOL,
Merck AG).
In the experiments where the effect of certain compounds on the cell-to-cell transfer of a-synuclein was
assessed, 6 well plates were first coated with PDL (Poly-D-lysine hydrobromide, average mol wt 30,000-
70,000, #P7280-5mg, ThermoFisher) before seeding the cells. 24h after transfection, the medium was
changed to normal growing medium and cells were treated with the following compounds and
concentrations: Alpha-amanitin (#A2263-1MG, Merck AG): 1, 2.5, 5, 10, 20ug/ml; cdk1 inhibitor
(#217695-5MG, Merck AG): 0.5, 1, 2, 3, 5.8uM; N,N,N′,N′-Tetrakis(2-pyridylmethyl)ethylenediamine: 1,
2, 3, 4uM (#P4413-50MG, Merck AG). The appropriate vehicle-only controls were also included: Alpha-
Amanitin: water; cdk1 inhibitor: DMSO; N,N,N′,N′-Tetrakis(2-pyridylmethyl)ethylenediamine: ethanol.
On the 5th day after transfection, the cells were collected as described above. Hoechst and live dead
stainings were also added.
Right before analysis through flow cytometry, the samples were filtered through a 35um cell strainer
(#352235, Corning). The samples were analyzed on a BD Fortessa instrument (BD Biosciences). The
following lasers and filters were used for the respective fluorophores: GFP: 488nm laser, 530/30nm
emission filter; RFP: 561nm laser, 610/20nm emission filter; Hoechst: 405nm laser; 450/50nm emission
filter; live dead far red: 640nm laser, 670/14nm emission filter. 100,000 events were recorded per
sample. Compensations and voltages were adjusted based on the single color controls.
For the analysis of the flow cytometry data, single cells were gated using the FSC-A/FSC-H plot. The
single color controls were used to set the gatings for the various fluorophores. The spreading ratio was
calculated as follows: %RFP+GFP- cells/%RFP+GFP+ cells. Where applicable, the percentage of single
cells that were positive for siRNA-Cy5 or Hoechst were also calculated. The number of cells that were
dead was determined using the live dead histogram.
Flow cytometry assays to evaluate the mitochondrial membrane potential and the lysosomal-
autophagy axis
.CC-BY-NC-ND 4.0 International license(which was not certified by peer review) is the author/funder. It is made available under aThe copyright holder for this preprintthis version posted December 23, 2019. . https://doi.org/10.1101/2019.12.23.886838doi: bioRxiv preprint
To quantify mitochondrial membrane potential, we used the MitoTracker Red CMXRos dye (#M7512,
ThermoFisher) and followed a similar procedure to a previously published experiment (Xiao et al., 2016).
The stock vial contained 50ug of dye and was reconstituted in 94ul DMSO to a concentration of 1mM.
The following concentrations were assayed in tissue culture and used for the dose-response experiment:
25, 50, 75, 100, 150, 200nM. 150nM were used for all other experiments.
To assess the lysosomal-autophagy axis, we used the LysoTracker Green DND-2 dye (#L7526,
ThermoFisher) (Chikte et al., 2014). This dye is delivered by the company in reconstituted form, with a
stock concentration of 1mM. The following concentrations were assayed in tissue culture and used for
the dose-response experiment: 10, 20, 30, 50, 75, 150nM. 150nM were used for all other experiments.
Chloroquine diphosphate (#C6628, Sigma) was used as a positive control for the LysoTracker assay. The
stock concentration was 25mM, in water. The following concentrations were assayed in tissue culture
and used for the dose-response experiment: 25, 50, 100, 200uM. The concentration used in all other
experiments was 50uM.
Carbonyl cyanide m-chlorophenyl hydrazine (CCCP) (#ab141229, abcam) was used as a positive control
for the MitoTracker assay. The stock concentration was 10mM in DMSO. The following concentrations
were assayed in tissue culture and used for the dose-response experiment: 5, 10, 20, 40uM. The
concentration used in all other experiments was 20uM. As a vehicle-only control, DMSO was used.
Other compounds used in those 2 assays were the following:
Rapamycin (#R8781-200UL, Sigma): The stock concentration was 2.5mg/ml in DMSO. The following
concentrations were assayed in tissue culture and used for the dose-response experiment: 50, 100, 200,
400nM. The concentration used in all other experiments was 200nM. As a vehicle-only control, DMSO
was used.
Torin 1 (#Cay10997-50, Cayman chemicals): The stock concentration was 2.5mM in DMSO. The following
concentrations were assayed in tissue culture and used for the dose-response experiment: 50, 100, 200,
400nM. The concentration used in all other experiments was 100nM. As a vehicle-only control, DMSO
was used.
Bafilomycin A1 (#B1793-10UG, Sigma): The stock concentration was 4uM in DMSO. The following
concentrations were assayed in tissue culture and used for the dose-response experiment: 10, 20, 40,
80nM. The concentration used in all other experiments was 40nM. As a vehicle-only control, DMSO was
used.
For the assays in 24 well format, the HEK-aSyn cells were plated and 48h later transfected (if applicable),
as described above. 3 days after transfection, they were incubated in the concentrations of Mitotracker
or LysoTracker indicated above. The dyes were diluted in the following medium: pure OMEM without
phenol+10%FBS+1% PenStrep. Right after, the cells were treated with the compounds at the
concentrations previously indicated (as applicable). The cells were then incubated at 37 degrees for 3h.
.CC-BY-NC-ND 4.0 International license(which was not certified by peer review) is the author/funder. It is made available under aThe copyright holder for this preprintthis version posted December 23, 2019. . https://doi.org/10.1101/2019.12.23.886838doi: bioRxiv preprint
The cells were collected for analysis through flow cytometry, as previously described. The appropriate
single color controls were also included.
For the assays in 96 well plate format (only applicable for the LysoTracker experiment), 96 well plates
were coated with PDL. Those experiments were completed using reverse transfections. The siRNAs from
the ThermoFisher Silencer Select library were printed using the ECHO555 acoustic dispenser (Labcyte).
100nl were printed per well for a final concentration of 5nM (that would occur after cell seeding and
addition of transfection mix). The stock concentration of the library was 5mM, in distilled and sterile
water. Each siRNA was printed in technical duplicates. 3 plates in total were used per batch of the
experiment. Empty wells were left for addition of the positive and negative control treatments after cell
seeding. The peripheral wells were used only for single color control samples because they are sensitive
to temperature gradients and evaporations which could adversely affect the results of the siRNA
experiments. The experiment was repeated independently 3 times. The plates were frozen until the
reverse transfections took place.
The 96 well plates were defrosted in the fridge for 1h. A solution containing 19.6ul of pure OMEM and
0.36ul of RNAiMax per well was prepared and incubated for 5min at room temperature. 20ul were
added per well. The plates were centrifuged at 2000g for 1min and then incubated at room temperature
for 20min. The cells were seeded at 870 cells/ul density and 80ul per well were added. 3 days later, the
plates were prepared for analysis through flow cytometry. The dyes and compounds were added as
described above. 3h later, the medium was aspirated using the multichannel aspirator. 50ul of PBS-/-
were added per well. This was aspirated and 10ul of trypsin were added per well, followed by 3min
incubation at 37 degrees in the dark. 40ul of the following medium were added per well to inactivate
the trypsin: pure OMEM without phenol+10%FBS+1%penstrep. 125ul of PBS-/-, followed by 25ul of
16%PFA were added per well, for a final volume of 200ul per well. The plates were analyzed using the
high throughput accessory to the Fortessa instrument (BD Biosciences). The following parameters were
used: Standard mode, 5x mix, 0.5 flow rate, 100ul mix volume, 500ul wash volume, 200 mix speed, 30ul
sample volume. Each sample was recorded for 1min or 10,000 events, whichever was achieved first.
The following dyes were used for confirmatory purposes: LysoTracker Blue DND-22 (#L7525,
ThermoFisher), MitoTracker Deep Red FM (#M22426, Thermofisher).
Flow cytometry assay to assess the cell cycle progression
A previously described method was followed for the cell cycle assay (Eddaoudi et al., 2018). Actinomycin
D (#11805017, ThermoFisher), a transcription inhibitor, was included as a positive control. The stock
concentration was 1mg/ml in DMSO. The following concentrations were assayed in tissue culture: 2.5, 5,
10ug/ml. 10ug/ml was used in all experiments. DMSO was used as a vehicle-only control. After addition
of the positive control in predetermined wells, the cells were incubated with Hoechst dye diluted 1:2000
in PBS-/- for 45-75min (stock concentration was 10mg/ml). Pyronin Y (#ab146350, abcam) was then
added at 20ug/well and incubated for another 45-75min (stock concentration was 2mg/ml in water).
.CC-BY-NC-ND 4.0 International license(which was not certified by peer review) is the author/funder. It is made available under aThe copyright holder for this preprintthis version posted December 23, 2019. . https://doi.org/10.1101/2019.12.23.886838doi: bioRxiv preprint
For experiments completed in 24 well format, the cells were pelleted as previously described, but
instead of being fixed in 2%PFA they were resuspended in PBS -/-.
For experiments in 96 well format, the cells were prepared as follows: The medium was aspirated and
50ul of PBS-/- were added per well. The PBS was aspirated and 10ul of trypsin were added per well.
After incubation at 37 degrees for 3min, 40ul of the following medium were added per well: pure
OMEM without phenol+10%FBS+1% PenStrep. The cells were pipetted to facilitate detachment. 150ul of
PBS-/- were added per well. In both versions of this experiment (24 well and 96 well), the cells were not
fixed, because fixation affected the fluorescence properties of the dyes. The samples were analyzed
using the high throughput accessory to the Fortessa instrument (BD Biosciences). The following
parameters were used: Standard mode, 5x mix, 0.5 flow rate, 100ul mix volume, 500ul wash volume,
200 mix speed, 30ul sample volume. Each sample was recorded for 1min or 10,000 events, whichever
was achieved first.
High throughput screen (HTS)
A commercially available library was used (Silencer Select, Thermofisher). This library contains 64,752
siRNAs (0.25nmol per siRNA) targeting 21,584 transcripts (i.e. 3 siRNAs per transcript) that were
lyophilized in 384 well ECHO-qualified low dead volume (LDV) plates. The plates were reconstituted in
distilled, sterile water to a concentration of 5mM. For the pooled version of the screen, 3ul of each
individual siRNA targeting the same transcript were mixed, with a final concentration of 5mM and a final
volume of 9ul.
The high throughput screen was completed as previously described (Pease et al., 2019). PDL-Coated
CellCarrier-384 ultra 384 well plates were used as destination plates (#6057508, Perkin Elmer). 20ng of
GFP-2a-aSyn-RFP construct that was reconstituted in distilled water were printed per well. Afterwards,
the library siRNAs were printed using the ECHO555 acoustic dispenser (Labcyte) that was controlled
through the Echo Tempo software (Labcyte). 30nl of each siRNA (pooled or singlet, depending on the
experiment) were dispensed per well, in technical duplicates spread over multiple plates. The
distribution of the siRNAs in the destination plates was determined through a computer algorithm, with
each technical duplicate printed on a different plate at a different position. Plates were printed in
batches of 8. 44 positive (3 pooled siRNAs targeting SNCA) and 44 negative controls (scrambled siRNA)
were included per plate, at a final concentration of 5nM. The controls were homogeneously distributed
across plates, for quality control purposes. The peripheral wells in each plate (first and last row, first and
last column) were excluded from analyses because they are sensitive to evaporation and temperature
gradients and therefore the readout for the library siRNAs could have been adversely affected. A total of
166 destination plates were assayed in the primary, pooled screen. The plates were frozen until reverse
transfections took place.
The plates were processed and analyzed in batches of 8. The plates were defrosted at 4 degrees for 1h
before cell seeding. Reverse transfections were used. First, a mix containing the following reagents and
volumes per well was prepared: 0.09ul of RNAiMax plus 4.91ul of pure OMEM without phenol. The mix
.CC-BY-NC-ND 4.0 International license(which was not certified by peer review) is the author/funder. It is made available under aThe copyright holder for this preprintthis version posted December 23, 2019. . https://doi.org/10.1101/2019.12.23.886838doi: bioRxiv preprint
was incubated at room temperature for 5min before adding 5ul per well. The plates were centrifuged at
2000g for 1min and incubated at room temperature for 20min. The HEK-aSyn cells were trypsinized and
seeded at a density of 870 cells/ul. 23ul of cells were added per well. The following medium was used:
pure OMEM without phenol plus 10%FBS plus 1%penstrep. The plated cells were then kept in the
incubator at 37 degrees for 5 days. To reduce the formation of temperature gradients, the plates were
rotated manually in the incubator 1-2 times per day. They were rotated at 180 degrees across their
longitudinal axis, along with change in position within the same shelf. The plates were spread out on the
same shelf and not stacked.
On the 5th day after seeding, the plates were fixed. The medium was aspirated from the wells, 20ul of
2% PFA were added per well, the plates were incubated for 10-15min at room temperature in the dark,
the PFA was aspirated, and 20ul of PBS -/- were added per well. The plates were wrapped in foil and
stored at 4 degrees until imaging.
The GE IN Cell Analyzer 2500HS (GE Life Sciences) was used for imaging, with the following parameters:
10x objective (air), 2D deconvolution, 1x1 binning, BGOFR_1 polychroic beam splitter, software
autofocus per channel, 10% laser power. The following lasers, emission filters and exposures were used:
GFP: excitation 475/28nm, emission filter 511.5/23nm, exposure 0.06sec; RFP: excitation 542/27nm,
emission 587.5/47nm, exposure 0.07sec. 2 images were acquired per well. Acquisition time per 384 well
plate was less than 30min. A subset of plates (48) were imaged on the Opera Phenix (Perkin Elmer) using
equivalent parameters.
During data analysis, all peripheral wells were excluded because they are more sensitive to evaporation
and external insults. The metric that was used as a readout for the screen was the cell-to-cell transfer
ratio of a-synuclein (number of RFP+GFP- units/number of GFP+ units).
All analyses were done in MATLAB. First, the vignetting artefact, inherent to any microscopy experiment,
was eliminated by global background subtraction where each image was divided pixel-by-pixel to the
corresponding background. The background image was obtained using an operator size of 15 pixels.
Further pre-processing included the use of a 2D median filter, automatic contrast adjustment and
binarization. The binarization was obtained by thresholding the overall image for a fixed value (th=0.1)
for all images. This value has been optimized empirically. Once the images for both channels were
computed, the difference between the red and green channel was calculated. The cell-to-cell transfer
ratio was computed using that difference. A heatmap for each plate was also generated. The code used
for data analysis and for the generation of the picklists is available on Github:
https://github.com/alecrimi/aSynuclein_siRNA_screen .
.CC-BY-NC-ND 4.0 International license(which was not certified by peer review) is the author/funder. It is made available under aThe copyright holder for this preprintthis version posted December 23, 2019. . https://doi.org/10.1101/2019.12.23.886838doi: bioRxiv preprint
Two statistical metrics were used as quality control, the z’-prime factor and the strictly standardized
mean difference (SSMD) (Zhang, 2008). Plates with a z’-factor below 0 were repeated, unless indicated
otherwise in the results section of this manuscript.
For each gene, the t-test with the corresponding p-value was computed and was used for ranking the
hits, after Bonferroni correction for multiple testings. Other metrics that were calculated per gene and
used mainly for visual representation of the data were the SSMD and log fold change. All those metrics
were calculated relatively to the scrambled controls per batch of 8 384well plates.
Fluorescence-activated cell sorting (FACS)
Cells were plated in 35mm dishes at a seeding density of 870 cells/ul. 48h later, the cells were
transfected with the GFP-2a-aSyn-RFP, E3-RFP or GFP-2a-aSyn constructs. 5 days later, the cells were
washed with PBS-/- and trypsinized. Once the cells were detached, wells were pooled and subjected to
centrifugation at 1500rpm for 7 min. Pellets were resuspended in FACS buffer (PBS, 2% FCS, 1 mM EDTA)
and the samples proceeded to flow cytometry and sorting. Acquisition and sorting of cells was
performed using a BD FACS Aria III 5L harnessing a 70 µm nozzle. The drop delay was performed using
BD FACS Accudrop beads (BD Biosciences, #345249) according to the manufacturers’ guidelines. Optical
configurations were set as follows: a 488 nm Blue and a 561 nm YellowGreen laser were used for
optimal excitation of GFP and RFP, respectively. The emission of GFP was recorded using a LP502 mirror
in combination with a BP530/30 filter, whereas the RFP was recorded using a LP600 mirror in
combination with a BP610/20 filter. Cells were gated for singlets on the FSC-A vs FSC-H plot and for
debris exclusion on the FSC-A vs SSC-A plot. RFP+GFP- and RFP+GFP+ populations were determined on
the plot for RFP vs GFP. Approximately 1,000,000 cells were collected per tube for the RFP+GFP+
population and 200,000 cells for the RFP+GFP- population.
Western blot
Cells were plated in 35mm dishes. Where applicable, they were transfected 48h after seeding with the
GFP-2a-aSyn-RFP construct. 5 days later they were washed with PBS, trypsinized and pelleted with
centrifugation at 1500rpm for 7min. The pellet was frozen until further usage. A pellet from a 35mm
dish was lysated in 100ul of lysis buffer consisting of RIPA 1x (#9806S, Cell signaling) and cOmplete
.CC-BY-NC-ND 4.0 International license(which was not certified by peer review) is the author/funder. It is made available under aThe copyright holder for this preprintthis version posted December 23, 2019. . https://doi.org/10.1101/2019.12.23.886838doi: bioRxiv preprint
protease inhibitors 1x (#11697498001, Merck). For the FACS sorted cells, approximately 200,000 and
1,000,000 cells were lysated in 20ul of lysis buffer for the RFP+GFP- and the RFP+GFP+ populations,
respectively. The protein concentration in each sample was measured with the BCA method (#23225,
ThermoFisher scientific). A total of 20ug of protein were blotted per sample, after being diluted in 1x
NuPage LDS sample buffer (#NP0008, ThermoFisher scientific) and 1x NuPAGE Sample Reducing Agent
(#NP0009, ThermoFisher scientific) (final protein concentration 1ug/ul). The samples were run on 4-12%
Bis-Tris gels (#NP0321BOX, ThermoFisher scientific) at 120Volt at room temperature with 1x MES
running buffer (#NP0002, ThermoFisher scientific). The gels were transferred onto PVDF membranes
using the iBlot 2 dry blotting system. After blocking for 2h at room temperature in 5% SureBlock
(#SB232010-50G, Lubioscience) in PBS, the membranes were incubated for 2h at room temperature in
mouse anti-a-Synuclein antibody, 1:1000 (#610786, BD Bioscience) in 1% SureBlock. Subsequently, the
membranes were washed with PBS + 0.1%Tween and incubated with the secondary HRP conjugated
goat anti-mouse antibody 1:12000 (#115-035-003, Jackson laboratories) for 1h at room temperature.
After washing, the membranes were treated with Crescendo HRP substrate (#WBLUR0100, Merck) and
imaged with the Fusion Solo 7S (witec ag). The membranes were also stained with a mouse anti-actin
antibody for 1h at room temperature (#MAB1501R, Merck).
Reverse transcription quantitative PCR (RT-qPCR)
Cells were seeded in 35mm dishes and transfected as previously described. RNA was extracted from
cells from a single 35mm dish using the miRNeasy Mini Kit (#217004, Qiagen) and eluted in 30ul of
ddH2O. DNAase I treatment (#79254, Qiagen) was also included during RNA extraction. For FACS-
isolated cells, RNA was extracted from 200,000 and from 1,000,000 cells for the RFP+GFP- and for the
RFP+GFP+ populations, respectively. cDNA was generated using the High-Capacity cDNA Reverse
Transcription Kit (ABI, # 4368814).
qPCR was performed following the relative standard curve method, as previously described (de Calignon
et al., 2012). Briefly, five 10-fold serial dilutions of cDNA template from HEK-aSyn cells transiently
transfected with the GFP-2a-aSyn-RFP construct were prepared for generation of the standard curve.
50ng of RNA reverse transcribed to cDNA were assayed per sample of interest. Each sample and each
concentration of the standard curve were assayed in technical triplicates. No template controls were
also included for each primer pair. A primer pair targeting the aSyn-RFP transcript (5'-TGC CTT CTG AGG
AAG GGT AT-3' within a-synuclein, 5'-AAG CGC ATG AAC TCC TTG AT-3' within RFP) and the GAPDH
housekeeping gene (5'-AAG GTG AAG GTC GGA GTC AA-3', 5'-AAT GAA GGG GTC ATT GAT GG-3') were
used. For each sample, 5ul of cDNA were included in a reaction with 10ul of 2x Fast SYBR green master
mix (#4385612, Applied Biosystems), 1ul of each of forward and reverse primers (3.3uM each) and 3ul of
ddH2O. The samples were analyzed in 96 well plates on a 7500 Fast Real-Time PCR System (Applied
Biosystems). Ct values were calculated using the 7500 v2.04 software (Applied Biosystems). Standard
curves depicting the Ct values vs the log of the RNA input amount were generated for each of the genes.
The RNA amount of each of the 2 transcripts was interpolated based on the standard curve for each of
the samples assayed. aSynRFP expression was normalized to GAPDH expression for each sample, and
.CC-BY-NC-ND 4.0 International license(which was not certified by peer review) is the author/funder. It is made available under aThe copyright holder for this preprintthis version posted December 23, 2019. . https://doi.org/10.1101/2019.12.23.886838doi: bioRxiv preprint
the fold-difference in expression of aSynRFP in the RFP+GFP- sample was calculated relatively to the
RFP+GFP+ (calibrator) sample.
Weighted gene co-expression network analysis (WGCNA)
In order to obtain co-expression models from brain tissue, we used GTEx gene expression V6. For all the
13 brain tissues available, we ran the same pipeline. For each tissue sample dataset, we selected only
Ensembl genes expressed above 0.1 Reads per kilobase of transcript, per million mapped reads (RPKM)
values at least in 80% of the corresponding samples. Then we corrected for batch effects with ComBat
by using CENTER variable. Those residuals were normalised at sample and gene level and then the
expression was further corrected for a number of SVA axes while controlling for age, sex and PMI
covariates. The resulting gene expression values were regressed for PMI, age, sex and the surrogate
variables detected by SVA. These residuals, along with the networks and annotations are accessible, for
each tissue at the CoExpGTEx GitHub repository https://github.com/juanbot/CoExpGTEx. The co-
expression networks are obtained with the WGCNA R package (Langfelder and Horvath 2008) and an
additional refinement step of the clusters, based on the k-means algorith implemented in the CoExpNets
R package (Botia et al., 2017). We constructed a set of clusters from gene expression values based on
correlation between genes across samples through building a gene expression adjacency matrix (with
scale free topology). This was converted into a distance (Euclidean) based matrix that we used to create
a dendrogram with the hclust package with default values for the corresponding method. Then we used
k-means to refine the clusters obtained from the dendrogram. Network annotations are based on the
gProfileR package (Reimand et al. 2007). All these models can be downloaded and used locally but they
can also be accessed from a Web interface, the CoExp Web app
https://snca.atica.um.es/coexp/Run/Catalog/.
Expression weighted cell type enrichment (EWCE)
EWCE (https://github.com/NathanSkene/EWCE) (Skene and Grant, 2016) was used to determine
whether the 38 hits implicated in regulation of a-synuclein transfer have higher expression within
particular brain-related cell types than would be expected by chance. As our input we used 1) the list of
38 hits (which excluded SNCA) and 2) specificity values calculated for level 1 cell types from two
independent human single-nuclear RNA-sequencing (snRNA-seq) datasets. These datasets included 1)
snRNA-seq data from the middle temporal gyrus (Allen Institute for Brain Science; Cell Diversity in the
Human Cortex, published 2018-9; https://portal.brain-map.org/atlases-and-
data/rnaseq#Previous_Human_Cortex) (Hawrylycz et al., 2012) and 2) massively parallel snRNA-seq with
droplet technology (DroNc-seq) datasets from the prefrontal cortex and hippocampus (Habib et al.,
2017). For the Allen Institute dataset, the cell-type specificity of each gene (i.e. proportion of total
expression of a gene in one cell type compared to all others) was estimated using exonic read count
values together with the ‘generate.celltype.data’ function of the EWCE package. Specificity values for
the human DroNc-seq data had been previously published by Skene et al (Skene and Grant, 2016). EWCE
.CC-BY-NC-ND 4.0 International license(which was not certified by peer review) is the author/funder. It is made available under aThe copyright holder for this preprintthis version posted December 23, 2019. . https://doi.org/10.1101/2019.12.23.886838doi: bioRxiv preprint
with the target list was then run with 100,000 bootstrap replicates, each of which was selected such that
it had comparable transcript lengths and GC-content to the target list, thus controlling for these biases.
Data are displayed as standard deviations from the mean, and any values < 0, which reflect a depletion
of expression, are displayed as 0. P-values were corrected for multiple testing using the Benjamini-
Hochberg method over all level 1 cell types tested in both studies.
GWAS data and burden analyses
To investigate the role of the 38 identified genes and the effects of their genetic variation on the risk of
PD, we utilized summary statistics from the latest International Parkinson’s Disease Genomics
Consortium (IPDGC) genome-wide association study (GWAS) consisting of 37.7K cases, 18.6K UK Biobank
proxy-cases, and 1.4M controls, and including 7.8M SNPs (Nalls et al., 2019).
For gene-based burden analyses, IPDGC individual level data containing 21,478 cases and 24,388
controls was used. The genotyping data underwent standard quality control and was imputed using the
Haplotype Reference Consortium r1.1 2016 (http://www.haplotype-reference-consortium.org), under
default settings with phasing using the EAGLE option, as previously described (Nalls et al., 2019).
Imputed variants with more than 10% missing genotypes were excluded and filtered for imputation
quality (RSQ) > 0.8. Analyses were adjusted by sex, 10 principal components to account for population
stratification, and dataset to account for possible chip bias. Since the variable age was missing for many
patients, it was not included as a covariate in our analyses.
Gene-based burden analyses SKAT, SKAT-O, Madson Browing, Fp, Zeggini and CMC were performed by
using RVTESTS (Zhan et al., 2016) to assess the cumulative effect of multiple variants at different minor
allele frequency thresholds (≤ 0.05, ≤ 0.03, ≤ 0.01) on the risk for PD according to default parameters.
Weighted protein-protein network interaction analysis (WPPNIA)
WWPNIA was completed as previously described (Ferrari et al., 2018; Ferrari et al., 2017). Briefly, the
direct interactors (first layer nodes) of proteins of interest (seeds), as reported in the literature, were
downloaded (June 2019) from the following repositories BioGrid, bhf-ucl, InnateDB, IntAct, MINT,
UniProt, and MBInfo, as catalogued in the PSICQUIC platform. The pipeline for the download of
interactors is freely available as an online tool
(http://www.reading.ac.uk/bioinf/PINOT/PINOT_form.html). All interactors were filtered based on the
number of publications in which they were reported and the number of different methods used, keeping
interactions with a final score >2. UBC was excluded from downstream analyses as it can bind to a large
array of proteins targeted for degradation. Analyses were performed in R and networks were visualized
with the Cytoscape 2.8.2 software.
Gene Ontology (GO) terms enrichment analyses (June 2019) was performed in g:Profiler
(http://biit.cs.ut.ee/gprofiler/).
.CC-BY-NC-ND 4.0 International license(which was not certified by peer review) is the author/funder. It is made available under aThe copyright holder for this preprintthis version posted December 23, 2019. . https://doi.org/10.1101/2019.12.23.886838doi: bioRxiv preprint
Confocal imaging
Confocal imaging was performed on the Zeiss LSM 880 or 980 with Airyscan instruments. Cells were
plated and transfected in 8 well glass bottom chamber slides (#055087, LabTek) and fixed in 2% PFA 5
days later for this experiment. Images were processed in Image J.
RNA sequencing
Cells of passage comparable to the one used for the HTS were analyzed through RNA sequencing to
determine whether the genes detected as hits were indeed expressed.
The libraries were prepared following Illumina TruSeq stranded mRNA protocol. The quality of the initial
RNA and the final libraries was determined using an Agilent Fragment Analyzer. The libraries were
pooled equimolecularly and sequenced in an Illumina NovaSeq sequencer with a depth of around 20
Mio reads per sample.
FastQC was used for quality control of the reads. Sequencing adaptors were removed with Trimmomatic
(Bolger et al., 2014) and reads were trimmed by 5 bases on the 3’ end. The TruSeq universal adaptor
sequence was as follows: 5’
AATGATACGGCGACCACCGAGATCTACACTCTTTCCCTACACGACGCTCTTCCGATCT. Reads that were at least
20bp long and had an average phred quality score over 10 were aligned to the human reference
transcriptome using STAR v2.5.1 (Dobin et al., 2013) under default parameters for single end reads. The
distribution of the reads across the isoforms transcribed was quantified with the R package
GenomicRanges (Bioconductor Version 3.0) (Lawrence et al., 2013). Differentially expressed genes were
identified with the R package EdgeR (Bioconductor Version 3.0) (Robinson et al., 2010). Genes with at
least 10 raw counts in at least half of the samples were retained. The TMM normalized expression
metric from EdgeR was used to determine if a gene was expressed or not.
QUANTIFICATION AND STATISTICAL ANALYSIS
All statistical analyses were performed in Graphpad Prism version 8.
For flow cytometry experiments, experiments were repeated 5-6 times independently, and each
independent experiment contained 2 technical replicates per condition. The technical replicates were
averaged and the independent experiments were collated for collective assessment of the data, after
normalizing the data within each experiment to a common sample, usually the negative control or the
first data point of a timecourse or dose response experiment, which was arbitrarily designated as 1 (Kara
et al., 2017; Kara et al., 2018). In some cases where the absolute values were important (for example to
assess cell viability), the data was not normalized prior to collation of independent experiments. P values
.CC-BY-NC-ND 4.0 International license(which was not certified by peer review) is the author/funder. It is made available under aThe copyright holder for this preprintthis version posted December 23, 2019. . https://doi.org/10.1101/2019.12.23.886838doi: bioRxiv preprint
below 0.05 were considered significant. In experiments where more than one conditions were
compared, the appropriate Bonferroni correction for multiple testing was used. The number of
biological replicates conducted for each experiment, statistical test used, normalization process (if
applicable), along with method for correction for multiple testing is indicated in the respective figure
legend. In all scatter plots included in the paper, mean +/- standard deviation is shown, and each dot
represents the mean result from one independent experiment.
The analysis and quantification for the HTS, GWAS, WPPNIA, WGCNA, EWCE are included under the
previous section.
DATA AND CODE AVAILABILITY
The code generated during this study is available on Github
https://github.com/alecrimi/aSynuclein_siRNA_screen
Results
Development of an assay to study the cell-to-cell transfer of a-synuclein that is amenable to high
throughput
To study the cell-to-cell transfer of a-synuclein, we used a genetically encoded reporter. Inspired by a
system previously developed to study the spread of tau (Wegmann et al., 2015), we cloned a construct
encoding GFP-2a-aSynuclein-RFP under the CMV promoter within the mammalian expression vector
pcDNA3.1. As a model system, we used a previously reported HEK QBI cell line stably overexpressing
human wild type (WT) a-synuclein (HEK-aSyn line) (Luk et al., 2009). We chose that cell line because we
reasoned that endogenous expression of a-synuclein is necessary for the correct assessment of the
“permissive templating” hypothesis (Hardy, 2005). Upon transfection of the cell line with the construct,
the translated protein is cleaved at the 2a position to produce two daughter proteins, GFP and a-
synuclein-RFP. A-synuclein-RFP can then spread to neighboring cells, without concomitant transfer of
GFP. The 2 cellular populations (donor and recipient cells of a-synuclein transfer) can, therefore, be
identified by their colors: the cells expressing a-synuclein generated through expression from the
plasmid are positive for GFP and RFP fluorescence, whereas the cells that received a-synuclein through
transfer are positive only for RFP fluorescence (figure 1a). We observed that a-synuclein that underwent
transfer did not enter the nucleus of the recipient cell, but instead formed punctate structures that
localized in the cytoplasm, primarily within the processes (figure 1b). We then isolated through FACS the
cellular population that expressed a-synuclein-RFP through transfection (RFP+GFP+), and the population
that had taken up a-synuclein-RFP through cell-to-cell transfer (RFP+GFP-) 5 days after transfection
(supplementary figure 1a), and analyzed them through western blot, along with transfected but
unsorted cells. Both populations contained the aSyn-RFP fusion protein (expected molecular weight
41kDa), confirming the anticipated cleavage pattern of the fusion protein at the 2a position and
.CC-BY-NC-ND 4.0 International license(which was not certified by peer review) is the author/funder. It is made available under aThe copyright holder for this preprintthis version posted December 23, 2019. . https://doi.org/10.1101/2019.12.23.886838doi: bioRxiv preprint
indicating that aSyn-RFP is the species transferred from cell-to-cell. To a lesser extent, the transfected
cells expressed the uncleaved GFP-2a-aSyn-RFP protein (expected molecular weight 68kDa), consistent
with previous reports (Wegmann et al., 2015). This species was absent from the recipient cells
(RFP+GFP-), as expected. All populations also contained untagged a-synuclein protein (expected
molecular weight 14kDa), consistent with expectations, as the HEK-aSyn line was used for transient
transfections. The HEK 293T line that was used as a negative control contained no detectable levels of a-
synuclein (figure 1c). The absence of aSyn-RFP transcript in the recipient cells was confirmed through
qPCR analysis, providing further evidence that the fusion protein was received through cell-to-cell
transfer rather than from aberrant expression of the transfected construct (supplementary figure 1b).
We first validated and characterized the assay using transient transfections in tissue culture, followed by
analysis through flow cytometry. In a time course experiment where we collected and analyzed the cells
at 3,5 and 7 days after transfection, we found a progressive increase over time of the number of
RFP+GFP- cells that received a-synuclein-RFP through transfer (figure 1d,e).
As a negative control, we used a construct encoding GFP-2a-RFP, to check whether the cell-to-cell
transfer of the fusion protein a-synuclein-RFP is driven by a-synuclein or by RFP. We collected the cells 5
days after transient transfection with either GFP-2a-aSyn-RFP or GFP-2a-RFP and analyzed them through
flow cytometry. We found that, while RFP was capable of transferring between cells, the fusion protein
aSynuclein-RFP transferred at a significantly higher ratio (figure 1f). No difference between the transfer
ratio of RFP and aSyn-RFP was observed in other cell lines tested (supplementary figure 1c,d,e,f,g), none
of which expressed endogenously a-synuclein (supplementary figure 1h). Those results suggest that
endogenous expression of a-synuclein could promote the cell-to-cell transfer of the aSyn-RFP fusion
protein to levels significantly higher than those of the intercellular transfer of RFP alone.
As a-synuclein in the recipient cells did not diffusely spread within the cytoplasm and nucleus but
instead formed punctate structures that apparently localized to the processes, we wanted to confirm
that indeed the recipient RFP+GFP- events detected on flow cytometry were intact cells and not debris.
To this end, before collecting and fixing the cells for flow cytometry, we stained them with the nuclear
dye Hoechst. Analysis through flow cytometry showed that, on average, 98.04% of the RFP+GFP- cells
contained a nucleus, a percentage comparable to that seen in the other populations analyzed (figure
1g). Additionally, we incubated the cells with a far red live dead dye before collection and found that all
4 populations of cells had a death ratio of less than 4% (figure 1h). Collectively, those data confirm that
the RFP+GFP- events identified through flow cytometry are intact, alive cells.
Genome-wide siRNA screen for the identification of genetic modifiers of a-synuclein spread
To establish a high throughput screen, we first determined the optimal concentration and incubation
time of the siRNA. As a positive control, we used three pooled siRNAs against a-synuclein, each targeting
a different region of the mRNA, with a final concentration of 5nM, and co-transfected them with the
GFP-2a-aSyn-RFP construct. In a separate experiment, we co-transfected the construct with an siRNA
tagged with a far red fluorophore (siRNA-Cy5). Analysis through flow cytometry that was done 5 days
.CC-BY-NC-ND 4.0 International license(which was not certified by peer review) is the author/funder. It is made available under aThe copyright holder for this preprintthis version posted December 23, 2019. . https://doi.org/10.1101/2019.12.23.886838doi: bioRxiv preprint
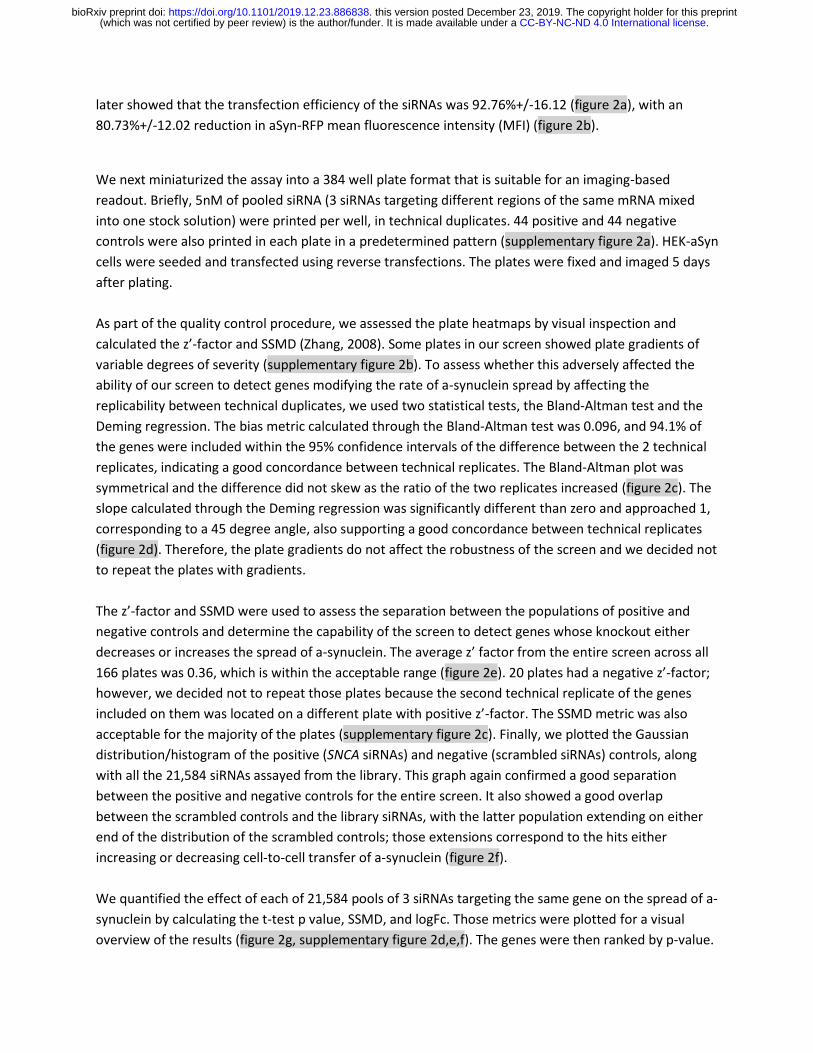
later showed that the transfection efficiency of the siRNAs was 92.76%+/-16.12 (figure 2a), with an
80.73%+/-12.02 reduction in aSyn-RFP mean fluorescence intensity (MFI) (figure 2b).
We next miniaturized the assay into a 384 well plate format that is suitable for an imaging-based
readout. Briefly, 5nM of pooled siRNA (3 siRNAs targeting different regions of the same mRNA mixed
into one stock solution) were printed per well, in technical duplicates. 44 positive and 44 negative
controls were also printed in each plate in a predetermined pattern (supplementary figure 2a). HEK-aSyn
cells were seeded and transfected using reverse transfections. The plates were fixed and imaged 5 days
after plating.
As part of the quality control procedure, we assessed the plate heatmaps by visual inspection and
calculated the z’-factor and SSMD (Zhang, 2008). Some plates in our screen showed plate gradients of
variable degrees of severity (supplementary figure 2b). To assess whether this adversely affected the
ability of our screen to detect genes modifying the rate of a-synuclein spread by affecting the
replicability between technical duplicates, we used two statistical tests, the Bland-Altman test and the
Deming regression. The bias metric calculated through the Bland-Altman test was 0.096, and 94.1% of
the genes were included within the 95% confidence intervals of the difference between the 2 technical
replicates, indicating a good concordance between technical replicates. The Bland-Altman plot was
symmetrical and the difference did not skew as the ratio of the two replicates increased (figure 2c). The
slope calculated through the Deming regression was significantly different than zero and approached 1,
corresponding to a 45 degree angle, also supporting a good concordance between technical replicates
(figure 2d). Therefore, the plate gradients do not affect the robustness of the screen and we decided not
to repeat the plates with gradients.
The z’-factor and SSMD were used to assess the separation between the populations of positive and
negative controls and determine the capability of the screen to detect genes whose knockout either
decreases or increases the spread of a-synuclein. The average z’ factor from the entire screen across all
166 plates was 0.36, which is within the acceptable range (figure 2e). 20 plates had a negative z’-factor;
however, we decided not to repeat those plates because the second technical replicate of the genes
included on them was located on a different plate with positive z’-factor. The SSMD metric was also
acceptable for the majority of the plates (supplementary figure 2c). Finally, we plotted the Gaussian
distribution/histogram of the positive (SNCA siRNAs) and negative (scrambled siRNAs) controls, along
with all the 21,584 siRNAs assayed from the library. This graph again confirmed a good separation
between the positive and negative controls for the entire screen. It also showed a good overlap
between the scrambled controls and the library siRNAs, with the latter population extending on either
end of the distribution of the scrambled controls; those extensions correspond to the hits either
increasing or decreasing cell-to-cell transfer of a-synuclein (figure 2f).
We quantified the effect of each of 21,584 pools of 3 siRNAs targeting the same gene on the spread of a-
synuclein by calculating the t-test p value, SSMD, and logFc. Those metrics were plotted for a visual
overview of the results (figure 2g, supplementary figure 2d,e,f). The genes were then ranked by p-value.
.CC-BY-NC-ND 4.0 International license(which was not certified by peer review) is the author/funder. It is made available under aThe copyright holder for this preprintthis version posted December 23, 2019. . https://doi.org/10.1101/2019.12.23.886838doi: bioRxiv preprint
SNCA was included within the siRNA library and was identified as the top hit of the screen in an unbiased
way. Its profound effect on a-synuclein spread was also readily identifiable by visual inspection of the
plate heatmaps (supplementary figure 2g). The top 1000 genes as ranked by p-value were selected for a
confirmatory secondary screen.
Secondary and tertiary screens confirm the role of 38 genes in the regulation of cell-to-cell transfer of
a-synuclein
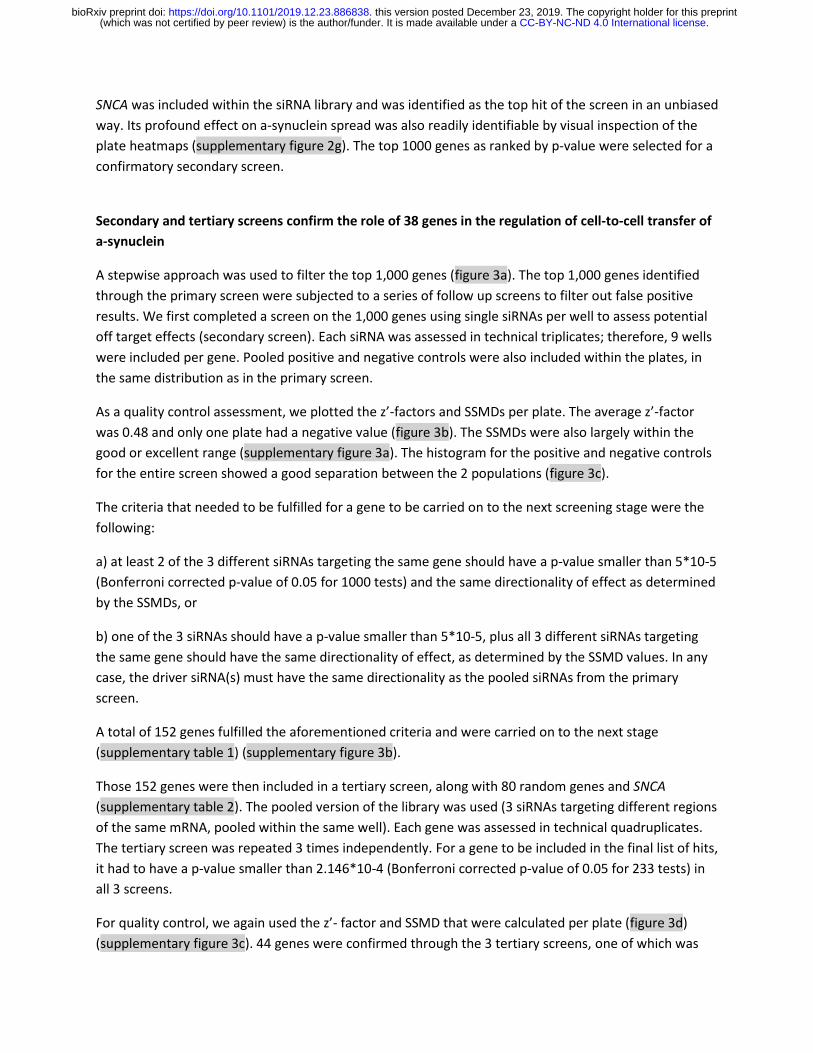
A stepwise approach was used to filter the top 1,000 genes (figure 3a). The top 1,000 genes identified
through the primary screen were subjected to a series of follow up screens to filter out false positive
results. We first completed a screen on the 1,000 genes using single siRNAs per well to assess potential
off target effects (secondary screen). Each siRNA was assessed in technical triplicates; therefore, 9 wells
were included per gene. Pooled positive and negative controls were also included within the plates, in
the same distribution as in the primary screen.
As a quality control assessment, we plotted the z’-factors and SSMDs per plate. The average z’-factor
was 0.48 and only one plate had a negative value (figure 3b). The SSMDs were also largely within the
good or excellent range (supplementary figure 3a). The histogram for the positive and negative controls
for the entire screen showed a good separation between the 2 populations (figure 3c).
The criteria that needed to be fulfilled for a gene to be carried on to the next screening stage were the
following:
a) at least 2 of the 3 different siRNAs targeting the same gene should have a p-value smaller than 5*10-5
(Bonferroni corrected p-value of 0.05 for 1000 tests) and the same directionality of effect as determined
by the SSMDs, or
b) one of the 3 siRNAs should have a p-value smaller than 5*10-5, plus all 3 different siRNAs targeting
the same gene should have the same directionality of effect, as determined by the SSMD values. In any
case, the driver siRNA(s) must have the same directionality as the pooled siRNAs from the primary
screen.
A total of 152 genes fulfilled the aforementioned criteria and were carried on to the next stage
(supplementary table 1) (supplementary figure 3b).
Those 152 genes were then included in a tertiary screen, along with 80 random genes and SNCA
(supplementary table 2). The pooled version of the library was used (3 siRNAs targeting different regions
of the same mRNA, pooled within the same well). Each gene was assessed in technical quadruplicates.
The tertiary screen was repeated 3 times independently. For a gene to be included in the final list of hits,
it had to have a p-value smaller than 2.146*10-4 (Bonferroni corrected p-value of 0.05 for 233 tests) in
all 3 screens.
For quality control, we again used the z’- factor and SSMD that were calculated per plate (figure 3d)
(supplementary figure 3c). 44 genes were confirmed through the 3 tertiary screens, one of which was
.CC-BY-NC-ND 4.0 International license(which was not certified by peer review) is the author/funder. It is made available under aThe copyright holder for this preprintthis version posted December 23, 2019. . https://doi.org/10.1101/2019.12.23.886838doi: bioRxiv preprint
SNCA (figure 3a). Of note, none of the 80 random genes passed the p-value cutoffs specified above.
Those results were intersected with the results from RNA sequencing performed on the HEK-aSyn cell
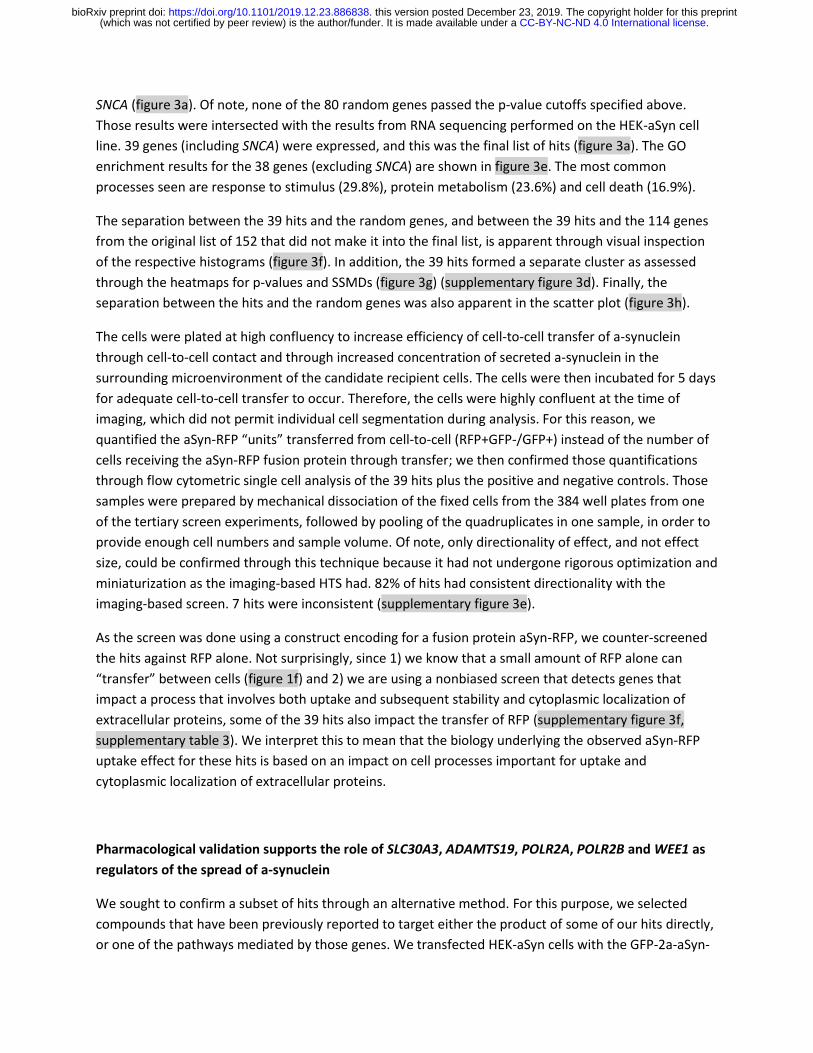
line. 39 genes (including SNCA) were expressed, and this was the final list of hits (figure 3a). The GO
enrichment results for the 38 genes (excluding SNCA) are shown in figure 3e. The most common
processes seen are response to stimulus (29.8%), protein metabolism (23.6%) and cell death (16.9%).
The separation between the 39 hits and the random genes, and between the 39 hits and the 114 genes
from the original list of 152 that did not make it into the final list, is apparent through visual inspection
of the respective histograms (figure 3f). In addition, the 39 hits formed a separate cluster as assessed
through the heatmaps for p-values and SSMDs (figure 3g) (supplementary figure 3d). Finally, the
separation between the hits and the random genes was also apparent in the scatter plot (figure 3h).
The cells were plated at high confluency to increase efficiency of cell-to-cell transfer of a-synuclein
through cell-to-cell contact and through increased concentration of secreted a-synuclein in the
surrounding microenvironment of the candidate recipient cells. The cells were then incubated for 5 days
for adequate cell-to-cell transfer to occur. Therefore, the cells were highly confluent at the time of
imaging, which did not permit individual cell segmentation during analysis. For this reason, we
quantified the aSyn-RFP “units” transferred from cell-to-cell (RFP+GFP-/GFP+) instead of the number of
cells receiving the aSyn-RFP fusion protein through transfer; we then confirmed those quantifications
through flow cytometric single cell analysis of the 39 hits plus the positive and negative controls. Those
samples were prepared by mechanical dissociation of the fixed cells from the 384 well plates from one
of the tertiary screen experiments, followed by pooling of the quadruplicates in one sample, in order to
provide enough cell numbers and sample volume. Of note, only directionality of effect, and not effect
size, could be confirmed through this technique because it had not undergone rigorous optimization and
miniaturization as the imaging-based HTS had. 82% of hits had consistent directionality with the
imaging-based screen. 7 hits were inconsistent (supplementary figure 3e).
As the screen was done using a construct encoding for a fusion protein aSyn-RFP, we counter-screened
the hits against RFP alone. Not surprisingly, since 1) we know that a small amount of RFP alone can
“transfer” between cells (figure 1f) and 2) we are using a nonbiased screen that detects genes that
impact a process that involves both uptake and subsequent stability and cytoplasmic localization of
extracellular proteins, some of the 39 hits also impact the transfer of RFP (supplementary figure 3f,
supplementary table 3). We interpret this to mean that the biology underlying the observed aSyn-RFP
uptake effect for these hits is based on an impact on cell processes important for uptake and
cytoplasmic localization of extracellular proteins.
Pharmacological validation supports the role of SLC30A3, ADAMTS19, POLR2A, POLR2B and WEE1 as
regulators of the spread of a-synuclein
We sought to confirm a subset of hits through an alternative method. For this purpose, we selected
compounds that have been previously reported to target either the product of some of our hits directly,
or one of the pathways mediated by those genes. We transfected HEK-aSyn cells with the GFP-2a-aSyn-
.CC-BY-NC-ND 4.0 International license(which was not certified by peer review) is the author/funder. It is made available under aThe copyright holder for this preprintthis version posted December 23, 2019. . https://doi.org/10.1101/2019.12.23.886838doi: bioRxiv preprint
RFP construct and the following day treated them with various concentrations of the aforementioned
compounds, including a vehicle-only control, to generate the dose-response curves. After 5 days, the
cells were collected and stained with a far red live dead staining, followed by analysis through flow
cytometry.
The zinc chelator N,N,N′,N′-Tetrakis(2-pyridylmethyl)ethylenediamine, treatment which is likely
analogous to silencing ADAMTS19 (a zinc-dependent metalloproteinase) and SLC30A3 (a protein that
mediates accumulation of zinc in synaptic vesicles), showed a significant dose-dependent effect, with
the highest concentrations resulting in an increase in cell-to-cell transfer of a-synuclein (figure 4a) and
toxicity levels indistinguishable from those of the vehicle-only control (figure 4b). A similar dose-
response was not seen in the vehicle-only control experiment (supplementary figure 4a). The
directionality of this effect is consistent with that seen during the high throughput imaging-based
screens, where silencing of those genes is also associated with an increased cell-to-cell transfer of a-
synuclein.
A-amanitin, which is a selective inhibitor of polymerase II and III, the protein produced by the POLR2A
and POLR2B genes, showed a dose-dependent effect, with higher doses reducing the cell-to-cell transfer
of a-synuclein, which, however, was not statistically significant (figure 4c,d). Nevertheless, the
directionality of this effect was consistent with what was seen in the imaging-based screen, where
silencing of POLR2A and POLR2B also reduced a-synuclein’s cell-to-cell transfer. Of note, A-amanitin was
reconstituted in water, therefore that dose-response effect cannot be attributed to the increasing
concentration of the vehicle. POLR2A and POLR2B were two of the genes whose directionality was
inconsistent between the imaging-based screen and the confirmatory analysis through flow cytometry.
Therefore, this data supports the robustness of the imaging-based data, in cases of conflict with the
confirmatory flow cytometric analysis.
An indolylmethylene-2-indolinone derivative that acts as a Cdk1/cyclin B inhibitor by binding to the ATP
pocket on the Cdk1 active site was also assessed regarding its effect on the cell-to-cell transfer of a-
synuclein. We expected that treatment with this compound would have the opposite effect of WEE1
silencing, given that WEE1 is an inhibitor of Cdk1 (Den Haese et al., 1995). Indeed, treatment with the
Cdk1 inhibitor showed a dose-dependent effect, with higher concentrations having a trend towards
increasing the cell-to-cell transfer of a-synuclein (figure 4e,f), whereas silencing of WEE1 had an
opposite effect. Of note, the dose-response curve for the vehicle (DMSO), showed no trends, with the
rates of the cell-to-cell transfer of a-synuclein being similar between all concentrations assayed
(supplementary figure 4a).
As a control experiment, we assessed the dose-response effect of various concentrations of DMSO and
ethanol (vehicle-only controls) on the cell-to-cell transfer of a-synuclein. The cell-to-cell transfer was
similar between all concentrations assessed and no trends were observed (supplementary figure 4a).
The toxicity rate was also similar between the various concentrations (supplementary figure 4b).
.CC-BY-NC-ND 4.0 International license(which was not certified by peer review) is the author/funder. It is made available under aThe copyright holder for this preprintthis version posted December 23, 2019. . https://doi.org/10.1101/2019.12.23.886838doi: bioRxiv preprint
Assessment of the lysosomal-autophagy axis, mitochondrial membrane potential and cell cycle
progression suggest links of the 39 hits with key functions related to the homeostasis of a-synuclein
We looked for additional evidence supporting the role of our 39 hits in the regulation of a-synuclein
transfer, while simultaneously further dissecting their function. To this end, we optimized three assays
to assess the mitochondrial membrane potential, the lysosomal-autophagy axis and the cell cycle
progression along with RNA quantity per cell cycle phase. We selected those functions because they
have been shown to have a crucial role in the homeostasis of a-synuclein (Kara et al., 2013; Ludtmann et
al., 2016; Ludtmann and Abramov, 2018; Ludtmann et al., 2018; Wang et al., 2019).
LysoTracker is a dye that has been found to localize to the lysosomes and can therefore be used to
indirectly measure lysosomal mass. However, this dye does not exclusively localize to the lysosomes but
is also taken up by organelles with an acidic pH. Therefore, the fluorescence intensity of LysoTracker per
cell is higher when its lysosomes are larger and/or when the pH within the cell and intracellular
organelles is more acidic. MitoTracker is used to assess the mitochondrial membrane potential; cells
with depolarized mitochondria fluoresce less intensely when stained with MitoTracker. For the cell cycle
assay, the cells that were used as positive controls were first treated with actinomycin D, a global
inhibitor of transcription. Thereafter, cells were stained with Hoechst, a dye capable of binding to
double stranded nucleic acids. After 45-75min incubation, pyronin Y, a dye that can stain both single and
double stranded nucleic acids, was added to the cells and incubated for another 45-75min. Addition of
the dyes in that sequence ensured that pyronin Y bound specifically to RNA molecules and, therefore, its
intensity would be correlated to the RNA quantity per cell (Eddaoudi et al., 2018).
We first generated dose-response curves for each of the dyes used in those experiments (LysoTracker
green, MitoTracker red and pyronin) to confirm that the selected concentration was within the linear
range. Those experiments were completed in 24 well plate format. For each concentration of the dye,
we included the appropriate positive and negative controls for the respective assay. For the LysoTracker
assay, chloroquine was the positive control and untreated the negative control (because chloroquine is
reconstituted in water) (figure 5a). For the MitoTracker assay, CCCP was the positive control and DMSO
the negative control (figure 5b). For the cell cycle assay, actinomycin D was the positive control and
DMSO the negative control (figure 5c). The subcellular distribution of the LysoTracker and MitoTracker
dyes was assessed through confocal microscopy (figure 5d).
We also did dose response experiments for the compounds used as positive controls, plus for additional
compounds including rapamycin, torin and bafilomycin for the LysoTracker and MitoTracker assays. We
saw a good dose response for chloroquine and torin in the LysoTracker assay (figure 5e), and for CCCP in
the MitoTracker assay (figure 5f). The rest of the compounds did not have an effect. The ability of the
assay to detect the effect of the positive control was confirmed through using different colors of the
same dyes, namely LysoTracker blue and MitoTracker far red (supplementary figure 5a,b,c).
The LysoTracker and cell cycle assays were successfully miniaturized into a 96 well format to enable
rapid and automatic flow cytometric analysis through the high throughput accessory of the fortessa
.CC-BY-NC-ND 4.0 International license(which was not certified by peer review) is the author/funder. It is made available under aThe copyright holder for this preprintthis version posted December 23, 2019. . https://doi.org/10.1101/2019.12.23.886838doi: bioRxiv preprint
instrument. The predetermined concentrations of the dyes and the compounds were used in that
experiments and gave consistent results with those seen in the 24 well format (figure 5g,h).
The assays were then applied after transfection of HEK-aSyn cells siRNAs against the 38 hits, SNCA or 18
random genes. After 3 days of incubation, the dyes were added to the cells and the samples were
analyzed through flow cytometry. The appropriate positive and negative controls were also included.
While none of the samples reached statistical significance, the top 5 genes increasing LysoTracker and
MitoTracker fluorescence upon silencing were hits from the HTS (figure 5i,j).
For the cell cycle assay, the percentage of the cells in each phase of the cell cycle was quantified (G0G1,
S, G2M). The MFI of Pyronin Y per phase of the cell cycle was also determined. Regarding the transition
between cell cycle phases, none of the results was statistically significant. However, several of the hits
had a tendency to increase cell proliferation, such as WEE1, RRM1, RRM2, FBXO5, AQP1, B9D1 and
POLR2A, as indicated by the fact that a decreased proportion of the cells were in the G0G1 phase and an
increased proportion in phases S and G2M (supplementary figure 5d,e,f). This is consistent with what is
known about the function of WEE1 as a regulator of cell cycle progression through modulation of cdk1
(Den Haese et al., 1995). None of the hits significantly modified the RNA quantity within the cell, though
there were hits whose silencing was associated with a sub-significant modification of RNA levels (figure
5k).
As the readouts were measured 3 days after transfection, the effect of the siRNAs at that time point was
also quantified (supplementary figure g,h).
Weighted gene co-expression network analysis (WGCNA) shows that most of the hits are included in
the same genetic networks as known PD Mendelian and risk genes within the brain
Thanks to genetic studies on familial forms of PD through exome sequencing, linkage analyses and
homozygosity mapping, and on sporadic forms of PD through GWAS, we now know numerous
Mendelian genes and genetic risk factors for this condition (Singleton and Hardy, 2019). We wanted to
assess whether our hits are related to those genes by participating in the same genetic networks. In all
bioinformatics analyses, SNCA was excluded from the list of hits to avoid introducing a PD-favorable
bias; therefore, a total of 38 genes were included in those analyses. For this purpose, we used WGCNA.
This analysis is based on the hypothesis that genes that are co-expressed are functionally related.
Through WGCNA, genes are grouped in modules (clusters) within each tissue studied, based on their
expression patterns. P-values do not matter regarding the relative importance of each module; rather,
the clustering of genes within modules is a qualitative instead of quantitative feature. Those modules
can then be queried for the presence of particular genes, followed by the generation of a GO
enrichment score and p-value for the most enriched annotated functions. Enrichment for cell type-
specific markers can also be assessed (Cahoy et al., 2008; Lein et al., 2007; Miller et al., 2010; Oldham et
al., 2008; Winden et al., 2009).
.CC-BY-NC-ND 4.0 International license(which was not certified by peer review) is the author/funder. It is made available under aThe copyright holder for this preprintthis version posted December 23, 2019. . https://doi.org/10.1101/2019.12.23.886838doi: bioRxiv preprint
WGCNA was performed using the GTEx version 6 dataset. The modules within each tissue assayed were
generated using the recently developed method with an additional k-means clustering step (Botia et al.,
2017). We first assessed the ability of WGCNA to correctly identify functional relationships between
genes and to correctly annotate those relationships and their enrichment for particular cell type
markers. As models for those analyses, we used known Mendelian genes (as catalogued in the Genomics
England Panel App) and risk genes for PD (Nalls et al., 2019) (supplementary table 4), and known risk
genes for Alzheimer’s disease (AD) (Jansen et al., 2019) and focused exclusively on modules within the
brain. The analyses for PD showed that one module passed the p-value threshold after correction for
multiple testings. This module was within the substantia nigra, contained 13 PD Mendelian and risk
genes, was significantly enriched for GO processes including catechol-containing biosynthetic processes,
cell-to-cell signaling, ion transport, and regulation of neurotransmitter levels, and was also enriched for
dopaminergic neuron cell markers (supplementary table 5). Similar analyses for the AD genes showed
several significant modules within the hypothalamus, pituitary, hippocampus, nucleus accumbens,
cortex, cerebellum and caudate nucleus, all of which were enriched for GO functions related to the
immune system and for microglial cell markers (supplementary table 6). Therefore, WGCNA is capable of
correctly identifying functional relationships between genes and classifying them into modules enriched
for functions and cell types experimentally determined to be important in particular disease processes.
We performed a similar analysis for our 38 hits. Assessment of the modules within all brain regions,
after application of a cutoff nominal p-value of 0.05, indicated several modules in which the hits cluster.
Those modules were enriched for GO functions such as protein modification, regulation of gene
expression, cytoskeletal organization, synaptic transmission and organelle organization. Several of the
modules were enriched for neuronal cell markers (table 1). Finally, analysis of the GTEX v6 dataset
showed that 37/38 (97.37%) of the hits were expressed in human brain, with only RRM2 not expressed.
Altogether, those results support a relevance of the 38 hits to neurons.
We then wanted to assess if our genes are functionally related to known PD Mendelian and risk genes
(supplementary table 4). We co-clustered the 38 hits with the PD genes in all brain tissues available in
the GTEx v6 dataset in modules with nominal p values <0.05. Using only hits (37 genes) and PD genes
that are present in the network, we found that 78.38% of the hits were present within modules that
included at least one known PD gene. We then modelled the null distribution of the percentage of genes
overlapping with PD genes by generating 100,000 random simulations, each of which containing 37
genes. Based on the fraction of times that we saw a greater % of overlap of the random gene lists with
the PD genes than the % overlap observed for the 37 hits, an empirical p-value was generated. We
found that the co-clustering of hits with PD genes occurred more frequently than expected by random
chance, with an empirical p-value of 0.014 (supplementary figure 6). The hits that are located in the
same modules as PD Mendelian and risk genes are listed in supplementary table 7.
Finally, we assessed whether the 38 hits had any cell type-specific characteristics. For this purpose, we
performed an expression-weighted cell type analysis (EWCE) (Skene and Grant, 2016). This analysis tests
whether the cell type specificity distribution of a certain gene list is greater in one cell type than would
be expected if a random gene list of the same length that contained genes with a similar length and GC
content was selected. We found the 38 genes to be more highly expressed than expected by chance in
.CC-BY-NC-ND 4.0 International license(which was not certified by peer review) is the author/funder. It is made available under aThe copyright holder for this preprintthis version posted December 23, 2019. . https://doi.org/10.1101/2019.12.23.886838doi: bioRxiv preprint
granule neurons of the dentate gyrus (FDR-adjusted p-value = 0.045). Given the lack of replicability in
other neuronal cell types and the limited availability of single-nuclear RNA-sequencing covering granule
neurons of the dentate gyrus (which meant we could not validate the result), we interpret this result
with some caution.
Weighted Protein-protein Interaction Network Analysis (WPPINA) confirms the functional relation
between the 38 hits and known PD genes
As an additional way of confirming the functional connection between the 38 hits from the screen and
known PD genes, we performed WPPINA. This analysis method was used to mine the literature for
previously published protein-protein interactions and generate the networks that are formed by the
proteins included in the input list. The networks were generated separately for the 38 hits, the PD
Mendelian genes and the PD GWAS risk genes. The network for the 38 hits (hits-network) included 34
seeds (4 hits were excluded as they did not show any interactor surviving our filtering step at the time of
the analysis) plus the direct interactors of the seeds, for a total of 615 nodes. The PD Mendelian network
included 18 seeds plus their direct interactors, for a total of 545 nodes. Finally, the PD risk gene network
included 65 seeds and their direct interactors, total of 902 nodes. The overlap between a) the network
of the hits and the PD Mendelian network, and b) the network of the hits and the PD risk gene network
was then assessed by determining the communal nodes, which could be either seeds or direct
interactors of the seeds. As a negative control, we generated 100,000 random gene lists, each
comprising of 615 genes (to simulate the number of nodes in the real hits-network). We then calculated
the overlap of these random lists with the real PD Mendelian and risk networks. We drew the
distribution curve of random overlaps between the random lists and the (real) PD Mendelian network
(real node matches = 79 vs random nodes matches = 16) and between the random lists and the (real)
risk network (real node matches = 132 vs random nodes matches = 28) indicating that the real networks
intersected more frequently than expected by random chance (supplementary figure 7a and b). A visual
representation of the overlap between those networks is depicted in figure 7a,b. The intersection of the
networks formed by the hits, the PD Mendelian and the PD risk genes contained 50 genes (figure 7c). GO
enrichment analysis of those genes showed that the top 3 most enriched processes were cell signaling
(23.9%), cytoskeleton-mediated transport (22.7%) and cell death (18.2%) (figure 7d).
PD patients do not carry an increased burden of rare variants within the 38 hits in comparison to
healthy controls
We found that the networks formed by the 38 hits significantly overlap with the networks formed by the
PD Mendelian and risk genes. Subsequently, we assessed whether the 38 hits contained risk variants
that directly contribute to the causation of PD. To this end, we used the most recent IPDGC GWAS
summary statistics including 37.7k PD patients, 18.6k UK Biobank proxy-cases, 1.4M controls, and 7.8M
SNPs that identified 90 risk loci contributing to the risk of disease (Nalls et al., 2019). We first compared
.CC-BY-NC-ND 4.0 International license(which was not certified by peer review) is the author/funder. It is made available under aThe copyright holder for this preprintthis version posted December 23, 2019. . https://doi.org/10.1101/2019.12.23.886838doi: bioRxiv preprint
our 38 hits with the top candidates per locus, as determined by previously undertaken eQTL analysis
(Nalls et al., 2019). One gene was in common, ITGA8.
We then checked whether the hits overlapped with PD GWAS loci using a 500kb window up and
downstream the region, to account for synthetic associations. Out of the tested hits, four overlapped,
including ARL6IP4, FBRS, POLR2A and ITGA8. We also generated a list containing all the 1,335 genes
spanning those regions. Statistical analysis using a Fisher’s exact test showed that the clustering of the 4
hits within GWAS loci did not occur more frequently than expected by random chance.
Finally, we performed burden analyses on imputed genotyping data to check whether the 38 hits
contained an increased frequency of rare variants in 21,478 PD patients and 24,388 healthy controls
(IPDGC dataset, excluding 23andMe cohort). The burden was computed in 2 different ways: a) within
each gene individually, b) across WGCNA modules in which the hits clustered. None of the WGCNA
modules showed enrichment after Bonferroni correction for multiple testing. When we looked at the
burdens within each gene individually, no genes were significant after Bonferroni multiple testing
correction (supplementary table 11).
Discussion
We performed an imaging-based siRNA screen to identify genes that regulate the cell-to-cell transfer of
a-synuclein. We identified 38 novel genes that modulate this process, 9 of which decrease and 29 of
which increase the cell-to-cell transfer of a-synuclein upon silencing. Interestingly, silencing the majority
of those genes resulted in the increase of a-synuclein spread, suggesting that the cell has mechanisms
that act as “brakes” preventing the cell-to-cell transfer of this and possibly also other proteins. Those
genes were enriched in functions implicated in the homeostasis and intercellular spread of a-synuclein,
such as cell-to-cell signaling, cytoskeletal-based transport and waste disposal. Several of the identified
genes have been previously linked to the pathogenesis of parkinsonisms and other neurodegenerative
diseases. NFX1 has been identified through a CRISPR-Cas9 screen as a gene that reduces the levels of
dipeptide repeat proteins (DPRs) by lowering the nuclear export of GGGGCCC repeat-containing
transcripts upon silencing (Cheng et al., 2019; Hautbergue et al., 2017). That gene was also identified
through our screen as a reducer of a-synuclein spread upon silencing, presumably through lowering
intracellular levels of a-synuclein, thereby having a consistent directionality of effect as reported in that
c9orf72 screen.
Our screen also identified FBXO5 as a hit that reduces a-synuclein transfer upon silencing. That gene
belongs to the same family as FBXO7, a gene mutated in complex parkinsonisms (Di Fonzo et al., 2009;
Paisan-Ruiz et al., 2010; Zhao et al., 2013) that is involved in mitochondrial homeostasis and in the
ubiquitin ligase complex called SCFs (SKP1-cullin-F-box). FBXO5 is also part of the SCF complex (Randle
and Laman, 2016), and our MitoTracker assay showed that FBXO5 induces mitochondrial depolarization
upon silencing, suggesting a role of that gene in mitochondrial homeostasis as FBXO7 (Burchell et al.,
2013).
.CC-BY-NC-ND 4.0 International license(which was not certified by peer review) is the author/funder. It is made available under aThe copyright holder for this preprintthis version posted December 23, 2019. . https://doi.org/10.1101/2019.12.23.886838doi: bioRxiv preprint
We found that SLC30A3 and ADAMTS19 increase the transfer of a-synuclein when silenced. Both those
genes are implicated in the homeostasis of zinc. SLC30A3 has been implicated in the accumulation of
zinc within the synaptic vesicles in mice (Cole et al., 1999), whereas ADAMTS19 is a member of the
ADAMTS family of zinc-dependent proteases. ADAMTS4, a gene belonging to the same family as
ADAMTS19, has been identified as a candidate risk gene for AD through GWAS (Jansen et al., 2019). We
have further shown that zinc chelation results in an increase of a-synuclein transfer, a directionality that
is consistent with the effect seen when those 2 genes are silenced. There are several lines of evidence
supporting a role of zinc in the pathogenesis of PD. It has been found that the parkinsonism gene
ATP13A2 encodes a zinc pump that facilitates transport of zinc into vesicles (Kong et al., 2014), a similar
function as SLC30A3. While ATP13A2 was not identified as a hit through our screen, silencing of that
gene resulted in a trend towards increased a-synuclein cell-to-cell transfer. Reduced zinc levels in the
serum and plasma have also been found in advanced forms of PD (Du et al., 2017). The exact mechanism
with which zinc modulates the cell-to-cell transfer of a-synuclein remains to be elucidated.
LRP12 and ITGA8 were also identified as hits from our screen. LRP12 belongs to the same family as
LRP10, a gene encoding a low-density lipoprotein receptor-related protein that has been found to carry
risk variants in patients with PD (Quadri et al., 2018). Previously published genetic analyses have already
implicated ITGA8 in the pathogenesis of PD. ITGA8 is a risk gene for PD that was identified in the most
recent PD GWAS meta-analysis (Nalls et al., 2019). In addition, Mendelian Randomization-QTL analyses
showed a significant association between decreased expression of ITGA8 and PD risk in brain caudate
basal ganglia data (Consortium, 2013) (Nalls et al., 2019); concurrently, our data indicated that reduction
in the expression levels of ITGA8 results in an increase in the cell-to-cell transfer of a-synuclein.
Therefore, the directionality of the effect associated to reduction of mRNA levels in both studies is the
same. Finally, ITGA8 downregulation has been found through an unbiased screen to increase the
susceptibility of cells to infection with proteinase K-resistant PrP (PrPsc) (Imberdis and Harris, 2014).
ITGA8 encodes alpha-8 integrin, a heterodimeric transmembrane receptor that is involved in functions
such as cell adhesion, cell signaling and cytoskeletal organization (Humbert et al., 2014), functions that
could all conceivably be related to the cell-to-cell transfer of a-synuclein.
Even though one hit, ITGA8, is the top candidate for a PD GWAS locus, the burden analyses did not
identify an increased frequency of rare variants within the hits in PD patients in comparison to healthy
controls. However, it is still possible that our hits are causal but the current analysis methods and
technologies were not sufficiently powered to detect such variants. GWAS have been designed to detect
common variation related to complex diseases, and rare variants are difficult to impute with accuracy
from that data. In addition, structural variation is not captured in GWAS data.
Our screen had some technical limitations. First, we decided to add an RFP tag to a-synuclein to enable
its detection through imaging, in order to eliminate extra processing steps for antibody staining. It has
been found that addition of a tag to a-synuclein modifies its ability to form aggregates (McLean et al.,
2001), therefore possibly also modifying its ability to spread (Gustafsson et al., 2018). However, we have
controlled for this limitation by including a negative control, GFP-2a-RFP. We found that, while RFP has
the ability to spread, it does so significantly less than the fusion protein a-synuclein-RFP. Second, our
384 well plates sometimes exhibited temperature-related gradients, which could cause poor replicability
.CC-BY-NC-ND 4.0 International license(which was not certified by peer review) is the author/funder. It is made available under aThe copyright holder for this preprintthis version posted December 23, 2019. . https://doi.org/10.1101/2019.12.23.886838doi: bioRxiv preprint
between technical replicates. However, statistical analyses using the Bland-Altman test and the Deming
regression, indicated that replicability between technical replicates is good and, therefore, the plate
gradients do not adversely affect our ability to draw robust conclusions from our screen. Third, we had
to resort to the quantification of “units” transferred from cell-to-cell instead of cells as a readout of the
imaging-based screen. This was because we were unable to segment individual cells due to their high
confluency. Nevertheless, the directionality of the effect was confirmed through single cell flow
cytometric analysis for 82% of the genes. From the 7 inconsistent genes, we looked with more detail
into POLR2A and POLR2B. The imaging-based screen showed a reduction in spread upon their silencing,
while flow cytometry analysis an increase. Pharmacological approximation of their silencing using a-
amanitin, a compound that selectively inhibits polymerases II and III, showed a reduction in the spread
of a-synuclein, which is consistent with the results of the imaging-based screen.
Conversely, our system also has a significant advantage in that it studied the spread of a-synuclein
produced endogenously from the donor, mammalian cells. Our study also did not make any assumptions
about the aggregation status of the transferred species of a-synuclein, given that the nature of this
species is still unclear (Cremades et al., 2012; Kurnik et al., 2018; Volles and Lansbury, 2003). This
presents a considerable advantage over the commonly used system assessing the uptake of a-synuclein
preformed fibrils (PFFs) from recombinant protein, and over systems based on primary neurons or
mouse models. Systems using PFFs presuppose that the spreading species of a-synuclein is the
aggregated, fibrillar form. While data from intracerebral injection of PFFs in mice supports this
hypothesis, there is a growing body of data contradicting this notion and supporting that the pathogenic
species is the oligomeric form (Cremades et al., 2012; Kurnik et al., 2018; Volles and Lansbury, 2003). In
addition, the PFFs are highly artificialized units and it is unclear what, if any, similarities they have to
physiologically produced aggregates (Strohaker et al., 2019). Finally, systems using PFFs do not take into
account the existence of donor cells as potentially crucial partners in the spread of a-synuclein from cell-
to-cell.
A recent study was performed using PFF uptake in primary neuronal and induced pluripotent stem cell
(iPSc) cultures to study the effects of known PD Mendelian genes on the uptake of a-synuclein in the
form of PFFs (Bieri et al., 2019). Among known PD genes, LRRK2 was found to significantly reduce a-
synuclein uptake upon silencing. However, LRRK2 was not identified as a hit in our screen, even though
the directionality of the effect was the same. There are several possible explanations for the
discrepancies between the two studies. First, the model systems used were different, both in terms of
the cell type under study and the source and state of the transferred a-synuclein. Second, the total
number of genes studied was substantially different; the study by Bieri et al included only a small
number of genes, therefore employing less strict p-value cutoffs compared to the ones used in our
study. It is possible that if we had only included the same genes and employed the same p-value cut-
offs, we would have also identified LRRK2 as a modifier of a-synuclein transfer.
The 38 genes that regulate the cell-to-cell transfer of a-synuclein participate in genetic and protein
networks formed by Mendelian and risk PD genes. The fact that there is a genetic overlap between the
phenomenon of a-synuclein spread and the causation of PD indicates that the role of a-synuclein
transfer is a crucial part of the pathogenesis of the disease. Those observations support the validity of
.CC-BY-NC-ND 4.0 International license(which was not certified by peer review) is the author/funder. It is made available under aThe copyright holder for this preprintthis version posted December 23, 2019. . https://doi.org/10.1101/2019.12.23.886838doi: bioRxiv preprint
the “prionoid” hypothesis (Aguzzi et al., 2007; Aguzzi and Rajendran, 2009), in lieu of (or in combination
with) alternative explanations for the progression of a-synuclein pathology such as the selective
vulnerability hypothesis (Alegre-Abarrategui et al., 2019; Fu et al., 2018; Hardy, 2016).
The data generated by our screen could be consistent with the “omnigenic” model of disease, a recently
formulated, intriguing hypothesis regarding the genetic causes of complex diseases such as PD and AD
(Boyle et al., 2017; Wray et al., 2018). A few protein-coding genes and their direct regulators (termed
”core genes”) carry highly penetrant mutations inherited in a Mendelian fashion that cause a particular
disease. However, GWAS have found that the majority of the known genetic causes of complex disease
are common, low effect size variants found primarily within non-coding and regulatory regions. The
omnigenic model proposes that any genes expressed within tissues affected by the particular disease
process are likely to be functionally linked to the “core” disease genes; any variant within those genes
can have a regulatory effect on the “core” genes, and therefore even minimally affect disease
pathogenesis. Consequently, genetic variants could be classified into three categories: a) highly
penetrant mutations in core genes causing Mendelian forms of the disease, b) lower penetrant risk
variants usually within intergenic non-coding, regulatory regions, with sufficient effect size to enable
detection through GWAS, and c) variants of variable frequency but very low effect size that are located
within housekeeping genes or regulatory regions. While the first 2 types can be identified using
conventional genetic approaches, the third category is notoriously difficult to study because of the low
effect size of the variants, low penetrance, and requirement of very large case-control cohorts that are
exceedingly difficult to assemble and costly to analyze through GWAS and exome sequencing. The data
generated through our screen support this model because the identified hits encode genes with
housekeeping functions, or with a regulatory role in gene expression, and are located within the same
genetic networks as genes included in categories 1 and 2. Given the critical functions in cellular
homeostasis in which those genes are implicated, it is conceivable that fully penetrant mutations within
those genes could be too deleterious to be compatible with life. Therefore, only variants of a low effect
size, with a weak regulatory, disease-modifying role, could be tolerated within those genes. Such genes
could be identified through functional screens in which genome-wide, gene-by-gene silencing is
followed by a functional readout for a particular trait related to a disease. Our work provides a
framework for such a gene discovery strategy that could be applied to complex diseases when
conventional approaches are nearing limits of what is achievable.
In conclusion, this study has identified 38 genes that integrate within PD genetic networks and have a
regulatory role on the cell-to-cell transfer or a-synuclein. Future perspectives include a more detailed
dissection of the functions of those genes and of the ways in which they interact with PD Mendelian and
risk genes.
Acknowledgments
Imaging was performed with support of the Center for Microscopy and Image Analysis, University of
Zurich. Flow cytometry was performed with equipment of the flow cytometry facility, University of
.CC-BY-NC-ND 4.0 International license(which was not certified by peer review) is the author/funder. It is made available under aThe copyright holder for this preprintthis version posted December 23, 2019. . https://doi.org/10.1101/2019.12.23.886838doi: bioRxiv preprint
Zurich. RNA sequencing experiments and basic data analyses were performed at the functional
genomics center Zurich (FGCZ). EK is the recipient of an HFSP long term fellowship (LT001044/2017), a
Dr. Wilhelm Hurka Foundation project grant and an EMBO long term fellowship (ATLF-815-2014, which
is co-funded by the Marie Curie Actions of the European Commission (LTFCOFUND2013, GA-2013-
609409)). AA is the recipient of an Advanced Grant of the European Research Council (ERC 250356) and
is supported by grants from the Swiss National Foundation (SNF, including a Sinergia grant), the Swiss
Initiative in Systems Biology, SystemsX.ch(PrionX, SynucleiX), the Klinische Forschungsschwerpunkte
(KFSPs) “small RNAs” and “Human Hemato‐Lymphatic Diseases,” and a Distinguished Investigator Award
of the NOMIS Stiftung. This work was supported by the UK Dementia Research Institute, which receives
its funding from DRI Ltd, funded by the UK Medical Research Council, Alzheimer’s Society and
Alzheimer’s Research UK. JH is supported by the Medical Research Council (award number
MR/N026004/1), the Wellcome Trust (award number 202903/Z/16/Z), the Dolby Family Fund, the
National Institute for Health Research University College London Hospitals Biomedical Research Centre
and the BRCNIHR Biomedical Research Centre at University College London Hospitals NHS Foundation
Trust and University College London. This work was supported in part by the Intramural Research
Programs of the National Institute of Neurological Disorders and Stroke (NINDS), the National Institute
on Aging (NIA), and the National Institute of Environmental Health Sciences both part of the National
Institutes of Health, Department of Health and Human Services; project numbers 1ZIA-NS003154, Z01-
AG000949-02 and Z01-ES101986. The funders played no role in study design, data collection and
analysis, decision to publish, or preparation of the manuscript. We would like to thank Gilles Kratzer
(UZH Institute of mathematics) for expert advice on statistical analyses, Dr. Kelvin Luk (University of
Pennsylvania) for providing us with vials of their HEK QBI wt synuclein cell line, Dr. Berend Snijder for
allowing us access to his Opera Phenix for imaging a subset of plates, Dr. Giancarlo Russo for assistance
with RNA sequencing analysis and data management, and Rita Moos and Jacqueline Wiedler for
assistance with ordering consumables and grant administration.
Statement of contribution
Acquired funding: AA, EK, BTH, JH, MR, PAL. Supervised study: AA, BTH, JH, MR, PAL, JB, EK, AT.
Performed clonings: EK, ZF, JDM, AW. Performed and optimized HTS imaging: EK, CA. Optimized and
performed wet lab experiments for HTS: EK. Performed and optimized confocal imaging: EK. Printed
siRNAs: EK, MC, ME, MA, DH, ACarrella, DS, LM, DP, AW. Analyzed GWAS data: SBC, CB. Analyzed gene
expression data: JB, EK, KD, RR, MR, SGR. Analyzed protein protein network interaction data: CM, PAL.
Performed flow cytometry: EK, AW. Performed FACS: ML, VL, EK, AW. Performed western blot: EK.
Performed qPCR: EK. Performed tissue culture: EK, AW, SCH, JDM. Optimized and maintained robotics
and provided critical advice on robotics usage: ME. Analyzed wet lab data: EK, ACrimi, AW, AChincisan.
Wrote code for analysis of HTS data: ACrimi, AChincisan. RNA sequencing: AM, DH, MA, EK. Wrote the
manuscript: EK, AA. Edited manuscript: all authors.
.CC-BY-NC-ND 4.0 International license(which was not certified by peer review) is the author/funder. It is made available under aThe copyright holder for this preprintthis version posted December 23, 2019. . https://doi.org/10.1101/2019.12.23.886838doi: bioRxiv preprint
Declaration of interests
The authors declare no competing interests.
References
Aguzzi, A., Heikenwalder, M., and Polymenidou, M. (2007). Insights into prion strains and neurotoxicity. Nat Rev Mol Cell Biol 8, 552-561. Aguzzi, A., and Rajendran, L. (2009). The transcellular spread of cytosolic amyloids, prions, and prionoids. Neuron 64, 783-790. Alegre-Abarrategui, J., Brimblecombe, K.R., Roberts, R.F., Velentza-Almpani, E., Tilley, B.S., Bengoa-Vergniory, N., and Proukakis, C. (2019). Selective vulnerability in alpha-synucleinopathies. Acta Neuropathol 138, 681-704. Bieri, G., Brahic, M., Bousset, L., Couthouis, J., Kramer, N.J., Ma, R., Nakayama, L., Monbureau, M., Defensor, E., Schule, B., et al. (2019). LRRK2 modifies alpha-syn pathology and spread in mouse models and human neurons. Acta Neuropathol 137, 961-980. Bolger, A.M., Lohse, M., and Usadel, B. (2014). Trimmomatic: a flexible trimmer for Illumina sequence data. Bioinformatics 30, 2114-2120. Botia, J.A., Vandrovcova, J., Forabosco, P., Guelfi, S., D'Sa, K., United Kingdom Brain Expression, C., Hardy, J., Lewis, C.M., Ryten, M., and Weale, M.E. (2017). An additional k-means clustering step improves the biological features of WGCNA gene co-expression networks. BMC Syst Biol 11, 47. Boyle, E.A., Li, Y.I., and Pritchard, J.K. (2017). An Expanded View of Complex Traits: From Polygenic to Omnigenic. Cell 169, 1177-1186. Braak, H., Del Tredici, K., Rub, U., de Vos, R.A., Jansen Steur, E.N., and Braak, E. (2003). Staging of brain pathology related to sporadic Parkinson's disease. Neurobiology of aging 24, 197-211. Burchell, V.S., Nelson, D.E., Sanchez-Martinez, A., Delgado-Camprubi, M., Ivatt, R.M., Pogson, J.H., Randle, S.J., Wray, S., Lewis, P.A., Houlden, H., et al. (2013). The Parkinson's disease-linked proteins Fbxo7 and Parkin interact to mediate mitophagy. Nat Neurosci 16, 1257-1265. Cahoy, J.D., Emery, B., Kaushal, A., Foo, L.C., Zamanian, J.L., Christopherson, K.S., Xing, Y., Lubischer, J.L., Krieg, P.A., Krupenko, S.A., et al. (2008). A transcriptome database for astrocytes, neurons, and oligodendrocytes: a new resource for understanding brain development and function. J Neurosci 28, 264-278. Campbell, R.E., Tour, O., Palmer, A.E., Steinbach, P.A., Baird, G.S., Zacharias, D.A., and Tsien, R.Y. (2002). A monomeric red fluorescent protein. Proc Natl Acad Sci U S A 99, 7877-7882. Cheng, W., Wang, S., Zhang, Z., Morgens, D.W., Hayes, L.R., Lee, S., Portz, B., Xie, Y., Nguyen, B.V., Haney, M.S., et al. (2019). CRISPR-Cas9 Screens Identify the RNA Helicase DDX3X as a Repressor of C9ORF72 (GGGGCC)n Repeat-Associated Non-AUG Translation. Neuron. Chikte, S., Panchal, N., and Warnes, G. (2014). Use of LysoTracker dyes: a flow cytometric study of autophagy. Cytometry A 85, 169-178. Cole, T.B., Wenzel, H.J., Kafer, K.E., Schwartzkroin, P.A., and Palmiter, R.D. (1999). Elimination of zinc from synaptic vesicles in the intact mouse brain by disruption of the ZnT3 gene. Proc Natl Acad Sci U S A 96, 1716-1721. Consortium, G.T. (2013). The Genotype-Tissue Expression (GTEx) project. Nat Genet 45, 580-585. Cremades, N., Cohen, S.I., Deas, E., Abramov, A.Y., Chen, A.Y., Orte, A., Sandal, M., Clarke, R.W., Dunne, P., Aprile, F.A., et al. (2012). Direct observation of the interconversion of normal and toxic forms of alpha-synuclein. Cell 149, 1048-1059.
.CC-BY-NC-ND 4.0 International license(which was not certified by peer review) is the author/funder. It is made available under aThe copyright holder for this preprintthis version posted December 23, 2019. . https://doi.org/10.1101/2019.12.23.886838doi: bioRxiv preprint
de Calignon, A., Polydoro, M., Suarez-Calvet, M., William, C., Adamowicz, D.H., Kopeikina, K.J., Pitstick, R., Sahara, N., Ashe, K.H., Carlson, G.A., et al. (2012). Propagation of tau pathology in a model of early Alzheimer's disease. Neuron 73, 685-697. Den Haese, G.J., Walworth, N., Carr, A.M., and Gould, K.L. (1995). The Wee1 protein kinase regulates T14 phosphorylation of fission yeast Cdc2. Molecular biology of the cell 6, 371-385. Di Fonzo, A., Dekker, M.C., Montagna, P., Baruzzi, A., Yonova, E.H., Correia Guedes, L., Szczerbinska, A., Zhao, T., Dubbel-Hulsman, L.O., Wouters, C.H., et al. (2009). FBXO7 mutations cause autosomal recessive, early-onset parkinsonian-pyramidal syndrome. Neurology 72, 240-245. Dobin, A., Davis, C.A., Schlesinger, F., Drenkow, J., Zaleski, C., Jha, S., Batut, P., Chaisson, M., and Gingeras, T.R. (2013). STAR: ultrafast universal RNA-seq aligner. Bioinformatics 29, 15-21. Du, K., Liu, M.Y., Zhong, X., and Wei, M.J. (2017). Decreased circulating Zinc levels in Parkinson's disease: a meta-analysis study. Sci Rep 7, 3902. Eddaoudi, A., Canning, S.L., and Kato, I. (2018). Flow Cytometric Detection of G0 in Live Cells by Hoechst 33342 and Pyronin Y Staining. Methods in molecular biology (Clifton, NJ) 1686, 49-57. Ferrari, R., Kia, D.A., Tomkins, J.E., Hardy, J., Wood, N.W., Lovering, R.C., Lewis, P.A., and Manzoni, C. (2018). Stratification of candidate genes for Parkinson's disease using weighted protein-protein interaction network analysis. BMC Genomics 19, 452. Ferrari, R., Lovering, R.C., Hardy, J., Lewis, P.A., and Manzoni, C. (2017). Weighted Protein Interaction Network Analysis of Frontotemporal Dementia. J Proteome Res 16, 999-1013. Fu, H., Hardy, J., and Duff, K.E. (2018). Selective vulnerability in neurodegenerative diseases. Nat Neurosci 21, 1350-1358. Guo, J.L., and Lee, V.M. (2014). Cell-to-cell transmission of pathogenic proteins in neurodegenerative diseases. Nat Med 20, 130-138. Gustafsson, G., Loov, C., Persson, E., Lazaro, D.F., Takeda, S., Bergstrom, J., Erlandsson, A., Sehlin, D., Balaj, L., Gyorgy, B., et al. (2018). Secretion and Uptake of alpha-Synuclein Via Extracellular Vesicles in Cultured Cells. Cell Mol Neurobiol 38, 1539-1550. Habib, N., Avraham-Davidi, I., Basu, A., Burks, T., Shekhar, K., Hofree, M., Choudhury, S.R., Aguet, F., Gelfand, E., Ardlie, K., et al. (2017). Massively parallel single-nucleus RNA-seq with DroNc-seq. Nat Methods 14, 955-958. Hardy, J. (2005). Expression of normal sequence pathogenic proteins for neurodegenerative disease contributes to disease risk: 'permissive templating' as a general mechanism underlying neurodegeneration. Biochem Soc Trans 33, 578-581. Hardy, J. (2016). Catastrophic cliffs: a partial suggestion for selective vulnerability in neurodegenerative diseases. Biochem Soc Trans 44, 659-661. Hautbergue, G.M., Castelli, L.M., Ferraiuolo, L., Sanchez-Martinez, A., Cooper-Knock, J., Higginbottom, A., Lin, Y.H., Bauer, C.S., Dodd, J.E., Myszczynska, M.A., et al. (2017). SRSF1-dependent nuclear export inhibition of C9ORF72 repeat transcripts prevents neurodegeneration and associated motor deficits. Nature communications 8, 16063. Hawrylycz, M.J., Lein, E.S., Guillozet-Bongaarts, A.L., Shen, E.H., Ng, L., Miller, J.A., van de Lagemaat, L.N., Smith, K.A., Ebbert, A., Riley, Z.L., et al. (2012). An anatomically comprehensive atlas of the adult human brain transcriptome. Nature 489, 391-399. Humbert, C., Silbermann, F., Morar, B., Parisot, M., Zarhrate, M., Masson, C., Tores, F., Blanchet, P., Perez, M.J., Petrov, Y., et al. (2014). Integrin alpha 8 recessive mutations are responsible for bilateral renal agenesis in humans. Am J Hum Genet 94, 288-294. Imberdis, T., and Harris, D.A. (2014). Prion permissive pathways: extracellular matrix genes control susceptibility to prion infection. EMBO J 33, 1506-1508.
.CC-BY-NC-ND 4.0 International license(which was not certified by peer review) is the author/funder. It is made available under aThe copyright holder for this preprintthis version posted December 23, 2019. . https://doi.org/10.1101/2019.12.23.886838doi: bioRxiv preprint
Jansen, I.E., Savage, J.E., Watanabe, K., Bryois, J., Williams, D.M., Steinberg, S., Sealock, J., Karlsson, I.K., Hagg, S., Athanasiu, L., et al. (2019). Genome-wide meta-analysis identifies new loci and functional pathways influencing Alzheimer's disease risk. Nat Genet 51, 404-413. Kara, E., Hardy, J., and Houlden, H. (2013). The pallidopyramidal syndromes: nosology, aetiology and pathogenesis. Curr Opin Neurol 26, 381-394. Kara, E., Marks, J.D., Fan, Z., Klickstein, J.A., Roe, A.D., Krogh, K.A., Wegmann, S., Maesako, M., Luo, C.C., Mylvaganam, R., et al. (2017). Isoform- and cell type-specific structure of apolipoprotein E lipoparticles as revealed by a novel Forster resonance energy transfer assay. J Biol Chem 292, 14720-14729. Kara, E., Marks, J.D., Roe, A.D., Commins, C., Fan, Z., Calvo-Rodriguez, M., Wegmann, S., Hudry, E., and Hyman, B.T. (2018). A flow cytometry-based in vitro assay reveals that formation of apolipoprotein E (ApoE)-amyloid beta complexes depends on ApoE isoform and cell type. J Biol Chem 293, 13247-13256. Kong, S.M., Chan, B.K., Park, J.S., Hill, K.J., Aitken, J.B., Cottle, L., Farghaian, H., Cole, A.R., Lay, P.A., Sue, C.M., et al. (2014). Parkinson's disease-linked human PARK9/ATP13A2 maintains zinc homeostasis and promotes alpha-Synuclein externalization via exosomes. Hum Mol Genet 23, 2816-2833. Kordower, J.H., Chu, Y., Hauser, R.A., Freeman, T.B., and Olanow, C.W. (2008). Lewy body-like pathology in long-term embryonic nigral transplants in Parkinson's disease. Nat Med 14, 504-506. Kurnik, M., Sahin, C., Andersen, C.B., Lorenzen, N., Giehm, L., Mohammad-Beigi, H., Jessen, C.M., Pedersen, J.S., Christiansen, G., Petersen, S.V., et al. (2018). Potent alpha-Synuclein Aggregation Inhibitors, Identified by High-Throughput Screening, Mainly Target the Monomeric State. Cell Chem Biol 25, 1389-1402 e1389. Lawrence, M., Huber, W., Pages, H., Aboyoun, P., Carlson, M., Gentleman, R., Morgan, M.T., and Carey, V.J. (2013). Software for computing and annotating genomic ranges. PLoS Comput Biol 9, e1003118. Lein, E.S., Hawrylycz, M.J., Ao, N., Ayres, M., Bensinger, A., Bernard, A., Boe, A.F., Boguski, M.S., Brockway, K.S., Byrnes, E.J., et al. (2007). Genome-wide atlas of gene expression in the adult mouse brain. Nature 445, 168-176. Li, J.Y., Englund, E., Holton, J.L., Soulet, D., Hagell, P., Lees, A.J., Lashley, T., Quinn, N.P., Rehncrona, S., Bjorklund, A., et al. (2008). Lewy bodies in grafted neurons in subjects with Parkinson's disease suggest host-to-graft disease propagation. Nat Med 14, 501-503. Ludtmann, M.H., Angelova, P.R., Ninkina, N.N., Gandhi, S., Buchman, V.L., and Abramov, A.Y. (2016). Monomeric Alpha-Synuclein Exerts a Physiological Role on Brain ATP Synthase. J Neurosci 36, 10510-10521. Ludtmann, M.H.R., and Abramov, A.Y. (2018). Mitochondrial calcium imbalance in Parkinson's disease. Neurosci Lett 663, 86-90. Ludtmann, M.H.R., Angelova, P.R., Horrocks, M.H., Choi, M.L., Rodrigues, M., Baev, A.Y., Berezhnov, A.V., Yao, Z., Little, D., Banushi, B., et al. (2018). alpha-synuclein oligomers interact with ATP synthase and open the permeability transition pore in Parkinson's disease. Nature communications 9, 2293. Luk, K.C., Covell, D.J., Kehm, V.M., Zhang, B., Song, I.Y., Byrne, M.D., Pitkin, R.M., Decker, S.C., Trojanowski, J.Q., and Lee, V.M. (2016). Molecular and Biological Compatibility with Host Alpha-Synuclein Influences Fibril Pathogenicity. Cell Rep 16, 3373-3387. Luk, K.C., Kehm, V., Carroll, J., Zhang, B., O'Brien, P., Trojanowski, J.Q., and Lee, V.M. (2012). Pathological alpha-synuclein transmission initiates Parkinson-like neurodegeneration in nontransgenic mice. Science 338, 949-953. Luk, K.C., and Lee, V.M. (2014). Modeling Lewy pathology propagation in Parkinson's disease. Parkinsonism & related disorders 20 Suppl 1, S85-87. Luk, K.C., Song, C., O'Brien, P., Stieber, A., Branch, J.R., Brunden, K.R., Trojanowski, J.Q., and Lee, V.M. (2009). Exogenous alpha-synuclein fibrils seed the formation of Lewy body-like intracellular inclusions in cultured cells. Proc Natl Acad Sci U S A 106, 20051-20056.
.CC-BY-NC-ND 4.0 International license(which was not certified by peer review) is the author/funder. It is made available under aThe copyright holder for this preprintthis version posted December 23, 2019. . https://doi.org/10.1101/2019.12.23.886838doi: bioRxiv preprint
McLean, P.J., Kawamata, H., and Hyman, B.T. (2001). Alpha-synuclein-enhanced green fluorescent protein fusion proteins form proteasome sensitive inclusions in primary neurons. Neuroscience 104, 901-912. Miller, J.A., Horvath, S., and Geschwind, D.H. (2010). Divergence of human and mouse brain transcriptome highlights Alzheimer disease pathways. Proc Natl Acad Sci U S A 107, 12698-12703. Nalls, M.A., Blauwendraat, C., Vallerga, C.L., Heilbron, K., Bandres-Ciga, S., Chang, D., Tan, M., Kia, D.A., Noyce, A.J., Xue, A., et al. (2019). Identification of novel risk loci, causal insights, and heritable risk for Parkinson's disease: a meta-analysis of genome-wide association studies. Lancet Neurol 18, 1091-1102. Oldham, M.C., Konopka, G., Iwamoto, K., Langfelder, P., Kato, T., Horvath, S., and Geschwind, D.H. (2008). Functional organization of the transcriptome in human brain. Nat Neurosci 11, 1271-1282. Paisan-Ruiz, C., Guevara, R., Federoff, M., Hanagasi, H., Sina, F., Elahi, E., Schneider, S.A., Schwingenschuh, P., Bajaj, N., Emre, M., et al. (2010). Early-onset L-dopa-responsive parkinsonism with pyramidal signs due to ATP13A2, PLA2G6, FBXO7 and spatacsin mutations. Movement disorders : official journal of the Movement Disorder Society 25, 1791-1800. Pease, D., Scheckel, C., Schaper, E., Eckhardt, V., Emmenegger, M., Xenarios, I., and Aguzzi, A. (2019). Genome-wide identification of microRNAs regulating the human prion protein. Brain pathology (Zurich, Switzerland) 29, 232-244. Quadri, M., Mandemakers, W., Grochowska, M.M., Masius, R., Geut, H., Fabrizio, E., Breedveld, G.J., Kuipers, D., Minneboo, M., Vergouw, L.J.M., et al. (2018). LRP10 genetic variants in familial Parkinson's disease and dementia with Lewy bodies: a genome-wide linkage and sequencing study. Lancet Neurol 17, 597-608. Randle, S.J., and Laman, H. (2016). F-box protein interactions with the hallmark pathways in cancer. Semin Cancer Biol 36, 3-17. Rey, N.L., George, S., Steiner, J.A., Madaj, Z., Luk, K.C., Trojanowski, J.Q., Lee, V.M., and Brundin, P. (2018). Spread of aggregates after olfactory bulb injection of alpha-synuclein fibrils is associated with early neuronal loss and is reduced long term. Acta Neuropathol 135, 65-83. Rey, N.L., Petit, G.H., Bousset, L., Melki, R., and Brundin, P. (2013). Transfer of human alpha-synuclein from the olfactory bulb to interconnected brain regions in mice. Acta Neuropathol 126, 555-573. Rey, N.L., Steiner, J.A., Maroof, N., Luk, K.C., Madaj, Z., Trojanowski, J.Q., Lee, V.M., and Brundin, P. (2016). Widespread transneuronal propagation of alpha-synucleinopathy triggered in olfactory bulb mimics prodromal Parkinson's disease. The Journal of experimental medicine 213, 1759-1778. Robinson, M.D., McCarthy, D.J., and Smyth, G.K. (2010). edgeR: a Bioconductor package for differential expression analysis of digital gene expression data. Bioinformatics 26, 139-140. Sacino, A.N., Brooks, M., McGarvey, N.H., McKinney, A.B., Thomas, M.A., Levites, Y., Ran, Y., Golde, T.E., and Giasson, B.I. (2013). Induction of CNS alpha-synuclein pathology by fibrillar and non-amyloidogenic recombinant alpha-synuclein. Acta Neuropathol Commun 1, 38. Singleton, A., and Hardy, J. (2019). Progress in the genetic analysis of Parkinson's disease. Hum Mol Genet 28, R215-R218. Skene, N.G., and Grant, S.G. (2016). Identification of Vulnerable Cell Types in Major Brain Disorders Using Single Cell Transcriptomes and Expression Weighted Cell Type Enrichment. Frontiers in neuroscience 10, 16. Strohaker, T., Jung, B.C., Liou, S.H., Fernandez, C.O., Riedel, D., Becker, S., Halliday, G.M., Bennati, M., Kim, W.S., Lee, S.J., et al. (2019). Structural heterogeneity of alpha-synuclein fibrils amplified from patient brain extracts. Nat Commun 10, 5535. Surmeier, D.J., Obeso, J.A., and Halliday, G.M. (2017). Parkinson's Disease Is Not Simply a Prion Disorder. J Neurosci 37, 9799-9807.
.CC-BY-NC-ND 4.0 International license(which was not certified by peer review) is the author/funder. It is made available under aThe copyright holder for this preprintthis version posted December 23, 2019. . https://doi.org/10.1101/2019.12.23.886838doi: bioRxiv preprint
Thakur, P., Breger, L.S., Lundblad, M., Wan, O.W., Mattsson, B., Luk, K.C., Lee, V.M.Y., Trojanowski, J.Q., and Bjorklund, A. (2017). Modeling Parkinson's disease pathology by combination of fibril seeds and alpha-synuclein overexpression in the rat brain. Proc Natl Acad Sci U S A 114, E8284-e8293. Volles, M.J., and Lansbury, P.T., Jr. (2003). Zeroing in on the pathogenic form of alpha-synuclein and its mechanism of neurotoxicity in Parkinson's disease. Biochemistry 42, 7871-7878. Volpicelli-Daley, L.A., Luk, K.C., and Lee, V.M. (2014). Addition of exogenous alpha-synuclein preformed fibrils to primary neuronal cultures to seed recruitment of endogenous alpha-synuclein to Lewy body and Lewy neurite-like aggregates. Nature protocols 9, 2135-2146. Volpicelli-Daley, L.A., Luk, K.C., Patel, T.P., Tanik, S.A., Riddle, D.M., Stieber, A., Meaney, D.F., Trojanowski, J.Q., and Lee, V.M. (2011). Exogenous alpha-synuclein fibrils induce Lewy body pathology leading to synaptic dysfunction and neuron death. Neuron 72, 57-71. Wang, X., Becker, K., Levine, N., Zhang, M., Lieberman, A.P., Moore, D.J., and Ma, J. (2019). Pathogenic alpha-synuclein aggregates preferentially bind to mitochondria and affect cellular respiration. Acta Neuropathol Commun 7, 41. Wegmann, S., Bennett, R.E., Delorme, L., Robbins, A.B., Hu, M., McKenzie, D., Kirk, M.J., Schiantarelli, J., Tunio, N., Amaral, A.C., et al. (2019). Experimental evidence for the age dependence of tau protein spread in the brain. Sci Adv 5, eaaw6404. Wegmann, S., Maury, E.A., Kirk, M.J., Saqran, L., Roe, A., DeVos, S.L., Nicholls, S., Fan, Z., Takeda, S., Cagsal-Getkin, O., et al. (2015). Removing endogenous tau does not prevent tau propagation yet reduces its neurotoxicity. EMBO J 34, 3028-3041. Winden, K.D., Oldham, M.C., Mirnics, K., Ebert, P.J., Swan, C.H., Levitt, P., Rubenstein, J.L., Horvath, S., and Geschwind, D.H. (2009). The organization of the transcriptional network in specific neuronal classes. Mol Syst Biol 5, 291. Wray, N.R., Wijmenga, C., Sullivan, P.F., Yang, J., and Visscher, P.M. (2018). Common Disease Is More Complex Than Implied by the Core Gene Omnigenic Model. Cell 173, 1573-1580. Xiao, B., Deng, X., Zhou, W., and Tan, E.K. (2016). Flow Cytometry-Based Assessment of Mitophagy Using MitoTracker. Front Cell Neurosci 10, 76. Zhang, X.D. (2008). Novel analytic criteria and effective plate designs for quality control in genome-scale RNAi screens. J Biomol Screen 13, 363-377. Zhao, T., Severijnen, L.A., van der Weiden, M., Zheng, P.P., Oostra, B.A., Hukema, R.K., Willemsen, R., Kros, J.M., and Bonifati, V. (2013). FBXO7 immunoreactivity in alpha-synuclein-containing inclusions in Parkinson disease and multiple system atrophy. Journal of neuropathology and experimental neurology 72, 482-488.
.CC-BY-NC-ND 4.0 International license(which was not certified by peer review) is the author/funder. It is made available under aThe copyright holder for this preprintthis version posted December 23, 2019. . https://doi.org/10.1101/2019.12.23.886838doi: bioRxiv preprint
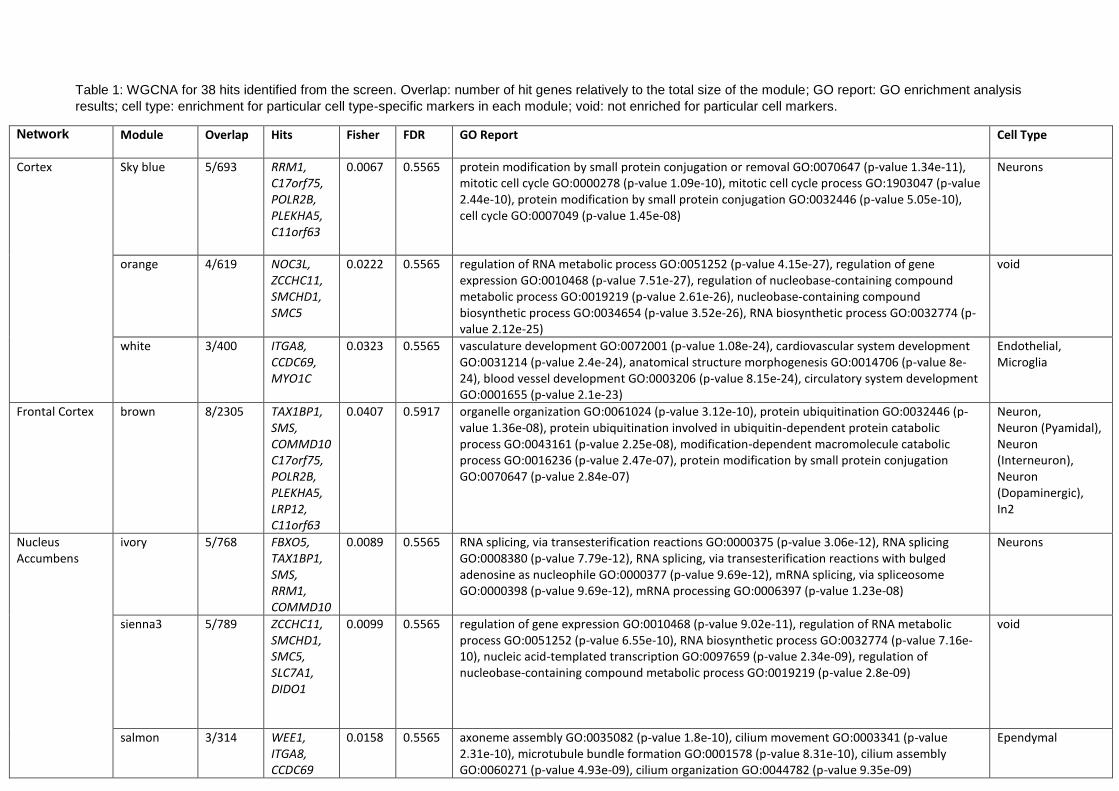
Table 1: WGCNA for 38 hits identified from the screen. Overlap: number of hit genes relatively to the total size of the module; GO report: GO enrichment analysis
results; cell type: enrichment for particular cell type-specific markers in each module; void: not enriched for particular cell markers.
Network Module
Overlap
Hits
Fisher
FDR
GO Report
Cell Type
Cortex
Sky blue
5/693
RRM1, C17orf75, POLR2B, PLEKHA5, C11orf63
0.0067
0.5565
protein modification by small protein conjugation or removal GO:0070647 (p-value 1.34e-11), mitotic cell cycle GO:0000278 (p-value 1.09e-10), mitotic cell cycle process GO:1903047 (p-value 2.44e-10), protein modification by small protein conjugation GO:0032446 (p-value 5.05e-10), cell cycle GO:0007049 (p-value 1.45e-08)
Neurons
orange
4/619
NOC3L, ZCCHC11, SMCHD1, SMC5
0.0222
0.5565
regulation of RNA metabolic process GO:0051252 (p-value 4.15e-27), regulation of gene expression GO:0010468 (p-value 7.51e-27), regulation of nucleobase-containing compound metabolic process GO:0019219 (p-value 2.61e-26), nucleobase-containing compound biosynthetic process GO:0034654 (p-value 3.52e-26), RNA biosynthetic process GO:0032774 (p-value 2.12e-25)
void
white
3/400
ITGA8, CCDC69, MYO1C
0.0323
0.5565
vasculature development GO:0072001 (p-value 1.08e-24), cardiovascular system development GO:0031214 (p-value 2.4e-24), anatomical structure morphogenesis GO:0014706 (p-value 8e-24), blood vessel development GO:0003206 (p-value 8.15e-24), circulatory system development GO:0001655 (p-value 2.1e-23)
Endothelial, Microglia
Frontal Cortex
brown
8/2305
TAX1BP1, SMS, COMMD10 C17orf75, POLR2B, PLEKHA5, LRP12, C11orf63
0.0407
0.5917
organelle organization GO:0061024 (p-value 3.12e-10), protein ubiquitination GO:0032446 (p-value 1.36e-08), protein ubiquitination involved in ubiquitin-dependent protein catabolic process GO:0043161 (p-value 2.25e-08), modification-dependent macromolecule catabolic process GO:0016236 (p-value 2.47e-07), protein modification by small protein conjugation GO:0070647 (p-value 2.84e-07)
Neuron, Neuron (Pyamidal), Neuron (Interneuron), Neuron (Dopaminergic), In2
Nucleus Accumbens
ivory
5/768
FBXO5, TAX1BP1, SMS, RRM1, COMMD10
0.0089
0.5565
RNA splicing, via transesterification reactions GO:0000375 (p-value 3.06e-12), RNA splicing GO:0008380 (p-value 7.79e-12), RNA splicing, via transesterification reactions with bulged adenosine as nucleophile GO:0000377 (p-value 9.69e-12), mRNA splicing, via spliceosome GO:0000398 (p-value 9.69e-12), mRNA processing GO:0006397 (p-value 1.23e-08)
Neurons
sienna3
5/789
ZCCHC11, SMCHD1, SMC5, SLC7A1, DIDO1
0.0099
0.5565
regulation of gene expression GO:0010468 (p-value 9.02e-11), regulation of RNA metabolic process GO:0051252 (p-value 6.55e-10), RNA biosynthetic process GO:0032774 (p-value 7.16e-10), nucleic acid-templated transcription GO:0097659 (p-value 2.34e-09), regulation of nucleobase-containing compound metabolic process GO:0019219 (p-value 2.8e-09)
void
salmon
3/314
WEE1, ITGA8, CCDC69
0.0158
0.5565
axoneme assembly GO:0035082 (p-value 1.8e-10), cilium movement GO:0003341 (p-value 2.31e-10), microtubule bundle formation GO:0001578 (p-value 8.31e-10), cilium assembly GO:0060271 (p-value 4.93e-09), cilium organization GO:0044782 (p-value 9.35e-09)
Ependymal
.CC-BY-NC-ND 4.0 International license(which was not certified by peer review) is the author/funder. It is made available under aThe copyright holder for this preprintthis version posted December 23, 2019. . https://doi.org/10.1101/2019.12.23.886838doi: bioRxiv preprint
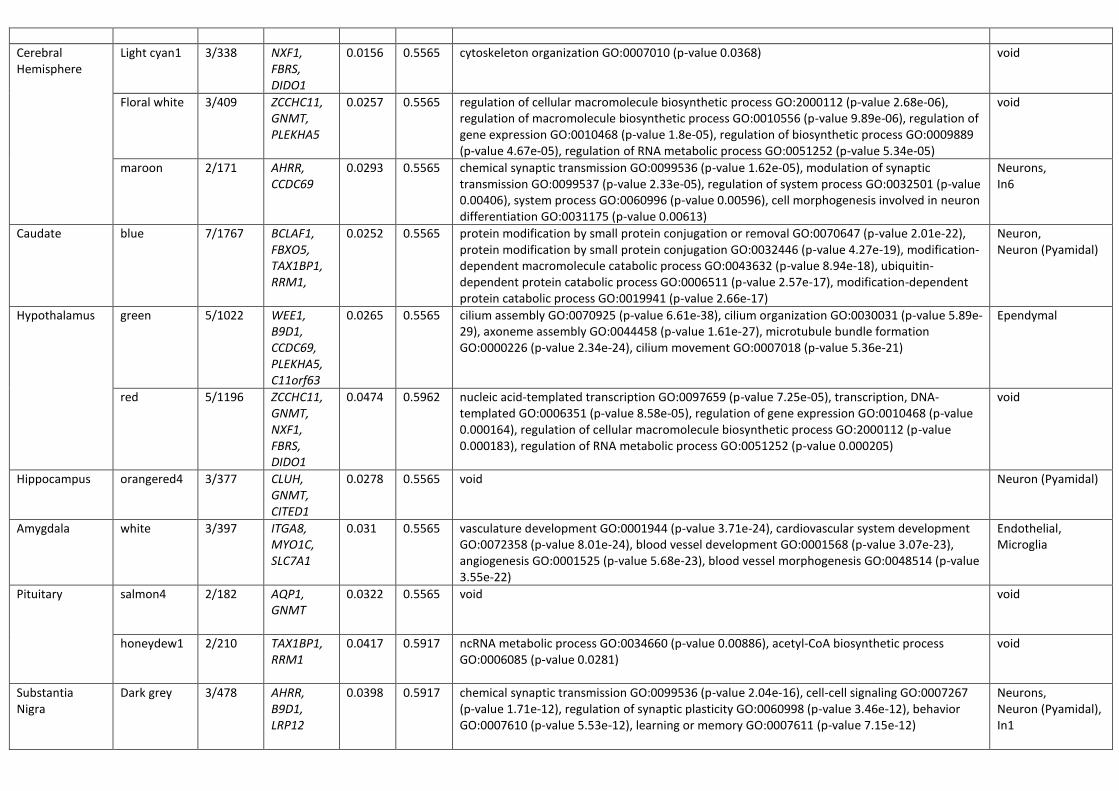
Cerebral Hemisphere
Light cyan1
3/338
NXF1, FBRS, DIDO1
0.0156
0.5565
cytoskeleton organization GO:0007010 (p-value 0.0368)
void
Floral white
3/409
ZCCHC11, GNMT, PLEKHA5
0.0257
0.5565
regulation of cellular macromolecule biosynthetic process GO:2000112 (p-value 2.68e-06), regulation of macromolecule biosynthetic process GO:0010556 (p-value 9.89e-06), regulation of gene expression GO:0010468 (p-value 1.8e-05), regulation of biosynthetic process GO:0009889 (p-value 4.67e-05), regulation of RNA metabolic process GO:0051252 (p-value 5.34e-05)
void
maroon
2/171
AHRR, CCDC69
0.0293
0.5565
chemical synaptic transmission GO:0099536 (p-value 1.62e-05), modulation of synaptic transmission GO:0099537 (p-value 2.33e-05), regulation of system process GO:0032501 (p-value 0.00406), system process GO:0060996 (p-value 0.00596), cell morphogenesis involved in neuron differentiation GO:0031175 (p-value 0.00613)
Neurons, In6
Caudate
blue
7/1767
BCLAF1, FBXO5, TAX1BP1, RRM1,
0.0252
0.5565
protein modification by small protein conjugation or removal GO:0070647 (p-value 2.01e-22), protein modification by small protein conjugation GO:0032446 (p-value 4.27e-19), modification-dependent macromolecule catabolic process GO:0043632 (p-value 8.94e-18), ubiquitin-dependent protein catabolic process GO:0006511 (p-value 2.57e-17), modification-dependent protein catabolic process GO:0019941 (p-value 2.66e-17)
Neuron, Neuron (Pyamidal)
Hypothalamus
green
5/1022
WEE1, B9D1, CCDC69, PLEKHA5, C11orf63
0.0265
0.5565
cilium assembly GO:0070925 (p-value 6.61e-38), cilium organization GO:0030031 (p-value 5.89e-29), axoneme assembly GO:0044458 (p-value 1.61e-27), microtubule bundle formation GO:0000226 (p-value 2.34e-24), cilium movement GO:0007018 (p-value 5.36e-21)
Ependymal
red
5/1196
ZCCHC11, GNMT, NXF1, FBRS, DIDO1
0.0474
0.5962
nucleic acid-templated transcription GO:0097659 (p-value 7.25e-05), transcription, DNA-templated GO:0006351 (p-value 8.58e-05), regulation of gene expression GO:0010468 (p-value 0.000164), regulation of cellular macromolecule biosynthetic process GO:2000112 (p-value 0.000183), regulation of RNA metabolic process GO:0051252 (p-value 0.000205)
void
Hippocampus
orangered4
3/377
CLUH, GNMT, CITED1
0.0278
0.5565
void
Neuron (Pyamidal)
Amygdala
white
3/397
ITGA8, MYO1C, SLC7A1
0.031
0.5565
vasculature development GO:0001944 (p-value 3.71e-24), cardiovascular system development GO:0072358 (p-value 8.01e-24), blood vessel development GO:0001568 (p-value 3.07e-23), angiogenesis GO:0001525 (p-value 5.68e-23), blood vessel morphogenesis GO:0048514 (p-value 3.55e-22)
Endothelial, Microglia
Pituitary
salmon4
2/182
AQP1, GNMT
0.0322
0.5565
void
void
honeydew1
2/210
TAX1BP1, RRM1
0.0417
0.5917
ncRNA metabolic process GO:0034660 (p-value 0.00886), acetyl-CoA biosynthetic process GO:0006085 (p-value 0.0281)
void
Substantia Nigra
Dark grey
3/478
AHRR, B9D1, LRP12
0.0398
0.5917
chemical synaptic transmission GO:0099536 (p-value 2.04e-16), cell-cell signaling GO:0007267 (p-value 1.71e-12), regulation of synaptic plasticity GO:0060998 (p-value 3.46e-12), behavior GO:0007610 (p-value 5.53e-12), learning or memory GO:0007611 (p-value 7.15e-12)
Neurons, Neuron (Pyamidal), In1
.CC-BY-NC-ND 4.0 International license(which was not certified by peer review) is the author/funder. It is made available under aThe copyright holder for this preprintthis version posted December 23, 2019. . https://doi.org/10.1101/2019.12.23.886838doi: bioRxiv preprint
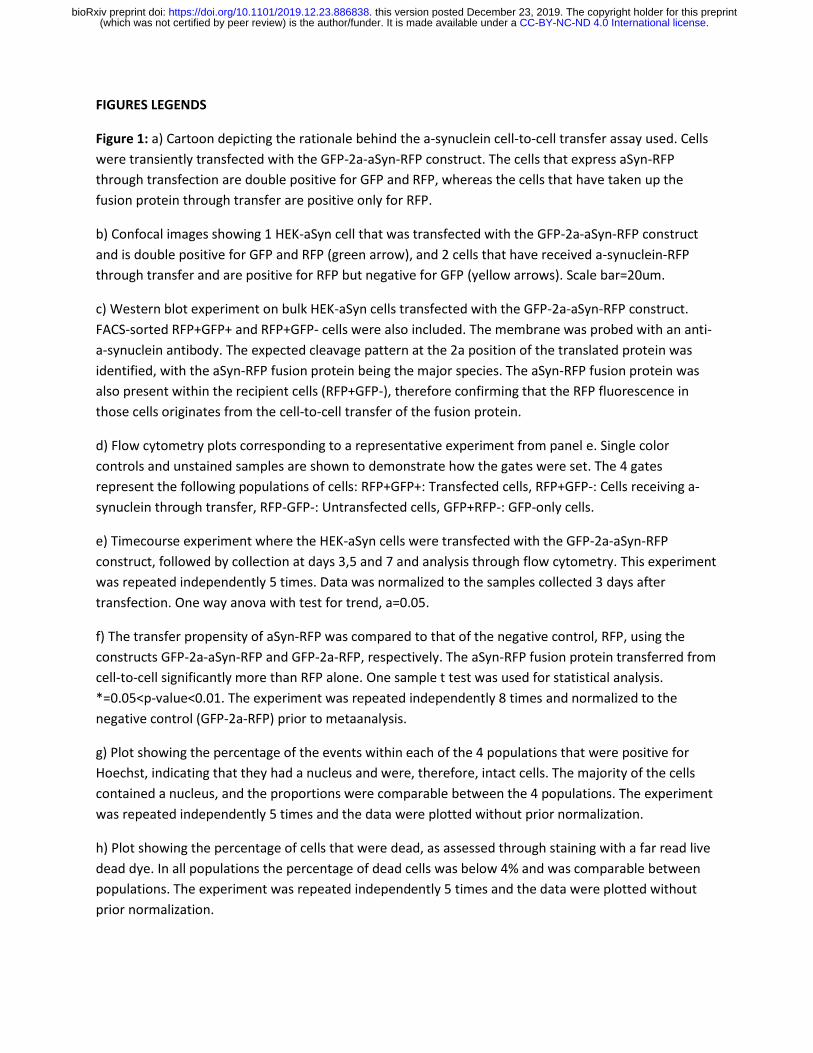
FIGURES LEGENDS
Figure 1: a) Cartoon depicting the rationale behind the a-synuclein cell-to-cell transfer assay used. Cells
were transiently transfected with the GFP-2a-aSyn-RFP construct. The cells that express aSyn-RFP
through transfection are double positive for GFP and RFP, whereas the cells that have taken up the
fusion protein through transfer are positive only for RFP.
b) Confocal images showing 1 HEK-aSyn cell that was transfected with the GFP-2a-aSyn-RFP construct
and is double positive for GFP and RFP (green arrow), and 2 cells that have received a-synuclein-RFP
through transfer and are positive for RFP but negative for GFP (yellow arrows). Scale bar=20um.
c) Western blot experiment on bulk HEK-aSyn cells transfected with the GFP-2a-aSyn-RFP construct.
FACS-sorted RFP+GFP+ and RFP+GFP- cells were also included. The membrane was probed with an anti-
a-synuclein antibody. The expected cleavage pattern at the 2a position of the translated protein was
identified, with the aSyn-RFP fusion protein being the major species. The aSyn-RFP fusion protein was
also present within the recipient cells (RFP+GFP-), therefore confirming that the RFP fluorescence in
those cells originates from the cell-to-cell transfer of the fusion protein.
d) Flow cytometry plots corresponding to a representative experiment from panel e. Single color
controls and unstained samples are shown to demonstrate how the gates were set. The 4 gates
represent the following populations of cells: RFP+GFP+: Transfected cells, RFP+GFP-: Cells receiving a-
synuclein through transfer, RFP-GFP-: Untransfected cells, GFP+RFP-: GFP-only cells.
e) Timecourse experiment where the HEK-aSyn cells were transfected with the GFP-2a-aSyn-RFP
construct, followed by collection at days 3,5 and 7 and analysis through flow cytometry. This experiment
was repeated independently 5 times. Data was normalized to the samples collected 3 days after
transfection. One way anova with test for trend, a=0.05.
f) The transfer propensity of aSyn-RFP was compared to that of the negative control, RFP, using the
constructs GFP-2a-aSyn-RFP and GFP-2a-RFP, respectively. The aSyn-RFP fusion protein transferred from
cell-to-cell significantly more than RFP alone. One sample t test was used for statistical analysis.
*=0.05<p-value<0.01. The experiment was repeated independently 8 times and normalized to the
negative control (GFP-2a-RFP) prior to metaanalysis.
g) Plot showing the percentage of the events within each of the 4 populations that were positive for
Hoechst, indicating that they had a nucleus and were, therefore, intact cells. The majority of the cells
contained a nucleus, and the proportions were comparable between the 4 populations. The experiment
was repeated independently 5 times and the data were plotted without prior normalization.
h) Plot showing the percentage of cells that were dead, as assessed through staining with a far read live
dead dye. In all populations the percentage of dead cells was below 4% and was comparable between
populations. The experiment was repeated independently 5 times and the data were plotted without
prior normalization.
.CC-BY-NC-ND 4.0 International license(which was not certified by peer review) is the author/funder. It is made available under aThe copyright holder for this preprintthis version posted December 23, 2019. . https://doi.org/10.1101/2019.12.23.886838doi: bioRxiv preprint
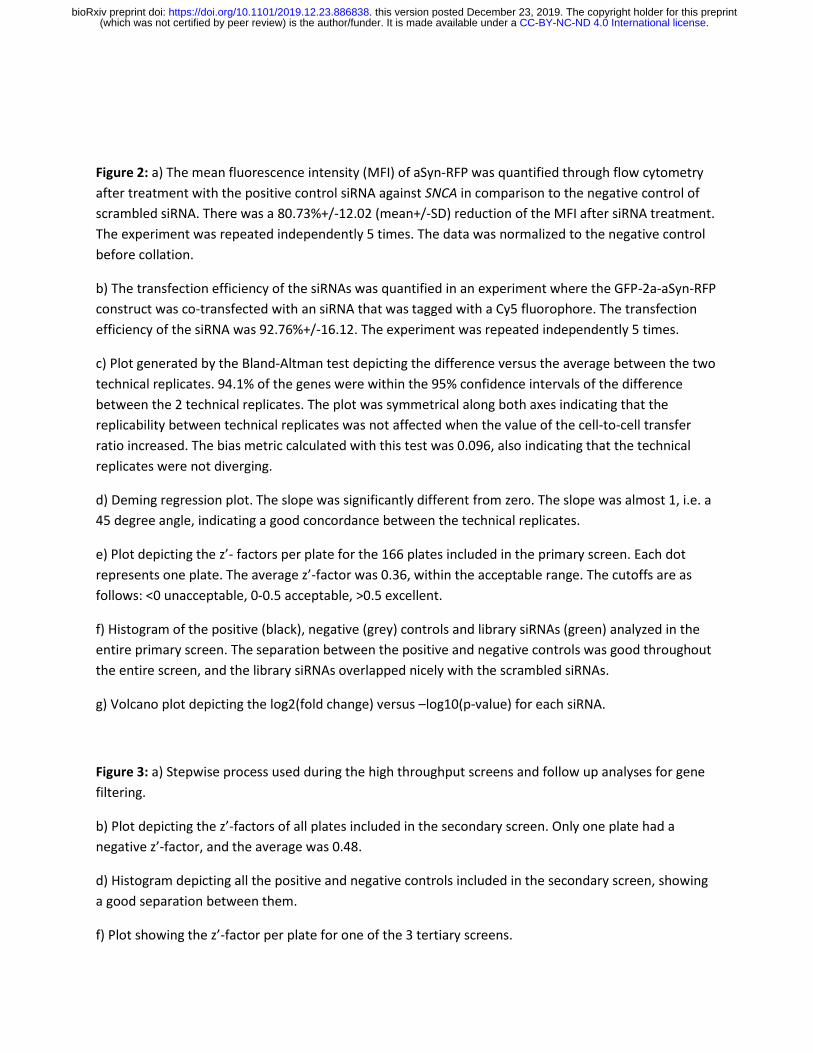
Figure 2: a) The mean fluorescence intensity (MFI) of aSyn-RFP was quantified through flow cytometry
after treatment with the positive control siRNA against SNCA in comparison to the negative control of
scrambled siRNA. There was a 80.73%+/-12.02 (mean+/-SD) reduction of the MFI after siRNA treatment.
The experiment was repeated independently 5 times. The data was normalized to the negative control
before collation.
b) The transfection efficiency of the siRNAs was quantified in an experiment where the GFP-2a-aSyn-RFP
construct was co-transfected with an siRNA that was tagged with a Cy5 fluorophore. The transfection
efficiency of the siRNA was 92.76%+/-16.12. The experiment was repeated independently 5 times.
c) Plot generated by the Bland-Altman test depicting the difference versus the average between the two
technical replicates. 94.1% of the genes were within the 95% confidence intervals of the difference
between the 2 technical replicates. The plot was symmetrical along both axes indicating that the
replicability between technical replicates was not affected when the value of the cell-to-cell transfer
ratio increased. The bias metric calculated with this test was 0.096, also indicating that the technical
replicates were not diverging.
d) Deming regression plot. The slope was significantly different from zero. The slope was almost 1, i.e. a
45 degree angle, indicating a good concordance between the technical replicates.
e) Plot depicting the z’- factors per plate for the 166 plates included in the primary screen. Each dot
represents one plate. The average z’-factor was 0.36, within the acceptable range. The cutoffs are as
follows: <0 unacceptable, 0-0.5 acceptable, >0.5 excellent.
f) Histogram of the positive (black), negative (grey) controls and library siRNAs (green) analyzed in the
entire primary screen. The separation between the positive and negative controls was good throughout
the entire screen, and the library siRNAs overlapped nicely with the scrambled siRNAs.
g) Volcano plot depicting the log2(fold change) versus –log10(p-value) for each siRNA.
Figure 3: a) Stepwise process used during the high throughput screens and follow up analyses for gene
filtering.
b) Plot depicting the z’-factors of all plates included in the secondary screen. Only one plate had a
negative z’-factor, and the average was 0.48.
d) Histogram depicting all the positive and negative controls included in the secondary screen, showing
a good separation between them.
f) Plot showing the z’-factor per plate for one of the 3 tertiary screens.
.CC-BY-NC-ND 4.0 International license(which was not certified by peer review) is the author/funder. It is made available under aThe copyright holder for this preprintthis version posted December 23, 2019. . https://doi.org/10.1101/2019.12.23.886838doi: bioRxiv preprint
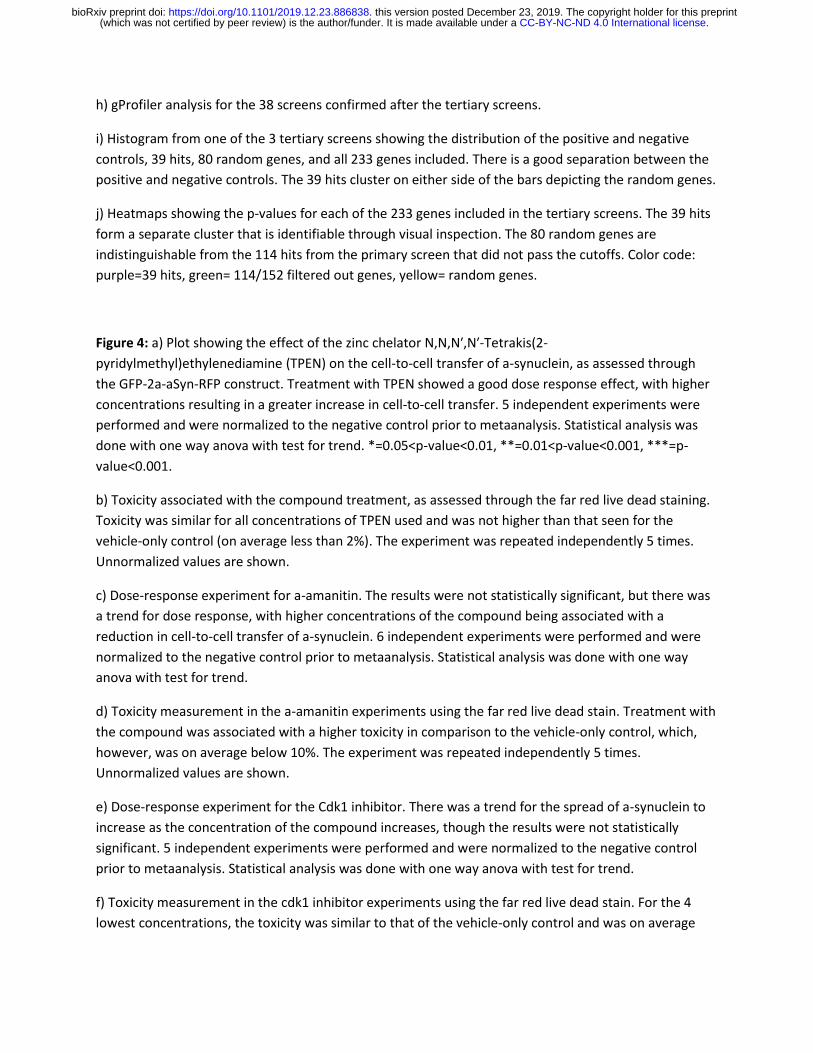
h) gProfiler analysis for the 38 screens confirmed after the tertiary screens.
i) Histogram from one of the 3 tertiary screens showing the distribution of the positive and negative
controls, 39 hits, 80 random genes, and all 233 genes included. There is a good separation between the
positive and negative controls. The 39 hits cluster on either side of the bars depicting the random genes.
j) Heatmaps showing the p-values for each of the 233 genes included in the tertiary screens. The 39 hits
form a separate cluster that is identifiable through visual inspection. The 80 random genes are
indistinguishable from the 114 hits from the primary screen that did not pass the cutoffs. Color code:
purple=39 hits, green= 114/152 filtered out genes, yellow= random genes.
Figure 4: a) Plot showing the effect of the zinc chelator N,N,N′,N′-Tetrakis(2-
pyridylmethyl)ethylenediamine (TPEN) on the cell-to-cell transfer of a-synuclein, as assessed through
the GFP-2a-aSyn-RFP construct. Treatment with TPEN showed a good dose response effect, with higher
concentrations resulting in a greater increase in cell-to-cell transfer. 5 independent experiments were
performed and were normalized to the negative control prior to metaanalysis. Statistical analysis was
done with one way anova with test for trend. *=0.05<p-value<0.01, **=0.01<p-value<0.001, ***=p-
value<0.001.
b) Toxicity associated with the compound treatment, as assessed through the far red live dead staining.
Toxicity was similar for all concentrations of TPEN used and was not higher than that seen for the
vehicle-only control (on average less than 2%). The experiment was repeated independently 5 times.
Unnormalized values are shown.
c) Dose-response experiment for a-amanitin. The results were not statistically significant, but there was
a trend for dose response, with higher concentrations of the compound being associated with a
reduction in cell-to-cell transfer of a-synuclein. 6 independent experiments were performed and were
normalized to the negative control prior to metaanalysis. Statistical analysis was done with one way
anova with test for trend.
d) Toxicity measurement in the a-amanitin experiments using the far red live dead stain. Treatment with
the compound was associated with a higher toxicity in comparison to the vehicle-only control, which,
however, was on average below 10%. The experiment was repeated independently 5 times.
Unnormalized values are shown.
e) Dose-response experiment for the Cdk1 inhibitor. There was a trend for the spread of a-synuclein to
increase as the concentration of the compound increases, though the results were not statistically
significant. 5 independent experiments were performed and were normalized to the negative control
prior to metaanalysis. Statistical analysis was done with one way anova with test for trend.
f) Toxicity measurement in the cdk1 inhibitor experiments using the far red live dead stain. For the 4
lowest concentrations, the toxicity was similar to that of the vehicle-only control and was on average
.CC-BY-NC-ND 4.0 International license(which was not certified by peer review) is the author/funder. It is made available under aThe copyright holder for this preprintthis version posted December 23, 2019. . https://doi.org/10.1101/2019.12.23.886838doi: bioRxiv preprint
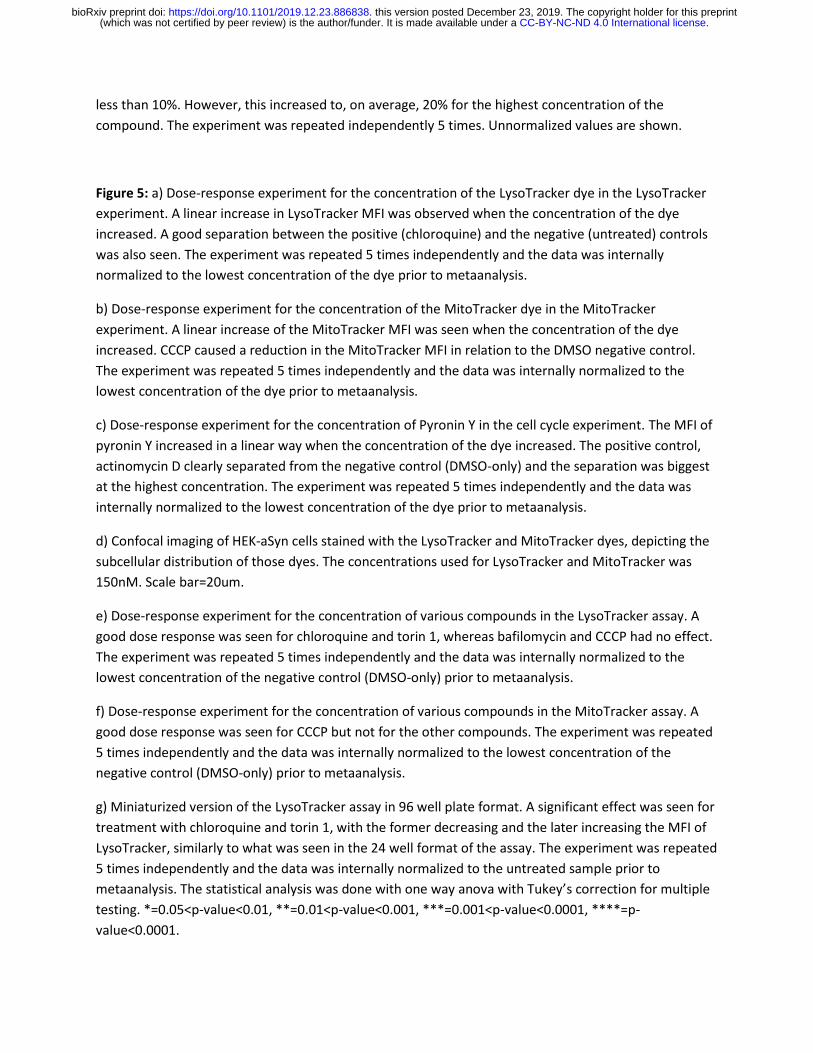
less than 10%. However, this increased to, on average, 20% for the highest concentration of the
compound. The experiment was repeated independently 5 times. Unnormalized values are shown.
Figure 5: a) Dose-response experiment for the concentration of the LysoTracker dye in the LysoTracker
experiment. A linear increase in LysoTracker MFI was observed when the concentration of the dye
increased. A good separation between the positive (chloroquine) and the negative (untreated) controls
was also seen. The experiment was repeated 5 times independently and the data was internally
normalized to the lowest concentration of the dye prior to metaanalysis.
b) Dose-response experiment for the concentration of the MitoTracker dye in the MitoTracker
experiment. A linear increase of the MitoTracker MFI was seen when the concentration of the dye
increased. CCCP caused a reduction in the MitoTracker MFI in relation to the DMSO negative control.
The experiment was repeated 5 times independently and the data was internally normalized to the
lowest concentration of the dye prior to metaanalysis.
c) Dose-response experiment for the concentration of Pyronin Y in the cell cycle experiment. The MFI of
pyronin Y increased in a linear way when the concentration of the dye increased. The positive control,
actinomycin D clearly separated from the negative control (DMSO-only) and the separation was biggest
at the highest concentration. The experiment was repeated 5 times independently and the data was
internally normalized to the lowest concentration of the dye prior to metaanalysis.
d) Confocal imaging of HEK-aSyn cells stained with the LysoTracker and MitoTracker dyes, depicting the
subcellular distribution of those dyes. The concentrations used for LysoTracker and MitoTracker was
150nM. Scale bar=20um.
e) Dose-response experiment for the concentration of various compounds in the LysoTracker assay. A
good dose response was seen for chloroquine and torin 1, whereas bafilomycin and CCCP had no effect.
The experiment was repeated 5 times independently and the data was internally normalized to the
lowest concentration of the negative control (DMSO-only) prior to metaanalysis.
f) Dose-response experiment for the concentration of various compounds in the MitoTracker assay. A
good dose response was seen for CCCP but not for the other compounds. The experiment was repeated
5 times independently and the data was internally normalized to the lowest concentration of the
negative control (DMSO-only) prior to metaanalysis.
g) Miniaturized version of the LysoTracker assay in 96 well plate format. A significant effect was seen for
treatment with chloroquine and torin 1, with the former decreasing and the later increasing the MFI of
LysoTracker, similarly to what was seen in the 24 well format of the assay. The experiment was repeated
5 times independently and the data was internally normalized to the untreated sample prior to
metaanalysis. The statistical analysis was done with one way anova with Tukey’s correction for multiple
testing. *=0.05<p-value<0.01, **=0.01<p-value<0.001, ***=0.001<p-value<0.0001, ****=p-
value<0.0001.
.CC-BY-NC-ND 4.0 International license(which was not certified by peer review) is the author/funder. It is made available under aThe copyright holder for this preprintthis version posted December 23, 2019. . https://doi.org/10.1101/2019.12.23.886838doi: bioRxiv preprint
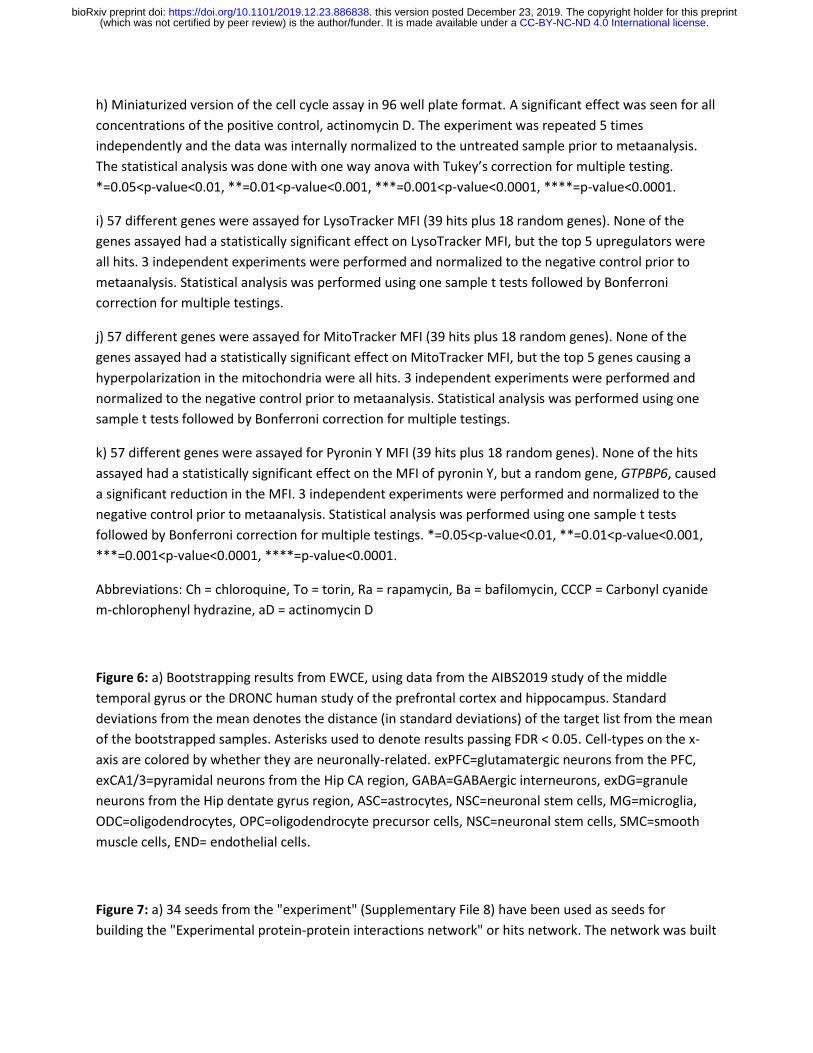
h) Miniaturized version of the cell cycle assay in 96 well plate format. A significant effect was seen for all
concentrations of the positive control, actinomycin D. The experiment was repeated 5 times
independently and the data was internally normalized to the untreated sample prior to metaanalysis.
The statistical analysis was done with one way anova with Tukey’s correction for multiple testing.
*=0.05<p-value<0.01, **=0.01<p-value<0.001, ***=0.001<p-value<0.0001, ****=p-value<0.0001.
i) 57 different genes were assayed for LysoTracker MFI (39 hits plus 18 random genes). None of the
genes assayed had a statistically significant effect on LysoTracker MFI, but the top 5 upregulators were
all hits. 3 independent experiments were performed and normalized to the negative control prior to
metaanalysis. Statistical analysis was performed using one sample t tests followed by Bonferroni
correction for multiple testings.
j) 57 different genes were assayed for MitoTracker MFI (39 hits plus 18 random genes). None of the
genes assayed had a statistically significant effect on MitoTracker MFI, but the top 5 genes causing a
hyperpolarization in the mitochondria were all hits. 3 independent experiments were performed and
normalized to the negative control prior to metaanalysis. Statistical analysis was performed using one
sample t tests followed by Bonferroni correction for multiple testings.
k) 57 different genes were assayed for Pyronin Y MFI (39 hits plus 18 random genes). None of the hits
assayed had a statistically significant effect on the MFI of pyronin Y, but a random gene, GTPBP6, caused
a significant reduction in the MFI. 3 independent experiments were performed and normalized to the
negative control prior to metaanalysis. Statistical analysis was performed using one sample t tests
followed by Bonferroni correction for multiple testings. *=0.05<p-value<0.01, **=0.01<p-value<0.001,
***=0.001<p-value<0.0001, ****=p-value<0.0001.
Abbreviations: Ch = chloroquine, To = torin, Ra = rapamycin, Ba = bafilomycin, CCCP = Carbonyl cyanide
m-chlorophenyl hydrazine, aD = actinomycin D
Figure 6: a) Bootstrapping results from EWCE, using data from the AIBS2019 study of the middle
temporal gyrus or the DRONC human study of the prefrontal cortex and hippocampus. Standard
deviations from the mean denotes the distance (in standard deviations) of the target list from the mean
of the bootstrapped samples. Asterisks used to denote results passing FDR < 0.05. Cell-types on the x-
axis are colored by whether they are neuronally-related. exPFC=glutamatergic neurons from the PFC,
exCA1/3=pyramidal neurons from the Hip CA region, GABA=GABAergic interneurons, exDG=granule
neurons from the Hip dentate gyrus region, ASC=astrocytes, NSC=neuronal stem cells, MG=microglia,
ODC=oligodendrocytes, OPC=oligodendrocyte precursor cells, NSC=neuronal stem cells, SMC=smooth
muscle cells, END= endothelial cells.
Figure 7: a) 34 seeds from the "experiment" (Supplementary File 8) have been used as seeds for
building the "Experimental protein-protein interactions network" or hits network. The network was built
.CC-BY-NC-ND 4.0 International license(which was not certified by peer review) is the author/funder. It is made available under aThe copyright holder for this preprintthis version posted December 23, 2019. . https://doi.org/10.1101/2019.12.23.886838doi: bioRxiv preprint
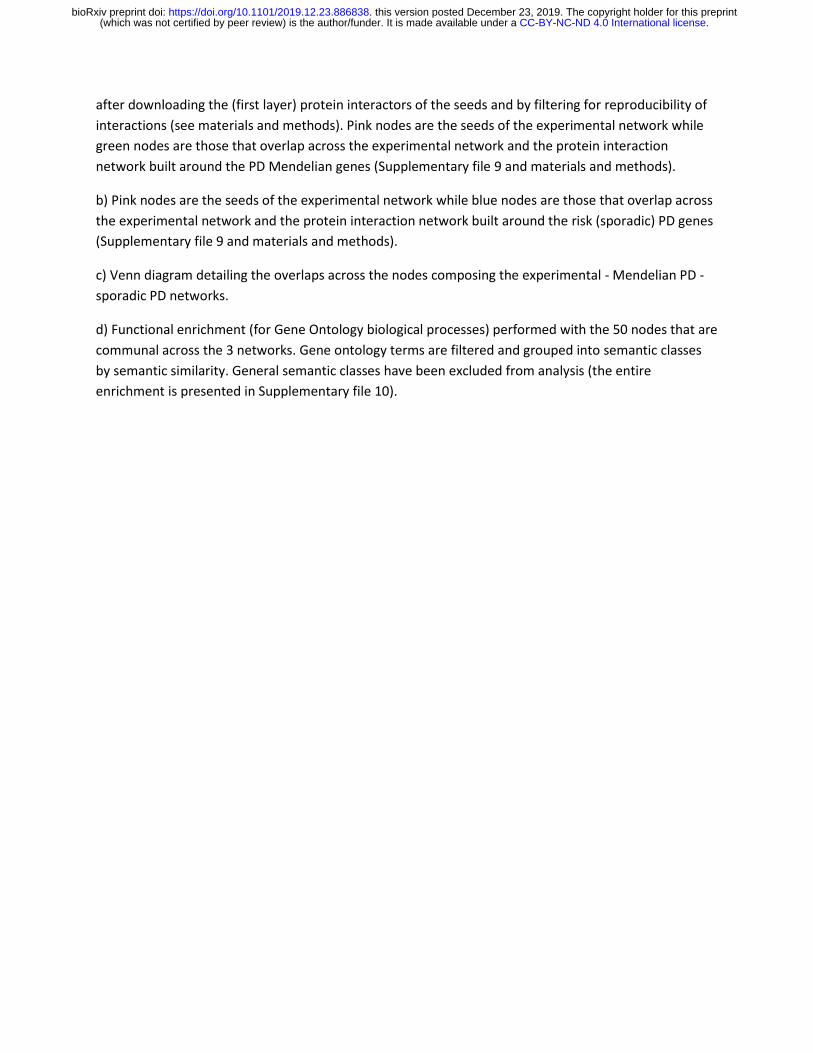
after downloading the (first layer) protein interactors of the seeds and by filtering for reproducibility of
interactions (see materials and methods). Pink nodes are the seeds of the experimental network while
green nodes are those that overlap across the experimental network and the protein interaction
network built around the PD Mendelian genes (Supplementary file 9 and materials and methods).
b) Pink nodes are the seeds of the experimental network while blue nodes are those that overlap across
the experimental network and the protein interaction network built around the risk (sporadic) PD genes
(Supplementary file 9 and materials and methods).
c) Venn diagram detailing the overlaps across the nodes composing the experimental - Mendelian PD -
sporadic PD networks.
d) Functional enrichment (for Gene Ontology biological processes) performed with the 50 nodes that are
communal across the 3 networks. Gene ontology terms are filtered and grouped into semantic classes
by semantic similarity. General semantic classes have been excluded from analysis (the entire
enrichment is presented in Supplementary file 10).
.CC-BY-NC-ND 4.0 International license(which was not certified by peer review) is the author/funder. It is made available under aThe copyright holder for this preprintthis version posted December 23, 2019. . https://doi.org/10.1101/2019.12.23.886838doi: bioRxiv preprint
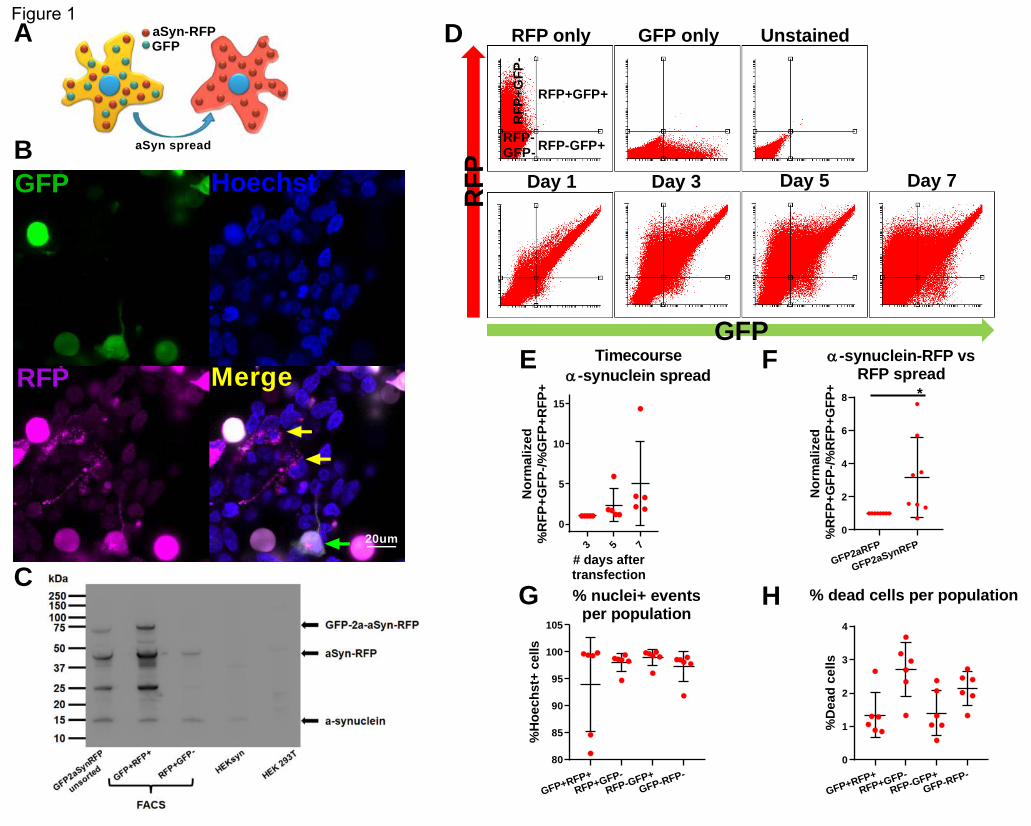
aSyn-RFPGFP
aSyn spread
GFP2aRFP
GFP2aSynRFP
0
2
4
6
8
No
rma
lized
%R
FP
+G
FP
-/%
RF
P+
GF
P+ *
GFP+RFP+
RFP+GFP-
RFP-GFP+
GFP-RFP-
80
85
90
95
100
105
%H
oe
chst
+ce
lls
GFP+RFP+
RFP+GFP-
RFP-GFP+
GFP-RFP-
0
1
2
3
4
%D
ea
dc
ells
A
B
C
GFP Hoechst
RFP Merge
3 5 7
0
5
10
15
No
rma
lize
d%
RF
P+
GF
P-/
%G
FP
+R
FP
+
# days aftertransfection
D
GFP
RF
P
RFP+GFP+
RFP-GFP+
RF
P+
GF
P-
RFP-GFP-
RFP only GFP only Unstained
Day 1 Day 3 Day 5 Day 7
E F
G H
Timecoursea-synuclein spread
a-synuclein-RFP vsRFP spread
% nuclei+ eventsper population
% dead cells per population
20um
Figure 1
.CC-BY-NC-ND 4.0 International license(which was not certified by peer review) is the author/funder. It is made available under aThe copyright holder for this preprintthis version posted December 23, 2019. . https://doi.org/10.1101/2019.12.23.886838doi: bioRxiv preprint
SCR SNCA 0.0
0.5
1.0
1.5
No
rmal
ized
RF
PM
FI
0
50
100
150
%C
y5
ce
lls
0 2 4 6 80
1000
2000
3000
4000
# RFP+GFP- cells/GFP+ cells
Nu
mb
ero
fO
ccu
rren
ces
SNCASCRgenes
50 100 150 200
-1.5
-1.0
-0.5
0.0
1.0
Plate number
z'fa
cto
r
0.5
2 4 6 8
-4
-2
0
2
4
6
Average
Dif
fere
nce
2.9%
3%
94.1%
2 4 6 8 10-2
0
2
4
6
8
10
Technical replicate 1
Tec
hn
ical
rep
licat
e2 Y = 0.9884*X - 0.05683
C
D
A B
E
0
10
20
30
40
50
Log2 Fold Change
-Lo
g1
0P
-Val
ue
-1.6 -1 -0.4 0.4
3.167
0
F
Control siRNAsCy5 siRNA
transfection efficiencyBland-Altman plot
Deming regression Z' factor per plate
GGaussian distribution Volcano plot
Figure 2.CC-BY-NC-ND 4.0 International license(which was not certified by peer review) is the author/funder. It is made available under a
The copyright holder for this preprintthis version posted December 23, 2019. . https://doi.org/10.1101/2019.12.23.886838doi: bioRxiv preprint
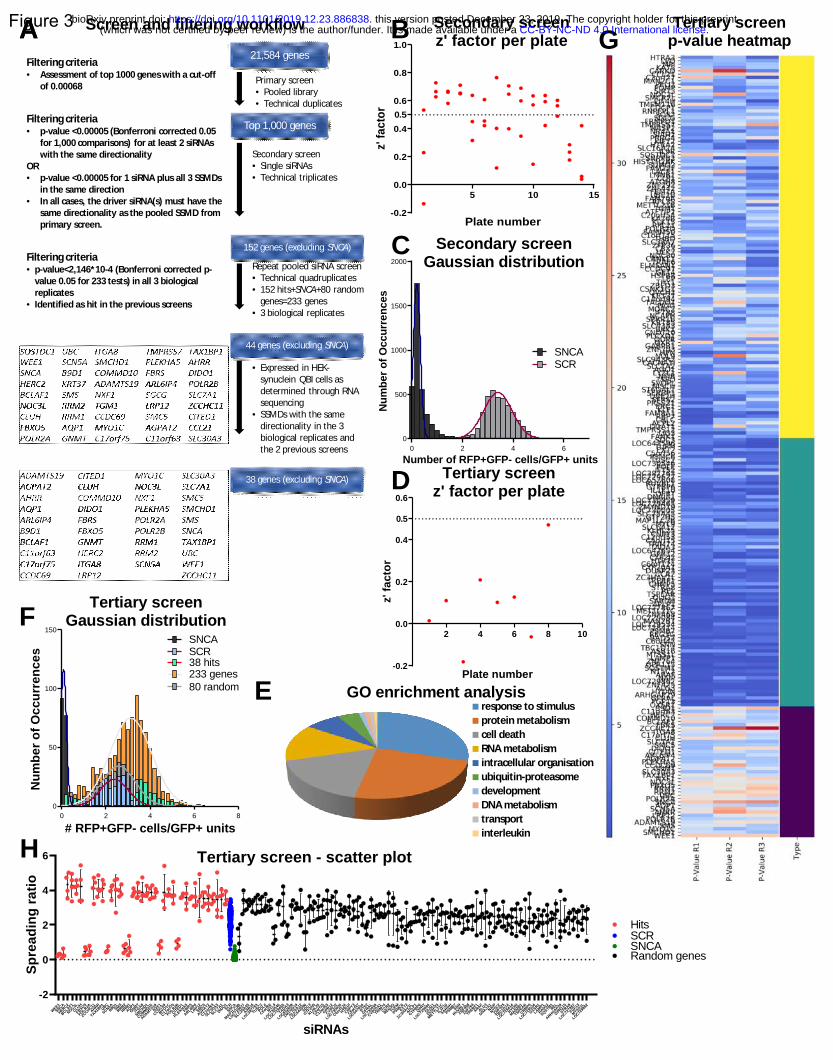
response to stimulusprotein metabolismcell deathRNA metabolismintracellular organisationubiquitin-proteasomedevelopmentDNA metabolismtransportinterleukin
5 10 15
-0.2
0.0
0.2
0.4
0.6
0.8
1.0
Plate number
z'fa
cto
r
0.5
0 2 4 60
500
1000
1500
2000
Number of RFP+GFP- cells/GFP+ units
Nu
mb
ero
fO
ccu
rre
nce
s
SNCASCR
2 4 6 8 10
-0.2
0.0
0.2
0.4
0.6
Plate number
z'fa
cto
r
0.5
0 2 4 6 80
50
100
150
# RFP+GFP- cells/GFP+ units
Nu
mb
er
of
Oc
cu
rre
nc
es
SNCASCR38 hits233 genes80 random
A21,584 genes
Primary screen• Pooled library • Technical duplicates
Top 1,000 genes
Secondary screen • Single siRNAs • Technical triplicates
152 genes (excluding SNCA)
Repeat pooled siRNA screen• Technical quadruplicates • 152 hits+SNCA+80 random
genes=233 genes• 3 biological replicates
44 genes (excluding SNCA)
Filtering criteria • p-value <0.00005 (Bonferroni corrected 0.05
for 1,000 comparisons) for at least 2 siRNAs with the same directionality
OR • p-value <0.00005 for 1 siRNA plus all 3 SSMDs
in the same direction • In all cases, the driver siRNA(s) must have the
same directionality as the pooled SSMD from primary screen.
Filtering criteria• Assessment of top 1000 genes with a cut-off
of 0.00068
Filtering criteria • p-value<2,146*10-4 (Bonferroni corrected p-
value 0.05 for 233 tests) in all 3 biological replicates
• Identified as hit in the previous screens
• Expressed in HEK-synuclein QBI cells as determined through RNA sequencing
• SSMDs with the same directionality in the 3 biological replicates and the 2 previous screens
38 genes (excluding SNCA)
WEE1
SNCA
HERC2
BCLAF1
NOC3L
CLUH
FBXO5
POLR2A
ZCCHC11
AHRR
TAX1BP1UBC
SCN5AB9D1
SMS
RRM2
RRM1
AQP1
GNMT
ITGA8
SMCHD1
COMM
D10
ADAMTS19
NXF1
CCDC69
MYO1C
C17orf7
5
POLR2B
CITED1
PLEKHA5
FBRS
ARL6IP4
LRP12
SMC5
AGPAT2
C11orf6
3
SLC30A3
SLC7A1
DIDO1
SCR
SNCA
MAP1L
C3B
LOC7296
27
SLC25A45
ASB16
LOC3877
63
TUSC2
POLE
C5orf5
6
MYL9
LOC7305
46
LOC7294
65
TADA3
LOC6526
08
ZMYND19
SLC6A12
LOC6435
96
SDC3
GTF2H5
KLHL25
C5orf1
5
C12orf5
3
GPR12
CYP2J2
LOC7300
05
C6orf1
24
HTR1F
CNPY3
C6orf4
7
LOC6476
54IF
T52
GFRAL
LOC7300
59
CYP20A1
TRIM74
CCR2
REG3GTUFM
PSMC6EXT2
ZC3HAV1L
APLP1
GTPBP6
QPRT
LOC7290
84
OLIG1
DUSP23
METTL21C
IL1F
10
SARDH
PSMB7
SNN
RUVBL1
ZNF468
ZNF764
TRERF1
ARAF
ALG3
DNAJA1NAIP
NT5C2
ZNF425
TBC1D14
LOC7284
14
HYDIN
MAN2B1
TSPEAR
CHMP5
LOC7295
34
OXSR1
LAMP1
RAD52
SQSTM1REL
ARHGAP29
GPR115
STRA8
LOC7278
67
FGF13
MTSS1L
LOC7298
62
-2
0
2
4
6
siRNAs
Sp
rea
din
gra
tio
HitsSCRSNCARandom genes
A B
GO enrichment analysis
Tertiary screenGaussian distribution
Secondary screenz' factor per plate
Screen and filtering workflow
Tertiary screen - scatter plot
Tertiary screenp-value heatmap
C
D
F
E
G
H
Secondary screenGaussian distribution
Tertiary screenz' factor per plate
Figure 3.CC-BY-NC-ND 4.0 International license(which was not certified by peer review) is the author/funder. It is made available under a
The copyright holder for this preprintthis version posted December 23, 2019. . https://doi.org/10.1101/2019.12.23.886838doi: bioRxiv preprint

0 1 2 3 40
1
2
3
4
5
No
rmal
ized
%R
FP
+G
FP
-/%
RF
P+
GF
P+
TPEN concentration (uM)
**
0 1 2.5 5 10 200.0
0.5
1.0
1.5
2.0
2.5
No
rma
lized
%R
FP
+G
FP
-/%
RF
P+
GF
P+
A-amanitinconcentration (ug/ml)
0 0.5 1 2 3 5.80.0
0.5
1.0
1.5
2.0
2.5
No
rma
lized
%R
FP
+G
FP
-/%
RF
P+
GF
P+
Cdk1 inhibitorconcentration (uM)
0 1 2 3 40.0
0.5
1.0
1.5
2.0
2.5
%D
ead
cells
TPEN concentration (uM)
0 1 2.5 5 10 200
5
10
15
%D
ea
dc
ells
A-amanitinconcentration (ug/ml)
0 0.5 1 2 3 5.80
10
20
30
40
50
%D
ea
dc
ells
Cdk1 inhibitor concentration (uM)
Zinc chelator (N,N,N',N'-Tetrakis(2-pyridylmethyl)ethylenediamine)
TPEN toxicity
A-amanitin (polymerase II inhibitor)
A-amanitin toxicity
CDK1 inhibitor
CDK1 toxicity
A B C
D E F
Figure 4
.CC-BY-NC-ND 4.0 International license(which was not certified by peer review) is the author/funder. It is made available under aThe copyright holder for this preprintthis version posted December 23, 2019. . https://doi.org/10.1101/2019.12.23.886838doi: bioRxiv preprint
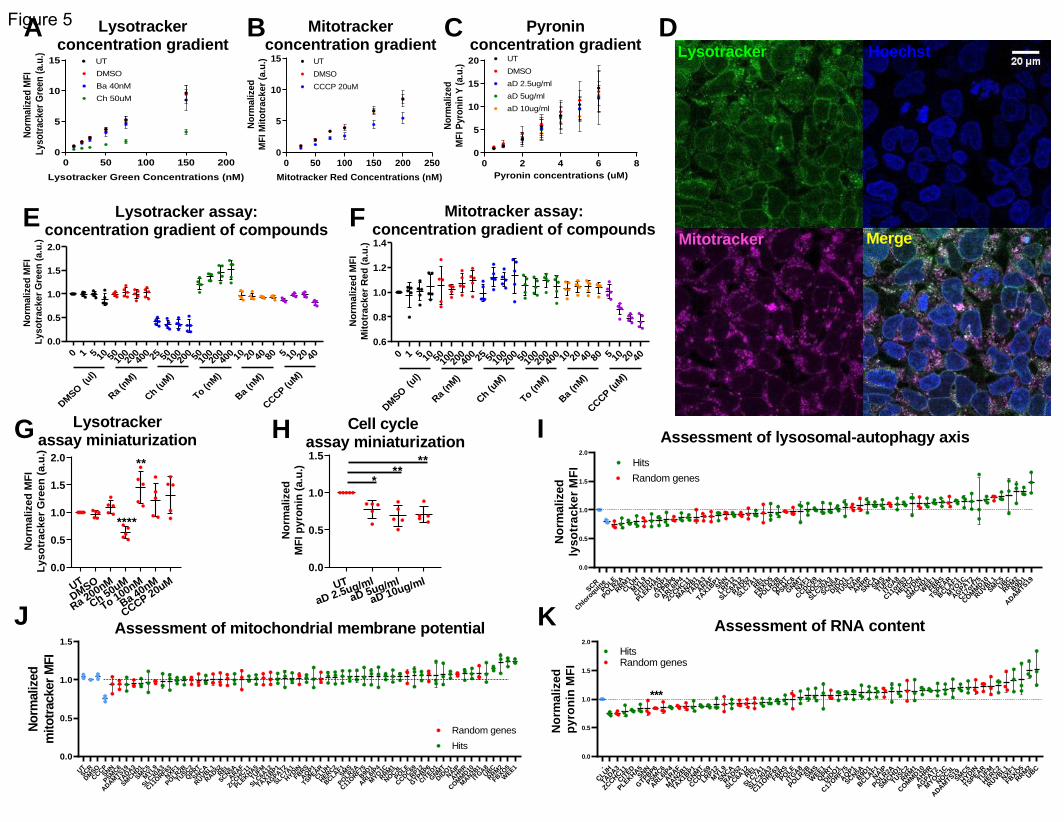
0 50 100 150 2000
5
10
15
Nor
mal
ized
MFI
Lyso
trac
ker
Gre
en(a
.u.)
Lysotracker Green Concentrations (nM)
UT
Ch 50uM
Ba 40nM
DMSO
0 50 100 150 200 2500
5
10
15
No
rmal
ized
MF
IMit
otr
acke
r(a
.u.)
Mitotracker Red Concentrations (nM)
CCCP 20uM
DMSO
UT
0 2 4 6 80
5
10
15
20
Nor
mal
ized
MFI
Pyr
onin
Y(a
.u.)
Pyronin concentrations (uM)
DMSO
aD 10ug/ml
aD 5ug/ml
UT
aD 2.5ug/ml
0 1 5 10 5010020
040
0 25 5010020
0 5010020
040
0 10 20 40 80 5 10 20 400.6
0.8
1.0
1.2
1.4
No
rmal
ized
MF
IM
ito
trac
ker
Red
(a.u
.)
DMSO
(ul)
Ra(n
M)
To(n
M)
Ba(n
M)
CCCP(u
M)
Ch(u
M)
UTDMSO
Ra 200nM
Ch 50uM
To 100nM
Ba 40nM
CCCP 20uM
0.0
0.5
1.0
1.5
2.0
No
rma
lize
dM
FI
Ly
so
tra
ck
er
Gre
en
(a.u
.)
****
**
UT
aD 2.5ug/ml
aD 5ug/ml
aD 10ug/ml0.0
0.5
1.0
1.5
No
rma
lized
MF
Ipy
ron
in(a
.u.)
***
**
SCR
Chloro
quinePO
LE
POLR2A
RRM1
CLUHM
YL9
CITED1
PLEKHA5
AQP1
GTPBP6
ARL6IP4
ZCCHC11
MAN2B
1
TADA3
ARAF
TAX1BP1SNN
LRP12
SLC6A12
RAD52
SLC7A1REL
FBXO5
POLR2B
QPRT
PSMC6
GNM
TNXF1
CCDC69
NOC3L
SLC30A3
SCN5A
DIDO1
TUSC2NAIP
AHRR
SNCASM
S
TUFM
ITGA8
C11orf6
3
HERC2
HYDIN
SMCHD1
WEE1
FBRS
TSPEAR
BCLAF1
MYO
1C
AGPAT2
C17orf7
5
COMM
D10
RUVBL1
SMC5UBC
RRM2
B9D1
ADAMTS19
0.0
0.5
1.0
1.5
2.0
No
rma
lized
lys
otr
ac
ke
rM
FI Hits
Random genes
UTSCR
DMSO
CCCPSNN
PSMC6
ADAMTS19
TADA3
SMCHD1
SMC5
MYL9
SLC30A3
C11ORF63
NXF1
POLR2B
TUSC2
QPRT
SNCA
RUVBL1
RAD52REL
SCN5A
ARAF
ZCCHC11
PLEKHA5
TUFM
SLC6A12
TAX1BP1
AGPAT2
SLC7A1
HYDINFBRS
AQP1
TSPEAR
CLUH
HERC2
BCLAF1SM
S
POLR2A
C11ORF75
B9D1
ARL6IP4
MYO1C
RRM1
NOC3L
POLE
CCDC69
LRP12
GTPBP6
CITED1
GNMT
DIDO1NAIP
AHRR
COMM
D10
MAN2B
1
ITGA8
UBC
RRM2
FBXO5
WEE1
0.0
0.5
1.0
1.5
No
rmal
ized
mito
trac
ker
MFI
Random genes
Hits
-
CLUH
TADA3
ZCCHC11
CITED
PLEKHA5SNN
GTPBP6
PSMC6
ARL6IP4
ARAF
MAN2B
1
TAX1BP1
GNM
T
CCDC69
LRP12
MYL9
SNCA
RAD52
SLC6A12REL
SLC7A1
SLC30A3
C11O
RF63
FBRS
POLE
ITGA8
POLR2B
SMS
WEE1
QPRT
DIDO1
C17O
RF75
AQP1
SCN5AB9D
1
BCLAF1NAIP
POLR2A
SMCHD1
TUSC2
RRM1
COMM
D10
AHRR
AGPAT2
MYOC1C
NOC3L
ADAMTS19
SMC5
HYDIN
TSPEAR
TUFM
HERC2
RUVBL1
NXF1
FBXO5
RRM2UBC
0.0
0.5
1.0
1.5
2.0
No
rma
lized
py
ron
inM
FI
***
HitsRandom genes
0 1 5 10 5010020
040
0 25 5010020
0 5010020
040
0 10 20 40 80 5 10 20 400.0
0.5
1.0
1.5
2.0
No
rmal
ized
MF
IL
yso
trac
ker
Gre
en(a
.u.)
DMSO
(ul)
Ra(n
M)
To(n
M)
Ba(n
M)
CCCP(u
M)
Ch(u
M)
Lysotrackerconcentration gradient
Mitotrackerconcentration gradient
Pyroninconcentration gradient
Lysotracker assay:concentration gradient of compounds
Mitotracker assay:concentration gradient of compounds
Assessment of lysosomal-autophagy axis
Assessment of mitochondrial membrane potential Assessment of RNA content
A B C D
E F
G Lysotrackerassay miniaturization
Cell cycle assay miniaturization
H I
J K
Lysotracker Hoechst
Mitotracker Merge
Figure 5
.CC-BY-NC-ND 4.0 International license(which was not certified by peer review) is the author/funder. It is made available under aThe copyright holder for this preprintthis version posted December 23, 2019. . https://doi.org/10.1101/2019.12.23.886838doi: bioRxiv preprint
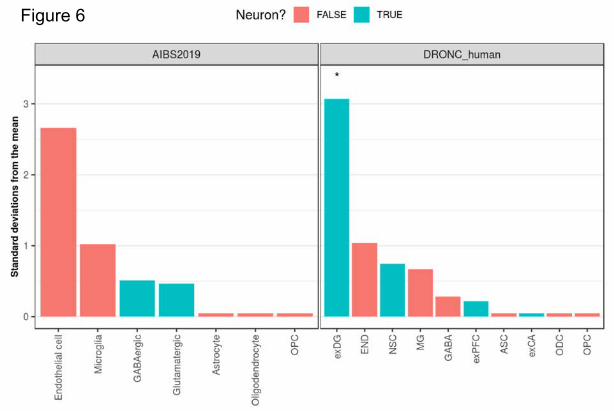
Figure 6
.CC-BY-NC-ND 4.0 International license(which was not certified by peer review) is the author/funder. It is made available under aThe copyright holder for this preprintthis version posted December 23, 2019. . https://doi.org/10.1101/2019.12.23.886838doi: bioRxiv preprint
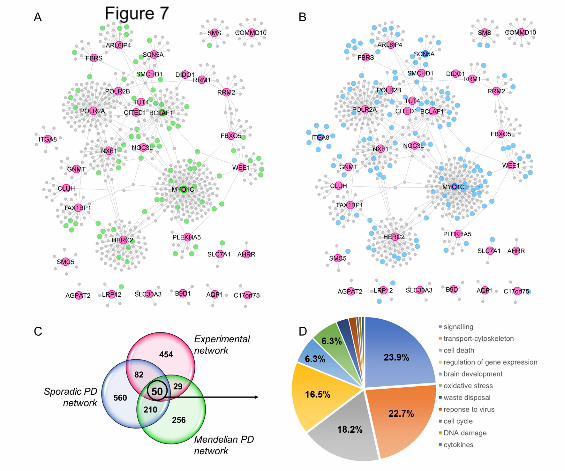
Figure 7
.CC-BY-NC-ND 4.0 International license(which was not certified by peer review) is the author/funder. It is made available under aThe copyright holder for this preprintthis version posted December 23, 2019. . https://doi.org/10.1101/2019.12.23.886838doi: bioRxiv preprint
SUPPLEMENTARY TABLES LEGENDS
Supplementary table 1: 152 genes that were confirmed through the secondary screen.
Supplementary table 2: List of genes included in the tertiary screen. Those genes were the 152 genes that were confirmed through the secondary screen, 80 random genes and SNCA.
Supplementary table 3: List of genes that modify the cell-to-cell transfer of RFP, as well as aSyn-RFP.
Supplementary table 4: List of known PD Mendelian and GWAS genes included in the WGCNA and WPPNIA analyses.
Supplementary table 5: WGCNA for known PD genes. Overlap: number of hit genes relatively to the total size of the module; GO report: GO enrichment analysis results; cell type: enrichment for particular cell type-specific markers in each module; void: not enriched for particular cell markers.
Supplementary table 6: WGCNA for known AD genes. Overlap: number of hit genes relatively to the total size of the module; GO report: GO enrichment analysis results; cell type: enrichment for particular cell type-specific markers in each module; void: not enriched for particular cell markers.
Supplementary table 7: Hits present in the same modules as PD Mendelian and GWAS genes.
Supplementary table 8: WPPNIA networks for hits, PD Mendelian and PD GWAS genes. The tabs in the table are as follows: Seeds: 34 hit genes, 18 PD Mendelian genes and 65 PD GWAS genes forming the input for the WWPNIA analysis; Experimental_Network_filtered: First layer interactors of 34 hits; PD_network_filtered: first layer interactors of PD Mendelian genes; GWAS_network_filtered: first layer interactors of PD GWAS genes. Terms used: NameA: seed genes; NameB: first layer interactors of seeds; SwissA, EntrezA, SwissB, EntrezB: identifiers of genes listed in columns NameA and NameB; Method.Score: scoring of the strength of published evidence based on the assessment of the methodology used; Publication.Score: scoring of the strength of the evidence based on the number of publications found; Final.Score: composite score of the 2 scoring methods.
Supplementary table 9: WPPNIA overlaps between the network of the hits with the network for PD Mendelian genes (tab: Attributes_EXP-PD), and between the network of hits with the network for PD GWAS genes (Attributes_EXP-GWAS). Definition of terms used: Nodes: all genes belonging to the network formed by the 34 hits (34 seeds and first layer interactors, for a total of 615 nodes); Experimental network: role of each gene in the network formed by the hits (seed: one of 34 hits, direct_interactor_of_hit: first layer interactor of hit gene); PD_Network: role of the genes in the network formed by PD Mendelian genes (interactor_PD: that gene is a first layer interactor of the PD Mendelian genes used as seeds); GWAS_Network: role of the genes in the network formed by PD GWAS risk genes (interactor_GWAS: that gene is a first layer interactor of the PD GWAS genes used as seeds); NA: not applicable; communal: common genes between the network of hits and either the network formed by PD Mendelian genes or PD GWAS genes; SEED_EXP: one of 34 hit genes; experimental: one of the first layer interactors of the hits; seed_GWAS: one of the 65 PD GWAS genes used as input for the WPPNIA.
.CC-BY-NC-ND 4.0 International license(which was not certified by peer review) is the author/funder. It is made available under aThe copyright holder for this preprintthis version posted December 23, 2019. . https://doi.org/10.1101/2019.12.23.886838doi: bioRxiv preprint
Supplementary table 10: GO enrichment analyses for the 50 genes that are in common between the 3 networks (hits, PD Mendelian, PD GWAS genes), as depicted in figure 7c. GO terms have been grouped in semantic classes by semantic similarities and general semantic classes (in light grey) have been removed from the analysis. Intersections: genes belonging to each GO term; term size: number of genes belonging to each GO term category; intersection size: number of genes from the 50 submitted genes that belonged to each GO term category.
Supplementary table 11: Burden per hit gene, as assessed by analyzing pre-existing GWAS data. Three different minor allele frequencies (MAFs) were assessed per gene. MAF, minor allele frequency; Q, Q statistic; Perm Pvalue, permuted P value based on 1000 permutations; the following nominated genes did not have enough variants to perform gene-based analyses ADAMTS19, AQP1, CITED1, CLUH, COMMD10, DIDO1, FBXO5, RRM2, SMCHD1, SMC5, SMS, TAX1BP1.
Please note that supplementary tables 8-10 can be found on Github under the following links:
https://github.com/alecrimi/aSynuclein_siRNA_screen/blob/master/supplementary%20table%208%20191219.xlsx https://github.com/alecrimi/aSynuclein_siRNA_screen/blob/master/supplementary%20table%209%20191219.xlsx https://github.com/alecrimi/aSynuclein_siRNA_screen/blob/master/supplementary%20table%2010%20191219.xlsx
.CC-BY-NC-ND 4.0 International license(which was not certified by peer review) is the author/funder. It is made available under aThe copyright holder for this preprintthis version posted December 23, 2019. . https://doi.org/10.1101/2019.12.23.886838doi: bioRxiv preprint
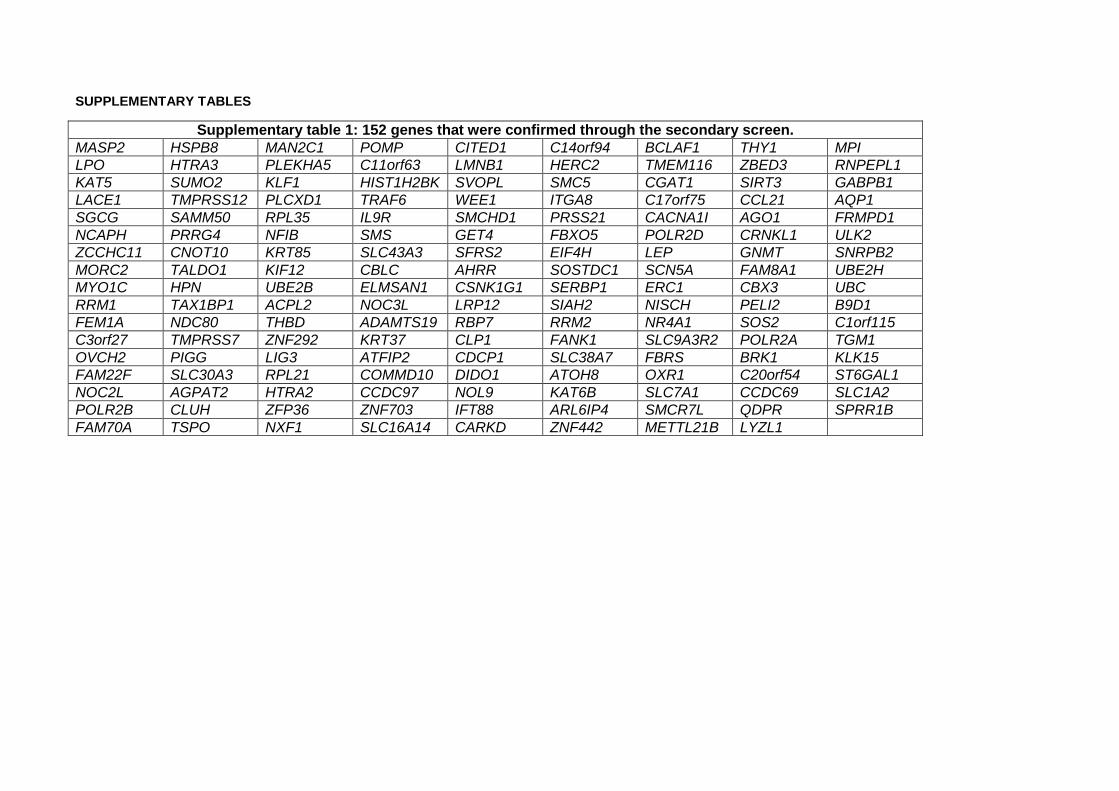
SUPPLEMENTARY TABLES
Supplementary table 1: 152 genes that were confirmed through the secondary screen.
MASP2 HSPB8 MAN2C1 POMP CITED1 C14orf94 BCLAF1 THY1 MPI LPO HTRA3 PLEKHA5 C11orf63 LMNB1 HERC2 TMEM116 ZBED3 RNPEPL1 KAT5 SUMO2 KLF1 HIST1H2BK SVOPL SMC5 CGAT1 SIRT3 GABPB1 LACE1 TMPRSS12 PLCXD1 TRAF6 WEE1 ITGA8 C17orf75 CCL21 AQP1 SGCG SAMM50 RPL35 IL9R SMCHD1 PRSS21 CACNA1I AGO1 FRMPD1 NCAPH PRRG4 NFIB SMS GET4 FBXO5 POLR2D CRNKL1 ULK2 ZCCHC11 CNOT10 KRT85 SLC43A3 SFRS2 EIF4H LEP GNMT SNRPB2 MORC2 TALDO1 KIF12 CBLC AHRR SOSTDC1 SCN5A FAM8A1 UBE2H MYO1C HPN UBE2B ELMSAN1 CSNK1G1 SERBP1 ERC1 CBX3 UBC RRM1 TAX1BP1 ACPL2 NOC3L LRP12 SIAH2 NISCH PELI2 B9D1 FEM1A NDC80 THBD ADAMTS19 RBP7 RRM2 NR4A1 SOS2 C1orf115 C3orf27 TMPRSS7 ZNF292 KRT37 CLP1 FANK1 SLC9A3R2 POLR2A TGM1 OVCH2 PIGG LIG3 ATFIP2 CDCP1 SLC38A7 FBRS BRK1 KLK15 FAM22F SLC30A3 RPL21 COMMD10 DIDO1 ATOH8 OXR1 C20orf54 ST6GAL1 NOC2L AGPAT2 HTRA2 CCDC97 NOL9 KAT6B SLC7A1 CCDC69 SLC1A2 POLR2B CLUH ZFP36 ZNF703 IFT88 ARL6IP4 SMCR7L QDPR SPRR1B FAM70A TSPO NXF1 SLC16A14 CARKD ZNF442 METTL21B LYZL1
.CC-BY-NC-ND 4.0 International license(which was not certified by peer review) is the author/funder. It is made available under aThe copyright holder for this preprintthis version posted December 23, 2019. . https://doi.org/10.1101/2019.12.23.886838doi: bioRxiv preprint
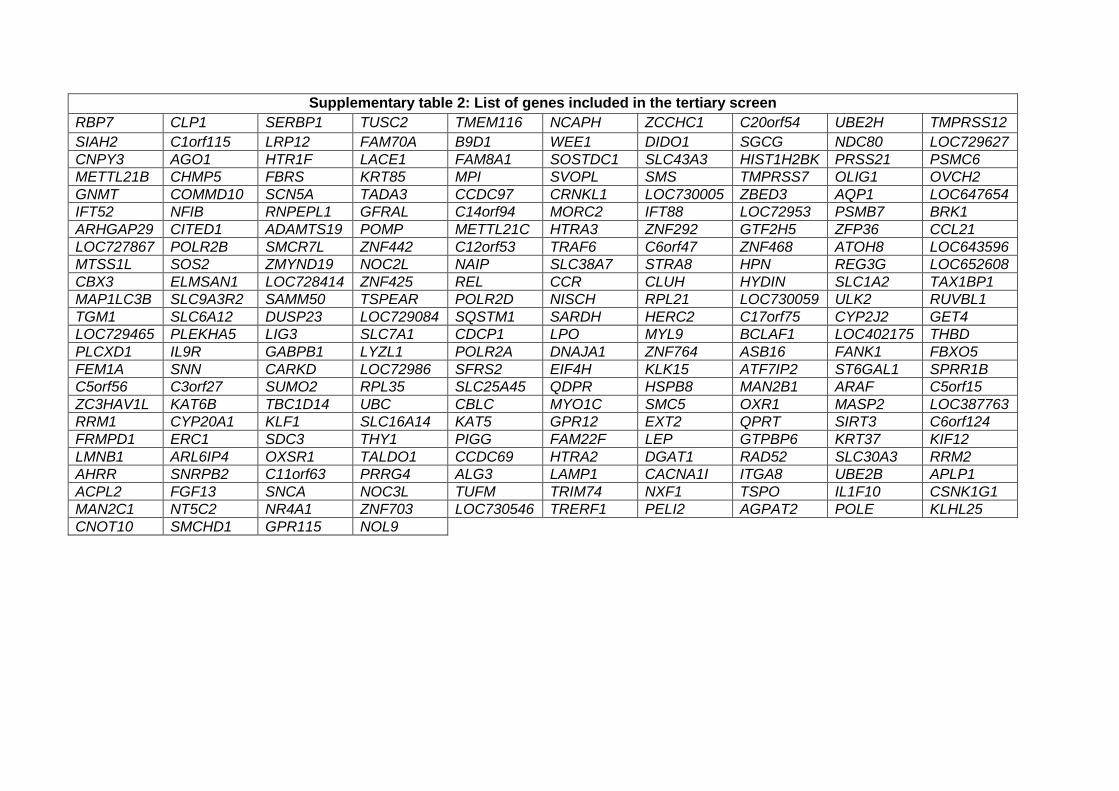
Supplementary table 2: List of genes included in the tertiary screen
RBP7 CLP1 SERBP1 TUSC2 TMEM116 NCAPH ZCCHC1 C20orf54 UBE2H TMPRSS12 SIAH2 C1orf115 LRP12 FAM70A B9D1 WEE1 DIDO1 SGCG NDC80 LOC729627 CNPY3 AGO1 HTR1F LACE1 FAM8A1 SOSTDC1 SLC43A3 HIST1H2BK PRSS21 PSMC6 METTL21B CHMP5 FBRS KRT85 MPI SVOPL SMS TMPRSS7 OLIG1 OVCH2 GNMT COMMD10 SCN5A TADA3 CCDC97 CRNKL1 LOC730005 ZBED3 AQP1 LOC647654 IFT52 NFIB RNPEPL1 GFRAL C14orf94 MORC2 IFT88 LOC72953 PSMB7 BRK1 ARHGAP29 CITED1 ADAMTS19 POMP METTL21C HTRA3 ZNF292 GTF2H5 ZFP36 CCL21 LOC727867 POLR2B SMCR7L ZNF442 C12orf53 TRAF6 C6orf47 ZNF468 ATOH8 LOC643596 MTSS1L SOS2 ZMYND19 NOC2L NAIP SLC38A7 STRA8 HPN REG3G LOC652608 CBX3 ELMSAN1 LOC728414 ZNF425 REL CCR CLUH HYDIN SLC1A2 TAX1BP1 MAP1LC3B SLC9A3R2 SAMM50 TSPEAR POLR2D NISCH RPL21 LOC730059 ULK2 RUVBL1 TGM1 SLC6A12 DUSP23 LOC729084 SQSTM1 SARDH HERC2 C17orf75 CYP2J2 GET4 LOC729465 PLEKHA5 LIG3 SLC7A1 CDCP1 LPO MYL9 BCLAF1 LOC402175 THBD PLCXD1 IL9R GABPB1 LYZL1 POLR2A DNAJA1 ZNF764 ASB16 FANK1 FBXO5 FEM1A SNN CARKD LOC72986 SFRS2 EIF4H KLK15 ATF7IP2 ST6GAL1 SPRR1B C5orf56 C3orf27 SUMO2 RPL35 SLC25A45 QDPR HSPB8 MAN2B1 ARAF C5orf15 ZC3HAV1L KAT6B TBC1D14 UBC CBLC MYO1C SMC5 OXR1 MASP2 LOC387763 RRM1 CYP20A1 KLF1 SLC16A14 KAT5 GPR12 EXT2 QPRT SIRT3 C6orf124 FRMPD1 ERC1 SDC3 THY1 PIGG FAM22F LEP GTPBP6 KRT37 KIF12 LMNB1 ARL6IP4 OXSR1 TALDO1 CCDC69 HTRA2 DGAT1 RAD52 SLC30A3 RRM2 AHRR SNRPB2 C11orf63 PRRG4 ALG3 LAMP1 CACNA1I ITGA8 UBE2B APLP1 ACPL2 FGF13 SNCA NOC3L TUFM TRIM74 NXF1 TSPO IL1F10 CSNK1G1 MAN2C1 NT5C2 NR4A1 ZNF703 LOC730546 TRERF1 PELI2 AGPAT2 POLE KLHL25 CNOT10 SMCHD1 GPR115 NOL9
.CC-BY-NC-ND 4.0 International license(which was not certified by peer review) is the author/funder. It is made available under aThe copyright holder for this preprintthis version posted December 23, 2019. . https://doi.org/10.1101/2019.12.23.886838doi: bioRxiv preprint

Supplementary table 3: Genes that regulate the cell-to-cell transfer of
both aSyn-RFP and RFP.
POLRA FBXO5 UBC RRM1 CITED1 MYOC1 GNMT SCN5A ZCCHC11 SLC7A1 DIDO1 AHRR LRP12 SMS
.CC-BY-NC-ND 4.0 International license(which was not certified by peer review) is the author/funder. It is made available under aThe copyright holder for this preprintthis version posted December 23, 2019. . https://doi.org/10.1101/2019.12.23.886838doi: bioRxiv preprint
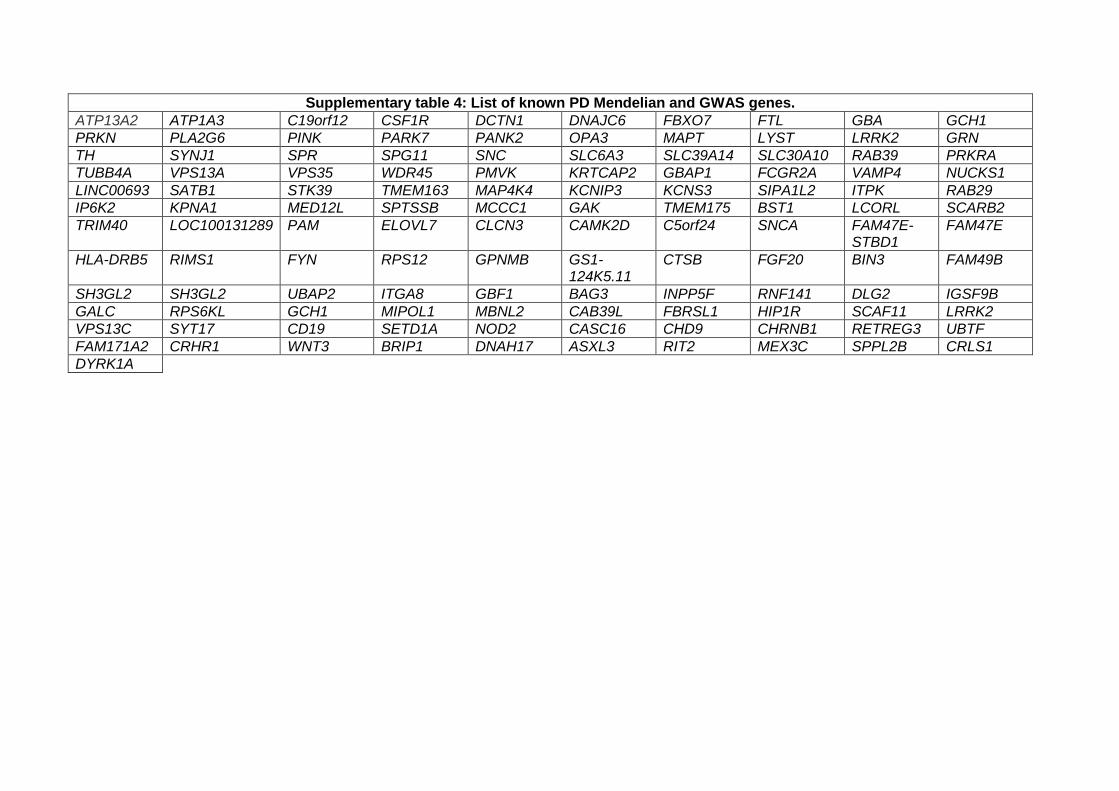
Supplementary table 4: List of known PD Mendelian and GWAS genes.
ATP13A2 ATP1A3 C19orf12 CSF1R DCTN1 DNAJC6 FBXO7 FTL GBA GCH1 PRKN PLA2G6 PINK PARK7 PANK2 OPA3 MAPT LYST LRRK2 GRN TH SYNJ1 SPR SPG11 SNC SLC6A3 SLC39A14 SLC30A10 RAB39 PRKRA TUBB4A VPS13A VPS35 WDR45 PMVK KRTCAP2 GBAP1 FCGR2A VAMP4 NUCKS1 LINC00693 SATB1 STK39 TMEM163 MAP4K4 KCNIP3 KCNS3 SIPA1L2 ITPK RAB29 IP6K2 KPNA1 MED12L SPTSSB MCCC1 GAK TMEM175 BST1 LCORL SCARB2 TRIM40 LOC100131289 PAM ELOVL7 CLCN3 CAMK2D C5orf24 SNCA FAM47E-
STBD1 FAM47E
HLA-DRB5 RIMS1 FYN RPS12 GPNMB GS1-124K5.11
CTSB FGF20 BIN3 FAM49B
SH3GL2 SH3GL2 UBAP2 ITGA8 GBF1 BAG3 INPP5F RNF141 DLG2 IGSF9B GALC RPS6KL GCH1 MIPOL1 MBNL2 CAB39L FBRSL1 HIP1R SCAF11 LRRK2 VPS13C SYT17 CD19 SETD1A NOD2 CASC16 CHD9 CHRNB1 RETREG3 UBTF FAM171A2 CRHR1 WNT3 BRIP1 DNAH17 ASXL3 RIT2 MEX3C SPPL2B CRLS1 DYRK1A
.CC-BY-NC-ND 4.0 International license(which was not certified by peer review) is the author/funder. It is made available under aThe copyright holder for this preprintthis version posted December 23, 2019. . https://doi.org/10.1101/2019.12.23.886838doi: bioRxiv preprint
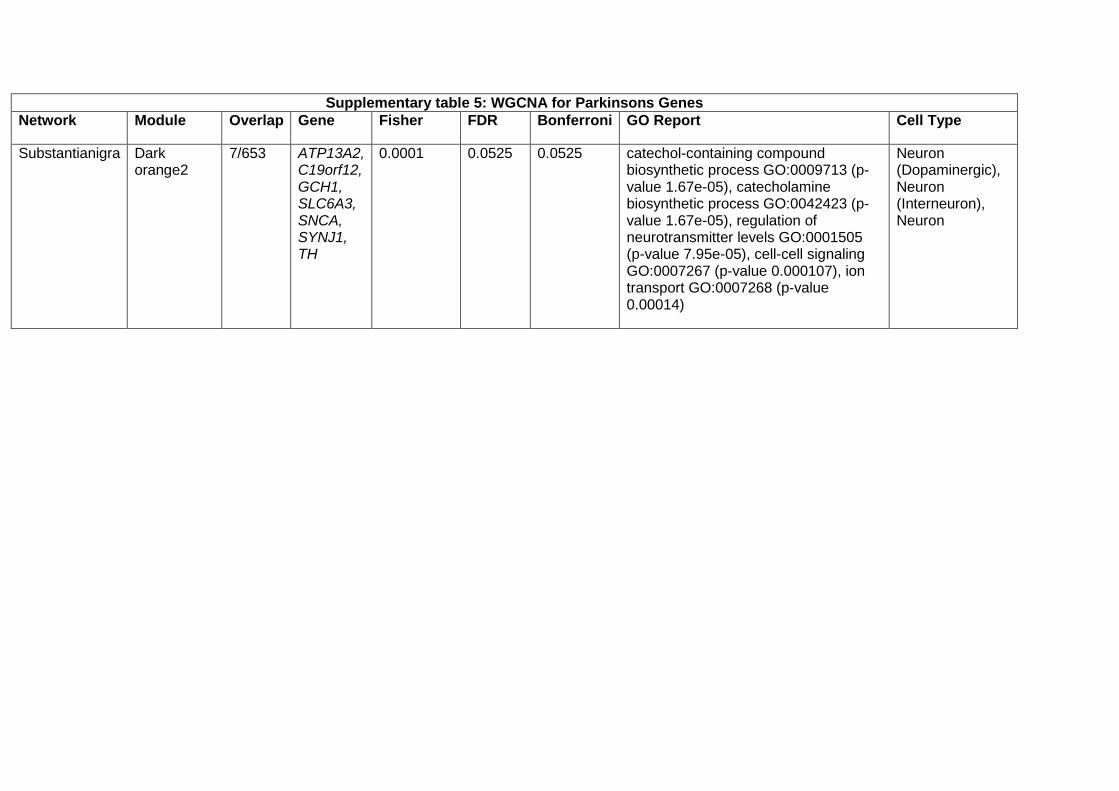
Supplementary table 5: WGCNA for Parkinsons Genes
Network
Module
Overlap
Gene
Fisher
FDR
Bonferroni
GO Report
Cell Type
Substantianigra
Dark orange2
7/653
ATP13A2, C19orf12, GCH1, SLC6A3, SNCA, SYNJ1, TH
0.0001
0.0525
0.0525
catechol-containing compound biosynthetic process GO:0009713 (p-value 1.67e-05), catecholamine biosynthetic process GO:0042423 (p-value 1.67e-05), regulation of neurotransmitter levels GO:0001505 (p-value 7.95e-05), cell-cell signaling GO:0007267 (p-value 0.000107), ion transport GO:0007268 (p-value 0.00014)
Neuron (Dopaminergic), Neuron (Interneuron), Neuron
.CC-BY-NC-ND 4.0 International license(which was not certified by peer review) is the author/funder. It is made available under aThe copyright holder for this preprintthis version posted December 23, 2019. . https://doi.org/10.1101/2019.12.23.886838doi: bioRxiv preprint
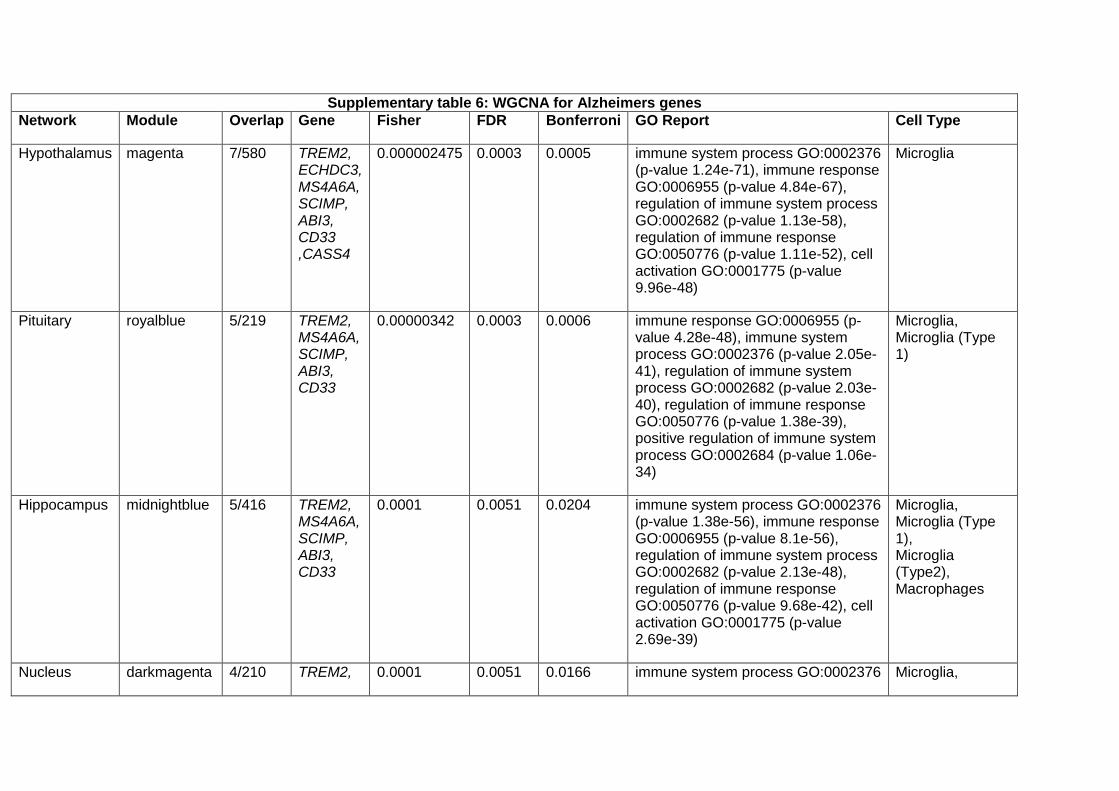
Supplementary table 6: WGCNA for Alzheimers genes
Network Module Overlap Gene Fisher FDR
Bonferroni
GO Report
Cell Type
Hypothalamus
magenta
7/580
TREM2, ECHDC3, MS4A6A, SCIMP, ABI3, CD33 ,CASS4
0.000002475
0.0003
0.0005
immune system process GO:0002376 (p-value 1.24e-71), immune response GO:0006955 (p-value 4.84e-67), regulation of immune system process GO:0002682 (p-value 1.13e-58), regulation of immune response GO:0050776 (p-value 1.11e-52), cell activation GO:0001775 (p-value 9.96e-48)
Microglia
Pituitary
royalblue
5/219
TREM2, MS4A6A, SCIMP, ABI3, CD33
0.00000342
0.0003
0.0006
immune response GO:0006955 (p-value 4.28e-48), immune system process GO:0002376 (p-value 2.05e-41), regulation of immune system process GO:0002682 (p-value 2.03e-40), regulation of immune response GO:0050776 (p-value 1.38e-39), positive regulation of immune system process GO:0002684 (p-value 1.06e-34)
Microglia, Microglia (Type 1)
Hippocampus
midnightblue
5/416
TREM2, MS4A6A, SCIMP, ABI3, CD33
0.0001
0.0051
0.0204
immune system process GO:0002376 (p-value 1.38e-56), immune response GO:0006955 (p-value 8.1e-56), regulation of immune system process GO:0002682 (p-value 2.13e-48), regulation of immune response GO:0050776 (p-value 9.68e-42), cell activation GO:0001775 (p-value 2.69e-39)
Microglia, Microglia (Type 1), Microglia (Type2), Macrophages
Nucleus darkmagenta
4/210
TREM2, 0.0001
0.0051
0.0166
immune system process GO:0002376 Microglia,
.CC-BY-NC-ND 4.0 International license(which was not certified by peer review) is the author/funder. It is made available under aThe copyright holder for this preprintthis version posted December 23, 2019. . https://doi.org/10.1101/2019.12.23.886838doi: bioRxiv preprint
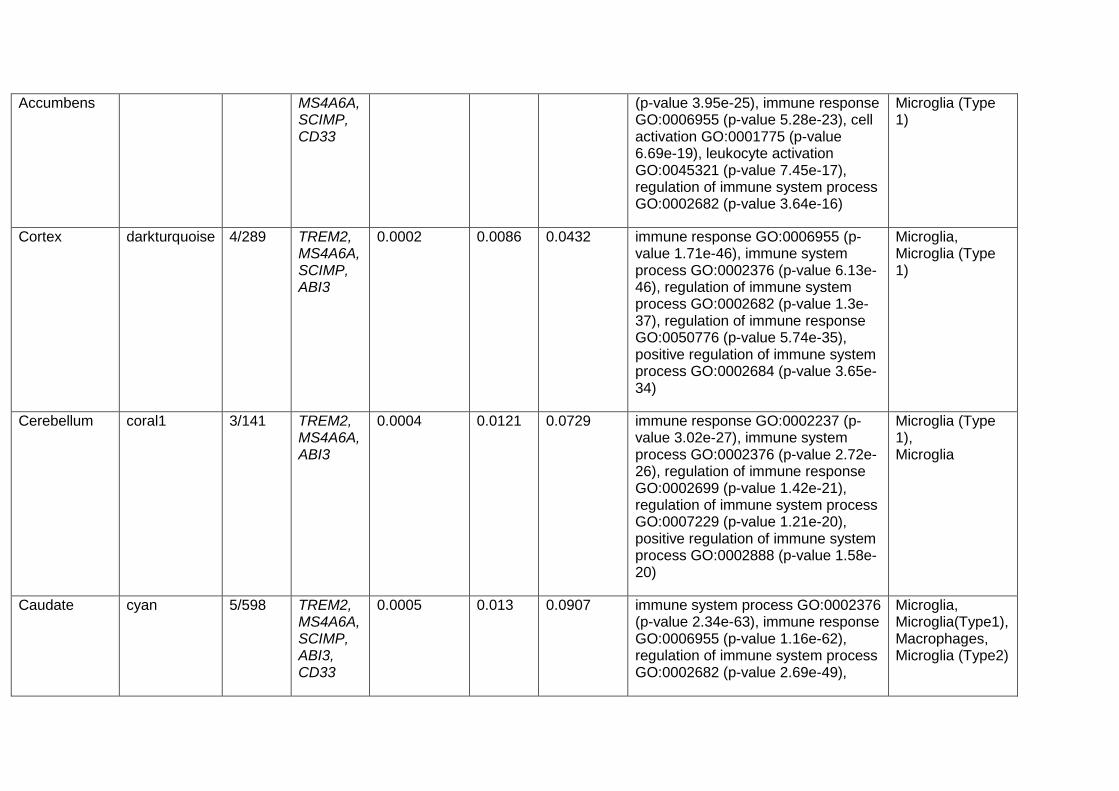
Accumbens
MS4A6A, SCIMP, CD33
(p-value 3.95e-25), immune response GO:0006955 (p-value 5.28e-23), cell activation GO:0001775 (p-value 6.69e-19), leukocyte activation GO:0045321 (p-value 7.45e-17), regulation of immune system process GO:0002682 (p-value 3.64e-16)
Microglia (Type 1)
Cortex
darkturquoise
4/289
TREM2, MS4A6A, SCIMP, ABI3
0.0002
0.0086
0.0432
immune response GO:0006955 (p-value 1.71e-46), immune system process GO:0002376 (p-value 6.13e-46), regulation of immune system process GO:0002682 (p-value 1.3e-37), regulation of immune response GO:0050776 (p-value 5.74e-35), positive regulation of immune system process GO:0002684 (p-value 3.65e-34)
Microglia, Microglia (Type 1)
Cerebellum
coral1
3/141
TREM2, MS4A6A, ABI3
0.0004
0.0121
0.0729
immune response GO:0002237 (p-value 3.02e-27), immune system process GO:0002376 (p-value 2.72e-26), regulation of immune response GO:0002699 (p-value 1.42e-21), regulation of immune system process GO:0007229 (p-value 1.21e-20), positive regulation of immune system process GO:0002888 (p-value 1.58e-20)
Microglia (Type 1), Microglia
Caudate
cyan
5/598
TREM2, MS4A6A, SCIMP, ABI3, CD33
0.0005
0.013
0.0907
immune system process GO:0002376 (p-value 2.34e-63), immune response GO:0006955 (p-value 1.16e-62), regulation of immune system process GO:0002682 (p-value 2.69e-49),
Microglia, Microglia(Type1), Macrophages, Microglia (Type2)
.CC-BY-NC-ND 4.0 International license(which was not certified by peer review) is the author/funder. It is made available under aThe copyright holder for this preprintthis version posted December 23, 2019. . https://doi.org/10.1101/2019.12.23.886838doi: bioRxiv preprint
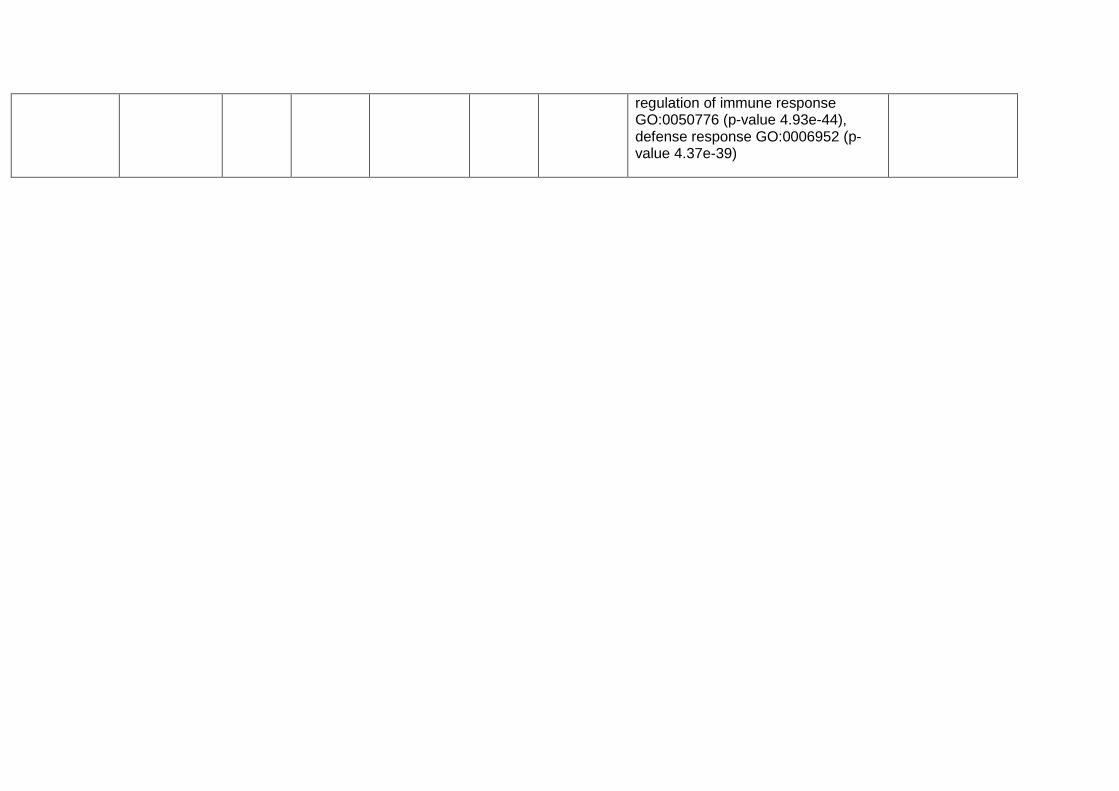
regulation of immune response GO:0050776 (p-value 4.93e-44), defense response GO:0006952 (p-value 4.37e-39)
.CC-BY-NC-ND 4.0 International license(which was not certified by peer review) is the author/funder. It is made available under aThe copyright holder for this preprintthis version posted December 23, 2019. . https://doi.org/10.1101/2019.12.23.886838doi: bioRxiv preprint
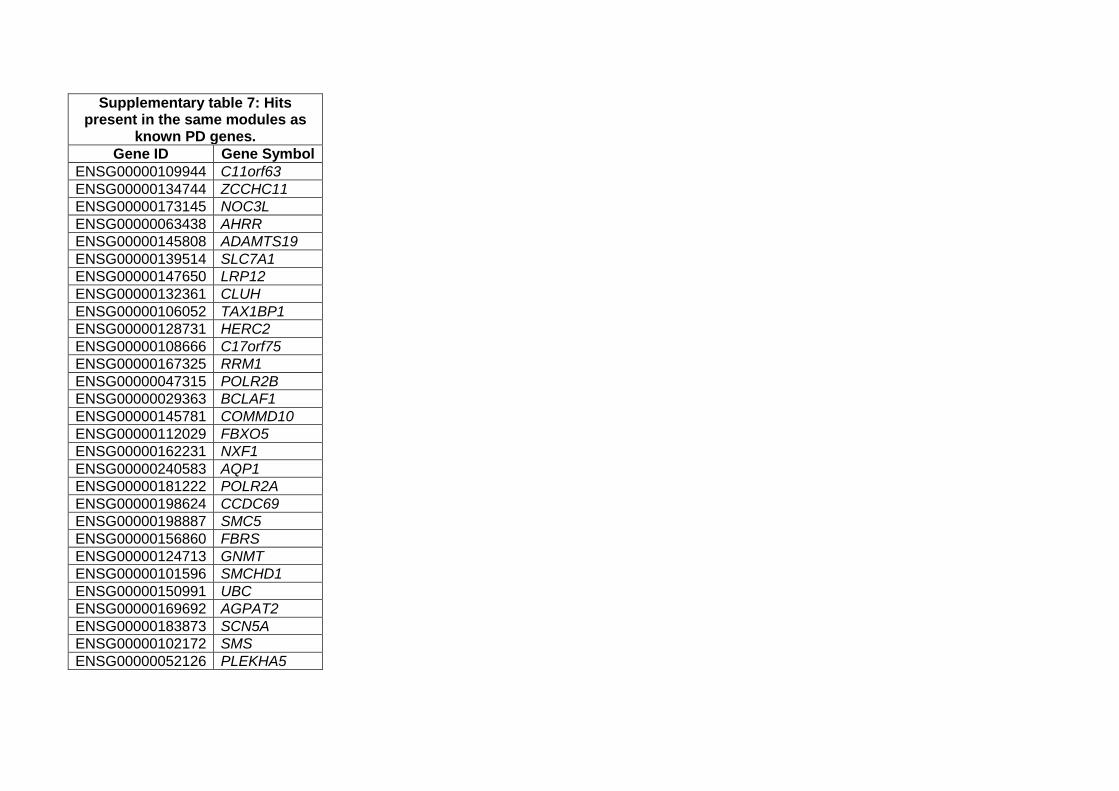
Supplementary table 7: Hits present in the same modules as
known PD genes.
Gene ID Gene Symbol
ENSG00000109944 C11orf63 ENSG00000134744 ZCCHC11 ENSG00000173145 NOC3L ENSG00000063438 AHRR ENSG00000145808 ADAMTS19 ENSG00000139514 SLC7A1 ENSG00000147650 LRP12 ENSG00000132361 CLUH ENSG00000106052 TAX1BP1 ENSG00000128731 HERC2 ENSG00000108666 C17orf75 ENSG00000167325 RRM1 ENSG00000047315 POLR2B ENSG00000029363 BCLAF1 ENSG00000145781 COMMD10 ENSG00000112029 FBXO5 ENSG00000162231 NXF1 ENSG00000240583 AQP1 ENSG00000181222 POLR2A ENSG00000198624 CCDC69 ENSG00000198887 SMC5 ENSG00000156860 FBRS ENSG00000124713 GNMT ENSG00000101596 SMCHD1 ENSG00000150991 UBC ENSG00000169692 AGPAT2 ENSG00000183873 SCN5A ENSG00000102172 SMS ENSG00000052126 PLEKHA5
.CC-BY-NC-ND 4.0 International license(which was not certified by peer review) is the author/funder. It is made available under aThe copyright holder for this preprintthis version posted December 23, 2019. . https://doi.org/10.1101/2019.12.23.886838doi: bioRxiv preprint
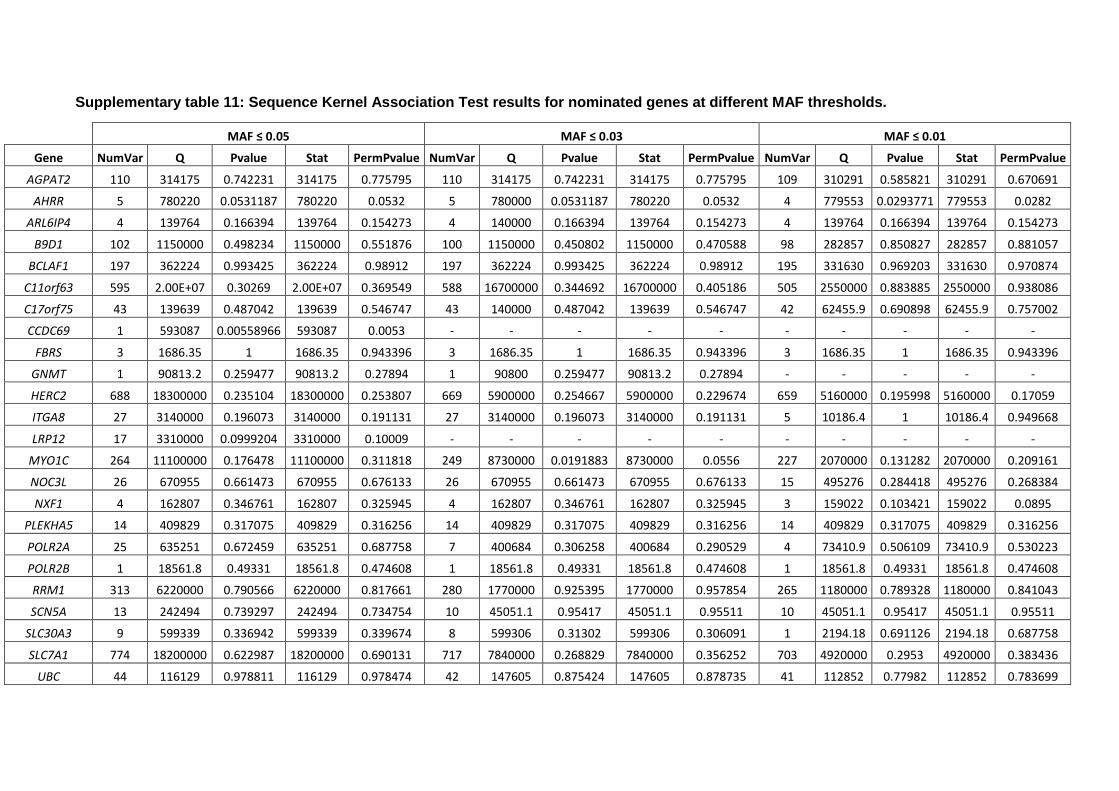
Supplementary table 11: Sequence Kernel Association Test results for nominated genes at different MAF thresholds.
MAF ≤ 0.05 MAF ≤ 0.03 MAF ≤ 0.01
Gene NumVar Q Pvalue Stat PermPvalue NumVar Q Pvalue Stat PermPvalue NumVar Q Pvalue Stat PermPvalue
AGPAT2 110 314175 0.742231 314175 0.775795 110 314175 0.742231 314175 0.775795 109 310291 0.585821 310291 0.670691
AHRR 5 780220 0.0531187 780220 0.0532 5 780000 0.0531187 780220 0.0532 4 779553 0.0293771 779553 0.0282
ARL6IP4 4 139764 0.166394 139764 0.154273 4 140000 0.166394 139764 0.154273 4 139764 0.166394 139764 0.154273
B9D1 102 1150000 0.498234 1150000 0.551876 100 1150000 0.450802 1150000 0.470588 98 282857 0.850827 282857 0.881057
BCLAF1 197 362224 0.993425 362224 0.98912 197 362224 0.993425 362224 0.98912 195 331630 0.969203 331630 0.970874
C11orf63 595 2.00E+07 0.30269 2.00E+07 0.369549 588 16700000 0.344692 16700000 0.405186 505 2550000 0.883885 2550000 0.938086
C17orf75 43 139639 0.487042 139639 0.546747 43 140000 0.487042 139639 0.546747 42 62455.9 0.690898 62455.9 0.757002
CCDC69 1 593087 0.00558966 593087 0.0053 - - - - - - - - - -
FBRS 3 1686.35 1 1686.35 0.943396 3 1686.35 1 1686.35 0.943396 3 1686.35 1 1686.35 0.943396
GNMT 1 90813.2 0.259477 90813.2 0.27894 1 90800 0.259477 90813.2 0.27894 - - - - -
HERC2 688 18300000 0.235104 18300000 0.253807 669 5900000 0.254667 5900000 0.229674 659 5160000 0.195998 5160000 0.17059
ITGA8 27 3140000 0.196073 3140000 0.191131 27 3140000 0.196073 3140000 0.191131 5 10186.4 1 10186.4 0.949668
LRP12 17 3310000 0.0999204 3310000 0.10009 - - - - - - - - - -
MYO1C 264 11100000 0.176478 11100000 0.311818 249 8730000 0.0191883 8730000 0.0556 227 2070000 0.131282 2070000 0.209161
NOC3L 26 670955 0.661473 670955 0.676133 26 670955 0.661473 670955 0.676133 15 495276 0.284418 495276 0.268384
NXF1 4 162807 0.346761 162807 0.325945 4 162807 0.346761 162807 0.325945 3 159022 0.103421 159022 0.0895
PLEKHA5 14 409829 0.317075 409829 0.316256 14 409829 0.317075 409829 0.316256 14 409829 0.317075 409829 0.316256
POLR2A 25 635251 0.672459 635251 0.687758 7 400684 0.306258 400684 0.290529 4 73410.9 0.506109 73410.9 0.530223
POLR2B 1 18561.8 0.49331 18561.8 0.474608 1 18561.8 0.49331 18561.8 0.474608 1 18561.8 0.49331 18561.8 0.474608
RRM1 313 6220000 0.790566 6220000 0.817661 280 1770000 0.925395 1770000 0.957854 265 1180000 0.789328 1180000 0.841043
SCN5A 13 242494 0.739297 242494 0.734754 10 45051.1 0.95417 45051.1 0.95511 10 45051.1 0.95417 45051.1 0.95511
SLC30A3 9 599339 0.336942 599339 0.339674 8 599306 0.31302 599306 0.306091 1 2194.18 0.691126 2194.18 0.687758
SLC7A1 774 18200000 0.622987 18200000 0.690131 717 7840000 0.268829 7840000 0.356252 703 4920000 0.2953 4920000 0.383436
UBC 44 116129 0.978811 116129 0.978474 42 147605 0.875424 147605 0.878735 41 112852 0.77982 112852 0.783699
.CC-BY-NC-ND 4.0 International license(which was not certified by peer review) is the author/funder. It is made available under aThe copyright holder for this preprintthis version posted December 23, 2019. . https://doi.org/10.1101/2019.12.23.886838doi: bioRxiv preprint
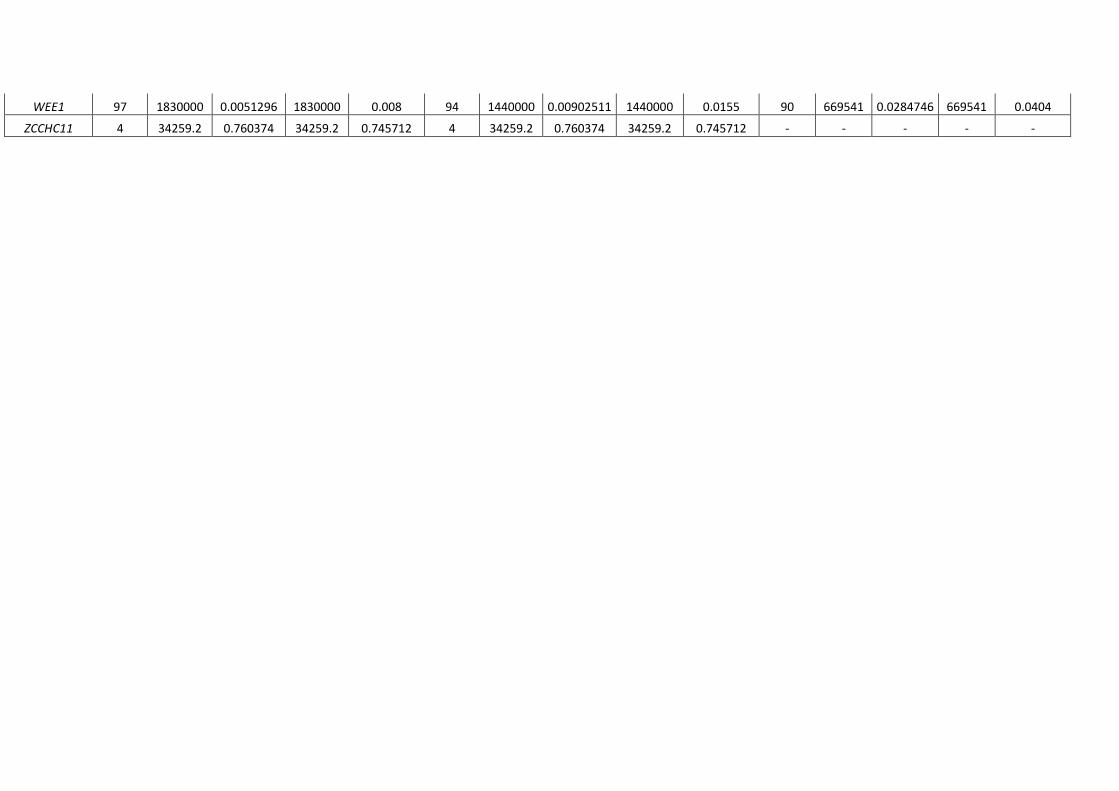
WEE1 97 1830000 0.0051296 1830000 0.008 94 1440000 0.00902511 1440000 0.0155 90 669541 0.0284746 669541 0.0404
ZCCHC11 4 34259.2 0.760374 34259.2 0.745712 4 34259.2 0.760374 34259.2 0.745712 - - - - -
.CC-BY-NC-ND 4.0 International license(which was not certified by peer review) is the author/funder. It is made available under aThe copyright holder for this preprintthis version posted December 23, 2019. . https://doi.org/10.1101/2019.12.23.886838doi: bioRxiv preprint
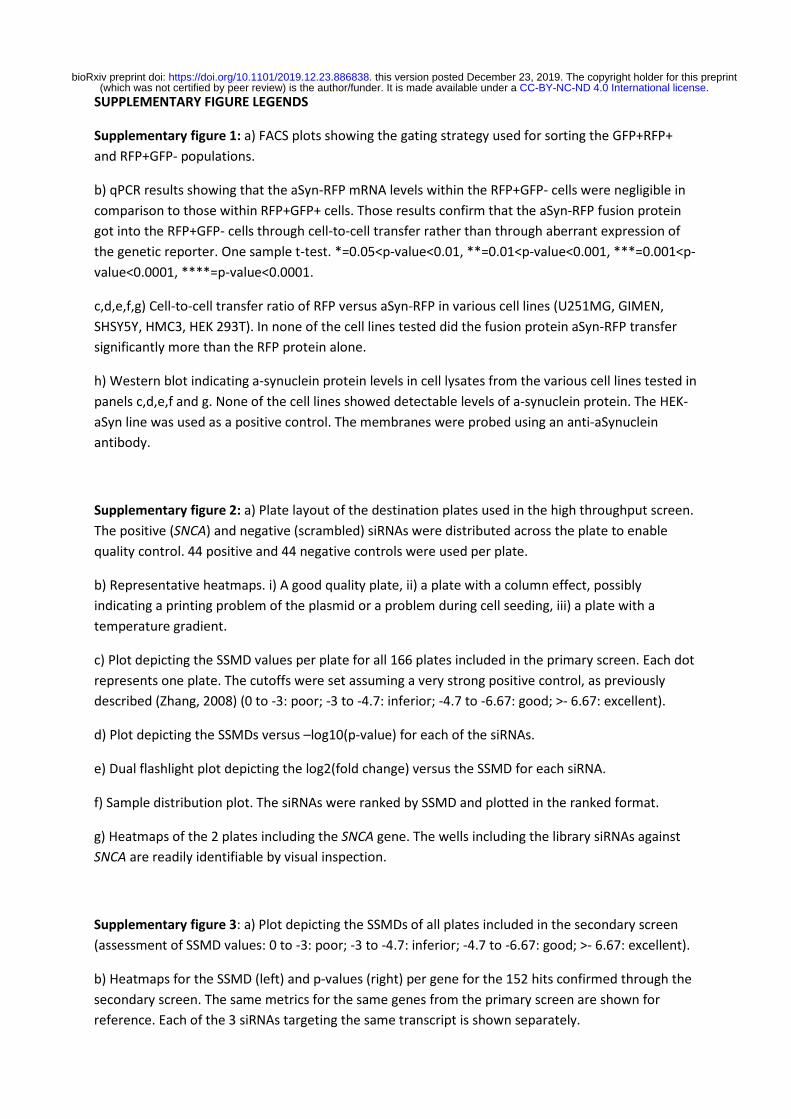
SUPPLEMENTARY FIGURE LEGENDS
Supplementary figure 1: a) FACS plots showing the gating strategy used for sorting the GFP+RFP+ and RFP+GFP- populations.
b) qPCR results showing that the aSyn-RFP mRNA levels within the RFP+GFP- cells were negligible in comparison to those within RFP+GFP+ cells. Those results confirm that the aSyn-RFP fusion protein got into the RFP+GFP- cells through cell-to-cell transfer rather than through aberrant expression of the genetic reporter. One sample t-test. *=0.05<p-value<0.01, **=0.01<p-value<0.001, ***=0.001<p-value<0.0001, ****=p-value<0.0001.
c,d,e,f,g) Cell-to-cell transfer ratio of RFP versus aSyn-RFP in various cell lines (U251MG, GIMEN, SHSY5Y, HMC3, HEK 293T). In none of the cell lines tested did the fusion protein aSyn-RFP transfer significantly more than the RFP protein alone.
h) Western blot indicating a-synuclein protein levels in cell lysates from the various cell lines tested in panels c,d,e,f and g. None of the cell lines showed detectable levels of a-synuclein protein. The HEK-aSyn line was used as a positive control. The membranes were probed using an anti-aSynuclein antibody.
Supplementary figure 2: a) Plate layout of the destination plates used in the high throughput screen. The positive (SNCA) and negative (scrambled) siRNAs were distributed across the plate to enable quality control. 44 positive and 44 negative controls were used per plate.
b) Representative heatmaps. i) A good quality plate, ii) a plate with a column effect, possibly indicating a printing problem of the plasmid or a problem during cell seeding, iii) a plate with a temperature gradient.
c) Plot depicting the SSMD values per plate for all 166 plates included in the primary screen. Each dot represents one plate. The cutoffs were set assuming a very strong positive control, as previously described (Zhang, 2008) (0 to -3: poor; -3 to -4.7: inferior; -4.7 to -6.67: good; >- 6.67: excellent).
d) Plot depicting the SSMDs versus –log10(p-value) for each of the siRNAs.
e) Dual flashlight plot depicting the log2(fold change) versus the SSMD for each siRNA.
f) Sample distribution plot. The siRNAs were ranked by SSMD and plotted in the ranked format.
g) Heatmaps of the 2 plates including the SNCA gene. The wells including the library siRNAs against SNCA are readily identifiable by visual inspection.
Supplementary figure 3: a) Plot depicting the SSMDs of all plates included in the secondary screen (assessment of SSMD values: 0 to -3: poor; -3 to -4.7: inferior; -4.7 to -6.67: good; >- 6.67: excellent).
b) Heatmaps for the SSMD (left) and p-values (right) per gene for the 152 hits confirmed through the secondary screen. The same metrics for the same genes from the primary screen are shown for reference. Each of the 3 siRNAs targeting the same transcript is shown separately.
.CC-BY-NC-ND 4.0 International license(which was not certified by peer review) is the author/funder. It is made available under aThe copyright holder for this preprintthis version posted December 23, 2019. . https://doi.org/10.1101/2019.12.23.886838doi: bioRxiv preprint
c) Plot showing the SSMD per plate for one of the 3 tertiary screens (assessment of SSMD values: 0 to -3: poor; -3 to -4.7: inferior; -4.7 to -6.67: good; >- 6.67: excellent).
d) Heatmaps showing the p-values and SSMDs for each of the 233 genes included in the tertiary screens. Color code: purple=39 hits, green= 114/152 filtered out genes, yellow= random genes. On the first 2 heatmaps, the genes have been ranked by p-value and SSMD, respectively. On the heatmap on the right, the genes have been clustered based on their status (i.e. belonging to one of the following 3 groups: 39 hits, 80 random genes, 114 genes identified through the secondary screen that did not pass the cutoffs of the tertiary screens).
e) Validation of 39 hits generated after the tertiary screens through flow cytometry. 82% of the genes had a directionality of effect that was consistent with that seen in the imaging-based screen.
f) Plot showing the rate of cell-to-cell transfer of RFP. Significance level cutoffs (Bonferroni corrected p-values with a=0.05) are depicted on the plot in the pink boxes. This screen was completed on the HEK-aSyn cell line.
Supplementary figure 4: a) Effect of various concentrations of DMSO and ethanol on the cell-to-cell transfer of a-synuclein. Increasing the concentration of the vehicle did not affect the rate of the cell-to-cell transfer of the asyn-RFP fusion protein (i.e. no dose-response effect was seen for the vehicle-only).
b) Toxicity levels of various concentrations of the vehicles. No significant difference was observed between concentrations.
% indicates v/v% of DMSO or ethanol in the culture medium of the cells.
ETOH=ethanol.
Supplementary figure 5: Dyes of different colors were used to confirm the results from the lysotracker and mitotracker assays.
a) The mean fluorescence intensity (MFI) of LysoTracker blue showed a linear dose response to the concentration of the dye, and the positive (chloroquine) and negative (untreated) controls were well-separated.
b) The positive control (chloroquine) significantly reduced the MFI of LysoTracker blue in comparison to the untreated samples. The experiment was repeated 5 times independently, data was internally normalized to the negative control prior to metaanalysis. Statistical analysis was performed with one sample t test. *=0.05<p-value<0.01, **=0.01<p-value<0.001, ***=0.001<p-value<0.0001, ****=p-value<0.0001.
c) The MFI of mitotracker far red showed a linear dose response to the concentration of the dye, and the positive (CCCP) and negative (DMSO) controls were well separated.
d,e,f) Percentage of the cells in each phase of the cell cycle. The experiment was performed 3 times independently and the data was normalized internally to the negative control prior to metaanalysis.
.CC-BY-NC-ND 4.0 International license(which was not certified by peer review) is the author/funder. It is made available under aThe copyright holder for this preprintthis version posted December 23, 2019. . https://doi.org/10.1101/2019.12.23.886838doi: bioRxiv preprint
Statistical analysis was performed with one sample t test, followed by Bonferroni correction for multiple testings. *=0.05<p-value<0.01, **=0.01<p-value<0.001, ***=0.001<p-value<0.0001, ****=p-value<0.0001.
Optimizations of siRNA transfections with 3 days’ incubation.
g) HEK-aSyn cells were co-transfected with the GRP-2a-aSyn-RFP construct plus 3 pooled siRNAs against SNCA or a scrambled control siRNA. The SNCA siRNAs resulted in a 83.86+/-3.6% reduction in the MFI of RFP. The experiment was performed 5 times independently.
h) HEK-aSyn cells were co-transfected with the GRP-2a-aSyn-RFP construct plus the siRNA-Cy5. Transfection efficiency was 93.6+/-7.2%. The experiment was performed 5 times independently.
Supplementary figure 6: Null distribution of the percentage of genes overlapping with PD genes. 100,000 random simulations were performed, generating 100,000 lists of genes each of which contained 37 genes. Based on the fraction of times that we saw a greater % of overlap of the random gene lists with the PD genes than the % overlap observed for the 37 hits, an empirical p-value was generated. We found that the co-clustering of hits with PD genes occurred more frequently than expected by random chance, with an empirical p-value of 0.014.
Supplementary figure 7: The top panel depicts the normal distribution of the % overlap with Mendelian PD network, while the bottom panel with the PD GWAS risk genes network.
a) Random matches (RANDOM) Experimental Network (615 nodes) vs (REAL) PD network (545 nodes)
number of real matches = 79; mean of random matches = 16
b) Random matches (RANDOM) Experimental Network (615 nodes) vs (REAL) GWAS network (902 nodes)
number of real matches = 132; mean of random matches = 28
.CC-BY-NC-ND 4.0 International license(which was not certified by peer review) is the author/funder. It is made available under aThe copyright holder for this preprintthis version posted December 23, 2019. . https://doi.org/10.1101/2019.12.23.886838doi: bioRxiv preprint
RFP+GFP+
RFP+GFP-
0.0
0.5
1.0
1.5
No
rmal
ized
aS
yn-R
FP
exp
ress
ion
/G
AP
DH
exp
ress
ion ***
GFP2ARFP
GFP2AsynRFP
-1
0
1
2
3
4
No
rma
lized
%R
FP
+G
FP
-/%
RF
P+
GF
P+
U251MG
GFP2ARFP
GFP2AsynRFP
0.0
0.5
1.0
1.5
No
rmal
ized
%R
FP
+G
FP
-/%
RF
P+
GF
P+
GIMEN
GFP2ARFP
GFP2AsynRFP
0.0
0.5
1.0
1.5
No
rma
lized
%R
FP
+G
FP
-/%
RF
P+
GF
P+
SHSY5Y
GFP2ARFP
GFP2AsynRFP
0
1
2
3
No
rma
lized
%R
FP
+G
FP
-/%
RF
P+
GF
P+ HMC3
10
152025
3750
75100150250kDa α-synuclein
10
152025
3750
75100150250kDa β-actin
GFP2aRFP
GFP2aSynRFP
0
1
2
3
4
No
rma
lized
%R
FP
+G
FP
-/%
RF
P+
GF
P+ HEK 293T
qPCR fold-change
GFP
RF
P
FSC-A
FS
C-H
FSC-A
SS
C-A
RFP only GFP only GFP-2a-aSyn-RFP
Singles No debrisA B
C D E
F G
H
FACS-sortedpopulations
Figure S1
.CC-BY-NC-ND 4.0 International license(which was not certified by peer review) is the author/funder. It is made available under aThe copyright holder for this preprintthis version posted December 23, 2019. . https://doi.org/10.1101/2019.12.23.886838doi: bioRxiv preprint
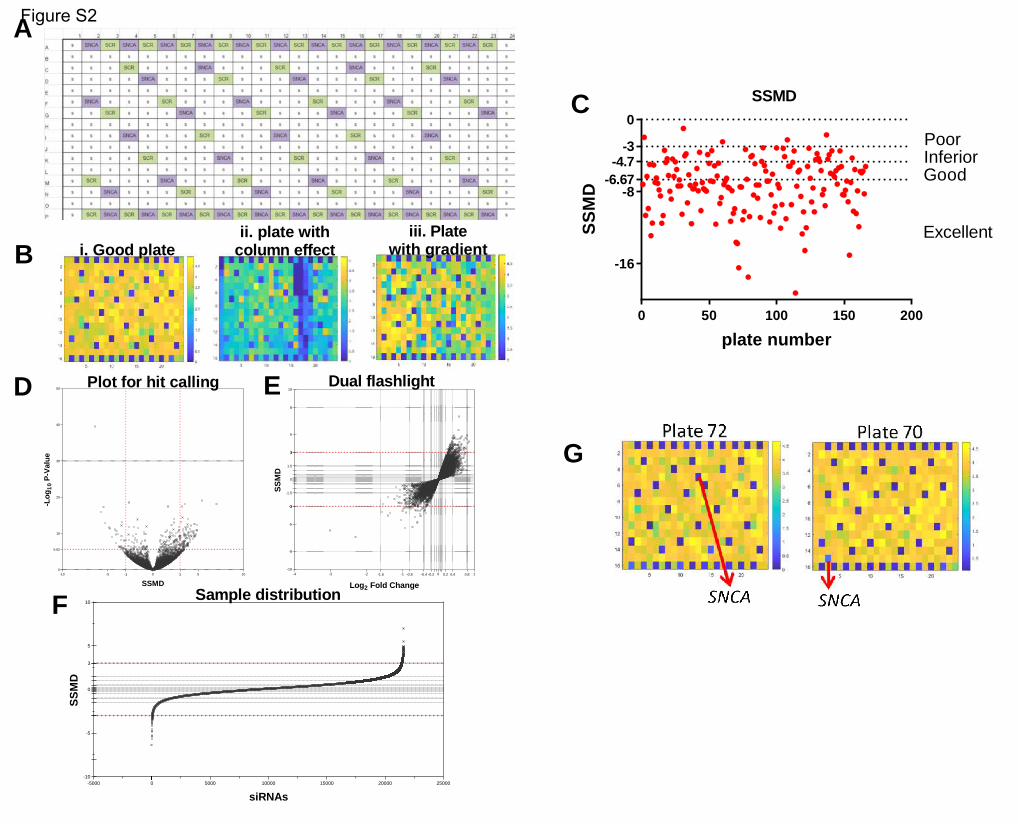
0 50 100 150 200
-16
-8
0
plate number
SS
MD
Excellent
GoodInferiorPoor-3
-4.7-6.67
-10 -5 0 5 100
10
20
30
40
50
SSMD
-Lo
g1
0P
-Val
ue
-3 3
5.62
-5000 0 5000 10000 15000 20000 25000-10
-5
0
5
10
siRNAs
SS
MD
3
SSMD
Plot for hit calling
-4 -3 -2 -1 0 1-10
-5
0
5
10
Log2 Fold Change
SS
MD
-1.6 -0.8 -0.4 -0.2 0.2 0.4 0.8
-8
-3-3
-1.5
1.5
33
8
Dual flashlight
Sample distribution
i. Good plateii. plate with
column effectiii. Plate
with gradient
A
B
C
D E
F
G
Figure S2
.CC-BY-NC-ND 4.0 International license(which was not certified by peer review) is the author/funder. It is made available under aThe copyright holder for this preprintthis version posted December 23, 2019. . https://doi.org/10.1101/2019.12.23.886838doi: bioRxiv preprint
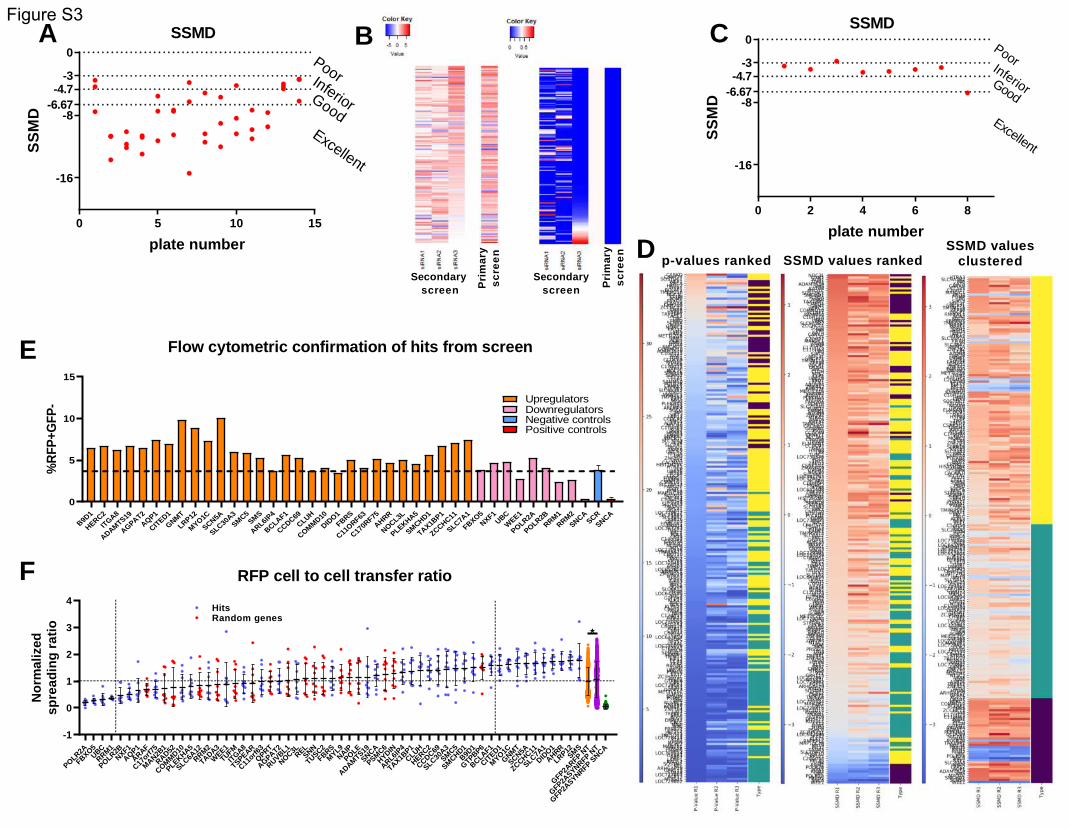
0 5 10 15
-16
-8
0
plate number
SS
MD
Excellent
Good
Inferior
Poor-3-4.7
-6.67
0 2 4 6 8
-16
-8
0
plate number
SS
MD
Excellent
Good
Inferior
Poor-3-4.7
-6.67
B9D1
HERC2
ITGA8
ADAMTS19
AGPAT2
AQP1
CITED1
GNMT
LRP12
MYO1C
SCN5A
SLC30A3
SMC5
SMS
ARL6IP4
BCLAF1
CCDC69
CLUH
COMM
D10
DIDO1
FBRS
C11ORF63
C170R
F75
AHRR
NOCL3L
PLEKHA5
SMCHD1
TAX1BP1
ZCCHC11
SLC7A1
FBXO5NXF1
UBC
WEE1
POLR2A
POLR2B
RRM1
RRM2
SNCASCR
SNCA
0
5
10
15
%R
FP+G
FP- Upregulators
DownregulatorsNegative controlsPositive controls
POLR2A
FBXO5UBC
RRM1
POLR2B
NXF1
AQP1
ARAF
C17orf7
5
MAN2B
1
RAD52
COMM
D10
PLEKHA5
SLC6A12
RRM2
TADA3
WEE1
TUFM
ITGA8
TSPEAR
C11orf6
3
QPRT
AGPAT2
RUVBL1
NOC3LREL
SNN
TUSC2
FBRS
MYL9
NAIP
POLE
ADAMTS19
SNCA
PSMC6
HYDIN
ARL6IP4
TAX1BP1
CLUH
HERC2
CCDC69
SLC30A3
SMC5
SMCHD1
B9D1
GTPBP6
BCLAF1
CITED1
MYO
1C
GNM
T
SCN5A
ZCCHC11
SLC7A1
DIDO1
AHRR
LRP12SM
S
GFP2A
RFPNT
GFP2A
SYNRFPNT
GFP2A
SYNRFPSNCA
-1
0
1
2
3
4
No
rma
lized
sp
rea
din
gra
tio
HitsRandom genes
*
SSMDSSMD
Flow cytometric confirmation of hits from screen
A B C
D
E
F RFP cell to cell transfer ratio
Secondaryscreen
SecondaryscreenPri
ma
rys
cre
en
Pri
ma
rys
cre
en
p-values ranked SSMD values rankedSSMD values
clustered
Figure S3
.CC-BY-NC-ND 4.0 International license(which was not certified by peer review) is the author/funder. It is made available under aThe copyright holder for this preprintthis version posted December 23, 2019. . https://doi.org/10.1101/2019.12.23.886838doi: bioRxiv preprint
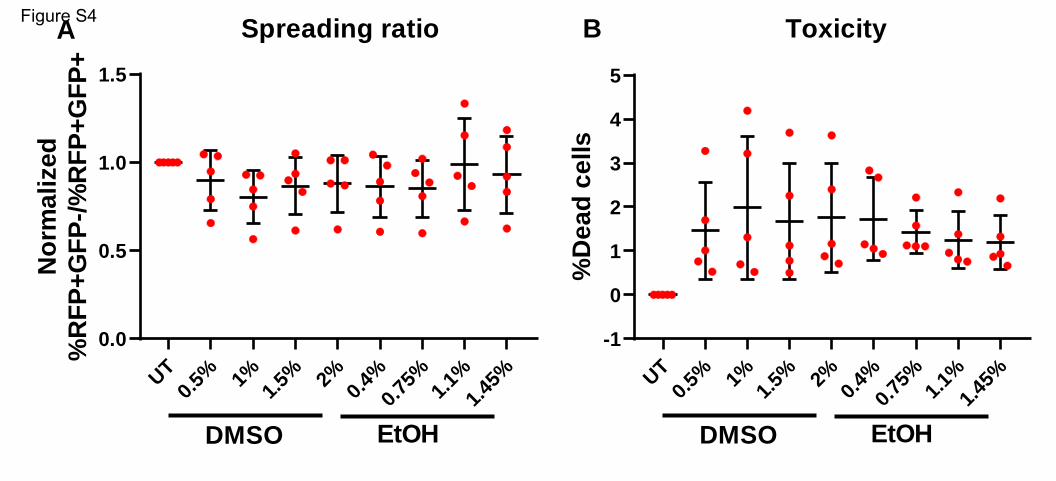
UT0.
5% 1%1.
5% 2%0.
4%0.
75%
1.1%
1.45
%
0.0
0.5
1.0
1.5N
orm
aliz
ed%
RF
P+
GF
P-/
%R
FP
+G
FP
+
DMSO EtOH
UT0.
5% 1%1.
5% 2%0.
4%0.
75%
1.1%
1.45
%
-1
0
1
2
3
4
5
%D
ea
dc
ells
DMSO EtOH
A BSpreading ratio ToxicityFigure S4
.CC-BY-NC-ND 4.0 International license(which was not certified by peer review) is the author/funder. It is made available under aThe copyright holder for this preprintthis version posted December 23, 2019. . https://doi.org/10.1101/2019.12.23.886838doi: bioRxiv preprint
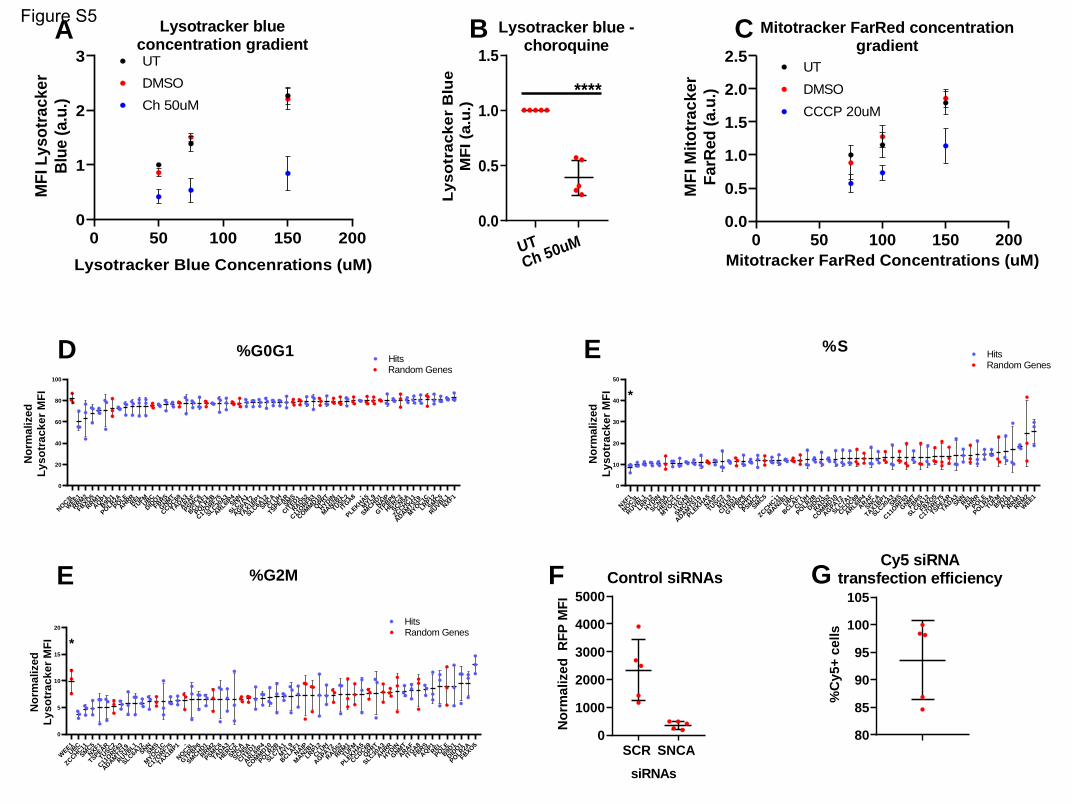
0 50 100 150 2000
1
2
3M
FIL
yso
trac
ker
Blu
e(a
.u.)
Lysotracker Blue Concenrations (uM)
DMSO
Ch 50uM
UT
UTCh 50uM
0.0
0.5
1.0
1.5
Ly
so
tra
ck
er
Blu
eM
FI(a
.u.)
****
0 50 100 150 2000.0
0.5
1.0
1.5
2.0
2.5
MF
IMit
otr
ac
ke
rF
arR
ed(a
.u.)
Mitotracker FarRed Concentrations (uM)
CCCP 20uM
UT
DMSO
WEE1
UBC
ZCCHC11
SMC5
NXF1
TSPEAR
TUSC2
C11O
RF63
ADAMTS19
RUVBL1
SLC6A12SNN
SMS
MYOC1C
C17O
RF75
TAX1BP1 -
NOC3L
GTPBP6
SMCHD1
RRM2
PSMC6
TADA3
HERC2
SNCA
SCN5A
CITED1
ARL6IP4
COMM
D10
POLR2B
SLC7A1
MYL9
BCLAF1NAIP
MAN2B
1
LRP12
CLUH
AGPAT2
RAD52
RRM1
TUFM
PLEKHA5
CCDC69
QPRT
SLC30A3
AHRR
HYDIN
GNM
T
ARAF
ITGA8
FBRS
AQP1
REL
POLEB9D
1
DIDO1
POLR2A
FBXO5
0
5
10
15
20
No
rma
lized
Ly
so
tra
ck
er
MF
I *
HitsRandom Genes
Lysotracker blueconcentration gradient
Lysotracker blue -choroquine
SCR SNCA 0
1000
2000
3000
4000
5000
No
rma
lize
dR
FP
MF
I
siRNAs
80
85
90
95
100
105
%C
y5+
cells
Mitotracker FarRed concentrationgradient
NOC3L
WEE1
RRM2
FBXO5
RRM1
AQP1
B9D1
POLR2A
POLE
AHRRREL
TUFMUBC
DIDO1
FBRS
GNM
T
CCDC69
TADA3
ARAF
PSMC6
BCLAF1
POLR2B
C17O
RF75
SLC30A3
ARL6IP4SNN
SLC7A1
AGPAT2
TAX1BP1
SLC6A12
SNCA
CLUH
TSPEARSM
S
CITED1
RAD52
C11O
RF63
COMM
D10
QPRT
HYDIN
MAN2B
1
TUSC2
ITGA8 -
PLEKHA5
MYL9
SMCHD1
NAIP
GTPBP6
HERC2
SCN5A
ZCCHC11
ADAMTS19
MYOC1C
LRP12
SMC5
RUVBL1
NXF1
0
20
40
60
80
100
No
rma
lized
Ly
so
tra
ck
er
MF
I
HitsRandom Genes
NXF1
NOC3L
RUVBL1
LRP12
HYDIN
SCN5A
HERC2
MYOC1C
ITGA8
SMCHD1
ADAMTS19
PLEKHA5NAIP
TUSC2
MYL9
CITED1
GTPBP6
QPRT
PSMC6
SMC5 -
ZCCHC11
MAN2B
1UBC
BCLAF1
CLUH
POLR2B
DIDO1
RAD52
COMM
D10
AGPAT2
SLC7A1
CCDC69
ARL6IP4
ARAF
SNCA
TAX1BP1
SLC30A3SM
S
C11O
RF63
GNM
T
FBRS
SLC6A12
FBXO5
C17O
RF75
TSPEAR
TADA3SNN
REL
AHRR
POLE
POLR2A
TUFMB9D
1
AQP1
RRM1
RRM2
WEE1
0
10
20
30
40
50
No
rma
lized
Ly
so
tra
ck
er
MF
I *
HitsRandom Genes
%G0G1 %S
%G2MCy5 siRNA
transfection efficiency
A B C
D E
E F GControl siRNAs
Figure S5
.CC-BY-NC-ND 4.0 International license(which was not certified by peer review) is the author/funder. It is made available under aThe copyright holder for this preprintthis version posted December 23, 2019. . https://doi.org/10.1101/2019.12.23.886838doi: bioRxiv preprint
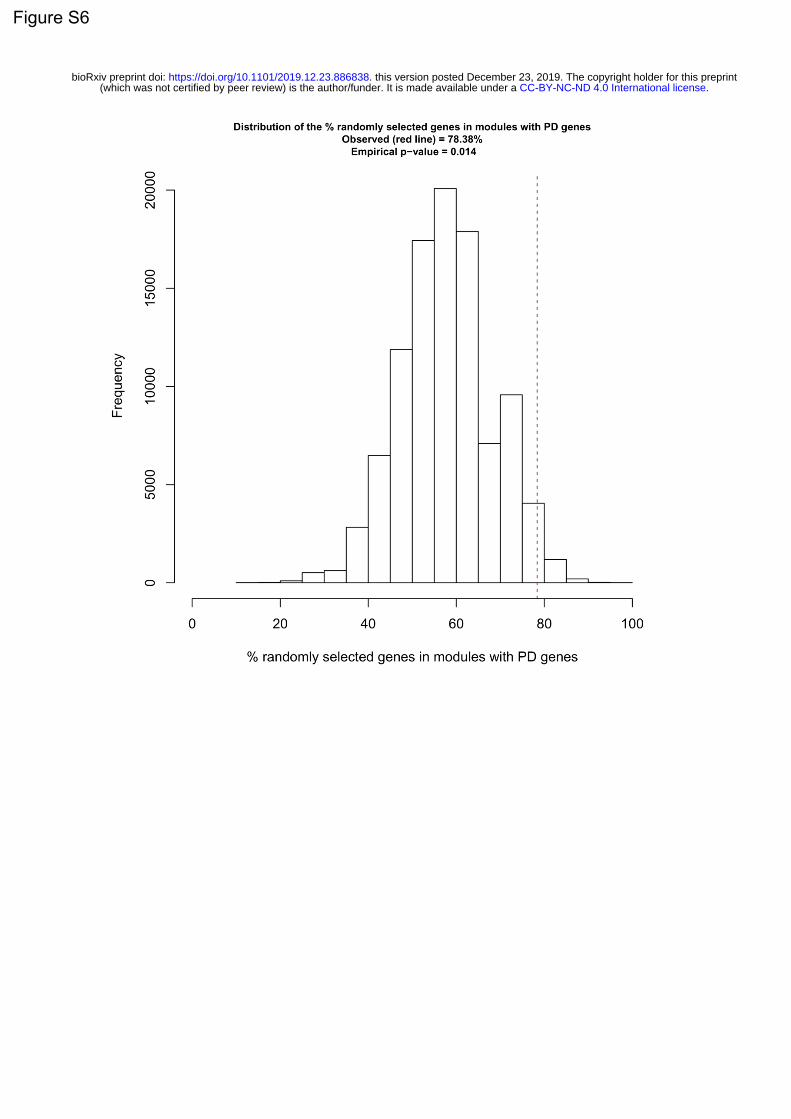
Figure S6
.CC-BY-NC-ND 4.0 International license(which was not certified by peer review) is the author/funder. It is made available under aThe copyright holder for this preprintthis version posted December 23, 2019. . https://doi.org/10.1101/2019.12.23.886838doi: bioRxiv preprint
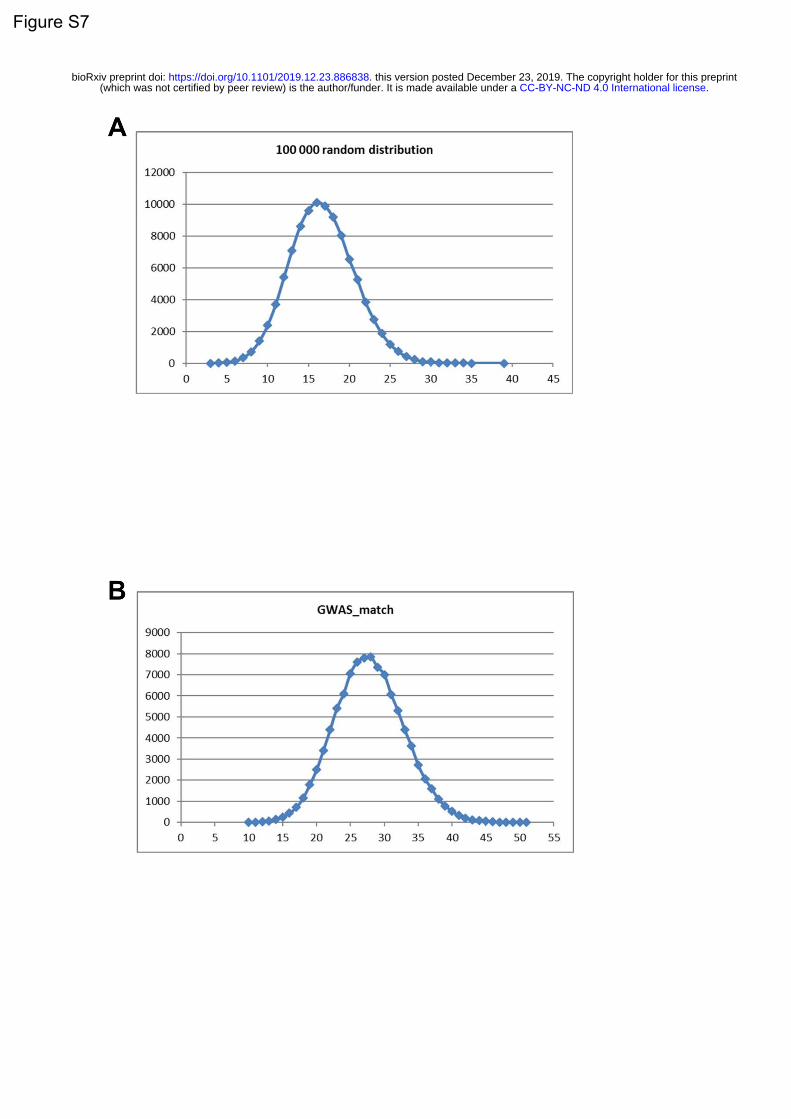
Figure S7
.CC-BY-NC-ND 4.0 International license(which was not certified by peer review) is the author/funder. It is made available under aThe copyright holder for this preprintthis version posted December 23, 2019. . https://doi.org/10.1101/2019.12.23.886838doi: bioRxiv preprint