an integrated framework for applying lean manufacturing and other strategies in mass
128
University of Kentucky UKnowledge University of Kentucky Master's eses Graduate School 2008 AN INTEGTED FMEWORK FOR APPLYING LEAN MANUFACTURING AND OTHER STTEGIES IN MASS CUSTOMIZATION ENVIRONMENTS Gregory Brandon Stump University of Kentucky, [email protected] Click here to let us know how access to this document benefits you. is esis is brought to you for free and open access by the Graduate School at UKnowledge. It has been accepted for inclusion in University of Kentucky Master's eses by an authorized administrator of UKnowledge. For more information, please contact [email protected]. Recommended Citation Stump, Gregory Brandon, "AN INTEGTED FMEWORK FOR APPLYING LEAN MANUFACTURING AND OTHER STTEGIES IN MASS CUSTOMIZATION ENVIRONMENTS" (2008). University of Kentucky Master's eses. 563. hps://uknowledge.uky.edu/gradschool_theses/563
Transcript of an integrated framework for applying lean manufacturing and other strategies in mass

University of KentuckyUKnowledge
University of Kentucky Master's Theses Graduate School
2008
AN INTEGRATED FRAMEWORK FORAPPLYING LEAN MANUFACTURING ANDOTHER STRATEGIES IN MASSCUSTOMIZATION ENVIRONMENTSGregory Brandon StumpUniversity of Kentucky, [email protected]
Click here to let us know how access to this document benefits you.
This Thesis is brought to you for free and open access by the Graduate School at UKnowledge. It has been accepted for inclusion in University ofKentucky Master's Theses by an authorized administrator of UKnowledge. For more information, please contact [email protected].
Recommended CitationStump, Gregory Brandon, "AN INTEGRATED FRAMEWORK FOR APPLYING LEAN MANUFACTURING AND OTHERSTRATEGIES IN MASS CUSTOMIZATION ENVIRONMENTS" (2008). University of Kentucky Master's Theses. 563.https://uknowledge.uky.edu/gradschool_theses/563

ABSTRACT OF THESIS
AN INTEGRATED FRAMEWORK FOR APPLYING LEAN MANUFACTURING AND OTHER STRATEGIES IN MASS CUSTOMIZATION ENVIRONMENTS
Manufacturing organizations are facing fragmented markets and increased demand of variety from consumers. As a result, many of these firms have adopted mass customization manufacturing strategies in an effort to offer their customers the freedom of choice while maintaining operational efficiency. Lean manufacturing strategies have also seen heavy use in manufacturing environments. This study investigates the possibilities of integrating lean manufacturing principles and practices into mass customization environments in order to improve system performance. The feasibility of other manufacturing strategies such as agility, Quick Response Manufacturing and the Theory of Constraints assisting in the application of lean manufacturing for mass customization is also explored with the goal of developing a theoretical framework for the application of these manufacturing systems in different types of mass customization environments. The result of these investigations is tested and verified using a real world case study.
KEYWORDS: Mass Customization, Lean Manufacturing, Quick Response Manufacturing, Theory of Constraints, Agile
________Gregory B. Stump________
________4 December, 2008________

AN INTEGRATED FRAMEWORK FOR APPLYING LEAN MANUFACTURING AND OTHER STRATEGIES IN MASS CUSTOMIZATION ENVIRONMENTS
By
Gregory Brandon Stump
_____Dr. Fazleena Badurdeen_____ Director of Thesis
______Dr. L. Scott Stephens______
Director of Graduate Studies
_______
4 December, 2008_______ Date

RULES FOR THE USE OF THESES
Unpublished theses submitted for the Master’s degree and deposited in the University of
Kentucky are as a rule open for inspection, but are to be used only with due regard to the
rights of the authors. Bibliographical references may be noted, but quotations or
summaries of parts may be published only with the permission of the author, and with the
usually scholarly acknowledgements.
Extensive copying or publication of the thesis in whole or in part also requires the
consent of the Dean of the Graduate School of the University of Kentucky.
A library that borrows this thesis for use by its patrons is expected to secure the signature
of each user.
Name
Date

THESIS
Gregory Brandon Stump
The Graduate School
University of Kentucky
2008

AN INTEGRATED FRAMEWORK FOR APPLYING LEAN MANUFACTURING
AND OTHER STRATEGIES IN MASS CUSTOMIZATION ENVIRONMENTS
_____________________________________________
THESIS
________________________________
A thesis submitted in partial fulfillment of the
requirements for the degree of Master of Science in
Mechanical Engineering in the
College of Engineering at the
University of Kentucky
By
Gregory Brandon Stump
Lexington, Kentucky
Director: Dr. Fazleena Badurdeen, Professor of Manufacturing
Lexington, Kentucky
2008
Copyright © Gregory Brandon Stump 2008

This document is hereby dedicated to my family, who were a constant source of
encouragement throughout my education, my teachers Dr. John Yingling, Dr. David
Veech, and Parthi Damodaraswamy, who tirelessly sought to teach me the intricacies of
manufacturing environments, and my advisor Dr. Fazleena Badurdeen, who provided
invaluable counsel throughout the creation of this document.

iii
Acknowledgements
The following thesis, while an individual work, benefited from the insights and
direction of several people. First, my Thesis Chair, Dr. Fazleena Badurdeen, exemplifies
the high quality scholarship to which I aspire. Next, I wish to thank the complete Thesis
Committee: Dr. Arlie Hall, Dr. Larry Holloway, Dr. Kozo Saito, and Dr. Fazleena
Badurdeen. Each individual provided insights that guided and challenged my thinking,
substantially improving the finished product.
In addition to the technical and instrumental assistance above, I received equally
important assistance from the engineering and management staff at the case study
company, Skier’s Choice, Inc. Lee Wadsworth, an engineer at said company, proved a
valuable liaison between Skier’s Choice and myself, aiding in obtaining information
pertinent to the research contained in this document.

iv
Table of Contents
Acknowledgements ............................................................................................................ iii Table of Contents ....................................................................................................... iv
List of Tables .......................................................................................................................v List of Figures .................................................................................................................... vi 1. Introduction ..................................................................................................................1 2. Background ..................................................................................................................5
2.1. Lean Manufacturing Overview .............................................................................5 2.2. Mass Customization Overview and Classification Systems ...............................12
2.2.1. Single Dimensional Classification Schemes ................................................13 2.2.2. Two Dimensional Classification Schemes...................................................16 2.2.3. Comparison and Selection ...........................................................................18
2.3. Low Level and High Level Customization .........................................................20 3. Literature Review.......................................................................................................23
3.1. Competency Models ............................................................................................23 3.2. Production Competencies ....................................................................................25 3.3. Other Competencies ............................................................................................30 3.4. Potential for Applying Lean Manufacturing For Mass Customization ...........32 3.5. Potential for Integrating Other Strategies............................................................36 3.6. Discussion ...........................................................................................................42
4. Methodology ..............................................................................................................43 4.1. Critical Review ....................................................................................................43 4.2. Framework ..........................................................................................................47 4.3. Objective .............................................................................................................53
5. Case Study – Skier’s Choice ......................................................................................55 5.1. Brief Company Description ................................................................................55 5.2. Mass Customization Product ...............................................................................56 5.3. Mass Customization Operations..........................................................................59
5.3.1. Manufacturing Operations ...........................................................................63 5.3.2. SWOT Analysis ...........................................................................................66
6. Experimental Model Development ............................................................................67 6.1. The Current State ................................................................................................67 6.2. Discussion of Applicable Approaches ................................................................68 6.3. Restructuring the Operations ...............................................................................72
6.3.1. Lamination Shop ..........................................................................................72 6.3.2. Small Parts Department ...............................................................................75 6.3.3. Upholstery Department ................................................................................76 6.3.4. Rigging and Assembly Line.........................................................................79 6.3.5. Inspection Line.............................................................................................81
6.4. Simulation Model Design....................................................................................83 6.5. Experimental Design ...........................................................................................93 6.6. Testing and Results .............................................................................................96
7. Discussion and Conclusions ....................................................................................106 List of References ............................................................................................................112 VITA ................................................................................................................................117

v
List of Tables Table 1. Manufacturing System Comparison (Koren et. al., 1999) ............................ 27Table 2. Company Data .............................................................................................. 56Table 3. Skier's Choice Model Offerings .................................................................... 57Table 4. Example Cycle Time Data ............................................................................ 84Table 5. Variables and Levels of Experiment ............................................................. 95Table 6. Experimental Results .................................................................................... 97Table 7. Average Lead Time Comparison ................................................................ 100Table 8. Average WIP Comparison .......................................................................... 101Table 9. Effect of Lamination/Assembly Buffer Size .............................................. 102Table 10. Effect of Random Number Variation ........................................................ 103Table 11. Summary of Case Selections .................................................................... 104

vi
List of Figures
Figure 2.1 The Toyota House (Liker, 2003) ................................................................. 6Figure 2.2 Lean Standardization ................................................................................... 7Figure 2.3 Lean Pull ...................................................................................................... 8Figure 2.4 Different Types of Waste .......................................................................... 11Figure 2.5 Duray et. al. (2000) Model for Mass Customization Classification .......... 18Figure 2.6 Classification Model Decision Matrix ....................................................... 19Figure 2.7 High Level Customization vs. Low Level Customization ........................ 21Figure 2.8 Low Level Customization ......................................................................... 22Figure 2.9 High Level Customization ......................................................................... 22Figure 3.1 Mass Customization Competencies (Moser, 2007) ................................... 24Figure 3.2 Mass Customization Value Chain based on (Moser, 2007) ...................... 25Figure 3.3 Mass Customization with Lean Principles and Practices .......................... 33Figure 3.4 DBR Mechanism ....................................................................................... 39Figure 3.5 POLCA Control (Suri, 1998) .................................................................... 41Figure 4.1 Mass Customization Competencies by Strategy ....................................... 47Figure 4.2 Importance of MC Capabilities and Ease of Lean Implementation .......... 49Figure 4.3 Theoretical Framework ............................................................................. 51Figure 5.1 Supra Gravity 24SSV ................................................................................ 58Figure 5.2 Mobius XLV .............................................................................................. 58Figure 5.3 Basic Process Map ..................................................................................... 63Figure 5.4 SWOT Analysis ......................................................................................... 66Figure 6.1 Skier's Choice Current State VSM ............................................................ 69Figure 6.2 Lamination Shop ....................................................................................... 73Figure 6.3 Lamination Shop CONWIP Cards ............................................................ 75Figure 6.4 Small Parts Shop ........................................................................................ 77Figure 6.5 Upholstery Shop ........................................................................................ 80Figure 6.6 Rigging and Assembly Line ...................................................................... 82Figure 6.7 Inspection Line .......................................................................................... 83Figure 6.8 Skier's Choice Simulation Model .............................................................. 85Figure 6.9 Lamination Line Simulation Model .......................................................... 87Figure 6.10 Small Parts Line Simulation Model ........................................................ 89Figure 6.11 Upholstery Shop Simulation Model ........................................................ 90Figure 6.12 Assembly/Rigging Line Simulation Model ............................................. 92Figure 6.13 Inspection Line Simulation Model .......................................................... 93Figure 6.14 Low Demand ANOVA ............................................................................ 98Figure 6.15 High Demand ANOVA ........................................................................... 99Figure 7.1 Revised Theoretical Framework .............................................................. 106

1
1. Introduction
The processes of providing goods and services to meet customer need, and the
strategies contained therein have been constantly changing and evolving over the past
century, making great strides in efficiency, but more importantly increasing in
complexity. This evolution of manufacturing paradigms can be easily modeled by the
automobile industry.
In its infancy, the process of automobile manufacture was highly complex, expensive,
and specialized, and was built to cater to the upper class citizen with excess money to
spend. Automobile manufacture began using the craft model of production. Highly
skilled craftsmen would design, fabricate, and build the vehicle from the ground up,
which involved a great deal of individualization for the customer. Buyers were able to
specify features such as size, color, engine power, upholstery, and much more (Ford,
1988).
While craft manufacturing provides a great deal of individualization for the customer
and ownership for the craftsman, its downfall lies in its inefficiency and long lead times.
Henry Ford changed all this with the implementation of standardization, the moving
assembly line, and the atomization of work. This mass manufacturing strategy was
highly effective and made Ford the premier auto manufacturer in the United States for
many years (Womack et al., 1991; Ford, 1988).
While mass manufacturing can be a very efficient means of production, it is also well
known for its drawbacks, including excessive inventory and waste. One of the most
important shortcomings of mass manufacturing is the inability to produce a high variety
of products on its production lines. The invention of lean manufacturing, or the
continuous improvement strategy, by Toyota in post World War II Japan seeks to
overcome mass production issues (Womack et al., 1991). Lean manufacturing makes use
of the pull system, linking the shop floor to the customer, thereby greatly reducing
inventory, throughput times, lead times, etc. Waste is also sought out and eliminated and
employees given a great deal of ownership through a team structure. These
improvements made it possible for the producer to add more variety to their products, but
the strategy was still largely dependent on standardization (Womack et al., 1991).

2
Problem Background
The once stable and homogeneous markets have recently begun to fragment among
different customer bases, each demanding their own customized goods and/or services
(Pine, 1993). This has led to the emergence of mass customization, which can be defined
in different ways. Broadly defined it is the ability to provide high variety and
customization at the individual customer level through the use of flexible and highly
responsive manufacturing systems (Pine, 1993). The “narrower” definition of mass
customization is a “…system that uses information technology, flexible processes, and
organization structures to deliver a wide range of products and services that meet specific
needs of individual customers at a cost near that of mass produced items” (Da Silveira,
2001).
Also important to understanding the concept of mass customization is to recognize
that there are different degrees of mass customization that are possible. There are several
examples of literature that have developed classification schemes for mass customizers
and each of these have their own strengths and weaknesses. However, most of them rely
on the point of customer involvement in the value chain as a key classification criterion.
The understanding of how the point of customer involvement affects the operation of the
manufacturing system as a whole is tantamount to this research as it will directly affect
the degree to which lean manufacturing and other strategies can be applied for mass
customization.
This combination of mass production and customization may seem contradictory and
unrealistic, but firms such as Dell, Motorola, Paris Miki, Bally Engineered Structures,
and many others are pursuing the strategy successfully (Selladurai, 2004; Gilmore and
Pine, 1997). Increased manufacturing capability due to flexible manufacturing and
information system technologies, increased customization demand, and shorter product
life cycles has steered the efforts of implementing mass customization (Da Silveira,
2001). Mass customization deals with niche markets (Berman, 2002), thus making it
difficult to predict customer demand because the product is customizable. It requires the
ability to dynamically adapt at all stages of the value chain to meet demand.
The need for efficient and flexible manufacturing systems to deliver mass customized
products has been briefly discussed in the literature (Pine, 1993; Da Silveira, 2001). The

3
potential of lean manufacturing to meet these requirements has also been raised. While
lean manufacturing has many capabilities that are essential for mass customization, the
strategy can fail with higher degrees of customization. Therefore, it is important to
conduct a critical investigation of how and what aspects of lean manufacturing are
applicable for successful mass customization. This research is an attempt to critically
review the use of lean manufacturing in the context of its application to mass
customization manufacturing.
Many lean manufacturing principles, such as continuous improvement and waste
reduction, have the potential to be readily applied in any mass customization
environment. Other principles, however, are likely to fail in situations where the
customer becomes involved very early in the value chain because of their reliance on
stability and standardization as is the case with just-in-time and heijunka (load leveling).
The high variability present in mass customization undoubtedly poses many challenges
for lean manufacturing.
It is important to understand in which situations these various lean principles will fail,
and what strategies can be used to fill in the gaps between lean and mass customization.
For this reason, other common manufacturing system structures such as Quick Response
Manufacturing, the Theory of Constraints, Agile, Leagile, and Job Shop Lean must be
brought into the discussion as a possible means of supplementing and strengthening lean
manufacturing in situations where its principles may fall short.
Research Objective
To date, there has been little research completed on lean manufacturing integration
for mass customization, and there is a need for further investigations into the topic.
Further, due to the varying degrees in which mass customization can take place, it is
necessary to understand how the variance in the type of mass customization affects the
ability of lean manufacturing and other strategies to improve the performance of the
system. This research attempts to provide insight into the issue by qualitatively
examining different manufacturing strategies to determine their strengths and weaknesses
for application in mass customization environments, with the objective of developing a
theoretical framework for the application of lean manufacturing and other strategies for

4
the different categories of mass customizers. A mass customizing manufacturer is
employed as a case study to apply this framework and demonstrate the proper selection of
manufacturing strategies for the restructuring of the operations.
The thesis document is organized as follows. In Chapter 2, an overview of the core
principles of lean manufacturing is given along with a discussion and evaluation of
different mass customization classification schemes that have been developed. Chapter 3
presents discussions on mass customization competencies, the application of lean
manufacturing for mass customization, and the characteristics of other prominent
manufacturing strategies based on the literature reviewed. In Chapter 4 the strengths and
weaknesses of each of the aforementioned manufacturing strategies is critically reviewed
and the theoretical framework is developed, while the characteristics of the case study
company are given in Chapter 5. Finally, the restructuring procedure for the
manufacturing operations of the case study company is detailed in Chapter 6 along with a
simulation to validate the improvements made, while Chapter 7 concludes the work with
a discussion of the findings.

5
2. Background
This chapter provides an overview of the mass customization and lean manufacturing
strategies in order to investigate the opportunities for applying lean manufacturing
concepts for mass customization. A brief discussion of lean manufacturing principles
and practices that create this cohesive system is given, along with a discussion of mass
customization and the classification strategies that have evolved over time to classify
mass customizers. Lastly, these classification systems are critically reviewed, and one
chosen for use throughout the research.
2.1. Lean Manufacturing Overview
Lean manufacturing is based on the Toyota Production System developed by Toyota
after World War II by modifying Ford’s mass production system to meet the specific
needs of the Japanese market at that time. Toyota sought to reduce the inefficiencies of
mass manufacturing by eliminating waste, reducing inventory, improving throughput, and
encouraging employees to bring attention to problems and suggest improvements to fix
them (Womack et al. 1991). Figure 2.1 illustrates “The Toyota House,” a diagram
showing the basic building blocks of lean systems operations (Liker, 2003). The
following sections will briefly discuss each of these key areas and their place in a
successful lean manufacturing system.
• Leveled Production (heijunka)
One of the key principles of lean manufacturing is leveled production, or heijunka.
Womack and Jones (1996) claim heijunka is a means “…to smooth out the perturbations
in day-to-day order flow…” It refers to the method of mixed model assembly, in which
products of different varieties are produced in a sequence, rather than in batches as with
traditional manufacturing.
Also important for leveling is to produce only what is needed through accurate
demand forecasting (Shingo, 1988). If a firm can understand the demand and sequence to
meet the requirements, heijunka eliminates variability of throughput and lead time that
batched production brings.

6
Best Quality – Lowest Cost – Shortest Lead Time – Best Safety – High Morale
Just-in-Time
1. Takt Time
2. Continuous Flow
3. Pull Systems
4. SMED
Jidoka (in station
quality)
1. Separate man from machine
2. Andon
3. Problem Solving
People & Teamwork
Waste Reduction
Leveled Production (heijunka)
Visual Management
Stable and Standardized Processes
Toyota Way Philosophy
Continuous Improvement
Figure 2.1 The Toyota House (Liker, 2003)
• Stable and Standardized Processes
Lean manufacturing, while more capable of handling variety in production than mass
manufacturing, is still built upon a platform of standardization, and thus constrained by it.
Process standardization is achieved through the use of standardized work sheets, which
outline the steps and the sequence in which those steps should be completed in order to
fully process a component/product (Monden, 1998). Thus, lean manufacturing requires
standardization and stability in the processes used to create a product rather than the
product itself. In this sense the term standardization by no means implies a totally rigid
and unvarying system, but rather is a means to aid continuous improvement (Bicheno,
2000) and refers to “the best way” at a given time, which can change as improvements
are developed. Standardized work allows the comparison of results of suggested
improvements to determine if the change was truly an advancement. See Figure 2.2 for
an illustration of lean standardization.

7
Lean SystemsStandard
Work
Continuous Improvement
Figure 2.2 Lean Standardization
• Visual Management
Management through the use of visuals to maintain the standard conditions of the
workplace is paramount to success with lean manufacturing. Adding visibility to the
production floor makes apparent the status of all operations allowing for efficient
communication. The principles of visual management can be broken down into two basic
categories: 5s and Visual Controls.
5s principles for workplace organization, the “S’s” of which refer to five Japanese
words later adapted by Shingo to stand for sort, straighten, shine, systematize, and
sustain (Bicheno, 2000), offer shortened changeovers, reduced defects, lowered costs
due to waste reduction, fewer delays, increased safety, fewer breakdowns, etc. (Hirano,
1995).
Visual control refers to activities such as labeling, color coding, and visual
information systems. Examples of these include maintaining WIP through first-in-first-
out (FIFO) methods, control limit markings on machine gauges (Monden, 1998), or an
information marquis displaying current plant conditions to employees, etc.
• Just-in-Time
Just-in-Time (JIT) refers to the set of principles governing the flow of product
through the manufacturing system. JIT manufacturing that operates through a pull
system to maintain continuous flow of products/components at the rate required by
customers constitutes one of the main pillars of lean manufacturing (see Figure 2.1).

8
• Takt time refers to the “pacing” of the production line, or the time allowable to
produce each product in order to meet demand. Producing to a takt pace allows
team members to be aware of their current status, enabling them to act
accordingly (i.e. call for team leader aid if they are behind).
• Continuous flow of a steady stream of product at a takt pace through the
production system helps maintain little WIP (ideally single-piece flow) with FIFO
at all stages. This enables reducing lead time and increasing throughput, as
products will not wait in large lines of WIP, but move quickly and directly to the
next process in the order of arrival.
• The Pull system is at the heart of lean manufacturing philosophy. According to
Wantuck (1989), the pull system serves as a linkage mechanism for the entire
production enterprise, linking both internal and external elements. The pull
system relies on the downstream customer to signal that production should
commence, whether they be the end customer or the next process operator in line
(Bicheno, 2000; Wantuck, 1989; Shingo, 1988). The traditional model of lean
manufacturing is one that involves a single pull signal from the customer to the
producer, the customer being the downstream process. Regardless of the
resolution of the examination, with lean manufacturing, the system operates with
a single (or a few) pull signal(s) as shown in Figure 2.3 (Liker, 2003. Ohno,
1988). A monument type process within a plant may feed multiple production
lines, but conceptually the amount of signals it must fulfill is still finite and
relatively small.
Figure 2.3 Lean Pull

9
Kanban and CONWIP
Kanban and CONWIP are the two prominent control methods within lean
manufacturing that enable the pull system to work. These systems seek to cap
inventory and increase the ability for a set of manufacturing processes to flow
(Co and Jacobson, 1994; Takahashi, et. al., 2005). Kanban pull systems
operate by utilizing a kanban card or kanban square as a means of indicating a
need to produce. For example, if a kanban card was attached to a bin of
supplier parts, once that bin had been used the kanban card would be released
indicating a new bin of parts would need to be ordered. The same can be said
for a kanban placed between two processes, in which an empty kanban would
indicate a need for the upstream process to produce (Kumar et. al., 2007).
While kanban operates completely on a pull system, CONWIP (constant
work in process) seeks to combine elements of push and pull. This system
works by employing a card system to cap the total inventory in a given set of
processes. However while overall inventory is controlled via the total number
of cards available, inventory between processes within the system are not and
all product is pushed. Thus, for a product to enter the CONWIP loop a card
must be available for it to be attached to, and the cards is not made available
again until the product exits the CONWIP loop (Huang et. al., 2007; Framinan
et. al., 2006). The combination of push and pull in a CONWIP system allows
it to buffer work content variation between products and processes and better
handle the issue of shifting bottlenecks due to variety (Takahashi, et. al.,
2005).
• SMED (single minute exchange of dies) refers to the rapid changeover
principle of lean manufacturing. If a firm is to have leveled, mixed model
production, then lengthy changeovers must be eliminated. Wantuck, (1989),
uses an example of Toyota changing over the die in an 800 ton press in less
than ten minutes, a process that took one to two shifts at his own facility.
Wantuck also claims that this was accomplished not with costly automation,
but with rigidly applied systematic processes and some clever engineering.

10
Rapid changeovers are an enabler for continuous flowing, mixed model
production with a pull system.
• Jidoka
The Japanese term jidoka refers to in process quality, or quality at the source. One
key area of source quality is poke yoke, or error proofing using simple mechanized error
proofing devices. Conversely, many quality check elements can only be performed
through sensory perception, which is the role of the man, not the machine.
Andon is a highly visual and audible notification method in the form of a lighted,
multi-colored board hung in a factory (Monden, 1998). Toyota, for example, places a
cord and a light at each workstation. Team members can pull the cord to announce a
problem, and stop the line if need be (Bicheno, 2000; Shingo, 1986).
Problem solving is another important aspect to source quality. When a defect is
created, multi-function work teams often work together to solve the problem and
eliminate the threat of reoccurrence in the future. One example of such a team, given
by Tsutsui (1998) is Toyota’s quality circle, a cross disciplinary work team dedicated
to solving problems that arise on the production floor.
• Waste Reduction
Waste reduction is an important structural component of the Toyota house. The very
term “lean” implies that wasteful excesses across the plant are sought out and eliminated.
There are three types of waste, with the Japanese terms muda, mura, and muri.
Muda refers to various wastes dealing with production and quality that occur on
the shop floor. There are seven types (see Figure 2.4) (Womack, 1996; Bicheno,
2000; Ohno, 1988).
Mura refers to the waste of overburden on workers. An employee whose work is
too burdensome is more prone to defects and less empowered to aid in
improvement (Ohno, 1988).
Muri refers to the waste of unevenness. This relates to the benefits of heijunka as
opposed to batch production as discussed earlier (Ohno, 1988).

11
Waste
Muri(Unevenness)
Mura(Overburden)Muda
Overproduction
Waiting
Transport
Overprocessing
Inventory
Motion
Defects
Figure 2.4 Different Types of Waste
• Continuous Improvement
Lean systems are dynamic and change through continuous improvement, or kaizen.
Improvements can be achieved through two types of kaizen; flow kaizen and process
kaizen (Bicheno, 2000). Flow kaizen refers to improvement made throughout the value
chain, while process kaizen refers to improvements that are isolated to specific processes.
Everyone in a lean organization is responsible for improvements, from the team members
to the plant manager. A lean organization understands that continuous improvement is
the only way to improve upon the standard and stay competitive.
• People and Teamwork
The people of a lean organization are what truly makes it work, and thus are
supported by the components discussed above. While mass production sought to atomize
work and eliminate employee thinking, lean manufacturing seeks to empower the worker,
standardize the process, and encourage team members to improve their process. Lean
manufacturing makes use of work teams, consisting of a small number of team members
(5-10) who work under a team leader. Those team leaders are assigned a group leader,
who may report to an assistant manager (Ohno, 1988). This system enables close
relationships among employees, creating an environment conducive to safety and

12
improvement. Lean leaders also follow a model of servant leadership, meaning that the
leaders function is to support and serve their team members.
Summary
The building blocks that make up a lean manufacturing system have been discussed
briefly, and it becomes obvious that while many limit lean to simply a JIT or TQM
practice, it in fact involves much more than that. Lean manufacturing implies a shift in
the very culture of an organization; it is a philosophy or way of doing business that
includes production methods, planning, and the way it treats people. Lean manufacturing
is an all encompassing method for operating a manufacturing firm in an effective manner.
2.2. Mass Customization Overview and Classification Systems
Mass customization began to emerge as a viable manufacturing strategy in the early
1990’s and has since grown in popularity. Many businesses began to find that their
markets were becoming more fragmented and customers were demanding more
individualization, and sales were being lost to competitors able to deliver custom goods
in a timely manner (Pine 1993). The main characteristic of mass customization is that
absolutely no work is done in the manufacture of a product until the customer order is
received. This differs from the pull system and “make-to-order” operations in that there
is no forecasting and each order is unique. Essentially, a particular order does not exist in
the system until the end customer submits it (Lampel and Mintzberg, 1996). Mass
customizers often make use of some sort of product configuration tool such as a
salesperson or software to assist the customer in choosing their options (Boynton et. al.,
1995).
Systems operation for mass customization manufacturing can be very different from
the single pull scenario of lean manufacturing as the manufacturer could potentially
receive many signals from individual consumers rather than distributors or retailers. The
effects of these multiple signals on operations depend upon the extent of mass
customization; some strategies may have little or no impact, while others may alter it
completely.
Prior to an in depth evaluation of the applicability of lean principles for mass
customization, a system for the classification of different mass customizers is necessary.

13
This will allow firms to be classified based on business strategy, and identify capabilities
needed for the particular type of mass customization. The following sections provide an
overview of four well known mass customization classification systems, with an analysis
to assess their suitability to serve as a framework to investigate the potential of using lean
manufacturing principles and practices for mass customization.
2.2.1. Single Dimensional Classification Schemes
Pine (1993) Model
Pine (1993) divided mass customizers into five different groups based on where
customization takes place in the value chain: Development, production, marketing, or
delivery. The first group is the customizing of services around standardized products
and services. This is based on the ability of marketing and distribution to customize
products by offering different services to customers, adding features to the product,
packaging, etc.
For the second group, create customizable products and service, customization takes
place in either the development or marketing stage of the value chain, while not affecting
the production and delivery stages. With this system, a product is still mass produced,
but because of the way it is designed, it will customize itself to the user.
Provide point-of-delivery customization involves catering to the customer’s needs at
the point of sale. Pine (1993) uses the age old practice of tailoring as an example. A
customer chooses a standardized style of suit, after which the tailor measures and fits the
suit to the customer’s specific body dimensions, thus providing on the spot
customization.
With provide quick response throughout the value chain customization begins at the
delivery stage, and then filters back through the value chain all the way to development,
causing the entire value chain to have to adapt rapidly to customer needs. The Hertz’s #1
Club Gold is an example of this strategy, where the tasks of transporting customers,
preparing vehicles, service contracts, etc. cannot be accomplished without a highly
adaptive value chain (Pine, 1993).
The final mass customization strategy in Pine’s (1993) classification is to modularize
components to customize end products and services. Pine claims that this method of

14
using standard modular components as a basis for mass customized products is the most
effective strategy.
In summary, this early classification model sought to break down the different
mass customization strategies using point of customer involvement in the value chain.
Pine’s model displays a wide range of mass customization behaviors, however little
attention is paid to mass customization in the design and production stages. This initial
model is focused mainly on using as much standardization as possible while providing
customization in the marketing and delivery stages. The concept of modularity is
employed in one of the five strategies, but the concept’s true place in mass customization
practice seems to be underdeveloped.
Lampel and Mintzberg (1996) Model
Lampel and Mintzberg (1996) divide manufacturers into five different groups: Pure
Standardization, Segmented Standardization, Customized Standardization, Tailored
Customization, and Pure Customization.
Pure Standardization is “...based on a “dominant design” targeted to the broadest
possible group of buyers, produced on as large a scale as possible, and then distributed
commonly to all.” With this strategy, the product is completely standardized with no
distinctions made between customers, as with Henry Ford’s Model T (Lampel and
Mintzberg, 1996).
Segmented Standardization involves building to the needs of “clusters” of buyers,
with the product remaining standardized within those clusters. Here, customization is
decided upon and produced based on predictions of customer needs rather than individual
customer requests, as with designer lamps (where one can find huge variety without
individualization) (Lampel and Mintzberg, 1996).
Customized Standardization occurs when “…products are made to order from
standardized components.” Also known as assemble to order, this strategy simply allows
the customer to decide what mass produced features, are or are not, present in their
individual product. Allowing a customer to choose the options on their particular
automobile, or choosing what ingredients are present in their hamburger at a fast food
restaurant is an example (Lampel and Mintzberg, 1996).

15
Tailored Customization occurs when “The company presents a product prototype to a
potential buyer and then adapts or tailors it to the individual’s wishes or needs.” Here
customization filters back to the fabrication stage, but not to the design stage, as there is
still a standardized product prototype.
Pure Customization is the highest degree of mass customization attainable,
according to the Lampel and Mintzberg Model. Here, the customer’s needs are outlined
and catered to beginning early in the design process, greatly affecting all steps of the
value chain. Traditional artisans such as jewelers or residential architects, who design
and build the product to the customer’s specifications, fall into this category (Lampel and
Mintzberg, 1996).
This framework of classifying mass customizers is slightly more developed and a
more concrete classification model than that of Pine, (1993). However, the first two
classifications listed; pure standardization and segmented standardization, do not involve
mass customization strategies at all. Further, this model, too classified strategies only by
customer involvement in the value chain in the assembly, delivery, or design stage (for
customized standardization, tailored customization, and pure customization,
respectively).
Gilmore and Pine (1997) Model
Gilmore and Pine (1997), divided mass customizers into four groups: Collaborative,
Adaptive, Cosmetic, and Transparent customizers. This model is an improvement over
Pine’s previous model (1993) in that the criteria for each category have become more
clearly defined and the model has shifted to include more customization in the design and
fabrication stages.
Transparent Customizers customize products based on predictions and observations
of customer’s needs. In this case, customers do not know that the product has been
customized for them. On the other hand, Cosmetic Customizers customize their products
by making it appear different to different customers. Custom features can include
packaging, specific feature advertisement, and personalization such as engraving.

16
With Adaptive Customization manufacturers produce a standard product which will
then automatically adapt itself to a customer’s needs. Here the desire is for the product to
perform differently based on the specific need at a given time.
Collaborative Customizers work one on one with individual customers to understand
and cater to their specific needs. This strategy most embodies the idea of mass
customization as we usually think of it.
The Pine and Gilmore model is a much more generalized classification system
compared to the two previous models. Here, the idea of a transparent customizer, one
who customizes products without customer specifications, is a new and intriguing idea
not considered in the earlier taxonomies. The customer essentially is only involved in the
delivery stage, but their specific needs are taken into account from the design stage in that
the mass customizer determines the needs of the customer themselves. We also find once
again that three of the four strategies allow for customer involvement only in the
assembly and/or delivery stages, and modularity is again unaccounted for.
2.2.2. Two Dimensional Classification Schemes
The three classification schemes above include only point of customer involvement in
their classification criteria. However, modularity is also an important aspect of mass
customization.
When examining mass customization, one key concept that has played a large part in
its success to this point is modularity. Swaminathan claims that modularity can be
present in product, process, or both. A modular product can be manufactured by
combining standardized modules into variable configurations. A modular process occurs
when different products undergo the same set of processing steps (Swaminathan, 2001).
Pine claimed that for true mass customization to take place efficiently, modularity must
be used (Pine, 1993). Also, Duray states that modularity is a means to achieve some
degree of economies of scale, as well as to “…provide variety and speed…” (Duray,
2000). Modularity allows firms to create base components, a kind of common
denominator, among different product lines, thereby allowing for increased efficiencies
for an individually customized product.

17
Duray et. al. (2000) Model
The mass customization classification system developed by Duray et al. (2000) is one
of the more recent and most advanced because it classifies mass customizers on two
dimensions; point of customer involvement in the value chain, and type of modularity
used by the producer. They divide mass customizers into the following four groups:
Assemblers, Modularizers, Involvers, and Fabricators.
Assemblers involve the customer and use modularity in the assembly and delivery
stages, enabling the customer to select different combinations of standard features to be
interfaced with a base model of product.
Modularizers are characterized by involving the customer in the assembly and
delivery stages, but using modularity in the design and fabrication stages. The producer
uses standard modules to design and fabricate a base module, and specific customer
needs are incorporated in assembly and delivery.
Involvers involve the customer in the design and fabrication stages while using
modularity in the assembly and delivery stages. Customers are involved early in design,
but this design must be created from a selection of standardized modules, as no new
modules will be designed for them.
Fabricators involve the customer and make use of modularity during the design and
fabrication process. Customers create their custom design, but modularity can be used to
some degree to create similarities in components.
Major differences are present between the Duray et. al. model and others; this model
not only classifies mass customizers based on point of customer involvement, but also
use of modularity. Further, it is more detailed and able to identify mass customization in
the early stages of the value chain. These are the major strengths of this latest model over
the previous ones. Though modularity is mentioned in the Pine (1993) model, its usage
and importance to mass customization is developed in greater detail in the Duray et. al.
(2000) model. See Figure 2.5 below for a graphical representation of this model.

18
1Fabricators
4Assemblers
3Modularizers
2 Involvers
Type of Modularity
Point ofCustomer
Involvement
Design
Design
Fabrication
Fabrication
UseAssembly
Assembly
Use
Figure 2.5 Duray et. al. (2000) Model for Mass Customization Classification
2.2.3. Comparison and Selection
In investigating the potential of applying lean manufacturing principles and practices
for mass customization, a well defined taxonomy helps to classify, compare, and contrast
different mass customizers. The time based progression and evolution of mass
customization thinking is evident when examining the different models detailed above.
As each model is developed, one can see the divisions between groups of mass
customizers becoming clearer while the focus begins to shift towards customer
involvement in the early stages of the value chain. Finally, in the latest model outlined
here we have the aforementioned improvements becoming more developed, along with a
new focus on a key concept in mass customization; modularity.
In the following section, a basic decision matrix is used to compare and contrast the
strengths and weaknesses of each of the four models, the result of which will allow one
of them to be chosen for further use in this article. The models are evaluated based on
the following criteria as per the authors’ opinions and observations.

19
Customer Involvement: Ability to classify customizers based on customer
involvement in the key value chain areas of design, fabrication, assembly, and
delivery.
Modularity: Ability to classify customizers based on modularity usage in the key
value chain areas of design, fabrication, assembly, and delivery.
Early customer involvement (CI) Focus: Tendency for the model to focus on
customization early in the value chain.
Strength of Classification: Ability of the model to crisply define and classify a mass
customizer into one of its respective categories.
Each model is scored on a three point rating scale (corresponding to 0, 1, and 2
points) in order to identify their strengths and weaknesses. Figure 2.6 presents these
results.
As can be observed from Figure 2.6, it is evident that when considering the concepts
of customer involvement and modularity across the value chain spectrum, the Duray, et.
al. (2000) model provides the most complete mass customization classification system.
The model also provides detail on early customer involvement in the value chain, and
therefore is the most appropriate for use in the following sections.
Figure 2.6 Classification Model Decision Matrix

20
2.3. Low Level and High Level Customization
Having chosen the Duray (2000) model for further mass customizer analysis, it is
possible to create two more general categories based on the similarities between
involvers/fabricators and modularizers/assemblers and the impact to the manufacturing
operations. These categories will hereafter be referred to as high level customization and
low level customization, based on the point of customer involvement in the value chain.
A high level customizer is a company where customized goods are offered through
customer involvement at the fabrication stage or earlier. With low level customization,
individualization is achieved by assembling (and/or packing and distributing) pre-
fabricated, standard components in a custom manner.
A low level customizer will find it much easier to employ process modularity and will
be able to more efficiently plan production so that WIP is reduced and flow is
maximized. A high level customizer, on the other hand, will find the need for a highly
flexible manufacturing system configuration much greater than the former, and will also
be more reliant on organizational learning in order to improve. The two situations are
illustrated in Figure 2.7.
Low level customization includes the assembler and modularizer strategies from the
Duray model (Duray, 2000). In the case of assemblers, customized products are
produced through assemble-to-order customization with customer involvement and
modularity usage occurring at the assembly or delivery stage. Modularizers operate in a
similar fashion, but they differ from assemblers in that modularity is employed in the
design or fabrication stage (Duray, 2000). In either case, the design and fabrication
stages of the value chain remain unaffected by customer involvement, warranting the
combined discussion of these two strategies.
With these strategies, product modularity and postponement are used to reduce the
variability and facilitate mass customization efficiently. Lean manufacturing principles
and practices are very applicable in this context where standardized modules can be
produced to forecasted demand (in the design and fabrication stages) for assembling-to-
order as illustrated in Figure 2.8. As pull signals from consumers come in, those modules
are assembled to the required configurations. However, upstream processes will only
have a single pull signal from the upstream customer.

21
Design
Distribution
Assembly
Fabrication
HIGH LEVEL CUSTOMIZATION
Great need for highly flexible mfg. sys. Config.
Process modularity becomes more important..
Production planning more complex.
Increased reliance on teamwork and learning.
LOW LEVEL CUSTOMIZATION
Less need for flexible mfg. sys. Config.
Less need for process modularity.
Efficient production planning more viable.
Team work and continuous improvement important as in Lean.
Figure 2.7 High Level Customization vs. Low Level Customization
High level customization, which includes the involver and fabricator strategies
(according to the Duray model) involve the customer in either the design or fabrication
stages of the value chain, allowing the customer to take part in the design of their product
before its production has commenced. The difference between the two strategies lies in
the point where modularity is employed in the production system. Involvers make use of
modularity in the assembly/delivery stage, while fabricators employ modularity in the
design/fabrication stage. High level customization offers a high degree of customization
by integrating the customer early in the value chain.
These strategies have a great effect on production because manufacturing must wait
for the customer orders to begin fabrication, and then follow the customer’s
specifications in order to fabricate and assemble a customized product, with each
successive product being different from the last. Thus lean manufacturing is not so easily
adapted to high level mass customization, as it is essentially impossible to forecast

22
demand and plan for work content variability. See Figure 2.9 for a representation of the
value chain for a high level customizer. These mass customization classifications are
employed in the upcoming sections for discussions regarding integrating lean
manufacturing and other strategies with mass customization.
Figure 2.8 Low Level Customization
Figure 2.9 High Level Customization

23
3. Literature Review
In this chapter, an account of the literature found through the course of the research
for this document is given, beginning with an overview of the competencies required of
any organization that is to be successful in its quest to become a mass customizer. The
competencies discussed therein pertain to both the production area of a manufacturing
firm, as well as external areas such as logistics and information technology.
Next, an account of the available literature providing evidence of successful
incorporation of lean manufacturing principles into a mass customization environment is
given in order to lay the foundation for what has already been accomplished in this area.
Lastly, an overview of some other strategies common in manufacturing is given along
with a discussion of their application and benefits in order to investigate the feasibility of
employing them in mass customization situations where lean manufacturing may fall
short.
3.1. Competency Models
Mass customization is a complete paradigm shift from traditional manufacturing, thus
identifying appropriate manufacturing system configurations and evaluating the use of
lean manufacturing principles and practices mandates a review of the capabilities
necessary to successfully implement it. According to Moser (2007), there is currently no
concrete, empirically founded set of core competencies that have been proven necessary
to pave the road towards mass customization and increased performance and market
share. However, there is ample literature that conceptually describes some of these
necessary capabilities (Moser, 2007). In an effort to identify mass customization
competencies, two models are evaluated.
Zipkin (2001) identified three major capabilities for successful mass customization as
elicitation, process flexibility, and logistics. These terms are defined as follows:
Elicitation is the process of interacting with customers to determine their specific
needs. This includes activities such as marketing, product configuration (via salesperson,
Internet, etc.), and gathering the required information to customize the offering (Berman,
2002; Zipkin, 2001).

24
Process Flexibility refers to the various production methodologies and technologies
that make the production of customized products possible. Flexible Manufacturing
Systems (FMS), Reconfigurable Manufacturing Systems (RMS), effective production
control and scheduling, and human factors such as team structures and cross training
facilitate achieving process flexibility (Berman, 2002; Zipkin, 2001).
Logistics refers to processes involved in delivering raw materials to the production
floor and delivering finished products to the customers. Here, mass customizers face a
greater challenge than traditional manufacturers because the product must often be
delivered to specific customers rather than distribution centers. Individual products must
be tracked, customized, and delivered to the customer (Berman, 2002; Zipkin, 2001).
Moser (2007) presented another, more comprehensive model to classify capabilities
for mass customization, defining eight distinct categories. He also exemplified the
impact of these competencies using the mass customization value chain. Figure 3.1
provides the competency model put forth by Moser (2007), while Figure 3.2 illustrates
the interaction of these capabilities in the value chain.
I. Customer Integration
II. Application of product configuration systems
III. Employment of product modularity
IV. Product variant management
V. Central production and logistics planning
VI. Management of mass and individual production
VII. Management of flexible organization and processes
VIII. Process documentation and IT support
Mass Customization Competencies
Figure 3.1 Mass Customization Competencies (Moser, 2007)

25
(1) ProductDevelopment
(4) Production(2) Customer
Interaction(3) Logistics
(7) Leadership & Organization
(6) Complexity Management
(5) IT Systems
Primary Activities
I.
I. II.
II.
III. III.
III. IV.
V.V.
V.
VI.
VII.
VIII.
VIII.
Support Activities
Figure 3.2 Mass Customization Value Chain based on (Moser, 2007)
Moser’s model is more descriptive, identifying the capabilities needed in
manufacturing and support activities as well, while the Zipkin model mainly focuses on
primary activities of the value chain. However, both models cover the wide range of
activities that must come together as one in order for a mass customized product to be
marketed, configured, manufactured, and delivered. Restricting the discussion to the
focus of this thesis, a detailed review of production competencies is provided in the
following sections. A brief assessment of non-manufacturing (other) competencies is
also provided.
3.2. Production Competencies
Production competencies are the various capabilities a firm must possess to
efficiently receive orders from individual customers and manufacture them with short
lead time and low cost; to operate under mass customization conditions. Based on the
research reviewed and empirical evidence, these capabilities can be broadly classified
into the following; manufacturing system configuration (Koren et al., 1999; Mehrabi et
al., 2000; Berman, 2002; Zipkin, 2001), process modularity (Swaminathan, 2001;
Selladurai, 2003), production planning (Da Silveira et al., 2001; Zipkin, 2001; Selladurai,

26
2003), and organizational learning and continuous improvement (Barnett et al., 2004;
Pine, 1993). These manufacturing competencies are reviewed in further detail in the
following sections.
Flexible System Configuration
Flexibility of the manufacturing system is a key success factor for a mass customizer.
Zipkin (2001) dedicated one of his three areas of mass customization capabilities solely
to process flexibility. Moser (2007) also places value on a flexible manufacturing system
configuration with the capability labeled “Management of flexible organization and
processes.” A company cannot hope to produce a mass customized product without a
highly flexible and adaptive manufacturing system configuration.
There have been some improvements in strategy over the outdated dedicated
manufacturing systems (DMS) (Koren et al., 1999; Mehrabi et al., 2000). Two such
systems are flexible manufacturing systems (FMS), and reconfigurable manufacturing
systems (RMS). An FMS is characterized by expensive computer controlled machines
capable of producing a variety of products with variable volume mixes (Koren et al.,
1999). FMS, however, has its drawbacks, which include lower throughput than DMS,
high cost (due to producers building all possible functions into the machine regardless of
its final set of tasks), inability to easily modify software, and the equipment being
designed to operate at full capacity from purchase (Koren et al., 1999, Mehrabi et al.,
2000).
According to Mehrabi et al. (2000), some of the key requirements for the future of
manufacturing is rapid new product ramp up, “…rapid integration of new functions and
process technologies into existing systems,” and high capacity flexibility, which they
postulate can be provided through RMS.
An RMS consists of a highly flexible set of machines that are manufactured
specifically for a certain product family, and are designed with a “middle of the road”
capacity in mind, supplying capacity flexibility for changing market conditions. Thus,
the RMS makes use of modularity both in machine and software to allow for quick
capacity adjustment, low changeover/setup between products, rapid adaptability of

27
software, and quick ramp up to new product production. Table 1 provides a comparison
between DMS, FMS, and RMS.
Table 1. Manufacturing System Comparison (Koren et. al., 1999)
DMS FMS RMS Machine Structure Fixed Adjustable Fixed
System Focus Part Part Family Machine Scalability No Yes Yes Flexibility No Customized General
Simult. Oper. Tool Yes Yes No
Another manufacturing system configuration, proposed by Badurdeen and Masel
(2007) is the modular minicell approach. They state that traditional cellular
manufacturing usually consists of cells dedicated to a product family based on machine
requirements. However, in a mass customization environment, there may be a limited
number of products with a large amount of variations. If one were to build a cell that
contained all the processes and machines needed to handle these variants, the cell would
likely become large and unmanageable.
The proposed solution to this issue is to segregate products by the options that are or
are not required for their manufacture. This will allow a network of minicells to be
configured with the operators and machines necessary to produce a particular option.
Thus, with this network of small cells in place, products and parts may be routed through
the necessary minicells, while bypassing the unnecessary ones (Badurdeen and Masel,
2007; Badurdeen and Thuramalla, 2007).
Whatever the method, there is no doubt that for successful mass customization to
occur, there must be a flexible and highly responsive manufacturing system configuration
in place on the production floor. FMS, RMS, and minicells are just a few examples of
the possible techniques for efficient mass customization.
Process Modularity
Modularity is a key concept for successful mass customization, enabling the creation
of some commonality between products and allowing for higher efficiencies to be
achieved while also permitting customization. Ulrich and Tung (1991) define modularity

28
as “…the use of interchangeable units to create product variants.” As mentioned earlier,
the two most general types of modularity are product modularity and process modularity
(Swaminathan, 2001; Selladurai, 2003). The former is a design challenge while the latter
is more significant from a systems perspective. Again referring to Zipkin (2001), process
modularity falls under the process flexibility category. Moser (2007) accounts for
process modularity by claiming that variant management, process documentation, and
flexible processes are among the mass customization required capabilities.
A modular process is “…one where each product undergoes a discrete set of
operations making it possible to store inventory in semi-finished form and where
products differ from each other in terms of the subset of operations that are performed on
them” (Swaminathan, 2001; Selladurai, 2003). A modular process allows a team member
to be trained to do a set of operations (not necessarily based on a specific product),
enabling the manufacture of many different products based on the general set of steps to
be completed in the processing.
Postponement can be used along with modularity in both product and process to
enable a higher degree of customization (Berman, 2002). By performing standard
operations using standard modules and postponing customization until latter stages of
processing, a firm can achieve higher efficiency, lower costs (purchasing modules in
bulk, and mass production of modules), and reduce inventory on-hand (Berman 2002;
Swaminathan, 2001). One example of such a strategy is that of Hewlett Packard (HP)
Deskjet Printers. Historically HP produced its printers to completion at a single location
but later began to use modularity and postponement. HP now assembles a base product
using modular components and processes at a central locale, while the printers are later
fully customized at various distribution centers. This change in strategy amounted to a
reported 25% reduction in total cost of manufacture (Lee and Feitzinger, 1995).
Dynamic Production Planning
When purchasing customized products, customers are not willing to wait a large
amount of time to receive them. Thus, the challenge with mass customization is
achieving low throughput and lead times while enabling customizability. This
necessitates reducing the amount of inventory on hand and the amount of WIP (work in

29
process) on the floor in order to maintain visibility of the system and reduce throughput
through better flow. According to Swaminathan (2001), the keys to determining correct
inventory levels are deciding “…which products to build-to-order, which to build-to-
stock, and which products may be substituted for another if need be.” Also important to
maintaining inventory levels is the proper determination of capacity requirements.
Accurately predicting over and under utilization of equipment and taking measures to
control capacity can help to control inventory levels and maintain predictability
(Swaminathan, 2001).
All of these key issues fall under the area of production planning. Zipkin (2001)
accounts for production planning in the elicitation and logistics areas. Moser (2007)
claims that central production and logistics planning, as well as management of
individual and mass production are among the eight key mass customization capabilities.
This leads to the notion that effective production planning is important for efficient mass
customization.
Organizational Learning and Continuous Improvement
According to Selladurai (2003), the “…traditional mass production company is
bureaucratic, hierarchical, and highly standardized. Workers operate under close
supervision and perform highly routine, standardized, and repetitive tasks.” Mass
customizers will require a new breed of highly skilled workers, capable of working in
cross functional teams and performing a multitude of tasks (Pine, 1993). Mehrabi, et al.
(2000) state that the “…restructuring of organizations emphasizes moving from highly
centralized to decentralized team-work (i.e., essentially creating modules and dividing the
tasks among them to enhance flexibility, integration, and faster execution of new tasks).”
Mehrabi, et al. (2000) alludes to the concept of an intellectual worker, one which
continually strives to gain further knowledge of product and process to better support
their company and work team. The concept of the intellectual worker was first proposed
by the lean manufacturing movement as a means to continuous improvement (Selladurai,
2002), and this trend must continue into mass customization. Given that “…mass
customization environment typically entail shorter product life cycles…” thus intellectual
workers capable of learning and continuous improvement are needed (Swaminathan,
2001).

30
Moser (2007) also accounted for learning and continuous improvement in his mass
customization capability model. Moser’s seventh capability is management of flexible
organization and processes. Indeed, it is important that the mass customizing
organization, from team member to manager, be flexible and strive to continuously learn.
Only through learning can improvement take place. The knowledgeable and empowered
employee will be vital to the swift introduction of new products. Thus, employees of a
mass customization firm must be empowered to make decisions and actively pursue new
knowledge in order to produce quality products with low lead times, and allow their firm
to continually introduce new and improved products with rapid ramp up so as to maintain
and increase market share.
3.3. Other Competencies
Though not the focus of this paper, external competencies are noteworthy because
they impact the production operations and system effectiveness for mass customization.
The major non-manufacturing competencies significant for mass customization include:
IT and Customer Interfacing, Product Development, and Logistics. These competencies
are discussed briefly in the following sections.
A major development that has led to more prominent use of mass customization is the
ever increasing popularity of internet business (Selladurai, 2002). The Internet has
allowed producers to create web-based “product configurators,” which allow customers
to personalize products to individual preferences, within solution spaces defined by the
producer.
In the past, customer interaction (elicitation) was costly and time consuming because
it was performed by “skilled sales people,” and thus was often reserved only for high
volume consumers (Berman, 2002). Irrespective of the method, it is imperative that the
consumers are able to decide on preferences, and then accurately convey their
preferences to the producer in a timely manner. The ability to provide these capabilities
to consumers can have a great effect on a company’s market performance (Boynton and
Pine, 1993). The IT aspect of mass customization directly influences the shop floor
operations in that customer orders for specific products must be communicated
accurately, scheduled appropriately, and materials made available to deliver custom
products in a short lead time.

31
A mass customizing firm must be able to quickly and efficiently introduce new
products into the markets in order to keep up with dynamic market conditions.
Sanderson and Uzumeri claim that “the emergence of global markets has fundamentally
altered competition as many firms have known it.” This has resulted in “forcing the
compression of product development times and expansion of product variety” (Sanderson
and Uzumeri, 1997). This does not mean, however, that standardization and
commonality cannot be made use of. It has been found that the increasing focus on
individual customers has led to “a failure to embrace commonality, compatibility,
standardization, or modularization among different products or product lines” (Meyer and
Lehnerd, 1997). This leads to the idea that product design is vital to the success of a
mass customizer. Tseng et al. (1997) present the idea of product family architecture
(PFA), a set of products with some commonality and standardization that can be
produced as a family, possibly among a work cell on the production floor.
Proper product development practices are directly related to the shop floor in that the
developed product must be produced there. The more a developer makes use of
standardization, modularity, and commonality, the easier and more efficient the task of
production will be.
The third aspect of mass customization external competencies is that of logistics.
Zipkin (2001) describes logistics as “…additional processing and transportation tasks.”
One key issue with producing individualized products is that they must be tracked and
produced by specific customer. One example of how a current mass customizer
accomplishes this is Levi Strauss, who attaches a water proof barcode to the cloth with
the customer’s information. This enables the products to be washed together, while
maintaining the products individual identity (Zipkin, 2001).
Also vital to mass customization logistics is the supply chain, which must be
coordinated and constantly in contact with the client. Berman (2002) claims that the key
to a mass customized supply chain is “…close relationships with channel partners more
capable than the firm in performing specific channel functions.” The important concept
here is a close, partnership like relationship between supplier and client. This will allow
for increased communication, trust, and integration between entities, enabling a mass
customizer to obtain materials as needed.

32
The third aspect of logistics is distribution, which is difficult since products are now
sent to individual customers, rather than “middle men” as with traditional manufacturing.
Zipkin (2001) states that “…technologies underlying e-commerce logistics (including the
internet, automated warehouses, and package delivery services) continue to develop, they
will help bring mass-customization systems to fruition. Today’s problems are
opportunities for such companies as Federal Express and United Parcel Service (UPS).”
Logistics is related to production in that it is vital for the shop floor to receive raw
materials and components when they need them, so as to be neither starved nor
overburdened with material. Finished goods must also be quickly transported from
production floor to customer upon completion of processing.
Discussion
In the previous sections, mass customization competencies presented by different
authors were reviewed, and based on these four broad categories of competencies
required for successful mass customization manufacturing have been identified. It is
evident, however, that as the degree of customization varies for different mass
customization classification schemes as discussed in Chapter 2, so does the extent to
which these competencies effect production. Having established these competencies, the
objective is to assess to what degree lean manufacturing principles and practices can meet
them.
3.4. Potential for Applying Lean Manufacturing For Mass Customization
A brief history of manufacturing evolution has been given and basic definitions of
lean manufacturing and mass customization established. Also, an examination of mass
customization classification schemes was given along with a discussion on mass
customization and lean manufacturing capabilities. Having fully defined and discussed
these two manufacturing strategies, a conceptual investigation into the transferability of
lean techniques for mass customization is pertinent at this point. An attempt was made to
find literature pertaining to the application of lean manufacturing principles for mass
customization, but there seems be little work in this area.
Boynton and Pine (1995) claimed that becoming lean was an important step for a
company wishing to transition to mass customization, but gave no details on the actual

33
employment of lean while mass customization is taking place. The theme of viewing
lean as a transitional step to achieving mass customization occurs with some regularity in
the literature, but on the possibility of actual integration of lean principles into a mass
customizing operation there is no supporting material to be found. Several works refer to
lean manufacturing in a build-to-order or make-to-order environment, but these
essentially mean building only to demand as in a pull system (Michel, 2002; Clarke,
2005). Make-to-order operations differ from mass customization in that no work is done
until the customer configures their individual product and delivers their specifications to
the manufacturer. This work will attempt to provide some insight into this previously
unexplored topic. See Figure 3.3 for a visual representation of the overlap between lean
manufacturing and mass customization that is to be explored.
Flexible System Configuration
Process Modularity
Dynamic Production Planning
Organizational Learning &Continuous Improvement
Mass Customization Competencies
Mass Customization Manufacturing Competencies
Other Competencies
How much overlap is possible?
Extent varies depending on degree
of mass customization as
presented in classification models.
Lean Manufacturing Principles and
Practices
Figure 3.3 Mass Customization with Lean Principles and Practices
From the discussions above, it is evident that some aspects of lean manufacturing are
directly transferrable to mass customization while others are not. Also, the lean
capabilities and tools that are applicable will vary based on the type of mass
customization in use. Lean manufacturing is readily adaptable to low level mass
customization operations that delay customer involvement until later stages of the value
chain such as assembly or delivery, but the uses of lean when the customer is involved in

34
the design or fabrication stage is much more abstract, and little research has been done on
the subject.
It is obvious that some aspects of lean can easily be used, and are in fact likely
required for efficient mass customization no matter what strategy is in place. One
example of this is good team structures and continuous learning. An operation that hopes
to use mass customization cannot do so without the intellectual worker. Employees must
be highly trained and encouraged to continuously learn and share knowledge in order to
improve their organization, just as employees of lean companies are required to do. This
concept is even more important for mass customization however, as the difficulty and
variability of the processing is significantly higher as variety increases.
Visual management is also a key lean practice that can be made use of in mass
customization regardless of strategy. It is important to visually represent the status of the
production floor at all times. This is especially so in mass customization as offering
customized products while maintaining low lead times and throughput requires a high
degree of organization. 5S can also be directly applied to mass customization, or to any
environment, and will greatly aid in creating an organized shop floor.
Mass customizers must also seek to continuously improve their operations and
eliminate waste wherever possible. While these lean capabilities may be more difficult in
operation for some styles of mass customization, the principles still apply.
Lean concepts that are not so easily adapted to mass customization include stable and
standardized processes, JIT, and Jidoka. The very definition of mass customization does
not account for any degree of stability and standardization, and as variety increases and
the customer becomes involved earlier in the value chain, these concepts become more
difficult to apply. Nevertheless, some degree of standardization can be reached, however
small, in any process. Tools such as process modularity can aid in creating some stability
in the process when none is offered by the product.
Leveled production and JIT (which includes the concepts of takt time, pull, and
continuous flow) are also very difficult to use in mass customization, at least for
involvers and fabricators where customization occurs early in the value chain. When
each product is completely individualized, accurately forecasting demand becomes
increasingly difficult, and products are likely to have highly variable work content. This

35
makes leveling production and use of takt pacing a near impossibility in many mass
customization environments. With little or no concept of takt and work leveling, it
becomes difficult to continuously flow product through the plant. However, some degree
of pull and flow can be implemented on the shop floor, especially with the aid of good
visual management. This is much more possible for assemblers and modularizers.
Jidoka, or source quality, is also increasingly difficult to adapt to mass customization
as the customer becomes involved early in the process. As products become increasingly
more customized and variety rises, good quality control on the shop floor is more
difficult. One can still implement self and successor checks, but with much lower
degrees of standardization in the product and process, these checks become less efficient.
When producing a product that was individually designed for a single customer, the
concept of “good quality” becomes more obscure as there is essentially no quality
example to compare the product to. The only quality standards available are those given
in the design parameters. However, some degree or source quality can be used in any
mass customization environment. For example, the characteristics of a quality weld are
constant regardless of where and on what surface the weld is placed, and thus can be
efficiently controlled with self and successor checks and other jidoka practices.
Above all, any firm, mass customizing or lean, should seek to continuously improve
itself. Only through continuous learning, increased knowledge, and the active pursuit of
solutions to problems and wastes can a producer hope to increase the efficiency of its
operations and further itself in its market. While many common lean tools, such as takt
pacing and leveled production, are seemingly inapplicable in some mass customization
manufacturing environments, there are many lean aspects that can be transferred directly.
Lean is often viewed as simply a set of tools and used interchangeably with terms like JIT
and TQM, but lean is actually a philosophy that encompasses all aspects of production.
Within this philosophy, there are certain “cultural” areas, such as team work, continuous
improvement, visual management and 5s, problem solving, and waste elimination that
can be directly applied to any mass customization environment.

36
3.5. Potential for Integrating Other Strategies
Various other strategies have emerged in the literature to cope with changing market
requirements. An investigation of these emerging strategies in the context of lean
manufacturing and their applicability to mass customization is worthwhile at this point.
These strategies include agile manufacturing, leagile manufacturing, job shop lean, Quick
Response Manufacturing (QRM) and POLCA, and Theory of Constraints (TOC).
Agile/Leagile
Agility is defined as “…using market knowledge and a virtual corporation to exploit
profitable opportunities in a volatile market place,” (Naylor et al., 1999). Indeed,
unstable and volatile markets, characterized by short product life cycles and highly
variable demand is one of the main drivers for becoming agile by developing market
knowledge and methods to rapidly respond to volatility. Agile manufacturing is entirely
different to the lean paradigm, and even mass customization (Stratton, 2003). The focus
of agile manufacturing is fast response throughout the supply chain to mitigate the effects
of variability, while mass customization is focused on delivering customized products to
each individual customer. By nature, both paradigms are characterized by high variety
and uncertain demand (Krishnamurthy et al., 2007).
Many studies have shown that neither lean nor agile supply is the answer to all
production issues, but in fact a combination of both may often be the best solution. One
such study consisting of a survey of some 600 companies in the United Kingdom
concluded that it is more likely that lean and agile manufacturing should work together to
be most effective (Yusuf and Adeleye, 2002, Agarwal et. al., 2006). This combination of
lean and agile has been termed leagile and is defined as “…the combination of the lean
and agile paradigms within a total supply chain strategy by positioning of the decoupling
point…” (Mason-Jones et al., 2000). The decoupling point is the point at which the agile
supply chain strategy and the lean supply chain are separated. Everything upstream of
the decoupling point uses lean principles to enable leveled production from accurately
forecasted demand, while all stages after the decoupling point use agile concepts to
maintain customer responsiveness and buffer the volatility of the market. It is important
to note that agile and lean sections must be used separately. This is accomplished either

37
through decoupling or time based variation in strategy usage, meaning the strategy in use
could vary depending on the season, for example (Towill and Christopher, 2002).
With the decoupling point at the assembly stage, further improvements are feasible by
incorporating leagile practices. This will enable upstream processes to operate very
efficiently using lean, while assembly and other downstream processes can maintain
customer responsiveness.
According to Goldsby et al. (2006), three methods to create lean and agile hybrids are
available. The first uses the 80/20 rule, (i.e. 80% of the sales will come from 20% of the
product varieties) to establish an efficient lean system for that 20% of high demand
product, while agile and leagile concepts are used for the other 80% of the variations.
While this concept may not be directly applicable to mass customization as the variety is
potentially very high, it can in principle be used with accurate forecasting to reduce the
variability in the system.
The second hybrid method involves investing in excess (production) capacity in order
to handle varying demand and work content fluctuations, which is also a useful strategy
considering the volatility of mass customization markets. Third is the principle of
postponement (Goldsby et al., 2006).
One well known example assembler/modularizer that uses postponement is Scion, a
division of Toyota. Customers are allowed to customize their cars online with a
multitude of features. Base models are manufactured in Japan applying lean
manufacturing, then customized later at distribution centers, or even at the dealerships
that sell them (Goldsby, et al., 2006). Given that the customer involvement takes place
late in the value chain for both low level customizers, these leagile strategies can possibly
be implemented with a well placed decoupling point. The best strategy to use will
depend upon the product and its market. While lean manufacturing is for the most part
directly applicable to these mass customization scenarios, the use of a leagile hybrid
system may increase customer responsiveness and further reduce the effect of variation
on the supply chain.

38
Job Shop Lean
Job shop lean is a relatively new method in which certain lean manufacturing
principles and practices are applied to job shop environments (Brink and Ballard, 2005).
The main focus of job shop lean is to use value stream mapping to gain a system wide
perspective. While it is difficult to quantify information such as processing times, lead
times, etc. in a fully customizing production line, value stream mapping can still provide
enough perspective over the system to enable the visualization many of the wastes (Brink
and Ballard, 2005; Huang et. al., 2005; Alves et. al., 2005). Other lean principles such as
5s, visual management, WIP control through kanban, and total productive maintenance
have found use in job shop environments (Brink and Ballard, 2005). There is very little
literature available on the actual application of job shop lean and its methods. It is clear
that this strategy is a variation of lean with many similarities, but accounts of successful
implementation and the benefits of applying this strategy to custom manufacturing
situations were unable to be found.
Flexible Manufacturing Systems/Reconfigurable Manufacturing Systems
Flexible/Reconfigurable manufacturing systems (FMS/RMS), as discussed earlier in
the chapter, offer flexibility in the production systems for those manufacturing
environments that heavily utilize equipment. FMS, while expensive, offer the ability to
handle a large number of products with rapid changeovers and setups, while the less
expensive and perhaps more practical RMS focuses on efficiently handling products
across a given family (Koren et. al., 1999). The main advantage of RMS over FMS is the
use of modularity in the equipment and software to quickly adjust capacity and allow for
rapid new product ramp up (Mehrabi, et. al., 2000).
While FMS/RMS are certainly viable strategies, they are limited to application in
equipment intensive environments where they can have a profound impact on throughput.
Companies will likely see little benefit in adding these expensive systems to a single or a
few processes on the shop floor, as it has been proven that maximizing the efficiency of a
single process may not effect or in fact be detrimental to overall system performance
(Goldratt, 2004).

39
Theory of Constraints (TOC)
The Theory of Constraints (TOC) is another strategy that has found success in many
manufacturing situations. Its focus is on the existence of a constraint or bottleneck which
determines the throughput of the entire system and can be used as a pacemaker (Goldratt,
2004; Mabin and Balderstone, 2000). Control over the manufacturing system is
established through the drum-buffer-rope (DBR) mechanism, where the constraint is the
drum or pacemaker, a buffer is placed between the drum and the downstream processes
to eliminate stoppage of the constraint, and the rope is employed to pull product to the
bottleneck from the upstream processes (Klusewitz and Rerick, 1996; Goldratt, 2004;
Mabin and Balderstone, 2000). Figure 3.4 shows the operation of the DBR mechanism.
Upstream Processes
DownstreamProcesses
Drum(Pacemaker Process)
Buffer(Prevents stoppage of drum)
Rope(Links drum pacing with
order release) Figure 3.4 DBR Mechanism
TOC also seeks to create excess capacity for variability buffering in all non-
constraint resources while only the constraint itself is run at nearly 100% utilization to
maximize throughput on the shop floor (Goldratt, 2004; Steel et. al, 2005). This
protective capacity has been proven to improve WIP and flow time, but with diminishing
returns and benefits as variability increases (Kadipasaoglu et. al., 2000).
(TOC) and the DBR mechanism have been proven to be effective and have been
accepted by many manufacturers over the years, but at this point there is still little
literature qualitatively analyzing situations where TOC is made more or less effective as
a control system. Mabin and Balderstone (2000) listed nearly 100 companies that had
implemented TOC successfully, but little quantification of the results was given other

40
than accounts of reduced inventory and increased throughput. Thus it is difficult to
understand from the literature just how effective TOC can be in different situations,
especially that of mass customization. One key observation that can be made of the DBR
mechanism is that it borrows from the lean principle of pull through the use of the rope
for order release. However, literature discussing any integration of lean principles along
with TOC was not found.
Quick Response Manufacturing (QRM)
Quick Response Manufacturing (QRM) is a manufacturing control strategy that has
found use in many situations where variety can be high. QRM uses lead time reduction
as its main performance measure and employs the paired cell-overlapping-loops of-
cards-with authorization (POLCA) (Suri, 1998). QRM seeks to reduce lead times across
all operations in order to gain responsiveness to the customer. POLCA is a control
mechanism that is efficient for controlling flow and inventory in manufacturing
environments that face a high number of complex product routings (Fernandes and
Carmo-Silva, 2006). A POLCA system has cards for each possible product routing that
are set to a number that can be determined through formulas based on indicators such as
demand and lead time. The cards are set for a routing between two cells, and are attached
to the product upon entering the first cell in the routing and detached upon leaving the
second cell (Suri, 1998). In this way, POLCA controls inventory levels between each
pair of cells and thus across all product routings. See Figure 3.5 for the operation of a
POLCA system.
Figure 3.5 shows one possible routing for a product through this example system, and
there would be a loop between each pair of cells for other product routings (i.e. P1F2,
F1A3, A1S1, etc.). For an explanation of the usage of POLCA cards the P1F1 loop in
Figure 3.5 can be examined. For a product to enter the P1 cell with a routing that had F1
as its next process, a P1F1 card would have to be available. The card would then be
attached to the product and flow from P1 to F1 before being detached and returned to the
P1 cell.

41
P1
One PrintingCells
Two FabricationCells
F1F1
F2
A1
A2
A3
Three AssemblyCells
S1
One ShippingCell
P1F1 Loop F1A2
LoopA2S1 Loop
Figure 3.5 POLCA Control (Suri, 1998)
Similarly, and F1A2 POLCA card would have to be available before the product could
enter the F1 process, and so on. In this way, POLCA controls inventory throughout a
system with complex routing situations.
It is apparent from the literature that QRM and POLCA are robust systems that can
aid in situations where variety is high. The focus on lead time reduction is an easy and
effective performance measure to employ (Suri, 1998; Johnson and Harrison, 2004)
where as lean manufacturing’s focus on waste reduction is more difficult to quantify.
However, the POLCA system does have its drawbacks. POLCA is intended to be used in
the cellular manufacturing environment, and there is little literature to be found on the
implementation of POLCA in non-cellular situations. It also can tend to become very
complex due to the requirement of having a set of cards for every possible cell-pair
routing, thus the physical operation of the system can be tedious in some situations.
The focus on lead time reduction and ability to handle high variety and product
routings indicate that QRM could be a strong system for aiding in successful mass
customization. The literature also indicates that it can be integrated with some aspects of
lean, such as combining lead time reduction and waste reduction as performance
indicators. POLCA and kanban can also be integrated by employing POLCA to control
inventory between cells while kanban is used for control within each cell (Suri, 1994).

42
Short lead times in high variety situations is tantamount to successful mass customization
by its very definition, and QRM can likely offer support for this.
3.6. Discussion
While the competencies required for successful mass customization and the principles
associated with lean manufacturing are well documented and defined, it is apparent from
the literature reviewed that there is a need for further investigation into the topic of
applying lean manufacturing principles and practices to mass customization. The
literature on this subject is currently very sparse and no clear conclusions, empirical or
otherwise, have been drawn on the applicability of lean or mass customization. Also
important to the research is the investigation into the application of the other
manufacturing strategies discussed in Section 3.5 to fill in the gaps where lean
manufacturing falls short, if there are any. Overall there is little literature to support or
discount neither the application of lean manufacturing in mass customization
environments nor the successful integration of other common manufacturing strategies
with lean. Thus, an attempt will be made to shed some light on this topic through further
research. In the next chapter, the applicability for each manufacturing strategy discussed
in Section 3.5 is discussed in terms of providing assistance for lean manufacturing, and a
theoretical framework is developed showing the proposed interactions of the various
systems based on the type of mass customization in place.

43
4. Methodology
Having provided a discussion of the characteristics of lean manufacturing principles
and practices and mass customization, and the applicability of the former to the latter, it
is now necessary to review some of the other strategies prominent in manufacturing
today. In this section, strategies such as agile/leagile, job shop lean, quick response
manufacturing, etc. are critically reviewed and arguments for or against their application
toward filling in the gaps between lean manufacturing and mass customization are
discussed. Next, a framework is provided showing the strengths and weaknesses of lean
manufacturing when applying it to mass customization and where the other strategies that
have been reviewed can supplement lean. Finally, the research objective and procedure
is presented and the case study company introduced.
4.1. Critical Review
It is evident that lean manufacturing principles and practices are not wholly
applicable in many mass customization environments, and that in many cases it will be
necessary to utilize aspects of other manufacturing strategies. In chapter 3, these
strategies and their characteristics were discussed. Here, their qualities are reviewed for
robustness in their ability to fill in the gaps where lean manufacturing falls short.
Agile/Leagile
Agile and leagile are business strategies focused on the responsiveness of a
manufacturing firm to the market conditions it must face. These strategies have received
quite a bit of attention in recent time as a means of handling the increasing fragmentation
of market conditions and shortening of product life cycles (Stratton, 2003; Krishnamurthy
et. al., 2007). Again, Leagile differs from agile only in that it incorporates a decoupling
point (Yusuf and Adeleye, 2002; Mason-Jones, 2000).
While there is no doubt that responsiveness to market conditions and the quick
introduction of new products is important, one cannot help but wonder exactly how an
organization might become agile. In all the literature reviewed, few accounts of an
organization actually applying agility to their manufacturing system were found. This is

44
most likely due to the fact that agility has at its core no principles or structure that an
organization could follow in an attempt to transition to an agile organization. The
principles and practices of lean manufacturing, and to a lesser extent, mass
customization, are well known and outlined, and the companies that have successfully
employed them are numerous. However, this is not true of agile manufacturing.
The core objective of fast market response and new product introduction for
agile/leagile manufacturing is certainly important for any business to have, however, the
weakness of these strategies lies in the fact that it is limited to a business objective, an
ideology to be applied across the enterprise, but lacking any tools for concrete application
to the shop floor.
Job Shop Lean
It is difficult to see where this strategy differs from that of lean manufacturing other
than the environment in which it is applied. Both approaches utilize value stream
mapping heavily to visualize the system and employ a strong focus on waste elimination
(Brink and Ballard, 2005). However, no tools or practices specifically unique to job shop
lean were found in the literature, and case studies of organizations applying job shop lean
were virtually non-existent. As with agile/leagile manufacturing, the question is raised of
how an organization might actually apply job shop lean, as no core tools other than value
stream mapping and a focus on waste reduction seem to be present.
While value stream mapping is a powerful tool and can be used in most any
environment, it is difficult to see any solid benefits of applying job shop lean in mass
customization organizations. It is likely that job shop lean will be further developed in
the future, but for now it remains a slight variation of lean manufacturing made less
effective by the environment in which it is applied.
Flexible/Reconfigurable Manufacturing Systems
Flexible/Reconfigurable manufacturing systems (FMS/RMS) provide a means to
handle processing and changeover/setup in high variety equipment intensive operations
(Korent et. al., 1999; Mehrabi et. al., 2000). The ability to handle a broad range of
products in an efficient manner is a principle that is at the core of mass customization.

45
Lean manufacturing promotes fast setups and changeover strategies such as SMED, thus
it is apparent that in applying lean manufacturing to mass customization the concepts of
FMS/RMS hold some merit. However, their weakness lies in the fact that they are both
equipment focused strategies, and are lacking as a means of system wide control and
operation of the manufacturing system. Employing FMS/RMS will provide some benefit
to many organizations, but focusing only on equipment must be avoided and close
attention paid to the mass customization competencies such as dynamic production
planning and process modularity.
For the efficient management of the shop floor in a mass customization environment
a more robust strategy than FMS/RMS is needed. These approaches, however,
depending on the products produced and their equipment requirements, can likely aid in
filling in the gaps between lean manufacturing and mass customization.
Theory of Constraints
When considering the ability of TOC to aid in creating efficient mass customization,
it is important to take into account the high variability that will be present. Each order
that a mass customizer receives is different and individual to the customer, thus work
content can differ greatly, especially for those companies who involve the customer early
in the value chain as in high level customization. It has been found that once the DBR
mechanism is implemented, the constraint can shift at times due to variation in the system
(Goldratt, 2004), and these occasional shifts must be recognized and the system adjusted
accordingly. With mass customization, many companies will deal with high work
content variation from each work piece to the next, thus it is likely that the constraint will
shift frequently, with a higher effect for low volume manufacturers with larger cycle time
ranges.
For mass customizers of the low level variety, TOC and DBR could likely be a viable
strategy for system control as these companies customize only in the assembly and
delivery stages and efficient use of product modularity can help reduce the effect of order
variability. High level customizers, on the other hand, face much more variation because
of the customer being involved in the design and fabrication stages. For these companies,

46
it is likely that an attempt to implement TOC would result is implementing a strategy that
requires a static constraint in a situation that is highly dynamic.
The theory of constraints is a more complete strategy than those discussed earlier. It
provides a means of inventory control and system pacing on the shop floor. One of its
strengths is its simplicity in managing the whole shop floor based on the constraint;
however it does not have the strong set of tools that make up the core of lean
manufacturing. The theory of constraints may be a very effective method of shop floor
management for some manufacturers, but in many mass customization situations it will
be difficult to implement due to its heavy reliance on a stable and consistent constraint in
the system.
Quick Response Manufacturing
The focus on lead time reduction and the POLCA strategy of QRM make one of the
more robust systems discussed thus far. In some ways it seems to nearly parallel lean
manufacturing. For example, where the focus of lean is considered to be waste reduction,
that of QRM is lead time reduction, and while lean utilizes the kanban/conwip card,
QRM has the POLCA card. QRM, like lean is an enterprise wide philosophy for the
employees to utilize and follow, however QRM is intended to fulfil the needs of those
firms facing higher product variation and seeking to cater to more unstable and
fragmented markets. POLCA itself is intended for use when many complex product
routings are present, as a means of managing the inventory and flow from one cell to
another (Suri, 1998; Suri, 1994; Fernandes and Carmo-Silva, 2006).
QRM as a whole is a strong strategy for any organization to follow. The simplicity of
the measure of lead time reduction as the main performance indicator is a definite plus
that can be applied across the enterprise. POLCA is a robust means of system control,
but it is also much more complex in operation than more prominent methods such as
kanban. It is meant to aid in managing a high variety of product routings and should not
be used in situations where kanban will suffice. QRM has already seen much success
with mass customizing firms and will likely continue to do so. It is apparent that QRM
can provide some strength in the areas of weakness for lean manufacturing as customer
involvement moves up the value chain.

47
4.2. Framework
The strengths and weaknesses of applying lean manufacturing to mass customization
have been analyzed, and a critical review of other strategies that may aid in filling in the
gaps has been provided. It is now necessary to provide a framework describing the
findings thus far. The ultimate goal of this framework is to provide a road map for
applying lean manufacturing to mass customization, including an account of which lean
principles and practices are applicable and to what degree based on the particular type of
mass customization in place, and how other strategies such as Quick Response
Manufacturing and the Theory of Constraints can pick up the slack where lean falls short.
To begin, it is beneficial to once again examine the mass customization competencies
put forth by Moser (2007), and show the varying degree to which each competency is
important as customer involvement moves up the value chain (i.e. moving from
assemblers to fabricators). Figure 4.1 graphically presents this analysis in a spider
diagram of mass customization.
Mass Customization Capabilities by Family.
Customer Integration
Application of Product Configuration Systems
Employment of Product Modularity
Product Variant Management
Central Production and Logistics Planning
Management of Mass and Individual Production
Management of Flexible Organization and Proccesses
Process Documentation and IT Support
Assemblers
Modularizers
Involvers
Fabricators
Figure 4.1 Mass Customization Competencies by Strategy

48
As can be seen from Figure 4.1, each mass customization competency can be
considered to carry a varying degree of importance based on the point of customer
involvement in the value chain. For the most part the importance of these competencies
increases in a linear manner from assemblers with customer involvement taking place in
the assembly or distribution phase, to fabricators who involve the customer in the design
phase. However, some of the competencies vary in this regard; customer integration,
application of product configurations systems, and management of mass and individual
production.
Customer integration refers to the act of customers becoming involved in certain
aspects of production, aspects that were likely once considered to be the sole
responsibility of the manufacturer (Moser, 2007). In figure 4.1 it is apparent that there is
a larger gap between assemblers/modularizers and involvers/fabricators than is present in
most of the other competencies. The reasoning behind this is the fact that the need for
customer input is much greater when customization takes place in the design and
fabrication stages rather than the assembly and distribution phases. For assemblers and
modularizers, the customer integration likely refers to some simple choices of options to
be present or absent on the product, as with 121TIME, a Swedish watch manufacturer
which allows customers to configure the appearance of their watch and order it online
(Moser, 2007). This is a rather simple interaction that requires no efforts from the
manufacturer itself to configure the product. However, with involvers and fabricators the
interaction between customer and manufacturer are likely to be much more personal and
lengthy. For example, Selve, a mass customizing shoe manufacturer, allows its
customers to choose from a range of base models. From there a dedicated salesperson
scans their foot, and the basic shoe is displayed before features such as material, color,
soles, etc. are chosen. The salesperson works with the customer through this entire
process as the customer becomes fully integrated into the production process from the
fabrication stage (Moser, 2007).
The reasoning behind the placement of the mass customization styles in the area of
application of product configuration systems is much the same as those provided in the
customer integration discussion. Product configuration systems are important because
they allow the customer the see the choices available to them and essentially build their

49
product in a virtual environment. These product configurators can range from software
programs to dedicated salesmen, and as the degree of customer integration increases, so
does the necessary robustness of the product configuration system.
Having shown the varying degree of importance of mass customization competencies
for different types of mass customizers, it is now important to show that the same
variation is true for lean manufacturing principles and practices. Figure 4.2 takes the
ideas on the importance of mass customization competencies expressed in Figure 4.1, and
adds in the lean application aspect in terms mass customization style ranging from
assemblers to fabricators. Figure 4.2 attempts to give a sequence of mass customization
competency importance and lean manufacturing principle and practice application.
Starting from the top on the mass customization side, the Figure shows that customer
integration is important for all mass customizers, but increases in importance as customer
involvement moves up the value chain.
Figure 4.2 Importance of MC Capabilities and Ease of Lean Implementation

50
When moving from assemblers to fabricators, these mass customization competencies
become more pronounced and important to the efficient operation of the organization.
For example, extensive product variant management techniques may not be prominent in
an assembler type mass customizer, but will certainly be so for a involver and to an even
greater extent for a fabricator. The underlying idea is that different mass customizer
families will strongly employ different core competencies with increasing applicability
and importance of these competencies as customer involvement moves up the value
chain.
On the lean side of the figure, the increasing applicability of lean manufacturing
principles and practices as customer involvement moves down the value chain is shown.
For a fabricator, for example, only certain lean aspects will be readily applicable to the
organization. Principles such as people and teamwork, continuous improvement, and
waste reduction are easily applied and important to any organization. Visual
management and jidoka are also likely to be applicable for all mass customization
families, but become increasingly difficult to apply as the inherent variation of the
products increase. Finally, the principles of leveled production, stable and standardized
processes, and just-in-time will almost certainly be applicable for mass customizers of the
assembler/modularizer type, if at all. This is due to the heavy reliance of these principles
on the existence of consistent demand and work content, as well as a relatively low
number of product variants.
Having provided a theoretical representation of mass customization competencies and
lean principle and practice application, it is now necessary to tie these two strategies
together with those discussed in the critical review section into a comprehensive
framework for this research. See Figure 4.3.
Figure 4.3 attempts to combine lean manufacturing, mass customization, and the
other strategies that have been discussed into a comprehensive framework. Across the
top the core lean principles and practices are listed, and once again the trend of increasing
ease of lean applicability as customer involvement moves down the value chain is
demonstrated. Above the lean principles the inventory control tools of CONWIP and
Route Specific Kanban are listed in order to show that these are some key strategies that

51
aid in the implementation of the principles of Just-in-Time, stable and standardized
processes, and leveled production.
Figure 4.3 Theoretical Framework
Also shown are the mass customization competencies as outlined by Moser (2007) across
the bottom. Here the increasing importance of these core competencies as customer
involvement moves up the value chain is demonstrated.
The most important aspect of this framework, however, is the information given on
the possible application of other strategies (QRM, TOC, Agile/Leagile, FMS/RMS, Job
Shop Lean) in combination with lean manufacturing to aid in effective mass
customization. Arrows of varying thickness are used to show for which mass customizer
families a particular strategy is most likely to be useful, and to what degree it could be
useful in relation to other types of mass customizers.
The Theory of Constraints (TOC) strategy is shown in the figure as being most likely
applicable in the cases of assembler and modularizer mass customization. Since the
customization takes place at earliest in the assembly stage for these mass customizers,
variety and work content variation will be much lower than in the cases of fabricators and
involvers. For fabricators and involvers, the work content variation is likely to be such

52
that any constraint in the system will experience frequent shifts, thus hindering the ability
of TOC to control the system flow. For these reasons TOC is likely to find some
beneficial application for those low level mass customizers.
In the framework figure, FMS/RMS are shown as being beneficial to all types of
mass customization, with increasing benefits as customer integration moves up the value
chain. It is apparent that high level customizers face more manufacturing challenges due
to variety than low level customizers, and for this reason would benefit more from the
implementation of an effective FMS/RMS. Lean manufacturing also advocates setup
reduction, so the combination of lean manufacturing principles on the shop floor with
FMS/RMS capable equipment will be beneficial to any mass customizer whose products
require significant machine time.
Quick Response Manufacturing (QRM) is represented as being beneficial in filling in
the gaps between lean and mass customization for the high level mass customizers. Lean
methods of Just-in-Time, stable and standardized processes, and leveled production fail at
this point and inventory control through kanban is likely to be impossible. Other lean
principles such as visual management, jidoka, continuous improvement, etc. remain
applicable but increase in difficulty of implementation. One of the key aspects of
combining lean and QRM is the integration of the lean principle of waste reduction with
a heavier focus on the QRM main performance measure of lead time reduction to help in
the evaluation of the system’s status.
Often in these situations the issue of complex routings and inventory control
between cells must be overcome, and POLCA, as discussed in Chapter 3 can do this.
Manufacturers can also use POLCA in tandem with kanban, employing POLCA to
manage routings and inventory between many cells, while kanban controls material flow
within the cells themselves. This combination of lean and QRM card-based control
system would undoubtedly be of benefit to many mass customizers.
Agile/Leagile manufacturing, as mentioned earlier in this chapter, does not have a
concrete set of implementation tools and benefits of its own but is limited to a business
perspective on market responsiveness and new product introduction. The concept of the
decoupling point in leagile manufacturing however, can likely be beneficial to those able
to implement it. This is more likely to occur for low level customizers than high level

53
ones, as the customization for high level customizers takes place so early in the value
chain.
Job shop lean is not in place on the figure but is discussed here as a strategy of note.
It is difficult to view this strategies as robust and substantial as at this point there seems
to be no significant tools or methods for implementation and control, and therefore any
benefit they would provide to the shop floor of a mass customizing organization is
unclear.
It should be noted that while this framework attempts to give a clear picture of how
lean and other manufacturing strategies can be combined for mass customization, it is by
no means a complete representation of all cases. For instance, the indication that QRM is
beneficial for high level mass customizers is meant to show that these are the areas where
QRM will most likely be needed. Obviously, the specific applications of these strategies
will differ on a case by case basis, and there are no doubt instances of low level
customization that would benefit from QRM implementation, and the same is true of the
other strategies present. Overall the figure is an attempt to combine the findings thus far
into a comprehensive framework to aid in the further research and experimentation of this
work.
4.3. Objective
Having developed a theoretical framework for incorporating lean manufacturing with
mass customization, it is now necessary to provide some validation of these theories. The
objective is to prove that the application of lean manufacturing principles is beneficial in
the mass customization environment, but also that some mass customizers, mainly high
level customizers, will often require the use of other manufacturing strategies such as
QRM to supplement lean manufacturing. However, to investigate all combinations of
these strategies for all the styles of mass customization is too large of a task to be
completed in this work. For this reason, a single investigation into a mass customizer of
the assembler family will be presented.
The case study company in question is Skier’s Choice, a manufacturer of competition
quality wakeboarding boats based in Maryville, Tennessee. The competition
wakeboarding boat market is the epitome of the types of markets many mass customizers

54
face; a fragmented niche market with high end products marketed towards adults with
extra money to spend and who demand a plethora of customizable options.
Throughout the remainder of this work, the operations of Skier’s Choice will be
thoroughly investigated. In Chapter 5, a detailed look into the features of the company,
its product and option offerings, its mass customization competencies, and its overall
manufacturing process is given. In Chapter 6, the validity of applying the other strategies
discussed in Chapters 3 and 4 (TOC, QRM, Agile/Leagile, FMS/RMS, Job Shop Lean) in
the context of the case study company will be analyzed. From this discussion, a strategy
for restructuring the manufacturing operations will be chosen, followed by a step-by-step
look and the restructuring process by department. Finally, a simulation will be conducted
comparing the current and future states in order to validate the benefits of restructuring
the plant in the proposed manner
55
5. Case Study – Skier’s Choice
Skier’s choice, a company based in Maryville, Tennessee, is involved in the
manufacture of boats built for water sports such as wakeboarding. This is a market that is
highly specialized and targeted at a rather small group of consumers. Also, as this is
considered a luxury product, market conditions are highly turbulent. Changes in the
status of the economy can have a large effect on consumer demand as opposed to a
product that would be considered more of a necessity. Also, it is imperative that the
producer constantly seek to update their product with improved functions, more options,
and new aesthetic qualities, at least on an annual basis, in order to remain competitive in
such a niche market.
The market for these sport boats has been in existence for over 30 years, but as time
has gone on the design of the boats has adapted to become more specialized specifically
for wake boarding/water skiing. Overall, demand has increased over the last decade, so
the market can be considered to be new and growing.
All manufacturers in this market offer a varying degree of mass customization to
their consumers in the options that can be chosen for the boat. Generally, a manufacturer
will build a certain percentage of boats to be sold at a dealership, with options chosen by
the dealer. These boats usually represent a “middle of the road” model as far as options
and expense are concern. The remaining production will be mass customized items that
were custom configured and individualized by the consumer working with a sales
representative, usually a dealer.
5.1. Brief Company Description
Production at Skier’s Choice began over 26 years ago with their Supra model boat,
one of two base models still built today. Eleven years ago, they added a more basic, less
expensive model called the Moomba. Skier’s Choice has been under its current
ownership for the last 11 years, and during that time has sought to increase market share
by offering high quality products that cater to a wide range of budgets with many
customizable options. This motivation has led the company to become the fastest
growing manufacturer in the market over the last eight years and propelled them to third

56
place in overall market share. These trends of growth and improvement are projected to
continue in the near future.
When walking through the Skier’s Choice facility, one is reminded of the most
traditional and basic manufacturing system, craftsmanship. There is an almost total lack
of automation, with operations being performed by highly skilled and trained team
members. Skier’s Choice has only one facility that manufactures this product, and thus
the employees take great pride in knowing that when they see a Supra or Moomba on the
water, they played a direct role in its manufacture.
Indeed, it is this pride and drive for quality, along with allowing the customer to
choose from many options to fit their needs and budget that has allowed Skier’s Choice
to solidify and strengthen its position in a turbulent market. See Table 1 for an overview
of the company data and contact information.
Table 2. Company Data
Company data
Name Skier’s Choice Address 1717 Henry G. Lane St.
Maryville, TN 37081 WWW www.skierschoice.com Year of foundation 1980
Number of employees 375 Industry Boat manufacture Products Supra and Moomba boats Markets Wakeboarding/Water skiing tow boats,
1,840 unit sales for 2007.
5.2. Mass Customization Product
As stated before, Skier’s Choice offers two base model lines of boats; the Moomba
and the higher end Supra. Within these lines, there are several different models from
which the customer can choose. See Table 2 for a listing of the offerings.

57
Table 3. Skier's Choice Model Offerings
From Table 2 we see that there are 10 distinct models within the Supra line and 6
models within the Moomba line. The main differences between these models are in the
area of horsepower, fuel tank capacity, ballast, length, width, draft, and occupant
capacity. For example, a Moomba Outback, a lower end model, features a length, width,
and draft of 22’8”, 94”, and 24”, respectively, as well as a 40 gallon fuel tank, seating
capacity of 10 people, and ballast options of 400 and 1200 pounds. The higher end
Moomba Mobius Gravity XLV, on the other hand, has a length, width, and draft of 25’,
98”, and 26”, respectively. This boat also features a 40 gallon fuel tank, seating capacity
of 16 people, and ballast options of 650 and 1950 pounds.
The more luxurious Supras vary in the same manner, but offer generally larger boats
with lengths varying from 22’10” to 26’, fuel tank capacities from 34 to 52 gallons and
higher ballast and seating capacity on average. All models of Supra and Moomba offer a
5.7L V-8 engine with 325hp except for the Supra Gravity 24 SSV which offers a 340hp
V-8 power plant. See Figures 5.1 and 5.2 for examples of the product lines.
Within the 16 base models of Supra and Moomba boats, there are many different
options that the consumer is able to customize. One of the most highly customizable
areas of the boat is the gel coat pattern, or paint scheme. Within the Supra line there are
37 possible gel coat spray patterns with individual models accounting for 1 to 8 of the
variants (i.e. Gravity 24 SSV has only 1 pattern, 21V has eight possibilities). The
Moomba line has a total of 20 spray pattern varieties with individual models accounting
for 1 to 7 of the variants. Note that these variations take into account only the pattern of
the gel coat spray scheme, not color information.

58
Figure 5.1 Supra Gravity 24SSV
Figure 5.2 Mobius XLV

59
For color options, there are three areas that can be customized, the base gel coat,
main gel coat, and small accent gel coat. The base gel coat offers four color variants,
while the main and small accent gel coats each offer 15 distinct choices.
Besides gel coat schemes, there are many other customizable options for each boat,
including engine option (engine size, salt water cooling system, etc.), appearance options
(teak platform, docking lights, etc.), canvas options (tonneau cover, cockpit cover, etc.),
audio/video options, performance options (tower w/ mirror bracket, Gravity III-d ballast
system, etc.), trailer options (galvanized frame, 18” chrome wheels, etc.), and other
miscellaneous options such as an automatic fire suppression system.
5.3. Mass Customization Operations
According to the classification method developed by Duray et. al. (2000), Skier’s
Choice can be classified as an assembler in that the customer is allowed to configure their
product by choosing from a selection of options. Standard modules (the product models)
are used as a baseline and specific customer needs are taken into account in the assembly
and use stages. The company incorporates a combination of make-to-stock and make to
order production, the former being sent to dealerships based on forecasted demand while
the latter is configured through customer-dealer interaction and made-to-order.
While Skier’s Choice delivers a state of the art product to its consumers, their
manufacturing capabilities are anything but. They are very proficient in the area of
product development as is evident from their frequent model changes and upgrades;
however, in the area of manufacture their greatest asset is worker skill. The production
line uses the traditional push system, and a manifest moves along with the boat to
indicate its model and options. Orders are released to the floor on a daily basis based on
a monthly production schedule. Load leveling and hiejunka are not taken into account
when making the schedule.
In order to fully understand the complete operation of Skier’s Choice, its activities
can be broken down and analyzed based on the mass customization competencies
outlined in Chapter 3.

60
Production Competencies
Manufacturing System Configuration
The manufacturing system at Skier’s Choice is set up as a traditional moving
assembly line with various feeder lines. All feeder lines are functionally arranged by
department. The main components of each boat; the deck and hull, move in a linear
manner through lamination, rigging, final assembly and inspection, while components
such as upholstery and small parsts sync up with the product along the way.
The ability to handle high variety at Skier’s Choice comes from the flexibility of its
work force instead of the utilization of advanced and costly tooling. There is, however,
an opportunity to improve the flexibility and responsiveness of the feeder lines by
restructuring and combining departments to create a cellular manufacturing process.
While modular minicells are likely unnecessary for this particular application, the system
would surely benefit from the use of some traditional lean cells. This is discussed in
further detail in Chapter 6.
Process Modularity
Process modularity is in use in nearly every process at Skier’s Choice. While each
successive product is significantly different than the last, the subset of steps for
completion of a particular process is similar, if not the same, for each product. For
example, in lamination, each boat must have its mold prepared then be gel coated. The
gel coat process involves spraying several different layers of a gel paint substance into
the mold, with each layer being of different color, thickness, and shape. This is the point
of variety explosion in the manufacturing process. To re-quote Swaminathan (2001) and
Selladurai (2003), a modular process is “…one where each product undergoes a discrete
set of operations making it possible to store inventory in semi-finished form and where
products differ from each other in terms of the subset of operations that are performed on
them.” The gel coat process follows this definition in that the basic set of operations
performed on each boat is standard, while the details of each operation differs.
Essentially all of the processes at Skier’s Choice follow this trend.

61
Dynamic Production Planning
Dynamic production planning refers to the ability of a firm to maintain low lead times
while enabling customizability. Skier’s Choice is a combination make-to-stock/make-to-
order operation, and managing both of these components while also controlling work in
process (WIP) on the floor and limiting over/under utilization of people and equipment is
important to the operation. That being said, Skier’s Choice has no means of WIP control
save floor space in the plant, nor does it have any clear picture of cycle times in any of its
processes that could be used to predict capacity requirements. This makes dynamic and
efficient production planning virtually impossible. By gathering some basic data on
cycle times, and cycle time variation, as well as implementing some WIP control
measures, Skier’s Choice could greatly improve their production planning capabilities.
Organizational Learning and Continuous Improvement
Organizational learning and continuous improvement is an area where Skier’s Choice
is actively seeking to improve. They have given classes to every team member in the
plant on the basics of lean manufacturing principles and practices, and assigned lean
projects (such as 5S) to teams made up of members from all levels of production, from
team members to managers. They have also created clearly defined teams with team
leaders and group leaders on the shop floor, and are continuing to give more advanced
classes in lean manufacturing, as well as assigning more involved improvement projects
to the employees. It is evident that Skier’s choice is committed to change and has begun
by seeking to educate their entire workforce of the value of learning and improvement.
Other Competencies
Information Technology and Customer Interfacing
Information technologies are also lacking at Skier’s Choice. Materials requisition is
not accomplished by a computerized system, but rather by a team of employees that are
charged with constantly updating parts inventory information and ordering what will be
needed for the next month’s schedule. Typical lead time for supplier parts is four weeks.
There is no method for visually representing the status of the production line to combat

62
problems, and individual departments within production cannot efficiently communicate
what is needed. These factors all combine to create a rather lengthy lead time of four to
six weeks. As a mass customizer, Skier’s Choice must seek to offer much faster lead
times to their consumers.
Product Development
Skier’s Choice undergoes a model change process every year during the summer and
fall seasons in preparation for the upcoming boating season. These model changes often
involve significant alterations to boat size and shape, paint schemes, and option offerings.
Due to the frequency at which model change occurs, the product development cycle at
Skier’s choice, from design to production, is well defined and provides for smooth
transitions from one model to the next. Model change has the largest effect on the
rigging and assembly lines where the majority of the major components and option work
are added, and the employees here are well trained and readied to transition to the new
product and produce it efficiently and correctly.
Logistics
Logistics is an area where Skier’s Choice has both strengths and weaknesses. The
plant is located in somewhat of a boat manufacturing center, and thus many component
part suppliers are located within a small radius of it. The tower manufacturer, for
example, is located within a half mile of the factory, while the trailer manufacturer is next
door. This enables Skier’s Choice to maintain close supplier relationship and low
inventories for many of its component parts.
The materials requisition and ordering system at Skier’s Choice are very outdated,
however. There is no computerized system such as MRP in place. For parts requisition,
there are various managers assigned to different aspects of the manufacturing operation.
These managers use a paper booking system to know what parts are present in the
warehouse, what is being used and will be used on the shop floor, what will be needed for
manufacture in the next period. By this system, parts are ordered on average every 2-6
weeks.

63
The nature of this system makes it anything but dynamic, and does not allow Skier’s
Choice to take full advantage of the close proximity of many of its suppliers.
5.3.1. Manufacturing Operations
In order to fully understand the nature of the manufacturing process at Skier’s Choice,
a basic process map is given in Figure 5.3, followed by a detailed description of the
operations.
Deck/Hull Molding
Grinding Initial Inspection
Small Parts Molding
Plastics
Upholstery
Rigging Final Assembly
Inspection/Lake Test
Final Finish
Skier’s Choice Basic Process
Map
Lead Time: 6 weeks
Figure 5.3 Basic Process Map
Lamination
The process begins in the lamination department where the deck and hull
components are molded. Mold prep is the first operation, where matching deck and hull
molds are selected and taped off according to the customizable paint scheme ordered by
the customer. From there, gel coat is sprayed onto the mold in multiple colors and
thicknesses according to the scheme laid out by mold prep. After drying, another coat of
“barrier coat” is added for strength and allowed to dry. Next fibreglass resin is sprayed

64
onto the molds along with fibreglass sheeting called bulk, and a coat of core spray is
added. Once this last coat has dried, the empty cavities of the mold are filled with foam
which hardens for strength, and then the molds are pulled and sent to a grinding booth
where excess material is removed and holes cut for future component parts to be added.
Small Parts
The small parts department operates in a similar manner to that of lamination, but
creates simpler, smaller parts to be installed in various stages of production. It supplies
parts that are installed in the lamination line, such as the floor component, as well as
some that are installed later in final assembly, as with the motor cover. The process again
begins with mold prep, and is followed by a single gel coat. The major difference is that
after gel coat the fibreglass resin is added and once dry the mold is pulled and sent to
grinding, completing the process. The barrier coat, core spray, bulk, and foam are not
necessary in the construction of these parts.
Plastics
The plastics department is functionally arranged and consist of several machines that
would be commonly found in a wood shop, such as table saws, routers, and mitre saws.
The purpose of this area is to create a large variety of simply shaped plastic pieces which
are cut from 4’x8’ sheets of raw material. The finished parts are supplied to various areas
of the plant, but their main function is to provide structural support for components added
in assembly, and frames for components made in the upholstery department such as seats.
It is a make-to-stock operation with a large storefront of finished parts. Each type of
part is stored in a rack with a minimum level denoted. Team members in the area make
parts to restock each part type when it nears its minimum level using the machines and a
large variety of available jigs. Because of the large variety of parts made here, and the
nature of a make-to-stock operation, inventory contained here is enormous.
Upholstery
In the upholstery department, parts are acquired from the plastics store front and
assembled into frames based on the specifications of the boat. Foam, which comes

65
roughly pre-cut from the supplier, is then glued to the frames and excess foam is
removed. Meanwhile, a CNC cutting machine, the only computerized equipment in the
plant, cuts out pieces of vinyl based on the size, shape, and color required by the boat
specifications. Once these pieces are cut, they are sorted and sent to a sewing department
where team members sew the various pieces together to create a skin. Lastly, the skins
and frames are matched, and the skins are pulled over the frames and stapled before being
sent to various stages of final assembly.
Rigging and Assembly
After leaving lamination, the deck and hull components are briefly inspected and any
blemishes from the molding process are repaired. The deck and hull are also mated to
ensure proper fit. From there, boats are split by model (Supra or Moomba) and sent to
separate lines where decks and hulls run parallel to each other. In the next few processes,
interior components such as bilge pumps, the engine, and wiring are added, as well as
underwater gear such as propellers.
Next, the deck and hull are mated permanently together and the boat undergoes a
series of final finish processes, where components such as seats, the windshield,
instrument panel, the tower, lighting, and the speaker system are installed based on the
options specified by the consumer.
Inspection
The last stage of the manufacturing process is inspection. Here, boats are removed
from the plant and placed in a small pool where it is checked for leaks and the engine is
hot tested. Other aspects are also tested such as the sound system, steering, and
instrumentation. Each boat is then placed on its trailer and hauled 20 minutes each
direction to a nearby lake where employees run each boat through a series of tests
designed to put it through a wide range of operations and fully inspect its functionality
and performance. After testing is complete and the boat approved, it is hauled back to the
factory where it is cleaned, and final components are added such as decals and
compartment covers.

66
5.3.2. SWOT Analysis
To conclude this chapter, a SWOT (strengths, weaknesses, opportunities, threats
analysis) is provided as a capstone to the discussion of the operations and capabilities of
the case study company; Skier’s Choice. Overall, Skier’s Choice is a strong company
with a strong mass customization product. They have a solid hold in the marketplace and
have experienced consistent growth. However, there is much room for improvement in
their manufacturing process which could enable them to obtain higher visibility and
understanding of their system, and allow for shorter lead times, reduced inventory and
workforce, creating a more dynamic and responsive system as a whole. See Figure 5.4
for the SWOT analysis.
Strengths • Strong market niche is present • Solid foothold in market • Knowledgeable workforce • Open to improvement • Non-union • Strong product development
cycle
Weaknesses • No knowledge of cycle
times or capacity • Production planning not
dynamic • No inventory control, low
system visibility • Push system throughout
plant
Opportunities • Improved supplier relations,
some parts delivered JIT • Advancement of materials
requisition system. • IT interfacing with the
consumer, possible use of product configurators
• Continuing education of workforce could lead to great improvement
Threats
• “Pleasure craft” market, fluctuates highly with state of economy.
• Technological advancement of competitors’ manufacturing systems could cause SC to fall behind
Figure 5.4 SWOT Analysis

67
6. Experimental Model Development
The theoretical framework for this research has been laid based on the literature
reviewed and the goals of the work, and a detailed overview of the case study company
has been provided. The next step is to systematically restructure the given case factory
based on the framework provided in Chapter 4. In this chapter, an account of the current
state at Skier’s Choice is provided, followed by a discussion of the validity of applying
the strategies (excluding lean) that have been discussed in an attempt to identify any area
where the need for a supplemental method may be needed due to a failure of lean
principles to provide adequate control for the system. From this discussion, the overall
strategy for restructuring the plant is chosen and each department is reconfigured.
Finally, both the current state and future state are input into simulation software and
performance measures are obtained for the comparison of the systems and measurement
of improvement.
6.1. The Current State
The current state at Skier’s Choice is typical of the mass production environments.
At first this does not seem to be the case when observing the manufacturing line as this is
a relatively low volume producer, however closer inspection reveals that most of the
same faults of mass manufacturing are present. One of the first things one will notice is
the lack of any kind of pacing of the assembly lines, which is evident even with the long
processing times. There is no inventory control in the system leading to WIP piling up in
front of some processes, and others being starved.
Overall, there is little control over the system as a whole, and even less visibility.
There is a lack of any kind of visual management and processes often seem to run
together. Employees also have little knowledge of line pacing, making them unable to
know whether they are ahead, behind, etc. The amount of WIP on the shop floor is large
in comparison to the daily volume the plant produces, and this WIP amounts to a
significant cost given the relatively high cost of products in this market.
Also of note is the fact that for the vast majority of the production process the main
body of the boat is in two pieces which must be matched late in the assembly stage.

68
Upholstery parts are also custom made for each particular boat. Obviously if these
components are not ready the assembly is halted, yet there is no clear method of
sequencing each section and correctly matching the components to the correct boat.
During the course of the initial investigation it was quickly discovered that there was
no quantitative knowledge of processing times in the factory. In order to obtain this
information, a tagging process was employed to gain information on the processing times
for several different boat models. While the products of Skier’s Choice can be
configured in thousands of ways and processing times vary, the data obtained from this
sampling activity provides a reasonable representation of the actual cycle times. See
Figure 6.1 for a current state value stream map generated from the process mapping and
data collection activities conducted at Skier’s Choice.
6.2. Discussion of Applicable Approaches
Prior to a detailed discussion on the restructuring of the operations, it is necessary to
examine all the manufacturing strategies discussed thus far and choose those that will
serve best for improving the performance of the system. In this section a discussion on
the applicability of each of these other strategies is given in the context of their ability to
be integrated with lean principles in improving the overall flow and lead time in the
system.
Agile/Leagile
At Skier’s Choice, the use of postponement is not an option as the variety explosion
occurs early in manufacturing at the gel coat process. When customers choose their base
model of boat and the gel coat scheme and color options, they are affecting the first two
operations in the manufacturing process, thus creating high variety at the beginning of
manufacturing. There is no possibility of restructuring the order of operations to
postpone variety in this case, as the decks and hulls which must be molded and painted
are the very foundation of the overall product and all downstream operations depend on
them. For this reason it is apparent that the use of a decoupling point, at least in the

Figure 6.1 Skier's Choice Current State VSM
180
Daily
Moomba Deck
C/T
S/U
195/255
0
6
Moomba Hull
C/T
S/U
195/2550
8
Cap & Rail
C/T
S/U
65/75
0
3
Final Assembly
C/T
S/U
260/340
0
8
Daily/Weekly/Monthly
Skier’s ChoiceMRP Production Control
Suppliers CustomersWeekly Orders
Monthly/Quarterly Orders
Customized Individual Orders
Monthly Make-to-stock Dealer OrdersPurchasing
ReceivingWarehouse
Mold Prep
C/T
S/U
20/35
0
5
Skinning
C/T
S/U
40/50
0
5
Gel/Barrier Coat
C/T
S/U
40/60
15
10
Core Spray/Bulk
C/T
S/U
40/50
0
10
Finish
C/T
S/U
35/55
0
9
Pull
C/T
S/U
30
0
3
Grind/Hole cut
C/T
S/U
50/65
0
14
Inspect
C/T
S/U
40
0
5
LAMINATION (3 Parallel lines; one deck line, one hull line, one deck/hull line)
Mold Prep
C/T
S/U
20/25
0
2
Gel Coat
C/T
S/U
30/40
15
3
Skinning
C/T
S/U
30/40
0
7
Pull
C/T
S/U
20
0
3
SMALL PARTS FEEDER
Vinyl Cut
C/T
S/U
30
15
4
Sewing
C/T
S/U
45/65
0
8
Plastic Cut
C/T
S/U
20/30
5
4
Foam
C/T
S/U
30/45
0
4
Upholstery Assembly
C/T
S/U
40/55
0
22
Upholstery Feeder
Supra Hull
C/T
S/U
240/300
0
7
Supra Deck
C/T
S/U
240/300
0
8
Cap & Rail
C/T
S/U
80/100
0
3
Final Assembly
C/T
S/U
320/380
0
10
Pool Test
C/T
S/U
35
0
1
Lake Test
C/T
S/U
40
0
3
Detail/Decals
C/T
S/U
30/40
0
6
Shrink Wrap
C/T
S/U
30/35
0
6
Rigging/Assembly/Inspection
Finished Goods Staging
Weekly Order BucketsTo Stations
LEGEND
Inventory
Push Production
Material Flow
Pull Production
Manual Information
Electronic Information
Pulse Production
Supermarket
Deliver by Truck
20/35
3
13540/60
3
40/50
1
4540/50
2
9035/55
22.5
.5
13530
112.5
2.5
50/6590
2
40
5
225
6
4
20/2545
1
30/40
4
18030/40
0
0
20450
3
135
4
35
4
18040
5
22530/40
6
27030/35
Supra Mfg. Lead Time (best/worst): 2285 min. (45.17 hr.) / 2530 min. (49.67 hr.)
Moomba Mfg. Lead Time (best/worst): 2260 min. (45.59 hr.) / 2550 min. (50.00 hr.)
3 Processes
3 Processes
3 Processes
3 Processes
4 Processes
4 Processes
8 DaysInventory for
Lamination: 6 Days
69

70
context of the manufacturing operations which are the focus of this research, is
impossible.
While being agile is certainly a desirable feature for mass customizers in terms of
responding to markets, the inability to employ a decoupling point and the lack of tools
and methods for making a manufacturing system agile makes these two strategies
unviable for application at Skier’s Choice.
Job Shop Lean
Value stream mapping has already been shown to be useful for gaining a system
perspective at Skier’s Choice in Figure 6.1, and Job Shop Lean advocates the use of this
tool. However, at this point, this strategy seems rather undeveloped from the literature
reviewed and its full merits are yet to be known. However it is known that Skier’s
Choice is a mass customizing manufacturer, not a job shop. Skier’s choice does have a
set of base models from which all their products are created, and thus a strategy intended
for job shops is not highly applicable.
Flexible/Reconfigurable Manufacturing Systems
These equipment design strategies will be useful in many cases for reducing setups
and changeovers; however, they are of little value in the context of Skier’s Choice. The
process of manufacturing a boat in this company is almost wholly manual in nature, the
only automated process being a CNC cutting machine for cutting out vinyl in the
upholstery department. The only changeover for this equipment is changing out the vinyl
colors and the only setup required is programming the cutting parameters for the next
boat, thus there is no need to employ an FMS/RMS here. The rest of the manufacturing
processes require little more than basic hand tools to complete, thus installing expensive
FMS/RMS systems is totally unnecessary and unviable for Skier’s Choice at this point.
Theory of Constraints (TOC)
While TOC is a stronger and more complete strategy than those mentioned thus far in
the context of system control for the manufacturing system, its weakness lies in its

71
reliance on the existence of a stand-alone and at least somewhat consistent constraint in
the system. As a mass customizer with high variability in work content, Skier’s Choice
faces the problem of inconsistent cycle times in many of its processes. Indeed, through
investigations of the cycle times in the tagging process it was found that a single
significant and consistent constraint to throughput could not be determined. This means
that the constraint is likely to shift on a boat by boat basis.
The ability of TOC to control flow and WIP in the system will be greatly diminished
in this situation of a frequently shifting constraint, as it will be very difficult to control
the system based on a single process when this constraint to throughput is constantly
moving. This is a problem that will be faced by many mass customizers like Skier’s
Choice. While TOC as a whole is a solid method for systems control in manufacturing,
the high variability faced by Skier’s Choice will make it difficult to apply the strategy.
Quick Response Manufacturing (QRM)
QRM can be a viable strategy for mass customizers to employ, and the POLCA
(paired cell-overlapping-loops of-cards-with authorization) system can aid in
manufacturing that involves many complex routings. Its focus on lead time reduction can
be compared to lean’s focus on waste reduction, while the POLCA system is comparable
to the kanban system of lean. Thus it is important to decide which of these strategies is
most viable at Skier’s Choice.
The kanban and CONWIP systems are meant to handle for the most part linear
product routings from one process or cell to another, while POLCA provides for many
different possible routings from one product to the next. When examining the operations
at Skier’s Choice, it is apparent that all boats undergo the same product routing from
beginning to end, while each process along that routing differs from one boat to the next.
Because POLCA is a robust system for high routing variation, it can be a somewhat
complex system to operate and should not be unnecessarily implemented. The degree of
linearity and small number of departments/cells at Skier’s Choice imply that POLCA is
not needed and that kanban will suffice.
The lead time reduction aspect of QRM, however, is a focus that can and likely
should be implemented as a performance measure. Skier’s Choice can combine lean

72
manufacturing and QRM by encouraging departments to reduce both lead times and
waste in order to seek continuous improvement.
Having discussed the applicability of each of these other strategies to the operations
of Skier’s Choice, it is apparent that in this particular situation lean manufacturing is the
best choice for seeking improvement to system performance. Each of these other
strategies has their own strengths and weaknesses and can support lean manufacturing in
improving mass customization operations in their own right. In the following sections,
combinations of lean principles such as kanban and CONWIP will be employed in order
to restructure the manufacturing system at Skier’s Choice on a department by department
basis.
6.3. Restructuring the Operations
The main concern at Skier’s Choice is the improvement of product flow and
reduction of lead time across the system. Various lean principles such as kanban,
CONWIP, just-in-time, and others are used to facilitate the transition to a lean system.
6.3.1. Lamination Shop
The lamination shop (see Figure 6.2) is where the boat manufacturing process begins.
Most of the major issues with this line relate to flow, inventory control, and visibility.
Currently Skier’s Choice runs three parallel lines, one for hulls, another for decks, and
another which essentially works on any deck or hull that is available. It is entirely a push
system building to a schedule of boats to be started on a particular day, and there is little
visibility of the current status. There is no means to visually deduce which deck matches
which hull and what their current status is in terms of processing. First-in-first-out
(FIFO) is often not maintained which results in products getting off schedule. Also, the
physical layout of the line itself makes it difficult to see the actual flow of work and what
processes are behind or ahead. Because of these problems in the system are not made
obvious and cannot be recognized early and counter-measured as would be done when

Lamination Shop
Gel/Barrier CoatSupra Deck
Gel/Barrier CoatMoomba Hull
Gel/Barrier CoatMoomba Deck
Gel/Barrier CoatSupra Hull
Dedicated Gel Coat Booths
Mold PrepSupra
Mold PrepMoomba
CureSupra Deck
CureMoomba Hull
CureMoomba Deck
CureSupra Hull
SkinningSupra Deck
SkinningMoomba Hull
SkinningMoomba Deck
SkinningSupra Hull
CureSupra Deck
CureMoomba Hull
CureMoomba Deck
CureSupra Hull
Core Spray/BulkSupra Deck
Core Spray/BulkMoomba Hull
Core Spray/BulkMoomba Deck
Core Spray/BulkSupra Hull
Pulling Supra
GrindingSupra Deck
GrindingMoomba Hull
GrindingMoomba Deck
GrindingSupra Hull
Cap & PaintMoomba
Cap & PaintSupra
Dedicated areas of the grinding booth with
floating workers.
FIFO
Dedicated Lamination Lines with Floating
Workers
FinishSupra Deck
FinishMoomba Hull
FinishMoomba Deck
FinishSupra Hull
PullingMoomba
SUPRA CONWIP LOOP
MOOMBA CONWIP LOOP
Matched set of color coded kanban cards
removed after leaving inspection
Matched set of color coded kanban cards
removed after leaving inspection
Set of Kanban cards return, one of each
attached to deck/hull molds. Serves both
purposes of matching and inventory control.
Set of Kanban cards return, one of each
attached to deck/hull molds. Serves both
purposes of matching and inventory control.
Mold prep cannot begin next job unless a kanban
card set is available.
Cap & Paint cannot work on a job unless both hull
& deck with matching cards are available.
Within the line, jobs are pushed, Kanban cards in the CONWIP loop control
overall inventory.
InspectionSupra Deck
InspectionMoomba Hull
InspectionMoomba Deck
InspectionSupra Hull
Figure 6.2 Lamination Shop
73

74
the principle of jidoka is employed. The ability to immediately and visually understand
the status of the shop floor is important to any system, lean or otherwise, but the current
structure in the lamination shop does not allow for this, nor does it have any means of
flow and inventory control.
For the restructuring of the lamination shop the proposed system involves the lean
principle of dedication for the Supra and Moomba product lines and the use of a
CONWIP method to control WIP. First, the physical layout would be changed to allow
for four parallel lines instead of the current three. One line each will be dedicated to
Supra decks, Supra hulls, Moomba Decks, or Moomba hulls. The reasoning behind this
change to four lines is to allow the deck and hull for each boat to run parallel to one
another, which will allow employees to quickly know where one component is in
processing in relation to the other. Also with these dedicated lines product variation will
be less because each line works only on a deck or a hull for a particular product line, thus
the processes become more stable and standardized. Utilizing jidoka becomes more
viable because delays can quickly be recognized and counter-measured.
To control inventory in the lamination shop, CONWIP loops for the Supra and
Moomba lines can be employed. CONWIP excels over kanban in manufacturing systems
that are linear and face variable cycle times, as is the case here. The CONWIP system
can also help with the key issue of matching decks to hulls in each pair of product lines.
At the end of the lamination line the deck and the hull for each boat undergo a process of
pre-fitting to make sure the molds come together as they should, meaning this process
requires both components to be present. To enable the quick matching of decks and
hulls, a set of two CONWIP cards can be employed as opposed to a single one, and the
principle of visual management can be used to color code each set of cards. Thus, in
order for the first process, mold prep, to start on a boat, a set of color coded cards must be
available, and are attached to the deck and the hull. Information contained on the card
should include boat model and number for further verification purposes. Once a set of
cards has been attached to a deck and hull, it travels along with the components through
the lamination line to the final inspection process. Here team members can quickly
match the deck and hull based on the color coded CONWIP cards and perform their
operations. Finally, after the process is complete the boat exits the lamination line, and

75
the cards are detached and physically returned to the mold prep station. See Figure 6.3
for an example of these CONWIP cards.
By dedicating lines to product type and decks/hulls, the processes will be more
standardized and the visibility in the system increased enabling problems to be
recognized and resolved sooner.
The employment of the CONWIP system allows overall WIP to be capped while still
using push within the system to help reduce the effect of variable work content. It also
helps with matching each deck to its respective hull. The optimal number of these sets of
CONWIP cards for this shop is not yet known, but is investigated further using a
simulation of the restructured system later in the chapter.
SUPRA DECK
1 of xx
Boat NO. HFL07
Model: Gravity 24 SSV
SUPRA HULL
1 of xx
Boat NO. HFL07
Model: Gravity 24 SSV
Cards can be laminated and washable markers
used to update boat number and model.
Figure 6.3 Lamination Shop CONWIP Cards
6.3.2. Small Parts Department
The problems of lack of visibility and poor inventory control present in the
lamination line also appear in the small parts shop. However, with the small parts line,
the cycle time variation is much less significant, as the processing for the parts from one
boat to the next usually differ only in size and color. This lower amount of variability is

76
made evident from the tagging process conducted in the plant, which also shows that
cycle times are shorter in general than lamination and the line as a whole appears to have
some excess capacity.
It is important to place some sort of control over this line, and the choice again is
between kanban and CONWIP. Due to the lower variation in cycle times and the fact
that this feeder line has excess capacity, the best choice for control of the system is
kanban. Part specific kanban is not an option due to the high number of models
manufactured, so route specific kanban is the obvious choice. Route specific kanban
squares placed on the factory floor can serve as a visual management aid to cap WIP in
the system, meaning a process does not have authorization to produce unless there is an
empty kanban square. Since each boat requires multiple parts from the small parts line it
is also desirable to employ kitting at the end of the line. Kits can be created as a very
visual means of showing what parts are yet needed to produce a finished boat of a
particular type, with a full kit indicating completed processing of a boat for the small
parts line. A simple tag can be attached to each kit to give the boat number that it
belongs to. Lastly, the small parts department should be realigned to contain two parallel
manufacturing lines, with one manufacturing small parts for Supra and the other for
Moomba. This again allows for more stability and standardization in the processing.
The restructured small parts line is intended to operate very similar to the restructured
lamination line. As in lamination, manufacturing lines specific to product type run
parallel to one another. By using route specific kanban the WIP in the small parts line is
capped and it can operate on a pull system with lamination pulling finished kits of parts.
With this system, interaction between small parts and lamination will be smoother,
overall visibility of the current status is improved, and the level of standardization from
one product to the next is increased. See Figure 6.4 for a representation of the
restructured small parts line.
6.3.3. Upholstery Department
For restructuring this department, the employment of dedicated work cells is the best
route for Skier’s Choice to take. They have already taken the initial steps to do this in
that they have defined the number of cells and the parts that will be manufactured in each

77
of them. They call these cells stage 1, 2, and 3, based on the point at which the
components that are made in the cell are actually installed during the final assembly
process. While this is an important initial step for the department, it can certainly be
taken further.
Small Parts Shop
Mold Prep Supra
Mold PrepMoomba
Gel Coat Supra
Gel CoatMoomba
Skinning Supra
SkinningMoomba
Curing Supra
CuringMoomba
Pulling Supra
PullingMoomba
Route specific kanban squares, kits pulled
through system
Finished small parts kits, pulled to grinding in
lamination.
To Supra Grinding
To Moomba Grinding
FIFO
Figure 6.4 Small Parts Shop
Currently, the work cells include only the processes of sewing, foam, and assembly,
while the plastics shop is a standalone department that works to fill a very large storefront
of finished goods. This shop supplies parts across the plant, but most of its work is done
for the upholstery department. Because of the large variety of plastic parts needed, there
are two solid walls around the plastics shop consisting of sections dedicated to each
possible type of plastic part that is used in a boat. Since the rest of the operations at
Skier’s Choice operate on a make to order basis, there is no reason why the plastics shop
cannot do so as well. In order to accomplish this, it is proposed that Skier’s Choice buy
replicates of their plastic cutting equipment and dedicate them to the stage 1, 2, and 3
sewing cells. While equipment replication is often a considerable obstacle to dedication
and work cells, in this case the equipment required is rather common and inexpensive,
and the gains would far outweigh the costs of equipment. If the equipment is replicated,
the large storefront of finished goods can be eliminated and communication in the cells
increased by completing all processes except vinyl cutting within a cell. A fourth cell

78
with the necessary equipment could also be created to handle demand external to the
upholstery department based on a pull system with kitted parts.
The vinyl cutting process differs from plastic cutting in that the CNC equipment is
expensive and not economical to replicate. This is not a significant obstacle to increased
efficiency in the upholstery department; however, as the basic operation of the vinyl
cutting machine will remain the same. Once the vinyl components needed for each boat
are cut they are sorted and kitted based on their destination of either the stage 1, 2, or 3
cells.
Having established the design of the cells, it is now necessary to impose some form of
inventory and flow control on the system overall and within the cells. When making the
choice between CONWIP and kanban, there are several factors to consider. First, the
upholstery department operates in a fan structure rather than a linear line due to the
shared resource of the vinyl cutting machine and the three work cells and if CONWIP
were employed there would have to be three separate loops of cards. Second, the
upholstery present on each boat is for the most part consistent, differing in color and size
only, thus cycle times are more consistent than in other areas of the plant. Thirdly, like
small parts the upholstery department is a feeder line whose goal is to have a set of parts
ready for use when they are needed by assembly, and thus should be placed on a pull
system linked with assembly in order to have high responsiveness between the two
departments. For these reasons, employing route specific kanban in a similar manner as
was used in the restructuring of the small parts line is the most viable solution.
When employing route specific kanban, it is important to again consider the matching
factor that was present in the lamination line. Here the vinyl skins manufactured through
the vinyl cut process and sewing must be matched with the frames created through the
plastic cutting and foaming processes. Color coded sets of cards can again be used to
accomplish this matching and synchronization. Whenever an order is launched into the
vinyl cut process, a colored card will be attached with the vinyl for that boat. At the same
time, the second card in the set would be placed in a FIFO queue in front of the plastic
cutting process. By operating in this manner, orders are launched for both the frames and
the vinyl at the same time and the cards which are attached to kits of parts can be easily

79
matched in order to mate the two components of each upholstery part in the final
assembly stage.
By operating in work cells, Skier’s Choice can again gain some degree of
standardization in the upholstery processes based on product family, and employing
visual management techniques through the use of kanban squares and color coded cards
will increase the visibility of the system. Responsiveness between upholstery and
assembly will also be greatly improved through the pull system and cell structure. Lastly,
the inventory in the system will be reduced due to WIP capping with the pull system and
the elimination of the make-to-stock operations in the plastic shop. Figure 6.5 shows the
proposed restructuring of the upholstery department.
6.3.4. Rigging and Assembly Line
The rigging and assembly line is the only department in the factory that already has
some sort of inventory control method in place. Skier’s Choice uses what they have
termed a “pulse line,” where no boats move until all processing is complete in the line.
For example, once every process is complete in the Moomba line from rigging 1 to
assembly 4 (see Figure 6.6), every boat will shift downstream by one process. While this
method does effectively control inventory, it can result in an excessive amount of waiting
for those processes that finish earlier than others, and those workers who are cross trained
must move and help with other processes once they have finished their own. For these
reasons it is apparent that a different control mechanism may prove more beneficial to
performance.
Like the lamination line, the rigging and assembly line is linear and faces high work
content variation, thus a CONWIP loop can once again be implemented. Also as in
lamination, the deck and hulls travel separately until the cap and rail process, so there is
again a need for a matching mechanism. This is not currently an issue with the pulse
system because all boats move at the same time, but with CONWIP there will be a push
system in the line and inventory will tend to gather in different areas based on the work
contents of the boats currently in the system. The color coded sets of CONWIP cards can
once again be employed to solve this problem. With these changes in place, the rigging
and assembly line will pull boats from the inspection process in the lamination

Upholstery Shop
Vinyl Cut & Sort by
Stage 1,2,3
One boat at a time, sequenced with
production schedule to match assembly.
Vinyl Kits, 2 Kanban squares per cell.
Two color coded cards with boat number attached to kit.
One card placed in inbound of plastic cut.
FIFO
Plastic Cut& Foam
Sewing
Pulling(Assembly)
FIFO Both cards of the
color set must be present for kits to be
pulled.Assembled Frame Kits
Sewn Vinyl Kits
Finished Stage 1 Kit Kanban to
Assembly
Finished Stage 2 Kit Kanban to
Assembly
Finished Stage 3 Kit Kanban to
Assembly
Stage 1 Cell
Matched pair of Kanban cards are
returned to vinyl cut to be attached to a
new job.
Plastic Cut& Foam
Sewing
Pulling(Assembly)
FIFO Both cards of the
color set must be present for kits to be
pulled.Assembled Frame Kits
Sewn Vinyl Kits
Stage 2 Cell
Plastic Cut& Foam
Sewing
Pulling(Assembly)
FIFO Both cards of the
color set must be present for kits to be
pulled.
Sewn Vinyl Kits
Assembled Frame Kits
Stage 3 Cell
Figure 6.5 Upholstery Shop
80

81
department. There will be a set number of CONWIP cards for the system (which will
be determined in the experimentation section) and in order for a deck and hull to enter the
process one set of cards must be available. Both the deck and hull will receive a card and
travel through their respective lines before the cap and rail process utilizes the matching
cards to mate the deck with the hull. Once the boat has traveled through the assembly
processes and exits the line the cards are detached and sent to the beginning of the line.
This CONWIP system will help to buffer out the issues caused by work content
variation and shifting bottlenecks, while also enabling easy matching of components.
Visibility of the lines’ status will also be increased and problems with work flow made
apparent early. Like the current pulse system CONWIP will also cap inventory but with
the added benefit of being able to handle variability from one boat and one process to the
next. See Figure 6.6 for a representation of the restructured rigging and assembly line.
6.3.5. Inspection Line
The last stage of the manufacturing process at Skier’s Choice is the inspection
process (see Figure 6.7). As with most of the other departments in the plant, the
inspection process has no method of inventory control. The line is fully linear with only
a single routing and all boats undergo the same processing regardless of product line, thus
the processes are shared between Supras and Moombas. The processing in this line is
very simple in relation to others in the plant, and the only real issue with the current
system is a lack of inventory control. While the cycle times for pool and lake testing are
only slightly variable, the tagging data makes it evident that the time required for
detailing/cleaning the boat can vary greatly. For this reason and due to the fact that the
processing is the same across all models, a simple CONWIP loop can serve to cap the
inventory and help to control flow in the system. Since the boats are fully assembled at
this point, there is no need to employ the color coded card matching system used for
restructuring other departments. Figure 6.7 shows the restructured inspection line.

Rigging and Assembly Line
Supra HullRigging 1
Supra HullRigging 2
Supra HullRigging 3
Supra DeckRigging 1
Supra DeckRigging 2
Supra DeckRigging 3
Moomba DeckRigging 1
Moomba DeckRigging 2
Moomba DeckRigging 3
Moomba HullRigging 1
Moomba HullRigging 2
Moomba HullRigging 3
Supra Cap & Rail
MoombaCap & Rail
SupraFinal Assembly
1
MoombaFinal Assembly
1
SupraFinal Assembly
2
Moomba Final Assembly
2
SupraFinal Assembly
3
Moomba Final Assembly
3
SupraFinal Assembly
4
Moomba Final Assembly
4
FIFO
SUPRA CONWIP LOOP
MOOMBA CONWIP LOOP
Matched set of color coded CONWIP cards removed after leaving
final assembly 4.
Cap & Rail cannot work on a job unless both hull
& deck with matching cards are available.
Rigging 1 cannot begin next job unless a
CONWIP card set is available.
Matched set of color coded CONWIP cards removed after leaving
final assembly 4.
Figure 6.6 Rigging and Assembly Line
82

83
Inspection Line
Pool Test Lake Test Detail Decals Shrink Wrap
Inspection CONWIP Loop
CONWIP card removed after boat leaves shrink
wrap.
CONWIP card attached to boat upon entering pool
test.
Within the inspection line, product is pushed.
TO FINISHED GOODS
Figure 6.7 Inspection Line
Over the course of the last few sections lean principles such as CONWIP, route
specific kanban, visual management, dedication, work cell design, and others have been
employed in order to restructure the manufacturing operations at the case study company
Skier’s choice. The goal of these activities has been to improve the performance of the
system by decreasing lead time and inventory and improving the flow of the entire
operation. The remainder of this chapter is dedicated to experimentation procedures
through simulation in order to examine the performance of this new system and analyze
the effect of varying demand and number of CONWIP cards.
6.4. Simulation Model Design
Before any testing of the current or future state model can be carried out it is
necessary to obtain cycle time data for each of the processes at Skier’s Choice. Any
knowledge of how long a particular process took to complete was wholly tacit obtained
from experience by the employees on the shop floor. To resolve this issue a simple
tagging exercise was developed in conjunction with the production engineering
department at Skier’s Choice. Data sheets were distributed across the plant in one of
three different categories; main line, upholstery, and small parts.

84
The main line data sheets included processes for the lamination line, the assembly
line, and the inspection line. Here, the tagging sheet moves with the boat and receives a
timestamp upon the beginning and ending of work for each process. The upholstery shop
data sheets were broken down by cell (stage 1, 2, or 3) and the processes contained within
the cell, and each work item was time-stamped upon the beginning and ending of the
upholstery items for a complete boat. The same was true for the small parts shop, with
one key difference. The amount and type of small parts required varies greatly from boat
to boat, but the two constant items are stringers and floors which are structural
components. Thus, these data sheets were able to give a representation for the variation
of work time by showing the variation in the number and type of parts required based on
boat type, and how long each of these parts took to manufacture.
With this structure in place, data was collected for approximately one week and the
results were compiled in a spreadsheet in order to find the mean, standard deviation,
maximum, and minimum values for each process based on boat model. Table 4 shows an
example of a few data points for Supra boats in the assembly line.
Having obtained all the necessary cycle time information the next step is to construct
a simulation model for testing the new system. The future state model was built using the
program Simul8®. The overall layout of the model is shown in Figure 6.8. The figure is
too large to study in detail, thus a further discussion of the simulation models for each
individual department follows.
Table 4. Example Cycle Time Data

Figure 6.8 Skier's Choice Simulation Model
Rigging/Assembly Line
Inspection Line
Small Parts Line
Upholstery Shop
Lamination Line
85

86
Lamination Line Model
Work begins in the simulation from two work entry points, one for Supra and one for
Moomba. The inter-arrival time is set to an average value based on the demand level that
is to be tested. Once the work is released, it enters a pre-system queue of orders that are
ready to be manufactured on a first-in-first-out (FIFO) basis. The next process is an order
distribution mechanism with a fixed cycle time of zero. The function of this process is to
take an order from the queue and communicate to the feeder lines (small parts and
upholstery) that a particular work item has entered the system and will require component
parts. These processes for Moomba and Supra essentially control the entire system, as
they require a lamination CONWIP card for their specific product type to begin work. If
a CONWIP card is available, they will pull a work item from the queue and split it into
four orders which are sent to the mold prep stations for decks and hulls, the small parts
shop, and the upholstery department for its respective product type. From the mold prep
stations the deck and hull travel through the various processes until they reach the cap
and paint station where they are joined. Following the cap and paint process there is a
buffer with a fixed maximum level (discussed in testing and results section) which
separates the lamination and assembly loops. If this buffer has available capacity the
work item will leave the cap and paint process and the CONWIP card attached to it will
be made available for more work to enter the system. A detailed view of the lamination
simulation model is shown in Figure 6.9.
Small Parts Line Model
The small parts feeder line receives orders from the order distribution processes.
Each order goes to its respective dedicated feeder line based on Supra and Moomba
product types. Again, no products can be launched into the small parts line until the
lamination loop indicates the system is ready based on the presence of a free CONWIP
card. Between each process is a buffer which indicates kanban squares and thus have a
fixed maximum level. This maximum level was determined by observing the minimum
level which prevents starvation of the lamination line in the simulation, which was found

Figure 6.9 Lamination Line Simulation Model
Moomba CONWIP Cards
Moomba Release
Supra CONWIP Cards
Supra Release
87

88
to be 2 for Supra and 4 for Moomba. It was also found by observation that if the
small parts line is started empty as the other departments are, lamination will be starved
at the beginning and the data will be skewed. For this reason, the small parts line is
started with full buffers. The entire line operates on a strict pull system in which no
products are manufactured until the lamination line has pulled components from the end
buffer. At the end of the line, there is a “kit-splitting” process with a fixed zero cycle
time. The purpose of this process is to divide work items created by the small parts line
into two components, one of which goes to the deck line and the other the hull line in
lamination. Figure 6.10 shows the model of the small parts line.
Upholstery Shop Model
Like the small parts line, the upholstery shop receives orders from Supra and
Moomba Order release, the main difference being that this line does not employ
dedicated product lines. Instead, the cell structure presented in the upholstery
restructuring discussion is employed. When an order is received, it is sent into the vinyl
cutting process where all of the vinyl needed for a particular boat is cut out. From there,
the work item is sent into a kit separation which represents the vinyl being split into stage
1, 2 and 3 components. This process takes the single work item from vinyl cut and
creates six work items, 3 of which represent kits of vinyl parts and the other three
representing corresponding orders for frames for the upholstery parts. Thus, orders are
not launched for frames until the vinyl is ready, which aids at balancing the cells and
matching the components together for assembly. For inventory control buffers are again
used as kanbans and set to a maximum level. Since the main concern of this
experimental investigation is the main line including lamination, assembly, and
inspection, these buffers were set to the minimum level to prevent starvation of the
assembly line, which was found by observation to be 3. Figure 6.11 shows a detailed
view of the upholstery shop simulation model.

Figure 6.10 Small Parts Line Simulation Model
To Supra Deck/Hull Lamination
To Moomba Deck/Hull Lamination
From Supra Order Distribution
From Moomba Order Distribution 89

90
Figure 6.11 Upholstery Shop Simulation Model
Assembly/Rigging Line Model
The assembly and rigging line receives work items from the buffer after the cap and
paint process in lamination. At the beginning, a splitting process (with a fixed cycle time
of zero) splits decks and hulls which were combined in the cap and paint process back
into individual components. This process cannot bring any work items into the line
unless there is a CONWIP card available for its respective product type.
Once this condition is met and the decks and hulls have been separated they travel
down their respective rigging line before being joined for good in the cap and paint
process. The boat then travels through the four final assembly stages along with its
CONWIP card. During final assembly 2, 3, and 4, upholstery kits are pulled from
upholstery cells 1, 2, and 3, respectively.
From Supra/Moomba Order
Release
To Final Assy.

91
Since upholstery does not have dedicated Supra and Moomba product lines, it is
important to constrain the simulation model such that Moomba upholstery parts are not
placed in Supra boats. To accomplish this, the assembly in these processes is
conducted on a matching basis. Upholstery parts and boats are mated based on a
unique identification label. This “Label Unique ID” is set from the order release
processes, and the processing on the work item cannot be completed unless the
upholstery part with the required identification is available.
Once all of the processing in the final assembly stage is complete, the boat exits into a
buffer between the assembly and rigging line and the inspection line. Through
observation it was found that these buffers never grow in size but are usually starved for
work due to the inspection line being faster than the assembly line. For this reason, no
capacity restriction was placed on the buffers. Figure 6.12 shows the detailed view of the
assembly/rigging line model.
Inspection Line Model
The inspection line gathers work items ready for final processing from two queues,
one being Supra final assembly and the other Moomba final assembly. The WIP in the
inspection line is wholly controlled by its CONWIP cards. A work item cannot enter the
line from one of the aforementioned buffers unless a CONWIP card is available, and the
CONWIP card is freed for more work to enter the line only upon the completion of work.
The first process in the line, lake test, chooses which queue to pull from based on time in
the system. Essentially, the work item that has been in the system the longest from either
queue is pulled, which maintains FIFO. The detailed view of the inspection line
simulation model is shown in Figure 6.13.
With the addition of the inspection line, the entire manufacturing system at Skier’s
Choice has been successfully modeled based on the restructured departmental setups
presented in Section 6.3. This model can now be used to test the performance of the
system with respect to the current state, as well as test the effect of and optimize the
number of CONWIP cards in the system. Simul8 gives many performance measures
which can be used to understand the system as a whole and choose the best combination
of different types of variables in order achieve the desired performance improvements.

Figure 6.12 Assembly/Rigging Line Simulation Model
Receive parts from stage 1, 2, and 3
upholstery cells. From Lamination
To Inspection
Supra CONWIP Cards
Moomba CONWIP Cards
92

93
Figure 6.13 Inspection Line Simulation Model
6.5. Experimental Design
A set of experiments was designed to test the simulation model and determine
optimal values for various parameters including the number of CONWIP cards in each
loop. Responses variables that are of key interest to this experimentation are lead time
and work in process. In order to fully test the performance of the system based on these
responses under different demand scenarios and CONWIP card amounts, an approach
similar to that used in a mixed-level factorial design of experiments was employed.
The first step in designing the experiment is to determine the variables that will be
changed over the course of the experiment. The main areas of interest in the system are
the lamination line, assembly/rigging line, and the inspection line, as these departments
make up the main line and determine the overall throughput of the system. Through
observation appropriate buffers between the small parts and upholstery departments and
the main lines which they feed were placed in order to prevent starvation. Since lead
time through the system is a key performance indicator, it is logical to elect the CONWIP
card levels of each of the main-line departments as three factors that must be varied in the
system, while ignoring the feeder lines as a limiter to throughput.
Inspection CONWIP Cards
Work Complete From Final Assembly

94
The fourth variable that is changed in the experiment is the demand level. Skier’s
Choice feeds a seasonal market as demand will tend to be higher in the warmer parts of
the year, thus they face a cyclical demand scenario as is the case with many mass
customizers. Because of the relatively low volume of the operations, a small increase in
demand can cause a significant effect on the performance of the system, and it is
important to test the ability of the new system to handle this variability.
With the experimental variables chosen as demand level and amounts of CONWIP
cards in each of the three loops, the next step is to determine the levels of each of the
factors that will be tested in the experiment. When setting the number of levels for each
factor, it is important to keep the number of experiments to a reasonable level while still
showing accurate results. Of the three CONWIP loops, lamination and assembly/rigging
have the greatest affect on the system, as observation of the simulation shows that the
inspection loop is often waiting on work from the assembly line. Thus the inspection line
CONWIP card factor is given two levels, while the lamination and assembly/rigging
loops are given three levels in order to analyze their effect on system in more detail. The
demand factor is given two levels in order to represent the cyclical periods of higher
demand in the spring and summer months and lower demand in the fall and winter.
The demand was varied between two levels one of which represents the fall and
winter months and corresponds to a 96 minute inter-arrival time for Supras and an 80
minute inter-arrival time for Moombas. To represent higher demand in the spring and
summer months, the daily demand on the system is raised by two boats; one Supra and
one Moomba (18% increase in daily demand). With the higher demand of six Supras and
seven Moombas daily, the inter-arrival times at the work release points are set to 80 and
68 minutes, respectively.
When setting the number of CONWIP cards in the lamination loop, the number of
processes must be taken into account. For a CONWIP loop the minimum number of
cards is generally considered to be the number of processes in the loop. Both the Supra
and Moomba lamination lines have 10 processes (excluding curing processes), which is a
reasonable initial level of cards to set. To take into account the slightly higher demand of
Moomba products over Supra, the card count for the Moomba lamination line is raised by
one card to 11. For the medium and high levels of the factor, both Moomba and Supra

95
card values are raised in increments of two, to 12 and 13 for the medium level and to 14
and 15 for the high level, respectively.
For determining the levels of the CONWIP cards in the assembly/rigging lines, a key
observation from running the simulation that must be taken into account is the fact that
these lines run slower than the lamination and inspection lines and usually end up
blocking/starving them. While the assembly/rigging lines have only 8 processes as
opposed to the 10 of lamination, it is advisable to set the lowest level of cards to a higher
value than the number of processes to take into account the bottleneck effect. Thus, the
amount of CONWIP cards for Supra is set to 11 while the Moomba value is set to 12,
with Moomba again having one more card due to higher demand. For the medium and
high levels, the values are once again raised in increments of 2 for a total of 13 Supra and
14 Moomba and 15 Supra and 16 Moomba respectively.
There are six processes in the inspection loop, thus the number of CONWIP cards
was varied from 6 to 8. Table 5 summarizes the variables and levels set for the
experimentation. The notation that is used here and for further discussions is (0) for the
low level, (1) for the medium, and (2) for the high.
Table 5. Variables and Levels of Experiment
Summary of Variables and Levels
Levels Low (0) Medium (1) High (2)
Supra Moomba Supra Moomba Supra Moomba
Var
iabl
es
Inter-arrival Times (Minutes) 96 80 N/A N/A 80 68
Lamination CONWIP Cards 10 11 12 13 14 15
Assembly CONWIP Cards 11 12 13 14 15 16
Inspection CONWIP Cards 6 N/A 8
The warm up period for the simulation is the time set to allow the system to fill with
work and reach steady state operation. Simul8 has a function that will inform the

96
operator if warm up and results collection periods are too short to truly show system
performance. Through the use of this tool and observations and testing, an appropriate
warm up period was found to be 5,000 minutes or roughly two work weeks. The results
collection period was set to 10,000 minutes or approximately four work weeks.
6.6. Testing and Results
Based on the variables and levels described above, the statistical analysis program
NCSS is used to create a test matrix. From the test matrix, the CONWIP cards and inter-
arrival times are set up based on the levels of each treatment and the simulation run for
results collection. The performance measures of interest that results are collected for
include average lead time, total WIP in the system, average WIP in each CONWIP loop,
average amount of orders waiting to be manufactured in the pre-system queue, and
average amount of boats completed. All of the results are collected based on averages
from a five trial replication with a base random number set of one. Table 6 summarizes
the test matrix and resulting performance measures. When examining the results of the
experiment it is worthwhile to consider the two levels of demand separately, as demand
level will have a great effect on system performance.
Examining the table from left to right, it is evident that the WIP levels in the
lamination, assembly/rigging, and inspection loops are simply a validation of the number
of CONWIP cards in the loop. The value for WIP is consistently equal to the total
number of cards for Supra and Moomba in each respective loop, which shows that the
CONWIP cards are accomplishing their objective of limiting the total inventory in the
loop. The total system WIP is simply the sum of the three CONWIP loop inventories,
and as expected increases as the number of CONWIP cards increase.
The pre-system WIP column corresponds to the total amount of boats (Supra and
Moomba) waiting to be launched into the system. Again, this response measure behaves
as expected, as it decreases with increasing CONWIP cards indicating more WIP in the
system and less waiting to be launched. An important observation is that this queue is
large compared to the boats completed over the time period of the simulation, especially
for the high demand case.

97
Table 6. Experimental Results
Case
No.
Variables RESPONSES (Random Number Set = 1)
Lam
inat
ion
CON
WIP
Car
ds
Ass
embl
y CO
NW
IP C
ards
Insp
ecti
on C
ON
WIP
Car
ds
Pre-
Syst
em W
IP
Lam
inat
ion
Loop
WIP
Ass
embl
y Lo
op W
IP
Insp
ecti
on W
IP
Tota
l Sys
tem
WIP
Boat
s Co
mpl
eted
Lead
Tim
e
Low
Inte
r-ar
riva
l Tim
es
1 0 0 0 37.36 21 23 5.33 49.3 126 4437
2 0 0 1 37.36 21 23 5.33 49.3 126 4421
3 0 1 0 33.69 20.97 27 5.3 53.3 125 4485
4 0 1 1 33.69 20.97 27 5.31 53.3 125 4469
5 0 2 0 29.97 20.94 31 5.28 57.2 124 4474
6 0 2 1 29.97 20.94 31 5.3 57.2 125 4460
7 1 0 0 33.4 24.97 23 5.33 53.3 126 4429
8 1 0 1 33.4 24.97 23 5.33 53.3 126 4400
9 1 1 0 29.79 24.89 27 5.29 57.2 125 4455
10 1 1 1 29.79 24.89 27 5.3 57.2 125 4437
11 1 2 0 26.27 24.79 31 5.27 61.1 124 4473
12 1 2 1 26.27 24.79 31 5.26 61.1 124 4452
13 2 0 0 29.83 28.88 23 5.28 57.2 125 4451
14 2 0 1 29.83 28.88 23 5.28 57.2 125 4434
15 2 1 0 26.03 28.69 27 5.28 61 124 4464
16 2 1 1 26.03 28.69 27 5.28 61 125 4443
17 2 2 0 22.37 28.49 31 5.28 64.8 124 4458
18 2 2 1 22.37 28.49 31 5.29 64.8 125 4436
Hig
h In
ter-
arri
val T
imes
19 0 0 0 80.39 21 23 5.6 49.6 123 5416
20 0 0 1 80.39 21 23 5.25 49.3 124 4356
21 0 1 0 76.35 21 27 5.18 53.2 122 5409
22 0 1 1 76.35 21 27 5.19 53.2 122 5394
23 0 2 0 72.17 21 31 5.17 57.2 122 5429
24 0 2 1 72.17 21 31 5.17 57.2 122 5415
25 1 0 0 75.68 25 23 5.28 53.3 124 5377
26 1 0 1 75.68 25 23 5.28 53.3 124 5355
27 1 1 0 71.71 25 27 5.26 57.3 124 5384
28 1 1 1 71.71 25 27 5.27 57.3 124 5363
29 1 2 0 67.98 25 31 5.22 61.2 123 5389
30 1 2 1 67.98 25 31 5.24 61.2 123 5374

98
31 2 0 0 71.23 29 23 5.3 57.3 125 5341
32 2 0 1 71.23 29 23 5.31 57.3 125 5298
33 2 1 0 67.27 29 27 5.29 61.3 124 5345
34 2 1 1 67.27 29 27 5.3 61.3 125 5328
35 2 2 0 63.89 29 31 5.25 65.3 123 5368
36 2 2 1 63.89 29 31 5.26 65.3 124 5358
This indicates that the manufacturing system at Skier’s Choice, based on the cycle
time data obtained from the tagging activity, is lacking adequate capacity to handle the
current demand level and any increase in demand will make this inadequacy more
prominent. Skier’s Choice should investigate the possibilities of reducing cycle times
and increasing their capacity. One possible solution is to conduct kaizen events with the
shop floor employees to identify and eliminate sources of process waste.
In order to further validate the results, an analysis of variance (ANOVA) is
performed, again using NCSS, to show which factors and/or interactions are most
significant to the performance of the system. The ANOVA was performed using two
replications of the simulation with two different random number sets. Based on the
setup of the CONWIP loops, it is obvious that the factors corresponding to the amount of
cards in each loop will be highly significant to determining the total WIP in the system,
and therefore an ANOVA with total WIP as the response is arbitrary. However when
considering average lead time it is not clear which of the factors have the most significant
effect, and thus an ANOVA is necessary. Figures 6.14 and 6.15 show the summary of
the ANOVA results for the high and low demand scenarios, respectively.
Figure 6.14 Low Demand ANOVA

99
Figure 6.15 High Demand ANOVA
Figures 6.14 and 6.15 show that none of the factors or interactions are statistically
significant with an alpha value of .05. However some important information can be
gathered from these ANOVA tables. First, it is confirmed in both scenarios based on the
probability level that each of the three factors are much more significant than any
interactions between them. Also based on the probability level both figures show that the
amount of cards in the lamination loop is the most significant factor to the response of
average lead time, followed by inspection CONWIP cards and finally assembly/rigging
CONWIP cards. This is likely due to the fact that assembly as a whole is a bottleneck
loop and is never starved or blocked by the upstream and downstream loops.
Based on the key performance indicators of lead time and WIP, best case scenarios
can be chosen from Table 6 for further analysis. Examining the results, it is evident that
for the low demand level case numbers 2 and 8 provide the best results. Case 8 has the
lowest average lead time with a total system WIP of 53.3 boats, while case 2 offers a
slightly higher lead time but with a decrease in WIP of 4 boats for a total of 49.3.
Similarly for the high demand level, case number 32 offers the lowest average lead time
of 5,298 minutes, while case 20 has a higher lead time of 5,356 minutes but with a WIP
reduction of 8 boats in the system. These four cases, based on their better performance as
compared to the others, are further analyzed and compared to the current state situation
based on total WIP and lead time.
Lead Time Comparison
While average lead time data for the experimental treatments in question are readily
available from Table 6, a measure of current state lead time is necessary for a
quantification of the improvements gained. The current state value stream map shown in

100
Figure 6.1 might suggest that the current state lead time can be taken from there, but this
is inadvisable for a comparison with the simulation results. The lead times present in the
value stream map represent only manufacturing lead time and do not include the time that
each order is waiting to enter the manufacturing system. The simulation model, on the
other hand, does include this queue time. To resolve this issue, a second simulation was
created that is very similar to the first, but without the constraint of CONWIP cards and
capped buffers. With this simulation the inter-arrival times can be set to the levels used
in the future state evaluation and a measure of average lead time obtained for comparison
with the restructured system’s performance. For validation of the current state lead times
given by the simulation, they can be compared to the current lead time that Skier’s
Choice quotes from time of order placement to the completion of the product, which is 4-
6 weeks. The values for lead time given by the current state simulation (and shown in the
current state cases in Table 7) for the low and high demand levels are 8,045 minutes and
9,147 minutes, respectively. This corresponds to an approximate total lead time of 3.35
weeks for the low demand level and 3.8 weeks for the high demand, which is in line with
and in fact lower than the times quoted by Skier’s Choice. Table 7 summarizes the
results.
Table 7. Average Lead Time Comparison
Inter-Arrival Time
(Minutes) Average Lead Time
(Minutes) Case No. Demand Supra Moomba
Future State
Current State
% Reduction
2 Low 96 80 4421 8045 45 8 Low 96 80 4400 8045 45
20 High 80 68 5356 9147 41 32 High 80 68 5298 9147 42
Table 7 shows a highly significant reduction in lead time from the current state to the
future state manufacturing system of 45% for the low demand scenario and 41-42% for
the high demand scenario. It is apparent from these results that the CONWIP loops are
accomplishing their task of limiting WIP and helping the system to flow smoothly. Due
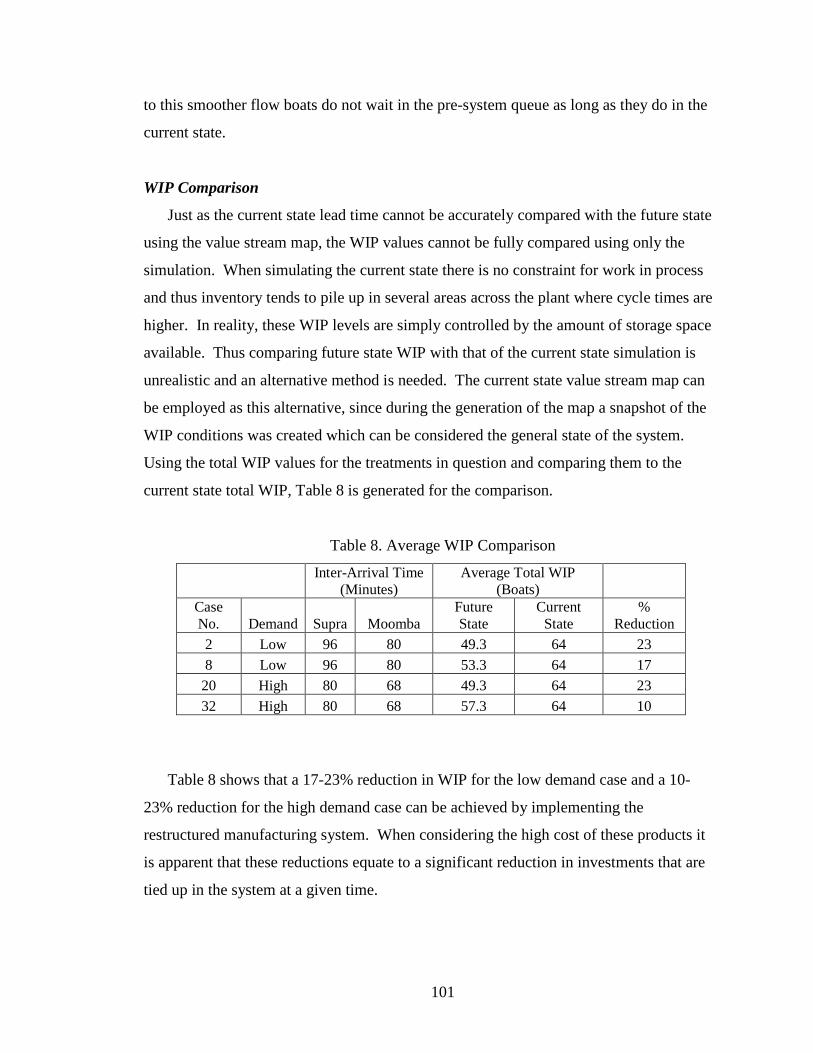
101
to this smoother flow boats do not wait in the pre-system queue as long as they do in the
current state.
WIP Comparison
Just as the current state lead time cannot be accurately compared with the future state
using the value stream map, the WIP values cannot be fully compared using only the
simulation. When simulating the current state there is no constraint for work in process
and thus inventory tends to pile up in several areas across the plant where cycle times are
higher. In reality, these WIP levels are simply controlled by the amount of storage space
available. Thus comparing future state WIP with that of the current state simulation is
unrealistic and an alternative method is needed. The current state value stream map can
be employed as this alternative, since during the generation of the map a snapshot of the
WIP conditions was created which can be considered the general state of the system.
Using the total WIP values for the treatments in question and comparing them to the
current state total WIP, Table 8 is generated for the comparison.
Table 8. Average WIP Comparison
Inter-Arrival Time
(Minutes) Average Total WIP
(Boats) Case No. Demand Supra Moomba
Future State
Current State
% Reduction
2 Low 96 80 49.3 64 23 8 Low 96 80 53.3 64 17 20 High 80 68 49.3 64 23 32 High 80 68 57.3 64 10
Table 8 shows that a 17-23% reduction in WIP for the low demand case and a 10-
23% reduction for the high demand case can be achieved by implementing the
restructured manufacturing system. When considering the high cost of these products it
is apparent that these reductions equate to a significant reduction in investments that are
tied up in the system at a given time.

102
Further Analysis
Two other analyses that must be performed in order to complete the experimentation
are investigations into the effect of the buffer size between lamination and assembly and
the effect of random number variation on system performance. From observation the
simulation shows that the assembly/rigging line blocks the lamination line and the buffer
between the two is usually at full capacity. During the preliminary experimentation this
buffer was set to a capacity of five boats of each product type for a total of 10 boats. The
reasoning behind this value is that 10 boats, which corresponds to a little less than a day
of inventory, is likely representative of a maximum inventory that Skier’s Choice would
wish to keep between the two CONWIP loops.
Having chosen the best cases for further analysis, experimentation can now be
performed to determine the effect of this buffer size on system performance. While it is
obvious that increasing the buffer size will increase the WIP in the system, the effect on
average lead time is unknown. Thus, the buffer was set to various levels ranging from 4
to 12 boats and lead time data collected. Table 9 summarizes the results.
Table 9. Effect of Lamination/Assembly Buffer Size
Case No.
Lamination/Assembly Buffer Size 4 6 8 10 12
Lead
Tim
es
(Min
utes
) 2 4415 4408 4414 4421 4430 8 4386 4404 4400 4400 4418
20 5296 5297 5315 5356 5395 32 5270 5295 5297 5298 5302
Table 9 shows that for all cases an increase in buffer size will result in an increase in
lead time, while a decrease in buffer size reduces the lead time. While the size of the
buffer does affect lead time, the increases/decreases are small and not very significant.
The size of this buffer could be reduced in the simulation to a value of 4 or 6 boats which
would result in lower WIP and a slightly decreased lead time, however it is important to
keep in mind one of the key purposes that a buffer serves which is handling variability.
Factors such as process downtime and employee absence can greatly affect the ability of

103
a system to keep a buffer consistently filled, and these concepts must be taken into
account when setting the buffer level so as to prevent starvation of the bottleneck
assembly/rigging lines.
Simulation analyses are to some extent limited by the random demand and cycle time
patterns generated for the multiple replications tested. Since Simul8, too, initiates the
same random number patterns of the inter-arrival and processing times for products for
any trial run with five replications, the scope of the results is limited to the corresponding
data set. All of the trials thus far have been conducted using a base random number set of
1, and the effect of changing this parameter must be tested. Cases 2, 8, 20, and 32 were
run using different random number sets, the variation of which was kept consistent from
one case to the next. Average lead times were taken from each run so that standard
deviations could be found on a case by case basis. Table 10 shows that simulating each
of the treatments in question for 10 different random number sets will result in an
approximate standard deviation of 90-100 minutes of the average lead time. When
compared with average lead times of 4,440 to 5,653 minutes for the treatments in
question, a standard deviation of this size is not largely significant to system
performance. Overall this test shows that variability will affect system performance, but
not to an excessive degree.
Table 10. Effect of Random Number Variation
Discussion and Selection
The experimental procedures are complete and the system performance has been fully
analyzed. These procedures have proven that if this restructured system were

104
implemented Skier’s Choice would achieve significant improvement in average lead time
and WIP on the shop floor. These tests also prove that the size of the buffer between
lamination and assembly does not have a large affect on lead time and needs only to be
kept at a minimum appropriate level to buffer any variation and prevent starvation of the
assembly/rigging line. Lastly, the tests show that the system performs much the same
regardless of the base random number set used to conduct the simulation.
Upon the completion of these analyses, the levels of CONWIP cards that should be
used for each demand level can be chosen. For the low demand scenario, cases 2 and 8
were presented as the best options for optimal system performance. Case 2 corresponds to
an average lead time of 4,421 minutes with a total system WIP of 53.3 boats, while case 2
has a lead time of 4,400 minutes with a WIP of 53.3 boats. Based on these values,
Skier’s Choice should elect to employ case 8 when setting the CONWIP card values as
they can obtain a four boat reduction in WIP with only a 21 minute increase in lead time.
For the high demand level cases 20 and 32 were shown as the best options from the
preliminary experimentation. Case 20 has a 5,356 minute lead time with a system WIP
of 49.3 boats while case 32 has a lead time of 4,298 minutes with a WIP of 57.3 boats in
the system. Again, Skier’s Choice should choose the lower WIP case 20, as they can
decrease the overall WIP in the system by 8 boats with a lead time increase of 58
minutes. Table 11 summarizes these choices and shows the resulting CONWIP card
values that should be set.
Table 11. Summary of Case Selections
The investigation of the Skier’s Choice case study began with a need to evaluate the
application of lean manufacturing principles and/or other strategies in order to achieve

105
performance improvements for the manufacturing system. Based on the framework
presented in Chapter 4 each of the manufacturing systems were evaluated in the context
of application at Skier’s Choice and it was discovered that lean manufacturing principles
alone were the best fit for the given situation, and from this each of the departments in the
system were restructured according to lean principles. Through system modeling and
experimentation it has been proven that should the restructured system be implemented,
significant gains in average lead time and system WIP would be gained while
maintaining the ability to handle the high variation inherent in the products of this mass
customizer.

106
7. Discussion and Conclusions
Over the course of this research the validity of incorporating lean manufacturing
principles and practices in mass customization environments has been thoroughly
examined. A classification scheme for mass customizers was selected, and the principles
inherent in lean manufacturing and the competencies required of a successful mass
customizer have been clearly defined and discussed. The possibilities for integrating
other manufacturing strategies in areas where lean may fall short as a tool for efficient
mass customization have also been investigated and from these discussions and
atheoretical framework for combining lean and mass customization was developed.
Based on this framework, each of these manufacturing strategies were evaluated in their
ability to offer performance improvements for Skier’s Choice. The framework can now
be reevaluated based on the findings from the investigation into the Skier’s Choice case
study. See Figure 7.1 for the revised theoretical framework.
Figure 7.1 Revised Theoretical Framework

107
The theoretical framework in Chapter 4 stated that Agile, and particularly Leagile
strategies, are more likely to be applicable for mass customizers classified as assemblers
or modularizers. Leagile manufacturing relies fully on the existence of a logical
decoupling point which splits standardized upstream processing from customized
downstream processing. Hence, a mass customizer must first have some degree of
standardization in the early stages of product manufacture, and also be able to define a
specific point in processing at which standardized products become customized. Despite
the fact that Skier’s Choice is an assembler, it was found through further evaluation that
due to their variety explosion occurring very early in the process the implementation of a
decoupling point was impossible. This indicates that in fact it may be difficult to define a
decoupling point even for low level mass customizers, and the implementation of leagile
manufacturing may be just as likely or unlikely in these cases as it is for high level
customizers. Based upon this reasoning, the applicability of agile and leagile systems has
been represented equally across all types of mass customization as Figure 7.1 shows.
Flexible/Reconfigurable manufacturing systems (FMS/RMS) were indicated in the
original framework as being applicable to all mass customizers whose processing is
equipment intensive, with increasing degrees of applicability as customer involvement
moves up the value chain. The evaluation of the case study company did show that there
was little need for these equipment strategies for and assembler, but this is more a result
of the particular type of manufacturing taken place and cannot be generalized for all mass
customizers. Essentially, the validity of these systems as a tool for mass customization
will fully depend on the specific equipment needs of a given manufacturing system.
Further research is needed in this area, but it can be speculated that for those
manufacturing processes that do require equipment, the need will be greater for robust
systems to handle variety as customer involvement moves up the value chain. Thus the
applicability of FMS/RMS has remained unchanged in the revised framework.
The Theory of Constraints (TOC) was first represented in Chapter 4 as being
applicable mainly for low level customizers, and even then to a small degree. In the
evaluation of this strategy for Skier’s Choice TOC was not considered as a valid means
of system control due to the high variation in cycle times which results in the shifting of
the constraint. Further analysis, however, has indicated that the assembly line as a whole

108
could be considered to be a bottleneck. This observation begs the question of how TOC
and the drum-buffer-rope mechanism could be applied not to a single process, but to a set
of processes or a department. It is entirely possible that the TOC system could be
adapted to control the system in terms of departments rather than individual processes.
For high level customizers, it is still likely that the bottleneck will shift frequently even
on a departmental level due to the early customer involvement and very high variation
from one design to the next. However, for low level customization it is reasonable to
increase the applicability of TOC as shown in Figure 7.1.
Quick Response Manufacturing (QRM) was represented in the original framework as
being applicable mainly for high level mass customizers. QRM and the POLCA
mechanism offers the ability to efficiently control product routings and inventory
between pairs of cells. The existence of many complex routings is more likely to occur
when the customer becomes involved earlier in the value chain, and the case study helped
to bolster this argument. As an assembler, Skier’s Choice has a linear main product line
in which product flow while obtaining parts from various feeder lines, thus there are no
complex routings to consider. The complexity of operating a POLCA system makes it
undesirable to implement unless absolutely needed. QRM also relies on the creation of a
cellular structure across the manufacturing system in order to implement POLCA. This
system is robust, requires a specific system structure for implementation, and will often
be unnecessary for low level customizers as was validated by the case study. Thus no
alterations to the original framework have been made in the context of QRM applicability
in Figure 7.1.
The theoretical framework enabled the selection of lean manufacturing principles as a
means to fully structure and control the system at Skier’s Choice. The experimentation
with the model of the restructured manufacturing system has validated the use of lean
principles in this mass customization environment by showing significant improvements
in average lead time and WIP over the system currently in place. Thus it is proven that
lean manufacturing can be successfully integrated as a means of systems structure in at
least some mass customization settings. While the situation at Skier’s Choice is not
representative in any way of all mass customizers, it does provide a reasonable

109
generalization of those mass customizers of the assembler variety as outlined by Duray
(2000).
It is apparent that certain lean principles such as continuous improvement, waste
reduction, visual management, 5s, etc. can be readily implemented in most manufacturing
environments. However what is not known is to what extent principles such as JIT,
stable and standardized processes, and load leveling can be applied for mass
customization. This research has attempted to investigate these principles further and
determine just how applicable they can be for mass customization, and has successfully
done so for the assembler variety of mass customizers.
Future Work
While the objective of validating lean manufacturing for use in mass customization
environments has been achieved, there are several limitations of this research that should
be the subject of future work. It has been shown that for assemblers lean manufacturing
can likely be employed, but the use of lean for the three other mass customizer
classifications of modularizers, fabricators, and involvers is still in question and could not
be further investigated due to time restrictions.
It is likely that lean can be implemented for modularizers in much the same way that
has been shown for Skier’s Choice. While the most effective system structure and
control mechanisms will vary, the overall application procedure should be similar due to
the fact that both assemblers and modularizers involve the customer in the later stages of
the value chain. On the other hand fabricators and involvers, who involve the customer
very early in the value chain, will likely find that many lean manufacturing principles,
especially those that rely greatly on stability, are not readily applicable. It is important
that these styles of mass customization be further investigated in order to fully understand
to what extent lean principles are applicable in each case.
The second aspect of this research that must be further investigated is the integration
of other manufacturing strategies such as Quick Response Manufacturing (QRM), the
Theory of constraints (TOC), Agile and Leagile systems, FMS/RMS, and Job Shop Lean
in situations where lean manufacturing does not adequately fulfill the needs of mass
customizers. While the restructuring of the operations of Skier’s Choice required only

110
lean principles, this will almost certainly not be the case for many mass customizers. The
POLCA strategy of QRM is a particularly robust mechanism for controlling inventory
and flow in complex product routing situations as will be the case in many mass
customization environments. TOC also offers the drum-buffer-rope (DBR) mechanism
which is a likely alternative for high level system control for those mass customizers who
are able to define a consistent and stable constraint in their system such as a monument
process. Also the decoupling point property of leagile systems is of particular interest in
those situations where a mass customizer can postpone variety explosion and run
upstream processes according to lean principles.
While little has been shown to this point on the actual implementation of agile
systems and Job Shop Lean on the manufacturing shop floor, further investigations into
the ability of these strategies to aid in mass customization will undoubtedly be required as
they become more developed. The strengths and weaknesses of each of these strategies
has been critically reviewed and the theoretical framework of the research has laid the
groundwork for how and in what situations they can be integrated as a supplement to lean
manufacturing for mass customization. However, there is still much work to be
completed in this area, and the theoretical framework presented in this work should be
used as a base point for conducting further research into the application of lean
manufacturing for involvers and fabricators as well as the possibilities for the integration
of the other strategies discussed.
In closing, this research has proven that lean manufacturing is not simply a tool for
companies with stable demand and a strict definition of takt time. Lean manufacturing is
a very strong and robust strategy that when properly applied can and will increase the
performance of at least some types of mass customizers, and while some classifications
of mass customization present great obstacles to the application of lean manufacturing,
many of its principles hold true for all manufacturers. However, mass customizers must
pay careful consideration to the individual properties of their system when contemplating
the application of lean manufacturing. One cannot simply reach into the lean toolbox and
pull out the answers to their manufacturing woes. Many consider the very idea of mass
customization to be an oxymoron, but with the increasing fragmentation of markets and
desire for individualization by consumers, there is no doubt that it is here to stay. Those

111
companies that are able to offer this individualization with short lead times while
maintaining system efficiency will gain a profound competitive advantage in their
market, and this research has shown that for at least some classifications of mass
customizers lean manufacturing can be the answer.

112
List of References
1. Agarwal, A., Shankar, R., Tiwari, M.K., (2006), ‘Modeling the metrics of lean,
agile and leagile supply chain: An ANP-based approach,’ European Journal of
Operational Research, Vol. 173, pp. 211-225
2. Alves, T. da C. L., Tommelein, I. D., Ballard, G., (2005), ‘Value Stream Mapping
for Make-to-order Products in a Job Shop Environment,’ 2005 ASCE Construction
Research Congress, San Diego, CA, April 5-7, 2005
3. Badurdeen, F., Masel, D., (2007), ‘A genetic algorithm-based approach to design
minicells for mass customization manufacturing,’ International Journal of Mass
Customization, In press
4. Badurdeen, F., Masel, D., (2007), ‘A modular minicell configuration for mass
customization manufacturing,’ International Journal of Mass Customisation, Vol.
2, Nos. 1/2, pp. 39-56.
5. Badurdeen, F., Thuramalla, S., (2006), ‘Establishing Rules to Design a Minicell-
based Manufacturing System for Mass Customization,’ Submitted to International
Journal of Agile Systems and Management, October 31, 2007
6. Barnett, L., Rahimifard, S., Newman, S., (2004), ‘Distributed scheduling to support
mass customization in the shoe industry,’ International Journal of Computer
Integrated Manufacturing, October-November 2004, Vol. 17, No. 7, pp. 623-632
7. Berman, B., (2002), ‘Should your firm adopt a mass customization strategy?’,
Business Horizons, Jul/Aug 2002, Vol. 45, No. 4, pp. 52-60
8. Bicheno, J., (2000), ‘The Lean Toolbox’, second ed., England: PICSIE Books
9. Boynton, A.C., Victor, B., Pine, B.J. II, (1993), ‘New competitive strategies:
Challenges to organizations and information technology,’ IBM Systems Journal,
Vol. 32, No. 1, pp. 40-64
10. Brink, T., Ballard, G., (2005), ‘Slam-A Case Study in Applying Lean to Job Shops,’
2005 ASCE Construction Research Congress, San Diego, CA, April 5-7, 2005
11. Clarke, C., (2005), ‘Do you want to be lean or agile?,’ Manufacturing Computer
Solutions, Vol. 11, No. 3, pp. 14-15

113
12. Co, H. C., Jacobson, S. H., (1994), ‘Kanban assignment problem in serial just-in-
time production systems,’ IIE Transactions (Institute of Industrial Engineers), Vol.
26, No. 2, pp. 76-85
13. Da Silveira, G., Borenstein, D., Fogliatto, F. S. (2001) ‘Mass Customization:
Literature review and research directions’ International Journal of Production
Economics Vol. 72, No. 1, pp. 1-13
14. Duray, R., Ward, P. T., Milligan, G. W., Berry, W. L., (2000), ‘Approaches to mass
customization: configurations and empirical validation,’ Journal of Operations
Management, Nov. 2000, Vol. 18, No. 6, pp. 605-625
15. Fernandes, N. O., Carmo-Silva, S., (2006), ‘Generic POLCA-A production and
materials flow control mechanism for quick response manufacturing,’ International
Journal of Production Economics, Vol. 62, No. 1-2, pp. 119-132.
16. Ford, H., (1988) ‘Today and Tomorrow’ Oregon: Productivity Press
17. Framinan, J.M, Gonzalez, P.L., Ruiz-Usano, R., (2006), ‘Dynamic card controlling
in a Conwip system,’ International Journal of Production Economics,’
January/February 2006, Vol. 99, No. 1, pp. 102-116
18. Gilmore, J. H., Pine, J. B., (1997) ‘The Four Faces of Customization’, Harvard
Business Review, January-February 1997, pp. 91-101)
19. Goldratt, E. M., (2004), ‘The Goal: A Process of Ongoing Improvement,’
Minnesota: Highbridge Company
20. Goldsby, T. J., Griffis, S. E., Roath, A. S., (2006), ‘Modeling Lean, Agile, and
Leagile Supply Chain Strategies,’ Journal of Business Logisitics, Vol. 27, No. 1, pp.
57-79
21. Hirano, H., (1995), ‘5 Pillars of the Visual Workplace’, Oregon: Productivity Press
22. Huang, C., Tseng, T., Chang, H., (2005), ‘A Novel Approach to Lean Control,’ IIE
Annual Conference and Exposition 2005
23. Huang, M., Wang, X., Wang, D., (2007), ‘Simulation study using system dynamics
for a CONWIP-controlled lamp supply chain,’ International Journal of Advanced
Manufacturing Technology, Vol. 32, No. 1-2, pp. 184-193
24. Johnson, D., Harrison, V., (2004), ‘Enabling quick response manufacturing,’
Circuits Assembly, Vol. 15, No. 12, pp. 36-38

114
25. Kadipasaoglu, S., Xiang, W., Hurley, S., Khumawala, B., ‘A study on the effect of
the extend and location of protective capacity in flow systems,’ International
Journal of Production Economics, 2000, Vol. 63, No. 3
26. Klusewitz, G., Rerick, R., (1996), ‘Constraint Management Through the Drum-
Buffer-Rope System,’ IEEE/SEMI Advance Semiconductor Manufacturing
Conference and Workshop, 1996, pp. 7-12
27. Koren, Y., Heisel, U., Jovane, F., Moriwaki, T., Pritschow, G., Ulsoy, G., Van
Brussel, H., (1999), ‘Reconfigurable Manufacturing Systems,’ Annals of the CIRP,
Vol. 48, No. 2, pp. 527-540
28. Krishnamurthy, R., Yauch, C. A., (2007), ‘Leagile manufacturing: a proposed
corporate infrastructure,’ International Journal of Operations & Production
Management, Vol. 27, No. 6, pp. 588-604
29. Kumar, S. C., Panneerselvam, R., (2007), ‘Literature review of JIT-KANBAN
system,’ International Journal of Advanced Manufacturing Technology, Vol. 32,
No. 3-4, pp. 393-408
30. Lampel, J., Mintzberg, H., (1996), ‘Customizing Customization,’ Sloan
Management Review, Vol. 38, No. 1, pp. 21-30
31. Lee, H. L., Feitzinger, E., (1995), ‘Product configuration and postponement for
supply chain efficiency,’ Industrial Engineering Research Conference
Proceedings, May 24-25, 1995, Nashville, TN USA
32. Liker, J. K., (2003), ‘The Toyota Way’,Wisconsin: McGraw-Hill
33. Mabin, V., Balderstone, S., (2000), The World of Theory of Constraints: a Review
of the International Literature, Florida: St. Lucie Press
34. Mason-Jones, R., Naylor, B., Towill, D. R., (2000), ‘Lean, agile, or leagile?
Matching your supply chain to the marketplace,’ International Journal of
Production Research, Vol. 38, No. 17, pp. 4061-4070
35. Mehrabi, M. G., Ulsoy, A. G., Koren, Y., (2000), ‘Reconfigurable manufacturing
systems: Key to future manufacturing,’ Journal of Intelligent Manufacturing, Vol.
11, pp. 403-419
36. Meyer, M.H., Lehnerd, A.P., (1997), ‘The Power of Product Platforms: Building
Value and Cost Leadership,’ New York: Free Press

115
37. Michel, R., (2002), ‘Multiple paths to lean,’ MSI, Vol. 20, No. 11, pp. 54-57
38. Monden, Y., (1998), ‘Toyota Production System’, Third Ed., Georgia: Engineering
and Management Press
39. Moser, K., (2007), ‘Mass Customization Strategies-Development of a competence-
based framework for indentifying different mass customization strategies’
40. Naylor, J. B., Naim, M. M., Berry, D., (1999), ‘Leagility: Integrating the lean and
agile manufacturing paradigms in the total supply chain,’ International Journal of
Production Economics, Vol. 62, pp. 107-118
41. Ohno, T., (1988), ‘Toyota Production System: Beyond Large-Scale Production’,
New York, Productivity Press
42. Pine, J. B., (1993), ‘Mass Customization: The New Frontier in Business
Competition’
43. Sanderson, S.W., Uzumeri, M., (1997), ‘Managing Product Families’, Chicago:
Irwin
44. Selladurai, R.S. (2004), ‘Mass customization in operations management: oxymoron
or reality?’ Omega, Aug. 2004, Vol. 32, No. 4, pp. 295-300
45. Shingo, S., (1988), Non-Stock Production: The Shingo System for Continuous
Improvement, Oregon: Productivity Press
46. Shingo, S., (1986), ‘Zero Quality Control: Source Inspection and the Poka-yoke
System’, Oregon: Productivity Press
47. Steele, D. C., Philipoom, P. R., Malhotra, M. K., Fry, T. D., (2005), ‘Comparisons
between drum-buffer-rope and material requirements planning: a case study’,
International journal of Production Research, Vol. 43, No. 15, pp. 3181-3208
48. Stratton, R., Warburton, R.D.H., (2003), ‘The strategic integration of agile and lean
supply,’ International Journal of Production Economics, Vol. 85, pp. 183-198
49. Suri, R. (1994), ‘Common misconceptions and blunders in implementing quick
response manufacturing,’ Technical Paper – Society of Manufacturing Engineers.,
1994, pp. 1-23
50. Suri, R., (1998), ‘Quick Response manufacturing: A Company Wide Approach to
Reducing Lead Times,’ Oregon: Productivity Press

116
51. Swaminathan, J. M., (2001), ‘Enabling Customization Using Standard Operations’,
California Management Review, Vol. 43, No. 3, pp. 125-135
52. Takahashi, K., Myreshka, H., Daisuke, (2005), ‘Comparing CONWIP,
synchronized CONWIP, and Kanban in complex supply chains,’ International
Journal of Production Economics, Vol. 93-94, Jan. 2005, pp. 25-40
53. Towill, D., Christopher, M., (2002), ‘The Supply Chain Strategy Conundrum: To be
Lean or Agile or To be Lean And Agile?,’ International Journal of Logistics:
Research and Applications, Vol. 5, No. 3, pp. 299-309
54. Tseng, M. M., Jiao, J., (1996), ‘Design for Mass Customization,’ Annals of the
CIRP, Vol. 45, No. 1, pp. 153-156
55. Tsutsui, W. M., (1998), ‘Manufacturing Ideology’, New Jersey: Princeton
University Press
56. Ulrich, K., Tung, K., (1991), ‘Fundamentals of Product Modularity,’ Issues in
Design Manufacture/Integration, Vol. 39, pp. 73-79
57. Wantuck, K. A., (1989), ‘Just In Time for America’, Michigan: Edwards Brothers
Inc
58. Womack, J. P., Jones, D. T., (1996), ‘Lean Thinking’, New York: Simon &
Schuster
59. Womack, J. P., Jones, D. T., and Roos, Daniel (1991) ‘The Machine That Changed
the World’ New York: HarperCollins Publishers
60. Yusuf, Y.Y., Adeleye, E.O., (2002), ‘A comparative study of lean and agile
manufacturing with a related survey of current practices in the UK,’ Modeling,
Planning and Scheduling of Manufacturing Systems, Vol. 40, No. 17, pp. 4545-
4562
61. Zipkin, P., (2001), ‘The limits of Mass Customization,’ Sloan Management Review,
Vol. 42, No. 3, pp.

117
Vita
Gregory Brandon Stump was born on January 6th, 1985 in Louisville, Kentucky. He
completed secondary school at Spencer County High School in Taylorsville, Kentucky.
He received his bachelor’s degree in mechanical engineering from the University of
Kentucky in December, 2008, and entered the graduate program in mechanical
engineering in January 2007 via the University Scholars Program to pursue a master’s
degree in mechanical engineering. During the course of the Master’s Degree he served as
a teaching assistant and research assistant.
Scholastic and Professional Honors
GAAN Fellowship, January 2007 – August 2007
University of Kentucky, Lexington, Kentucky
Publications and Conferences
1. H. Metta, A. Goyal, B. Stump, Kundana Inala, Smitha Thuramalla, Fazleena
Badurdeen, “A Simple Simulation Model to Demonstrate Mass Customization
Strategies,” 2007, Third World Conference on Mass Customization &
Personalization, October 07-11, 2007, Boston, MA
2. F. Badurdeen, H. Metta, B. Stump, (2007), “Simulation Models to Demonstrate
Mass Customization Strategies,” Advances in Mass Customization and
Personalization, Vol. 3, World Scientific Publishing, in press (W*)
3. F Badurdeen, B. Stump, (2008), “Integrating Lean and Other Strategies for Mass
Customization: A Case Study,” Journal of Intelligent Manufacturing, submitted
(W)