AN INNOVATIVE TECHNOLOGY FOR NATURAL … innovative technology for natural gas sweetening by ......
18
AN INNOVATIVE TECHNOLOGY FOR NATURAL GAS SWEETENING BY MEANS OF CRYOGENIC DISTILLATION Laura A. Pellegrini, Stefano Langé, Giorgia De Guido, Stefania Moioli Politecnico di Milano, Italy Oldrich Mikus Stamicarbon (Maire Tecnimont Group), the Netherlands Barbara Picutti, Paolo Vergani, Guido Franzoni, Marco Lo Savio, Fabio Brignoli Tecnimont (Maire Tecnimont Group), Italy Abstract The application of traditional chemical absorption of CO2 and H2S by means of alkanolamines is not competitive for natural gas sweetening when the amount of acid gas is high, because the energy required by these processes is proportional to the quantity of acid components to be removed. On the other hand, the cryogenic distillation technologies can be usefully applied to process natural gas with any amount of acid components, since the costs are incrementally reduced, the higher the acid gas content in the stream. In the amine washing separation methods, CO2 and H2S are recovered at low pressures (nominally 1-2 bar) and need then to be dried and then compressed for re-injection into underground storage; on the contrary the cryogenic distillation technologies discharge the CO2 and H2S mixture as a high pressure liquid, with a commercial advantage when this stream is re-injected for storage into depleted reservoirs or for EOR purposes. An innovative process based on a "dual-pressure" cryogenic distillation unit is proposed with its two sections (the high-pressure column for the CO2 bulk removal and the low-pressure column for the methane recovery) working across the critical pressure of methane and the SVL locus of the binary CO2-CH4 mixture. This allows a complete separation of CO2 and H2S from methane, while avoiding the CO2 freezing. A dynamic simulation study has been developed in order to validate the process architecture and to define the unit start-up procedure, while a laboratory experimental campaign is beginning. The performances of the new process applied to an industrial case-study are shown. Moreover, the influence of other mixture components on the process is well pointed out by properly defining the thermodynamic framework, also in view of downstream separation processes.
-
Upload
truongtuyen -
Category
Documents
-
view
235 -
download
6
Transcript of AN INNOVATIVE TECHNOLOGY FOR NATURAL … innovative technology for natural gas sweetening by ......
AN INNOVATIVE TECHNOLOGY FOR NATURAL GAS SWEETENING BY MEANS OF CRYOGENIC DISTILLATION
Laura A. Pellegrini, Stefano Langé, Giorgia De Guido, Stefania Moioli Politecnico di Milano, Italy
Oldrich Mikus
Stamicarbon (Maire Tecnimont Group), the Netherlands
Barbara Picutti, Paolo Vergani, Guido Franzoni, Marco Lo Savio, Fabio Brignoli Tecnimont (Maire Tecnimont Group), Italy
Abstract The application of traditional chemical absorption of CO2 and H2S by means of alkanolamines is not competitive for natural gas sweetening when the amount of acid gas is high, because the energy required by these processes is proportional to the quantity of acid components to be removed. On the other hand, the cryogenic distillation technologies can be usefully applied to process natural gas with any amount of acid components, since the costs are incrementally reduced, the higher the acid gas content in the stream. In the amine washing separation methods, CO2 and H2S are recovered at low pressures (nominally 1-2 bar) and need then to be dried and then compressed for re-injection into underground storage; on the contrary the cryogenic distillation technologies discharge the CO2 and H2S mixture as a high pressure liquid, with a commercial advantage when this stream is re-injected for storage into depleted reservoirs or for EOR purposes. An innovative process based on a "dual-pressure" cryogenic distillation unit is proposed with its two sections (the high-pressure column for the CO2 bulk removal and the low-pressure column for the methane recovery) working across the critical pressure of methane and the SVL locus of the binary CO2-CH4 mixture. This allows a complete separation of CO2 and H2S from methane, while avoiding the CO2 freezing. A dynamic simulation study has been developed in order to validate the process architecture and to define the unit start-up procedure, while a laboratory experimental campaign is beginning. The performances of the new process applied to an industrial case-study are shown. Moreover, the influence of other mixture components on the process is well pointed out by properly defining the thermodynamic framework, also in view of downstream separation processes.
AN INNOVATIVE TECHNOLOGY FOR NATURAL GAS SWEETENING BY MEANS OF CRYOGENIC DISTILLATION
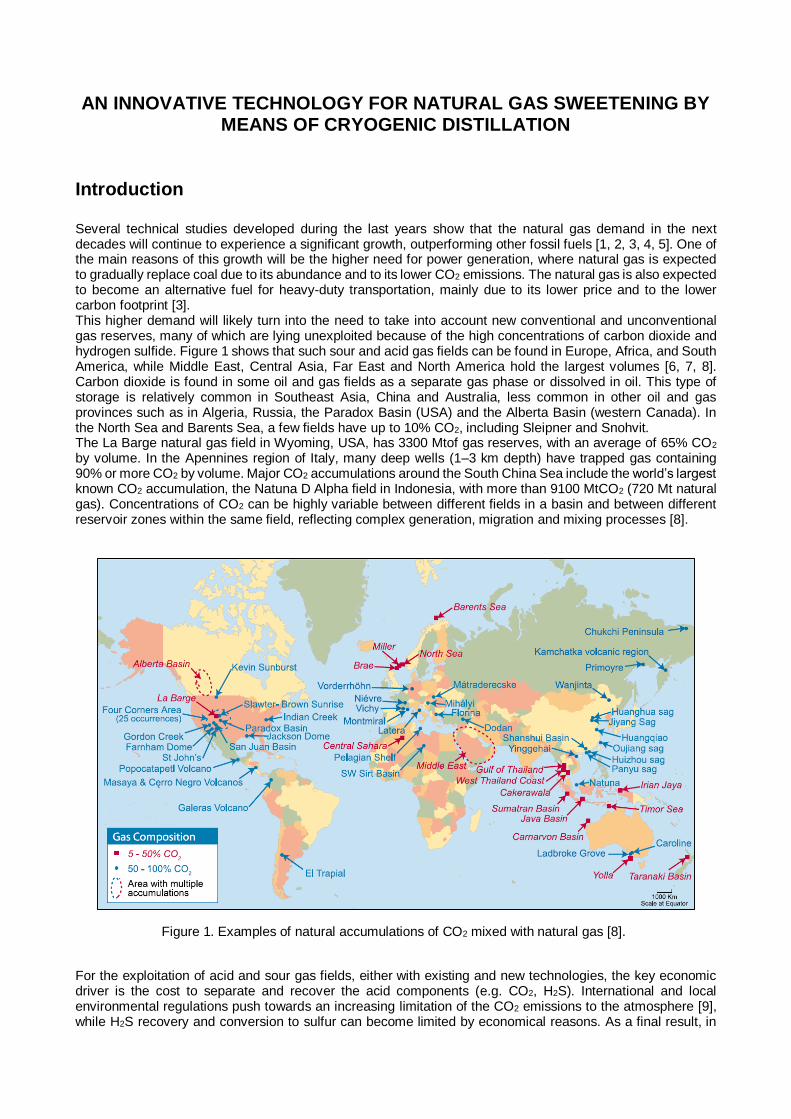
Introduction Several technical studies developed during the last years show that the natural gas demand in the next decades will continue to experience a significant growth, outperforming other fossil fuels [1, 2, 3, 4, 5]. One of the main reasons of this growth will be the higher need for power generation, where natural gas is expected to gradually replace coal due to its abundance and to its lower CO2 emissions. The natural gas is also expected to become an alternative fuel for heavy-duty transportation, mainly due to its lower price and to the lower carbon footprint [3]. This higher demand will likely turn into the need to take into account new conventional and unconventional gas reserves, many of which are lying unexploited because of the high concentrations of carbon dioxide and hydrogen sulfide. Figure 1 shows that such sour and acid gas fields can be found in Europe, Africa, and South America, while Middle East, Central Asia, Far East and North America hold the largest volumes [6, 7, 8]. Carbon dioxide is found in some oil and gas fields as a separate gas phase or dissolved in oil. This type of storage is relatively common in Southeast Asia, China and Australia, less common in other oil and gas provinces such as in Algeria, Russia, the Paradox Basin (USA) and the Alberta Basin (western Canada). In the North Sea and Barents Sea, a few fields have up to 10% CO2, including Sleipner and Snohvit. The La Barge natural gas field in Wyoming, USA, has 3300 Mtof gas reserves, with an average of 65% CO2 by volume. In the Apennines region of Italy, many deep wells (1–3 km depth) have trapped gas containing 90% or more CO2 by volume. Major CO2 accumulations around the South China Sea include the world’s largest known CO2 accumulation, the Natuna D Alpha field in Indonesia, with more than 9100 MtCO2 (720 Mt natural gas). Concentrations of CO2 can be highly variable between different fields in a basin and between different reservoir zones within the same field, reflecting complex generation, migration and mixing processes [8].
Figure 1. Examples of natural accumulations of CO2 mixed with natural gas [8].
For the exploitation of acid and sour gas fields, either with existing and new technologies, the key economic driver is the cost to separate and recover the acid components (e.g. CO2, H2S). International and local environmental regulations push towards an increasing limitation of the CO2 emissions to the atmosphere [9], while H2S recovery and conversion to sulfur can become limited by economical reasons. As a final result, in
the exploitation of highly sour gas fields, an interesting option seems to be the separation of acid gas components alongside with their re-injection into the well. While several processes exist for removing acid components, nearly all of them reject H2S and CO2 as a low pressure gaseous stream [10], therefore leading to high recompression costs for the subsequent re-injection. The new acid and sour gas sweetening process, based on an innovative cryogenic distillation scheme [11], allows the separation of acid components as high pressure liquid while still being able to meet the required specifications on the sweet gas. In principle, it can represent a promising solution for the unlocking and exploitation of acid and sour gas fields. But, mainly, for the treatment of highly acid and sour natural gas cryogenic distillation offers competitive advantages over other techniques nowadays widely used, such as chemical absorption with aqueous solutions of alkanolamines [12]. In fact, the proportionality coefficient between the energy consumption and the CO2 content in the feed stream is much lower for distillation than for chemical absorption. In the present paper, after a brief overview of the fields of potential application of the new technology, an application to an industrial case-study will be developed. The thermodynamic framework will be described with particular reference to how the presence of components different from CH4 and CO2 affects the process.
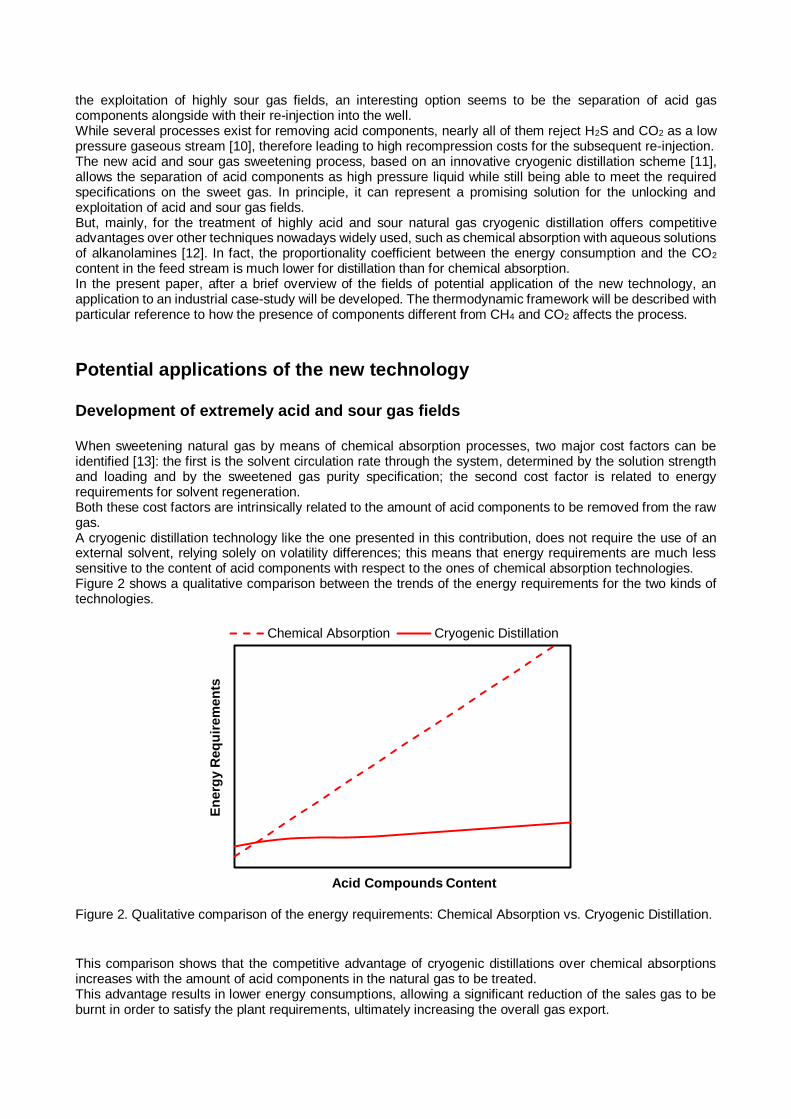
Potential applications of the new technology Development of extremely acid and sour gas fields When sweetening natural gas by means of chemical absorption processes, two major cost factors can be identified [13]: the first is the solvent circulation rate through the system, determined by the solution strength and loading and by the sweetened gas purity specification; the second cost factor is related to energy requirements for solvent regeneration. Both these cost factors are intrinsically related to the amount of acid components to be removed from the raw gas. A cryogenic distillation technology like the one presented in this contribution, does not require the use of an external solvent, relying solely on volatility differences; this means that energy requirements are much less sensitive to the content of acid components with respect to the ones of chemical absorption technologies. Figure 2 shows a qualitative comparison between the trends of the energy requirements for the two kinds of technologies.
Figure 2. Qualitative comparison of the energy requirements: Chemical Absorption vs. Cryogenic Distillation.
This comparison shows that the competitive advantage of cryogenic distillations over chemical absorptions increases with the amount of acid components in the natural gas to be treated. This advantage results in lower energy consumptions, allowing a significant reduction of the sales gas to be burnt in order to satisfy the plant requirements, ultimately increasing the overall gas export.
En
erg
y R
eq
uir
em
en
ts
Acid Compounds Content
Chemical Absorption Cryogenic Distillation
A preliminary analysis of the energy requirements indicates that the new process, considering the sweetening section only, could be more competitive than chemical absorptions when applied to raw natural gas containing more than 10 to 15%v of acid components. A more precise estimation could be carried out on the basis of the actual gas field conditions and on the specific Customer needs.
Integration with EOR and acid gas re-injection schemes A key distinguishing feature of the new process with respect to chemical absorptions is its capability of rejecting the acid components as a high pressure liquid stream. Depending on the raw gas initial composition, different process schemes could be adopted. When treating a gas mainly composed by methane and carbon dioxide, with negligible amounts of H2S and heavier hydrocarbons, the byproduct of the new process could be easily reused for Enhanced Oil Recovery operations. For the re-injection into a well, the required pressure of the CO2 stream can be of several hundreds of bars, depending on the nature and depth of the reservoir. Absorption based technologies reject the acid components as a low pressure gaseous stream saturated with water: the re-injection of this CO2 product would require, after dehydration, a highly onerous supercritical gas compression. The stream produced by the new process, instead, is anhydrous and in liquid phase. Liquid compression requires less energy and simpler machinery as well, thus providing significant savings over gas compression.
Integration with a Nitrogen Rejection Unit (NRU) The concentration of nitrogen in the gas to be sold has to be limited in order to meet the required specifications (e.g. gas heating value, Wobbe index), hence, when raw natural gas contains significant amount of nitrogen, this inert compound has to be removed. Nitrogen rejection is especially required when the destination of the sweetened gas is a liquefaction plant for LNG production. This specific need is mainly due to the significant increase of the required compression duty generated by the presence of non-condensable gases. The typical technology used in order to process elevated gas flow rates while still being able of achieving high methane recovery, is cryogenic distillation [13]. Due to the low temperature operations, contaminants like water and CO2 have to be removed in order to avoid solid deposition into the plant: the new process, being a cryogenic distillation itself, gives a product stream that already fulfills NRUs requirements.
LNG Production
Liquefied Natural Gas has a normal boiling point temperature around -162 C. A general flowsheet for LNG production is based on a sequence of refrigeration steps, each one being at a different temperature level. The gas produced by the new process is already available at low temperatures (i.e. -85 to -90 C) and relative high pressures: this means that a significant portion of the refrigeration steps can be avoided. Starting from a pressure level around 40 bar, the refrigerant effect of a Joule – Thomson expansion can also be exploited up to around 30 bar, the usual pressure of intermediate liquefaction stages. If nitrogen rejection is required, cryogenic NRUs can be successfully integrated at this stage [13].
The Thermodynamic Framework To accurately design low temperature distillation processes for the purification of natural gas, a proper thermodynamic framework is required. The distillation is an operation at vapor-liquid equilibrium. Due to the presence of carbon dioxide, freezing may occur during the distillation process and the proper assessment of freezing conditions, considering also the effect of other than CH4 and CO2 components, is fundamental in order to determine the most suitable operating conditions. The solid-liquid-vapor equilibrium (SLVE) requires the formation of a solid phase in presence of liquid and vapor phases. This condition can also be named triple point condition, due to the simultaneous presence of three phases at equilibrium. At equilibrium conditions, the phase equilibrium is defined by equating the
chemical potential expressed by the fugacity of each compound in each phase at temperature and pressure equal in all the phases. Mathematically this can be expressed as:
𝑓𝑖𝑆(𝑇, 𝑃, �̅�𝑆) = 𝑓𝑖
𝐿(𝑇, 𝑃, �̅�𝐿) = 𝑓𝑖𝑉(𝑇, 𝑃, �̅�𝑉)𝑖 = 1, 𝑁𝐶 (1)
where 𝑓 is the fugacity of the compound i in each phase (solid, S; liquid, L; vapor, V), T is the temperature, P is the pressure and �̅� is the molar composition in terms of mole fraction of each phase. In this formulation also the solid phase is considered as a mixture of compounds. If the solid phase is considered pure, the formulation of the problem becomes:
{𝑓𝑖
𝑆(𝑇, 𝑃) = 𝑓𝑖𝐿(𝑇, 𝑃, �̅�𝐿) = 𝑓𝑖
𝑉(𝑇, 𝑃, �̅�𝑉)
𝑓𝑗𝐿(𝑇, 𝑃, �̅�𝐿) = 𝑓𝑗
𝑉(𝑇, 𝑃, �̅�𝑉)𝑗 = 2, 𝑁𝐶 (2)
where P is the bubble pressure, T is the system temperature, xi and yi are respectively the liquid phase mole fraction and the vapor phase mole fraction of compound i in the mixture of NC compounds. The resulting equation to calculate the solubility of CO2 in the liquid phase at triple point conditions is therefore:
{𝑓𝐶𝑂2
𝑆 (𝑇, 𝑃) = 𝑓𝐶𝑂2
𝐿 (𝑇, 𝑃, �̅�𝐿) = 𝑃𝑥𝐶𝑂2
𝐿 �̂�𝐶𝑂2
𝐿 (𝑇, 𝑃, �̅�𝐿)
𝑃𝑥𝑖𝐿�̂�𝑖
𝐿(𝑇, 𝑃, �̅�𝐿) = 𝑃𝑦𝑖𝑉�̂�𝑖
𝑉(𝑇, 𝑃, �̅�𝑉)𝑖 = 1, 𝑁𝐶 (3)
where P is the bubble pressure, T is the system temperature, xi and yi are respectively the liquid phase mole fraction and the vapor phase mole fraction of compound i in the mixture of NC compounds. The resulting equation to calculate the solubility of CO2 in the liquid phase at triple point conditions is therefore:
𝑥𝐶𝑂2
𝐿 =
𝜙𝐶𝑂2𝐿 (𝑇,𝑃)[𝑒𝑥𝑝(
∆ℎ𝑓𝑢𝑠(𝑇𝑚,𝑃)
𝑅𝑇𝑚(1−
𝑇𝑚𝑇
)+(�̃�𝑝
𝐿 −�̃�𝑝𝑆)
𝑅(
𝑇𝑚𝑇
−1−𝑙𝑛(𝑇𝑚
𝑇)))]
�̂�𝐶𝑂2𝐿 (𝑇,𝑃,�̅�𝐿)
(4)
where ∆ℎ𝑓𝑢𝑠 is the molar heat of fusion at melting point, 𝑇𝑚 is the melting point temperature for the pure
compound, �̃�𝑝𝐿 is the molar specific heat at constant pressure for the liquid phase and �̃�𝑝
𝑆 is the one for the solid
phase. Adopting the model parameters reported in the work by De Guido et al. (2014 a,b), it is possible to study the solubility of carbon dioxide in liquid light hydrocarbons at low-temperature in terms of solubility and pressure-temperature diagrams for the SLVE line (Figure 3).
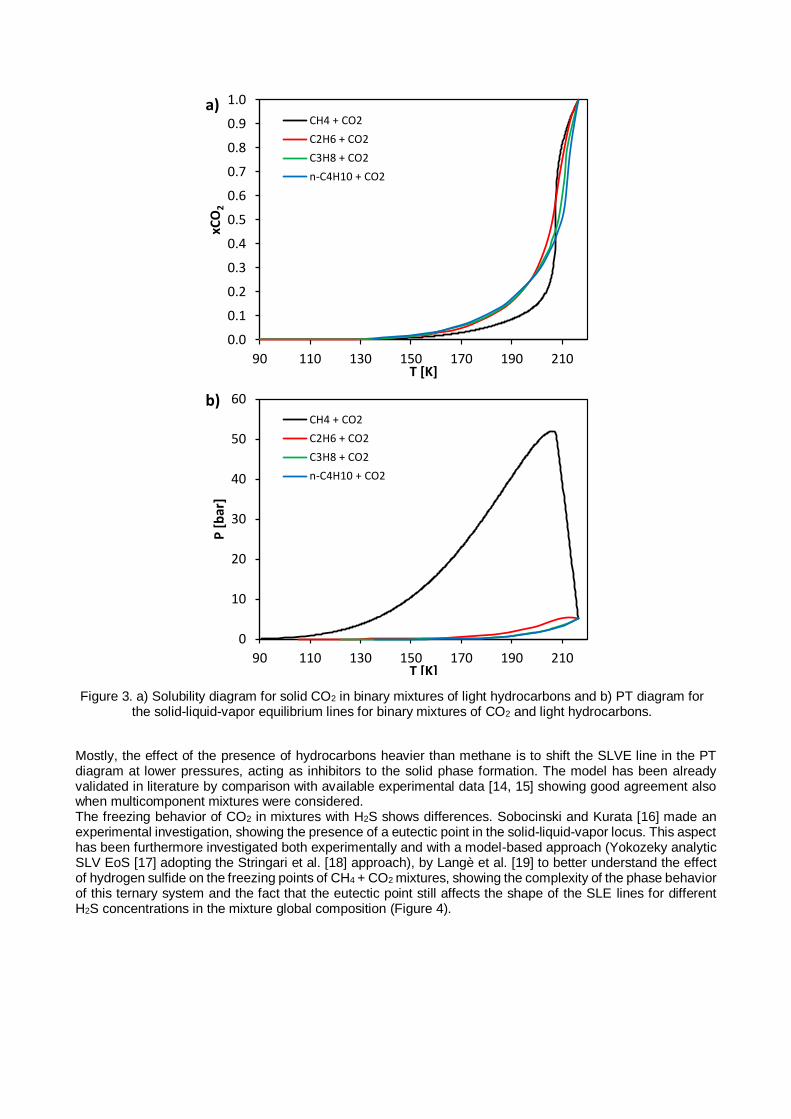
Figure 3. a) Solubility diagram for solid CO2 in binary mixtures of light hydrocarbons and b) PT diagram for the solid-liquid-vapor equilibrium lines for binary mixtures of CO2 and light hydrocarbons.
Mostly, the effect of the presence of hydrocarbons heavier than methane is to shift the SLVE line in the PT diagram at lower pressures, acting as inhibitors to the solid phase formation. The model has been already validated in literature by comparison with available experimental data [14, 15] showing good agreement also when multicomponent mixtures were considered. The freezing behavior of CO2 in mixtures with H2S shows differences. Sobocinski and Kurata [16] made an experimental investigation, showing the presence of a eutectic point in the solid-liquid-vapor locus. This aspect has been furthermore investigated both experimentally and with a model-based approach (Yokozeky analytic SLV EoS [17] adopting the Stringari et al. [18] approach), by Langè et al. [19] to better understand the effect of hydrogen sulfide on the freezing points of CH4 + CO2 mixtures, showing the complexity of the phase behavior of this ternary system and the fact that the eutectic point still affects the shape of the SLE lines for different H2S concentrations in the mixture global composition (Figure 4).
0.0
0.1
0.2
0.3
0.4
0.5
0.6
0.7
0.8
0.9
1.0
90 110 130 150 170 190 210
xCO
2
T [K]
CH4 + CO2
C2H6 + CO2
C3H8 + CO2
n-C4H10 + CO2
a)
0
10
20
30
40
50
60
90 110 130 150 170 190 210
P [
bar
]
T [K]
CH4 + CO2
C2H6 + CO2
C3H8 + CO2
n-C4H10 + CO2
b)
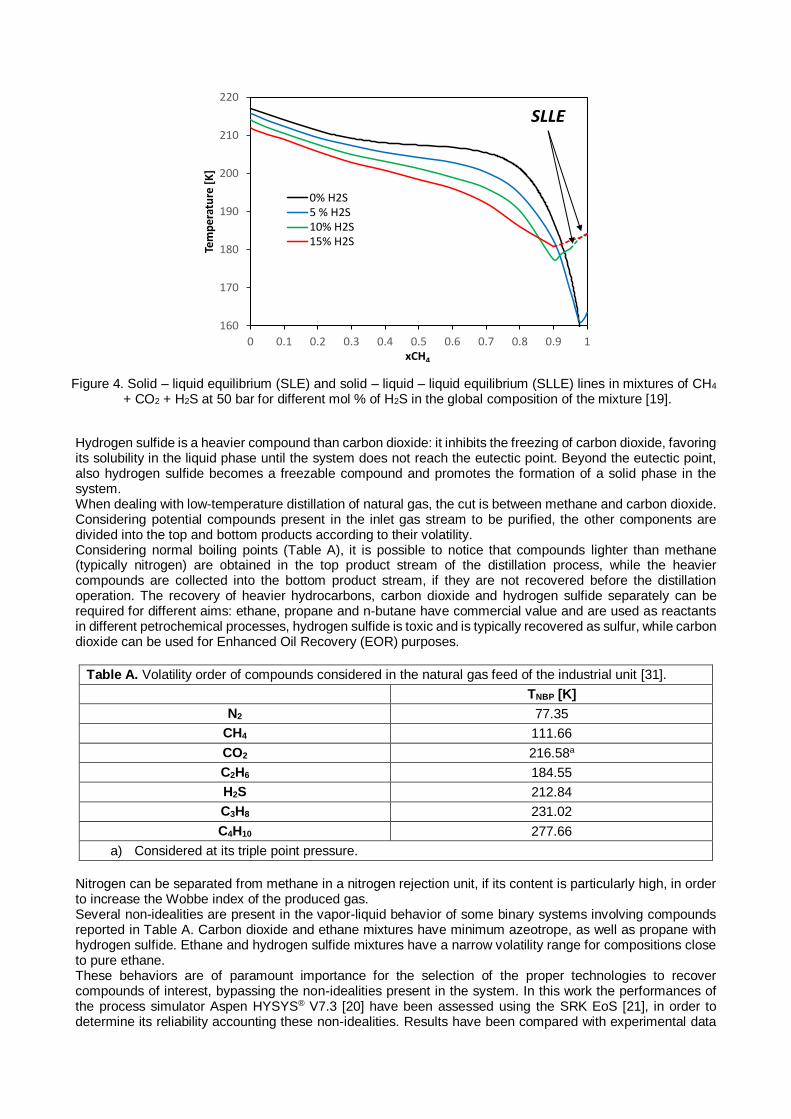
Figure 4. Solid – liquid equilibrium (SLE) and solid – liquid – liquid equilibrium (SLLE) lines in mixtures of CH4 + CO2 + H2S at 50 bar for different mol % of H2S in the global composition of the mixture [19].
Hydrogen sulfide is a heavier compound than carbon dioxide: it inhibits the freezing of carbon dioxide, favoring its solubility in the liquid phase until the system does not reach the eutectic point. Beyond the eutectic point, also hydrogen sulfide becomes a freezable compound and promotes the formation of a solid phase in the system. When dealing with low-temperature distillation of natural gas, the cut is between methane and carbon dioxide. Considering potential compounds present in the inlet gas stream to be purified, the other components are divided into the top and bottom products according to their volatility. Considering normal boiling points (Table A), it is possible to notice that compounds lighter than methane (typically nitrogen) are obtained in the top product stream of the distillation process, while the heavier compounds are collected into the bottom product stream, if they are not recovered before the distillation operation. The recovery of heavier hydrocarbons, carbon dioxide and hydrogen sulfide separately can be required for different aims: ethane, propane and n-butane have commercial value and are used as reactants in different petrochemical processes, hydrogen sulfide is toxic and is typically recovered as sulfur, while carbon dioxide can be used for Enhanced Oil Recovery (EOR) purposes.
Table A. Volatility order of compounds considered in the natural gas feed of the industrial unit [31].
TNBP [K]
N2 77.35
CH4 111.66
CO2 216.58a
C2H6 184.55
H2S 212.84
C3H8 231.02
C4H10 277.66
a) Considered at its triple point pressure.
Nitrogen can be separated from methane in a nitrogen rejection unit, if its content is particularly high, in order to increase the Wobbe index of the produced gas. Several non-idealities are present in the vapor-liquid behavior of some binary systems involving compounds reported in Table A. Carbon dioxide and ethane mixtures have minimum azeotrope, as well as propane with hydrogen sulfide. Ethane and hydrogen sulfide mixtures have a narrow volatility range for compositions close to pure ethane. These behaviors are of paramount importance for the selection of the proper technologies to recover compounds of interest, bypassing the non-idealities present in the system. In this work the performances of the process simulator Aspen HYSYS® V7.3 [20] have been assessed using the SRK EoS [21], in order to determine its reliability accounting these non-idealities. Results have been compared with experimental data
160
170
180
190
200
210
220
0 0.1 0.2 0.3 0.4 0.5 0.6 0.7 0.8 0.9 1
Tem
per
atu
re [
K]
xCH4
0% H2S5 % H2S10% H2S15% H2S
SLLE
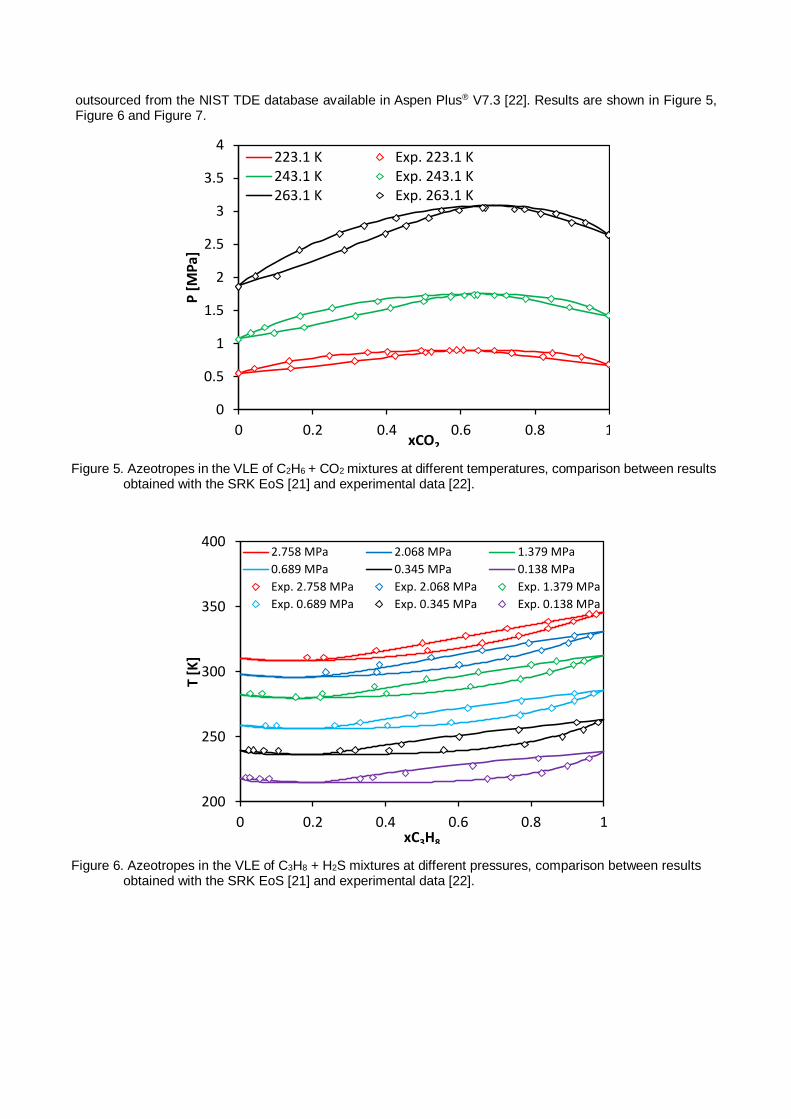
outsourced from the NIST TDE database available in Aspen Plus® V7.3 [22]. Results are shown in Figure 5, Figure 6 and Figure 7.
Figure 5. Azeotropes in the VLE of C2H6 + CO2 mixtures at different temperatures, comparison between results obtained with the SRK EoS [21] and experimental data [22].
Figure 6. Azeotropes in the VLE of C3H8 + H2S mixtures at different pressures, comparison between results obtained with the SRK EoS [21] and experimental data [22].
0
0.5
1
1.5
2
2.5
3
3.5
4
0 0.2 0.4 0.6 0.8 1
P [
MP
a]
xCO2
223.1 K Exp. 223.1 K243.1 K Exp. 243.1 K263.1 K Exp. 263.1 K
200
250
300
350
400
0 0.2 0.4 0.6 0.8 1
T [K
]
xC3H8
2.758 MPa 2.068 MPa 1.379 MPa
0.689 MPa 0.345 MPa 0.138 MPa
Exp. 2.758 MPa Exp. 2.068 MPa Exp. 1.379 MPa
Exp. 0.689 MPa Exp. 0.345 MPa Exp. 0.138 MPa
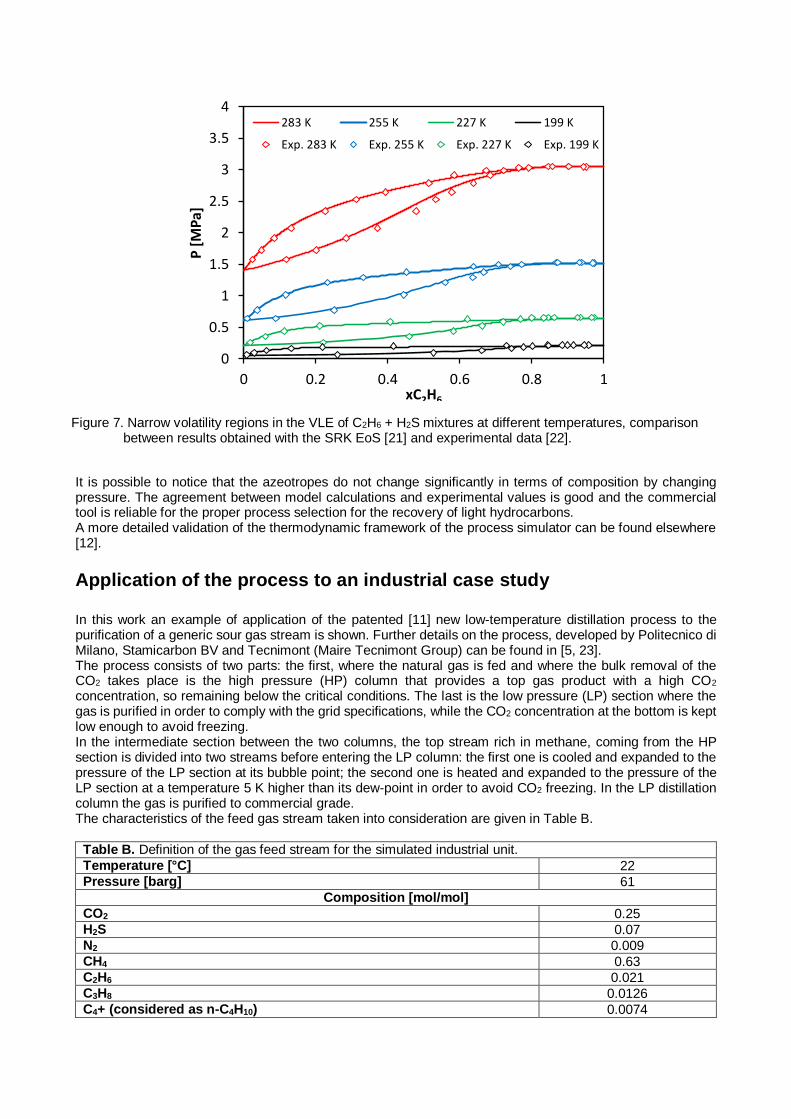
Figure 7. Narrow volatility regions in the VLE of C2H6 + H2S mixtures at different temperatures, comparison between results obtained with the SRK EoS [21] and experimental data [22].
It is possible to notice that the azeotropes do not change significantly in terms of composition by changing pressure. The agreement between model calculations and experimental values is good and the commercial tool is reliable for the proper process selection for the recovery of light hydrocarbons. A more detailed validation of the thermodynamic framework of the process simulator can be found elsewhere [12].
Application of the process to an industrial case study In this work an example of application of the patented [11] new low-temperature distillation process to the purification of a generic sour gas stream is shown. Further details on the process, developed by Politecnico di Milano, Stamicarbon BV and Tecnimont (Maire Tecnimont Group) can be found in [5, 23]. The process consists of two parts: the first, where the natural gas is fed and where the bulk removal of the CO2 takes place is the high pressure (HP) column that provides a top gas product with a high CO2 concentration, so remaining below the critical conditions. The last is the low pressure (LP) section where the gas is purified in order to comply with the grid specifications, while the CO2 concentration at the bottom is kept low enough to avoid freezing. In the intermediate section between the two columns, the top stream rich in methane, coming from the HP section is divided into two streams before entering the LP column: the first one is cooled and expanded to the pressure of the LP section at its bubble point; the second one is heated and expanded to the pressure of the LP section at a temperature 5 K higher than its dew-point in order to avoid CO2 freezing. In the LP distillation column the gas is purified to commercial grade. The characteristics of the feed gas stream taken into consideration are given in Table B.
Table B. Definition of the gas feed stream for the simulated industrial unit.
Temperature [°C] 22 Pressure [barg] 61
Composition [mol/mol]
CO2 0.25 H2S 0.07 N2 0.009 CH4 0.63 C2H6 0.021 C3H8 0.0126 C4+ (considered as n-C4H10) 0.0074
0
0.5
1
1.5
2
2.5
3
3.5
4
0 0.2 0.4 0.6 0.8 1
P [
MP
a]
xC2H6
283 K 255 K 227 K 199 K
Exp. 283 K Exp. 255 K Exp. 227 K Exp. 199 K
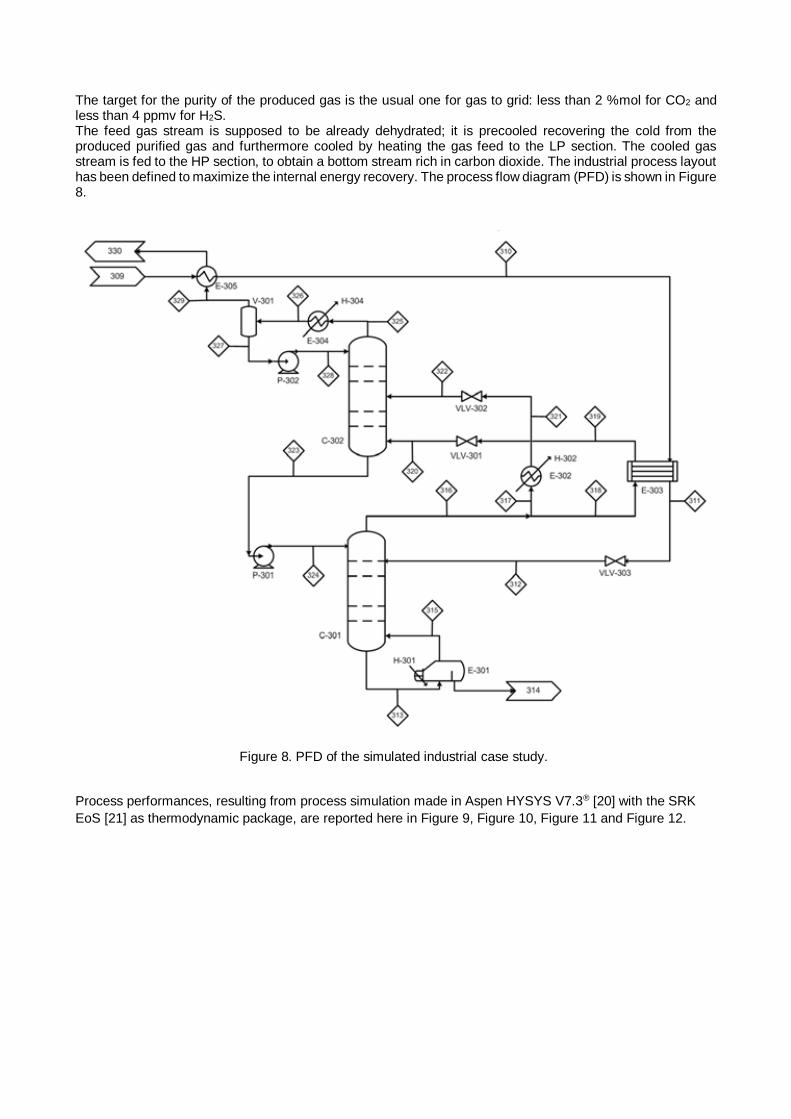
The target for the purity of the produced gas is the usual one for gas to grid: less than 2 %mol for CO2 and less than 4 ppmv for H2S. The feed gas stream is supposed to be already dehydrated; it is precooled recovering the cold from the produced purified gas and furthermore cooled by heating the gas feed to the LP section. The cooled gas stream is fed to the HP section, to obtain a bottom stream rich in carbon dioxide. The industrial process layout has been defined to maximize the internal energy recovery. The process flow diagram (PFD) is shown in Figure 8.
Figure 8. PFD of the simulated industrial case study.
Process performances, resulting from process simulation made in Aspen HYSYS V7.3® [20] with the SRK
EoS [21] as thermodynamic package, are reported here in Figure 9, Figure 10, Figure 11 and Figure 12.
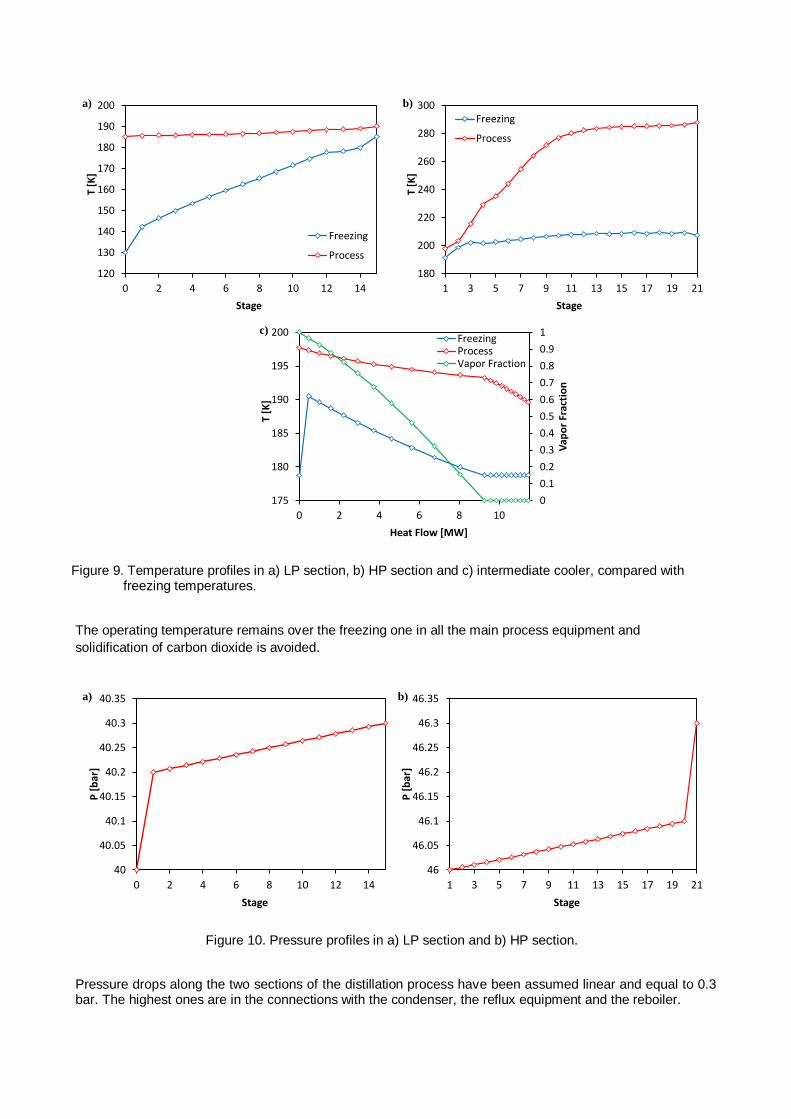
Figure 9. Temperature profiles in a) LP section, b) HP section and c) intermediate cooler, compared with freezing temperatures.
The operating temperature remains over the freezing one in all the main process equipment and
solidification of carbon dioxide is avoided.
Figure 10. Pressure profiles in a) LP section and b) HP section.
Pressure drops along the two sections of the distillation process have been assumed linear and equal to 0.3 bar. The highest ones are in the connections with the condenser, the reflux equipment and the reboiler.
120
130
140
150
160
170
180
190
200
0 2 4 6 8 10 12 14
T [K
]
Stage
Freezing
Process
180
200
220
240
260
280
300
1 3 5 7 9 11 13 15 17 19 21
T [K
]
Stage
Freezing
Process
0
0.1
0.2
0.3
0.4
0.5
0.6
0.7
0.8
0.9
1
175
180
185
190
195
200
0 2 4 6 8 10
Vap
or
Frac
tio
n
T [K
]
Heat Flow [MW]
FreezingProcessVapor Fraction
a) b)
c)
40
40.05
40.1
40.15
40.2
40.25
40.3
40.35
0 2 4 6 8 10 12 14
P [
bar
]
Stage
46
46.05
46.1
46.15
46.2
46.25
46.3
46.35
1 3 5 7 9 11 13 15 17 19 21
P [
bar
]
Stage
a) b)
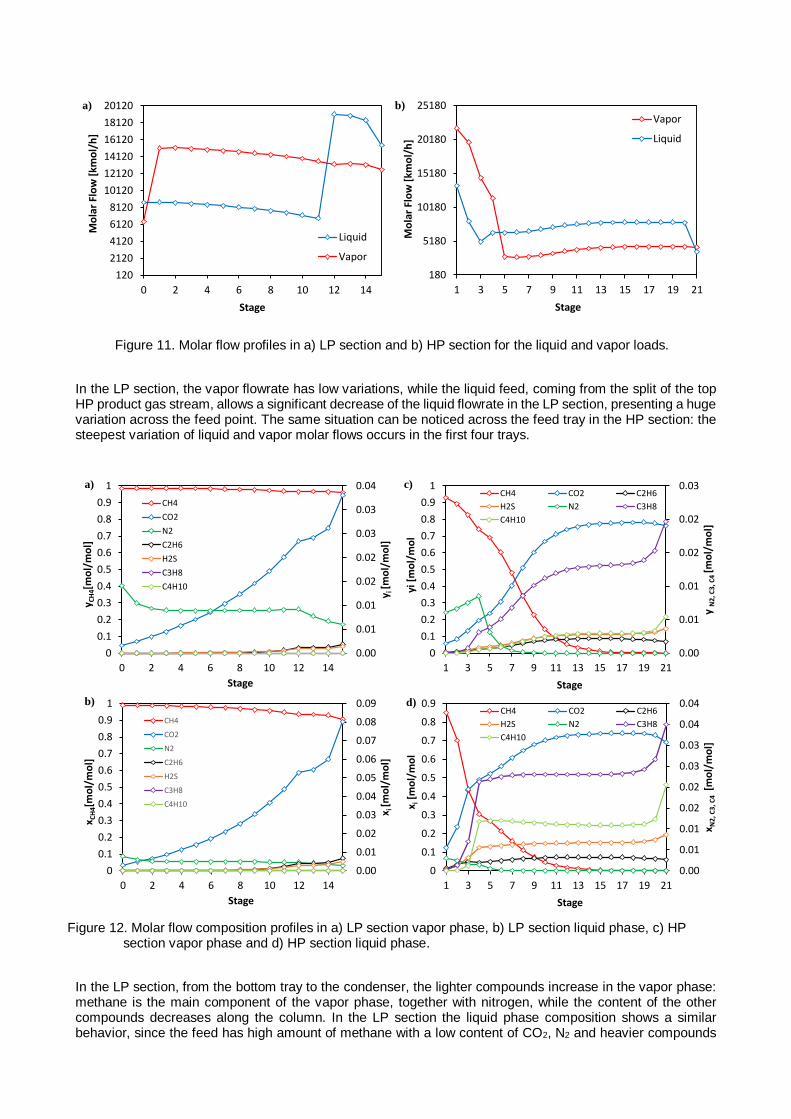
Figure 11. Molar flow profiles in a) LP section and b) HP section for the liquid and vapor loads.
In the LP section, the vapor flowrate has low variations, while the liquid feed, coming from the split of the top HP product gas stream, allows a significant decrease of the liquid flowrate in the LP section, presenting a huge variation across the feed point. The same situation can be noticed across the feed tray in the HP section: the steepest variation of liquid and vapor molar flows occurs in the first four trays.
Figure 12. Molar flow composition profiles in a) LP section vapor phase, b) LP section liquid phase, c) HP
section vapor phase and d) HP section liquid phase.
In the LP section, from the bottom tray to the condenser, the lighter compounds increase in the vapor phase: methane is the main component of the vapor phase, together with nitrogen, while the content of the other compounds decreases along the column. In the LP section the liquid phase composition shows a similar behavior, since the feed has high amount of methane with a low content of CO2, N2 and heavier compounds
180
5180
10180
15180
20180
25180
1 3 5 7 9 11 13 15 17 19 21
Mo
lar
Flo
w [
kmo
l/h
]
Stage
Vapor
Liquid
120
2120
4120
6120
8120
10120
12120
14120
16120
18120
20120
0 2 4 6 8 10 12 14
Mo
lar
Flo
w [
kmo
l/h
]
Stage
Liquid
Vapor
a) b)
0.00
0.01
0.01
0.02
0.02
0.03
0.03
0.04
0
0.1
0.2
0.3
0.4
0.5
0.6
0.7
0.8
0.9
1
0 2 4 6 8 10 12 14
y i [m
ol/
mo
l]
y CH
4[m
ol/
mo
l]
Stage
CH4
CO2
N2
C2H6
H2S
C3H8
C4H10
0.00
0.01
0.02
0.03
0.04
0.05
0.06
0.07
0.08
0.09
0
0.1
0.2
0.3
0.4
0.5
0.6
0.7
0.8
0.9
1
0 2 4 6 8 10 12 14
x i [m
ol/
mo
l]
x CH
4[m
ol/
mo
l]
Stage
CH4
CO2
N2
C2H6
H2S
C3H8
C4H10
0.00
0.01
0.01
0.02
0.02
0.03
0
0.1
0.2
0.3
0.4
0.5
0.6
0.7
0.8
0.9
1
1 3 5 7 9 11 13 15 17 19 21
y N
2, C
3, C
4 [m
ol/
mo
l]
yi [
mo
l/m
ol
Stage
CH4 CO2 C2H6
H2S N2 C3H8
C4H10
0.00
0.01
0.01
0.02
0.02
0.03
0.03
0.04
0.04
0
0.1
0.2
0.3
0.4
0.5
0.6
0.7
0.8
0.9
1 3 5 7 9 11 13 15 17 19 21
x N2
, C3
, C4
[m
ol/
mo
l]
x i[m
ol/
mo
l
Stage
CH4 CO2 C2H6
H2S N2 C3H8
C4H10
a) c)
b) d)
in traces. In this way, the role of the LP section is to purify the gas coming from the HP section to the commercial grade. The biggest removal of carbon dioxide, hydrogen sulfide and heavier hydrocarbons occurs in the HP section, where the concentration of CO2, H2S, C2H6, C3H8 and n-C4H10 increases from the top tray to the reboiler. Looking at the profile of heavier hydrocarbons, carbon dioxide and hydrogen sulfide in the HP section, a significant variation is present across the feed tray. This clearly shows how the HP section performs the bulk separation, while the finishingis obtained in the LP section. The process is able to perform the desired purification, allowing the recovery of a natural gas product that fulfills the required levels of purity for the market and, at the same time, the formation of a solid phase is avoided in all the parts of the process equipment.
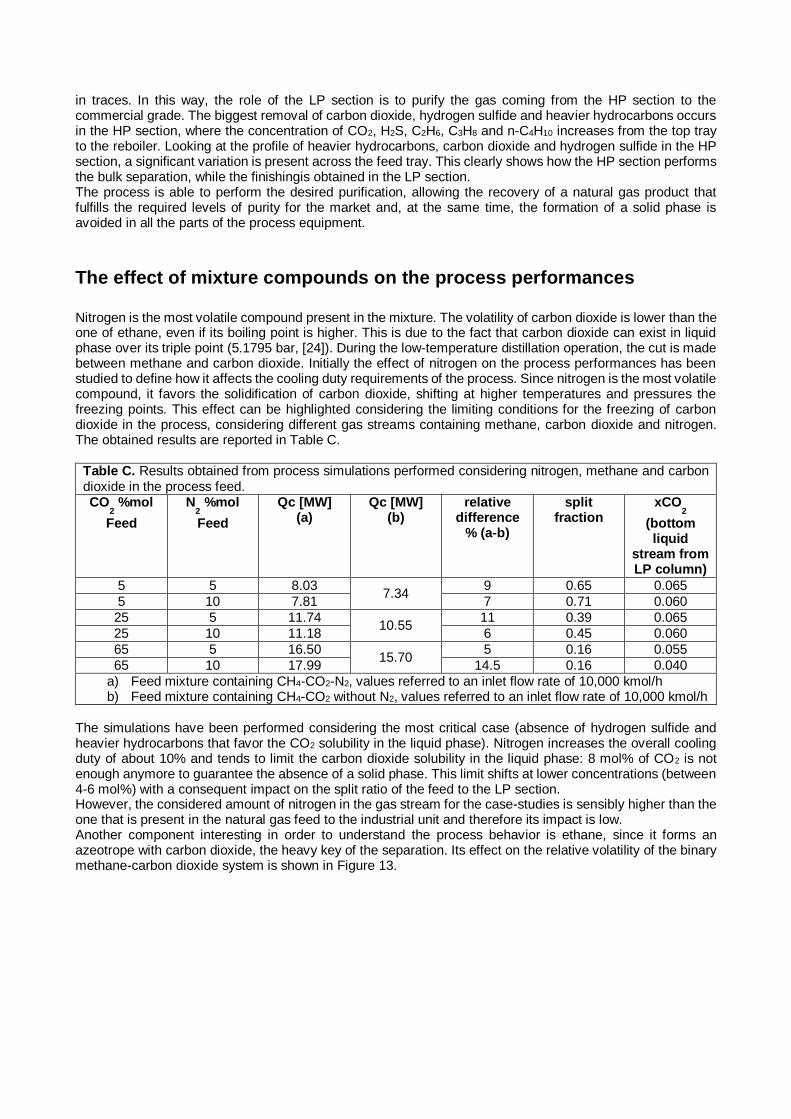
The effect of mixture compounds on the process performances Nitrogen is the most volatile compound present in the mixture. The volatility of carbon dioxide is lower than the one of ethane, even if its boiling point is higher. This is due to the fact that carbon dioxide can exist in liquid phase over its triple point (5.1795 bar, [24]). During the low-temperature distillation operation, the cut is made between methane and carbon dioxide. Initially the effect of nitrogen on the process performances has been studied to define how it affects the cooling duty requirements of the process. Since nitrogen is the most volatile compound, it favors the solidification of carbon dioxide, shifting at higher temperatures and pressures the freezing points. This effect can be highlighted considering the limiting conditions for the freezing of carbon dioxide in the process, considering different gas streams containing methane, carbon dioxide and nitrogen. The obtained results are reported in Table C.
Table C. Results obtained from process simulations performed considering nitrogen, methane and carbon dioxide in the process feed. CO
2 %mol
Feed
N2 %mol
Feed
Qc [MW] (a)
Qc [MW] (b)
relative difference
% (a-b)
split fraction
xCO2
(bottom liquid
stream from LP column)
5 5 8.03 7.34
9 0.65 0.065
5 10 7.81 7 0.71 0.060
25 5 11.74 10.55
11 0.39 0.065
25 10 11.18 6 0.45 0.060
65 5 16.50 15.70
5 0.16 0.055
65 10 17.99 14.5 0.16 0.040
a) Feed mixture containing CH4-CO2-N2, values referred to an inlet flow rate of 10,000 kmol/h b) Feed mixture containing CH4-CO2 without N2, values referred to an inlet flow rate of 10,000 kmol/h
The simulations have been performed considering the most critical case (absence of hydrogen sulfide and heavier hydrocarbons that favor the CO2 solubility in the liquid phase). Nitrogen increases the overall cooling duty of about 10% and tends to limit the carbon dioxide solubility in the liquid phase: 8 mol% of CO2 is not enough anymore to guarantee the absence of a solid phase. This limit shifts at lower concentrations (between 4-6 mol%) with a consequent impact on the split ratio of the feed to the LP section. However, the considered amount of nitrogen in the gas stream for the case-studies is sensibly higher than the one that is present in the natural gas feed to the industrial unit and therefore its impact is low. Another component interesting in order to understand the process behavior is ethane, since it forms an azeotrope with carbon dioxide, the heavy key of the separation. Its effect on the relative volatility of the binary methane-carbon dioxide system is shown in Figure 13.
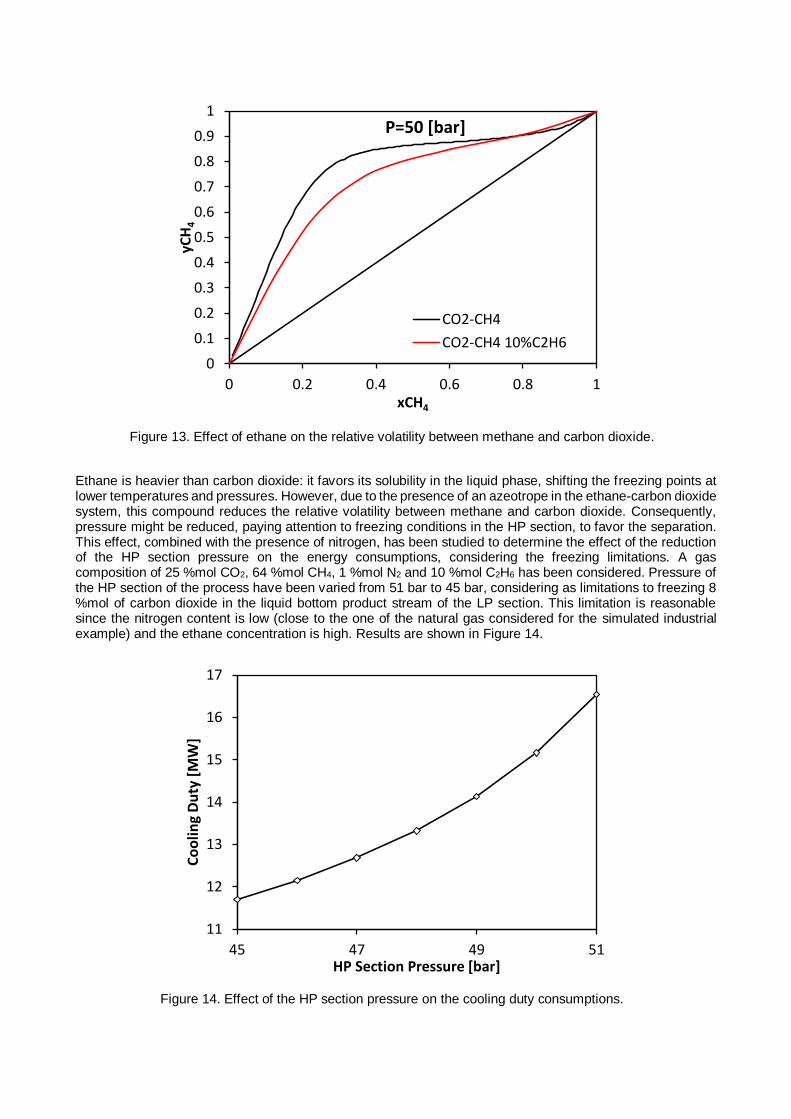
Figure 13. Effect of ethane on the relative volatility between methane and carbon dioxide.
Ethane is heavier than carbon dioxide: it favors its solubility in the liquid phase, shifting the freezing points at lower temperatures and pressures. However, due to the presence of an azeotrope in the ethane-carbon dioxide system, this compound reduces the relative volatility between methane and carbon dioxide. Consequently, pressure might be reduced, paying attention to freezing conditions in the HP section, to favor the separation. This effect, combined with the presence of nitrogen, has been studied to determine the effect of the reduction of the HP section pressure on the energy consumptions, considering the freezing limitations. A gas composition of 25 %mol CO2, 64 %mol CH4, 1 %mol N2 and 10 %mol C2H6 has been considered. Pressure of the HP section of the process have been varied from 51 bar to 45 bar, considering as limitations to freezing 8 %mol of carbon dioxide in the liquid bottom product stream of the LP section. This limitation is reasonable since the nitrogen content is low (close to the one of the natural gas considered for the simulated industrial example) and the ethane concentration is high. Results are shown in Figure 14.
Figure 14. Effect of the HP section pressure on the cooling duty consumptions.
0
0.1
0.2
0.3
0.4
0.5
0.6
0.7
0.8
0.9
1
0 0.2 0.4 0.6 0.8 1
yCH
4
xCH4
P=50 [bar]
CO2-CH4
CO2-CH4 10%C2H6
11
12
13
14
15
16
17
45 47 49 51
Co
oli
ng
Du
ty [
MW
]
HP Section Pressure [bar]
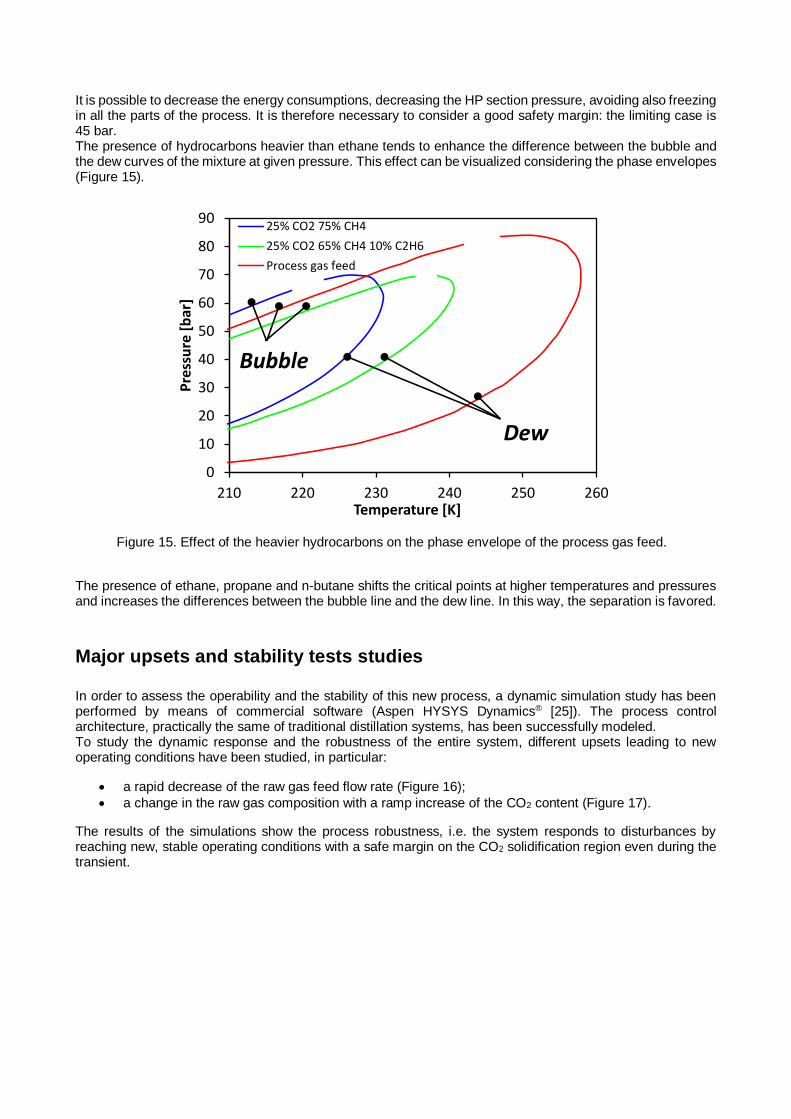
It is possible to decrease the energy consumptions, decreasing the HP section pressure, avoiding also freezing in all the parts of the process. It is therefore necessary to consider a good safety margin: the limiting case is 45 bar. The presence of hydrocarbons heavier than ethane tends to enhance the difference between the bubble and the dew curves of the mixture at given pressure. This effect can be visualized considering the phase envelopes (Figure 15).
Figure 15. Effect of the heavier hydrocarbons on the phase envelope of the process gas feed.
The presence of ethane, propane and n-butane shifts the critical points at higher temperatures and pressures and increases the differences between the bubble line and the dew line. In this way, the separation is favored.
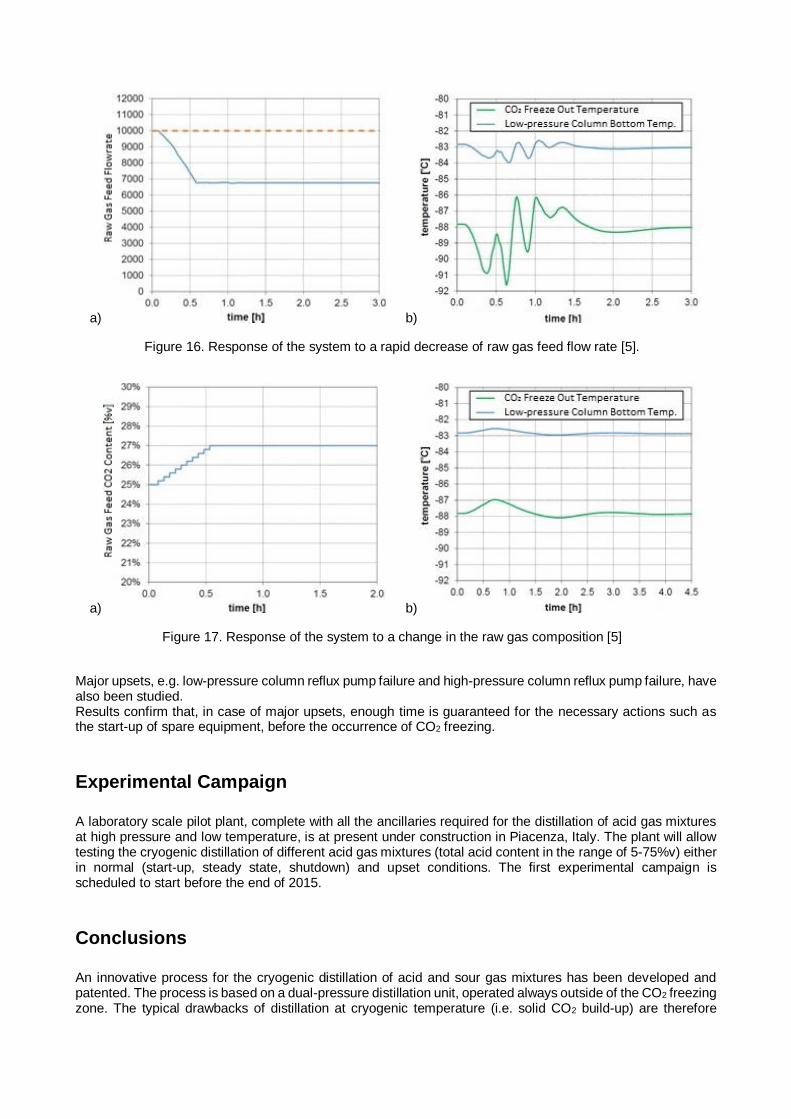
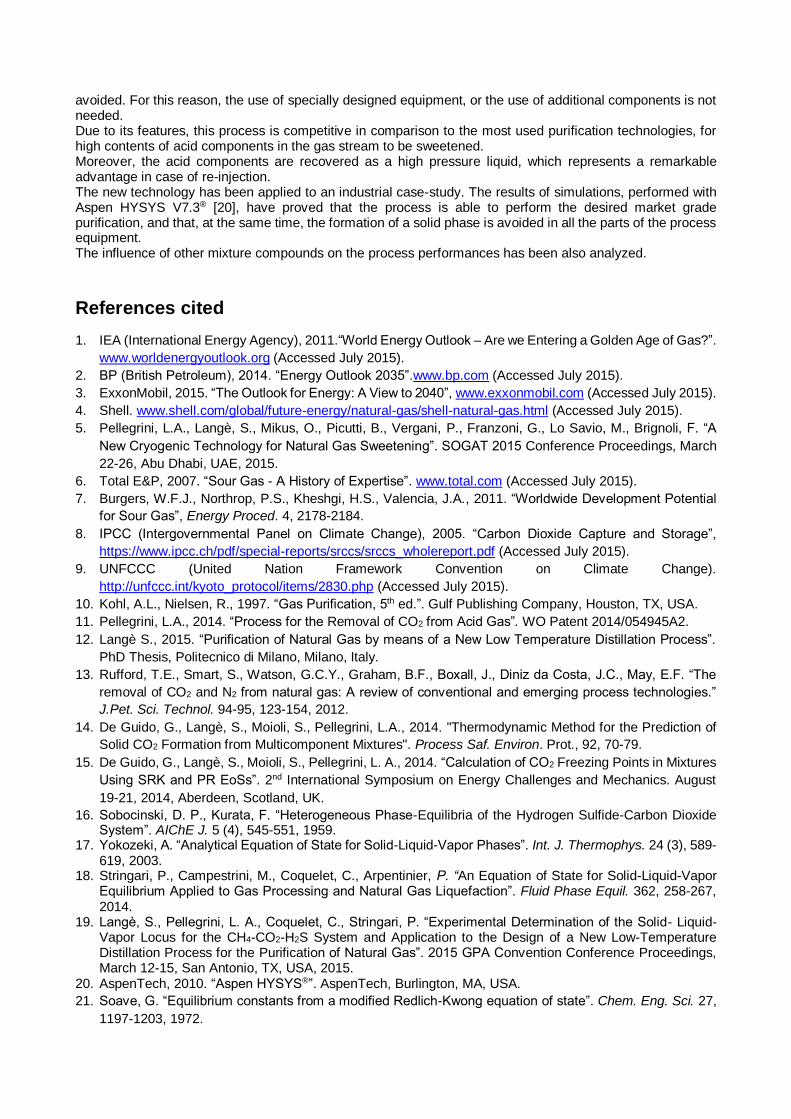
Major upsets and stability tests studies In order to assess the operability and the stability of this new process, a dynamic simulation study has been performed by means of commercial software (Aspen HYSYS Dynamics® [25]). The process control architecture, practically the same of traditional distillation systems, has been successfully modeled. To study the dynamic response and the robustness of the entire system, different upsets leading to new operating conditions have been studied, in particular:
a rapid decrease of the raw gas feed flow rate (Figure 16);
a change in the raw gas composition with a ramp increase of the CO2 content (Figure 17).
The results of the simulations show the process robustness, i.e. the system responds to disturbances by reaching new, stable operating conditions with a safe margin on the CO2 solidification region even during the transient.
0
10
20
30
40
50
60
70
80
90
210 220 230 240 250 260
Pre
ssu
re [
bar
]
Temperature [K]
25% CO2 75% CH4
25% CO2 65% CH4 10% C2H6
Process gas feed
Dew
Bubble
a) b)
Figure 16. Response of the system to a rapid decrease of raw gas feed flow rate [5].
a) b)
Figure 17. Response of the system to a change in the raw gas composition [5]
Major upsets, e.g. low-pressure column reflux pump failure and high-pressure column reflux pump failure, have also been studied. Results confirm that, in case of major upsets, enough time is guaranteed for the necessary actions such as the start-up of spare equipment, before the occurrence of CO2 freezing.
Experimental Campaign A laboratory scale pilot plant, complete with all the ancillaries required for the distillation of acid gas mixtures at high pressure and low temperature, is at present under construction in Piacenza, Italy. The plant will allow testing the cryogenic distillation of different acid gas mixtures (total acid content in the range of 5-75%v) either in normal (start-up, steady state, shutdown) and upset conditions. The first experimental campaign is scheduled to start before the end of 2015.
Conclusions An innovative process for the cryogenic distillation of acid and sour gas mixtures has been developed and patented. The process is based on a dual-pressure distillation unit, operated always outside of the CO2 freezing zone. The typical drawbacks of distillation at cryogenic temperature (i.e. solid CO2 build-up) are therefore
avoided. For this reason, the use of specially designed equipment, or the use of additional components is not needed. Due to its features, this process is competitive in comparison to the most used purification technologies, for high contents of acid components in the gas stream to be sweetened. Moreover, the acid components are recovered as a high pressure liquid, which represents a remarkable advantage in case of re-injection. The new technology has been applied to an industrial case-study. The results of simulations, performed with Aspen HYSYS V7.3® [20], have proved that the process is able to perform the desired market grade purification, and that, at the same time, the formation of a solid phase is avoided in all the parts of the process equipment. The influence of other mixture compounds on the process performances has been also analyzed.
References cited
1. IEA (International Energy Agency), 2011.“World Energy Outlook – Are we Entering a Golden Age of Gas?”.
www.worldenergyoutlook.org (Accessed July 2015).
2. BP (British Petroleum), 2014. “Energy Outlook 2035”.www.bp.com (Accessed July 2015).
3. ExxonMobil, 2015. “The Outlook for Energy: A View to 2040”, www.exxonmobil.com (Accessed July 2015).
4. Shell. www.shell.com/global/future-energy/natural-gas/shell-natural-gas.html (Accessed July 2015).
5. Pellegrini, L.A., Langè, S., Mikus, O., Picutti, B., Vergani, P., Franzoni, G., Lo Savio, M., Brignoli, F. “A
New Cryogenic Technology for Natural Gas Sweetening”. SOGAT 2015 Conference Proceedings, March
22-26, Abu Dhabi, UAE, 2015.
6. Total E&P, 2007. “Sour Gas - A History of Expertise”. www.total.com (Accessed July 2015).
7. Burgers, W.F.J., Northrop, P.S., Kheshgi, H.S., Valencia, J.A., 2011. “Worldwide Development Potential
for Sour Gas”, Energy Proced. 4, 2178-2184.
8. IPCC (Intergovernmental Panel on Climate Change), 2005. “Carbon Dioxide Capture and Storage”,
https://www.ipcc.ch/pdf/special-reports/srccs/srccs_wholereport.pdf (Accessed July 2015).
9. UNFCCC (United Nation Framework Convention on Climate Change).
http://unfccc.int/kyoto_protocol/items/2830.php (Accessed July 2015).
10. Kohl, A.L., Nielsen, R., 1997. “Gas Purification, 5th ed.”. Gulf Publishing Company, Houston, TX, USA.
11. Pellegrini, L.A., 2014. “Process for the Removal of CO2 from Acid Gas”. WO Patent 2014/054945A2.
12. Langè S., 2015. “Purification of Natural Gas by means of a New Low Temperature Distillation Process”.
PhD Thesis, Politecnico di Milano, Milano, Italy.
13. Rufford, T.E., Smart, S., Watson, G.C.Y., Graham, B.F., Boxall, J., Diniz da Costa, J.C., May, E.F. “The
removal of CO2 and N2 from natural gas: A review of conventional and emerging process technologies.”
J.Pet. Sci. Technol. 94-95, 123-154, 2012.
14. De Guido, G., Langè, S., Moioli, S., Pellegrini, L.A., 2014. "Thermodynamic Method for the Prediction of
Solid CO2 Formation from Multicomponent Mixtures". Process Saf. Environ. Prot., 92, 70-79.
15. De Guido, G., Langè, S., Moioli, S., Pellegrini, L. A., 2014. “Calculation of CO2 Freezing Points in Mixtures
Using SRK and PR EoSs”. 2nd International Symposium on Energy Challenges and Mechanics. August
19-21, 2014, Aberdeen, Scotland, UK.
16. Sobocinski, D. P., Kurata, F. “Heterogeneous Phase-Equilibria of the Hydrogen Sulfide-Carbon Dioxide System”. AIChE J. 5 (4), 545-551, 1959.
17. Yokozeki, A. “Analytical Equation of State for Solid-Liquid-Vapor Phases”. Int. J. Thermophys. 24 (3), 589-619, 2003.
18. Stringari, P., Campestrini, M., Coquelet, C., Arpentinier, P. “An Equation of State for Solid-Liquid-Vapor Equilibrium Applied to Gas Processing and Natural Gas Liquefaction”. Fluid Phase Equil. 362, 258-267, 2014.
19. Langè, S., Pellegrini, L. A., Coquelet, C., Stringari, P. “Experimental Determination of the Solid- Liquid-Vapor Locus for the CH4-CO2-H2S System and Application to the Design of a New Low-Temperature Distillation Process for the Purification of Natural Gas”. 2015 GPA Convention Conference Proceedings, March 12-15, San Antonio, TX, USA, 2015.
20. AspenTech, 2010. “Aspen HYSYS®”. AspenTech, Burlington, MA, USA.
21. Soave, G. “Equilibrium constants from a modified Redlich-Kwong equation of state”. Chem. Eng. Sci. 27,
1197-1203, 1972.

22. Aspen Plus® V7.3. “NIST TDE in Aspen Properties Databank®”, Aspen Technology, Inc., Burlington,
Massachusetts, USA, 2010.
23. Langè, S., Pellegrini, L.A., Vergani, P., Lo Savio, M. “Energy and Economic Analysis of a New Low-Temperature Distillation Process for the Upgrading of High-CO2 Content Natural Gas Streams" accepted for publication by Industrial & Engineering Chemistry Research.
24. Huber, M.L., McLinden, M.O., Lemmon, E.W. “NIST Standard Reference Database 23, Reference Fluid
Thermodynamic and Transport Properties-REFPROP, Version 8.0”. National Institute of Standards and
Technology, Standard Reference Data Program, Gaithersburg, 2007.
25. AspenTech, 2010. “Aspen HYSYS® Dynamic Modeling Guide”. AspenTech, Burlington, MA, USA.