An Innovative Risk-based Fire Analysis and Passive Fire ... Innovative... · Passive Fire...
19
An Innovative Risk-based Fire Analysis and Passive Fire Protection (PFP) Optimization for Safer and Economical Design Ali Sari, Ph.D., P.E. Genesis Houston, Structural and Quantitative Analysis Manager E-mail: [email protected] [email protected] 66 th Canadian Chemical Engineering Conference QUÉBEC CITY, QC OCTOBER 16-19, 2016 Ali Sari, Ph.D., P.E., Sepehr Dara, Ph.D., Umid Azimov, P.E.
Transcript of An Innovative Risk-based Fire Analysis and Passive Fire ... Innovative... · Passive Fire...
An Innovative Risk-based Fire Analysis and
Passive Fire Protection (PFP) Optimization
for Safer and Economical Design
Ali Sari, Ph.D., P.E.
Genesis Houston, Structural and Quantitative Analysis Manager
E-mail: [email protected]
66th Canadian Chemical Engineering
Conference
QUÉBEC CITY, QC
OCTOBER 16-19, 2016
Ali Sari, Ph.D., P.E., Sepehr Dara, Ph.D., Umid Azimov, P.E.
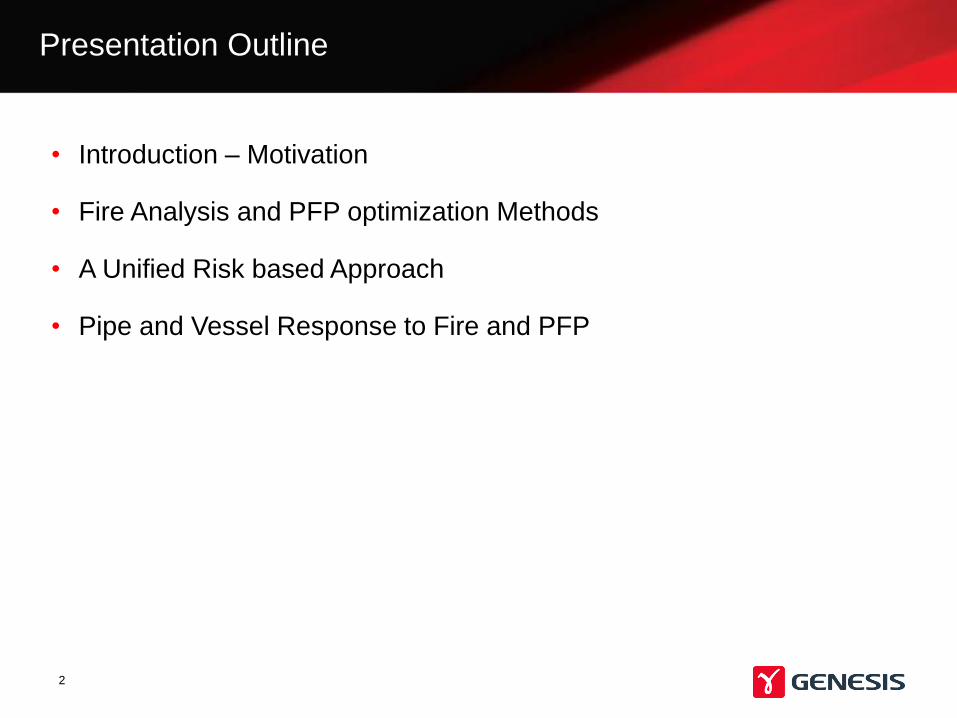
• Introduction – Motivation
• Fire Analysis and PFP optimization Methods
• A Unified Risk based Approach
• Pipe and Vessel Response to Fire and PFP
Presentation Outline
2
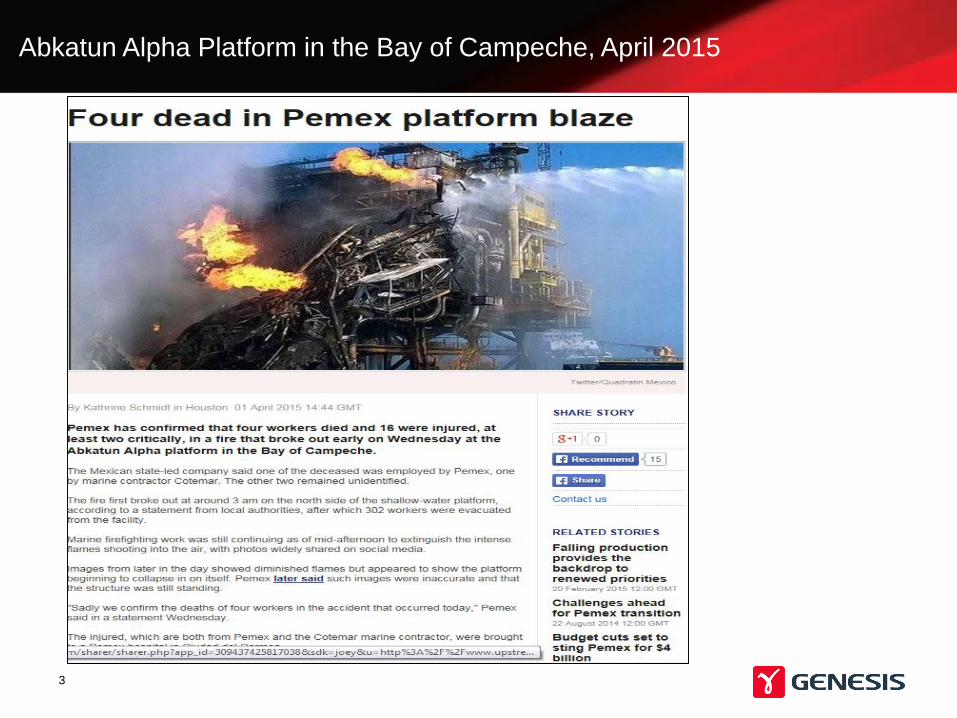
Abkatun Alpha Platform in the Bay of Campeche, April 2015
3
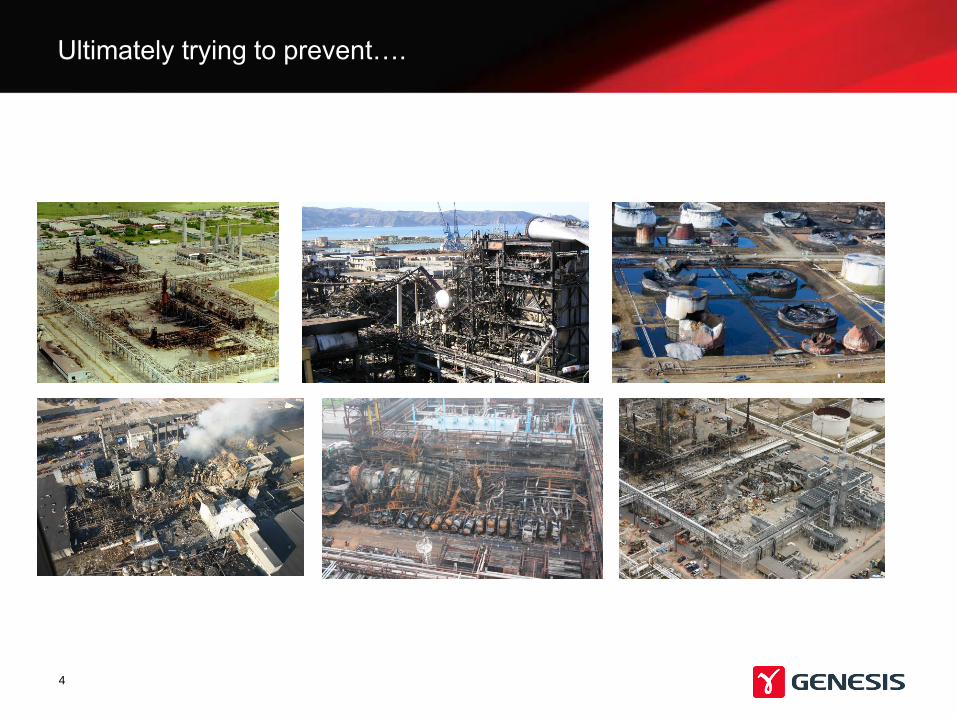
Ultimately trying to prevent….
4
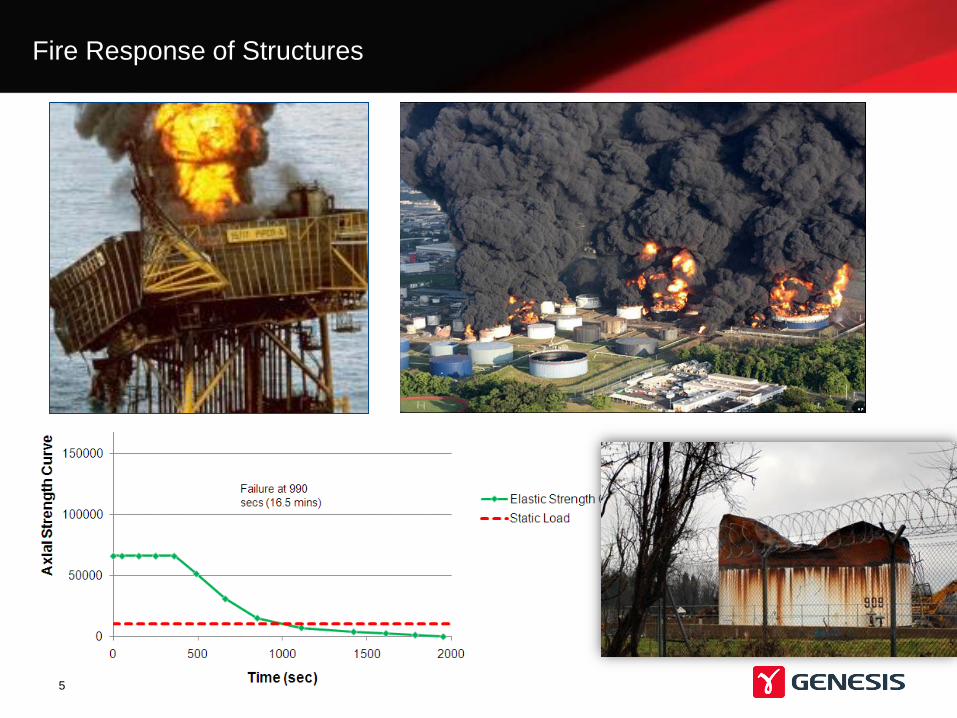
Fire Response of Structures
5
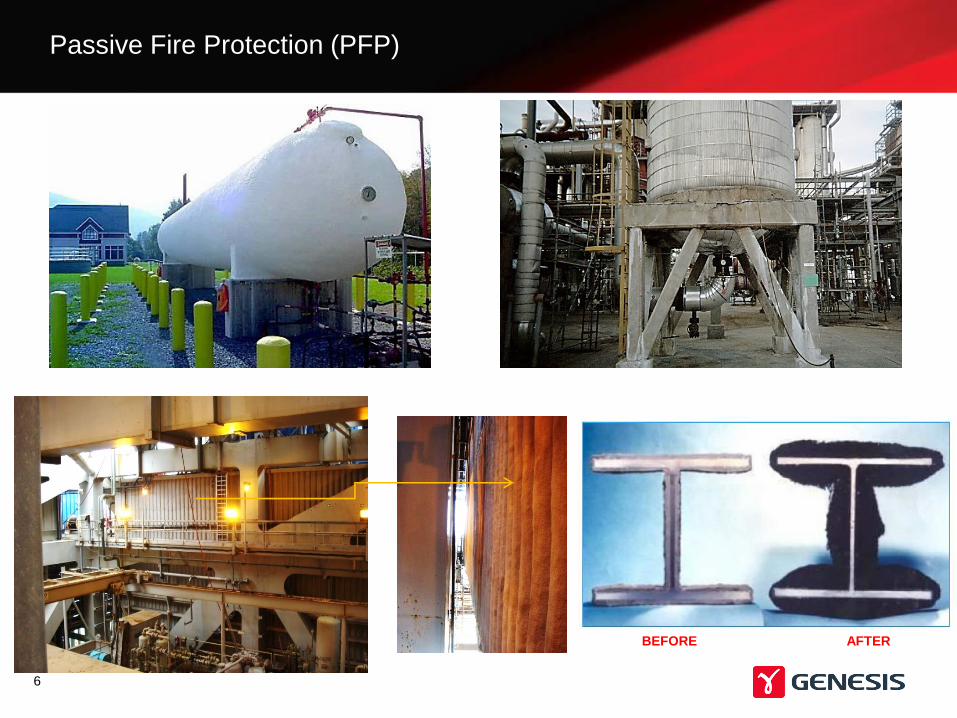
Passive Fire Protection (PFP)
BEFORE AFTER
6
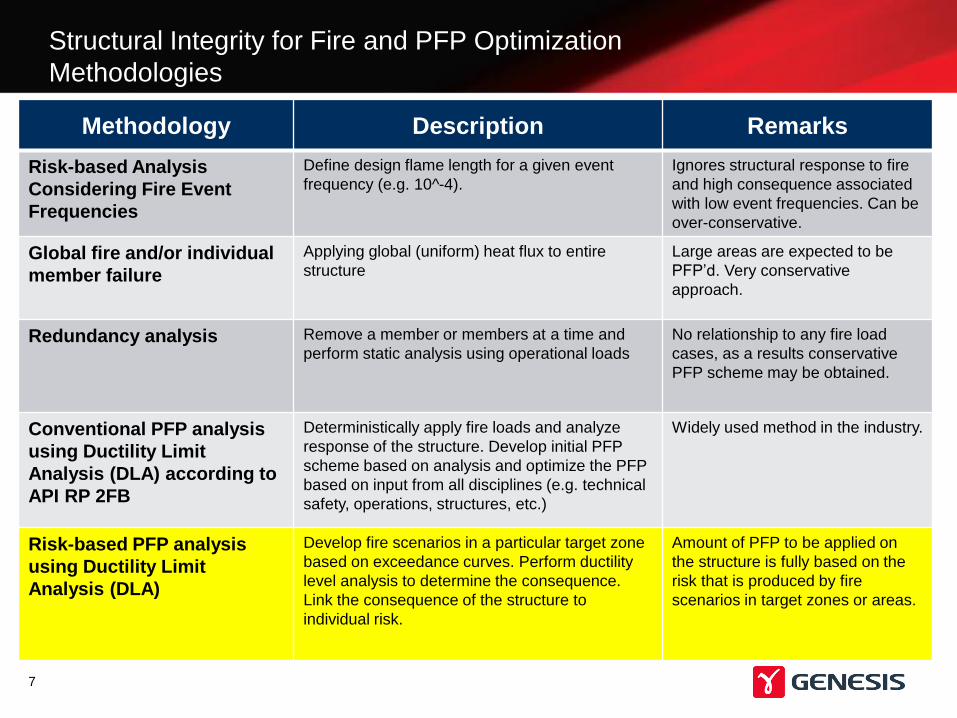
Structural Integrity for Fire and PFP Optimization
Methodologies
7
Methodology Description Remarks
Risk-based Analysis
Considering Fire Event
Frequencies
Define design flame length for a given event
frequency (e.g. 10^-4).
Ignores structural response to fire
and high consequence associated
with low event frequencies. Can be
over-conservative.
Global fire and/or individual
member failure
Applying global (uniform) heat flux to entire
structure
Large areas are expected to be
PFP’d. Very conservative
approach.
Redundancy analysis Remove a member or members at a time and
perform static analysis using operational loads
No relationship to any fire load
cases, as a results conservative
PFP scheme may be obtained.
Conventional PFP analysis
using Ductility Limit
Analysis (DLA) according to
API RP 2FB
Deterministically apply fire loads and analyze
response of the structure. Develop initial PFP
scheme based on analysis and optimize the PFP
based on input from all disciplines (e.g. technical
safety, operations, structures, etc.)
Widely used method in the industry.
Risk-based PFP analysis
using Ductility Limit
Analysis (DLA)
Develop fire scenarios in a particular target zone
based on exceedance curves. Perform ductility
level analysis to determine the consequence.
Link the consequence of the structure to
individual risk.
Amount of PFP to be applied on
the structure is fully based on the
risk that is produced by fire
scenarios in target zones or areas.
Benefits of Proposed PFP Optimization
• Significant Reduction in Installation Cost of PFP (Up to
50%),
– $2 - $15 million saving, Recent Onshore and Offshore
Projects
• Significant Reduction in Maintenance Cost
• Reduction in Weight of the Structure
8
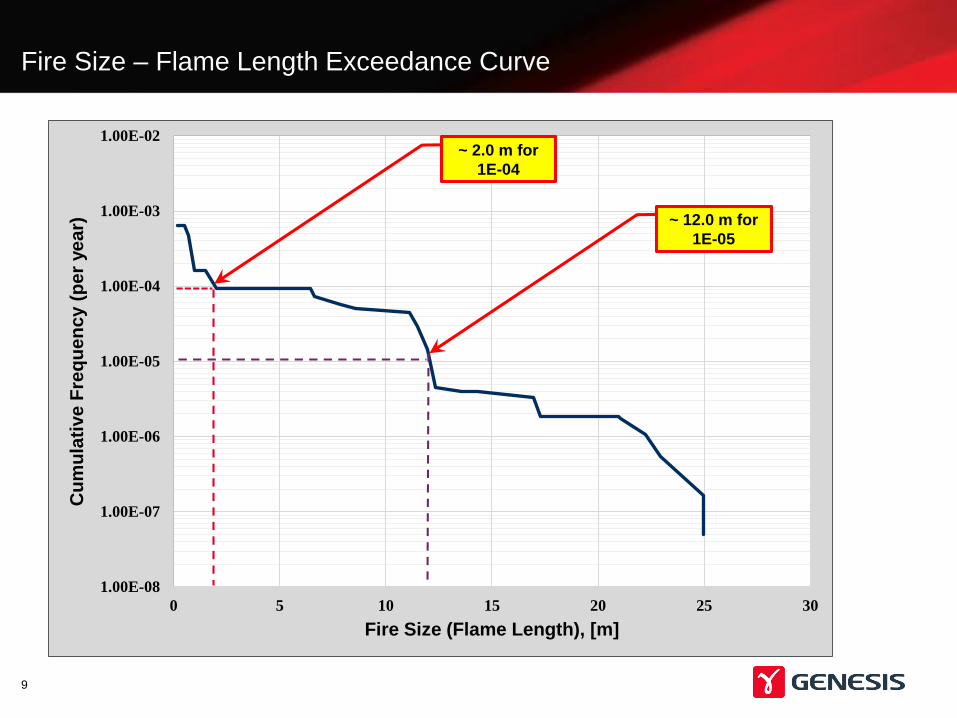
Fire Size – Flame Length Exceedance Curve
9
1.00E-08
1.00E-07
1.00E-06
1.00E-05
1.00E-04
1.00E-03
1.00E-02
0 5 10 15 20 25 30
Cu
mu
lati
ve
Fre
qu
en
cy (
pe
r ye
ar)
Fire Size (Flame Length), [m]
~ 2.0 m for
1E-04
~ 12.0 m for
1E-05

Without PFP on Upper Deck Beams Framing into Crane Pedestal
10
Plastic Utilization Contours
Failure time = 5 - 6 mins
Fire Loading
Crane Pedestal and its Support - Fire Response without PFP
11
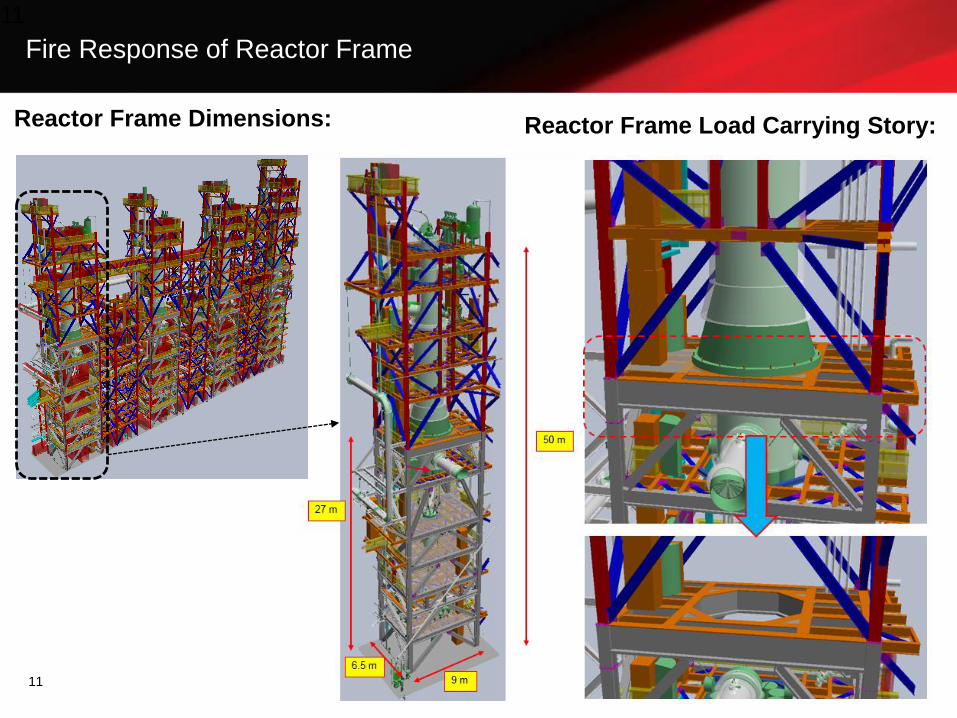
Fire Response of Reactor Frame
Reactor Frame Dimensions: Reactor Frame Load Carrying Story:
11
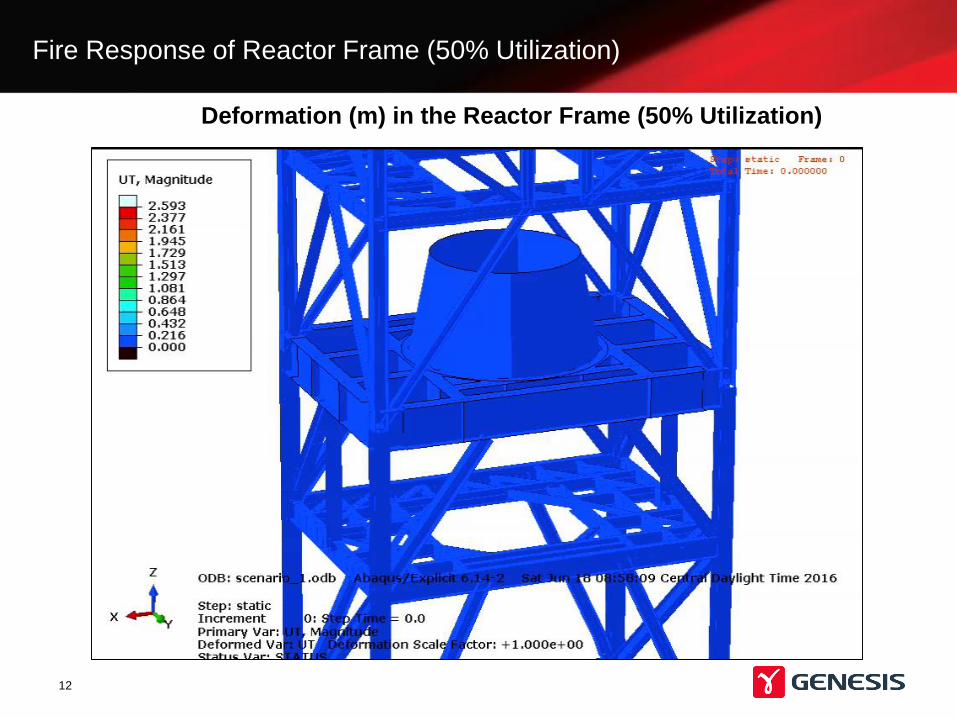
Fire Response of Reactor Frame (50% Utilization)
Deformation (m) in the Reactor Frame (50% Utilization)
12
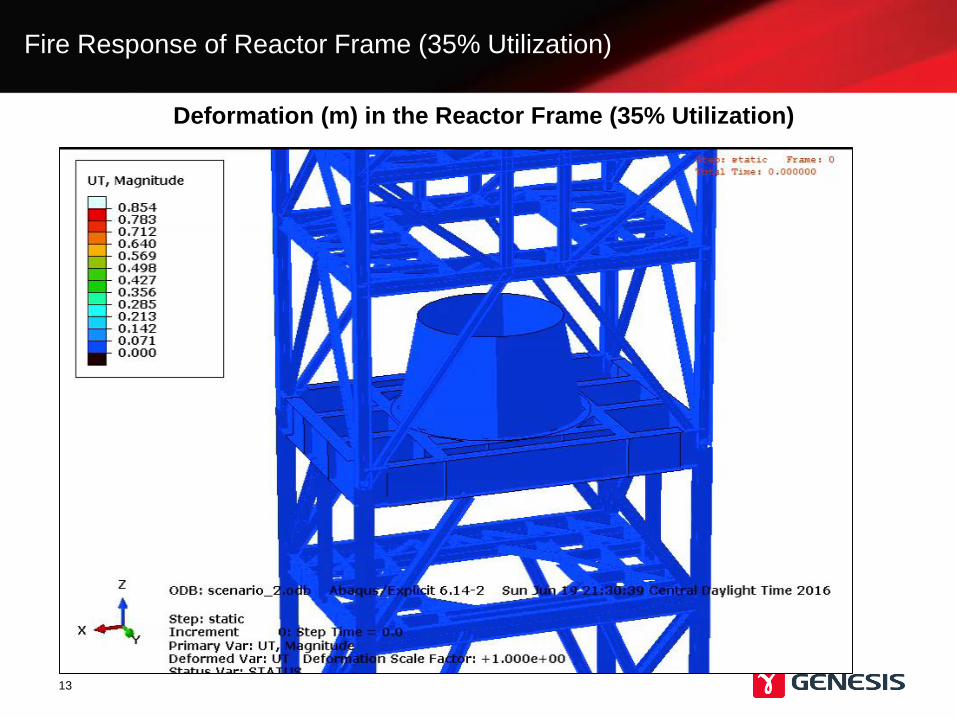
Fire Response of Reactor Frame (35% Utilization)
Deformation (m) in the Reactor Frame (35% Utilization)
13
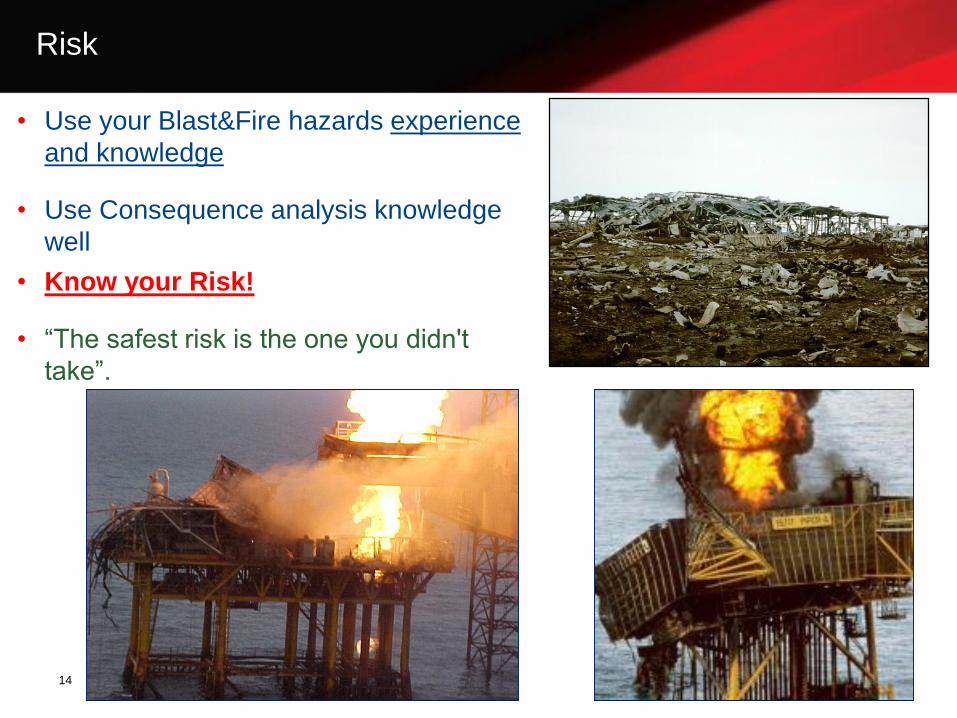
Risk
• Use your Blast&Fire hazards experience
and knowledge
• Use Consequence analysis knowledge
well
• Know your Risk!
• “The safest risk is the one you didn't
take”.
14

15
Defining Risk – Generic Risk Matrix
Likelihood of Risk Event/Frequency
Severity
Level –
Financial
M=million
Severity
Level -
Human
A
An event has
not yet
occurred in the
industry,
Freq. = 10-5
B
An event has
occurred
somewhere in
the industry
Freq. = 10-4
C
An event has
occurred once
in the
organization or
more than
once in the
industry
Freq. = 10-3
D
An event has
occurred once
or twice in the
particular
facility lifetime
Freq. = 10-2
E
An event has
occurred at
least once per
year at the
particular
facility
Freq. < 10-1
< 0.5M USD loss
Minor
Health/safety
impact
1 2 3 4 5
0.5M – 1M USDMedium
Health/safety
impact
2 3 4 5 6
1M – 10M USD
Permanent
Injuries, high
health
impact
3 4 5 6 7
10M – 100M
USD1-3 fatalities 4 5 6 7 8
> 100M USD 3-10 fatalities 5 6 7 8 9
> 1000M USD > 10 fatalities 6 7 8 9 10
Not Acceptable
ALARP (Marginally Tolerable Risk) region
Tolerable Risk
Acceptable Risk
Event
Risk = Frequency x Consequences

16
Defining Risk – A Unified Approach
Identify Risk using
Risk Matrix
- Structural Response Analysis,
- Consequence Analysis,
Severity Levels
- Probability of Damage, Fragility Curves
- Damage Frequency Matrix,
- Individual Risk Matrix
Likelihood of Risk
- Hazard Curve
- Pressure Exceedance Curve
- Probability of Exceeding of Hitting vs Vessel Impact Energy
- Annual Exceedance Curve
Develop Mitigation/Repair/Strengthening Options,
if Risk is not acceptable
17
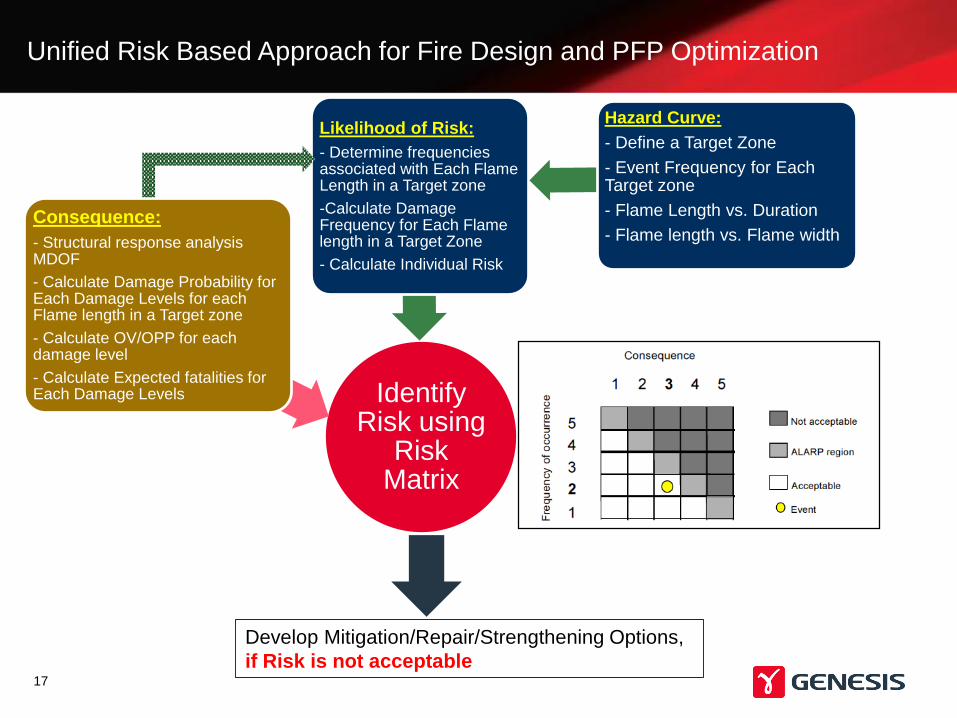
Unified Risk Based Approach for Fire Design and PFP Optimization
Identify Risk using
Risk Matrix
Consequence:
- Structural response analysis MDOF
- Calculate Damage Probability for Each Damage Levels for each Flame length in a Target zone
- Calculate OV/OPP for each damage level
- Calculate Expected fatalities for Each Damage Levels
Likelihood of Risk:
- Determine frequencies associated with Each Flame Length in a Target zone
-Calculate Damage Frequency for Each Flame length in a Target Zone
- Calculate Individual Risk
Hazard Curve:
- Define a Target Zone
- Event Frequency for Each Target zone
- Flame Length vs. Duration
- Flame length vs. Flame width
Develop Mitigation/Repair/Strengthening Options,
if Risk is not acceptable
In Conclusion….
• Existing Approaches are excellent screening tools – however the
methodologies as they stand require updating
• For new facilities, this kind of Front End Thinking provides
– cost reductions in final design
– as well as practical risk mitigating measures for operations
• For existing facilities, the proposed methods can
– allow operators to improve both existing safety measures
– as well as maintaining reasonable costs for implementation of new
mitigation solutions
18
THANK YOU!
Contact Details
Ali Sari, Ph. D., P.E.
Tel (Direct): +1 281 848 5033
Thank You! Questions?
19