AN INNOVATIVE GSFC METHODOLOGY FOR USING FMECA AS A …
15
AN INNOVATIVE GSFC METHODOLOGY FOR USING FMECA AS A RISK ASSESSMENT AND COMMUNICATION TOOL RAMS 2016 Jan 25, 2016 FMEA SESSION – 01D 10:15 AM Nancy J Lindsey NASA Sr. Reliability Manager , Code 371 GSFC
Transcript of AN INNOVATIVE GSFC METHODOLOGY FOR USING FMECA AS A …
AN INNOVATIVE GSFC METHODOLOGY FOR USING FMECA AS A RISK ASSESSMENT
AND COMMUNICATION TOOL
RAMS 2016 Jan 25, 2016 FMEA SESSION – 01D 10:15 AM
Nancy J Lindsey NASASr. Reliability Manager , Code 371 GSFC

AGENDA
Introduction to Risk Management & FMECA FMECA Risk Assessment Methodology Examples Conclusions & Recommendations

FAILURE MODE EFFECTS AND CRITICALITY ANALYSIS (FMECA)
Postulate where there is the potential for irreversible physical and/or functional damage/failure;
Identify how damage/failures propagate or not;
Identify how damage/failures impacts system Identify the means available for failure
detection, isolation, and/or mitigation; Recommend/Track corrective actions and
their implementation/effectiveness.
NASA/GSFC uses FMECAs to continually identify plausible system failures and causes and analyze their implications and mitigations.
Ref.No.
Component Name
Component Function
PotentialFailureMode
PotentialCause of Failure
Occurrence Value
Potential Effects of Failure
Severity Value
Severity Category
Mitigating Factors(Detection/Prevention)
D/P Value
RPNLocal Effect
Subsystem Effect
Mission Effect
• Failure Mode Effects and Criticality Analysis is a bottoms-up inductive analysis of potential failures. That is performed at the functional, interface, and/or detailed level on a system or process.
• The purpose of any FMECA is to:

RISK MANAGEMENT & FMECA
• NASA/GSFC employs Continuous Risk Management (CRM)/Risk Informed Decision Making (RIDM) to make decisions on design, manufacturing, and operations of on-orbit assets based on the risk to achieving mission success
• NASA/GSFC uses FMECAs to continually identify plausible system failures and causes and analyze their implications and mitigations or mission failure risks.
Understand Performance
Criteria
IdentifyAlternatives
Analyze Alternatives
Deliberate and Decide
Implement Decision
Track and ControlImplementation
Both Risk Management and FMECAs are living processes at GSFC throughout a mission’s life.
Postulate FailuresAssess ImpactsIdentify Detection/
MitigationRecommend/Track Corrective Actions and Re-analyze and/or Identify new risk/failure mode
How the FMECA process fits in:

FMECA RISK ASSESSMENT METHODOLOGY
1. Correlating Mission Specific Success Requirements-to-GSFC Risk Management Consequence Definitions (GPR 7120.4D);
2. Correlating Failure Severities (NASA/GSFC Failure Mode Effect and Criticality Analysis Procedures)-to-GSFC Risk Management Consequence Definitions (GPR 7120.4D);
3. Correlating Mission Failure and Duration-to-GSFC Risk Management Likelihood Definitions (GPR 7120.4D);
4. Analyzing and characterizing each failure mode using these correlations;
5. Assessing the Failure Modes/Critical Items/Single Point Failures as risks and documenting and communicating risks to mission risk managers.
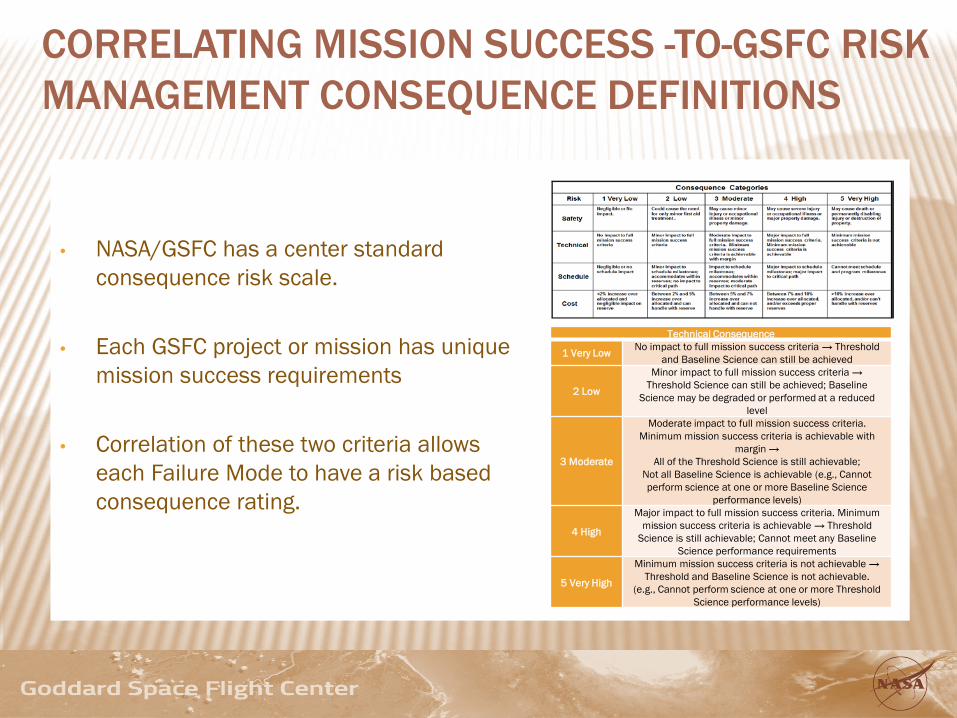
CORRELATING MISSION SUCCESS -TO-GSFC RISK MANAGEMENT CONSEQUENCE DEFINITIONS
• NASA/GSFC has a center standard consequence risk scale.
• Each GSFC project or mission has unique mission success requirements
• Correlation of these two criteria allows each Failure Mode to have a risk based consequence rating.
Technical Consequence
1 Very Low No impact to full mission success criteria → Threshold and Baseline Science can still be achieved
2 Low
Minor impact to full mission success criteria →Threshold Science can still be achieved; Baseline
Science may be degraded or performed at a reduced level
3 Moderate
Moderate impact to full mission success criteria. Minimum mission success criteria is achievable with
margin →All of the Threshold Science is still achievable;
Not all Baseline Science is achievable (e.g., Cannot perform science at one or more Baseline Science
performance levels)
4 High
Major impact to full mission success criteria. Minimum mission success criteria is achievable → Threshold
Science is still achievable; Cannot meet any Baseline Science performance requirements
5 Very High
Minimum mission success criteria is not achievable → Threshold and Baseline Science is not achievable.
(e.g., Cannot perform science at one or more Threshold Science performance levels)

CORRELATE FAILURE SEVERITIES-TO-GSFC RISK MANAGEMENT CONSEQUENCE DEFINITIONS
• NASA/GSFC also has a center tailorable standard safety based FMECA severity scale.
• With the development of the risk based consequence rating scale
• Correlation of the FMECA/Safety categories and the risk based consequence scale allows for safety and risk failure mode characterization.
Technical Consequence Failure Severity
1 Ve
ry
Low
No impact to full mission success criteria → Threshold and Baseline Science can still be
achieved
Minor or no impact on mission life or performance: noticeable or no degradation, that does not lead to loss of science or significant peril
to mission. (Category 4)
2 Lo
w
Minor impact to full mission success criteria
→ Threshold Science can still be achieved; Baseline Science may be degraded or
performed at a reduced level
Potential for major or significant degradation of mission or performance: no immediate impact on mission, but potential exists
for future loss, at level 5-3, if adequate alternatives or measures are not implemented. (Category 3)
3 M
oder
ate
Moderate impact to full mission success criteria. Minimum mission success criteria
is achievable with margin →All of the Threshold Science is still
achievable;Not all Baseline Science is achievable (e.g.,
Cannot perform science at one or more Baseline Science performance levels)
Significant loss or degradation of mission: significant loss of mission function leading to a significant loss of data, or a significant
reduction in life of the mission. (Category 2 or 3)Or Loss or degradation of a redundant subsystem or science
instrument producing levels 4 or 3 severity, if remaining redundancy is lost. (Category 2R)
4 H
igh
Major impact to full mission success criteria. Minimum mission success criteria is
achievable → Threshold Science is still achievable; Cannot meet any Baseline
Science performance requirements
Major loss or degradation of mission: capability to complete some mission objectives (Category 2) Or Loss or degradation of a
redundant subsystem producing levels 4 or 5 severity, if remaining redundancy is lost. (Category 1R)
5 Ve
ry H
igh
Minimum mission success criteria is not achievable → Threshold and Baseline
Science is not achievable.(e.g., Cannot perform science at one or more
Threshold Science performance levels)
Complete loss of mission: complete loss of primary mission capability. (Category 1) Or
Loss or degradation of a subsystem or science leading to safety or hazard monitoring system failure that could cause the system to fail
to detect a hazardous condition or fail to operate during such condition and lead to Severity 5 consequences (Category 1S)

CORRELATE MISSION FAILURE AND DURATION-TO-GSFC LIKELIHOOD DEFINITIONS
• NASA/GSFC has a center standard likelihood risk scale
• Each GSFC project or mission has unique mission success duration requirement
• Correlation of these two criteria allows each Failure Mode to have a risk based likelihood rating.
Value Occurrence or Likelihood
5 Very High (0.50 < PF) Or(2.5 x10⁻⁵ <λ for mission duration)
4 High (0.25 < PF ≤ 0.50) Or(1.03 x10⁻⁵ <λ< 2.5 x10⁻⁵ for mission duration)
3 Moderate (0.15 < PF ≤ 0.25) Or(5.9 x10⁻⁶ <λ< 1.03 x10⁻⁵ for mission duration)
2 Low (0.02 < PF ≤ 0.15) Or(7.3 x10⁻⁷ <λ< 5.9 x10⁻⁶ for mission duration)
1 Very Low (0.001 <PF ≤ 0.02) Or(3.6 x10⁻⁸ <λ< 7.3 x10⁻⁷ for mission duration)
< 1 Very Very Low (PF ≤ 0.001) Or(λ < 3.6 x10⁻⁸ for mission duration)
𝜆𝜆 = ln(1−𝑃𝑃𝑓𝑓)−𝑡𝑡𝑡𝑡𝑡𝑡𝑡𝑡
= ln(1−𝑃𝑃𝑓𝑓)−27720 ℎ𝑟𝑟𝑟𝑟

ANALYZE AND CHARACTERIZE EACH FAILURE MODE
1. Postulate all potential failure modes
2. Identify causes and impacts of each failure mode
3. Ascertain each failure mode’s or cause’s available prevention and/or mitigation strategies and detection capabilities
4. Using the correlations as shown characterize each failure modes by assigning a occurrence, consequence, and detection/prevention value.
Likelihood Technical Consequence Failure Severity Detection/Prevention
<1 V
ery V
ery
Low
Very Very Low (PF ≤ 0.001) Or
(λ < 3.6 x10⁻⁸ for mission duration)
N/A
1 Ve
ry L
ow Very Low (0.001 <PF ≤ 0.02) Or
(3.6 x10⁻⁸ <λ< 7.3 x10⁻⁷ for mission duration)
No impact to full mission success criteria → Threshold and Baseline Science can still be
achieved
Minor or no impact on mission life or performance: noticeable or no degradation, that
does not lead to loss of science or significant peril to mission. (Category 4)
Certain - failure will be detected and
prevented or mitigated
2 Lo
w Low (0.02 < PF ≤ 0.15) Or(7.3 x10⁻⁷ <λ< 5.9 x10⁻⁶ for
mission duration)
Minor impact to full mission success criteria → Threshold Science can still be achieved;
Baseline Science may be degraded or performed at a reduced level
Potential for major or significant degradation of mission or performance: no immediate impact on
mission, but potential exists for future loss, at level 5-3, if adequate alternatives or measures
are not implemented. (Category 3)
Moderate to High -Failure is likely to be
detected before occurrence and has a good chance of being
prevented or mitigated
3 M
oder
ate Moderate (0.15 < PF ≤ 0.25)
Or(5.9 x10⁻⁶ <λ< 1.03 x10⁻⁵ for
mission duration)
Moderate impact to full mission success criteria. Minimum mission success criteria
is achievable with margin → All of the Threshold Science is still achievable; Not all Baseline Science is achievable (e.g., Cannot
perform science at one or more Baseline Science performance levels)
Significant loss or degradation of mission: significant loss of mission function leading to a
significant loss of data, or a significant reduction in life of the mission. (Category 2 or 3)
Or Loss or degradation of a redundant subsystem or science instrument producing levels 4 or 3
severity, if remaining redundancy is lost. (Category 2R)
Low to Moderate -Failure may be
detected and may be prevented or
mitigated4
Hig
h High (0.25 < PF ≤ 0.50) Or(1.03 x10⁻⁵ <λ< 2.5 x10⁻⁵ for
mission duration)
Major impact to full mission success criteria. Minimum mission success criteria is
achievable → Threshold Science is still achievable; Cannot meet any Baseline
Science performance requirements
Major loss or degradation of mission: capability to complete some mission objectives (Category 2) Or
Loss or degradation of a redundant subsystem producing levels 4 or 5 severity, if remaining
redundancy is lost. (Category 1R)
Remote - Unlikely failure will be detected or
prevented or mitigated
5 Ve
ry H
igh
Very High (0.50 < PF) Or(2.5 x10⁻⁵ <λ for mission
duration)
Minimum mission success criteria is not achievable → Threshold and Baseline
Science is not achievable.(e.g., Cannot perform science at one or
more Threshold Science performance levels)
Complete loss of mission: complete loss of primary mission capability. (Category 1) Or
Loss or degradation of a subsystem or science leading to safety or hazard monitoring system failure that could cause the system to fail to
detect a hazardous condition or fail to operate during such condition and lead to Severity 5
consequences (Category 1S)
None - Failure will not be detected and will not be prevented or
mitigated

FAILURE MODE EXAMPLE
Note: Matrices do not take the place of Risk Statement proposals but rather they support and justify proposals
Ref.No.
Component Name
Component Function
PotentialFailureMode
PotentialCause of Failure
Occurrence Value
Potential Effects of Failure Severity Value
Severity Category
Mitigating Factors(Detection/Prevention)
D/P Value
RPN
Local Effect Subsystem Effect Mission Effect
MEB-6Ultra-Stable Oscillators
(USO)
Provides clock signal
USO frequency
change/drift
No autonomous switching
Thermal control
(internal) loss
1Degraded
performance parameter
Inaccurate synchronization
between systems using
USO
Degraded Science 3 2R
Detection: USO drift identified in science
data
Mitigation: switch to redundant USO
Prevention: High Quality Parts and Design,
and workmanship with robust testing,
3 9

Assess and Communicate Risks
• Use the FMECA Matrices to Summarize Risks for Assessment and Communication
• Assess and Prioritize the risk of each characterized Failure Modeo Formulate Critical Items List o Formulate Single Point Failure
List
• Develop and Propose Risk Statements Note: Matrices do not take the place of Risk Statement
proposals but rather they support and justify proposals

EXAMPLE: (L X C)
LEO Science Mission
29 SPFs but all have Low to Very Low Probability of Failure.
5
43
2 (Q TY-2)P-3, P-4
(QTY-1)*L-4
(QTY-7) P-1, P-2, D-3, D-4, *L-5, *L-9, *L-
11
(QTY-2)MB-24, C-16
1
(QTY-40)A-15, A-18, S-2, S-7, B-9, B-10, R-8, R-17, R-18, T-7, T-14, T-18, RR-8,
RR-9, O-1, O-4, O-7, O-10, O-13, O-16, O-19, O-20, O-25, FO-13, FO-14,
DDD-11, DDD-12, D-8, MB-38, U-19, C-23, C-24, C-25, C-26, C-28, C-
30, C-32, C-34, *L-26, *L-29
(QTY-13)A-7, A-11, A-16, A-19, B-4, R-20, T-
4, T-8, C-27, C-29, C-31, C-33, *L-25
(QTY-56) X-5, A-6, A-17, A-20, A-22, A-24, BE-1, DD-3, DD-4, DD-5, B-3, B-8, B-11, R-4, R-9, R-11, R-12, R-13, R-14, LL-1, LL-2, LL-3, LL-6, LL-7, LL-
10, TL-1, TL-2, TL-3, TL-4, TL-5, TL-7, TL-9, T-5, T-10, T-11, T-12, T-13, FO-9, FO-10, FO-11, DDD-5, M-7, M-9, S-2, S-6, MB-5, MB-13, MB-16, MB-33, MB-34, MB-35, MB-36,
C-21, DD-4, *L-1, *L-2
(QTY-70)FM-1, FM-2, FM-3, X-1, X-2, X-3, X-4, S-1, S-3, S-4, S-5, R-3, T-3, T-6, T-9, T-16, T-17, O-2, O-3, O-5, O-8, O-9, O-11, O-14, O-15, O-17,
O-21, O-22, O-23, FO-1, FO-2, FO-3, FO-5, FO-6, FO-7, DDD-1, DDD-2, DDD-4, D-1, D-2, D-7, MB-4, MB-6, MB-15, MB-21, MB-23, MB-25, MB-26, U-5, U-6, U-7, U-8, MB-32, U-1, U-2, U-4, U-9, U-10, U-11, U-12, U-20, *L-
3, *L-8, *L-10, *L-16, *L-17, *L-18, *L-19, *L-20, *L-22
(QTY-70) A-8, X-7, BE-2, S-6, B-1, B-2, B-5, B-6, B-
12, R-1, R-2, R-5, R-16, R-10, R-15, R-19, LL-4, LL-8, LL-9, LL-12, TL-6, TL-8, T-15, T-19, RR-1, RR-3, RR-5, RR-10, O-6, O-12, O-18, O-24, FO-4, FO-8, DDD-3, DDD-6, M-8, M-10, S-1, MB-7, MB-10, MB-11, MB-12, MB-14,
MB-17, MB-18, MB-19, MB-20, MB-27, MB-28, MB-29, MB-30,MB-31, MB-37, C-1, C-3, C-4, C-5, C-6, C-7, C-8, C-11, C-12, C-15,
C-17, C-19, C-20, C-22, DD-3, DD-5
(QTY-2)DD-1, DD-2
(QTY-27)A-14, BE-3, BE-4, BE-5, DD-1, DD-2, B-7, LL-5, LL-11, RR-2, RR-4, RR-6, RR-7,
FO-12, MB-1, MB-2, MB-3, MB-101, MB-8, MB-9, MB-22, C-9, C-13, C-14, C-18,
DD-6, *L-21 (L-21.57, L-21.61)
<1(QTY-1)
S-4(QTY-2)T-1, T-2
(QTY-3)D-5, D-6, S-3
(QTY-8) X-6, A-10, A-12, A-21, A-23, A-25, MB-
39, U-21
Sev. Cat. 4 3 3 2/2R 2/2S 1R 1/1SSev. Val. 1 2 5
Likelihood of Occurrence
Criticality Matrix3 4
Relative Severity of Failure Mode
GSFC Credible Risk Threshold

EXAMPLE (RPN X C)
ISS Mission Example
RiskPriorityNumber(RPN)
Very High 26-125
High 21-25
Moderate 16-204.4-1, 4.7-1(2)
Low 11-154.1-10
(1)4.1-2, 4.1-12
(2)
Very Low 6-10
Very Very Low 1-5
2.34-1, 2.35-1, 2.73-1, 2.73-2, 2.74-1, 2.74-2, 2.75-2, 4.1-4, 4.2-1, 4.3-1, 4.1-5, 4.1-6, 4.1-7, 4.1-8
(14)
1.1-1, 1.1-2, 1.2-2, 1.3-1, 1.3-2, 1.4-2, 1.5-1, 1.5-2, 1.8-1, 1.8-2, 2.1-2, 2.2-2, 2.5-2, 2.6-2, 2.9-1, 2.14-1, 2.15-1, 2.17-1, 2.23-1, 2.25-1, 2.26-1, 2.27-1, 2.28-1, 2.29-1, 2.30-1, 2.31-1, 2.32-1, 2.33-1, 2.48-1, 2.50-1, 2.51-1, 2.52-1, 2.53-1, 2.54-1, 2.55-1, 2.55-1B, 2.56-1, 2.58-1, 2.59-1, 2.64-1, 2.65-1, 2.66-1, 2.67-1, 2.68-1, 2.69-1, 2.70-1, 2.70-2, 2.70-3, 2.70-4, 2.71-1, 2.72-1,4.1-15, 4.1-16, 4.1-17
(54)
2.10-1, 2.11-1, 2.43-1, 2.45-1, 2.61-1, 2.61-2, 2.61-3, 2.61-4, 2.62-1, 2.75-1, 3.1-2
(11)
1.6-1, 1.6-2, 1.7-1, 1.7-2, 2.1-1, 2.2-1, 2.5-1, 2.5-3, 2.6-1, 2.7-1, 2.8-1, 2.10-1, 2.12-1, 2.13-1, 2.18-1, 2.19-1, 2.20-1, 2.22-1, 2.24-1, 2.37-1, 2.38-1, 2.39-1, 2.41-1, 2.42-1, 2.44-1, 2.46-1, 2.47-1, 2.76-1, 2.76-2, 2.77-1, 2.78-1, 2.79-1
(32)
3.1-1, 3.1-2,
(2)
1.2-1, 1.4-1, 3.1-3, 3.1-4, 4.1-1, 4.1-3, 4.1-9, 4.1-11, 4.1-13, 4.1-14, 4.3-2, 4.4-2, 4.5-1, 4.6-1, 4.6-2, 4.7-2
(16)
FMEA Severity 4 3 2R 2 1R 1
Risk Rating 1 2 3 4 5
Severity
Detection methodis
unavailable but mission is not lost
16 SPFs but all have Low Probability of Failure thus representing only a Very Very Low Risk.
GSFC Credible Risk Threshold

CONCLUSIONSMethodology Benefits:
Easily shows and begins action/risk management;
Provides a quick communication mechanism of failure risks and FMECA results;
Offers a direct translation of SPFs to risks;
Is easily tailored for mission length and risk tolerance profile;
Requires care in implementation by reliability personnel to account for and ensure consistency in the application of the one-to-many cases in the correlations of Technical Consequence to Failure Severity Categories;
Makes the formulation of CIL and SPF lists and communication of safety issues more efficient and verifiable.
Recommendations:
Define up-front risk definitions for consequence and likelihood;
Establish and understand the mission/project/system success criteria and allowable degradations or mitigation strategies within the success criteria;
Agree and implement risk management strategies and philosophies consistent with mission/project/system and or organizational risk tolerance intensities;
Acquire up-front agreement on FMECA correlations especially criticality levels;
Involve designers, safety, quality, management, and systems engineering in the failure postulation and analysis.
The GSFC FMECA Risk Assessment and Communication Methodology is valid for all spaceflight mission and industries.

ACKNOWLEDGEMENTS
ICESAT-2, OSIRIS-Rex, Robotic Refueling Mission (RRM), Gravity and Extreme Magnetism SMEX (GEMS), and Nuclear Spectroscopic Telescope Array (NuSTAR)Projects
GSFC SMA Mission Assurance Directorate GSFC Risk and Reliability Branch (Code 371) Peers and Orson John, Aron Brall, & Syed Aziz Reliability and Maintainability Symposium (RAMS)