An Exploratory Study of the Effectiveness of the Staff Development ...
91
DOCUMENT RESUME ED 413 703 EC 305 977 AUTHOR Frasier, Mary M.; Hunsaker, Scott L.; Lee, Jongyeun; Finley, Vernon S.; Garcia, Jaime H.; Martin, Darlene; Frank, Elaine TITLE An Exploratory Study of the Effectiveness of the Staff Development Model and the Research-Based Assessment Plan in Improving the Identification of Gifted Economically Disadvantaged Students. INSTITUTION National Research Center on the Gifted and Talented, Storrs, CT SPONS AGENCY Office of Educational Research and Improvement (ED), Washington, DC. REPORT NO NRCGT-RM95224 PUB DATE 1995-09-00 NOTE 92p. CONTRACT R206R00001 PUB TYPE Reports Research (143) EDRS PRICE MF01/PC04 Plus Postage. DESCRIPTORS Economically Disadvantaged; Elementary Secondary Education; Evaluation Methods; *Gifted Disadvantaged; Language Minorities; Limited English Speaking; Models; Psychological Characteristics; *Staff Development; Student Evaluation; *Student Placement; *Talent Identification ABSTRACT This monograph discusses a project involving 246 teachers that investigated a Staff Development Model (SDM) and a Research-Based Assessment Plan (RAP) for their potential to improve the identification and education of gifted students from economically disadvantaged families, some of whom have limited proficiency in the English language. The concept of giftedness as a psychological construct defined by a basic set of traits, aptitudes, and behaviors (TABs) formed the basis of the two models. Overall, the models were perceived as an effective way to: (1) improve teachers' ability in observing giftedness in target population student groups; and (2) facilitate the collection and use of information derived from multiple sources when making decisions for program placement and services. The TABs associated with the giftedness construct appeared to provide a feasible way to train teachers to recognize exceptional ability in target population student groups. Secondly, the SDM and the RAP process appeared to affirm the importance of involving teachers and other staff in the entire process of identifying gifted target students. Finally, feedback on the RAP suggested that it could be a systematically viable way to consider the interrelationships of information from multiple sources when making gifted program placement decisions. (Contains 39 references.) (Author/CR) ******************************************************************************** Reproductions supplied by EDRS are the best that can be made from the original document. ********************************************************************************
Transcript of An Exploratory Study of the Effectiveness of the Staff Development ...

DOCUMENT RESUME
ED 413 703 EC 305 977
AUTHOR Frasier, Mary M.; Hunsaker, Scott L.; Lee, Jongyeun; Finley,Vernon S.; Garcia, Jaime H.; Martin, Darlene; Frank, Elaine
TITLE An Exploratory Study of the Effectiveness of the StaffDevelopment Model and the Research-Based Assessment Plan inImproving the Identification of Gifted EconomicallyDisadvantaged Students.
INSTITUTION National Research Center on the Gifted and Talented, Storrs,CT
SPONS AGENCY Office of Educational Research and Improvement (ED),Washington, DC.
REPORT NO NRCGT-RM95224PUB DATE 1995-09-00NOTE 92p.
CONTRACT R206R00001PUB TYPE Reports Research (143)EDRS PRICE MF01/PC04 Plus Postage.DESCRIPTORS Economically Disadvantaged; Elementary Secondary Education;
Evaluation Methods; *Gifted Disadvantaged; LanguageMinorities; Limited English Speaking; Models; PsychologicalCharacteristics; *Staff Development; Student Evaluation;*Student Placement; *Talent Identification
ABSTRACTThis monograph discusses a project involving 246 teachers
that investigated a Staff Development Model (SDM) and a Research-BasedAssessment Plan (RAP) for their potential to improve the identification andeducation of gifted students from economically disadvantaged families, someof whom have limited proficiency in the English language. The concept ofgiftedness as a psychological construct defined by a basic set of traits,aptitudes, and behaviors (TABs) formed the basis of the two models. Overall,the models were perceived as an effective way to: (1) improve teachers'ability in observing giftedness in target population student groups; and (2)facilitate the collection and use of information derived from multiplesources when making decisions for program placement and services. The TABsassociated with the giftedness construct appeared to provide a feasible wayto train teachers to recognize exceptional ability in target populationstudent groups. Secondly, the SDM and the RAP process appeared to affirm theimportance of involving teachers and other staff in the entire process ofidentifying gifted target students. Finally, feedback on the RAP suggestedthat it could be a systematically viable way to consider theinterrelationships of information from multiple sources when making giftedprogram placement decisions. (Contains 39 references.) (Author/CR)
********************************************************************************Reproductions supplied by EDRS are the best that can be made
from the original document.********************************************************************************

THE NAnoNALRESEARCH CENTERON THE OPTEDAND ENTED
itRINIEMItlf101
EL
I 7 0 5The University of Georgia
The University of Connectic&itThe University of GeorgiaThe University of VirginiaYale University
An Exploratory Study of theEffectiveness of the Staff Development
Model and the Research-BasedAssessment Plan in Improving the
Identification of Gifted EconomicallyDisadvantaged Students
BEST COPY AVAILABLE
Mary M. FrasierScott L. Hunsaker
Jongyeun LeeVernon S. FinleyJaime H. GarciaDarlene MartinElaine Frank
The University of GeorgiaAthens, Georgia
September 1995Number RM95224
U.S. DEPARTMENT OF EDUCATIONOffice of Educational Research and Improvement
EDUCATIONAL RESOURCES INFORMATIONCENTER (ERIC)
This document has been reproduced asreceived from the person or organizationoriginating IL
0 Minor changes have been made to improvereproduction Quality.
o Points of mew or opinions stated in this docu-ment do not necessanly represent officialOE RI position or policy.

An Exploratory Study of the Effectiveness of the StaffDevelopment Model and the Research-Based
Assessment Plan in Improving the Identification ofGifted Economically Disadvantaged Students
Mary M. FrasierScott L. Hunsaker
Jongyeun LeeVernon S. Finleyjaime H. GarciaDarlene MartinElaine Frank
The University of GeorgiaAthens, Georgia
September 1995Number RM95224
3

THE NATIONALRESEARCH CENTERON THE GIFTEDAND TALENTED
The National Research Center on the Gifted and Talented (NRC/GT) is funded under theJacob K. Javits Gifted and Talented Students Education Act, Office of EducationalResearch and Improvement, United States Department of Education.
The Directorate of the NRC/GT serves as the administrative unit and is located atThe University of Connecticut.
The participating universities include The University of Georgia, The University ofVirginia, and Yale University, as well as a research unit at The University ofConnecticut.
The University of ConnecticutDr. Joseph S. Renzulli, Director
Dr. E. Jean Gubbins, Assistant Director
The University of ConnecticutDr. Francis X. Archambault, Associate Director
The University of GeorgiaDr. Mary M. Frasier, Associate Director
The University of VirginiaDr. Carolyn M. Callahan, Associate Director
Yale UniversityDr. Robert J. Sternberg, Associate Director
Copies of this report are available from:NRC/GT
The University of Connecticut362 Fairfield Road, U-7Storrs, CT 06269-2007
Research for this report was supported under the Javits Act Program (Grant No. R206R00001) asadministered by the Office of Educational Research and Improvement, U.S. Department ofEducation. Grantees undertaking such projects are encouraged to express freely their professionaljudgement. This report, therefore, does not necessarily represent positions or policies of theGovernment, and no official endorsement should be inferred.
ii 4

Note to Readers...
All papers by The National Research Center on the Gifted and Talented may bereproduced in their entirety or in sections. All reproductions, whether in part orwhole, should include the following statement:
Research for this report was supported under the Javits Act Program(Grant No. R206R00001) as administered by the Office of EducationalResearch and Improvement, U.S. Department of Education. Granteesundertaking such projects are encouraged to express freely theirprofessional judgement. This report, therefore, does not necessarilyrepresent positions or policies of the Government, and no officialendorsement should be inferred.
This document has been reproduced with the permission of TheNational Research Center on the Gifted and Talented.
If sections of the papers are printed in other publications, please forward a copy to:
The National Research Center on the Gifted and TalentedThe University of Connecticut362 Fairfield Road, U-7Storrs, CT 06269-2007
5

An Exploratory Study of the Effectiveness of the StaffDevelopment Model and the Research-Based Assessment
Plan in Improving the Identification of GiftedEconomically Disadvantaged Students
Mary M. FrasierScott L. Hunsaker
Jongyeun LeeVernon S. FinleyJaime H. GarciaDarlene MartinElaine Frank
The University of GeorgiaAthens, Georgia
ABSTRACT
A Staff Development Model (SDM) and a Research-Based Assessment Plan (RAP)developed by researchers at The University of Georgia were investigated for their potentialto improve the identification and education of gifted students from economicallydisadvantaged families, some of whom may have limited proficiency in the Englishlanguage. The concept of giftedness as a psychological construct defined by a basic set oftraits, aptitudes, and behaviors (TABs) formed the basis of the two models. Overall, themodels were perceived as an effective way to (a) improve teachers' ability in observinggiftedness in target population student groups, and (b) facilitate the collection and use ofinformation derived from multiple sources when making decisions for program placementand services. A basic implication of this study is that the TABs associated with thegiftedness construct appeared to provide a feasible way to train teachers to recognizeexceptional ability in target population student groups. Secondly, the SDM and the RAPprocess appeared to affirm the importance of involving teachers and other staff in the entireprocess of identifying gifted target students. Finally, feedback on the RAP suggests that theRAP is a viable way to systematically consider the interrelationships of information frommultiple sources when making gifted program placement decisions.
6V

An Exploratory Study of the Effectiveness of the StaffDevelopment Model and the Research-Based Assessment
Plan in Improving the Identification of GiftedEconomically Disadvantaged Students'
Mary M. FrasierScott L. Hunsaker
Jongyeun LeeVernon S. FinleyJaime H. GarciaDarlene Martin
Elaine Frank
The University of GeorgiaAthens, Georgia
EXECUTIVE SUMMARY
Introduction
At the top of most lists recounting problems faced in identifying culturally differentand economically disadvantaged students are criticisms about test bias and theinappropriateness of relying on standardized tests as the primary identifier of giftedpotential. Critics contend that most standardized tests are not designed to evaluate theabilities of culturally different children or children who come from economicallydisadvantaged families (Baldwin, 1985; Bernal, 1981; Hilliard, 1991) and also do notadequately account for incongruencies between the language of the test giver (or testconstructor) and culturally different test takers (Taylor & Lee, 1991).
Teachers may find it difficult to recognize unfamiliar expressions of giftednesswhen exhibited by children who are different from mainstream children in terms of culture,language, or environment (Baca & Chinn, 1982; Bernal, 1972; Wood & Achey, 1990).When considerations for gifted programs depend on teacher nominations, students areeffectively excluded when they are not referred. In fact, as Scott, Perou, Urbano, Hogan,and Gold (1992) noted, regardless of any inadequacies in the assessment process, childrenwho are not referred will never have the opportunity to be selected for gifted programs.Tuliao (1986) found that when teachers were involved in identification processes asmembers of assessment committees, they positively affected the nomination process inschools that had large populations of students from low socioeconomic status and minoritygroups. However, Mims (1988) contended that teachers' limited knowledge of giftedcharacteristics and their low expectations were major deterrents to their referrals of minoritystudents for gifted program participation.
Wiggins (1989) contended that, "When an educational problem persists despite thewell-intentioned efforts of many people to solve it, it's a safe bet that the problem hasn't beenproperly framed" (p. 703). One difficulty in resolving the problems associated withidentifying gifted disadvantaged students may have been caused by the complexity of the
1 While minority group status is not directly implied by this label, because high proportions ofeconomically disadvantaged students are also members of minority groups in this country the two terms arefrequently used interchangeably in the literature. As needed, minority and economically disadvantaged willbe used in this paper to refer to target students.
vii

issues involved as well as the indiscriminate attention given to cultural, environmental, andsocial issues when deliberating the identification of gifted target population students.Frasier (1989) observed that
Probably with no other subpopulation have the definition and identification ofgiftedness been more complex and seemingly inextricably interwoven withenvironmental factors, performance on standardized tests, deviation from mainstreamcultures, and ambiguous attitudes regarding the degree of academic acuity possessedby Black students. (p. 221)
Finding effective solutions to the identification of gifted target population students isnot easy. Gregory (1985) observes that the problems associated with the inadequateidentification of gifted minority students are much too complex to be resolved by simplyseeking a new assessment instrument. A much more comprehensive approach is needed.
The SDM and the RAP were developed by researchers at The University of Georgiaas a comprehensive approach to improving the identification and education of giftedstudents from economically disadvantaged families and areas, some of whom may havelimited proficiency in the English language. Hereafter students in these groups are referredto as the target population.
Purpose of the Study
Training is required to implement any new approach for identifying giftedness inminority or disadvantaged populations. Educators must be prepared to (a) recognizeattributes of giftedness in these students, (b) select appropriate assessment measures forappraising these attributes, and (c) use a decision-making process that emphasizes theevaluation of information from multiple sources. The purposes of this exploratory study,thus, were threefold:
1. To pilot the SDM which was designed to provide educators with theinformation and a process they needed to recognize gifted attributes bytarget population students.
2. To pilot the RAP which was designed to facilitate the appraisal ofexceptional performance by target population students by using multipleinformation sources based on the core attributes of giftedness.
3. To examine the overall efficiency and effectiveness of the SDM and theRAP in addressing factors affecting the identification of target populationstudents. The results of this investigation would be used to refine the SDMand the RAP.
Research Questions
The following research questions were posed to explore the effectiveness of theSDM and the RAP in facilitating the identification of target population students:
1. Does the SDM provide an effective process to train teachers to betterobserve and refer target population students for gifted programparticipation? This question is designed to explore whether teachers who aretrained in using the SDM process are able to refer confidently students fromthe target population for gifted program participation who normally wouldnot have been referred.
2. Does the RAP provide an effective process to facilitate the use of multipleselection criteria in making better professional decisions about the
viii

identification and education of gifted target population students? Thisquestion is designed to explore whether the RAP effectively facilitatesteachers' ability to use confidently multiple criteria (or data from objective andsubjective sources) to make recommendations for placement of targetpopulation students in gifted programs.
The SDM and the RAP: Background, Design, and Rationale
The two models used in this investigation were designed to address the question ofhow to recognize gifted potential in students from diverse environments and cultures byfocusing on strategies that emphasize the core attributes of giftedness. The goal was todevelop a procedure to improve the methods by which identification and programming forgifted target population students is conducted.
Assumptions Underlying the SDM and the RAP
The basic assumption of the SDM and the RAP was that core attributes of thegiftedness construct provided the best foundation for developing procedures to help aschool's instructional staff (a) recognize gifted attributes in target population students and(b) give appropriate consideration to cultural, economic, and environmental factors whenappraising them for gifted program participation. The following principles underlie thisbasic assumption:
1. There are core attributes of giftedness that are observable in the performanceof children, regardless of economic, cultural, or ethnic backgrounds.
2. Exceptional expressions of these core attributes can be appraised in targetstudents by using a variety of objective and subjective assessment measures.
3. Educators can be trained to use these core attributes as a means of becomingmore effective in observing giftedness in target groups.
4. Educators can be trained to use these core attributes to guide the selection ofassessment measures.
5. A procedure can be developed wherein all the assessment informationcollected about target students is used to make decisions for gifted programplacement and services.
6. Educational programs can be developed that use assessment information asthe basis for addressing the exceptional learning needs of target students.
The Core Attributes of the Giftedness Construct
There are two reasons for viewing giftedness as a psychological construct. Onereason comes from the theories and ideas of several researchers and writers who contendthat the adequate measure of gifted potential depends on an understanding of the basicattributes associated with the giftedness construct (Bernal, 1980; Culross, 1989; Hagen,1980; Hoge, 1988, 1989; Hoge & Cudmore, 1986; Leung, 1981). By extension, they alsosuggest that effective curricula and programs would also reflect primary consideration of thecore attributes of giftedness.
This notion of a construct used in this study was explicated by Sax (1980) whodefined a construct as a set of hypothesized traits, abilities, or characteristics abstracted froma variety of behaviors presumed to have educational or psychological meaning. A construct,itself, is not directly measurable. Behaviors associated with a construct are measurable. As
ix9

Ary, Jacobs, and Razavieh (1979) observed, the sum of the measurement of associatedbehaviors provides the indirect measure of the construct.
The second reason for focusing on identifying core attributes that underlie thegiftedness construct grew out of activities engaged in by researchers at The University ofGeorgia in the initial planning of a procedure to identify gifted children in the targetpopulation. A decision was made to focus on intellectual giftedness and specific academicaptitudes because most school programs are designed to address exceptional abilities inthese areas. Two of the intelligences proposed by Gardner (1983)linguistic and logical-mathematicalwere selected as the primary domains to reflect the focus of schoolprograms for gifted students. A succinct list of characteristics of gifted children reported byGallagher and Kinney (1974) was used as descriptors of the basic abilities associated withthese two intelligences.
When we used the two intelligences proposed by Gardner (1983) and the basicgifted abilities outlined by Gallagher and Kinney (1974) to organize the basic meanings ofitems on various culture-specific checklists, two observations were evident. There appearedto be great similarity in the meanings of items on the various checklists designed to observegifted potential in the target groups. The checklist items also appeared to reflect theunderlying meanings of the gifted abilities proposed by Gallagher and Kinney and appearedto articulate behaviors that students would exhibit when showing ability in either of the twointelligences proposed by Gardner. Further observations suggested that many items on thechecklists better described target population students' motivation for intellectual pursuit andtheir preferred learning environment, learning styles or interests. The reader is referred toFrasier et al. (1995) for a full discussion of the development of the 10 core attributes ofgiftedness that resulted from further investigations of these similarities and guided thedevelopment of the SDM and the RAP.
The Staff Development Model
The Staff Development Model (SDM) is a comprehensive training model designedto provide educators with (a) background information on the concept of giftedness as apsychological construct; (b) an understanding of the set of core traits, aptitudes, andbehaviors or TABs associated with the giftedness construct; (c) instructions for observingTABs in the target population student groups; and (d) a procedure to use these TABs toobserve and refer students for assessment to determine their participation in their school'sgifted program. Vignettes and a series of Panning for Gold forms are used to prepareteachers to observe gifted behaviors in target population groups.
The invitational education theory developed by Purkey (Purkey & Novak, 1984)provided the conceptual framework guiding the decision to make classroom teachers thecentral participants in implementing the SDM. Invitational education theory is based on theprinciple that people are able, valuable, and responsible individuals who possess relativelyuntapped potential in all areas of human development. Further, invitational educationaltheory suggests that policies, places, and programs must be designed to personally andprofessionally invite people to invite themselves as participants.
The Research-Based Assessment Plan
The Research-Based Assessment Plan (RAP) is an identification system designed toguide the collection and interpretation of data from multiple sources when appraisingchildren's needs for gifted program services. At the heart of the RAP model is the FrasierTalent Assessment Profile (F-TAP) (Frasier, 1986). Process and performance informationcollected on students are plotted using an appropriate scale on the F-TAP for interpretation
by a committee. Information that cannot be plotted is recorded in the form of narratives.All the information is examined together when decisions are made for placement.
The F-TAP also includes a form for developing an educational plan in four areas,based on the information collected during assessment: (a) programming, (b) curriculum,(c) counseling, and (d) student goals and outcomes. Basic demographic information onstudents and recommendations for services are also recorded on the F-TAP.
No recommendations for participation or services are made until the data collectionprocess is completed. A group decision making process is used in making therecommendations for placement and services. No set cut-off score is ever used. No onepiece of information dictates the decision making. The profile of students' abilities andinterests guides the development of recommendations for gifted program services.
The RAP process expands the role of teachers by including them in the decision-making process. That is, teachers who referred students were also involved in makingdecisions about whether students would be assessed further and whether they should berecommended for the gifted program services.
Participants
The SDM and the RAP were piloted in five Georgia school systems and one NorthCarolina school system. The entire faculty and staff at each of the schools were theparticipants in this study. A total of 246 teachers participated in the staff developmenttraining conducted at each of the participating sites. Of the participants, 66% indicated thatthey were regular classroom teachers; 3% were administrators; 5% were teachers of thegifted; and 22% were support personnel, e.g., music, art, and physical education teachers orteachers of English as a second language. Of the participants, 26% had 1-5 years ofteaching experience; 25% of the teachers had 6-10 years of teaching experience; and 49%had 10+ years of teaching experience. Of the participants, 47% were certified at thebachelor's level; 45% had masters degrees; and 5% had earned a sixth year certificate. Inaddition, 9% were certified at the doctoral and leadership levels.
The Research Sites
Five school systems in Georgia and one in North Carolina participated in thisexploratory study. A total of 17 schools across these sites were involved. The followingcriteria were used to select the school system:
1. The system was a collaborative school district with The National ResearchCenter on the Gifted and Talented.
2. The system had a strong interest in the project's goals. In addition to theirinterest, this also meant that the gifted program administrators were willingto secure schools in their district that had the appropriate student populationand were willing to get the necessary endorsements from their centraladministration and/or from the Georgia State Department of Education.
3. The system was in close enough proximity to The University of Georgia tofacilitate the collaborations that were necessary with the research staff.
4. The systems served a wide range of ethnic and cultural groups, many ofwhom were from the target populations that were of interest in this study.One school system had a population that was 95% Native American. It
xi

should be noted that, largely for Hispanics and somewhat for Asians, thenumber was not as large as the researchers would have liked. This may bedue in part to the characteristics of student populations in this region of thecountry; there are no heavy concentrations of Hispanics and Asians inGeorgia schools.
5. The systems provided a variety of administrative arrangements and a goodmix of school sizes and geographic locations, ranging from very small tovery large; rural, urban, and suburban.
Instruments
Classroom Teacher Instruments
Two instruments were administered to the participants. One instrument Why DoWe Identify So Few Gifted Children From Economically Disadvantaged (ED) and LimitedEnglish Proficient (LEP) Backgrounds?was used to gather information from participantsregarding their perceptions of the barriers to identifying target population students for giftedprograms. A second instrument, Session "Feedforward" Instrument, was used to gatherinformation from participants regarding their understanding of (a) the observation andreferral process used in the SDM and (b) the assessment process used in the RAP. Inaddition, this instrument provided information on the level of commitment that the schoolsystem had made to being involved in the exploration of the models.
Instruments Completed By or About Students
Instruments administered to the students were selected if (a) they were a reliable andvalid measure of performances related to one or more of the core attributes of giftedness,and (b) they contributed to the development of the desired combination of objective andsubjective measures.
The California Achievement Test (CAT) (Airasian & Wardrop, 1989) or the IowaTests of Basic Skills (Lane & Raju, 1992) was selected to provide information on a child'sachievement on the reading and math subtest, as one or the other of these tests is routinelyused at many of the school sites. When achievement test scores on these measures were notavailable, the National Achievement Test (NAT) (Wick et al., 1990) was administered by theresearchers.
The Children's Language Usage Evaluation Scale (CLUES), developed byresearchers at The University of Georgia, was used to evaluate children's use of writtenlanguage. The objective was to use a writing sample to assess a student's ability to organizeand communicate written responses that demonstrated an understanding of relationshipsamong people, objects, and events. Specific writing element categories measured byCLUES are fluency of writing, language usage, story structure, novelty, and personalinterpretations.
Developing Cognitive Abilities Test (DCAT) (Wick, Boggs, & Mouw, 1989) wasused to assess learning characteristics and abilities that are believed to contribute toacademic performance. Because the DCAT is not appropriate for very young children (K-2), The Kuhlmann-Anderson Test (Kuhlmann & Anderson, 1982) was used as the aptitudemeasure.
12xli

The Scale for Rating Behavioral Characteristics of Superior Students (SRBCSS)(Renzulli, Smith, White, Callahan, & Hartman, 1976) was used to collect information fromteachers regarding the frequency with which children engaged in relevant learning,motivation, creativity, and leadership activities.
The School Attitude Measure (SAM) (Dolan & Enos, 1980) was selected to assessstudents' attitudes toward school, their view of their academic environment, and their view ofthemselves as competent students. Because the SAM only provides a total score for gradesone and two, the I Feel . . . Me Feel (Yeatts & Morrison, 1988) was administered to theyounger students. Finally, the Torrance Tests of Creative Thinking (TTCT), Figural, FormB (Torrance & Ball, 1984) was used to assess general creative thinking abilities.
Implementation Steps
The Staff Development Model
The presentation of the Staff Development Model (SDM) by The University ofGeorgia researchers was scheduled at each of the schools in the participating systemsduring the months of January and February 1992. Site coordinators were given the optionof deciding who would participate in the in-service sessions. Some site coordinators choseto involve the entire instructional staff at a school. Other site coordinators chose to useleadership teams who, in turn, trained the instructional staff at their school.
Step 1: Administer the Why Do We Identify So Few Gifted Children FromEconomically Disadvantaged (ED) and Limited English Proficient (LEP)Backgrounds? This survey assessed current attitudes and beliefsregarding the barriers to identification.
Step 2: Present information on the concept of giftedness as a psychologicalconstruct and on the core traits, aptitudes, and behaviors (TABs) associatedwith this construct. Exemplary vignettes of target population studentswere used to provide the participants with examples of the TABs exhibitedby different children. The vignettes were developed from informationgenerated in a national survey of teachers titled A Nationwide Survey of theAttributes of Gifted Economically Disadvantaged Students (Frasier, 1991).Participants were encouraged to contribute vignettes of their own.
Step 3: Explain the observation strategies. The Panning for Gold observation andreferral forms were introduced. Every effort was made to assure theparticipants that they were in charge of referring students.
Step 4: Present an overview of the RAP model. The entire assessment processwas explained to the participants. This included information on theinstruments to be used, how the information gathered would he recordedand interpreted, and how the information would be used to make programand curriculum decisions.
Step 5: Complete the Session "Feedforward" Form. This form was used togather information from the participants regarding their understanding ofthe SDM and RAP models and their commitment to participate. Generalinformation on the quality of the presentation was also collected.
The RAP Model
The following steps describe the process of data gathering, data evaluation, selectionof students, and educational program planning. These tasks were completed by researchers
13

from The University of Georgia and a representative committee of participants at each of thesites.
Step 1: Review referrals to select students for further assessment. A Panning forGold Student Referral Form was completed for each referred student.
Step 2: Administer assessment measures. The University of Georgia researchersadministered the TTCT because there were few or no trained persons at theparticipating sites. In addition, researchers provided testing assistance atsites as needed or requested. Local site personnel collected achievementtest data, administered the SRBCSS and the CLUES, collected the referralinformation from teachers, and scheduled students for assessment.
Step 3: Score assessment measures and plot information on the F-TAP.Researchers scored all instruments and plotted the results on the F-TAP.Any unusual observation about a student's profile was noted to facilitatedecision-making at the school sites.
Step 4: Conduct selection meetings at each site. Researchers met with and servedas discussion facilitators with the local school committees who made theplacement and program decisions at each of the sites.
Interim Activities
While the SDM was being presented, the assessment measures that would be usedwere ordered or copied. Assessment information was gathered in six basic areas: (a)aptitude, (b) achievement, (c) creativity, (d) structured observations, (e) language usage, and(f) motivation to achieve. These selected measures reflected a balance of student generatedinformation, test generated information, and information derived from others. The measureswere also matched to one or more of the TABs.
Policy Considerations
The principal investigator negotiated an agreement with the Georgia StateDepartment of Education (GSDOE) whereby the selected students would be consideredbona fide participants in the state's gifted programs and schools would receive the normalfunding for the students that was received for students identified using traditionalidentification criteria. Further, the GSDOE made a commitment to considering findingsfrom this study in efforts to expand the current test-only criteria.
Results
Results for Research Question 1
Research question 1 asked: Does the SDM provide an effective process to trainteachers to better observe and refer target population students? Two sets of evidence wereused to address the effectiveness of the SDM: (a) perceptions of the training providedthrough the SDM and its effectiveness in assisting teachers to make better referrals of targetstudents and (b) the number of target students referred as a result of applying strategies inthe SDM who would normally not have been referred.
Perceptions of Training Using the SDM
A total of 246 school instructional staff members completed the "Feedforward"instrument. The first part of this instrument, questions 1 to 6, was concerned with
xiv14
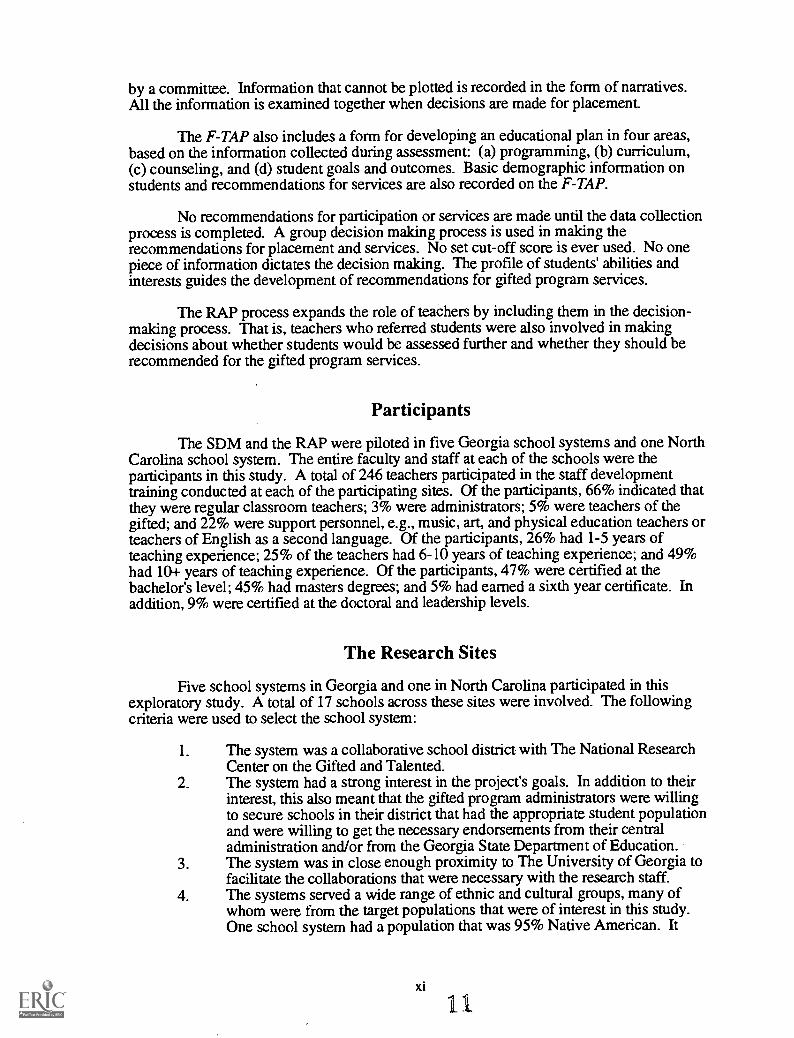
information about the mechanics of the staff development presentation. The majority of theresponses were positive with at least four-fifths of the participants agreeing or stronglyagreeing that the objectives were clearly stated; the terms used were clearly defined; thepresenters were effective; the handouts and overheads were useful; and the overall directionsfor using the material were adequate. On-going adjustments were made in the presentationbased on evaluations received about the presenters, the material and media used, thestructure of the in-service, and the overall content.
Responses to questions 7 through 10 indicated the level of understanding theschool's instructional staff was able to achieve about giftedness in target student populationsand the intensity of their commitment to participate in this exploratory study. More thanfour-fifths of the respondents strongly agreed or agreed that the SDM presentation washighly or substantially stimulating; the content of the SDM was extremely or substantiallyrelevant to their job situation, and the information provided was extremely or substantiallyuseful. Ninety-nine percent of the participants agreed to participate in implementing theplan when they indicated that they would actively advocate for potentially gifted studentsfrom economically disadvantaged backgrounds. Of the 99%, 79% said they woulddefinitely implement the plan; 20% said they would try.
In questions 11 and 12, participants were asked to evaluate strong points of the presentationand to indicate areas where improvements were needed. Narrative responses (n=573) wereanalyzed in the two categories that emerged: (a) Presentation (454 comments), and (b)Acquisition of Knowledge (119 comments). The majority of the comments (78%) werepositive. That is, 446 of the 573 comments described strong points of the staff developmentpresentation. Only 27% or 127 of the comments referred to areas where improvementswere needed.
In addition, meetings were held with site representatives to gather formative andsummative information on the implementation of the SDM. Site representatives observedthat many of their teachers probably "over-nominated" students for the project because oftheir keen desire to "do right" by students who, as a group, are so often neglected by oureducational system. Teachers did not expect that all the students referred would be selectedfor program placement. Site representatives also reported that teachers generally expressedan aversion to any use of quotas, but did express strong desires to err on the side ofinclusion if there were any signs of exceptional potential.
Number of Students Referred
It was anticipated that approximately 10 to 15 students per site would be referred.However approximately 4 times as many or 341 target population students wererecommended for assessment. It was discovered, however, that 14 of these studentsqualified for gifted program participation according to the traditional criteria used in thestate of Georgia. Thus, 327 students were finally referred for assessment. Of the 327referred students, 60% were African Americans; 9%, Native Americans; 16%, White; and16%, "Others." The majority of the students referred were elementary (74%). Almost halfthe referred students were male (47%); a little more than half were female (53%).
Results for Research Question 2
Research question 2 asked: Does the RAP provide an effective process to facilitatethe use of multiple criteria in making better professional decisions about the identificationand education of target population students? Evidence to address this question was derivedfrom formative and summative 'feedback on the implementation of the RAP and theperformance differences between selected and nonselected students.
xv

A total of 121 students were selected from the 327 students referred for assessment.Of the selected students, 55% were African Americans; 4%, Native Americans; 22%, White;and 18%, "Other." Again, the majority of the students selected were elementary (82%).More female students (59%) than males (41%) were selected.
Students were grouped by program placement status which has two levels: selectedand nonselected. Selected means that students were favorably recommended for giftedprogram participation. Nonselected means that students were not recommended forprogram participation. In this study, comparisons of performances on standardizedmeasures were only made between selected and nonselected students using an analysis ofvariance.
Developing Cognitive Ability Test (DCAT) Performance
Significant mean differences were found for program placement status. That is,selected students scored significantly higher than nonselected students on each subtestscore and on the total score of the DCAT, at the .003 level (Familywise Type I error rate =.05/11).
Bloom's Taxonomy Findings
Only five levels of the Bloom's Taxonomy are used to evaluate students' levels ofthinking on the DCAT. Students who were selected for placement scored significantlyhigher than those who were not selected, on all the Bloom's Taxonomy levels except theKnowledge level, at the .01 level (Familywise Type I error rate = .05/5).
School Attitude Measure (SAM) Performance
No significant differences were found for program placement status on any of thefive SAM subtests (Motivation for Schooling, Academic Self-Concept/Performance Based,Academic Self-Concept/Reference Based, Control Over Performance, and InstructionalMastery). There was also no significant difference found for program placement status onthe total score.
Torrance Tests of Creative Thinking (TTCT) Figural, Form B Performance
A significant difference was found for program placement status only for theAbstractness of Titles score. That is, students who were selected for placement in giftedprograms scored significantly higher than those who were not, on Abstractness of Titles, atthe .01 level (Familywise Type I error rate = .05/5).
Scales for Rating Behavioral Characteristics of Superior Students (SRBCSS)Performance
A significant difference was found between selected and nonselected students, on theSRBCSS Learning subtest, at the .0125 level (Familywise Type I error rate = .05/4).Selected students were observed by their teachers to demonstrate learning characteristics ofgifted individuals at a significantly higher level than nonselected students.
Children's Language Usage Evaluation Scale (CLUES)
CLUES was developed by researchers at The University of Georgia to evaluatechildren's use of language as evidenced in a writing sample. Students generated a writing
xvi 16

sample on a topic of their choice. Points were given each time an element in the followingfive categories was present in the writing sample:
1. Fluency of Writing: Number of ideas (length), flow of ideas.2. Language Usage: Verbs, adjectives, precision, picturesque speech.3. Story Structure: Unusual beginning, unusual dialogue, unusual ending,
unusual plot, inclusion of readers.4. Novelty: Novelty of names, novelty of locale, unique punctuation and
expressional devices, novel devices, ingenuity in solving situations,combination of ideas in unusual relationships, humor.
5. Personal Interpretation: Unusual ability to express emotional depth, unusualability to identify self with others, unusual sensitivity, unique philosophicalthinking.
The writing samples were also analyzed for the presence of novelty features such as(a) novelty of ideas, (b) novelty of themes, (c) novelty of form, (d) facility in beautifulwriting, and (e) vivid presentation of personal experiences. Additional points were added tothe score if these features were present.
Writing samples were available for 196 students (72 of the students selected forprogram participation and 124 of the students not selected for program participation).Results of the evaluations of stories submitted are summarized by categories.
1. Fluency of writing: Sixty-eight (94%) of the selected students received oneor more points for fluency; 119 (96%) of the nonselected students scoredone or more points for fluency.
2. Language Usage: Fifty-seven (79%) of the selected students and 86 (69%)of the nonselected student exhibited two or more of the language usageelements in their stories.
3. Story Structure: Forty-six (64%) of the selected and 58 (47%) of thenonselected students exhibited three or more of the story structure elementsin their stories plot, inclusion of readers, vitality.
4. Novelty: Forty-two (58%) of the selected students and 48 (39%) of thenonselected students received points for three or more novelty elements intheir stories.
5. Personal Interpretation: Thirty-eight (53%) of the selected students and 50(40%) of the nonselected students included two or more emotionalexpressive elements in their stories.
6. Optional Features: Twenty-seven (38%) of the stories of selected studentsand 21(17%) of the stories of the nonselected students included optionalfeatures.
Overall, selected students exhibited a more unusual writing or storytelling abilitythan nonselected. Of the selected students, 10% had two or more elements in the languageusage category in their stories than did nonselected students. More of the selected studentsthan the nonselected students had a greater number of elements in their stories in each of theother categories. In fact, in the category of optional features more than 50% of the selectedstudents included at least two or more optional elements in their stories than did nonselectedstudents. The only category in which nonselected students exceeded the performance ofselected students was in fluency.2
2Contact the first author for complete information on evaluating writing samples using the CLUES.

Implications
Finding an effective way to identify gifted target population students is not easy.Numerous issues intertwine to defy simple solutions to this complex problem that haschallenged educators for over 30 years. The purpose of this study was to explore thepotential of a staff development model and an assessment model to addresscomprehensively all of the issues that affect the resolution of the seemingly intractableproblems in recognizing the gifted potential of students from economically disadvantagedbackgrounds, including those of limited English proficiency. The issues include (a)adequate preparation of teachers to observe the abilities of target students from a proficiencyperspective; and (b) facilitation on the collection and use of information derived frommultiple sources, objective and subjective, when making professional decisions forplacement and services. These issues cannot be addressed without considering barrierscreated by traditional ways of defining giftedness; current rules and regulations governingthe participation of students in gifted programs; negative perceptions about students fromeconomically disadvantaged backgrounds; the lack of confidence in the ability of lowincome families to nurture the intellectual development of their children; and identificationprocedures that rely on standardized tests.
Each of these issues was considered in this exploratory study. This action-orientedstudy took place in six diverse school settings where a number of challenges had to beconsidered, e.g., scheduling problems, competition with other school-based initiatives,transient students and their families, and different administrative styles. Implications fromthis study are presented in this section and relate to (a) definition, (b) educator roles,(c) decision-making, and (d) program and curricular adaptation.
The Concept of Giftedness as a Psychological Construct
A basic implication of this study is that considering giftedness as a constructdefined by a set of core attributes provides a feasible way to introduce the TABs associatedwith giftedness to a school's instructional staff. Given the logic of viewing gifted ability asmultidimensional, the TABs appeared to provide a promising way to introduce school staffto the discovery of potential in children, regardless of economic status, cultural/ethnic groupmembership, and language proficiency. The participants in this study were quick torecognize the validity of the TABs as markers of gifted potential when they were presentedin the form of vignettes that were closely connected to traditional classroom activities. Thisunderstanding was evident in the rapidity with which participants could generate their ownvignettes with great confidence in the validity of their observations.
The Role of the Classroom Teachers and Other School Staff
A finding of this exploratory study was the affirmation of the importance of the fullinvolvement of teachers and other school staff in the process of identifying gifted targetpopulation students. Since target population students have rarely been selected for giftedprogram participation, regular educators were the most logical persons to know them best.But these educators need to be empowered to be involved in the entire process of referral,identification, and programming. This is the only way that they can become effectiveadvocates for gifted target population students, a task to which they are fully capable, givenappropriate training. Feedback from the participants attests to the value of having teachersinvolved in the entire observation and identification process. The enthusiasm demonstratedby many of the participants provides some evidence of their potential to become moreeffective at recognizing gifted potential in target population students, given appropriatetraining.
18xviii

The Relation Between Professional Decision Making and the Use of MultipleCriteria
A key objective of the RAP was to replace the emphasis on tests as the primaryidentifier of gifted potential with an emphasis on effectively using relevant informationcollected from multiple sources. A willingness to value information from subjective as wellas objective sources was critical. It was important that participants saw a need for bothtypes of information to develop a comprehensive picture of students' ability and that theydid not feel that either type of information was a substitute for the other.
In addition, an important component of the RAP was the use of a group-orienteddecision making process for placement that depended on studying and interpreting theinformation derived from multiple measures used in constructing the profile. The decisionfor placement was not based on any one measure; rather, the decision was based on theinteraction and complementary nature of the information derived from several sources. Theprocess used was consistent with the basic tenets of expert decision making theory whereinthe interrelationships of information are systematically considered (Wright & Bolger,1992). Group interactions were relied on to increase judgmental accuracy and confidence(Sniezek & Henry, 1990). Planned follow-up study on the performance of selectedstudents will provide further evaluation of the reliability of placement decisions.
xix 9

References
Airasian, P. W., & Wardrop, J. L. (1989). Review of California Achievement Test,Form E and F. In J. J. Kramer & J. C. Conoley (Eds.), The tenth mental measurementsyearbook (pp. 126-133). Lincoln, NE: The University of Nebraska-Lincoln, The BurosInstitute of Mental Measurement.
Ary, D., Jacobs, L. C., & Razavieh, A. (1979). Introduction to research ineducation (2nd ed.). Norwood, NJ: Ablex.
Baca, L., & Chinn, P. C. (1982). Coming to grips with cultural diversity.Exceptional Education Quarterly, 2(4), 33-45.
Baldwin, A. Y. (1985). Programs for the gifted and talented: Issues concerningminority populations. In F. D. Horowitz & M. O'Brien (Eds.), The gifted and talented:Developmental perspectives (pp. 223-249). Washington, DC: American PsychologicalAssociation.
Bernal, E. M. (1972). Curriculum development for the bilingual/biculturalexceptional child. In Regional training program to serve the bilinguaUbiculturalexceptional child. Sacramento, CA: Montal Educational Associates.
Bernal, E. M. (1980). Methods of identifying gifted minority students (ERICReport 72 ed.). Princeton, NJ: Educational Testing Service.
Bernal, E. M. (1981). Special problems and procedures for identifying minoritygifted students. Paper presented for The Council for Exceptional Children Conference onThe Exceptional Bilingual Child, New Orleans, LA. (ERIC Document ReproductionService No. ED 203 652)
Culross, R. (1989). Measurement issues in the screening and selection of thegifted. Roeper Review, 12(2), 76-78.
Dolan, L. J., & Enos, M. M. (1980). School Attitude Measure (SAM). Iowa City,IA: American Testronics.
Frasier, M. M. (1986). Frasier Talent Assessment Profile (F-TAP): A multiplecriteria model for the identification and education of gifted students. Athens, GA: TheUniversity of Georgia, The Torrance Center for Creative Studies.
Frasier, M. M. (1989). Identification of gifted Black students: Developing newperspectives. In C. J. Maker & S. W. Schiever (Eds.), Critical issues in gifted education:Vol. 2. Defensible programs for cultural and ethnic minorities (pp. 213-225). Austin, TX:Pro-ED.
Frasier, M. M. (1991). A nationwide survey of the attributes of gifted economicallydisadvantaged students: A survey instrument. Athens, GA: The University of Georgia,The National Research Center on the Gifted and Talented.
Frasier, M. M., Hunsaker, S. L., Lee, J., Mitchell, S., Cramond, B., & Krisel, S.(1995). Toward a multigroup perspective on giftedness: Moving from a deficiency to aproficiency view. Unpublished manuscript, The National Research Center on the Gifted andTalented, the University of Georgia, Athens.
xg0

Gallagher, J. J., & Kinney, L. (Eds.). (1974). Talent delayed-talent denied: Theculturally different gifted child. Reston, VA: The Foundation for Exceptional Children.
Gardner, H. (1983). Frames of mind: The theory of multiple intelligences. NewYork: Basic Books.
Gregory, D. A. (1985). Diagnostique monograph: Perspectives in specialeducation assessment. Reston, VA: The Council for Exceptional Children.
Hagen, E. (1980). Identification of the gifted New York: Columbia University,Teachers College Press.
Hilliard, A. G. (1991). The learning potential assessment device and instrumentalenrichment as a paradigm shift. In A. G. Hilliard (Ed.), Testing African American students:Special re-issue of The Negro Educational Review (pp. 200-208). Morristown, NJ: AaronPress.
Hoge, R. D. (1988). Issues in the definition and measurement of the giftednessconstruct. Educational Researcher, 17(7), 12-16, 22.
Hoge, R. D. (1989). An examination of the giftedness construct. CanadianJournal of Education, 14(1), 6-17.
Hoge, R. D., & Cudmore, L. (1986). The use of teacher-judgment measures in theidentification of gifted pupils. Teacher and Teacher Education, 2(2), 181-196.
Kuhlmann, F., & Anderson, R. (1982). The Kuhlmann Anderson Test.Bensenville, IL: Scholastic Testing Service.
Lane, S., & Raju, N. S. (1992). Iowa Test of Basic Skills, Form J. In J. J. Kramer& J. C. Conoley (Eds.), The eleventh mental measurements yearbook (pp. 419-424).Lincoln, NE: The University of Nebraska-Lincoln, The Buros Institute of MentalMeasurements.
Leung, E. K. (1981, February). The identification and social problem of the giftedbilingual-bicultural children. Paper presented at The Council for Exceptional ChildrenConference on the Exceptional Bilingual Child, New Orleans, LA. (ERIC DocumentReproduction Service No. ED 203 653)
Mims, J. S. (1988). Access to gifted and talented education: Alternative strategiesfor underrepresented students. Dissertation Abstracts International, 49, 2619A.(University Microfilms No. AAC88-11924)
Purkey, W. W., & Novak, J. M. (1984). Inviting school success: A self-conceptapproach to teaching and learning (2nd ed.). Belmont, CA: Wadsworth.
Renzulli, J. S., Smith, L. H., White, A. J., Callahan, C. M., & Hartman, R. K. (1976).Scales for the Rating of Behavioral Characteristics of Superior Students. MansfieldCenter, CT: Creative Learning Press.
Sax, G. (1980). Principles of educational and psychological measurement andevaluation (2nd ed.). Belmont, CA: Wadsworth.
21

Scott, M. S., Perou, R., Urbano, R., Hogan, A., & Gold, S. (1992). Theidentification of giftedness: A comparison of White, Hispanic and Black families. GiftedChild Quarterly, 36(3), 131-139.
Sniezek, J. A., & Henry, R. A. (1990). Revision, weighting, and commitment inconsensus group judgment. Organizational Behavior and Human Decision Processes, 45,66-84.
Taylor, 0. L., & Lee, D. L. (1991). Standardized tests and African-Americanchildren: Communication and language issues. In A. G. Hilliard (Ed.), Testing AfricanAmerican students (pp. 67-80). Morristown, NJ: Aaron Press.
Torrance, E. P., & Ball, 0. (1984). Torrance Tests of Creative Thinking, Figural,Form B. Bensenville, IL: Scholastic Testing Service.
Tuliao, N. A. C. (1986). The identification of culturally-different gifted andtalented children. Dissertations Abstracts International, 48, 281A. (University MicrofilmsNo. AAC87-10615)
Wick, J. W., Boggs, D. L., & Mouw, J. T. (1989). Developing Cognitive AbilitiesTest (DCAT). Iowa City, IA: American Testronics.
Wick, J. W., Mason, J., Stewart, J., Smith, J., Wallen, N., Gatta, L., & Fraenkel, J.(1990). National Achievement Test. Chicago: American Testronics.
Wiggins, G. (1989). A true test: Toward more authentic and equitable assessment.Phi Delta Kappan, 70(9), 703-713.
Wood, S. B., & Achey, V. H. (1990). Successful identification of giftedracial/ethnic group students without changing classification requirements. Roeper Review,13(1), 21-26.
Wright, G., & Bolger, F. (1992). Expertise and decision support. New York:Plenum.
Yeatts, P., & Morrison, M. (1988). Instruction manual: Administering the "I Feel. . . Me Feel" self-concept instrument Athens, GA: The University of Georgia.

Table of Contents
ABSTRACT
EXECUTIVE SUMMARY vii
Introduction 1
Statement of the Problem 1
Purpose of the Study 2
Research Questions 3
Definitions 3
The Staff Development Model (SDM) and the Research-BasedAssessment Plan (RAP): Background, Design, and Rationale 4
Assumptions Underlying the Staff Development Model (SDM) and theResearch-Based Assessment Plan (RAP) 4
The Core Attributes of the Giftedness Construct 4The Staff Development Model (SDM) 7The Research-Based Assessment Plan (RAP) 7
Procedures 8
Participants 8
Research Sites 8
Instruments 10Classroom Teacher Instruments 10
Why Do We Identify So Few Gifted Children FromEconomically Disadvantaged (ED) and LimitedEnglish Proficient (LEP) Backgrounds? 10
Session "Feedforward" Instrument 11Instruments Completed by or About Students 11
California Achievement Test (CAT) 11Children's Language Usage Evaluation Scale (CLUES) 12Developing Cognitive Abilities Test (DCAT) 12"I Feel . . . Me Feel" Self-Concept Instrument 13Iowa Tests of Basic Skills (ITBS) 13Kuhlmann Anderson Tests 13National Achievement Test (NAT) 13Scales for Rating Behavioral Characteristics of Superior
Students (SRBCSS) 14School Attitude Measure (SAM) 14Torrance Tests of Creative Thinking (TTCT), Figural, Form B 15
Implementation Steps 15The Staff Development Model (SDM) 15The Research-Based Assessment Plan (RAP) 16Interim Activities 17Policy Considerations 17
21/

Table of Contents (continued)
ResultsResults for Research Question 1
Perceptions of Training Using the Staff Development Model (SDM)Number of Students Referred
Results for Research Question 2Developing Cognitive Ability Test (DCAT) PerformanceBloom's Taxonomy FindingsSchool Attitude Measure (SAM) PerformanceTorrance Test of Creative Thinking (TTCT), Figural, Form B
PerformanceScales for Rating Behavioral Characteristics of Superior
Students (SRBCSS) PerformanceChildren's Language Usage Evaluation Scale (CLUES)
DiscussionSummaryImplicationsThe Concept of Giftedness as a Psychological ConstructThe Role of the Classroom Teachers and Other School StaffThe Relation Between Professional Decision Making and the Use of
Multiple Criteria
References
AppendicesAppendix A:Appendix B:Appendix C:Appendix D:Appendix E:
Appendix F:Appendix G:Appendix H:
Sample VignettesPanning for GoldFrasier Talent Assessment Profile (F-TAP)Session "Feedforward" InstrumentWhy Do We Identify So Few Gifted Children FromEconomically Disadvantaged (ED) and Limited EnglishProficient (LEP) Backgrounds?Children's Language Usage Evaluation Scale (CLUES)Information Sheets for Participating Teachers and ParentsSession "Feedforward" Instrument: Responses toQuestions 1-6
xxvi
24
1717172121232323
24
2426
2727272828
28
31
3535394955
596369
73

List of Tables
Table 1 Examples of Similarities Among Gifted Characteristics on Culture-SpecificChecklists 6
Table 2 Session "Feedforward" Instrument: Subject Responses to Questions 7 to 10 19
Table 3 Distribution of Students Referred for Testing by Ethnicity, Grade, andGender (11 = 327) 22
Table 4 Distribution of Students Selected for Placement in Gifted Program byEthnicity, Grade, and Gender = 121) 22
Table 5 Analysis of Variance for the Subtests and the Total Score of the DevelopingCognitive Abilities Test by Program Placement Status 23
Table 6 Analysis of Variance for the Bloom's Taxonomy Scores of the DevelopingCognitive Abilities Test by Program Placement Status 24
Table 7 Analysis of Variance for the Abstractness of Titles Score of the TorranceTests of Creative Thinking by Program Placement Status 25
Table 8 Analysis of Variance on the Subscales of the Scales for Rating BehavioralCharacteristics by Program Placement Status 25
25;mu
An Exploratory Study of the Effectiveness of the StaffDevelopment Model and the Research-Based Assessment
Plan in Improving the Identification of GiftedEconomically Disadvantaged Students'
Mary M. FrasierScott L. Hunsaker
Jongyeun LeeVernon S. FinleyJaime H. GarciaDarlene Martin
Elaine Frank
The University of GeorgiaAthens, Georgia
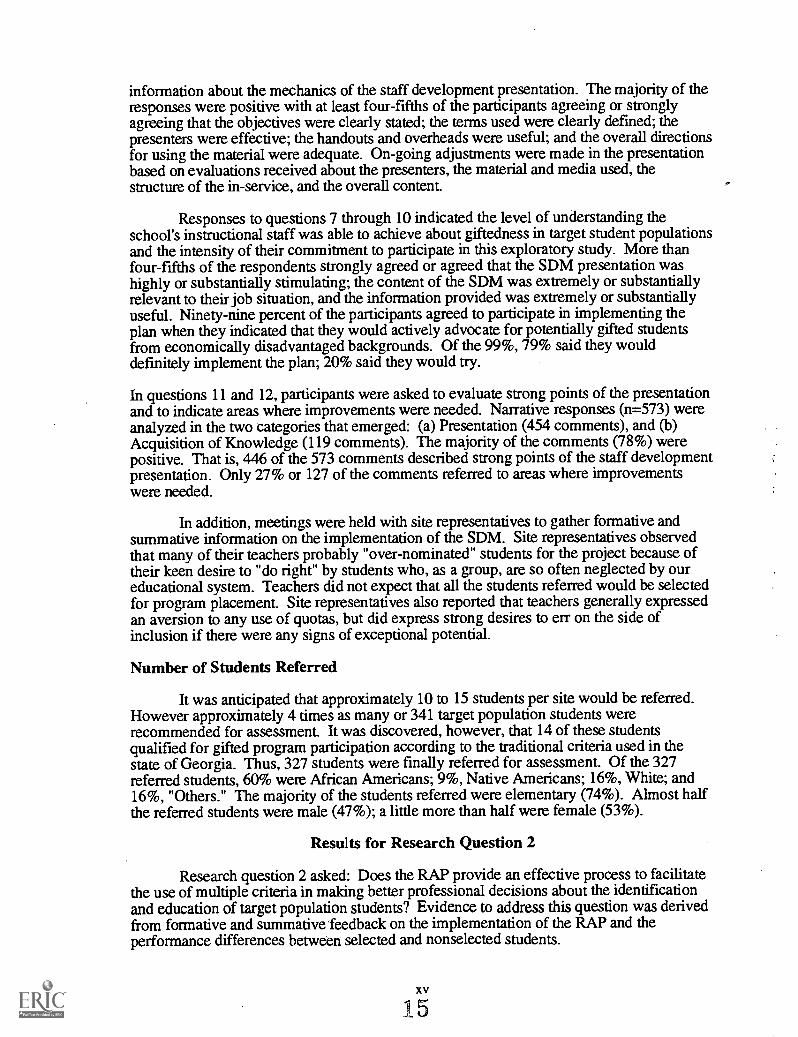
Introduction
A Staff Development Model (SDM) and a Research-Based Assessment Plan (RAP)model were developed by researchers at The University of Georgia site. These models weredesigned to improve the identification and education of gifted students from economicallydisadvantaged families and areas, some of whom may have limited proficiency in theEnglish language. Results from an exploratory investigation on the effectiveness of theSDM and the RAP are presented in this report.
The SDM was based on the notion that regular classroom teachers have the greatestpotential to know the abilities of target population students. Finding ways to capitalize ontheir knowledge of the potential of these children was considered to he critical in thisinvestigation of methods to improve their identification as gifted. The RAP was predicatedon a notion that the judicious use of multiple selection criteria should form the basis forassessing the gifts of target population students. Both models were based on the concept ofgiftedness as a psychological construct and used core attributes of this construct as thefoundation for observing, referring, appraising, and making professional recommendationsfor placement, programs, and services.
Statement of the Problem
At the top of most lists recounting problems faced in identifying culturally differentand economically disadvantaged students are criticisms about test bias and theinappropriateness of relying on standardized tests as the primary identifier of giftedpotential. Critics contend that most standardized tests are not designed to evaluate theabilities of culturally different children or children who are from economicallydisadvantaged families (Baldwin, 1985; Bernal, 1981; Hilliard, 1991). Tests are alsocriticized as not adequately accounting for incongruencies between the language of the testgiver (or test constructor) and culturally different test takers (Taylor & Lee, 1991).
1 While minority group status is not directly implied by this label, because high proportions ofeconomically disadvantaged students are also members of minority groups in this country the two terms arefrequently used interchangeably in the literature. As needed, minority and economically disadvantaged willbe used in this paper to refer to target group students.
26

2
Teachers may find it difficult to recognize unfamiliar expressions of giftednesswhen exhibited by children who are different from mainstream children in terms of culture,language, or environment (Baca & Chinn, 1982; Bernal, 1972; Wood & Achey, 1990).When considerations for gifted programs depend on teacher nominations, students areeffectively excluded when they are not referred. In fact, as Scott, Perou, Urbano, Hogan,and Gold (1992) noted, regardless of any inadequacies in the assessment process, childrenwho are not referred will never have the opportunity to be selected for gifted programs.Tuliao (1986) found that when teachers were involved in identification processes asmembers of assessment committees, they positively affected the nomination process inschools that had large populations of students from low socioeconomic status and minoritygroups. However, Mims (1988) reported that teachers' limited knowledge of giftedcharacteristics and their low expectations were major deterrents to their referrals of minoritystudents for gifted program participation.
Wiggins (1989) contends that "When an educational problem persists despite thewell-intentioned efforts of many people to solve it, it's a safe bet that the problem hasn't beenproperly framed" (p. 703). Given the persistent underrepresentation of target populationstudents in gifted programs, a plausible assumption may be that the problems in theiridentification have not been properly conceptualized. One difficulty in conceptualizing theproblems may be caused by the complexity of the issues involved. Frasier (1989) observesthat "Probably with no other subpopulation have the definition and identification ofgiftedness been more complex and seemingly inextricably interwoven with environmentalfactors, performance on standardized tests, deviation from mainstream cultures, andambiguous attitudes regarding the degree of academic acuity possessed by Black students"(p. 221). Although her reference is to Black students, similar observations have been madeabout the search for gifted students in other minority groups (Bernal, 1981, 1989;Kirschenbaum, 1988, 1989; Perrine, 1989; Tonemah, 1987).
Finding effective solutions to the identification of gifted target population students isnot easy. For example, Gregory (1985) observed that the problems associated with theinadequate identification of gifted minority students are much too complex to be resolved bysimply seeking a new assessment instrument. A much more comprehensive approach isneeded.
Purpose of the Study
Training is required to implement any new approach for identifying giftedness inminority or disadvantaged populations. Educators must be prepared to (a) recognizeattributes of giftedness in these students, (b) select appropriate assessment measures forappraising these attributes, and (c) use a decision-making process that emphasizes theevaluation of information from multiple sources. The purposes of this exploratory study,thus, were threefold:
1. To pilot the SDM which was designed to provide educators with theinformation and a process they needed to recognize gifted attributes bytarget population students.
2. To pilot the RAP which was designed to facilitate the appraisal ofexceptional performance by target population students by using multipleinformation sources based on the core attributes of giftedness.
3. To examine the overall efficiency and effectiveness of the SDM and theRAP in addressing factors affecting the identification of target populationstudents. The results of this investigation would be used to refine the SDMand the RAP.
27

3
Research Questions
The following research questions were posed to explore the effectiveness of theSDM and the RAP in facilitating the identification of target population students:
1. Does the SDM provide an effective process to train teachers to betterobserve and refer target population students for gifted programparticipation? This question is designed to explore whether teachers who aretrained in using the SDM process are able to refer confidently students fromthe target population for gifted program participation who normally wouldnot have been referred.
2. Does the RAP provide an effective process to facilitate the use of multipleselection criteria in making better professional decisions about theidentification and education of gifted target population students? Thisquestion is designed to explore whether the RAP effectively facilitatesteachers' ability to use confidently multiple criteria (or data from objective andsubjective sources) to make recommendations for placement of targetpopulation students in gifted programs.
Definitions
1. Target Population Students: Target population students for this study are primarilydefined by their low socioeconomic status. That is, target population students aredefined as students who are eligible for free or reduced lunch. As noted earlier,because a high proportion of minority students and students who have limitedproficiency in English are also economically disadvantaged, they are the primaryfocus of this paper.
2. Assessment: To provide the broader focus needed for this study, the concept ofassessment rather than testing was chosen. Assessment refers to the process ofgathering information from a variety of sources to make educational decisions aboutprogrammatic interventions for children (Hargrove & Poteet, 1984; Luftig, 1989;McReynolds, 1968; Oakland, 1977; Salvia & Ysseldyke, 1988). Typicallyassessment involves the entire process of referrals, screening, classification,instructional planning, and pupil progress decisions (Nuttall, Romero, & Kalesnik,1992).
3. Giftedness as a Psychological Construct: The concept of giftedness used in thisstudy is that giftedness is a psychological construct. This conception was derivedfrom Hagen's (1980) observation that giftedness is a psychological constructinferred by observing certain characteristics or behaviors of individuals. Theaccuracy of these inferences depends on the characteristics or behavior chosen forobservation and appraisal.
4. Staff Development: According to Bradley, Kallick, and Regan (1991), the term staffdevelopment refers to any systematic attempt to affect the professional practices,beliefs, and understandings of school persons toward an announced goal. Staffdevelopment programs are aimed at providing educators with new or reinforcedlearning, undertaken for the purpose of achieving a goal through the acquisition ofrelevant skills, knowledge, and understanding. Staff is defined as including anymember of the school community. Development refers to continuing growth inskills, knowledge, and understanding.
28

4
5. School's Instructional Staff: In this study the more inclusive term, schoolinstructional staff, is used to refer to the classroom teachers who provide instructionin core subject areas as well as to the aides who assist them; special area teacherssuch as art, music, physical education; media specialists; counselors; administrators;and gifted education specialists.
The Staff Development Model (SDM) and the Research-BasedAssessment Plan (RAP): Background, Design, and Rationale
Much of what we know about the identification of gifted target population studentshas been derived from attempts to manipulate or modify traditional identificationprocedures. For example, special instruments, scoring methods, or training programs havebeen designed in attempts to qualify target population students for gifted programparticipation. Missing in these attempts has been a consideration of the fundamentalattributes that underlie the concept of giftedness. Considerations of these fundamentalattributes may have important implications for addressing the more important question ofhow to design procedures that effectively appraise basic gifted potential, regardless ofenvironment and culture. The two models used in this investigation were designed toaddress the question of how to recognize gifted potential in students from diverseenvironments and cultures by focusing on strategies that emphasize the core attributes ofgiftedness, regardless of background.
Assumptions Underlying the Staff Development Model (SDM)and the Research-Based Assessment Plan (RAP)
The basic assumption of the SDM and the RAP is that core attributes of thegiftedness construct provide the best foundation for developing procedures to help aschool's instructional staff (a) recognize gifted attributes in target population students, and(b) give appropriate consideration to cultural, economic, and environmental factors whenappraising them for gifted program participation. The following principles underlie thisbasic assumption:
1. There are core attributes of giftedness that are observable in the performanceof children, regardless of economic, cultural, or ethnic backgrounds.
2. Exceptional expressions of these core attributes can be appraised in targetstudents by using a variety of objective and subjective assessment measures.
3. Educators can be trained to use these core attributes as a means of becomingmore effective in observing giftedness in target groups.
4. Educators can be trained to use these core attributes to guide the selection ofassessment measures.
5. A procedure can be developed wherein all the assessment informationcollected about target students is used to make decisions for gifted programplacement and services.
6. Educational programs can be developed that use assessment information asthe basis for addressing the exceptional learning needs of target students.
The Core Attributes of the Giftedness Construct
There are two reasons for viewing giftedness as a psychological construct. Onereason comes from the theories and ideas of several researchers and writers who contendthat the adequate measure of gifted potential depends on an understanding of the basicattributes associated with the giftedness construct (Bernal, 1980; Culross, 1989; Hagen,

5
1980; Hoge, 1988, 1989; Hoge & Cudmore, 1986; Leung, 1981). By extension, they alsosuggest that effective curricula and programs would also reflect primary consideration of thecore attributes of giftedness.
This notion of a construct was explicated by Sax (1980) who defined a construct asa set of hypothesized traits, abilities, or characteristics abstracted from a variety of behaviorspresumed to have educational or psychological meaning. A construct, itself, is not directlymeasurable . Behaviors associated with a construct are measurable. As Ary, Jacobs, andRazavieh (1979) observed, the sum of the measurement of associated behaviors provides theindirect measure of the construct.
Hagen (1980) asserts that giftedness is a psychological construct. As such, accurateinferences about gifted potential depend on the choices made about the characteristics andbehaviors to observe and appraise. Bernal (1980) believes that a major problem affectingthe referral of minority students for gifted programs is based on the lack of a cleardefinition of attributes that underlie the giftedness construct. He suggests that by focusingon the core attributes of giftedness, there would be less reason to be bound by the cognitivepreferences of one group over another. Culross (1989) agrees when she notes that the lackof consensus regarding what constitutes giftedness may be a primary cause of some of thepitfalls in screening and selecting students for gifted programs.
Leung (1981) suggests that absolute characteristics of giftedness provide aneffective way for educators to consider attributes of giftedness in different cultural andeconomic groups. Absolute aspects, according to Leung, are those traits that symbolizegiftedness across different cultural and economic groups. Conversely, specific aspects ofgiftedness are absolute aspects that have been affected by culture and environment. Leungfeels that adequate understanding of specific aspects of giftedness are predicated onclarifying absolute attributes.
Finally, Hoge (1988, 1989), and Hoge and Cudmore (1986) posit that an adequatedefinition of the giftedness construct is necessary before appropriate selections can be madeof measures to assess gifted potential in children. Hoge (1989) observes that, for example,while the formal definition of the giftedness construct incorporates "a broad range ofcognitive, motivation, and personality characteristics, gifted children continue to be identifiedsolely on the basis of IQ test performance" (p. 11). He believes that a clear statementspecifying the traits, aptitudes, and behaviors associated with the giftedness construct mustbe decided before making decisions about labels and services.
The second reason for focusing on identifying the core attributes that underlie thegiftedness construct grew out of activities engaged in by researchers at The University ofGeorgia in the initial planning of a procedure to identify gifted children in the targetpopulation. A decision was made to focus on intellectual giftedness and specific academicaptitudes because most school programs are designed to address exceptional abilities inthese areas. Two of the intelligences proposed by Gardner (1983)linguistic and logical-mathematicalwere selected as the primary domains to reflect the focus of schoolprograms for gifted students. A succinct list of characteristics of gifted children reported byGallagher and Kinney (1974) was used as descriptors of the basic abilities associated withthese two intelligences.
When we used the two intelligences proposed by Gardner (1983) and the basicgifted abilities outlined by Gallagher and Kinney (1974) to organize the basic meanings ofitems on various culture-specific checklists, two observations were evident. There appearedto be great similarity in the meanings of items on the various checklists designed to observefor gifted potential in the target groups. The checklist items reflected the underlying
30

6
meanings of the gifted abilities proposed by Gallagher and Kinney, and illustrated behaviorsthat students would exhibit when showing ability in either of the two intelligences proposedby Gardner. An example of the relationship among items that led to this observation isillustrated in Table 1.
Further observations suggested that many items on the checklists better describedtarget population students' motivation for intellectual pursuit and their preferred learningenvironment, learning styles, or interests. The reader is referred to Frasier et al. (1995) for afull discussion of the development of the 10 core attributes of giftedness that grew out ofthese observations. These core attributes are referred to as traits, aptitudes, and behaviors(TABs). They eventually led to the development of the SDM and the RAP.
Table 1
Examples of Similarities Among Gifted Characteristics on Culture-Specific Checklists
Category ofGiftedness
GenericIndicator
Relevant ChecklistIndicator
Linguistic (Gardner, 1983) Meaningfully manipulatessome symbol system(Gallagher & Kinney, 1974)
Logical-Mathematical(Gardner, 1983)
Extends or extrapolatesknowledge to new situationsof unique applications(Gallagher & Kinney, 1974)
Expressive speech(Torrance, 1977)Uses words to expressthought and meaning(Tonemah, 1987)Speaks correctly withgood grammar for his/herage (Bernal, 1974)Can talk more than oneway (can talk proper,everyday talk, talk todifferent groups) (Hilliard,1976)
Innovative use of commonmaterials (Torrance, 1977;Tonemah, 1987)Invents ways to makeimprovements to things orways of doing things(Tonemah, 1987)Figures out things orworks on problems andfinds solutions whichother kids probably areunable to do (Bernal,1974)

7
The Staff Development Model (SDM)
The invitational education theory developed by Purkey (Purkey & Novak, 1984),and notions embodied in the concept of teacher empowerment (Maeroff, 1988; Powell &Solity, 1990) provided the conceptual framework for the SDM. Essentially the principles ofinvitational education imply that people are able, valuable, and responsible individuals whopossess relatively untapped potential in all areas of human development. This potential isbest developed through the implementation of policies, places, and programs designed topersonally and professionally invite people to invite themselves as participants. Whenapplied in the development of the SDM, this principle represented the intent to inviteteachers to become active participants in the identification of gifted target populationstudents.
Teachers must become more empowered as effective members of the team makingprofessional decisions for services if they are to assume the role of talent scouts. Theconcept of empowerment refers to the development of a sense of self-efficacy andconfidence so that teachers can exercise their craft in a professionally responsible way(Maeroff, 1988; Powell & Solity, 1990). Applying the concept of empowerment in thecontext of the SDM specifically means that teachers are not only invited to participate in theprocess of identifying gifted target population students, they are also empowered toparticipate as an integral part of the team making the professional recommendations aboutplacement in gifted programs.
The SDM provides educators with (a) background information on the concept ofgiftedness as a psychological construct; (b) an understanding of the set of core traits,aptitudes, and behaviors or TABs associated with the giftedness construct; (c) instructionsfor observing TABs in the target population student groups; and (d) a procedure to usethese TABs to observe and refer students for assessment to determine their participation intheir school's gifted program. Vignettes2 and a series of Panning for Gold Forms are usedto prepare teachers to observe gifted behaviors in target population groups. A sample of thevignettes used in implementing the SDM are provided in Appendix A. The Panning forGold series of forms are provided in Appendix B.
The Research-Based Assessment Plan (RAP)
The RAP is an identification system designed to guide the collection andinterpretation of data from multiple sources when appraising children's needs for giftedprogram services. At the heart of the RAP is the Frasier Talent Assessment Profile(F-TAP) (Frasier, 1986). Process and performance information collected on students areplotted using an appropriate scale on the F-TAP for interpretation by a committee.Information that cannot be plotted is recorded in the form of narratives. All of theinformation is examined together when decisions are made for placement (See Appendix Cfor a copy of F-TAP.)
The F-TAP also includes a form for developing an educational plan in four areasbased on the information collected during assessment: (a) programming, (b) curricula,(c) counseling, and (d) student goals and outcomes. Basic demographic information onstudents and recommendations for services are also recorded on the F-TAP.
2 The vignettes were derived from a national survey conducted to collect teacher descriptions of brightchildren from economically disadvantaged backgrounds. For a full report on this survey see Frasier (1991)and Thomas (1991).
32

8
No recommendations for participation or services are made until the data collectionprocess is completed. A group decision making process is used in making therecommendations for placement and services. No set cut-off score is ever used. No onepiece of information dictates the decision making. The profile of students' abilities andinterests guides the development of recommendations for gifted program services.
The RAP process was designed to expand the role of teachers by including them inthe decision-making process. That is, teachers who referred students were also involved inmaking decisions about whether they would be assessed further and whether they should berecommended for the gifted program services.
Procedures
The procedures used in this exploratory study to investigate the effectiveness of theSDM and the RAP are presented in this section. The participants and the research sites aredescribed. Steps followed in implementing the staff training and collecting assessment dataare outlined. Information is also provided about the instruments that were administered tothe teachers and the students, and the methods used to analyze data.
Participants
The SDM and the RAP were piloted in five Georgia school systems and one NorthCarolina school system. The entire faculty and staff at each of the schools in theparticipating systems were participants for this study. These faculty and staff were involvedin the staff development and assessment process according to the procedure adopted by thesite coordinator. That is, at some of the sites the school's instructional staff was trained byresearchers from The University of Georgia. At other sites, the researchers trained a teamselected by the site coordinator. This team, in turn, provided the training for theinstructional staff at the participating site.
A total of 246 teachers participated in the staff development training conducted ateach of the participating sites. Of the participants, 66% indicated that they were regularclassroom teachers; 3% were administrators; 5% were teachers of the gifted; and 22% weresupport personnel such as music, art, and physical education teachers or teachers of Englishas a second language. Of the teachers participating in the staff development training, 4%did not indicate the position they held at their school. Of the participants, 26% or 63 had 1-5 years of teaching experience; 25% or 61 had 6-10 years of teaching experience; and 49%had 10+ years of teaching experience. Of the teachers, 47% were certified at the bachelor'slevel; 45% had master's degrees; and 5% had earned a sixth year certificate. In addition, 9%were certified at the doctoral and leadership levels.
Research Sites
Six school systems in Georgia and one in North Carolina comprised the originalgroup of schools that participated in this exploratory study. One of the Georgia sitesdropped out of the project because of difficulties encountered in collecting the requiredinformation. The following criteria were used to select the school system:
1. The system was a collaborative school district with The National ResearchCenter on the Gifted and Talented.
2. The system had a strong interest in the project's goals. In addition to theirinterest, this also meant that the gifted program administrators were willing

9
to secure schools in their district that had the appropriate student populationand were willing to get the necessary endorsements from their centraladministration and/or from the Georgia State Department of Education.
3. The system was in close enough proximity to The University of Georgia tofacilitate the collaborations that were necessary with the research staff.
4. The systems served a wide range of ethnic and cultural groups, many ofwhom were from the target populations that were of interest in this study.One of the school systems had a population that was 95% NativeAmericans. It should be noted that, largely for Hispanics and somewhat forAsians, the number was not as large as the researchers would have liked.This may be due in part to the characteristics of student populations in thisregion of the country; there are no heavy concentrations of Hispanics andAsians in Georgia schools.
5. The systems provided a variety of administrative arrangements and a goodmix of school sizes and geographic locations, ranging from very small tovery large; rural, urban, and suburban.
Across the sites, a total of 17 schools participated. A description of each sitefollows.
School System A is an urban school system located in approximately the middle ofthe state of Georgia. The total student population is 24,375. Of that population, 38% areWhite and 62% are African Americans. Hispanics, Asian/Pacific Islanders, and AmericanIndians or Alaskan Natives make up less than 1% each. This school system consists of 30elementary schools, 4 middle schools, and 4 high schools. Two of the elementary schoolswere selected for participation in this study. Both had large minority enrollments; one wasclassified as a Title 1 school.
School System B is a private, rural reservation school located in North Carolina. Ofthe school system's total student population of 995, 5% are White and 95% are AmericanIndians. The median family income is in the low socioeconomic (SES) range. At the timethe exploratory study was initiated, 21 students were being served in the system's giftedprogram; 7 students were in the process of being evaluated. This school system consists of1 elementary school, 1 middle school, and 1 high school, all of which participated in thisstudy.
School System C serves approximately 10,800 students with 25% living in ruralareas, 35% in suburban areas, and 40% in urban areas. Of the students, 51% are AfricanAmerican, 46% are White, 1% Hispanic, 1.5% Asian/Pacific Islanders, and 5% AmericanIndians or Alaskan Native. Of the families, 14% are classified as high SES, 61% mediumSES, and 25% low SES. The county in which the school system is located derives a largepart of its economic base from the local university. Three of the system's 13 elementaryschools participated in this study.
School System D serves about 42,000 inner city, rural, and suburban students.Some of the students served are bilingual. The student enrollment consists of 42% AfricanAmericans, 54% Whites, 2% Hispanics, 3% Asian/Pacific Islanders, and .07% AmericanIndian/Alaskan Native. Two middle schools were chosen for participation because of theirdiversity.
School System E is located in a large suburban community that is adjacent to amajor metropolitan center. District wide, this system serves approximately 65,000 students.Of the students, 90% are White, 5% are African Americans, 2% are Hispanic, 3% areAsian/Pacific Islanders, and .5% are American Indian/Alaskan Natives. Approximately
34

10
6,500 students are served in the system's gifted program. This system was chosen becauseof its growing English as a Second Language (ESL) population. Two elementary schoolswith large ESL populations were chosen to participate in this study.
School System F is located in rural, south central Georgia. The school systemserves a total of 1,800 students, K-12 in three elementary schools and one comprehensivemiddle/high school. The majority of the students are on free or reduced lunch. The fourschools in this school system participated in this study.
Instruments
Instruments used in this study are described in this section. The section is dividedinto two parts. In Part I the instruments administered to the school's instructional staff atthe participating schools are described. In Part II the instruments administered to studentswho were referred for placement are described.
Classroom Teacher Instruments
Two instruments were administered to the participants. One instrument, Why DoWe Identify So Few Gifted Children From Economically Disadvantaged (ED) and LimitedEnglish Proficient (LEP) Backgrounds?, was used to gather information from participantsregarding their perceptions of the barriers to identifying target population students for giftedprograms. A second instrument, Session "Feedforward" Instrument (see Appendix D), wasused to gather information from participants regarding their understanding of (a) theobservation and referral process used in the SDM, and (b) the assessment process used inthe RAP. In addition, this instrument provided information on the level of commitment thatthe school system had made to being involved in the exploration of the models.
Why Do We Identify So Few Gifted Children From Economically Disadvantaged (ED) andLimited English Proficient (LEP) Backgrounds?
This 10-item survey was developed to examine educators' perceptions of the criticalbarriers affecting the identification of gifted target population students. Results from thissurvey were not used to evaluate the effectiveness of the SDM and the RAP. Rather theywere used to adjust the training materials to focus more clearly on the barriers that wereconsidered by the participating staff to be most serious.
The literature on gifted minority and poor students comprised one source for theitems that were used to develop this survey. This review of literature revealed severalrecurring problems related to language, home environments, teacher expectations, andtesting that had been discussed as contributors to the underrepresentation of targetpopulation students in gifted programs. The other source of information for the surveyitems was the professional and personal experiences of The University of Georgiaresearchers. These researchers have had extensive experience over the last thirty years asregular classroom teachers, gifted program teachers, teacher trainers, and gifted and specialeducation consultants. In addition each was a member of one of the groups identified as thetarget population for this study. Their professional and personal experiences werecombined with information gleaned from the literature to develop and refine the surveyitems. There was consensus that the 10 items selected reflected the most frequently citedbarriers to the identification of gifted target population students.
Participants indicated their perceptions about the issues reflected in the ten items ona 5-point Likert scale. Response possibilities ranged from 1 meaning "Strongly Agree" to 5meaning "Strongly Disagree." A copy of the survey is provided in Appendix E. The surveywas administered prior to beginning the first staff development training session at each site.

11
Participants were told that the purpose of the survey was to find out what their perspectiveswere on the problems encountered in identifying gifted target population students.
Session "Feedforward" InstrumentFile copies of various session evaluation instruments collected over the years by the
principal investigator were reviewed for examples of typical items used to evaluateeducational presentations. Literature on staff development was also reviewed for items thatreflected current goals of staff development programs. In addition, faculty in theDepartment of Educational Leadership at The University of Georgia were consultedregarding the development of the items.
The Session "Feedforward" Instrument consists of 12 items. The first six aretraditional items used to evaluate educational presentations. This information was primarilyused by the researchers to adjust any conditions in subsequent presentations related to theuse of visuals and handouts, the effectiveness of presenters, and the clarity with which thematerial was presented.
Questions 7 through 10 were concerned with judging the degree of commitmentparticipants made to participating in the project. Participants were asked to indicate thedegree to which they were stimulated and motivated by the session and how relevant anduseful or practical they found the information presented. The last two items asked for(a) an appraisal of strong points of the overall presentation and (b) "feedforward"suggestions on how to make subsequent presentations more effective. Information fromthis instrument was used to make ongoing modifications in the staff developmentprocedures and content and to evaluate the effectiveness of the SDM and the RAP from theperspective of classroom teachers.
Instruments Completed by or About Students
Instruments administered to the students were selected if (a) they were a reliable andvalid measure of performances related to one or more of the core attributes of giftedness,and (b) they contributed to the development of the desired combination of objective andsubjective measures.
The instruments are presented in alphabetical order. The California AchievementTest (CAT) and the Iowa Tests of Basic Skills (ITBS) are used routinely by many of theschools sites. The National Achievement Test (NAT) was administered by the researchersonly if scores on the CAT and the ITBS were not available.
California Achievement Test (CAT)The CAT (Airasian & Wardrop, 1989) measures achievement in basic academic
skills: reading language expression, mathematics concepts, math applications, mathematicscomputation, spelling, science, social studies, and study skills. In this study, only the scoresfor reading, language expression, math concepts, math applications, and total battery scoreswere used. The test has a multiple-choice format and 11 levels for use with grades K-12.The scores reflect the total number correct in each content area and for the total battery.Scores are reported as national percentiles, national stanines, grade equivalents, normal curveequivalents, scale scores, and number of objectives mastered.
The CAT was standardized in 1984 and 1985 using a public school sample stratifiedby geographic region, community (urban, suburban, rural), and size of district. The Kuder-Richardson 20 formula was used to determine reliability of the subtests and total battery.Coefficients, which ranged from high .60's to .95 were reported by level.
36

12
Children's Language Usage Evaluation Scale (CLUES)CLUES was developed by researchers at The University of Georgia to evaluate
children's use of written language. The objective was to use a writing sample to assess astudent's ability to organize and communicate written responses that demonstrated anunderstanding of relationships among people, objects, and events.
Students generated writing samples on a topic of their choice. Possible storystarters or topics were suggested as follows: (a) the tricky cat; (b) unwelcome visitor;(c) golden dragon; (d) most embarrassing moment; (e) an event I'll never forget; (f) mymost frightening experience; and (g) one of the funniest (saddest, strangest, etc.) things I'veever seen. Several prewriting activities were suggested as warm-ups.
The abilities that were of interest included expressions of feelings, judgments andcausality, comprehension of complex situations, and uncommon descriptions of behaviors,attributes, and actions. Mechanics and grammar were not evaluated. Specific writingelements measured by CLUES are fluency of writing, language usage, story structure,novelty, and personal interpretations. A copy of CLUES is provided in Appendix F.
Points are given based on whether or not an element is present in the writing sample.Additional points are given if the writing sample contains any of five optional features:novelty of idea, novelty of theme, novelty of form, facility in beautiful writing, and vividpresentation of personal experience. Inter-rater reliability, at a level of .90, was establishedfor the evaluators of the writing samples.
Developing Cognitive Abilities Test (DCAT)The DCAT (Wick, Boggs, & Mouw, 1989) assesses learning characteristics and
abilities that are believed to contribute to academic performance. There are eight levels ofthis test, designed for use with grades 1 through 12. Each level uses a multiple choiceformat and 81 items are evenly divided among three content areas: (a) Verbal Ability, (b)Quantitative Ability, and (c) Spatial Ability. Bloom's Taxonomy provides the conceptualframework for test items. Within each content area, the first nine items assess basiccognitive abilities, the second set of nine items assesses application abilities, and the lastnine items assess critical thinking. Scores are reported for five of the thinking skill areas inthe Bloom's Taxonomy: (a) knowledge, (b) comprehension, (c) application, (d) analysis,and (e) synthesis.
Scores for the three content areas are reported as national percentiles, normal curveequivalents, stanines, equal interval scores, and cognitive ability indicators. The scores onthe Bloom's Taxonomy are reported according to the average percent of questions (on eachof the three subscales) the student gets correct. The report also compares the averagepercent correct with the national average percent correct for the respective grade level(average percent correct difference).
The DCAT was developed in 1988 using a stratified, multi-stage national probabilitysample of kindergarten to twelfth grade students in public and parochial schools.Depending on grade, reliability (KR-20) for the total DCAT ranges between .88 and .96(Aylward, 1992). The figures for the individual content and thinking skills areas are lower,but still within an acceptable range. Subscale scores of the DCAT were correlated with thereading, language, mathematics, social studies, and science scores on the NationalAchievement Test (Wick et al.; 1990). The correlation coefficients ranged from .70 to .85(Wick, Boggs, & Mouw, 1989).

13
"I Feel . . . Me Feel" Self-Concept InstrumentThe "I Feel . . . Me Feel" (Yeatts & Morrison, 1988) self-concept measure is a 40
item self-report instrument designed to assess young children's underlying structure of self-feeling. It is appropriate for use with children in grades K through 4. Each item is read outloud by the test administrator (usually the classroom teacher). The children respond bycoloring in the face (sad, not sad-not happy, or happy) that best shows how they feel aboutthe item. A factor analysis = 25,322) identified five factors: (a) Academic, (b) Self, (c)Frustration, (d) Fun, and (e) Independence. The recommended scoring procedure is to sumthe numeric value of the responses to the items associated with each factor.
The split-half method of determining internal test consistency resulted in acorrelation coefficient of .86 across all grades (Yeatts & Morrison, 1988). Test-retestreliability coefficients were calculated for each grade and ranged from .78 to .84. Constructvalidity was explored by correlating the total scores on the "I Feel . . . Me Feel" with scoreson the Metropolitan Readiness Test (for kindergartners) and on the California AchievementTest (for first through fourth graders). The correlation coefficients ranged from a low of.68 for kindergartners to a high of .81 for fourth graders.
Iowa Tests of Basic Skills (ITBS)The ITBS (Lane & Raju, 1992) is a traditional group measure of achievement used
with children in grades K through 9. It uses a multiple-choice format and assesses growthin seven general cognitive skill areas. The subscales used in this study were MathematicsConcepts, Mathematics Problems, and Reading. Internal-consistency reliability coefficientsare above .85. The equivalent form reliability coefficients for the scales used in this studyrange from .70 to .90.
Kuhlmann Anderson TestsThe Kuhlmann Anderson Tests (Kuhlmann & Anderson, 1982) provide an
assessment of academic potential by measuring cognitive skills related to the learningprocess. There are seven levels of the test for use with grades K through 12. Each level hastwo subtests, Verbal and Nonverbal. The Kuhlmann Anderson Tests were given only tokindergarten children in this study. Form K, for kindergartners, has 80 multiple-choiceitems. The raw score, basic growth measure standard score, cognitive skills quotientestimates (CSQ), national percentile (using age and grade-related norms), and nationalstanines (using age and grade-related norms) are reported for the full test. The raw scoreand CSQ score are reported for the verbal and nonverbal subtests. Full test and subtestinternal consistency for form K, determined by using the Kuder-Richardson Formula 10,are .91 (full test and CSQ score), .81 (verbal subtest, CSQ score), and .88 (nonverbal, CSQscore).
National Achievement Test (NAT)The NAT (Wick et al., 1990) is a group measure of achievement in areas commonly
found in school curricula. There are 12 test levels for use with grades K-12. Composed of184 to 419 multiple-choice items, different levels of the NAT use various combinations ofthe following subscales: Reading (vocabulary, comprehension, and total), Language(spelling mechanics, expression, and total), Mathematics (computation, concepts/problemsolving, and total), Word Attack, Social Studies, Science, Reference Skills, Basis BatteryTotal. The subscales used in this study were Reading Comprehension, LanguageExpression, and Mathematics Concepts/Problem Solving. Percentile rank, gradeequivalents, equal interval scores, stanines, and normal curve equivalents are reported foreach subscale and the Basic Battery Total.
The correlation coefficients between the subtests and the total score range from alow of .45 to .75 for grades K through 1 to a high of .55 to .95 for grades 5 through 7. The
38

14
internal-consistency reliability (KR-20) ranges from the high .80's to low .90's for allsubject areas and test levels.
Scales for Rating Behavioral Characteristics of Superior Students (SRBCSS)The SRBCSS (Renzulli, Smith, White, Callahan, & Hartman, 1976) was developed to
facilitate teachers' observations of the frequency in which students demonstrated typicalbehaviors associated with gifted individuals. Ten separate scales make up the completeSRBCSS, four of which were used in this study: (a) Learning, (b) Motivation, (c) Creativity,and (d) Leadership. Each scale consists of 8 to 10 items to which the teacher makes one offour possible responses: (a) seldom or never, (b) occasionally, (c) considerably, or (d)almost always. The numeric value (1 to 4) of the responses are summed for the items in thescale to obtain a total score for each scale.
Reliability coefficients were determined by having two sets of teachers rate the samefifth-and sixth-grade students after a 3-month interval. Statistically significant correlationcoefficients ranged from .77 on the Leadership Scale to .91 on the Motivation Scale.Interjudge reliability coefficients ranged from a low of .67 on the Leadership Scale to a highof .91 on the Creativity Scale (Renzulli et al., 1976).
Renzulli, et al. (1976) also examined the validity of the four scales by comparingthem with relevant standardized measures. The validity of the Learning and the Motivationscales was determined by comparing ratings on these scales with scores on standardizedintelligence and achievement tests. A significant correlation of .61 was found for theLearning scale; a significant correlation of .36 was found for the Motivation scale. Thevalidity of the Leadership Scale was determined by correlating teachers' ratings withsociometric peer ratings. The correlation coefficients were significant and high between thescale and peer rating for fourth and fifth grade students (ranging from .75 to .84) butconsiderably lower for sixth graders (.23 to .35).
School Attitude Measure (SAM)Developed by Dolan and Enos (1980), the SAM assesses students' attitudes toward
school, their view of their academic environment, and their view of themselves as competentstudents. There are five subscales: (a) Motivation for Schooling, (h) Academic Self-ConceptReferenced Based, (c) Academic Self-ConceptPerformance Based, (d)Student's Sense of Control over Performance, and (e) Students' Instructional Mastery. TheMotivation for Schooling score indicates the students' attitude about school work andenvironment. The two Academic Self-Concept scores indicate the students' feelings abouttheir ability. The Performance Based scale indicates how they personally feel about theirability and the Reference Based scale indicates what they think others (teachers, family, andpeers) feel about their ability. The Control Over Performance scale indicates where thestudents place responsibility for their success or failure. Instructional Mastery indicateshow the students feel about their ability to understand and master the concepts taught inschool. The total score is an average of the above scales.
There are five forms of the SAM for use with grades 1 through 12. The number ofitems ranges from 40 (grades 1 and 2) to 100 (grades 9 through 12). The response choicesfor students in the first and second grade are "Yes" and "No." On the other four forms, thechoices are "never agree," "sometimes agree," "usually agree," and "always agree." Scoresare computed for each subscale by adding up the numeric value (1 to 4) for responses foreach item. A total score is obtained by summing the subscale scores. Percentile scores andequal interval scale units are reported for each subscale and the total.
The standardization sample for the SAM consisted of 90,000 kindergarten to twelfthgrade students, stratified according to geographic region, school district size, and

15
socioeconomic status. No ethnic, gender, socioeconomic, cultural, or regional biases werefound. Internal consistency (KR-20) coefficients were determined for each subtest bygrade. The correlations ranged from .68 to .80 (Dolan & Enos, 1980).
Torrance Tests of Creative Thinking (TTCT), Figural, Form BThe TTCT (Torrance & Ball, 1984) assesses general creative thinking abilities. The
five norm-referenced dimensions measured by the TTCT are: (a) Fluency, (b) Originality,(c) Abstractness of Titles, (d) Elaboration, and (e) Resistance to Premature Closure. TheFluency score represents the ability to respond to a variety of stimuli in various ways andthe Originality score represents an individual's ability to break away from commonplaceideas and respond in new and original ways. Higher level thinking skills and the use ofsymbolic meanings are represented by the Abstractness of Title score. The Elaborationscore estimates an individual's ability to add details beyond a minimum response and theResistance to Premature Closure score represents an individual's ability to keep an openmind long enough to make a mental leap to new ideas.
Thirteen criterion-referenced creative strengths are also measured by the TTCT:(a) emotional expressiveness, (b) storytelling articulateness, (c) movement or action,(d) expressiveness of titles, (e) synthesis of incomplete figures, (f) synthesis of lines orcircles, (g) unusual visualization, (h) internal visualization, (i) extending or breakingboundaries, (j) humor, (k) richness of imagery, (1) colorfulness of imagery, and (m) fantasy.
A creativity index score is derived by adding scores from the criterion referencedcreative strengths to the scores on the five norm-referenced dimensions of creativity. Rawscores, national percentile ranks, local percentile ranks, and standard scores are provided forthe five norm-referenced scores. The degree of presence of a creative strength is indicatedby one or two "+" signs next to that strength.
Reliability scoring studies of the TTCT have indicated that it is possible to keep thescoring reliability of the five norm-referenced dimensions and the 13 criterion referenceddimensions above the .90 level. Predictive validity studies of the measures of the Fluency,Originality, and Elaboration scores yielded significant validity coefficients of .51 for thetotal sample, .50 for males, and .43 for females. Predictive validity studies yieldedsignificant validity coefficients for the following creative strengths: emotionalexpressiveness (.55), storytelling articulateness (.49), movement or action (.49), synthesis ofcircles (.22), unusual visualization (.44), internal visualization (.60), extending or breakingboundaries (.59), humor richness/colorfulness of imagery (.71), and fantasy (.45).
Implementation Steps
The Staff Development Model (SDM)
The presentation of the SDM by The University of Georgia researchers wasscheduled at each of the schools in the participating systems during the months of Januaryand February 1992. Hereafter, The University of Georgia researchers will be referred to asthe researchers. Site coordinators were given the option of deciding who would participatein the training. Some chose to involve the entire instructional staff; others chose to use aleadership team who would, in turn, train the rest of the instructional staff at their school.
Step 1: Administer the Why Do We Identify So Few Gifted Children FromEconomically Disadvantaged (ED) and Limited English Proficient (LEP)Backgrounds? This survey assessed current attitudes and beliefs regardingthe harriers to identification.
40

16
Step 2: Present information on the concept of giftedness as a psychologicalconstruct and the TABs associated with this construct. Exemplary vignettesof target population students were included to provide the participants withexamples of the TABs exhibited by different children. Participants wereencouraged to contribute vignettes of their own.
Step 3: Explain the observation strategies. The Panning for Gold observation andreferral forms were introduced. Every effort was made to assure theparticipants that they were in charge of referring students.
Step 4: Present an overview of the RAP. The entire assessment process wasexplained to the participants. This included information on the instrumentsto be used, how the information gathered would be recorded and interpreted,and how the information would be used to make program and curriculumdecisions.
Step 5: Complete the Session "Feedforward" Form. The primary purpose for thisform was to gather information from the participants regarding theirunderstanding of the SDM and the RAP and their commitment toparticipate. General information on the quality of the presentation was alsogathered.
The Research-Based Assessment Plan (RAP)
The following steps describe the process of data gathering, data evaluation, selectionof students, and educational program planning. These tasks were completed by researchersfrom The University of Georgia and a representative committee of participants at each of thesites.
Step 1: Review referrals to select students for further assessment. A Panning forGold Student Referral Form was completed for each referred student.
Step 2: Administer assessment measures. The University of Georgia researchersadministered the TTCT because there were few or no trained persons at theparticipating sites. In addition researchers provided testing assistance atsites as needed or requested. Local site personnel collected achievementtest data, administered the SRBCSS and the CLUES, collected the referralinformation from teachers, and scheduled students for assessment.
Step 3 Score assessment measures and plot information on the F-TAP.Researchers scored all instruments and plotted the results on the F-TAP.Any unusual observations about a student's profile was noted to facilitatedecision-making at the school sites.
Step 4: Conduct selection meetings at each site. Researchers met with and servedas discussion facilitators with the committees who made the placement andprogram decisions at each of the sites. Because of the extendedassessment period necessitated by the large number of students referredand other conflicts with school events, these meetings were delayed andwere not completed until the fall of 1992, not May 1992 as anticipated.Nine review and selection meetings were held in July and August 1992,and 7 were held in September 1992.

17
Interim Activities
While the SDM was being presented, decisions about the assessment measures thatwould be used were ordered or copied. Assessment information was gathered in six basicareas: (a) aptitude, (b) achievement, (c) creativity, (d) structured observations, (e) languageusage, and (f) motivation to achieve. The measures reflected a balance of student generatedinformation, test generated information, and information derived from others. The measureswere also matched to one or more of the TABs.
Consent forms were prepared to acquire permission to test from parents of referredstudents. In addition two information sheets, one for teachers and one for parents, weredeveloped to provide them with responses they might make to any questions raised aboutthe project Copies of these information forms are provided in Appendix G.
Policy Considerations
Several policies were considered in the conduct of this study. The first related toachieving a waiver for the participation of students who would not normally be eligible forgifted program services in Georgia. This was not an issue for the North Carolina site sincethey operated as a private entity. The second related to the status of identified students inthe gifted program. The third policy related to the provision of additional staff as neededand reimbursements to be received by school districts that were being asked toaccommodate an increased number of students in their gifted programs.
The principal investigator negotiated an agreement with the Georgia StateDepartment Of Education (GSDOE) whereby the selected students would be consideredbona fide participants in the state's gifted programs and schools would receive the fundingfor the students that was received for students identified using traditional identificationcriteria. Further, the GSDOE made a commitment to consider findings from this study inefforts to expand the current test-only criteria to allow the use of multiple criteria to identifychildren for gifted program participation.
Results
Results for Research Question 1
Research question 1 asked: Does the SDM provide an effective process to trainteachers to better observe and refer target population students? Two sets of evidence wereused to address the effectiveness of the SDM: (a) perceptions of the training providedthrough the SDM and its effectiveness in assisting teachers to make better referrals of targetstudents, and (h) the number of target students referred as a result of applying strategies inthe SDM who would normally not have been referred.
Perceptions of Training Using the Staff Development Model (SDM)
A total of 246 school instructional staff members completed the "Feedforward"instrument. The first part of this instrument, questions 1 to 6, was concerned withinformation about the mechanics of the staff development presentation. The majority of theresponses were positive with at least four-fifths of the participants agreeing or stronglyagreeing that the objectives were clearly stated; the terms used were clearly defined; thepresenters were effective; the handouts and overheads were useful; and the overall directionsfor using the material were adequate (see Appendix H). On-going adjustments were made
42

18
in the presentation based on evaluations received about the presenters, the material andmedia used, the structure of the inservice, and the overall content.
Responses to questions 7 through 10 indicate the level of understanding the school'sinstructional staff was able to achieve about giftedness in target student populations and theintensity of their commitment to participate in this exploratory study. A summary ofresponses to questions 7 through 10 is provided in Table 2. More than four-fifths of therespondents strongly agreed or agreed that the SDM presentation was highly orsubstantially stimulating; the content of the SDM was extremely or substantially relevant totheir job situation, and the information provided was extremely or substantially useful. Ofthe participants, 99% agreed to participate in implementing the plan when they indicated thatthey would actively advocate for potentially gifted students from economicallydisadvantaged backgrounds. Of the 99%, 79% said they would definitely implement theplan; 20% said they would try.
In questions 11 and 12, participants were asked to evaluate strong points of thepresentation and to indicate areas where improvements were needed. Narrative responses(N=573) were analyzed in the two categories that emerged: (a) Presentation (454comments), and (b) Acquisition of Knowledge (119 comments). The majority of thecomments (78%) were positive. That is, 446 of the 573 comments described strong pointsof the staff development presentation. Only 27% or 127 of the comments referred to areaswhere improvements were needed.
Three themes emerged within the category of Acquisition of Knowledge from ananalysis of responses to questions 11 and 12: (a) Knowledge Learned (88), (b) LocalRelevance (16), and (c) Teacher Involvement (15). A majority of the comments in theKnowledge Learned category were positive and indicated that the participants (a) hadlearned a new way of identifying gifted children, (b) were more aware of the reasons whygifted children get overlooked, (c) understood how gifted children are currently chosen forprogram participation, (d) understood the need for a broadened view of the abilities of allstudents, and (e) understood the purpose of and role they would play in the study.
Examples of responses leading to these conclusions were:
"We have to look at all the student qualities, not just test scores" (06-02-60)3."Teachers' perceptions of ability need to be challenged, rechanneled, and expanded"(02-00-23)."Giftedness comes in many forms" (06-01-26).
Sixteen comments made were related to local relevance. Examples of thesecomments were:
"Very appropriate for our population" (06-02-08)."This presentation was relevant to my job".(02-00-35)."It addresses a need previously unaddressed" (04-01-08).
3 The number in parentheses refers to the code number assigned to subjects who completed the Feedforwardform.
43

19
Table 2
Session "Feedforward" Instrument: Subject Responses to Questions 7 to 10
Item n Percentage
7. How stimulating did you find this session?
Highly stimulating 83 34Substantially stimulating 118 49Somewhat stimulating 35 14Slightly stimulating (or less) 7 3
8. How relevant to your job situation did you find thecontents of this session?
Extremely relevant 116 48Substantially relevant 87 36Somewhat relevant 31 13Slightly relevant (or less) 6 3
9. How useful (practical) for you was the informationgained in this session?
Extremely useful 100 42Substantially useful 102 43Somewhat useful 30 13Slightly useful (or less) 5 2
10. How well motivated are you to try to advocate for apotentially gifted student from an economicallydisadvantaged background?
I am definitely going to implement this plan. 184 79I am considering implementing, may try. 46 20I am considering implementing, have doubts. 3 2I am skeptical. I may. I may not. 0 0
The 12 comments made regarding teacher involvement reflected their appreciationfor being actively included in the process of identification of gifted students. Examples ofthe comments were as follows:
"Our opinions matter" (02-00-12)."It recognizes the fact that teachers are good at observing unique, special traits inkids" (06-01-68)."It may help us to discover and serve a child whose life may be significantlychanged because of this discovery of his potential" (04-02-13).
44
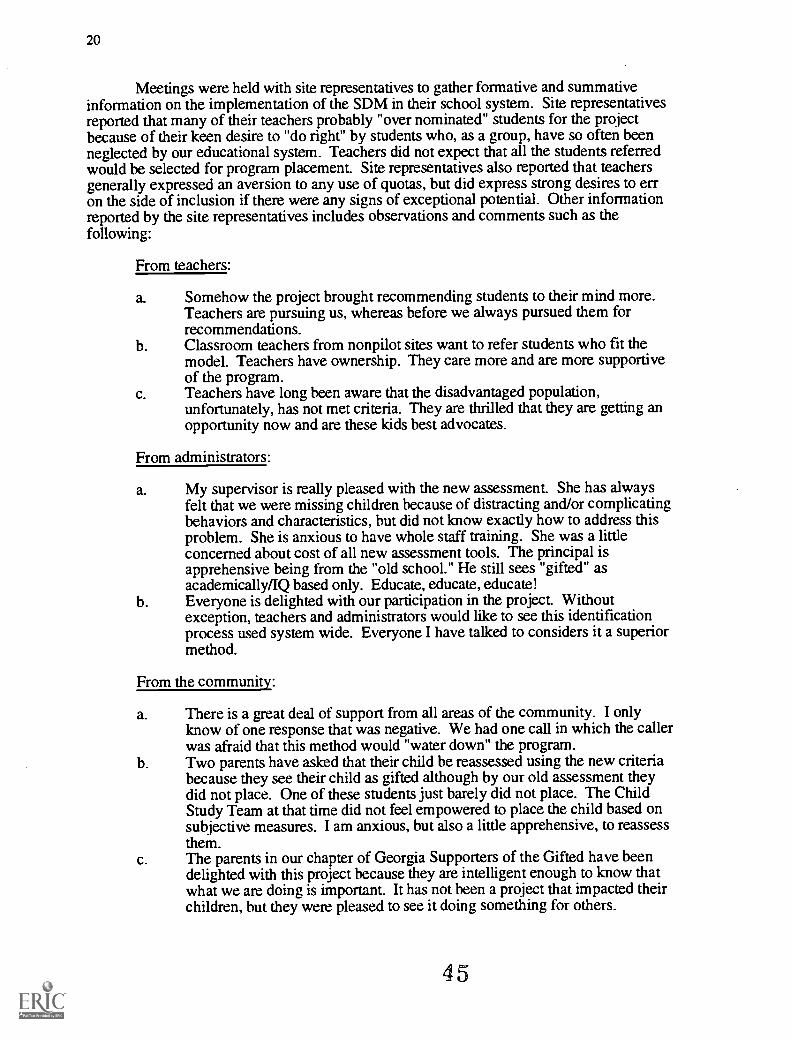
20
Meetings were held with site representatives to gather formative and summativeinformation on the implementation of the SDM in their school system. Site representativesreported that many of their teachers probably "over nominated" students for the projectbecause of their keen desire to "do right" by students who, as a group, have so often beenneglected by our educational system. Teachers did not expect that all the students referredwould be selected for program placement. Site representatives also reported that teachersgenerally expressed an aversion to any use of quotas, but did express strong desires to erron the side of inclusion if there were any signs of exceptional potential. Other informationreported by the site representatives includes observations and comments such as thefollowing:
From teachers:
a. Somehow the project brought recommending students to their mind more.Teachers are pursuing us, whereas before we always pursued them forrecommendations.
b. Classroom teachers from nonpilot sites want to refer students who fit themodel. Teachers have ownership. They care more and are more supportiveof the program.
c. Teachers have long been aware that the disadvantaged population,unfortunately, has not met criteria. They are thrilled that they are getting anopportunity now and are these kids best advocates.
From administrators:
a. My supervisor is really pleased with the new assessment. She has alwaysfelt that we were missing children because of distracting and/or complicatingbehaviors and characteristics, but did not know exactly how to address thisproblem. She is anxious to have whole staff training. She was a littleconcerned about cost of all new assessment tools. The principal isapprehensive being from the "old school." He still sees "gifted" asacademically/IQ based only. Educate, educate, educate!
b. Everyone is delighted with our participation in the project. Withoutexception, teachers and administrators would like to see this identificationprocess used system wide. Everyone I have talked to considers it a superiormethod.
From the community:
a. There is a great deal of support from all areas of the community. I onlyknow of one response that was negative. We had one call in which the callerwas afraid that this method would "water down" the program.Two parents have asked that their child be reassessed using the new criteriabecause they see their child as gifted although by our old assessment theydid not place. One of these students just barely did not place. The ChildStudy Team at that time did not feel empowered to place the child based onsubjective measures. I am anxious, but also a little apprehensive, to reassessthem.
c. The parents in our chapter of Georgia Supporters of the Gifted have beendelighted with this project because they are intelligent enough to know thatwhat we are doing is important. It has not been a project that impacted theirchildren, but they were pleased to see it doing something for others.
45

21
From students (as reported by teachers):
a. My students in grades 4-6 are aware of the assessment project and havequestioned what we are doing and why. They are very much in favor of this.I have used the areas on the Panning for Gold sheet to talk to my studentsabout the individuality and uniqueness of them and their peers whether in ornot in our program. I see an increased awareness in them of each other andof themselves. I think they were able to see the range of giftedness mucheasier than adults! One of my sixth graders has now referred a student inhis class that he feels we should consider even if (his) teacher doesn't seethat she is gifted.
b. Students have referred themselves.
There were concerns raised about reverse discrimination and the effects thatidentified target populations students would have on the quality of programs offered.Comments such as the following were reported:
What services will be available for these students once they have been identified?How will program services differ to meet their diverse needs?Won't this water-down the gifted program?
Number of Students Referred
It was anticipated that approximately 10 to 15 students per site would be referred.However approximately 4 times as many or 341 target population students wererecommended for assessment. It was discovered, however, that 14 of these studentsqualified for gifted program participation according to the traditional criteria used in thestate of Georgia. Thus, 327 students were finally referred for assessment (see Table 3). Ofthese 327 referred students, 60% percent were African Americans; 9%, Native Americans;16%, White; and 16%, "Others." The majority of the students referred were elementary(74%). Almost half the referred students were male (47%); a little more than half werefemale (53%).
Results for Research Question 2
Research question 2 asked: Does the RAP provide an effective process to facilitatethe use of multiple criteria in making better professional decisions about the identificationand education of target population students? Evidence to address this question was derivedfrom formative and summative feedback on the implementation of the RAP and theperformance differences between selected and nonselected students.
A total of 121 students were selected from the 327 students referred for assessment.Of the selected, 55% students were African Americans; 4%, Native Americans; 22%, White;and 18%, "Other" (see Table 4). Again, the majority of the students selected wereelementary (82%). More female students (59%) than males (41%) were selected.
Students were grouped by program placement status which has two levels: selectedand nonselected. Selected means that students were favorably recommended for giftedprogram participation. Nonselected means that students were not recommended forprogram participation. In this study, comparisons of performances on standardizedmeasures were only made between selected and nonselected students using an analysis ofvariance.

22
Table 3
Distribution of Students Referred for Testing by Ethnicity, Grade, and Gender (N = 327)
African-American
Native-American
White Other Total
Elementary 152 11 42 29 234 (74)K 18 1 3 9 31First 24 0 7 5 36Second 25 0 16 1 42Third 40 6 7 6 59Fourth 25 3 6 7 41Fifth 20 1 3 1 25
Secondary 44 17 9 23 93 (26)Sixth 24 0 3 9 36Seventh 10 8 6 8 32Eighth 10 4 0 6 20Ninth 0 1 0 0 1
Tenth 0 4 0 0 4Male 94 16 25 19 154 (47)Female 102 12 26 33 173 (53)Total 196 (60) 28 (9) 51 (16) 52 (16) 327
Note. Numbers in parentheses represent the percentage of students in the categories.
Table 4
Distribution of Students Selected for Placement in Gifted Program by Ethnicity, Grade, andGender (N = 121)
African-American
Native-American
White Other Total
Elementary 55 2 25 17 99 (82)K 6 0 1 4 11First 10 0 6 2 18Second 10 0 10 1 21Third 6 0 3 5 14Fourth 14 1 2 5 22Fifth 9 1 3 0 13
Secondary 12 3 2 5 22 (18)Sixth 7 0 0 1 8Seventh 3 1 2 2 8
Eighth 2 0 0 2 4Ninth 0 0 0 0 0Tenth 0 2 0 0 2
Male 28 1 12 8 49 (41)Female 39 4 15 14 72 (59)Total 67 (55) 5 (4) 27 (22) 22 (18) 121
Note. Numbers in parentheses represent the percentage of students in the categories.

23
Developing Cognitive Ability Test (DCAT) Performance
Significant mean differences were found for program placement status. That is,selected students scored significantly higher than nonselected students on each subtestscore at the .003 level (Familywise Type I error rate = .05/11) and on the total score of theDCAT at the .001 level (see Table 5).
Bloom's Taxonomy Findings
Significant differences were found between selected and nonselected students for allthe Bloom's Taxonomy levels except the Knowledge level, at the .01 level (Familywise TypeI error rate = .05/5). That is, students who were selected for placement scored significantlyhigher than those who were not selected, on all the Bloom's Taxonomy levels except theKnowledge level (see Table 6).
School Attitude Measure (SAM) Performance
No significant differences were found for program placement status on any of thefive SAM subtests (Motivation for Schooling, Academic Self-Concept/Performance Based,Academic Self-Concept/Reference Based, Control Over Performance, and InstructionalMastery). There was also no significant difference found for program placement status onthe total score.
Table 5
Analysis of Variance for the Subtests and the Total Score of the Developing CognitiveAbilities Test by Program Placement Status
Mean SD Fa
Verbal 10.863 .0011*
Nonselectedb 54.60 17.97
Selected' 70.40 20.41
Quantitative 27.969 .0000*Nonselectedb 53.30 17.12
Selectee 71.16 16.51
Spatial 11.253 .0009*Nonselectedb 47.68 18.86
Selectee 64.14 21.18Total 42.165 .0000**
Nonselectedb 49.73 14.31
Selectee 68.97 13.55
Note. a df = 1, 260. b n = 180. e n = 110.*2 < .003 (Familywise Type I error rate = .05/11).**2<.001.
48

24
Table 6
Analysis of Variance for the Bloom's Taxonomy Scores of the Developing CognitiveAbilities Test by Program Placement Status
Mean SD F 2
Knowledge 6.722a .0101*Nonselectedb 78.52 18.53Selected' 85.79 14.19
Comprehension 7.623a .0062*Nonselectedb 68.51 17.99Selectee 80.56 13.30
Application 30.095a .0000*Nonselectedb 61.72 15.86Selectee 76.35 12.07
Analysis 22.431a .0000*Nonselectedb 48.18 18.43Selectee 67.26 18.97
Synthesis 29.430d .0000*Nonselectede 43.86 16.77
Selectedf 61.23 16.44
Note. a df = 1, 260. b n = 180. c n = 110. d df = 1, 256. e n = 177. f n = 109.*p < .01 (Familywise Type I error rate = .05/5).
Torrance Tests of Creative Thinking (TTCT), Figural, Form B Performance
A significant difference was found between selected and nonselected student onlyfor the Abstractness of Titles score at the .01 level (Familywise Type I error rate = .05/5).That is, those students who were selected for placement in gifted programs scoredsignificantly higher than those who were not selected on Abstractness of Titles (see Table7).
Scales for Rating Behavioral Characteristics of Superior Students (SRBCSS)Performance
A significant differences was found between selected and nonselected students onthe SRBCSS Learning subtest at the .0125 level (Familywise Type I error rate = .05/4). Thatis, selected students were observed by their teachers to demonstrate learning characteristicsof gifted individuals at a significantly higher level than nonselected students (see Table 8).

25
Table 7
Analysis of Variance for the Abstractness of Titles Score of the Torrance Tests of CreativeThinking by Program Placement Status
Mean SD Fa
Nonselected 168 95.92 32.25 6.962 .0089*Selected 81 105.47 29.38
Note. a df = 1, 221.*2 < .01 (Familywise Type I error rate = .05/5).
Table 8
Analysis of Variance on the Subscales of the Scales for Rating Behavioral Characteristicsby Program Placement Status
Mean SD Fa
Learning 10.64 .0012*Nonselectedb 72.20 15.20
Selectee 80.80 13.40Motivation 5.16 .0238
Nonselectedb 69.90 14.20
Selectee 74.50 12.60Creativity 5.51 .0195
Nonselectedb 67.20 15.60
Selectee 71.70 15.70Leadership 4.93 .0272
Nonselectedb 77.50 15.00
Selected' 83.50 13.70
Note. a df = 1,293. b n = 190. c n = 119.*2 < .0125 (Familywise Type I errjr rate = .05/4).
50
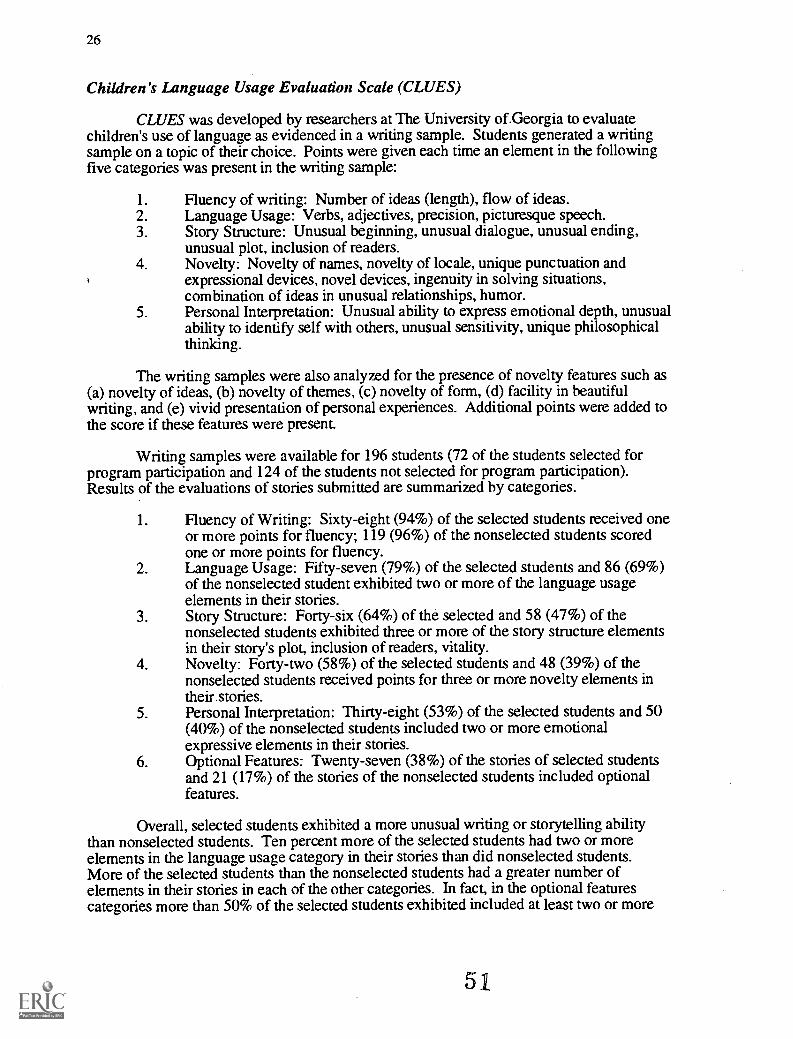
26
Children's Language Usage Evaluation Scale (CLUES)
CLUES was developed by researchers at The University of.Georgia to evaluatechildren's use of language as evidenced in a writing sample. Students generated a writingsample on a topic of their choice. Points were given each time an element in the followingfive categories was present in the writing sample:
1. Fluency of writing: Number of ideas (length), flow of ideas.2. Language Usage: Verbs, adjectives, precision, picturesque speech.3. Story Structure: Unusual beginning, unusual dialogue, unusual ending,
unusual plot, inclusion of readers.4. Novelty: Novelty of names, novelty of locale, unique punctuation and
expressional devices, novel devices, ingenuity in solving situations,combination of ideas in unusual relationships, humor.
5. Personal Interpretation: Unusual ability to express emotional depth, unusualability to identify self with others, unusual sensitivity, unique philosophicalthinking.
The writing samples were also analyzed for the presence of novelty features such as(a) novelty of ideas, (b) novelty of themes, (c) novelty of form, (d) facility in beautifulwriting, and (e) vivid presentation of personal experiences. Additional points were added tothe score if these features were present.
Writing samples were available for 196 students (72 of the students selected forprogram participation and 124 of the students not selected for program participation).Results of the evaluations of stories submitted are summarized by categories.
1. Fluency of Writing: Sixty-eight (94%) of the selected students received oneor more points for fluency; 119 (96%) of the nonselected students scoredone or more points for fluency.
2. Language Usage: Fifty-seven (79%) of the selected students and 86 (69%)of the nonselected student exhibited two or more of the language usageelements in their stories.
3. Story Structure: Forty-six (64%) of the selected and 58 (47%) of thenonselected students exhibited three or more of the story structure elementsin their story's plot, inclusion of readers, vitality.
4. Novelty: Forty-two (58%) of the selected students and 48 (39%) of thenonselected students received points for three or more novelty elements intheir. stories.
5. Personal Interpretation: Thirty-eight (53%) of the selected students and 50(40%) of the nonselected students included two or more emotionalexpressive elements in their stories.
6. Optional Features: Twenty-seven (38%) of the stories of selected studentsand 21 (17%) of the stories of the nonselected students included optionalfeatures.
Overall, selected students exhibited a more unusual writing or storytelling abilitythan nonselected students. Ten percent more of the selected students had two or moreelements in the language usage category in their stories than did nonselected students.More of the selected students than the nonselected students had a greater number ofelements in their stories in each of the other categories. In fact, in the optional featurescategories more than 50% of the selected students exhibited included at least two or more

27
optional elements in their stories than did nonselected students. The only category in whichnonselected students exceeded the performance of selected students was in fluency.4
Discussion
Summary
The purpose of this study was to explore the potential of the SDM and the RAP aseffective procedures to improve the identification and education of gifted students fromeconomically disadvantaged families and areas, some of whom may have limited proficiencyin the English language. The target group for this study was children who were eligible forfree or reduced lunch, regardless of ethnic or cultural group membership.
Information to determine the effectiveness of these models was derived fromfeedback provided by the instructional staff at the schools that participated in the study,from the representatives who coordinated activities at the school sites, and from comparingthe performance of selected vs. nonselected students. The school sites were located inGeorgia and North Carolina. Because of the location of the research sites, students involvedin the study were primarily African-American, Native American, and White. Children whowere not members of one of these groups were classified as "Other."
Two research questions were posed: (a) Does the Staff Development Model(SDM) provide an effective process to train teachers to better observe and refer targetpopulation students for gifted program participation? and (b) Does the Research-BasedAssessment Plan (RAP) provide an effective process to facilitate the use of multipleselection criteria in making better professional decisions about the identification andeducation of gifted target population students? The first question was designed to explorewhether teachers who are trained, using the SDM process, can confidently refer studentsfrom the target population for gifted program participation who normally would not havebeen referred. The second question was designed to explore whether the RAP effectivelyfacilitates teachers' ability to confidently use multiple criteria (or data from objective andsubjective sources) to make recommendations for placement of target population students ingifted programs.
Overall, participants in this study appeared to have confidence in their ability to referstudents from the target population who normally would not have been referred for giftedprogram placement as indicated by the high number of students referred (341) and thepositive reactions to the training received using the SDM. Participants also appeared toshow confidence in their ability to use multiple criteria or data from multiple sources tomake professional recommendations for gifted program placement using the RAP.Participants appeared to feel empowered to take an active role in advocating for targetpopulation students. For example, their comments reflected overall gratification with havingtheir observations and recommendations valued and with having a procedure that allowedthem to use other information besides a test score to make program placement decisions.
Implications
Finding an effective way to identify gifted target population students is not easy.Numerous issues intertwine to defy simple solutions to this complex problem that haschallenged educators for over 30 years. The purpose of this study was to explore the
4 Contact the first author for complete information on evaluating writing samples using the CLUES.
52

28
potential of a staff development model and an assessment model to comprehensivelyaddress all of the issues that affect the resolution of the seemingly intractable problems inrecognizing the gifted potential of students from economically disadvantaged backgroundsincluding those of limited English proficiency. The issues include (a) adequate preparationof teachers to observe the abilities of target students from a proficiency perspective, and (b)facilitation of the collection and use of information derived from multiple sources, objectiveand subjective, when making professional decisions for placement and services. Theseissues cannot be addressed without considering barriers created by traditional ways ofdefining giftedness; current rules and regulations governing the participation of students ingifted programs; negative perceptions about students from economically disadvantagedbackgrounds; the lack of confidence in the ability of low income families to nurture theintellectual development of their children; and identification procedures that rely onstandardized tests.
Each of these issues was considered in this exploratory study. This action-orientedstudy took place in six diverse school settings where a number of challenges had to beconsidered, e.g., scheduling problems, competition with other school-based initiatives,transient students and their families, different administrative styles. Implications from thisstudy are presented in this section and relate to (a) definition, (b) educator roles, (c)decision-making, and (d) program and curricular adaptation.
The Concept of Giftedness as a Psychological Construct
A basic implication of this study is that considering giftedness as a constructdefined by a set of core attributes provides a feasible way to introduce the TABs associatedwith giftedness to a school's instructional staff. Given the logic of viewing gifted ability asmultidimensional, the TABs appeared to provide a promising way to introduce school staffto the discovery of potential in children, regardless of economic status, cultural/ethnic groupmembership, and language proficiency. The participants in this study were quick torecognize the validity of the TABs as markers of gifted potential when they were presentedin the form of vignettes that were closely connected to traditional classroom activities. Thisunderstanding was evident in the rapidity with which participants could generate their ownvignettes with great confidence in the validity of their observations.
The Role of the Classroom Teachers and Other School Staff
A finding of this exploratory study was the affirmation of the importance of the fullinvolvement of teachers and other school staff in the process of identifying gifted targetpopulation students. Since target population students have rarely been selected for giftedprogram participation, regular educators were the most logical persons to know them best.These educators need to be empowered to he involved in the entire process of referral,identification, and programming. This is the only way that they can become effectiveadvocates for gifted target population students, a task to which they are fully capable givenappropriate training. Feedback from the participants attests to the value of having teachersinvolved in the entire observation and identification process. The enthusiasm demonstratedby many of the participants provides some evidence of their potential to become moreeffective at recognizing gifted potential in target population students, given appropriatetraining.
The Relation Between Professional Decision Making and the Use ofMultiple Criteria
A key objective of the RAP was to replace the emphasis on tests as the primaryidentifier of gifted potential with an emphasis on effectively using relevant information

29
collected from multiple sources. A willingness to value information from subjective as wellas objective sources was critical. It was important that participants saw a need for bothtypes of information to develop a comprehensive picture of students' ability, and that theydid not feel that either type of information was a substitute for the other.
In addition, an important component of the RAP was the use of a group-orienteddecision making process for placement that depended on studying and interpreting theinformation derived from the multiple measures used in constructing the profile. Thedecision for placement was not based on any one measure; rather the decision was based onthe interaction of and the complementary nature of information derived from severalsources. The process used was consistent with the basic tenets of expert decision-makingtheory wherein the interrelationships of information are systematically considered (Wright& Bolger, 1992). Group interactions were relied on to increase judgmental accuracy andconfidence (Sniezek & Henry, 1990). Planned follow-up study on the performance ofselected students will provide further evaluation of the reliability of placement decisions.
54

31
References
Airasian, P. W., & Wardrop, J. L. (1989). Review of California Achievement Test,Form E and F. In J. J. Kramer & J. C. Cono ley (Eds.), The tenth mental measurementsyearbook (pp. 126-133). Lincoln, NE: The University of Nebraska-Lincoln, The BurosInstitute of Mental Measurement.
Ary, D., Jacobs, L. C., & Razavieh, A. (1979). Introduction to research ineducation (2nd ed.). Norwood, NJ: Ablex.
Aylward, G. P. (1992). Review of the Developing Cognitive Abilities Test (2nded.). In J. J. Kramer & J. C. Conoley (Eds.), The eleventh mental measurements yearbook(pp. 280-281). Lincoln, NE: The Buros Institute of Mental Measurements.
Baca, L., & Chinn, P. C. (1982). Coming to grips with cultural diversity.Exceptional Education Quarterly, 2(4), 33-45.
Baldwin, A. Y. (1985). Programs for the gifted and talented: Issues concerningminority populations. In F. D. Horowitz & M. O'Brien (Eds.), The gifted and talented:Developmental perspectives (pp. 223-249). Washington, DC: American PsychologicalAssociation.
Bernal, E. M. (1972). Curriculum development for the bilingual/biculturalexceptional child. In Regional training program to serve the bilingual/biculturalexceptional child Sacramento, CA: Montal Educational Associates.
Bernal, E. M. (1974). Gifted Mexican American children: An ethno-scientificperspective. California Journal of Educational Research, 25, 261-273.
Bernal, E. M. (1980). Methods of identifying gifted minority students (ERICReport 72 ed.). Princeton, NJ: Educational Testing Service.
Bernal, E. M. (1981). Special problems and procedures for identifying minoritygifted students. Paper presented for The Council for Exceptional Children Conference onThe Exceptional Bilingual Child, New Orleans, LA. (ERIC Document ReproductionService No. ED 203 652)
Bernal, E. M. (1989). Equity and excellence in gifted education (Invited address).San Diego, CA: California Association for the Gifted.
Bradley, M. K., Kallick, B. 0., & Regan, H. B. (1991). The staff developmentmanager: A guide to professional growth. Boston: Allyn & Bacon.
Culross, R. (1989). Measurement issues in the screening and selection of thegifted. Roeper Review, 12(2), 76-78.
Dolan, L. J., & Enos, M. M. (1980). School Attitude Measure (SAM). Iowa City,IA: American Testronics.
Frasier, M. M. (1986). Frasier Talent Assessment Profile (F-TAP): A multiplecriteria model for the identification and education of gifted students. Athens, GA: TheUniversity of Georgia, The Torrance Center for Creative Studies.
55

32
Frasier, M. M. (1989). Identification of gifted Black students: Developing newperspectives. In C. J. Maker & S. W. Schiever (Eds.), Critical issues in gifted education:Defensible programs for cultural and ethnic minorities: Vol. 2. Defensible programs forcultural and ethnic minorities (pp. 213-225). Austin, TX: Pro-ED.
Frasier, M. M. (1991). A nationwide survey of the attributes of gifted economicallydisadvantaged students: A survey instrument. Athens, GA: The University of Georgia,The National Research Center on the Gifted and Talented.
Frasier, M. M., Hunsaker, S. L., Lee, J., Mitchell, S., Cramond, B., & Krisel, S.(1995). Toward a multigroup perspective on giftedness: Moving from a deficiency to aproficiency view. Unpublished manuscript, The National Research Center on the Gifted andTalented, The University of Georgia, Athens.
Gallagher, J. J., & Kinney, L. (Eds.). (1974). Talent delayed-talent denied: Theculturally different gifted child. Reston, VA: The Foundation for Exceptional Children.
Gardner, H. (1983). Frames of mind: The theory of multiple intelligences. NewYork: Basic Books.
Gregory, D. A. (1985). Diagnostique monograph: Perspectives in specialeducation assessment. Reston, VA: The Council for Exceptional Children.
Hagen, E. (1980). Identification of the gifted. New York: Columbia University,Teachers College Press.
Hargrove, L. J., & Poteet, J. A. (1984). Assessment in special education .Englewood Cliffs, NJ: Prentice-Hall.
Hilliard, A. (1976). Alternatives to I. Q. testing: An approach to the identificationof gifted "minority" children (Final report No. ED 147 009). Sacramento, CA: CaliforniaState Department of Education, Sacramento Division of Special Education.
Hilliard, A. G. (1991). The learning potential assessment device and instrumentalenrichment as a paradigm shift. In A. G. Hilliard (Ed.), Testing African American students:Special re-issue of The Negro Educational Review (pp. 200-208). Morristown, NJ: AaronPress.
Hoge, R. D. (1988). Issues in the definition and measurement of the giftednessconstruct. Educational Researcher, 17(7), 12-16, 22.
Hoge, R. D. (1989). An examination of the giftedness construct. CanadianJournal of Education, 14(1), 6-17.
Hoge, R. D., & Cudmore, L. (1986). The use of teacher-judgment measures in theidentification of gifted pupils. Teacher and Teacher Education, 2(2), 181-196.
Kirschenbaum, R. J. (1988). Methods for identifying the gifted and talentedAmerican Indian student. Journal for the Education of the Gifted, 11(3), 53-63.
Kirschenbaum, R. J. (1989). Identification of the gifted and talented AmericanIndian student. In C. J. Maker & S. W. Schiever (Eds.), Critical issues in gifted education:Vol. 2. Defensible programs for cultural and ethnic minorities (pp. 91-101). Austin, TX:Pro-Ed.
56
33
Kuhlmann, F., & Anderson, R. (1982). The Kuhlmann Anderson Test .Bensenville, IL: Scholastic Testing Service.
Lane, S., & Raju, N. S. (1992). Iowa Tests of Basic Skills, Form J. In J. J. Kramer& J. C. Conoley (Eds.), The eleventh mental measurements yearbook (pp. 419-424).Lincoln, NE: The University of Nebraska-Lincoln, The Buros Institute of MentalMeasurements.
Leung, E. K. (1981, February). The identification and social problem of the giftedbilingual-bicultural children. Paper presented at The Council for Exceptional ChildrenConference on the Exceptional Bilingual Child, New Orleans, LA. (ERIC DocumentReproduction Service No. ED 203 653)
Luftig, R. L. (1989). Assessment of learners with special needs. Boston: Allyn &Bacon.
Maeroff, G. I. (1988). The empowerment of teachers: Overcoming the crisis ofconfidence. New York: Columbia University, Teachers College Press.
McReynolds, P. (1968). Advances in psychological assessment. Palo Alto, CA:Science and Behavior Books.
Mims, J. S. (1988). Access to gifted and talented education: Alternative strategiesfor underrepresented students. Dissertation Abstracts International, 49, 2619A.(University Microfilms No. AAC88-11924)
Nuttall, E. V., Romero, I., & Kalesnik, J. (1992). Assessing and screeningpreschoolers: Psychological and educational dimensions. Boston: Allyn & Bacon.
Oakland, T. (Ed.). (1977). Psychological and educational assessment of minoritychildren. New York: Bruner/Mazel.
Perrine, J. (1989). Situational identification of gifted Hispanic students. In C. J.Maker & S. W. Schiever (Eds.), Critical issues in gifted education: Vol. 2. Defensibleprograms for cultural and ethnic minorities (pp. 5-18). Austin, TX: Pro-Ed.
Powell, M., & Solity, J. (1990). Teachers in control: Cracking the code. NewYork: Routledge.
Purkey, W. W., & Novak, J. M. (1984). Inviting school success: A self-conceptapproach to teaching and learning (2nd ed.). Belmont, CA: Wadsworth.
Renzulli, J. S., Smith, L. H., White, A. J., Callahan, C. M., & Hartman, R. K. (1976).Scales for the Rating of Behavioral Characteristics of Superior Students . MansfieldCenter, CT: Creative Learning Press.
Salvia, J., & Ysseldyke, J. (1988). Assessment in special and remedial education(4th ed.). Boston: Houghton Mifflin.
Sax, G. (1980). Principles of educational and psychological measurement andevaluation (2nd ed.). Belmont, CA: Wadsworth.
57

34
Scott, M. S., Perou, R., Urbano, R., Hogan, A., & Gold, S. (1992). Theidentification of giftedness: A comparison of White, Hispanic and Black families. GiftedChild Quarterly, 36(3), 131-139.
Sniezek, J. A., & Henry, R. A. (1990). Revision, weighting, and commitment inconsensus group judgment. Organizational Behavior and Human Decision Processes, 45,66-84.
Taylor, 0. L., & Lee, D. L. (1991). Standardized tests and African-Americanchildren: Communication and language issues. In A. G. Hilliard (Ed.), Testing AfricanAmerican students (pp. 67-80). Morristown, NJ: Aaron Press.
Thomas, L. S. (1991). A survey of the attributes of bright students fromeconomically disadvantaged families and areas: How teachers describe these students.Unpublished master's thesis, The University of Georgia, Athens.
Tonemah, S. (1987). Assessing American Indian gifted and talented students'abilities. Journal for the Education of the Gifted, 10, 181-194.
Torrance, E. P. (1977). Discovery and nurturance of giftedness in the culturallydifferent. Reston, VA: The Council for Exceptional Children.
Torrance, E. P., & Ball, 0. (1984). Torrance Tests of Creative Thinking, Figural,Form B. Bensenville, IL: Scholastic Testing Service.
Tuliao, N. A. C. (1986). The identification of culturally-different gifted andtalented children. Dissertations Abstracts International, 48, 281A. (University MicrofilmsNo. AAC87-10615)
Wick, J. W., Boggs, D. L., & Mouw, J. T. (1989). Developing Cognitive AbilitiesTest (DCAT). Iowa City, IA: American Testronics.
Wick, J. W., Mason, J., Stewart, J., Smith, J., Wallen, N., Gatta, L., & Fraenkel, J.(1990). National Achievement Test. Chicago: American Testronics.
Wiggins, G. (1989). A true test: Toward more authentic and equitable assessment.Phi Delta Kappan, 70(9), 703-713.
Wood, S. B., & Achey, V. H. (1990). Successful identification of giftedracial/ethnic group students without changing classification requirements. Roeper Review,13(1), 21-26.
Wright, G., & Bolger, F. (1992). Expertise and decision support. New York:Plenum.
Yeatts, P., & Morrison, M. (1988). Instruction manual: Administering the"I Feel . . . Me Feel" self-concept instrument Athens, GA: The University of Georgia.

35
Appendix A
Sample Vignettes
59
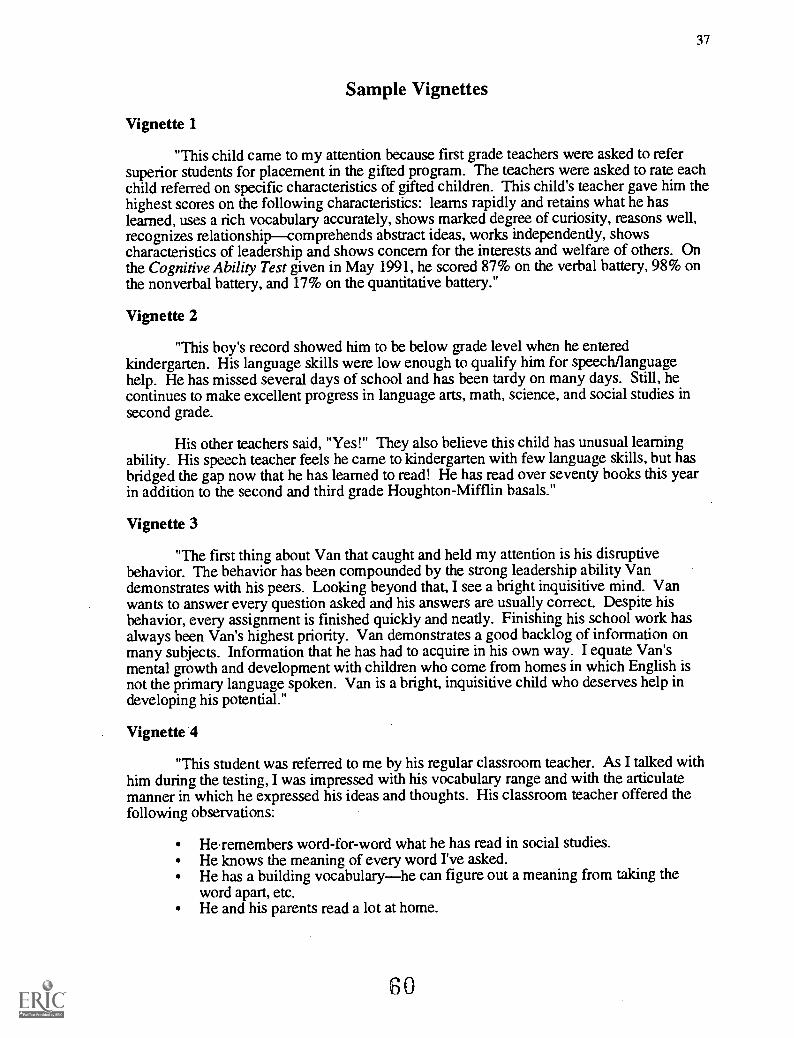
37
Sample Vignettes
Vignette 1
"This child came to my attention because first grade teachers were asked to refersuperior students for placement in the gifted program. The teachers were asked to rate eachchild referred on specific characteristics of gifted children. This child's teacher gave him thehighest scores on the following characteristics: learns rapidly and retains what he haslearned, uses a rich vocabulary accurately, shows marked degree of curiosity, reasons well,recognizes relationshipcomprehends abstract ideas, works independently, showscharacteristics of leadership and shows concern for the interests and welfare of others. Onthe Cognitive Ability Test given in May 1991, he scored 87% on the verbal battery, 98% onthe nonverbal battery, and 17% on the quantitative battery."
Vignette 2
"This boy's record showed him to be below grade level when he enteredkindergarten. His language skills were low enough to qualify him for speech/languagehelp. He has missed several days of school and has been tardy on many days. Still, hecontinues to make excellent progress in language arts, math, science, and social studies insecond grade.
His other teachers said, "Yes!" They also believe this child has unusual learningability. His speech teacher feels he came to kindergarten with few language skills, but hasbridged the gap now that he has learned to read! He has read over seventy books this yearin addition to the second and third grade Houghton-Mifflin basals."
Vignette 3
"The first thing about Van that caught and held my attention is his disruptivebehavior. The behavior has been compounded by the strong leadership ability Vandemonstrates with his peers. Looking beyond that, I see a bright inquisitive mind. Vanwants to answer every question asked and his answers are usually correct. Despite hisbehavior, every assignment is finished quickly and neatly. Finishing his school work hasalways been Van's highest priority. Van demonstrates a good backlog of information onmany subjects. Information that he has had to acquire in his own way. I equate Van'smental growth and development with children who come from homes in which English isnot the primary language spoken. Van is a bright, inquisitive child who deserves help indeveloping his potential."
Vignette '4
"This student was referred to me by his regular classroom teacher. As I talked withhim during the testing, I was impressed with his vocabulary range and with the articulatemanner in which he expressed his ideas and thoughts. His classroom teacher offered thefollowing observations:
He,remembers word-for-word what he has read in social studies.He knows the meaning of every word I've asked.He has a building vocabularyhe can figure out a meaning from taking theword apart, etc.He and his parents read a lot at home.
60

38
At parent conference time I was amazed at the vocabulary of his father and thefather's articulation.He and his parents read a lot at home.He is an only child.He lacks self-motivation."
k.
Vignette 5
"She is a very bright, well motivated student who has never qualified for formalplacement based on her standardized test scores (CTBS and TCS). Her teacherrecommended her to the resource teacher to help find her weaknesses.
Although she is excellent at using higher level thinking skills to solve problems, she spendsso long at an assignmentperfection, to a faultthat she never sees it through tocompletion. This could definitely have some effect on her test performance. If she could beidentified in a formal program based on multiple criteria, in my opinion, she would mostlikely be accepted."

39
Appendix B
Panning for Gold
62

41
Panning for GoldStudent Referral Form
Name of Student Gender: M F
School Grade: Birth date:
Name of Person Referring:
Relation to Student:Racial/Ethnic Identification (please be as specific as possible: e.g., Lebanese, African-American, Cuban-
American, etc.)
Length of residency in the U.S.:
Primary language spoken at home:
Language proficiency scores, if available: First language
English
Directions: Please rate the student being referred for assessment on each TAB. Also provide specificexample(s) or comment(s) for each of the TABs. The Panning for Gold TABs Observation Sheet mayassist you in completing this form.
Communication- unusual ability to communicate (verbally, nonverbally, physically, artistically, symbolically)- uses particularly apt examples, illustrations, or elaborations
In this area, the student is: Strong5
Average4 3 2
Weak1
Specific example(s)
Motivation- persistent in pursuing/completing self-selected tasks (may be culturally influenced); evident in school or
non-school type activities- enthusiastic learner- has aspirations to be somebody, do something
In this area, the student is: Strong5
Average4 3 2
Weak1
Specific example(s)
'BEST COPY AVAILABLE 6 3

42
Humor- keen sense of humor that may be gentle or hostile- large accumulation about emotions- heightened capacity for seeing unusual relationships- unusual emotional depth- openness to experiences- heightened sensory awareness
In this area, the student is: Strong5
Average4 3 2
Weak1
Specific example(s)
Inquiry- asks unusual questions for age- plays around with ideas- extensive exploratory behaviors directed toward eliciting information about materials, devices or situations
In this area, the student is: Strong.
5
Average4 3 2
Weak1
Specific example(s)
Insight- has exceptional ability to draw inferences- appears to be a good guesser- is keenly observant- integrates ideas and disciplines
In this area, the student is: Strong5
Average4 3 2
We*1
Specific example(s)

Interestsunusual or advanced interests in a topic or activity
- self-starter- pursues an activity unceasingly- beyond the group
In this area, the student is: Strong5
Average4 3 2
Weak1
43
Specific example(s)
Problem Solving Ability- unusual ability to devise or adapt a systematic strategy for solving problems and to change the strategy if
it is not working- creates new designs- inventor/innovator
In this area, the student is: Strong5
Average4 3 2
Weak1
Specific example(s)
Memory- already knows- 1-2 repetitions for mastery- has a wealth of information about school or non-school topics- pays attention to details- manipulates information
In this area, the student is: Strou5
Average4 3 2
Weak1
Specific example(s)

44
Reasoning- ability to make generalizations- ability to use metaphors and analogies- can think things through in a logical manner- critical thinker- ability to think things through and come up with a plausible answer
In this area, the student is: Strong5
Average4 3 2
Weak1
Specific example(s)
Imagination/Creativity- shows exceptional ingenuity in using everyday materials- is keenly observant- has wild, seemingly silly ideas- fluent and flexible producer of ideas- is highly curious
In this area, the student is: Strong5
Average4 3 2
Weak1
Specific example(s)
Any other significant observations of abilities:
Format adapted from: Portland Public Schools, Portland, OregonThe National Research Center on the Gifted and Talented
The University of GeorgiaRevised 7/92
66

45
Selection of Student Pool for the RAP
GROUP I
I think this child shows real strength, but, inmy best judgment, he/she is not a memberof one of the target populationseconomically disadvantaged or of limitedEnglish proficiency.
GROUP II
This child is a member of one of the targetgroups, and I feel very strongly that he/sheis potentially gifted.
GROUP III
This child is a member of one of the targetgroups, and I've seen some indicators ofhigh potential, but I'm just not sure ifgifted placement would be in his/her bestinterest.
GROUP IV
This child is a member of one of the targetgroups, and he/she occasionally showssome real "sparks" of potential, but overallhe/she is probably not a good candidatefor referral.
67

68
Pann
ing
for
Gol
d O
bser
vatio
n Sh
eet
Circ
le O
ne:
Cla
ssSt
uden
t
Nam
e:
Dir
ectio
ns: U
se th
e bo
xes
belo
w th
e de
fini
tions
and
des
crip
tions
of
the
basi
c tr
aits
, apt
itude
s, a
nd b
ehav
iors
(T
AB
s) a
ssoc
iate
d w
ith th
egi
fted
ness
con
stru
ct to
rec
ord
exam
ples
of
TA
Bs
disp
laye
d by
the
stud
ent(
s). U
se th
e sc
ale
in th
e bo
x to
sum
mar
ize
your
eva
luat
ion.
blot
ivat
ioti
Evi
denc
e of
des
ire to
lear
n.
Des
crip
tion:
For
ces
that
initi
ate,
dire
ct a
nd s
usta
in in
divi
dual
or
grou
p be
havi
or in
ord
er to
sat
isfy
a
Inte
r 11
kIn
tens
e (s
omet
imes
unu
sual
)
inte
rest
s.
Des
crip
tion:
Act
iviti
es, a
voca
tions
,ob
ject
s, e
tc.,
that
hav
e sp
ecia
l wor
th
Com
mun
icat
ion
Ski
llspr
oble
m-S
.3M
= A
bilit
ykl
emor
yLa
rge
stor
ehou
se o
f inf
orm
atio
n on
scho
ol o
r no
n-sc
hool
topi
cs.
Des
crip
tion:
Exc
eptio
nal a
bilit
y to
reta
in a
nd r
etrie
ve in
form
atio
n.
Hig
hly
expr
essi
ve a
nd e
ffect
ive
use
of w
ords
, num
bers
, sym
bols
.
Des
crip
tion:
Tra
nsm
issi
on a
ndre
cept
ion
of s
igna
ls o
r m
eani
ngs'
Effe
ctiv
e, o
ften
inve
ntiv
e, s
trat
egie
sfo
r re
cogn
izin
g an
d so
lvin
gpr
oble
ms.
Des
crip
tion:
Pro
cess
of d
eten
nin-
need
or
atta
in a
goa
l.or
sig
nific
ance
and
are
giv
en s
peci
alth
roug
h a
syst
em o
f sym
bols
(co
des
ing
a co
rrec
t seq
uenc
e of
alte
rnat
ives
Stu
dent
may
:S
tude
nt m
ay:
atte
ntio
n.ge
stur
es, l
angu
age,
num
bers
).le
adin
g to
a d
esire
d go
al o
r to
alre
ady
know
.de
mon
stra
te p
ersi
sten
ce in
Stu
dent
may
:S
tude
nt m
ay:
succ
essf
ul c
ompl
etio
n or
per
for-
need
onl
y 1-
2 re
petit
ions
for
purs
uing
/com
plet
ing
self-
dem
onst
rate
unu
sual
or
adva
nced
dem
onst
rate
unu
sual
abi
lity
tom
ance
of a
task
.m
aste
ry.
sele
cted
task
s (m
ay b
e cu
ltura
llyin
tere
sts
in a
topi
c or
act
ivity
.co
mm
unic
ate
(ver
bally
, phy
si-
Stu
dent
may
:ha
ve a
wea
lth o
f inf
orm
atio
n
influ
ence
d; e
vide
nt in
sch
ool o
rbe
a s
elf-
star
ter.
cally
, art
istic
ally
, sym
bolic
ally
).de
mon
stra
te u
nusu
al a
bilit
y to
abou
t sch
ool o
r no
n-sc
hool
non-
scho
ol a
ctiv
ities
).be
bey
ond
age-
grou
p.us
e pa
rtic
ular
ly a
pt e
xam
ples
,de
vise
or
adap
t a s
yste
mat
icto
pics
.
be a
n en
thus
iast
ic le
arne
r.pu
rsue
an
activ
ity u
ncea
sing
ly.
illus
trat
ions
or
elab
orat
ions
.st
rate
gy fo
r so
lvin
g pr
oble
ms
and
pay
atte
ntio
n to
det
ails
.
aspi
re to
be
som
ebod
y, d
oso
met
hing
.
to c
hang
e th
e st
rate
gy if
it is
not
wor
king
.m
anip
ulat
e in
form
atio
n.
crea
te n
ew d
esig
ns, i
nven
t.
Mot
ivat
ion
Inte
rest
sC
omm
unic
atio
n S
kills
Pro
blem
-Sol
ving
Abi
lity
Mem
ory
Evi
denc
e of
des
ire to
lear
n.In
tens
e (s
omet
imes
unu
sual
)H
ighl
y ex
pres
sive
and
effe
ctiv
e us
eE
ffect
ive,
ofte
n in
vent
ive,
str
ateg
ies
Larg
e st
oreh
ouse
of i
nfor
mat
ion
onin
tere
sts.
of w
ords
, num
bers
, sym
bols
,fo
r re
cogn
izin
g an
d so
lvin
gpr
oble
ms.
scho
ol o
r no
n-sc
hool
topi
cs.
11
11
110
86
42
108
64
21
1
108
64
21
11
11
108
64
21
11
11
108
64
2
Str
ong
Mod
erat
eW
eak
Str
ong
Mod
erat
eW
eak
Str
ong
Mod
erat
eW
eak
Str
ong
Mod
erat
eW
eak
Str
ong
Mod
erat
eW
eak
BE
ST
CO
PY
AV
AIL
AB
LE
© 1
994.
Tor
ranc
e C
ente
r fo
r C
reat
ive
Stu
dies
, The
Uni
vers
ity o
f Geo
rgia
. All
right
s re
serv
ed.
Per
mis
sion
to r
epro
duce
has
bee
n gr
ante
d.
69

0
Pann
ing
for
Gol
d O
bser
vatio
n Sh
eet (
cont
inue
d)In
aukx
kaig
m(t
enon
ing
bnul
natio
n/C
reat
ivItv
Hon
orQ
uest
ions
, exp
erim
ents
, exp
lore
s.Q
uick
ly g
rasp
s ne
w c
once
pts
and
Logi
cal a
ppro
ache
s to
figu
ring
out
Pro
duce
s m
any
idea
s; h
ighl
yC
onve
ys a
nd p
icks
up
on h
umor
.m
akes
con
nect
ions
; sen
ses
deep
erso
lutio
ns.
orig
inal
.D
escr
iptio
n: M
etho
d or
pro
cess
of
mea
ning
s.D
escr
iptio
n: A
bilit
y to
syn
thes
ize
seek
ing
know
ledg
e. u
nder
stan
ding
or in
form
atio
n.D
escr
iptio
n: S
udde
n di
scov
ery
ofD
escr
iptio
n: H
ighl
y co
nsci
ous,
dire
cted
, con
trol
led,
act
ive,
inte
n-D
escr
iptio
n: P
roce
ss o
f for
min
gm
enta
l im
ages
of o
bjec
ts, q
ualit
ies,
key
idea
s or
pro
blem
s in
com
plex
situ
atio
ns in
a h
umor
ous
way
;S
tude
nt m
ay:
the
corr
ect s
olut
ion
follo
win
gtio
nal,
forw
ard-
look
ing,
goa
lsi
tuat
ions
or
rela
tions
hips
whi
chex
cept
iona
l sen
se o
f tim
ing
in w
ords
ask
unus
ual q
uest
ions
for
age.
inco
rrec
t atte
mpt
s ba
sed
prim
arily
orie
nted
thou
ght.
aren
't im
med
iate
ly a
ppar
ent t
o th
ean
d ge
stur
es.
play
aro
und
with
idea
s.on
tria
l and
err
or.
Stu
dent
may
:se
nses
. Pro
blem
-sol
ving
thro
ugh
Stu
dent
may
:de
mon
stra
te e
xten
sive
exp
lor-
Stu
dent
may
:m
ake
gene
raliz
atio
ns.
non-
trad
ition
al p
atte
rns
of th
inki
ng.
have
kee
n se
nse
of h
umor
-may
stor
y be
havi
ors
dire
cted
tow
ard
dem
onst
rate
exc
eptio
nal a
bilit
yus
e m
etap
hors
and
ana
logi
es.
Stu
dent
may
:be
gen
tle o
r ho
stile
.el
iciti
ng in
form
atio
n ab
out
to d
raw
infe
renc
es.
thin
k th
ings
thro
ugh
in a
logi
cal
show
exc
eptio
nal i
ngen
uity
inha
ve la
rge
accu
mul
atio
n of
mat
eria
ls, d
evic
es o
r si
tuat
ions
.ap
pear
to b
e a
good
gue
sser
.m
anne
r.us
ing
ever
yday
mat
eria
ls.
info
rmat
ion
abou
t em
otio
ns.
be k
eenl
y ob
serv
ant
thin
k cr
itica
lly.
have
wild
, see
min
gly
silly
idea
s.se
e un
usua
l rel
atio
nshi
ps.
poss
ess
heig
hten
ed c
apac
ity fo
rth
ink
thin
gs th
roug
h an
d co
me
uppr
oduc
e id
eas
fluen
tly/fl
exib
ly.
dem
onst
rate
unu
sual
em
o-se
eing
unu
sual
and
div
erse
rela
tions
hips
.
with
a p
laus
ible
ans
wer
.be
hig
hly
curio
us.
tiona
l dep
th.
be o
pen
to e
xper
ienc
es.
inte
grat
e id
eas
and
disc
iplin
es.
dem
onst
rate
sen
sory
aw
are-
ness
.
lam
asIn
ahth
1E
sann
ing
Jrna
lJna
tion/
Cre
athi
tvB
un=
Pro
duce
s m
any
idea
s; h
ighl
y or
igin
al.
Que
stio
ns, e
xper
imen
ts, e
xplo
res.
Qui
ckly
gra
sps
new
con
cept
s an
dm
akes
con
nect
ions
; sen
ses
deep
er
mea
ning
s.
Logi
cal a
ppro
ache
s to
figu
ring
out
solu
tions
.C
onve
ys a
nd p
icks
up
on h
umor
.
For
mat
Ada
pted
from
San
dra
Kap
lan'
s "lo
t She
et"
RE
SE
AR
CH
ED
ITIIO
NN
RC
orr
at L
IGA
lune
199
2
101
1 3
I6
i4
I2
I10
8l
6F
4t
21
101
81
61
41 2
11t
i-t-,
r1-2
110
18
i6
14
21
Str
ong
Mod
erat
eW
eak
Str
ong
Mod
erat
eW
eak
Str
ong
Mod
erat
eW
eak
Str
ong
Mod
erat
eW
eak
Str
ong
Mod
erat
eW
eak
BE
STC
OPY
AV
AIL
AB
LE
t19
94. T
orra
nce
Cen
ter
for
Cre
ativ
e S
tudi
es, T
he U
nive
sity
of G
eorg
ia. A
ll rig
hts
rese
rved
.P
erm
issi
on to
rep
rodu
ce h
as b
een
gran
ted.
71

49
Appendix C
Frasier Talent Assessment Profile (F-TAP)
72

FTAP
rasier
alent
ssessment
rofileTM
Student InformationName Student Code
D.O.B. Gender Race/Ethnicity
Grade School Name/Number
Parent/Guardian
Referred By:
Relationship to Student
Committee Decisions
Copyright 1992. Mary M. FrasierReproduced by permission
73
51

52
Student Code Assessment
Process/Performance
or0r
4...eo
C.)er3
-4-.as
CZ
PercentileTest/RatingScale/Rater Stanine
Observer/Product/Performance/ Deviational IQ
Descriptor/etceteraStandardDeviation
1 2 16 50 84 98 99.; \
1 2 3 4 5 6 7 8 9
52 68 84 100 116 132 148
-3 -2 -1 0 +1 +2 +3
\...
Percentage
Liked Scale
Below Average Average Above Average
10 20 30 40 50 60 70 80 90 100
1 2 3 4 5 6 7 8 9 10 i
BEST COPY AAaLAt LE
Copyright 1992. Mary M. FrasierReprinted by permission
74

Student Code Assessment
Advocacy Information
Language Proficiency
AdditionalInformation Aptitude/
Achievement
Self-Perceptionof Ability
Other
Referral
Motivation
Interests
Communication Skills
Problem-Solving Ability
Memory
_Inquiry
Insight
Reasoning
Imagination/Creativity
Humor
TABs Summary
BEST COPY AVAILABLE 75
Copyright 1992. Mary M. FrasierReprinted by permission
53

54
Student Code Educational Plan
(Programming Options
Counseling Needs
Curricular Needs .4\
Goals/OutcomesEvaluations
Copyright 1992. Mary M. FrasierReprinted by permission
J

55
Appendix D
Session "Feedforward" Instrument
77

57
Session Topic: Identifying Giftedness in Economically Disadvantagedand Limited English Proficient Students
Please complete each of the items on this form. The information will he used to help usmodify future presentations.
DateNumber of years teaching experienceCertification levelPosition/Teaching Assignment (e.g., 5th grade, regular classroom; art teacher, K-5)
Your age group? (circle one) 20-30 31-40 41-50 51+
Strongly StronglyDisagree Agree
1. Objectives of the session were clearly stated. 1 2 3 4 52. Terms used were clearly defined. 1 2 3 4 53. Handouts provided useful information. 1 2 3 4 54. Overheads provided useful information. 1 2 3 4 55. The presenter(s) were effective. 1 2 3 4 56. Directions for using materials were adequate. 1 2 3 4 5
7. How stimulating did you find this session? (check only one)( ) Highly stimulating( ) Substantially stimulating( ) Somewhat stimulating( ) Slightly stimulating (or less)
8. How relevant to your job situation did you find the contents of the session?( ) Extremely relevant( ) Substantially relevant( ) Somewhat relevant( ) Slightly relevant (or less)
9. How useful (practical) for you was the information gained in this session?( ) Extremely useful( ) Substantially useful( ) Somewhat useful( ) Slightly useful (or less)
10. How well motivated are you to try to advocate for a potentially gifted student froman economically disadvantaged background? (check one that fits best)
( ) I am definitely going to implement this plan.( ) I am considering implementing, may try.( ) I am considering implementing, have doubts.( ) I am skeptical. I may. I may not.
78

58
11. Three strong points of this presentation were:
1.
2.
3.
12. How could this presentation have been more effective?
1.
2.
3.
79

59
Appendix E
Why Do We Identify So Few Gifted Children From EconomicallyDisadvantaged (ED) and Limited English Proficient (LEP) Backgrounds?
80

61
Position Grade Subject/Content
Based on your experiences as an educator, please help us to understand why so fewchildren from economically disadvantaged backgrounds are identified as gifted? Use thefollowing scale to indicate your perceptions about some possible barriers to theidentification of gifted students who are poor:
StronglyAgree
Uncertain StronglyDisagree
1 2 3 4 5
Place the number which best matches your perception in the blank at the beginning ofeach statement
1. Deficits in language experiences hinder the development of giftedness inchildren from deprived backgrounds.
2. Parents of poor children often do not provide them with stimulating early homeenvironments; thus, these children often enter school at a disadvantage and areunlikely to catch up.
3. Teachers often do not recognize indicators of potential giftedness ineconomically disadvantaged or limited English proficient children.
4. Standardized tests are biased against minority and economically disadvantagedstudents, so they can't score high enough to qualify for gifted programs.
5. Because of prejudice (either subconscious or overt), teachers often do notnominate poor or culturally different children for gifted screening.
6. There are few truly gifted children who come from economically disadvantagedbackgrounds.
7. The screening/selection process used by my school/state is too narrow to permitpoor or minority students to qualify for gifted placement.
8. Intellectual giftedness is not valued by some cultural groups, so parents ofchildren from those groups do not encourage their children to excel in school.
9. Teachers fear that placing economically disadvantaged and limited Englishproficient students in existing gifted programs will "water down" the quality ofthose programs.
10. Nonstandard English and limited English proficiency prevent children fromperforming well enough in school to be nominated for gifted programs.
81

63
Appendix F
Children's Language Usage Evaluation Scale (CLUES)
82

65
CHILDREN'S LANGUAGE USAGE EVALUATION SCALE
ELEMENT DESCRIPTORS SCORING PROCEDUREFLUENCYOF WRITING
1. Number ofIdeas(Length)
(Dictated/Child Written# Categories by grade levels)
Score items either 0 or 1:0 = item not present
1 = item present
Record really terrific instancesof an item in the Commentsection of the score sheet.* Optional Features are notscored, but presence of theseitems are recordedunder the space provided onthe scoring sheet.
2. Flow ofIdeas
Words flow smoothly or easily.
LANGUAGEUSAGE
3. Vets Descriptive verbs uncommon for agegroup
4. Adjectives Descriptive adjectives uncommon forage group
5. Precision Correct words used to describe orname people, objects, and events thatare uncommon for age group.
6. PicturesqueSpeech
Especially effective words, phrases,slang, figures of speech, comparisons,or the creation of new words that areappealing to senses and create imagesin the reader's mind.
Total Items = 24Fluency of Writing - 2Language Used - 4Story Structure - 6Novelty - 7Personal Interpretation - 5
STORYSTRUCTURE
7. UnusualBeginning
Lead-in appearing with statisticalinfrequency in stories written bychildren at this grade level.
8. UnusualDialog
Dialogue is used naturally and doesnot seem to be forced or artificial.
9. UnusualEnding
Different, unexpected, or rareconclusion. Elements of surprise areused effectively.
10. Unusual Plot Plot develops in mature logicalfashion giving relevant accounts ofevents. Tale unfolds before thereader's eyes.
11. Inclusion ofReaders
Child speaks to or develops idea(s)with reader.
12. Vitality There is much color and lifeportrayed. Reader may want to readagain or share writing with others.
NOVELTY 13. Novelty ofNames
Names for characters are unusual orrare.
14. Novelty ofLocale
Unusual setting chosen for story.
15. UniquePunctuation&ExpressionalDevices
Novel or unusual punctuation,symbols, variety of handwriting, orother devices represent feeling oremotion.
16. NovelDevices
Novel contrivances, devices, ornatural phenomena are used todescribe people, objects, or events inthe story.
83

66
ELEMENT ITEM DESCRIPTORS SCORING PROCEDURENOVELTY(cont' d)
17. Ingenuity inSolvingSituations
Unique methods used to develop ordescribe resolution of situation(s) inthe story.
18. Combingtion of Ideasin UnusualRelation-ships
Synthesis of ideas present or describean unusual relationship.
19. Humor Elements are brought together in ahumorous fashion infrequently seenat this age level.
PERSONALINTERPRE-TATION
20. UnusualAbility toExpressEmotionalDepth
Emotional elements used enhancemeaning of the story. Effectivedevelopment or descriptions ofcharacters' feelings are demonstrated.
21. UnusualSincerity inExpressingPersonalProblems
Real feelings expressed; reader hasthe sense that author is identifyingself with problem or situation.
22. UnusualAbility toIdentify Selfwith Others
Ability to show empathy indescribing people, objects, or events.
23. UnusualSensitivity
Perceptive to social and physicalenvironment.
24. UniquePhilosophi-cal Thinking
Philosophical thinking is at a deeplevel for this age group.
OPTIONALFEATURES
* Novelty of Ideas Idea(s) seem to be rare. Idea(s)unusual for age level.
* Record presence of theseitems by listing specificsunder Optional Features onthe scoring sheet.
* Novelty ofTheme
Theme of entire story that appearsrarely at this grade level.Demonstrates comprehension ofmature topics.
* Novelty of Form In response to write a short story,child creates verse, dramatic form ordifferent type of writing.
* Facility inBeautifulWriting
Individual facility in utilizing wordsor expressions in a beautiful manneris rare at this age level.
* VividPresentation ofPersonalExperience
Personal-realistic experiences arepresented in a sincere, vivid manner.
Adapted From: Carlson Analytical Scale for Measuring the Originality of en s Stories and ePalo Alto Writing Scale. Carlson, R. K. (1965). Sparkling Words, Berke ey, CA: Wagner Printing.NRC/GT-UGA July 1992RESEARCH EDITION

67
Children's Language Usage Evaluation ScaleSCORING SHEET
0/1 ITEM COMMENTSFLUENCY OF WRITING
1. Number of Ideas (Length)2. Flow of Ideas
LANGUAGE USAGE3. Verbs4. Adjectives5. Precision6. Picturesque Speech
STORY STRUCTURE7. Unusual Beginning8. Unusual Dialogue9. Unusual Ending
10. Unusual Plot11. Inclusion of Readers12. VitalityNOVELTY13. Novelty of Names14. Novelty of Locale15. Unique Punctuation & Expressional
Devices16. Novel Devices17. Ingenuity in Solving Situations18. Combination of Ideas in Unusual
Relationships19. HumorPERSONAL INTERPRETATION20. Unusual Ability to Express Emotional
Depth21. Unusual Sincerity in Expressing
Personal Problems22. Unusual Ability to Identify Self with
Others23. Unusual Sensitivity ,24. Unique Philosophical Thinking
OPTIONAL FEATURES: (Novelty of Ideas, Novelty of Theme, Novelty of Form, Facility in BeautifulWriting, Vivid Presentation of Personal Experience)
NRC/GT-UGA, JULY 1992RESEARCH EDITION
85

69
Appendix G
Information Sheets for Participating Teachers and Parents
86

71
INFORMATION SHEET FOR TEACHERS
Because the parents of the children targeted for this project trust you, they are likely to call you with anyquestions they might have. Also, other parents or colleagues may have questions for you concerning thispilot study. The following information may help you in discussing the project:"What will my child have to do?" Graduate research assistants from The University of Georgia will becoming into your school to work with the recommended students. The children will be pulled out of theirclasses to work with the researchers, but we will work closely with you (the classroom teacher) to makesure that the children's normal school day is disrupted as little as possible. The researchers will beinterviewing each child regarding what he/she likes to do, what he/she likes about school, etc. (None of thequestions will be of a personal nature.) The children will be taking two tests: one will be a schoolachievement test, the other an aptitude test. Neither test is particularly long, and most children find themenjoyable. In addition, the children will be engaged in some activities focusing on creative thinking andproblem solvingthe Torrance Tests of Creative Thinking, an Invent America!-like activity, and somecreative writing. Again, these will not be stressful, and most children enjoy them. The children will in noway be penalized for being out of the classroom during this time."What's the purpose of this research?" The University of Georgia Project is part of a national effort tostudy new ways to measure the talents of students from a wide variety of backgrounds. Some groups havehistorically been underrepresented in our country's programs for gifted children; certainly one reason forthis is that most of those programs use a very narrow defmition of giftedness, usually focusing on a child'sability to score well on standardized tests. The University of Georgia's study is focusing on thedistinguishing characteristics of bright students who display various potentials, but have not beenidentified by traditional means for gifted services."Does this mean that my child will be in the gifted program?" Some of the children participating inthis study will undoubtedly be placed in their schools' gifted programs as a result of the thoroughassessment conducted. But, whether or not a child is placed in the gifted program, there will be severalbenefits for all participating children:
(1) The information gathered on each child will be profiled and used to develop anindividualized educational plan that focuses on the child's strengths.
(2) Teachers will be made aware of children's exceptional abilities, and they will be givenguidance in planning classroom experiences which allow the children to use theirexceptional abilities.
(3) Information about their children's exceptional abilities will be shared with parents, andsuggestions will be provided as to how (a) they can continue to nurture those strengthsat home, and (b) they can find community resources which can will further theirchildren's education.
"It doesn't seem fair that only children who are either economically disadvantaged or of limitedEnglish proficiency are eligible for participation in this project. I know many other children whoare bright, who I think should be identified as gifted by this procedure, but they don't qualifybecause of their economic status." While we agree that the Research-Based Assessment Plan is a betterway of considering the abilities and educational needs of all children, we must keep in mind that this is aresearch study. The federal legislation that authorizes this study has set as its top priority finding betterways of identifying gifted children from these particular populations. It is an opportunity to pilot a projectwhich at this point will include only those children who historically have been the most penalized by ourcurrent methods of identification. But we are confident that the knowledge gained through this study willbegin to benefit a wider range of students very soon as state governments and local education agenciesbegin to take a new look at their definitions of giftedness and the criteria by which they are identifyingchildren for gifted programs. Here in Georgia, the State Department of Education fully endorses this projectand hopes to use the data we are collecting to make changes in our policies regarding gifted services by1993.
If you receive any questions which you feel uncomfortable in answering, please refer those parents toDr. Mary Frasier or Ms. Sally Krisel at the number or address on this sheet. We would also like foryou to feel free to contact us with any questions you might have. Thank you.
bEST U Y AVAILABLE 8 7

72
INFORMATION SHEET FOR PARENTS
WHAT TO TELL YOUR CHILD ABOUT THIS PROJECT
Why was I selected? The most important thing to communicate to your childabout this project is how proud you are of him/her for being selected. We asked teachers torecommend students who were very bright, very creative, or highly motivated to achieve, andyour child was selected! Congratulations!
What will I have to do? You can explain that some teachers from The Universityof Georgia will be coming to his/her school to meet with the students involved with theproject. The teachers will be talking to them about the things they like to do, what they likeabout school, what they like to do in their free time, etc. Your child will be doing somewriting and some drawing. These activities will show how your child is doing in schoolsubjects, how good he/she is at thinking and solving problems, and how he/she uses creativethinking skills. The activities are not particularly long, and most children enjoy them.
Why are they doing this project? We know that children demonstrate theirabilities in different ways. One way is through standardized test scores. But we also knowthat test scores do not always give a complete picture of a child's ability. In Georgia,however, qualification for some special programs is based solely on test scores. Forexample, many bright children do not qualify for gifted programs because they may showtheir abilities in other ways. That is the point of this researchto look at the other wayschildren demonstrate how capable they are.
What will they do with the information about me? The teachers from theuniversity will use the information to get a more complete picture of your child's specialstrengths. They will then use this information to help your child's teacher design a moreindividualized educational program for him/her, a program that allows your child to learneven more because activities can be focused to take advantage of your child's exceptionalabilities.
If you or your child have any other questions, please do not hesitate to contact Dr.Frasier, Ms. Krisel, or your child's teacher or principal.

73
Appendix H
Session "Feedforward" Instrument: Responses to Questions 1-6

Question
1. Objectives of the sessionwere clearly stated. (n= 254)
2. Terms used were clearly defined.(a = 242)
3. Handouts provided usefulinformation. (n= 237)
4. Overheads provided usefulinformation. (a= 235)
5. The presenter(s) were effective.(a = 241)
6. Directions for using materials wereadequate. (n = 243)
75
Strongly StronglyDisagree Agree1 2 3 4 5
2(1) 12(5) 14(6) 62(24) 164(65)
0(0) 9(4) 20(8) 75(31) 138(57)
0(0) 2(1) 19(8) 56(24) 160(68)
3(1) 6(3) 27(11) 76(32) 123(52)
1(.4) 1(.4) 16(7) 57(24) 166(69)
2(1) 3(1) 24(10) 71(29) 143(59)
Note. The numbers in parentheses are percentages.
90

77
The National Research Center on the Gifted and TalentedThe University of Connecticut
362 Fairfield Road,U-7Storrs, CT 06269-2007
Production AssistantsDawn R. Guenther
Siamak Vahidi
ReviewersE. Jean GubbinsThomas Hebert
Valentina I. KloostermanIvor PritchardLilia Ruban
Carol Tomlinson
91
78
The
National
Research
Center
on
the
Gifted
and
Talented
Research
Teams
The University of Connecticut
Dr. Francis X. Archambault, Jr. , Associate DirectorThe University of ConnecticutSchool of Education, U-4Storrs, CT 06269-2004860-486-4531
Dr. Alexinia Y. BaldwinDr. Scott W. BrownDr. Deborah E. BurnsDr. David A. KennyDr. Jonna KulikowichDr. Sally M. ReisDr. Karen L. WestbergDr. Michael F. Young
The University of Georgia
Dr. Mary M. Frasier, Associate DirectorThe University of GeorgiaDepartment of Educational Psychology323 Aderhold HallAthens, GA 30602-7146404-542-5106
Dr. Scott L. Hunsaker
The University of Virginia
Dr. Carolyn M. Callahan, Associate DirectorCurry School of EducationThe University of Virginia405 Emmet StreetCharlottesville, VA 22903804-982-2849
Dr. Michael S. CaldwellDr. Marcia A. B. DelcourtDr. Brenda H. LoydDr. Kathleen MayDr. Claudia SowaDr. Ellen TomchinDr. Carol A. Tomlinson
Yale University
Dr. Robert J. Sternberg, Associate DirectorDepartment of PsychologyYale UniversityP.O. Box 208205New Haven, CT 06520-8205203-432-4632
Dr. Pamela Clinkenbeard
92
(9/92)
U.S. DEPARTMENT OF EDUCATIONOffice of Educational Research and improvement (OERI)
Educational Resources Information Center (ERIC)
NOTICE
REPRODUCTION BASIS
3d,-r1'77
1 ERIC I
This document is covered by a signed "Reproduction Release(Blanket)" form (on file within the ERIC system), encompassing allor classes of documents from its source organization and, therefore,does not require a "Specific Document" Release form.
This document is Federally-funded, or carries its own permission toreproduce, or is otherwise in the public domain and, therefore, maybe reproduced by ERIC without a signed Reproduction Releaseform (either "Specific Document" or "Blanket").