
An Exploratory Study of Minor League Baseball Statisticspages.pomona.edu/~gjc04747/MiLB.pdf · An...
37
An Exploratory Study of Minor League Baseball Statistics Gabriel Chandler and Guy Stevens Department of Mathematics, Pomona College, Claremont, CA 91711 Abstract We consider the problem of projecting future success of Minor League baseball players at each level of the farm system. Using tree based methods, in particular random forests, we consider which statistics are most correlated with Major League success, how Major League teams use these statistics dif- ferently in handling prospects, and how prior belief in a players ability, mea- sured through draft position, is used throughout a players Minor League ca- reer. We find that roughly the 18th round prospect corresponds to being draft neutral for a team, at which point teams essentially make decisions based strictly on performance. We use for our data all position players drafted be- tween 1999 and 2002. 1 Introduction Whether a prospect ultimately has success in Major League Baseball (MLB) is a difficult achievement to predict; sometimes, individuals who appear on the fast track to success never make the highest level,
-
Upload
truongnguyet -
Category
Documents
-
view
219 -
download
0
Transcript of An Exploratory Study of Minor League Baseball Statisticspages.pomona.edu/~gjc04747/MiLB.pdf · An...

An Exploratory Study of Minor LeagueBaseball Statistics
Gabriel Chandler and Guy StevensDepartment of Mathematics, Pomona College, Claremont, CA 91711
Abstract
We consider the problem of projecting future success of Minor League
baseball players at each level of the farm system. Using tree based methods,
in particular random forests, we consider which statistics are most correlated
with Major League success, how Major League teams use these statistics dif-
ferently in handling prospects, and how prior belief in a players ability, mea-
sured through draft position, is used throughout a players Minor League ca-
reer. We find that roughly the 18th round prospect corresponds to being draft
neutral for a team, at which point teams essentially make decisions based
strictly on performance. We use for our data all position players drafted be-
tween 1999 and 2002.
1 Introduction
Whether a prospect ultimately has success in Major League Baseball
(MLB) is a difficult achievement to predict; sometimes, individuals
who appear on the fast track to success never make the highest level,
while relatively unknown players surprise everyone and become su-
perstars. Brien Taylor and Steve Chilcott were both the top overall
draft pick in their respective drafts, yet neither ever played in a single
Major League game. On the other hand, Mike Piazza, considered one
of the greatest catchers of all time, was drafted in the 62nd round (for
perspective, the 2012 draft consisted of only 40 rounds).
Almost all prospects, obtained as high school or collegiate ath-
letes through the Rule 4 Amateur Draft each June, spend time in
the Minor Leagues (MiLB), honing their skills and adjusting to the
lifestyle and quality of competition in professional baseball. Each of
the 30 MLB organizations has a system of Minor League affiliates
through which their players progress. While players often skip indi-
vidual levels according to their own development, the typical progres-
sion remains the same; Rookie Class, Class A Short-Season, Class A,
Class A Advanced, Double-A, and Triple-A. Depending on age and
prior experience, players may begin their professional career at any
of these levels. An organization must monitor each player’s progress
throughout his career to decide when he is ready to be promoted to
the next level, or when he is no longer on track for big-league success
and should be released.
Even with standard performance statistics being available on

Minor League performance, players who do reach the Major Leagues
frequently fail to produce at an acceptable level. Both Spurr and Bar-
ber (1994) and Longley and Wong (2011) considered factors related
to progression through the ranks for Minor League pitchers. Spurr
and Barber (1994), using data from mid 1970s to the late 1980s, found
that performance relative to the mean dictated how quickly a pitcher
moved to the next level. Longley and Wong (2011) found that Mi-
nor League statistics do not hold strong predictive power over Major
League performance, and a heavy reliance on performance early in
a pitcher’s career can lead to the early release of a player with Ma-
jor League potential. Pitchers are notoriously volatile, prone to in-
jury or sudden lack of success. We wonder here if hitters, less injury
prone than pitchers, may be more predictable and therefore safer in-
vestments.
Prospects are an increasingly important commodity in baseball.
More and more teams have begun to focus on player development in-
stead of big-money free agent signings. Drafted and developed talent
is cheap relative to the price of free agents; once reaching the Majors,
these players are initially paid the league minimum and remain un-
der team control with relatively minor salary increases for up to six
seasons, often providing value far beyond what they are paid. As a

result, a good deal of literature exists on analyzing draft strategies.
For instance, Shughart and Goff (1992) showed that playing at a four-
year college is related to a quicker progression through the Minor
Leagues. Molitor and Winfree (2007) found that lower round high
school draftees can maximize their expected earnings by choosing to
go to college. Spurr (2000) concluded that there is no statistically sig-
nificant difference between clubs in their ability to find Major League
prospects via the draft. This suggests that there is a large deal of un-
certainty in projecting the development of players. Due to this uncer-
tainty, young stars often fail spectacularly rather than reach the lofty
expectations of their clubs.
As small-market organizations become increasingly dependent
on successes from their Minor League ranks, the cost of mismanaging
these prospects is growing rapidly. Teams have incredible incentives
to handle their young talent as effectively as possible; because these
players can provide substantial surplus values at the big league level,
any advantage in projecting Major League success can be a huge boon
for the team. As Burger and Walters (2009) point out, while there is
a low probability of draft picks ultimately achieving Major League
success, the large expected returns suggests that any slight advantage
a team might garner could be substantial. Cheaply obtaining other

team’s prospects that are likely to outperform their club’s valuation
is another possible way to strengthen the club’s development track.
For example, former Reds’ GM Jim Bowden defended his policy of
scouting prospects that would be drafted by other teams by explain-
ing, “when their stock goes down, we’re going to trade for them”
(Sullivan, 2001).
The goal of the current investigation is two-fold. We examine
the problem of predicting eventual Major League success by looking
at a player’s career trajectory through the Minor Leagues. Players of-
ten fail to make the Majors entirely, which can be a costly failure for
the club due to escalating signing bonuses. As found by Longley and
Wong (2011), for pitchers, this is not an easy prediction to make. In
the present work, we instead focus our attention on position players
and their offensive abilities. Statistics that would be most useful are
those that have strong predictive power at all levels, which would al-
low reliable judgements to be made at the lower Minor League levels.
As it seems obvious that statistics at more advanced classes should be
more predictive of Major League success, we seek to quantify this.
Secondly, we examine how different organizations use informa-
tion about prospects, which might suggest inefficiencies in the eval-
uation process. This includes not only performance statistics at the
various levels, but also their more subjective measurement of talent
which we quantify by draft position.
We mention at the outset that this is an exploratory investiga-
tion into offensive MiLB statistics, an area that has not been explored
in a level of detail even approaching that of MLB, due in part to the
difficulty in accumulating such data. Analyses of prospects and pre-
dictive power of their performances are common in other sports as,
for instance, NCAA basketball and football have much greater visi-
bility than MiLB (see e.g. Coates and Oguntimein, 2008, who looked
at NCAA basketball performance and its relation to NBA success).
While there is undoubtably much to discover through detailed anal-
ysis, we present an overview of the sort of information that can be
gleamed from such data. The following section contains a description
of the data that was used. Section 3 contains an overview of the tech-
niques we used in analyzing the data, most notably random forests.
The results of our analysis are found in section 4, with a discussion in
the section following.
2 Data
Our data comes from The Baseball Cube (www.thebaseballcube.com),
a website with an extensive database of statistics from both MLB and

MiLB. Draft team data was taken from the web site My MLB Draft
(www.mymlbdraft.com).
The data set consists of all hitters who were drafted and signed
by a Major League team between 1999 and 2002, and played in at
least 15 minor league games. These players are drafted between the
ages of 17-23, depending on their experience. Many are drafted after
graduating high school, while others have college experience. The
years that we selected reflect a desire to use the most current data
available which also allows for a final evaluation of whether a player
has reached the Major Leagues or not. Our particular time frame was
also chosen to reflect evaluation of talent that is consistent with the
paradigm shift associated with the release of “Moneyball” (Lewis,
2003). An additional limiting factor is the difficulty in attaining this
type of data. We none-the-less have over 1000 (n=1019) players who
played at least 15 games at Class A.
The data for each player is separated into an array of statistics
at each of the six Minor League levels. Table 1 contains the variables,
including a summary of each statistic at the Triple-A level. These
statistics measure different aspects of each player’s offensive perfor-
mance. We assume the reader is familiar with most of these statistics,
save perhaps isolated power (ISO), which is calculated by subtracting

batting average from slugging percentage. This stat is aimed purely at
determining the hitters proficiency at getting extra-base hits (doubles,
triples, and home runs), predominately a power metric. Defensive
ability, while undoubtably associated with a player’s evaluation, is
not included in our study as data of reliable defensive metrics does
not exist for Minor League baseball. Future improvements on this
sort of analysis can be made by taking into account both position and
defensive ability.
The response we created, ML Contribution, was a binary vari-
able. A value of 1 meant the player established himself in the Major
Leagues (which we define as having played over 320 games through
the 2011 season). This somewhat arbitrary definition of success cor-
responds to roughly two full seasons of Major League experience. It
does not account for varying levels of success, and future research
should explore different metrics of success. Our choice of data en-
sured that players who were going to develop into successful MLB
players would have had time to do so.
Because many players follow a somewhat unique route through
the Minors, as some skip a level along the way and many fail to reach
higher levels, we divided the data set into six subsets. Each subset
corresponds to one of the six Minor League levels, containing only
the players who played at least 15 games at that level.
We note that all of the statistics under consideration are fairly
standard, though the list is fairly comprehensive in the realm of classi-
cal baseball statistics. In recent years, many new statistics have been
proposed, falling under the umbrella of ‘sabermetrics.’ However,
much of the information required for calculating these statistics is not
available for Minor League games. When such statistics were com-
putable, for instance OPS or ISO, we included it. Thus, the choice of
variables that we considered in this study is comprised of essentially
all classical offensive statistics as well as those modern statistics that
are computable from the available data. We are also working under
the assumption that no player is released who otherwise would have
become a successful Major League player. This seems a reasonable
assumption, as many minor league players are kept on well past the
point when an organization has lost hope on a player in order to fill
roster spots.
We also note that the start of these players professional careers
coincides in an era when performance-enhancing drug (PED) use was
believed to be fairly common. There is no way to know which play-
ers, and how many, were using PEDs, though it is possible that this
can contaminate a significant amount of recent data. While there is

no doubt that PED use causes issues on an individual level, we sug-
gest that when looking across the entirety of MiLB, teams are still
using the same criteria in evaluating players regardless of whether or
not their achievements have been “enhanced.” This issue may add ex-
tra uncertainty into our model in the case of players who start to use
PEDs midway through their career, making their earlier statistics un-
reliable in predicting Major League success. We present our analysis
with an acknowledgement of this concern.
To check the generalization of our results to other years, the
New York Mets organization allowed us access to a data set of a se-
lection of draftees by all clubs from 1995-1998, the four years im-
mediately preceding our window. Though not comprehensive, it al-
lowed us to consider the question of whether evaluation methods have
changed over time, albeit in a fairly short time frame. The variables
in this data set are identical to those used in the primary one.
3 Classification Trees and Random Forests
The foundation of our statistical analysis is the Classification Tree
(see, for instance, Hastie, Tibshirani and Friedman, 2001), which uses
any number of explanatory variables to predict a categorical response
variable by a series of splits. Beginning with the entire set of data at

the starting node, this method constructs a tree by dividing this node
into two splits based on a condition on a single statistic (for example,
AVG>.250 and AVG≤ .250). Then, at each of the subsequent nodes,
it is split again the same way based on any of the statistics in the
set. This continues until the tree is well developed and sufficient in
accomplishing the goal of “purity.” For instance, the oft-used Gini
impurity is defined at the ith node as
IG(i) =
m∑j=1
qi j(1 − qi j)
where qi j is the proportion of observations in the ith node of the jth
class. Here, m=2 (either Major League success or not or promoted
beyond the current level or not). In creating the tree, enough splits
are made so that most nodes are very pure. However, the pruning pro-
cess that follows removes any over-specification, allowing for some
impurity but maintaining the usefulness of the results. In the end, each
player belongs to a single “terminal node” and a single probability of
success for all observations within the node.
Building on the usage of the Classification Tree is the Random
Forest technique (Breiman, 2001). This is an ensemble classifier that
creates a large number of trees, each randomly selecting a subset of
variables to use at each split in the tree and limiting consideration
for the split to this subset. Additionally, each tree is grown based on

a bagged (bootstrapped) sample of the training data. By comparing
the results of the numerous tree iterations, the Random Forest algo-
rithm can determine which variables were most significant. This is
accomplished in two ways. One way is by taking the “out of bag”
(OOB) observations (those not used to grow the tree) and comparing
the number of correct classifications against the number of correct
classifications when we permute the values of this variable. Alter-
natively, one can look at the reduction in impurity when the variable
is used, which is what we use in the present work. The average of
these quantities is called the variable importance, V . It quantifies
how useful a variable is for prediction of the response. For an indi-
vidual player, their estimated probability of success, p, is computed
as the proportion of trees in the Random Forest which predict a 1 for
the response when that players statistics are “pushed down” each tree
in the forest. Furthermore, a measure of tree accuracy is given by
the OOB error rate, which is the misclassification rate of observations
that were not used to grow the tree, thus avoiding a biased error rate
due to over fitting.
The Random Forest technique has been shown to be fruitful in
analyzing sports data, for instance in predicting baseball Hall of Fame
voting (Mills and Salaga, 2011). Random Forests are well-suited for

these situations as they can combine a wide range of variables in un-
expected, non-linear relationships.
While some of our variables are highly correlated (for instance
SLG and OPS), Archer and Kimes (2008) have shown through an ex-
tensive simulation study that variable importance based on Gini impu-
rity works well in a variety of settings in identifying influential pre-
dictors, including when covariates are correlated. Additionally, we
considered the method of Diaz-Uriarte and Alvarez de Andres (2006)
for variable selection, which uses backward stepwise elimination to
achieve a set of “important” covariates. This was done using the as-
sociated R package varSelRF (Diaz-Uriarte, 2010).
4 Results
We analyzed trends across Minor League levels using various slope
analyses. Two outputs of the Random Forest lent themselves very
nicely to this type of analysis: the variable importance score Vi j for
variable i at Minor League level j = 1, . . . , 6, and the estimated prob-
ability of promotion for individual players, pk, k = 1, . . . , n. We used
the evolution of Vi over levels to compare both the predictive power
of performance metrics and the relative usefulness of draft position in
promoting prospects. The Random Forests were run in R (R Develop-

ment Core Team, 2011), using the randomForest package of Liaw and
Wiener (2002). For each Random Forest, we used standard values of
the various parameters. Each run consisted of 500 trees (which was
sufficient for the OOB error rate to roughly converge), and we used
the standard rule of thumb of√
k variables at each iteration, where k
is the number of co-variates. In our setting k=19 and thus we used
4 variables at each iteration. This choice of k was competitive with
others in terms of OOB error rates. To quantify the performance of
the Random Forests, the OOB error rates are provided in Table 2.
Not surprisingly, there is a positive trend in the error rate as we move
up through the levels, as the probability of a random selected player
reaching the Majors naturally has a greater probability (closer to .5) at
higher levels than at lower ones. At the lowest levels, one can be quite
accurate in terms of overall error rate by predicting no one to become
a productive Major Leaguer. In fact, for players who played at least
15 games in Rookie Class, only 47 of the 857 had Major League suc-
cess according to our definition. At AAA, where such a naıve strategy
would fail, the Random Forest is fairly accurate. This table gives the
first indication that predicting Major League success is both easier
done at higher levels as well as very difficult to do.
To explore the generalization of our results to other time peri-

ods (with hopes that they hold for modern day), we pushed the indi-
viduals contained in our smaller 1995-1998 data set down our trees
and calculated their ensemble prediction (whichever outcome is pre-
dicted by the majority of the trees in the Random Forest). The class
that consisted of the most observations was AAA, with 251 observa-
tions, 104 of whom went on to have Major League success (41 per-
cent vs 23 percent in our primary data set, suggesting that this is not
a random sample of AAA players). For this data set, we found a false
positive rate of 62.5 percent and a false negative rate of 6.8 percent.
4.1 Projecting Major League success based on performance statis-
tics
We took the subset of players who made it at least as far as Triple-A
and created a Random Forest, including the statistics from all six Mi-
nor League levels. The importance values of each statistic are greater
for the higher levels, as expected.
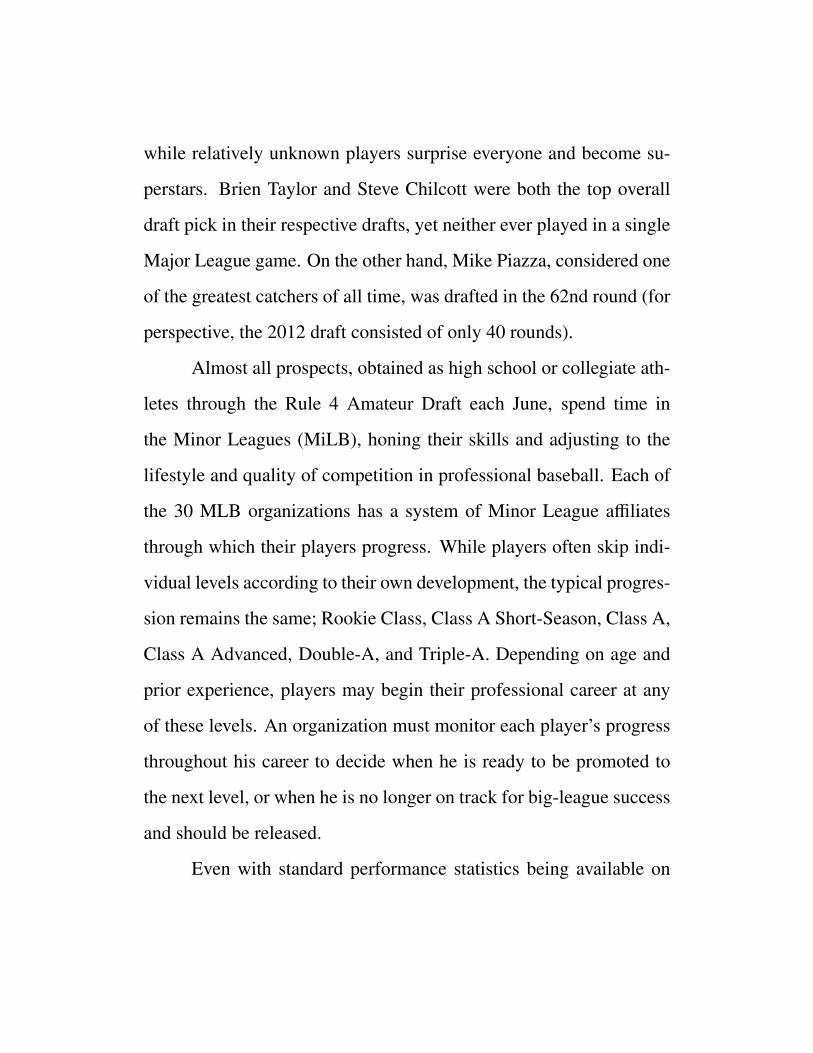
In order to compare importance trends across statistics, we com-
puted normalized importance values
Vi j =Vi j
max j Vi j,
i.e. normalized according to the maximum value for each statistic.
For most statistics, this was the AAA importance, yet there were a few

Figure 1: Normalized importance values at each level for four statistics.
exceptions, which is likely due to sampling variability. Using these
normalized values, we quantified the evolution of the importance by
calculating a slope for each of the Vi. In order to calculate a slope, we
had to determine the “distance” between each level. Both a graphical
analysis as well as an application of the Box-Cox method suggested
that assigning consecutive integers to successive levels was suitable.
Figure 1 shows an example of the trends found in some statistics.
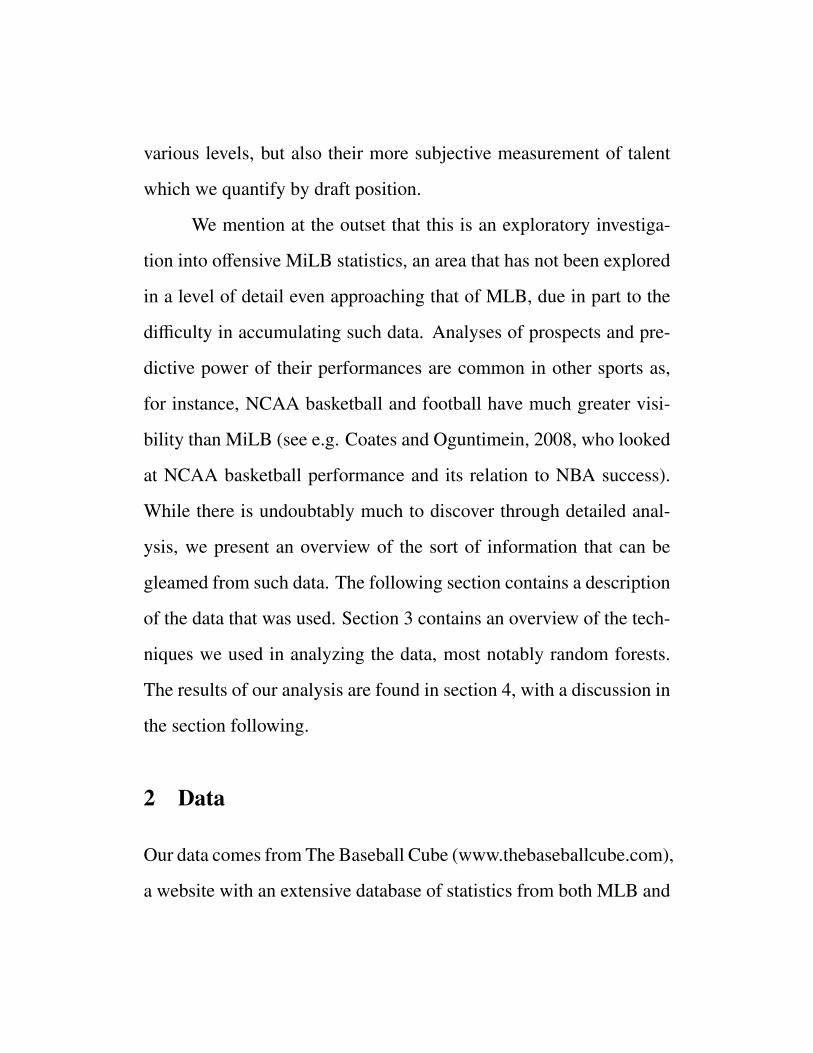
Figure 2 shows these slope values plotted against their impor-
tance values at AAA only. The graph area might meaningfully be
divided into four quadrants, with variables falling into each quadrant
having similar properties. The bottom-left corner, corresponding to

low-importance, low-slope statistics, contains statistics with very lit-
tle predictive power at any level, though tending to be stable for each
player. As expected, GIDP/AB and HBP/AB fall into this category.
More surprising is that BB/AB also fit this description, as walk rate is
typically considered a very useful metric in other areas.
The bottom-right corner, corresponding to low-importance, high-
slope statistics, contains statistics whose low-level prediction value
increases in value with progress through the Minor Leagues. How-
ever, even their explanatory power at Triple-A is not particularly im-
pressive. This includes RBIs, which sabermetricians have almost uni-
versally agreed upon is a statistic not truly determined by player abil-
ity but rather by team strength and luck, which suggests its value as a
future predictor is likely quite small.
The top-right corner corresponds to high-importance, high-slope
statistics. These statistics are those whose value at the higher Minor
League levels, like Double-A and Triple-A, is notable, yet still carry
very little predictive power in the lower levels. These include the typ-
ical rate statistics that analysts like to use: AVG, OBP, SLG, OPS.
While the results still suggest that these are not reliable for low level
performance, these are the most predictive statistics as prospects get
closer to the Major Leagues.

Figure 2: Importance of AAA statistics versus Slope of importance.
Finally, the top-left corner corresponds to high-importance, low-
slope statistics. These would be statistics that have strong predictive
power of Major League success at every level of the Minor Leagues.
Such statistics would be very valuable to Major League clubs, as
they would allow decision-makers to make more accurate conclusions
about prospects earlier in their Minor League careers. The lack of any
such statistics suggests that definite conclusions about a player based
on his performance in the low Minors are not easy; Minor League
performance does not begin to distinguish prospects’ future Major
League performance until the higher levels.

We conjecture that there is a convex relationship that relates
variables importance to their slope. This could suggest some con-
straint on decision-making that prevents smart decisions early. To vi-
sualize this, we have plotted the least convex majorant to our particu-
lar variables. Sabermetric statistics may push this boundary outward,
but likely not all the way to the target area. In general, the major im-
pact of sabermetric analysis is a better judgment of a player’s value to
his team, not predicting how his statistics against inferior competition
will correlate with those at the highest level. The problem we face is
that early conclusions are faulty, requiring promotion to higher levels
to really put together a prospect’s statistical portfolio. Somewhat un-
surprisingly, the variables selected via the backward stepwise method
of Diaz-Uriarte and Alvarez de Andres (2006) were all standard met-
rics, ISO/BA, OPS, and AVG.
This does not mean that Rookie ball statistics are completely
useless. By creating a subset of the data including players in the first
315 picks of each draft, corresponding to about 10 rounds, we find
that certain statistics are significantly more important than others for
certain players. Notably, for these early picks, Strikeouts per At Bat
and Strikeouts per Walk are far more significant than others. Many
of these players are potential-rich high school picks, those with the

physical tools for success but who lack experience against higher-
level pitching. If these players are overwhelmed in Rookie ball, lead-
ing to high strikeout rates, it is a very poor indicator for their Major
League career.
For this subset, the importance values level out for all stats ex-
cept the standard rate metrics by High A. At this level and at Double-
A, OPS is far more important than any other statistic in determining
Major League success. At Triple-A, AVG, OBP, and OPS carry sim-
ilar importance values, while all other statistics are much less signif-
icant. The same trends are not present for those drafted lower than
pick 315, which show no outliers in terms of importance. Essentially,
top draft picks that display the type of performance that their potential
indicated was possible can distinguish themselves in the high minors,
as shown in the traditional rate statistics. Unfortunately, lesser draft
picks do not appear to have this opportunity. Our statistics seem to
fail to illuminate success-bound players taken in the lower rounds of
the draft.
4.2 How draft pick number is used
The second piece of our analysis relates to the power of draft status
in a prospect’s progression through the Minor Leagues. The response

variable is whether or not a player was meaningfully promoted be-
yond his current level (defined as playing at least 15 games at a higher
level than that considered, as often prospects will be promoted for
shorter time periods due to extenuating circumstances like injuries).
Using draft pick number in addition to performance variables, we can
analyze the motivators to promote a given prospect, specifically how
influential draft position is to an organization’s evaluation of a player.
We suspect that a highly touted pre-draft prospect is likely to be pro-
moted from lower levels regardless of his statistics. This corresponds
to our previous results showing that low level statistics do not project
well for later success. Likewise, we conjecture that late-draft players
will require better performances in lower levels to justify (or perhaps
establish) their promise.
Perhaps the most fundamental question is how good scouts are
at recognizing talent pre-draft and how unpredictable players devel-
opment is. To this effect, we calculated the correlation between a
players draft position (in terms of pick number) and their OPS at
each level. A negative correlation indicates that players drafted ear-
lier tended to have higher OPS. While this is verified by the data, the
numbers are fairly low (see table 3).
To analyze how ‘prior’ information about a player factors into
promotion decisions, we looked at how the likelihood of promotion
was affected by the inclusion of draft pick in our analysis. We cre-
ated a Random Forest for each level-specific subset of data, obtaining
the estimated probability of meaningful promotion based on only the
player’s statistics at that level. Here, the estimated probability is the
proportion of trees in the Random Forest that predict promotion for
the terminal node that the player belongs to. We also created a sec-
ond Random Forest with the same statistics and subset, additionally
including the player’s draft pick number, DP. This yielded a second
estimate of the probability of promotion, which we denote as pDP.
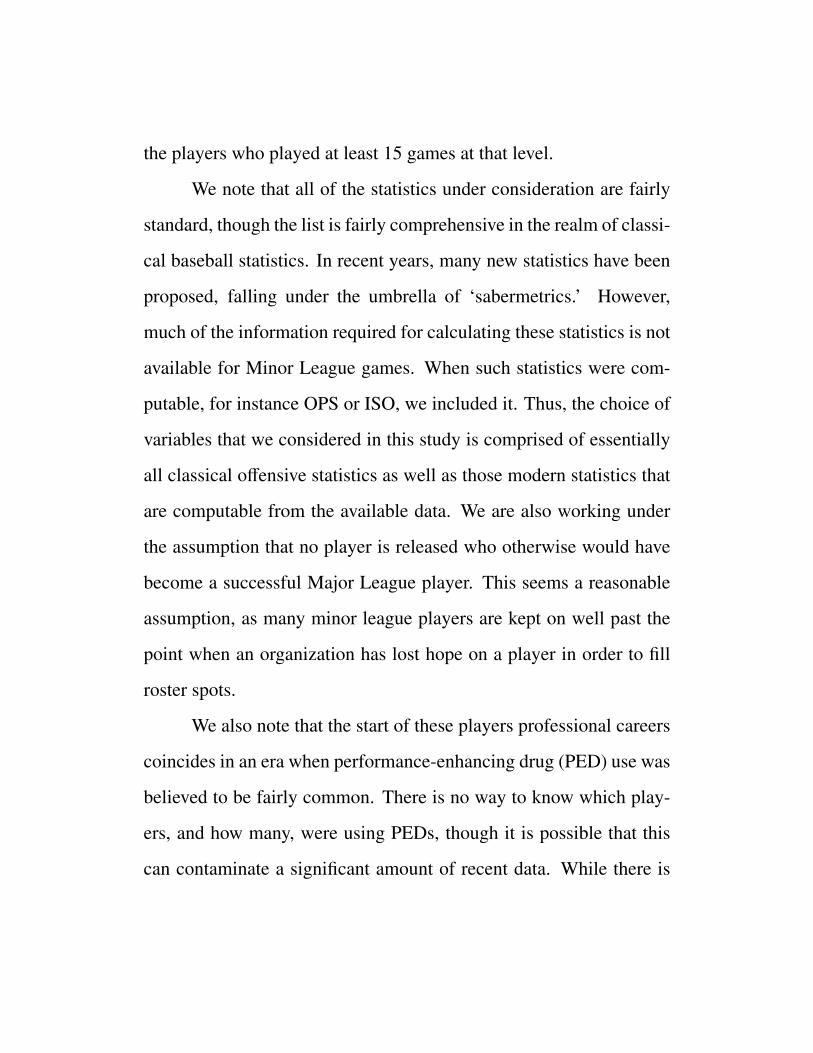
We then calculated the difference between these two probabilities–
representing the change in likelihood of promotion based on the in-
clusion of draft pick– and regressed this value on the player’s position
in the draft, i.e. we fit the model
p − pDP = β0 j + β1 jDP + ε.
We analyzed this regression across each level-specific subset, look-
ing at the resulting slopes β1 j. Unsurprisingly, for many players, the
change in estimated probability is essentially 0, corresponding to the
fact that draft position correlates with performance itself. However, as
we can see, players who were drafted higher (smaller values for draft
position) are often given the benefit of the doubt at this low level.

Figure 3: Difference in promotion probability versus draft position at Low A with loess
curve (solid line).
Conversely, players who are not highly regarded and thus drafted
lower are often much less likely to be promoted given their statistics.
The change in probabilities based on the inclusion of draft number
can be quite dramatic, with values exceeding 20 percent in either di-
rection. We note that the x-intercept for the line of best fit occurs at
draft position 549 (somewhere around Round 18). This seems to rep-
resent the point at which an organization is neutral to draft position
and seemingly relies solely on empirical evidence of ability.
As expected, there is a decreasing trend in the slopes as we

move up through the Minor Leagues, with the slope at the Rookie
level being 2.75 times larger than at AAA. This signifies that actual
performance becomes more important to an organization’s evaluation
of talent as level increases.
As we noted at the end of 4.1 above, Rookie level statistics do
have some value to clubs. While they are not indicative of Major
League success, there is information to be gleaned from these statis-
tics nonetheless. Still using the difference in probabilities, we took the
residuals from a fitted line for each observation in the Rookie data set.
This residual gives a measure of performance, in terms of probability
of promotion, relative to some expected performance level. Positive
residual values indicate a player outperforming expectations, while
negative values correspond to underperformance.
Logistic regression of these residuals on Major League success
returned a positive coefficient with a one-sided p-value of .027, show-
ing statistically significant evidence that Rookie performance rela-
tive to expectations is related to probability of Major League success.
Again, our earlier analysis showed us that Rookie statistics are not
very strong predictors of future success, however they can be used
to gain information about players. In this case, Rookie ball perfor-
mance significantly different than expectations should lead a club to

reevaluate their opinion of a player. While vastly outperforming ex-
pectations does not make the player a lock for future success, clubs
may want to consider viewing a player differently than they did prior
to Rookie ball. A 30th round pick who plays like a 1st rounder in
Rookie ball should not suddenly be viewed as a top tier prospect, but
his club’s valuation of him may increase beyond what his draft status
would suggest. The same can be said in the opposite direction; while
a first round pick who plays like a 30th rounder should not become
an afterthought, his club may view him as a less-promising prospect
than it previously had. Organizations do not need to make finite con-
clusions based on these early performances, but they might consider
shifting their initial beliefs and projections nonetheless.
4.3 Differences in organizational philosophies
The final section of our analysis looked into what factors each fran-
chise uses in evaluating its Minor League players. We ran a separate
Random Forest on each organization’s Minor League system, evalu-
ating the chance of promotion at each Minor League level. As earlier,
this gave us an importance value for each statistic and each team at
each level. We normalized these by each statistic’s maximum in order
to compare them across teams and levels.

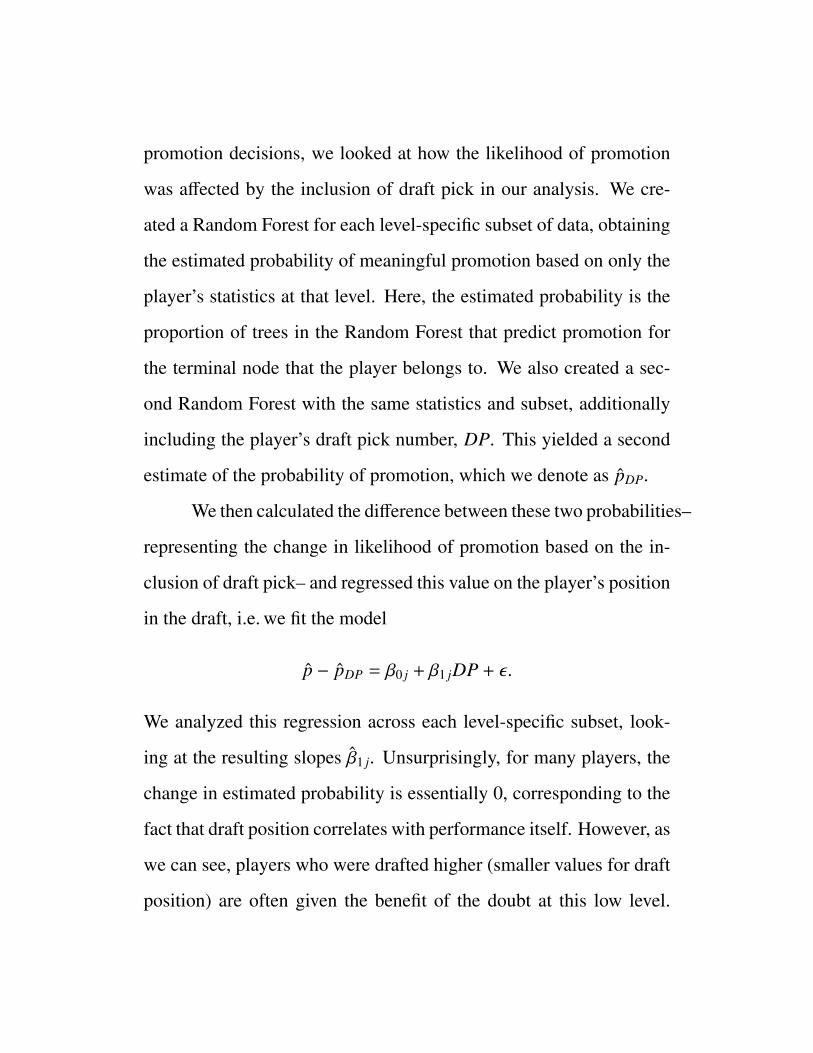
At each Minor League level, we took the mean importance
value and the variance of the importance values for the 30 Major
League organizations. A sample of this for three select statistics is
shown in Figure 4. These three stats show very interesting trends
worth further analysis.
Figure 4: Importance to promotion across Major League organizations.
OBP has a very clear trend across the six Minor League levels.
While not monotonically increasing in mean and variance, its gen-
eral path is that. This means that, for higher levels, OBP becomes a
more and more important factor in the promotion of a player. At the
same time, teams disagree more and more, showing a divide in teams’

methodologies. After Michael Lewis’ bestseller Moneyball (2003),
OBP became a widely used statistic in judging a player’s offensive
worth, yet it did not catch on with all teams. As some teams were
resistant to this change, the data shows significant differences in how
teams value OBP. The Athletics, the focus of Moneyball, fittingly
showed the highest importance values for OBP at the higher levels.
The Red Sox and Blue Jays, also known for their early implemen-
tation of statistical analysis and belief in Moneyball ideas, showed
similarly high importance values for OBP and OPS.
SO/AB shows the reverse trend, decreasing in importance across
levels. We found earlier that strikeout rate is meaningful at the lower
levels for early draft picks, and this high mean and variance for Rookie
and Low A seem to suggest that this had been implemented by some
teams. The decreasing trend in importance means, once a player has
been promoted through the ranks, as long as his other production
is there, an accompanying high strikeout rate will not prevent him
from being promoted. The simple fact that he has been promoted to
a higher level suggests that he is performing in other areas (a high
slugging percentage for example).
AB may be the most telling of this group. At the higher lev-
els, number of at bats carries the highest mean importance values of

any statistic, while also having substantial variance. This suggests
that, while teams disagree on how to value at bats, it is widely used
as the single most important statistic in promoting players. This says
that teams may have predetermined the players they consider their
most promising prospects, and thus give them the most at bats to pre-
pare them for the next level. Furthermore, we suggest that, rather
than using their AA and AAA teams to evaluate numerous players
and promote those who are successful, they have a handpicked group
of prospects they are evaluating ahead of the rest regardless of, and
possibly despite, their performance numbers.
Leading the pack of AB-heavy franchises is the Pittsburgh Pi-
rates, an organization who saw very little in terms of recent success
in player development despite consistently desirable draft position
due to a lack of Major League success. Their organization has been
loaded and reloaded with incoming impact talent, yet rarely had a Pi-
rates prospect become an impact player at the highest level until the
2012 season. The Chicago Cubs’ development track, also having a
noteworthy dependence on at bats, has been unable to provide Major
League-caliber players on a regular basis. Finally, the New York Yan-
kees provide an interesting case. Due to their large budget, they have
less incentive to develop players who will actually be successful at the

Major League level. Much of the value they derive from player devel-
opment is the ability to trade prospects who are considered valuable
by other clubs. This might explain a reliance on at bats, promoting
the players they believe will be valuable trade chips to other clubs.
5 Discussion and Future Directions
The results of our study suggest, unsurprisingly, that Minor League
hitters cannot be accurately judged by their performances early in
their Minor League careers. Some conclusions seem to be possible
early on – for example, strikeout rates in the low Minors are impor-
tant for high draft picks – but a player’s overall body of work does
not become truly telling of Major League potential until he has pro-
gressed to the higher levels. The apparent functional upper bound
on statistics’ predictive power might be viewed as a challenge to an-
alysts; the identification of a statistic pushing this boundary would
provide a legitimate advantage to evaluators. It is of interest to see
where on this graph (Figure 2) modern statistics favored by saberme-
tricians would fall. As mentioned earlier, such statistics are generally
not available from MiLB.
We also analyzed the effect of draft pick number in the devel-
opment and promotion of a prospect. We saw that higher picks are

more likely to be promoted at any given set of performance statis-
tics, proving that performance is not the only tool used by clubs to
decide the worth of a prospect. Instances of promotions of underper-
forming early round draft picks are common across MiLB. However,
as a prospect progresses toward the Major Leagues, his performance
rightly begins to outweigh his draft location in the eyes of his club.
Whether this happens quickly enough is an interesting question. For
instance, Jackson Williams, a catcher taken in the first round in the
2007 draft by the San Francisco Giants has consistently played over
undrafted Tyler LaTorre throughout their MiLB careers, despite La-
Torre having a much higher career OBP (.343 vs .307), as well as
their 2011 season together at AAA (.331 vs .288).
The most telling aspect of the draft pick analysis is the evi-
dence that performance relative to expectations is important. An un-
known prospect who dominates early on could be seen as a legitimate
prospect, while early failures of a top prospect are meaningful neg-
ative signals for his future career. While nothing can be said defini-
tively based on low level MiLB performance, there appears to be a
great deal of uncertainty in the process that leads to suboptimal player
development.
Our team-by-team analysis suggested some interesting insights
into clubs’ decision-making. On-base percentage, strikeout rate, and
home run rate all showed interesting trends in franchises, while teams’
clear preferences for their chosen prospects seem to be overshadow-
ing actual performance in the high Minors, shown in the valuation of
at bats. This might be seen as a meaningful inefficiency, as empha-
sis on at bats seemingly does not match its unimpressive predictive
power over future Major League success.
An important question is how decision-making changes over
time. The introduction of the Moneyball era, for instance, should be
readily apparent through a similar analysis on much earlier data. Fu-
ture work should consider whether results from a decade or so ago are
still valid. As the success of today’s Minor Leaguers is still unknown,
this question is a difficult one to answer.
Another question of interest to MLB clubs that we did not ad-
dress is how a player should be promoted through the various levels
towards MLB. While we assumed that players were not released until
it was certain that they would not develop into a successful Major Lea-
guer for their club, it is possible that players careers were affected by
the particular schedule they followed. It is often worried that promot-
ing a player too quickly, especially younger players, can hamper their
development. This may be reflected in the importance that AB has

for some clubs. While the appropriate promotion schedule is likely
individual specific, it would be interesting to see if any general trends
exist.
In the speculative world of player development, any marginal
advantage in decision making can be parlayed into long-term success.
Our exploratory analysis suggests that such advantages can be found.
Future analyses should incorporate defensive ability, as well as po-
sition, as this is certainly being taken into account by the individual
organizations. One might expect varying organizational emphases on
defense, which, given the disagreement over the importance of field-
ing ability (see Moneyball), may lead to advantages for clubs who
value it appropriately.
The ultimate success of a Minor League prospect depends on
many factors, only a few of which have been accounted for here.
While we’ve already noted sabermetrics, position, and defensive abil-
ity, injury and need at the MLB level are two additional variables that
were left out of our model. These are difficult, as the occurrence of ca-
reer ending injuries is often not reported, and would lead to censored
data. MLB need is difficult to quantify. Improvements in our study
can be made by bringing in any of these factors that were unavailable
to us.

References
Archer K.J., and Kimes, R.V. (2008). Empirical characterization of
random forest variable importance measures. Computational Statis-
tics & Data Analysis, 52(4) 2249–2260.
Breiman L. (2001). Random Forests. Machine Learning. 45, 5-32.
Burger, J.D., and Walters, S.J.K. (2009). Uncertain prospects: rates of
return in the baseball draft. Journal of Sports Economics, 10 485–
501.
Coates, D. and Oguntimein, B. (2008). The length and success of
NBA careers: does college production predict professional out-
comes? North American Association of Sports Economists Working
Paper Series, 08-06.
Cohen, G, (2011). The Baseball Cube. www.thebaseballcube.
com, 15 June 2011.
Diaz-Uriate, R., and Alvarez de Andres, S. (2006). Gene Selection
and Classification of Microarray Data Using Random Forest. BMC
Bioinformatics 7:3.
Diaz-Uriarte, R. (2010). varSelRF: Variable selection using random

forests. R package version 0.7-3. http://CRAN.R-project.org/
package=varSelRF
Hastie, T., Tibshirani, R., and Friedman, J.H. (2009). The Elements of
Statistical Learning: Data Mining, Inference, and Prediction, New
York: Springer.
Lewis M.L., (2003). Moneyball: The Art of Winning an Unfair Game.
Norton: New York.
Liaw, A. and Wiener, M. (2002). Classification and Regression by
randomForest. R News 2, 18–22.
Longley, N. and Wong, G. (2011). The speed of human capital forma-
tion in the baseball industry: the information value of minor-league
performance in predicting major-league performance. Managerial
and Decision Economics, 32: 193–204.
Mills, B.M. and Salaga, S. (2011). Using Tree Ensembles to Analyze
National Baseball Hall of Fame Voting Patterns: An Application to
Discrimination in BBWAA Voting, Journal of Quantitative Analy-
sis in Sports Vol. 7: Iss. 4, Article 12.
myMLBdraft, 15 June 2011 www.myMLBdraft.com.
R Development Core Team (2011). R: A language and environment
for statistical computing. R Foundation for Statistical Computing,
Vienna, Austria. ISBN 3-900051-07-0, http://www.R-project.
org/.
Shughart, W. F., II, and Goff, B. L. (1992). Field of dreams: On
the construction of professional baseball talent in colleges and the
minor leagues . In G. W. Scully (Ed.), Advances in the economics
of sport (Vol. 1, pp. 91-114). Greenwich, C: JAI Press.
Spurr, S.J. and Barber, W. (1994). The effect of performance on a
worker’s career: evidence from minor league baseball. Industrial &
Labor Relations Review, 47, 692–708.
Spurr, S.J. (2000). The baseball draft: A study of the ability to find
talent. Journal of Sports Economics, 1, 66–85.
Sullivan, T. (2001). Bowden makes deals - and enemies, The Cincin-
nati Enquirer. http://reds.enquirer.com/2001/04/01/red_
bowden_makes_deals_-.html 2 Dec. 2011.
Winfree, J.A. and Molitor, C.J. (2007). The value of college: Drafted
high school baseball players. Journal of Sports Economics, 8, 378–
393.

Stat Description Min Mean Max SD
AB At Bats 8 830.851 3753 662.548
AVG Batting Average 0.091 0.264 0.391 0.04
OBP On-Base Percentage 0.161 0.334 0.455 0.042
SLG Slugging Percentage 0.091 0.408 0.737 0.091
OPS On-Base Plus Slugging 0.303 0.743 1.131 0.127
ISO Isolated Power 0 0.144 0.427 0.064
ISO/BA Isolated Power by AVG 0 0.538 1.377 0.217
R/AB Runs per At Bat 0 0.141 0.256 0.033
DBL/AB Doubles per At Bat 0 0.054 0.25 0.02
TPL/AB Triples per At Bat 0 0.006 0.029 0.006
HR/AB Home Runs per At Bat 0 0.025 0.093 0.018
RBI/AB Runs Batted In per At Bat 0 0.13 0.269 0.044
SB/AB Stolen Bases per At Bat 0 0.021 0.144 0.024
SB% Stolen Base Success Rate 0 0.567 1 0.28
BB/AB Walks per At Bat 0.016 0.099 0.244 0.035
SO/AB Strikeouts per At Bat 0.062 0.211 0.545 0.063
SO/BB Strikeouts per Walk 0.533 2.456 12 1.434
HBP/AB Hit-by-Pitch per At Bat 0 0.012 0.057 0.009
GIDP/AB Double Plays per At Bat 0 0.023 0.103 0.012
Table 1: Summary of Triple-A Statistics.

Level Rookie Low A A High A AA AAA
Sample Size 857 852 1019 931 664 443
OOB Error Rate 0.0548 0.048 0.074 0.091 0.137 0.167
False Negative Rate 0.000 0.001 0.006 0.009 0.044 0.073
False Positive Rate 1.000 1.000 0.925 0.867 0.635 0.480
Table 2: Sample sizes and error rates for the Random Forests at each level of MiLB.
Rookie Low A A High A AA AAA
-0.116 -0.169 -0.142 -0.249 -0.123 -0.124
Table 3: Sample correlation values between draft number and OPS at each level.