
An Experimental Study of the Effect of Coal Blending on Ash Deposition
12
An experimental study of the effect of coal blending on ash deposition A. Rushdi * , A. Sharma, R. Gupta Department of Chemical Engineering, Cooperative Research Centre for Coal in Sustainable Development (CCSD), The University of Newcastle, Callaghan NSW 2308, Australia Received 26 March 2003; revised 24 July 2003; accepted 20 August 2003; available online 25 September 2003 Abstract In this study, deposition experiments with well characterized samples of Australian black coals and blends were conducted in a laminar drop-tube furnace to assess the blends behavior and their potential to form ash deposits. Comparison of the results between the blends and single coals shows that the blends behavior was not additive in nature. Some blends developed a thicker ash deposit layer with a maximum thickness higher than 700 mm compared to a thickness of 300 mm for the source coals, whereas, other blends had a lower potential to form ash deposits. This non-additive behavior of coal blends results from the interaction between ash particles within the deposit layer. Therefore, the coal blends performance may not be the same as that of the source coals with same bulk composition. Three techniques were used to explain the trends of the deposition experiments. The use of slag viscosity measurements and a slagging index based on the ash bulk properties, were not successful. Thermomechanical analysis (TMA) test was conducted as another technique that represents the thermal behavior of the ash deposits. The (TMA) penetration curves showed a reasonable matching trend with the deposit thickness obtained in the deposition experiments. q 2004 Elsevier Ltd. All rights reserved. Keywords: Ash deposition; TMA; Slag viscosity and indices 1. Introduction Many pulverized coal fired power plants were originally usually designed to burn a fairly narrow range of fuels. In many cases, these fuels are no longer fired. Therefore, more care must be taken to maintain the quality of the coal going to the power plant [1]. Consequently, utilities use fuel specifications based on experience, usually based on the performance of coals from a single source. This can be achieved by blending of coals. Possible advantages for the electric utilities are: 1. Reducing fuel costs 2. Controlling emission limits 3. Enhancing fuel flexibility and extending the range of acceptable coals 4. Providing a uniform product from coal of varying quality 5. Solving existing problems such as poor carbon burnout, slagging and fouling and improving boiler performance However, although blended coals may conform to the fuel specifications, their performance may not be interp- olated linearly from that of the parent coals [1]. The use of two or more coals blended to meet station requirements has been successful at some sites, but has resulted in some problems at others. Thus, questions are raised about coal combustion, ash deposition and emission performances for blended fuels and how the performance parameters of individual coals can be combined for blended coals. During coal blend combustion, there is no interaction between the different ash particles during ash formation and transpor- tation processes. The interaction amongst the different ash particles takes place only on the deposit surface [2]. This interaction can be highly non-linear for coal blends. This explains why the behaviour of coal blends cannot be predicted from the bulk properties of the parent coals. So far, it is apparent that the effects of coal blending on power plant performance are poorly understood, and also the attempts to understand them are limited. There have been a number of lab-scale and full-scale studies aimed at investigating ash deposition problems for coal blends. In Germany, one of the full-scale studies was carried out to evaluate the influence of coal types on slagging, fouling, 0016-2361/$ - see front matter q 2004 Elsevier Ltd. All rights reserved. doi:10.1016/j.fuel.2003.08.013 Fuel 83 (2004) 495–506 www.fuelfirst.com * Corresponding author. Tel.: þ 61-2-4921-7442; fax: þ61-2-4921-8692. E-mail address: [email protected] (A. Rushdi).
-
Upload
rizal-ahmad-mubarok -
Category
Documents
-
view
216 -
download
1
Transcript of An Experimental Study of the Effect of Coal Blending on Ash Deposition

An experimental study of the effect of coal blending on ash deposition
A. Rushdi*, A. Sharma, R. Gupta
Department of Chemical Engineering, Cooperative Research Centre for Coal in Sustainable Development (CCSD),
The University of Newcastle, Callaghan NSW 2308, Australia
Received 26 March 2003; revised 24 July 2003; accepted 20 August 2003; available online 25 September 2003
Abstract
In this study, deposition experiments with well characterized samples of Australian black coals and blends were conducted in a laminar
drop-tube furnace to assess the blends behavior and their potential to form ash deposits. Comparison of the results between the blends and
single coals shows that the blends behavior was not additive in nature. Some blends developed a thicker ash deposit layer with a maximum
thickness higher than 700 mm compared to a thickness of 300 mm for the source coals, whereas, other blends had a lower potential to form
ash deposits. This non-additive behavior of coal blends results from the interaction between ash particles within the deposit layer. Therefore,
the coal blends performance may not be the same as that of the source coals with same bulk composition.
Three techniques were used to explain the trends of the deposition experiments. The use of slag viscosity measurements and a slagging
index based on the ash bulk properties, were not successful. Thermomechanical analysis (TMA) test was conducted as another technique that
represents the thermal behavior of the ash deposits. The (TMA) penetration curves showed a reasonable matching trend with the deposit
thickness obtained in the deposition experiments.
q 2004 Elsevier Ltd. All rights reserved.
Keywords: Ash deposition; TMA; Slag viscosity and indices
1. Introduction
Many pulverized coal fired power plants were originally
usually designed to burn a fairly narrow range of fuels. In
many cases, these fuels are no longer fired. Therefore, more
care must be taken to maintain the quality of the coal going
to the power plant [1]. Consequently, utilities use fuel
specifications based on experience, usually based on the
performance of coals from a single source. This can be
achieved by blending of coals. Possible advantages for the
electric utilities are:
1. Reducing fuel costs
2. Controlling emission limits
3. Enhancing fuel flexibility and extending the range of
acceptable coals
4. Providing a uniform product from coal of varying quality
5. Solving existing problems such as poor carbon burnout,
slagging and fouling and improving boiler performance
However, although blended coals may conform to the
fuel specifications, their performance may not be interp-
olated linearly from that of the parent coals [1]. The use of
two or more coals blended to meet station requirements has
been successful at some sites, but has resulted in some
problems at others. Thus, questions are raised about coal
combustion, ash deposition and emission performances for
blended fuels and how the performance parameters of
individual coals can be combined for blended coals. During
coal blend combustion, there is no interaction between the
different ash particles during ash formation and transpor-
tation processes. The interaction amongst the different ash
particles takes place only on the deposit surface [2]. This
interaction can be highly non-linear for coal blends. This
explains why the behaviour of coal blends cannot be
predicted from the bulk properties of the parent coals.
So far, it is apparent that the effects of coal blending on
power plant performance are poorly understood, and also
the attempts to understand them are limited. There have
been a number of lab-scale and full-scale studies aimed at
investigating ash deposition problems for coal blends.
In Germany, one of the full-scale studies was carried out
to evaluate the influence of coal types on slagging, fouling,
0016-2361/$ - see front matter q 2004 Elsevier Ltd. All rights reserved.
doi:10.1016/j.fuel.2003.08.013
Fuel 83 (2004) 495–506
www.fuelfirst.com
* Corresponding author. Tel.: þ61-2-4921-7442; fax: þ61-2-4921-8692.
E-mail address: [email protected] (A. Rushdi).

temperatures and gas concentrations in a 325 MW power
plant boiler using three coals and their blends [3]. This study
showed that the operation of the plant in the tests worked
well with all coals and blends, except for the case with the
regular coal. Also, the type of coals affected furnace
temperatures and the extent of furnace slagging depended on
the coals used.
Another lab-scale study examined the ignition, flame
stability, carbon burnout, slagging and fouling propensities
for three pairs of Australian black coals and blends [1]. This
study concluded that due to the chemical interactions
between ash particles in the blends, the propensity of
slagging and fouling of a blend cannot be linearly computed
based on weight percentage of component coals.
At Imperial College, three UK coals were blended with
two US coals and two South African coals using an
entrained flow reactor (EFR) [4]. The main conclusion from
this study was that the blends of UK coals with either US or
South African coals demonstrated non-linear behavior, with
enhanced slagging propensity frequently observed with
relatively small additions of an overseas coal to a UK coal.
Inorganic matter in coal is present in three distinct forms
as shown in Fig. 1. These forms are:
1. Organically bonded elements
2. Minerals included within the coal matrix
3. Excluded minerals
During coal combustion, the minerals in coal are
transformed into ash particles that are different in size and
chemical composition. Physical form of ash is classified in
three categories: fumes, fines and coarse particles [5]. The
fines are mostly generated from fragmentation of excluded
minerals or from expulsion of the mineral grains during
combustion. The large ash particles result mostly from the
excluded quartz or clay particles. The particle size distri-
bution of the ash influences the mode of transportation to the
heat transfer surfaces. Large particles are transported by
inertial impaction and turbulent diffusion, whereas, the fine
particles are transported by thermophoretic forces and
Brownian motion [5,6].
Ash deposition on the heat transfer surface is initiated
with the attachment of particles in a dry, semi-molten or
molten state depending upon the composition of the ash
particles, its particle size, the local heat flux, or conden-
sation of volatile constituents [7,8]. Small dry particles may
adhere to the surface due to surface changes. Semi-molten
and molten particles form as a result of fluxing of quartz by
alkalis, partial decomposition of pyrites, the chlorination or
sulfation of heavy metals and alkali earth, metals, or super
cooling due to a fast quench below the melting temperature
of the ash particles [8].
Particles in the free gas stream of the combustion gases
will be at a high temperature 1400–1500 8C. However, as
the particles approach the deposit surface, the decreasing
temperature gradient will cool them near the surface and
they may be molten when they impact the surface. In this
case, for the particles to adhere to the deposit surface they
must be sticky [2]. It has been suggested that a glue is
formed from alkali salts (Fe and Ca) that condense on the
cold tube surface [9]. It is known that the initial layer can
be enriched in sulphate materials or consist of simple
oxides [10].
These semi-molten particles may bond to the tube
surface by surface tension prior to freezing. Submicron
particles and products of condensation generally deposit
uniformly over the surface, whereas larger semi-molten
or molten deposits develop in irregular patterns depend-
ing upon the fluid dynamics and distribution of ash in the
gas stream.
As the initial layer builds up, the temperature of the
deposit surface increases. This temperature change affects
the physical structure of the deposit surface, in which, it
changes from a particulate surface to a partially molten
surface. This will provide a sticky surface on which other
particles can adhere. At this stage, sintering of the deposit
will occur to some extent depending on the state of melting
of the arriving particles. As the sintered deposit continues to
grow, the deposit surface temperature increases, and the
degree of sintering will increase [11]. When the deposit
temperature becomes very high the deposit surface will
become molten and flow. At this stage, the deposit may not
grow any further due to the liquid running off the surface.
Fig. 2 shows the development of the ash deposit layers.
Fig. 2. Schematic of the development of an ash deposit [11].
Fig. 1. The nature of mineral matter, included, excluded, and organically
associated elements.
A. Rushdi et al. / Fuel 83 (2004) 495–506496

The present paper presents an experimental approach to
study the effect of coal blending on ash deposition using a
vertical drop tube furnace (DTF) shown in Fig. 3. Also, it
aims to explain the behaviour of coal blends using the
techniques:
† Slag viscosity and slagging index techniques based on
the ash bulk properties
† Thermomechanical analysis (TMA) technique
2. Experimental procedures and analysis techniques
2.1. Experiments apparatus and conditions
In this study, the ash deposition experiments were
conducted using seven Australian black coals. Eight blends
were generated from those coals with different ratios. The
proximate, ultimate, and ash analyses for all coals and
blends are given in Table 1.
All the coals and blends were crushed and pulverized to
the pulverized fuel (PF) size (75% less than 212 mm). Due
to the difficulties in feeding fine coal particles less than
45 mm, all the coals and blends were wet sieved to remove
the fine particles less than 45 mm. Before running the
deposition experiments, all the coals and blends were dried
at 115 8C for 24 h after the wet sieving tests. Fifteen ash
deposition experiments were carried out. In each exper-
iment, the ash deposit samples were analyzed using
scanning electron microscopy (SEM) to get the average
deposit layer thickness around the alumina probe.
All the experiments were conducted in an electrically
heated laminar flow Drop Tube Furnace illustrated in Fig. 3.
Coal particles were introduced with the primary air into the
furnace using a mechanical feeder to avoid particle size
segregation at feed rates of 20–30 gm coal/h for 3 h.
Secondary air was introduced at a lower point to provide
mixing during the initial stages of coal combustion. An
excess air of 15–20% was introduced for all experiments to
enable a complete combustion environment. The combus-
tion temperature within the 1.2 m long drop tube section
was 1500 8C permitting complete burnout for the largest
coal particles.
At the furnace exit, ash particles were introduced into a
smaller furnace at the bottom of the large drop tube with an
operating temperature around 1000 8C. In this furnace the
rotating alumina probe 10.0 mm OD was oriented perpen-
dicular to the gas flow and the ash particles were deposited
onto the probe uniformly. A small motor was connected to
the probe to provide a low rotating speed 0.6 rpm to provide
a stable condition for the sticking of ash particles on the
probe surface. Other particles that did not intercept or stick
on the probe were collected in a separate tray located at the
exit of the small furnace, as shown in Fig. 3.
Fig. 3. Schematic diagram of the Drop Tube Furnace (DTF), the bottom furnace and the deposition probe.
A. Rushdi et al. / Fuel 83 (2004) 495–506 497

In all experiments, the collection probe was air-cooled. The
air ran through the alumina probe to keep the inner surface of
the probe temperature less than 700 8C to avoid any physical
changes to the probe structure due to the high temperature of
the bottom furnace and the depositing ash particles. Two
thermocouples were located at the inlet and outlet of the
collecting probe to control the temperature changes along the
probe as shown in the bottom section of Fig. 3.
At the end of each experiment, the collecting probe was
removed from the bottom furnace carefully to keep the ash
layer undisturbed. Then the 10 cm probe with the ash
deposit layer was embedded in resin for at least 24 h as
illustrated in Fig. 4.
2.2. Data analysis
The probes were sectioned and polished and analyzed
using scanning electron microscopy. Fig. 5 shows the cross
sectioned samples ready for analysis that on the left side
being coated with a carbon layer for backscattered electron
imaging.
Table 1
Analysis data of the four Australian black coal sets [13]
Coals and blends Set 1 Set 2 Set 3 Set 4
A AB
(67:33)
BA
(33:67)
B AE
(67:33)
EA
(33:67)
E C CD
(75:25)
DC
(50:50)
D F FG
(67:33)
GF
(33:67)
G
Proximate analysis (%, db)
Ash 9.6 9.0 8.4 7.8 8.9 8.1 7.4 3.2 5.6 7.9 12.7 19.2 17.01 14 12.7
VM 45.9 39.6 33.0 26.7 42.3 37.5 33.9 38.5 36.5 34.5 30.6 30.2 30.4 30.5 30.7
FC 44.5 51.4 58.6 65.5 48.8 54.4 58.7 58.3 57.9 57.5 56.7 50.6 52.6 54.6 56.6
Ultimate analysis (%, db)
C 70.0 72.5 75.0 77.5 72.3 75.5 77.8 76.3 75.3 74.3 72.4 62.4 65.9 69.5 73.0
H 5.3 5.1 4.8 4.6 5.2 5.0 4.9 5.0 4.9 4.8 4.7 3.5 3.9 4.3 4.7
N 11.0 1.2 1.5 1.8 1.2 1.5 1.8 2.1 2.0 2.0 1.9 0.9 1.3 1.6 1.9
S 0.4 0.4 0.4 0.4 0.4 0.4 0.3 0.4 0.4 0.5 0.6 0.2 0.3 0.4 0.5
O 13.7 11.8 9.8 7.9 11.9 9.6 7.8 13.1 11.8 10.4 7.7 13.7 11.6 9.3 7.2
Ash analysis (%)
SiO2 71.5 67.2 62.7 58.4 66.4 59.5 54.4 51.8 52.5 53.2 54.6 50.8 53.4 56.2 58.8
Al2O3 15.9 19.0 22.2 25.3 17.7 20.2 22.0 18.9 23.4 27.8 36.8 28.0 30.0 32.1 34.1
TiO2 2.2 2.1 1.9 1.8 2.2 2.2 2.2 1.3 1.4 1.4 1.6 2.2 2.1 2.1 2.0
Fe2O3 1.8 3.6 5.4 7.2 4.3 7.6 10.1 10.8 8.8 6.8 2.8 11.1 8.2 5.2 2.3
CaO 4.2 3.7 3.1 2.6 4.5 4.9 5.2 7.1 5.5 3.9 0.7 4.0 2.8 1.6 0.4
MgO 1.3 1.1 0.9 0.7 1.2 1.0 0.9 2.5 2.0 1.5 0.4 1.5 1.1 0.7 0.4
Na2O 0.58 0.47 0.36 0.25 0.49 0.38 0.29 0.77 0.65 0.52 0.27 0.48 0.37 0.27 0.16
K2O 0.27 0.61 0.96 1.30 0.79 1.48 2.00 0.42 0.57 0.71 1.00 0.14 0.52 0.92 1.30
Mn3O4 0.04 0.04 0.04 0.04 0.04 0.05 0.05 0.12 0.10 0.07 0.02 0.21 0.14 0.08 0.01
SO3 1.30 0.96 0.60 0.26 1.39 1.51 1.60 3.00 2.30 1.60 0.19 1.40 0.97 0.53 0.10
P2O5 0.06 0.60 1.16 1.70 0.24 0.47 0.65 2.20 1.69 1.19 0.17 0.02 0.08 0.15 0.21
SrO 0.12 0.13 0.13 0.14 0.14 0.18 0.20 0.16 0.12 0.09 0.01 0.03 0.04 0.06 0.07
BaO 0.09 0.09 0.09 0.09 0.09 0.10 0.10 0.09 0.08 0.07 0.05 0.03 0.03 0.04 0.04
ZnO 0.03 0.03 0.02 0.02 0.03 0.03 0.03 0.02 0.02 0.02 0.02 0.03 0.03 0.03 0.03
V2O5 0.09 0.08 0.08 0.07 0.10 0.10 0.11 0.03 0.04 0.04 0.05 0.05 0.06 0.08 0.09
ðBase=AcidÞSdry 0.028 0.046 0.052 0.082 0.041 0.054 0.078 0.101 0.075 0.047 0.029 0.062 0.072 0.072 0.062
Fig. 4. Schematic diagram of the probe with the deposits layer embedded in
an epoxy.
Fig. 5. Collecting probe polished samples with the deposit layer around the
probe covered by a resin layer, the sample on the left side covered with a
carbon layer. The average sample diameter is 29.5 mm.
A. Rushdi et al. / Fuel 83 (2004) 495–506498

2.3. TMA technique
This technique was used to study the thermal behavior of
ash from coals and blends and to compare the ashes in terms
of the potential to form deposits and assess the character of
ash deposits. It involves heating 50 mg ash sample of coals
or blends from 700–1600 8C at 5 8C/min under 100 gm load
and measuring the penetration of a ram into the sample [11,
12]. In this study, a lab-ash produced from all the coals and
blends under 815 8C for two and half hours were used to
generate the TMA percent of penetration curves.
2.4. Slag viscosity calculations ðhÞ
Slag viscosity was used in this study to try to explain the
results obtained from the deposition experiments. Eq. (1)
shows the expression for the standard viscosity curve. This
viscosity model is explained elsewhere [14].
log10
h
TD 2 TS
� �¼
14788
TD 2 TS
2 10:931 ð1Þ
Where
h : is the slag viscosity
TD : deposit temperature
TS : probe surface temperature.
Fig. 6. Two images of coal (A) show sites number 8 and 4, respectively with the deposit particles and the maximum thickness of the deposit layer.
Fig. 7. (SEM) images that show ash deposit layers for the two coals (A) and (B), respectively.
Fig. 8. Deposit layer thickness comparison for coal set (A–B).
A. Rushdi et al. / Fuel 83 (2004) 495–506 499

2.5. Slagging index
Usually, the slagging indices are based on the ash bulk
analysis. One of these indices is based on the ratio of
the basic to acidic oxides as shown in Eq. (2):
Slagging Index ¼Basic
Acidic
� �Sdry ð2Þ
where
Sdry indicates the dry sulfur content in coal or blend
samples [8,15–17].
Basic: Basic Oxide contents in the form of CaO, MgO,
Na2O, K2O and Fe2O3 etc.
Acidic: Acidic Oxide mainly consists of SiO2, Al2O3 and
TiO2.
3. Experimental results and discussion
3.1. Deposit samples analysis technique
Using SEM, 11 images were taken for each sample to
cover the whole probe surface using the same magnification
for all the images. Fig. 6 shows two images of coal (A).
From each image the maximum deposit thickness was
obtained during the analysis as shown by the arrows. The
final deposit thickness was obtained by taking the average
thickness value from 11 locations of the tube surface all coal
and blend samples.
Fig. 9. (SEM) images that show ash deposit layers for the blends (AB) and (BA), respectively.
Fig. 10. (TMA) percent of penetration curves for coal set (A–B).
Fig. 11. (SEM) images that show a selected ash deposit layer for coal (E).
Fig. 12. Deposit layer thickness comparison for coal set (A–E).
A. Rushdi et al. / Fuel 83 (2004) 495–506500

3.2. (DTF) Deposition experimental results
3.2.1. (A–B) coal set
3.2.1.1. Experimental results. The first set of coals consists
of two Australian black coals (A) and (B). Both coals
have close values of ash content 9.6 and 7.8% (ad)
respectively, as shown in Table 1. Coal (A) is rich in
silica and to some extent in calcium oxides, while (B)
coal is rich in alumina and to some extent in iron oxides.
The following images show selected ash deposit layers
from the parent coals (Fig. 7).
From the ash deposition point of view, coal (B), which is
rich in iron oxides 7.20%, should create more ash deposition
problem than coal (A) due to the low melting point of iron
oxides, which may contribute in forming the initial deposit
layer as discussed earlier. The effect of pyrite on ash
deposition in this study is not significant due to the very low
sulfur content in the Australian black coals as shown in
Table 1. This behavior is predicted from the deposit layer
thickness comparison shown in Fig. 8. In this figure, the
maximum deposit thickness for coal (B) is 500 mm, which is
100 mm thicker than coal (A).
The blends (AB) and (BA) have compositions in between
the parent coals with respect to the ratio of blending. Fig. 9
shows ash deposit layers for the blends (AB) and (BA),
respectively. Blend (AB) has more iron and aluminum
oxides than (A) coal, which increased the potential to form
ash deposits for this blend. From Fig. 8, blend (AB) is
showing the worst case of ash deposition with a maximum
thickness around 700 mm. On the other hands, blend (BA)
has more silica than (B) coal comparing to other alkali
oxides. This blend showed the lowest potential to form ash
deposits with a maximum thickness of around 300 mm. This
behavior of coal blends provides a strong evidence of the
non-additive nature of coal blends; therefore, the coal
blends performance may not be the same as that of the
parent coals.
3.2.1.2. TMA comparison. To explain the above results of
(A–B) coal set, (TMA) tests were conducted for each coal
and blend. This test shows the potential of coals and blends
to form ash deposits by characterizing the melting properties
that can be related to the chemical composition of the coal.
All the (TMA) results will be presented with a maximum
temperature of 1000 8C. The reason for that is to match the
conditions of the deposition experiments in the bottom
furnace, where the operating temperature did not exceed this
temperature.
Fig. 10 shows the percent of penetration curves for the
parent coals and the blends of (A–B) coal set. These curves
show that the blend (AB) has the highest potential to form
ash deposits as observed from the (DTF) deposition
experiments [18].
For example, at 900 8C, the percent of penetration value
for (BA, A, B, and AB) was 7.37, 8.89, 12.00, and 16.00%,
respectively. These values show almost the same trend
predicted from Fig. 8. This means that the ash particles of
blend (AB) have the ability to melt at a lower temperature
due to the alkali oxides present which have low melting
points [18,19].
Fig. 13. (SEM) images that show ash deposit layers for the blends (AE) and (EA), respectively.
Fig. 14. (TMA) percent of penetration curves for coal set (A–E).
A. Rushdi et al. / Fuel 83 (2004) 495–506 501
3.2.2. (A–E) coal set
3.2.2.1. Experimental results. The second set of coals
consists of two coals (A) and (E). Coal (E) has a lower ash
content than coal (A) 7.4% (ad) as shown in Table 1
(Fig. 11). Coal (E) rich in iron, calcium, and potassium
oxides. The following image in Fig. 12 shows a selected ash
deposit layer from coal (E).
If the ash content of coal (E) was the same of coal (B), coal
(E) would show more potential to form ash deposits due to the
higher alkali oxide content, especially 10.1% iron oxide
content comparing to 1.8% for coal (A). But, from Fig. 12, it
is obvious that this coal had developed a lower deposit
thickness 380 mm comparing to coal (A). This is due to the
lower ash content for this coal comparing with the coal (A).
The blends (AE) and (EA) have compositions in between
the parent coals with respect to the ratio of blending. Fig. 13
shows the ash deposit layers for the blends (AE) and (EA),
respectively. Blend (AE) has more iron and aluminum
oxides than (A) coal, which increased the potential to form
ash deposits for this blend. From Fig. 13, blend (AE) is
showing the worst case of ash deposition in this set of coal
with a maximum thickness around 620 mm. On the other
hand, blend (EA) has slightly more silica compared to coal
(E) 59.53 and 54.4%, respectively. This blend shows the
lowest potential to form ash deposits with a maximum
thickness around 340 mm.
3.2.2.2. TMA comparison. Fig. 14 shows the percent of
penetration curves for the parent coals (A) and (E) and the
two blends of (A–E) coal set. These curves show that the
blend (AE) has the highest potential to form ash deposits as
predicted from the (DTF) deposition experiments.
For example, at 900 8C, the percent of penetration value
for (EA, E, A, and AE) was 3.68, 5.71, 8.89, and 16.48%,
respectively. These values show almost the same trend
predicted from Fig. 12. This means that the ash particles of
blend (AE) have the ability to be molten at
lower temperatures. At 867 8C blend AE achieves 10%
penetration, while blend EA needs a temperature 927 8C to
reach that value [18].
3.2.3. (C–D) coal set
3.2.3.1. Experimental results. The third set of coals consists
of two coals (C) and (D) along with two blends (CD) and
(DC). The single coals have different ash contents, as shown
in Table 1; coal (D) has the highest ash content 12.7%, while
coal (C) has only 3.2%. In this coal set, the main factor to
determine the highest potential to form ash deposits was the
basic oxides content in each coal. Coal (C) has 10.8% iron,
7.1% calcium, 2.5% magnesium, and 0.77% sodium oxides
comparing to 2.8% iron, 0.7% calcium, 0.42% magnesium,
and 0.27% sodium oxides in coal (D) that is mainly rich in
alumina oxide. Fig. 15 shows two images for selected ash
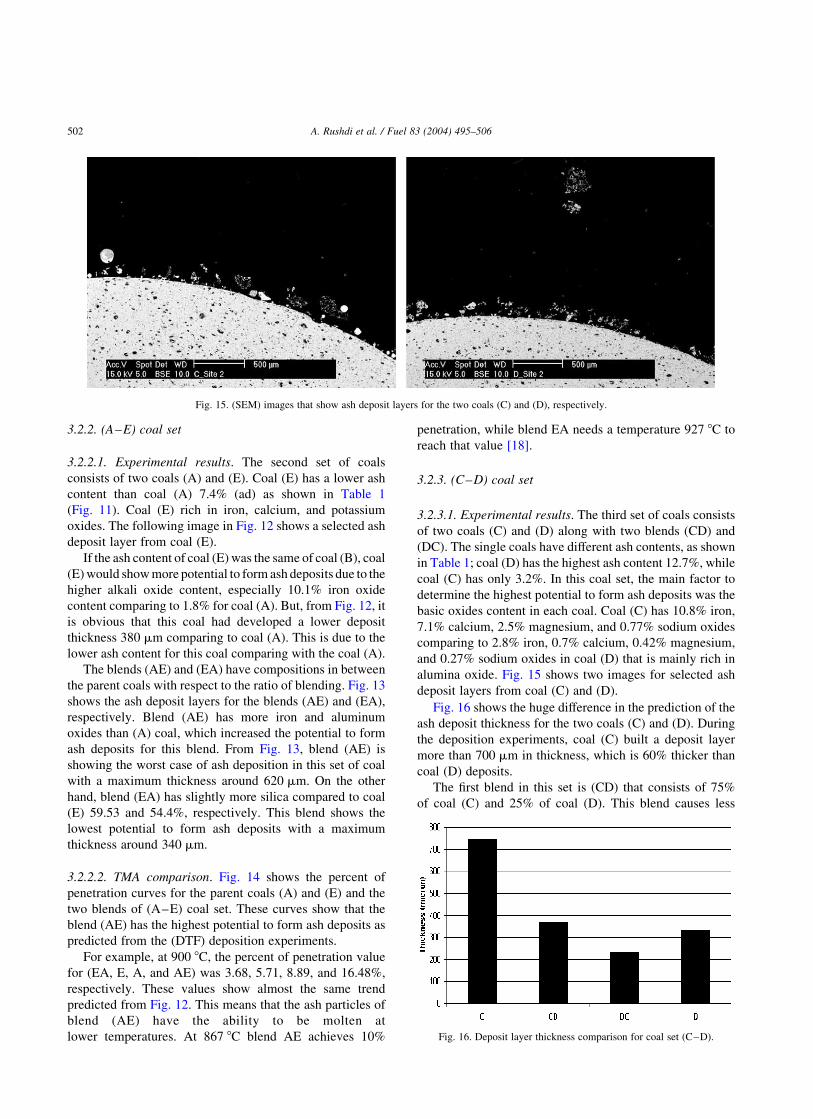
deposit layers from coal (C) and (D).
Fig. 16 shows the huge difference in the prediction of the
ash deposit thickness for the two coals (C) and (D). During
the deposition experiments, coal (C) built a deposit layer
more than 700 mm in thickness, which is 60% thicker than
coal (D) deposits.
The first blend in this set is (CD) that consists of 75%
of coal (C) and 25% of coal (D). This blend causes less
Fig. 15. (SEM) images that show ash deposit layers for the two coals (C) and (D), respectively.
Fig. 16. Deposit layer thickness comparison for coal set (C–D).
A. Rushdi et al. / Fuel 83 (2004) 495–506502

ash deposits problem than coal (C), due to the increase in
the silica and alumina oxides. At the same time, it
produced deposit layer with 50 mm thicker than coal (D)
as shown in Fig. 16. From the practical point of view,
(DC) blend that has 50% from both single coals had the
lowest potential to form deposits in this set. The
maximum deposit thickness of this blend was around
220 mm, due to the higher content of silica and alumina
comparing with (CD) blend and (C) coal as shown in
Fig. 16. Fig. 17 shows selected ash deposit layers for the
blends (CD) and (DC), respectively.
3.2.3.2. TMA comparison. To validate the above results of
(C–D) coal set, (TMA) tests were conducted for each coal
and blend. Fig. 18 shows the percent of penetration curves
for the parent coals and the two blends. These curves show
that coal (C) has the highest potential to form ash deposits as
predicted from the (DTF) deposition experiments compar-
ing with coal (D) and the two blends.
For example, at 900 8C, the percent of penetration
value for (DC, D, CD, and C) was 1.23, 1.93, 3.49, and
14.25%, respectively. These values show almost the same
trend predicted from Fig. 16. This means that the ash
particles of coal (C) can melt at low temperatures due to
the higher content of basic oxides, which has low melting
points [18,19].
From the percent of penetration of coal (D), it can be
seen that when the temperature is less than 870 8C this
coal behaves similar to the (DTF) deposition experiment
trends. Beyond that temperature, coal (D) will have a
higher potential to form deposits with a maximum percent
of penetration of 9.72% at 1000 8C. This behaviour can be
explained on the basis of the chemical interaction between
the oxides beyond 870 8C producing different alkali
silicates with lower melting temperatures [7,8,15]. This
can increase the potential of coal (D) to form ash deposits
at higher temperatures.
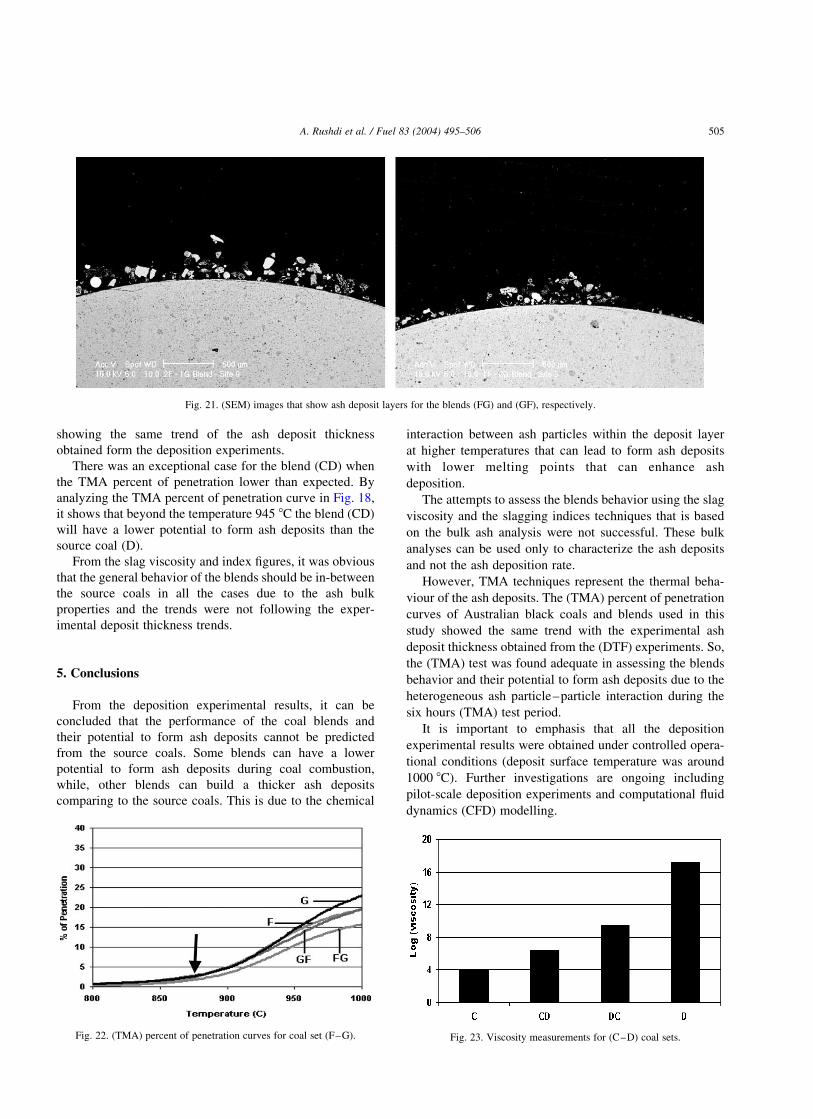
3.2.4. (F–G) coal set
3.2.4.1. Experimental results. The last set of coals consists
of two coals (F) and (G) along with two blends (FG) and
(GF). The single coals have different ash contents, as
shown in Table 1; coal (F) has the highest ash content
19.2%, while coal (G) has 12.7%. Both coals have almost
the same silica content, but the main difference is in the
iron and alumina oxides. Coal (F) has the highest iron
oxide content, while coal (G) has higher silica and alumina
contents of 58.8% and 34.1%, respectively. Fig. 19
shows two images for selected ash deposit layers for the
parent coals.
Fig. 20 shows the deposit thickness difference between
coal (F) and (G). Coal (F) deposit layer is slightly higher that
(G) coal, due to the high iron oxide content.
The first blend in this set is (FG) that consists of 75% (F)
coal and 25% of (G) coal. This blend shows the highest
potential to form deposits as shown in Fig. 20 comparing to
the other blend and parent coals. (FG) has higher potassium
content comparing to coal (F), this may cause to form some
silicates or sulfates with low melting temperatures [7,15].
Fig. 21 shows selected ash deposit layers for the blends (FG)
and (GF), respectively.
Fig. 17. (SEM) images that show ash deposit layers for the blends (CD) and (DC), respectively.
Fig. 18. (TMA) percent of penetration curves for coal set (C–D).
A. Rushdi et al. / Fuel 83 (2004) 495–506 503

Blend (FG) built a deposit layer with a thickness of
337 mm, which is 80 mm thicker than coal (F). The other
blend built a deposit layer that has almost the same
thickness as coal (F).
From the practical point of view, these two blends are not
recommended to be used in a real coal combustion plant,
due to the fact that they may create higher ash deposition
problems in the real furnace, which will affect the overall
performance of the plant.
3.2.4.2. TMA comparison. Fig. 22 shows the percent of
penetration curves for the parent coals and the two blends in
this coal set. These curves show that up to 875 8C all the
coals and blends have the same potential to form deposits as
shown with the arrow. Beyond that temperature, coal (G)
and (GF) blend show the highest potentials, while (FG)
blend has the lowest potential to form ash deposits.
Although the differences were small, the general trend of
the percent of penetration curves did not match well with the
deposition experimental results for this coal set.
4. Slag viscosities and slagging indices comparison
The slag viscosity and slagging index are based on bulk
ash analysis and can only be used to characterize ash
deposits. These bulk analyses have a non-additive behavior
in first place, and secondly the rate of deposition and
consequently the thermal performance of coals and blends
cannot be predicted by using these techniques [2]. Also, the
(TMA) technique is derived form the ash bulk analysis, but
as discussed earlier, this test was able to predict the blends
behavior due to the interaction between the blend ash
particles during the test. This particle–particle interaction is
a heterogonous interaction that reflects the real ash deposits
situation in PF boilers. While, in slag viscosity measure-
ments and slagging indices this interaction is totally
homogenous.
By using the viscosity model discussed earlier [14], coals
and blends viscosity values were generated. Fig. 23 is
showing the viscosity measurements for (C–D) coal set
only at 1000 8C. By analyzing these values, it can be seen
that the blend behaviour should be in between the parent
coals. The slag indices show the same trend as in Table 1.
So, it can be concluded that the slag viscosity measurements
cannot be used as an indicator to predict the slagging
behaviour of coal blends.
On the other hand, from the deposition experimental
results and (TMA) percent of penetration curves it was
shown that this was not the case and the blends could have a
higher potential to form ash deposits than the parent coals,
such as, (AB), (AE), and (FG) blends. In other cases, it
could have a lower potential, such as, (BA), (EA), (DC), and
(GF) blends.
As a summary, Fig. 24 shows a comparison between the
ash deposit thickness obtained form the deposition exper-
iments with the (TMA) percent of penetration, slag
viscosities, and slag index measurements for the coal sets.
It is obvious that the TMA percent of penetration curves are
Fig. 19. (SEM) images that show ash deposit layers for the two coals (F) and (G), respectively.
Fig. 20. Deposit layer thickness comparison for coal set (F–G).
A. Rushdi et al. / Fuel 83 (2004) 495–506504
showing the same trend of the ash deposit thickness
obtained form the deposition experiments.
There was an exceptional case for the blend (CD) when
the TMA percent of penetration lower than expected. By
analyzing the TMA percent of penetration curve in Fig. 18,
it shows that beyond the temperature 945 8C the blend (CD)
will have a lower potential to form ash deposits than the
source coal (D).
From the slag viscosity and index figures, it was obvious
that the general behavior of the blends should be in-between
the source coals in all the cases due to the ash bulk
properties and the trends were not following the exper-
imental deposit thickness trends.
5. Conclusions
From the deposition experimental results, it can be
concluded that the performance of the coal blends and
their potential to form ash deposits cannot be predicted
from the source coals. Some blends can have a lower
potential to form ash deposits during coal combustion,
while, other blends can build a thicker ash deposits
comparing to the source coals. This is due to the chemical
interaction between ash particles within the deposit layer
at higher temperatures that can lead to form ash deposits
with lower melting points that can enhance ash
deposition.
The attempts to assess the blends behavior using the slag
viscosity and the slagging indices techniques that is based
on the bulk ash analysis were not successful. These bulk
analyses can be used only to characterize the ash deposits
and not the ash deposition rate.
However, TMA techniques represent the thermal beha-
viour of the ash deposits. The (TMA) percent of penetration
curves of Australian black coals and blends used in this
study showed the same trend with the experimental ash
deposit thickness obtained from the (DTF) experiments. So,
the (TMA) test was found adequate in assessing the blends
behavior and their potential to form ash deposits due to the
heterogeneous ash particle–particle interaction during the
six hours (TMA) test period.
It is important to emphasis that all the deposition
experimental results were obtained under controlled opera-
tional conditions (deposit surface temperature was around
1000 8C). Further investigations are ongoing including
pilot-scale deposition experiments and computational fluid
dynamics (CFD) modelling.
Fig. 22. (TMA) percent of penetration curves for coal set (F–G). Fig. 23. Viscosity measurements for (C–D) coal sets.
Fig. 21. (SEM) images that show ash deposit layers for the blends (FG) and (GF), respectively.
A. Rushdi et al. / Fuel 83 (2004) 495–506 505

Acknowledgements
The authors acknowledge the support of CCSD for Coal
in Sustainable Development, Australia for the present
research and Professor Terry Wall for his valuable advice.
References
[1] Su S. Combustion behavior and ash deposition of blended coals. In:
Chemical engineering. Brisbane: The University of Queens land; 1999.
[2] Gupta RP, Rushdi A, Browning G, Wall TF. A mechanistic approach
for assessing thermal performance of coal blends. In: Engineering
Foundation Conference on Impact of Fuel Quality on Power
Generation. UT, USA: Snowbird; 2001.
[3] Heinzel T, Maier J, Spliethoff H, Hein KRG, Cleve W. Slagging tests
on the suitability of alternative coals in a 325 MW PC boiler. In:
Proceedings of an Engineering Foundation Conference on Mineral
Matter in Fuels. Kuna/Hawaii: Kluwer/Plenum; 1997/1999.
[4] Manton NJ, Williamson J, Riley GS. Changes in slagging behavior
with composition for blended coals. In: Gupta RP, editor. Impact of
mineral impurities in solid fuel combustion. New York: Kluwer/
Plenum; 1999. p. 297–308.
[5] Gupta RP, Wall TF. Inorganic transformations and ash deposition
during combustion. In: Engineering Foundation Conference. New
Hampshire; 1993.
[6] Im KH, Chung PM. Particulate deposition from turbulent parallel
streams. AIChE 1983;29:498–505.
[7] Raask E. Mineral matter and ash in coal. In: ACS Symposium Series
301; 1986.
[8] Bryers RW. Fireside slagging, fouling, and high temperature
corrosion of heat-transfer surface due to impurities in steam-raising
fuels. Prog Energy Combust Sci 1996;22(1):29–120.
[9] Rosner DE, Nagarajan R. Toward a mechanistic theory of net deposit
growth from ash laden flowing combustion gases: self-regulated
sticking of impacting particles and deposit erosion in the presence of
vapor glue. In: AIChE Symposium Series; 1987. p. 289–96.
[10] Wibberley LJ. Effect of coal composition on deposit formation in
PF fired boilers. In: Intensive course on the characterisation of
steaming coal. Newcastle, Australia: Institute of Coal Research;
1985.
[11] Wall TF, Juniper L, Lowe A. ACARP Project C9055—State-of-the-
art review of ash behavior in coal fired furnaces. Newcastle:
University of Newcastle; 2001. p. 93.
[12] Gupta SK, Gupta RP, Bryant GW, Juniper L, Wall TF. Thermomech-
anical analysis and alternative ash fusibility temperatures. In:
Proceedings EF Conference, Impact of Mineral Impurities During
Solid Fuel Combustion. Kuna, Hawaii; 1997.
[13] Holcombe D. Thermal coal blends. Booval, QLD, Australia: ACIRL
LTD; 2000.
[14] Browning G, Bryant GW, Hurst HJ, Lucas JA, Wall TF. An empirical
method for the prediction of coal ash slag viscosity. Energy Fuels
2003;17:731–7.
[15] Couch G, Understanding slagging and fouling in PF combustion, vol.
IEACR/72. London, UK: IEA Coal Research; 1994. p. 118.
[16] Raask E. Mineral impurities in coal combustion: behavior problems,
and remedial measures. Washington: Hemisphere Pub. Corp; 1985. p.
484.
[17] Vaninetti GE, Busch CF. Mineral analysis of ash data: a utility
prospective. J Coal Quality 1982;22–31.
[18] Wall TF, Creelman RA, Gupta RP, Gupta SK, Coin C, Lowe A. Coal
ash fusion temperatures—new characterisation techniques, and
implications for slagging and fouling. Prog Energy Combust Sci
1998;24(4):345–53.
[19] Gupta SK, Wall TF, Creelman RA, Gupta RP. Ash fusion
temperatures and the transformations of coal ash particles to slag.
Fuel Process Technol 1998;56(1–2):33–43.
Fig. 24. Comparison between the ash deposit thickness obtained in the deposition experiments with the TMA percent of penetration, viscosity, and slag index
for all coal sets (A–B), (A–E), (C–D), and (F–G), respectively.
A. Rushdi et al. / Fuel 83 (2004) 495–506506


![Projector Station for Blending - pro.sony · [Sony Corporation] > [Projector Station for Blending] > [PS for Blending]. For Windows 8, start the software using the [PS for Blending]](https://static.fdocuments.net/doc/165x107/5f6f6b9611addf735154fc46/projector-station-for-blending-prosony-sony-corporation-projector-station.jpg)


