AN EXPERIMENTAL STUDY OF FLUIDIZATION PROCESSES …Sieve Analysis of No. 4000 Glass Microspheres...
103
NASA CONTRACTOR REPORT LOAN COPY: RETURN TO AFWL [WLIL-2) KIRTLAND AFB, N MEX AN EXPERIMENTAL STUDY OF FLUIDlZATION PROCESSES UNDER LUNAR CONDITIONS by Gordon H. Miller md Irving R. King ,. Prepared by ,. ,-’ 1. .’ TEXACO EXPERIMENT, INC. . .-., Richmond, Va. ,/ I for Goddard Space Flight Center j .’ ti .’ . . . NATIONAL AERONAUTICS AND SPACEADMINISTRATION l WASHINGTON, D. C. l OCTOBER 1966 https://ntrs.nasa.gov/search.jsp?R=19660029513 2020-05-12T01:46:11+00:00Z
Transcript of AN EXPERIMENTAL STUDY OF FLUIDIZATION PROCESSES …Sieve Analysis of No. 4000 Glass Microspheres...

NASA CONTRACTOR
REPORT
LOAN COPY: RETURN TO AFWL [WLIL-2)
KIRTLAND AFB, N MEX
AN EXPERIMENTAL STUDY OF FLUIDlZATION PROCESSES UNDER LUNAR CONDITIONS
by Gordon H. Miller md Irving R. King ,.
Prepared by ,. ,-’
1. .’
TEXACO EXPERIMENT, INC. . .-.,
Richmond, Va. ,/ I
for Goddard Space Flight Center j .’ ti .’ . . .
NATIONAL AERONAUTICS AND SPACE ADMINISTRATION l WASHINGTON, D. C. l OCTOBER 1966
https://ntrs.nasa.gov/search.jsp?R=19660029513 2020-05-12T01:46:11+00:00Z
TECH LIBRARY KAFB, NM
AN EXPERIMENTAL STUDY OF FLUIDIZATION PROCESSES
UNDER LUNAR CONDITIONS
By Gordon H. Miller and Irving R. King
Distribution of this report is provided in the interest of information exchange. Responsibility for the contents resides in the author or organization that prepared it.
Prepared under Contract No. NAS 5-9231 by TEXACO EXPERIMENT, INC.
Richmond, Va.
for Goddard Space Flight Center
NATIONAL AERONAUTICS AND SPACE ADMINISTRATION
For sale by the Clearinghouse for Federal Scientific and Technical Information Springfield, Virginia 22151 - Price $2.50


TABLEOFCONTENTS
TABLES
Page
V
FIGURES vii
I. INTR ODUC TION
A. Maria Formation by Fluidized Ash Flow 1. Flow of Terrestrial Ash
2. Flow of Lunar Ash
B. Experimental Study and Demonstration of Simulated Flow of Fluidized Ash 1. Description of the Fluidization Process 2. Problems in Demonstrating Ash Flow 3. Possible Demonstration of Ash Flow 4. Composition of Material for Fluidized Flow 5. Effect of Vacuum on Fluidization
C. Object and Scope of Program
D. Acknowledgements
II. EXPERIMENTAL WORK
A. Materials Used in Fluidization Studies 1. Particle Shapes 2. Source of Materials 3. Particle Size and Distribution 4. Physical Measurements of Particles
B. Settling Rates
C. Flow Properties 1. Horizontal Flow Velocities 2. Flow Distances 3. Particle Separation
D. Vacuum Fluidization
E. Discussion of Results
1
2 2 3
7
8
9
9 9 9 9
28
34
54 54 57 67
69
82
III. CONCLUSIONS 85
iii

IV. RECOMMENDATIONS
V. FUTURE WORK
REFERENCES
Page
87
88
90
iv

I.
II,
III.
IV.
V.
VI.
VII.
VIII.
IX.
X.
XI.
XII.
XIII.
XIV.
xv.
XVI.
LIST OF TABLES
Materials used in Fluidization Studies
Screens used for Particle Sizing
Sieve Analysis of No. 4000 Glass Microspheres
Sieve Analysis of No. 2332.5 Glass Microspheres
Sieve Analysis of No. 325 Talc
Sieve Analysis of Crushed Granite
Composition of Granite Mix No. 1
Sieve Analysis of FCCU Regen. Catalyst
Sieve Analysis of F-2-25 Catalyst
Sieve Analysis of Unwelded Ash Flow Tuff
Sieve Analysis of Unwelded Ash Flow Tuff (heart cut)
Physical Measurements of Particles
Bulk Density of Fluidized Materials
Minimum Mass Flow Rate for Fluidization of Glass Micro- spheres
Minimum Mass Flow Rate for Fluidization of Unsvelded Ash Flow Tuff
Effect of Particle Size on Settling Rate of Glass Micro- spheres
XVII. Effect of Particle Size on Settling Rate of Unwelded Ash Flow Tuff.
Page 18
20
21
21
22
23
24
25
26
27
30
31
32
45
48
50
50
V
XVIII.
XIX.
xx.
XXI.
XXII.
XXIII.
XXIV.
xxv.
XXVI.
XXVII.
Effect of Particle Size on Settling Rate of Crushed Granite
Effect of Size Distribution on Settling Rates of Unwelded
Ash Flow Tuff
Effect of Size Distribution on Expansion Ratio of Unwelded Ash Flow Tuff
Effect of Particle Size on Expansion Ratio of Unwelded Ash Flow Tuff
Horizontal Flow Velocities
Flow Properties of Fluidized Materials
Factors Affecting Travel Distance of Fluidized Materials
Summary of Low Pressure Fluidization Data of 37-53 mi- cron Catalyst at a Settled Bed Depth of 15. 5 cm
Summary of Low Pressure Fluidization Data of 37-53 mi-
cron FCCU Catalyst at a Settled Bed Depth of 28.9 cm
Summary of Low-Pressure Fluidization Data of 37-53 mi-
cron FCCU catalyst at a Settled Bed Depth of 29.8 cm
Page
50
53
53
53
56
58
65
74
75
76
vi

LIST OF ILLUSTRATIONS
Page
1. Glass Microspheres No. 4000 (Approx. 20 to 40 Microns) 10
2. Talc No. 325 (Smaller Than 44 Microns) 11
3. Granite Dust (63 to 74 Microns) 12
4. Fluid Catalytic Cracking Unit (FCCU) Catalyst, Unsized (Smaller Than 105 Microns) 13
5. F-2-25 Catalyst, Unsized (20 to 105 M,icrons) 14
6. Fluidized Ash Flow Tuff (Smaller Than 44 Microns) 15
7. Fluidized Ash Flow Tuff (Larger Than 6.35 mm) I. 6
8. Fluidized Ash Flow Tuff 590 to 840 Microns) 17
9. Rosin’s Law Applied to Granite and Ash Flow Tuff 29
10. Experimental Set-up for Studying Settling Rates of a Fluidized Bed 35
11. Effect of Particle Shape on Settling Rates 36
12. Effect of Column Weight on Back Pressure of Fluidized Granite Column 4.8 cm ID 38
c
13. Effect of Bed Depth on Settling Rate of Unsized FCCU Catalyst 39
14. Effect of Column Diameter on Settling Rates (Bed Material No. 2332. 5 Glass Microspheres) 40
15. Effect of Bed Expansion on Settling Rates (Bed Material No. 4000 Glass Microspheres) 42
16. Effect of Fluidizing Medium on Settling Rates 43
17. Minimum Mass Flow Rate (Gmf) as a Function of Particle Diameter,Glass Microspheres 46
vii

Page
18. Minimum Mass Flow Rate (Gmf) as a Function of Particle
Diameter - Unwelded Ash Flow Tuff 49
19. Effect of Particle Size on Settling Rate 51
20. Experimental Set-up for Determining Flow Properties of
Fluidized Materials 55
21. Flow Pattern of F-2-25 Catalyst (Unsized, 5-cm Drop Height) 60
22. Flow Pattern of Unwelded Ash Flow Tuff (All Particles Less
Than 125 CL, 11 -cm Drop Height) 61
23. Flow Pattern of No. 325 Talc (Unsized, 11-cm Drop Height) 62
24. Flow Pattern of Crushed Granite (Particles Less Than 44 ~4 325 Mesh, 11 -cm Drop Height) 63
25. Flow Pattern of F-2-25 Catalyst - Side Ejection 64
26. Flow Pattern of Unwelded Ash Flow Tuff - Side Ejection 64
27. Effect of Expansion Ratio, Particle Density and Settling
Rate on Travel Distance 66
28. Particle Fractionation Resulting From Fluidization of Ash Flow Tuff (Smaller Than 297 Microns) 68
29. Low Pressure Fluidization System 70
30. Mean Free Path of Nitrogen Molecules as a Function of Pressure 71
31. Effect of Vacuum on Expansion Ratio of FCCU Catalyst 73
32. Bed Expansion as a Function of Bed Depth at 1.0 Torr 77
33. Photograph of Stable Fluidization of FCCU Catalyst Under
Vacuum Conditions 78
34. Photograph of Erupting FCCU Catalyst Under Vacuum Condi-
tions 80
viii

ABSTRACT
Fluidized ash flow has been proposed in the literature (.5 and 6) as the volcanic means by which the lunar maria have been formed. If this process could be
reasonably established as the origin of the maria, then the Ranger and Sur- veyor program information could be more effectively interpreted and a bett.er foreknowledge of lunar landing conditions could be obtained. The program reported herein was undertaken to examine, in the laboratory, certain factors of fluidization which could lead to a relatively large-scale demonstration of fluidized ash flow. The program object was to select the best material for simulating lunar soils for such a demonstration and to ascertain the effect on fluidization of the hard vacuum of the lunar environment.
Talc, spent fluidized catalyst, high-porosity fluidized catalyst, granite dust, ash-flow tuff and glass microspheres were examined in laboratory fluidization equipment.to determine: a) the effect of size, size distribution, and shape on settling rate after fluidization vapor is cut off; b) the maximum. size which will permit satisfactory horizontal flow; and c) such physical data as voids fraction, surface area, density and bulk density of the materials. An examination was also made of the effect of vacuum on fluidization in the pressure region below about 4 torr where the mean free path of the gas is of the order of the particle size to determine: a) if fluidization is affected, b) the probable depth below the surface where fluidization is altered, c) the maximum gas flows allowable without violent bubbling and d) the effect on bed expansion and pressure drop through the bed.
It was concluded that the fluidization properties of various materials could be rated so that the best material for a large scale demonstration of fluidized ash flow could be made in the laboratory. The best material, judged by flowing the greatest distance, having the highest/travel velocity and the slowest settling rate is the F-2-25 catalyst. This material-will require no separation or grinding before use. The effects of,p&icle size and size distribution on fluidization were important and the/se are described in detail. The distance particles will flow correlates well with the factor of expansion ratio divided by particle density and settling rate.
It was established that low pressure, in the range where the mean free path of the vapor becomes larger than the particle dimensions, has a pronounced effect on fluidization. The maximum gas flow through the bed without violent bubbling is at least an order of magnitude less under these vacuum conditions
ix

than for fluidization at one atmosphere. The hypothetical distance below the
surface where fluidization can still occur in a vacuum is between about 4 to
8 cm for FCCU catalyst which was the easiest material to fluidize. Bed ex-
pansion ratio is decreased as the pressure is lowered near the critical point
and approaches unity (no expansion) rapidly below 1 torr. The ratio also is
decreased as the bed height is increased and at 1 torr it approaches unity between 40-50 cm of bed height. From all this, it is seen that in a fluidized
system of major dimensions, the effect of vacuum is to cause the top surface
to erupt into a dilute phase and to cause extensive elutriation. This dilute phase then falls back to the surface at the end of the eruption.
It is recommended that F-2-25 catalyst be used for a large scale demonstra- tion of fluidized ash flow and that recognition be given to the effect that vacuum has had on the mechanism of a lunar ash flow. This means that in addition
to possible dense phase flow, similar to terrestrial ash flows, lunar flows
must have been accompanied by an extensive dilute phase sent upward and fal-
ling back to the surface near and immediately following the end of the eruption.
Future problems which merit study, in addition to a large scale demonstration,
concern‘the effect of the dilute phase falling back to the moon and the nature of
the resultant surface which is formed. A suggested experimental program is
briefly outlined.
X

I. INTRODUCTION
A major goal of the National Aeronautics and Space Administration is a manned landing on the moon. One key question that requires answering before this attempt is made is how the landing will be affected by the nature and condition of the lunar surface. Until recently, the most definitive.knowledge of the lunar surface has come from the studies of the photometric curves of reflected sun- light and of radar-reflection data: These have given some ideas of the nature of the very outer surface in the centimeter and meter range. At slightly lower depths, which are regions of concern for the physical support of the manned landing spacecraft, the situation is less clear. In the maria, where landing is planned, it is not known whether the composition is powdery or hard, loosely compacted or dense. Instrument explorations via the Ranger and Surveyor pro- grams have been expected to eventually answer these questions. However, the Ranger pictures, while interpreted by many as indicating a satisfactory landing surface, are believed by some to show deep dust and an unsatisfactory surface. The pictures alone have not settled the controversy. The more recent Russian soft landing in the Sea of Storms has indicated, at least for that region, that a 100 kilogram sphere could be landed satisfactorily. It has not yet been estab- lished if deep dust was present or not. The Surveyor will, hopefully, establish the surface conditions, but to fully interpret the results, it will be of immense aid if a better understanding exists as to how the maria were formed.
Maria formation and conditions are described by a number of conflicting theories. These include formation by the flow of molten lava (Baldwin (1) ) , the melting of planetesimals (Urey (2) ), and deep dust that was transported from the highlands (Gold, (3) ). All of these theories have certain drawbacks. A more recent theory involves maria formation by the flow of fluidized ash. This concept has been tentatively indicated by Shoemaker and Hackman (4) and discussed in considerable detail by O’Keefe and Cameron (5)) and by O’Keefe and Adams (6) .
Fluidized-ash flow appears to much better explain the lunar features of the maria than any of the others. If this process can be reasonably established as the origin of the maria, then it will stand as a theory to be tested by the Surveyor program. Data obtained from these explorations can be more in- telligently interpreted as a result, and foreknowledge of lunar landing condi- tions will thereby be enhanced.
1

The current program was undertaken to examine, in the laboratory, certain
aspects of fluidization which could lead to a relatively large-scale demonstra-
tion of the flow of fluidized ash. In particular, it seeks to select those materi-
als most suitable for simulating lunar soils in a fluidization experiment and to
deduce the effect that the lunar hard vacuum will have on the fluidization pro-
cess.
A. MARIA FORMATION BY FLUIDIZED ASH FLOW
An excellent statement of the fluidized-ash-flow concept on the moon is given
by O’Keefe and Cameron (5)) who point out the similarities between the lunar surface and the comparatively recently recognized mechanism of the flow of
volcanic ash on earth. The latter has been extensively reviewed by Ross and Smith (7).
1. Flow of Terrestrial Ash
An ash flow is described by Ross and Smith as a “turbulent mixture of gas and
pyroclastic materials of high temperature, ejected explosively from a crater or fissure, that travels swiftly down the slopes of a volcano or along the ground surface. The solid material in an ash flow, although unsorted, is dominantly
of particles of ash size (less than 4.mm in diameter) but generally contains different amounts of lapilli and blocks. ” The deposit from an ash flow may be consolidated and is then known as an ash-flow tuff,. or it may be welded and is
then called a welded tuff.
Some of the early ,recognition of sand or ash flow was the volcanic action that occurred in the Katmai region of Alaska which gave rise to the “Valley of 10,000 Smokes”. Fenner (8) stresses the “remarkable character imparted
to the dust and gas mixture by the continuous evolution of gas which must not only have eliminated almost completely the contact friction of the particles
but also have tended to drive them apart somewhat forcibly and caused the mass to spread almost as freely as a true liquid. ” Griggs (9)) describing the same Katmai region, commented that “surrounded as it is by high rugged
mountains , the most striking feature of the conformation of the Valley of
10, 000 Smokes is the flatness of its floor. One could ride a bicycle for miles
along its smooth surface. Altogether it occupies an area of 53 square miles
(137 sq kin). ”
Single ash flows may be quite extensive, covering areas up to 10,000 square
miles at depths from 60 to 500 ft (150 meters). The flow around Lake Tobe,
2

Sumatra, is comprised of 2000 cubic kilometers of erupted matter (10). Dol- goff (11) traced individual sheets in the Pahranaget area of Nevada for 100 miles.
The speed of flow may be high, in the range of 60 to 100 miles per hour (7,
Pg 41) l At the edges, the flow conforms to the containing walls like liquid at
a shore line. Ash flow temperatures have been determined by Boyd (12) to be about 850°C. Heat is retained for long periods of time, and welding may take place, particularly in the middle. The top (and frequently the bottom) where heat escapes more readily, is less likely to be welded. The settling or collapse of the original porous structure is greatest where the ash is deepest, and, as Boyd has indicated, the surface tiill often tend to show the features of the covered surface below, although they would be diminished in height and depth.
2. Flow of Lunar Ash
In view of the above, the formation of lunar maria by the flow of fluidized ash seems to be a good possibility. Many features or observations of the moon are explainable by this mode, or at least are not in conflict with it.
a. Absence of Scarps. Scarps that are typical c& molten lava are not seen. Fluidized-ash laydown would not show sudden breaks at the terminus of flow.
b. Absence of Blocky Substrate. Radar data show smoothness of the order of meters or more deep, and basaltic flow would be expected to be blocky on this scale. Fluidized-ash laydown is consistent with radar results.
C. Ghost Craters. Ghost craters such as those seen, for example, in Mare Nectaris and Mare Humorum, are best explained by the flow of fluidi- zed ash. Pre-maria craters are believed to have been covered by the ash flow and their forms revealed by the settling and compaction of the ash.
d. Color of Maria. The relatively uniform color of individual mare is consistent with the uniform spread of fluidized material (uniform composi- tion is observed in terrestrial flows). Since the color appears to be of shallow depth, it is suggested by us (but with no present experimental evidence) that the color near the surface may have been caused by chemical reactions of escaping volatile9 that were associated with the fluidizing steam. In this connection, Urey (private communication) has pointed out the interesting five
3

or so dark spots that are visible on the floor of Alphonsus crater, where
volcanic gases (identified as containing C,) were observed by Kozyrov (13). Radiation darkening of the surface of ash-flow deposit should also be consider-
ed a possibility.
e. Comparative Age of Maria. The maria were apparently formed at about the same time, as indicated by Shoemaker’s and Hackman’s counts (14) of post-mare craters in all the major tunar dark areas. The random
craters showed the same frequency pattern in all areas (with the possible exception of Mare Crisium). The flow of fluidized ash from volcanic events
could probably take place over a comparatively short span of time.
f. Heat Balance. Ash flow would require less heat than lava flow, and this may be an important consideration in any re-examination of lunar
heat balance.
g- Feasibility of Fluidized Ash Flow. O’Keefe and Cameron (5) have
very clearly shown that lunar conditions of reduced gravity actually favor de- position of more extensive tuff from ash flow on the moon than under terres- trial conditions. Because of lower gravitational pull, the weight of the mate- rial to be supported is less, and the pressure and specific gravity are less at every depth. This means that less fluidizing gas is required, resulting in a factor of about 33 in favor of ash flow on ‘the moon.
B. EXPERMENTAL STUDY- AND DEMONSTRATION OF SIMULATED FLOW OF FLUIDIZED ASH
The flow of fluidized ash appears plausible as a phenomenon for formation of
maria, but it is believed that a convincing demonstration, and an experimental
establishment of certain facts, would lead to a more widespread acceptance of such a mechanism. For this reason the current program was undertaken.
1. Description of the Fluidization Process
Fluidization of particles is a well-known industrial technique used in such
instances as fluid transport of powders, dusts, and cereal grains. When
vapor is passed through a bed of particles in a tube at a velocity that is suf-
ficiently high, a condition known as incipient fluidization results. This occurs when the pressure-drop across the bed equals the weight of the bed divided
by the area. With a slight increase in velocity, the bed begins to expand, and
the particles tend to separate from each other and to rest on a cushion of
vapor. This reduces the interparticle friction substantially, and the resulting

bed of particl,es behaves as a fluid and has a characteristic viscosity. This
fluidized bed will “float” denser objects and will have flow characteristics that are very similar to a liquid. Over a certain range of velocity, the bed
and vapor will reach a more or less steady-state condition, and the viscosity of the fluidized bed will remain relatively constant.
At higher velocities, however, severe bubbling and slugging will take place,
and at still higher velocities, the bed will be lifted out of the tube.
Many variables affect the fluidization phenomena. These include the density,
size, size distribution, and shape of the particles; density, viscosity, and velocity of the fluid; the total pressure ; and the gravitational field. The effects
of many of the above factors are fairly well established for industrial proces- ses but they need to be re-examined in the unusual environment of the moon.
2. Problems in Demonstrating Ash Flow
For a flow on the moon which may be 100 meters or more deep, the fluidizing steam will undergo a substantial expansion and will increase in velocity as it rises toward the top. This driving f0rc.e (of pressure drop and vapor flow through the ash) is on such a large scale in nature that it is difficult to simu- late in a demonstration. Furthermore, the water is diffusing from the interior of the particles and being continually emitted as steam for a substantial period of time or may cause a vesiculation or a “popcorn” explosion of many of the particles. It is a simple matter to show fluid properties of a column of parti- cles in a container with fluidizing vapor being continuously passed upward through it. However, to demonstrate any extended horizontal travel of an. ash flow, which must contain its own fluidizing vapor and possess the requisite liquid-like properties, is somewhat difficult.
3. Possible Demonstration of Ash Flow
It occurred to us, however, that based on experience with a unique operation called the Texaco Fine Grinding Process, a demonstration might be possible. It was observed that if hot and very finely ground talc was accidentally spilled from the equipment, it flowed across the floor like a liquid.
In the Texaco process, after the material has been finely ground, it is trans- ported in super-heated steam to a cyclone, where excess steam is removed and the hot powder, still containing some dry superheated steam, is sent to a storage vessel or silo. There, because of the excellent thermal insulation
5

properties of the powder, it remains very hot for long periods of time. This
material could be used for a very effective demonstration of the flow of
fluidized ash.
4. Composition of Material for Fluidized Flow
Rather than talc, it would be preferred if the simulated ash flow could be made
with the same rock particle composition as occurs on the moon. Unfortunately,
this composition is not known, so it can only be assumed. O’Keefe and Came-
ron (5) have discussed the possibility of lunar granites and have given support
to the theory that tektites may come from the moon. The tektites are similar in a number of respects to earth granites but contain more quartz and, pre- sumably, have lost K,O and Na,O by some process. It is possible that this may have resulted from elutriation fractionation during ash-flow processes
on the moon. However, for the time being, granites or their volcanic equiva-
lents, rhyolites, appear to be among the better simulations to use. Actually, an ash-flow tuff from California, New Mexico, or Nevada would be an excellent
choice.
The Texaco fine-grinding equipment has handled such substances as talc,
kaolin, barites, limestone, coal, and feldspar (the latter is a granite com-
ponent) . Therefore, it could handle any desired rock. However, the fine-
ness of product is related to the size of crushed and powdered material charged
to it. .It would save considerable expense if fairly fine charge material were
already available. Talc and spent fluidized catalyst (sodium aluminum sili.cate) are available. It would be important, too, to know the maximum size of parti- cles which will permit satisfactory horizontal flow so as to minimize fine
grinding and more nearly simulate the sizes found in nature. Furthermore,
a technical problem exists. It is known that the finely ground talc can be used satisfactorily for the demonstration as far as the fluidized flow is concerned, but it is not completely certain that some other minerals will do as well.
Talc is in the form of small, flat platelets and, therefore, differs in its parti-
cle action from granites, for example, which are apt to be rough granules.
In view of the above, it was proposed to make small-scale fluidization studies of several materials, including talc, spent fluidized catalyst, high-porosity
fluidized catalyst, granite, and an ash-flow tuff to determine which shall be
used for the large-scale demonstration. Glass microspheres were included
to serve as a reference. The data from this study will hermit selection of the material to use for the large demonstration after consultation with the
NASA project scientists.
6

5. Effect of Vacuum on Fluidization
One of the chief technical questions that is raised when lunar fluidized-ash flows are considered is the effect of vacuum on the process. A sound argument can be made that the effect is essentially trivial for deep ash flows. The equation relating to the minimum flow of gas necessary to fluidize a bed actually derives from Poiseuille’s equations for capillary flow. However, this equation breaks down at very low pressures, where the meanfree path of the gas approaches the dimensions of the particles, and viscous tortes no longer act to support the particles. However, calculations by O’Keefe (private communication) indi- cate that the depth at which viscous forces begin to support the particles to be in the order of 5 cm or so below the surface. Therefore, in flows 100 meters deep, this will have insignificant overall effect. However, the top portion, no longer fluidized, would be expected to be blown upward by the rapidly expand- ing gases and form a dilute phase or cloud similar to the nuke ardente of the Mont Pelke eruption (15).
C. OBJECT AND SCOPE OF PROGRAM
The overall object of the program reported herein was to examine, in the laboratory, certain aspects of fluidization which could lead to a relatively large-scale demonstration of fluidized-ash flow such as may form the lunar maria. The specific objects were to select those materials most suitable for simulating lunar soils in a fluidization experiment and to deduce the effect that the lunar hard vacuum will have on the fluidization process.
The scope of the program involves:
1.1 The examination, on small laboratory fluidization equipment, of several materials including talc, spent fluidized catalyst, high-porosity fluidized catalyst, granite, ash-flow tuff and glass microspheres to determine:
a) Effect of size, size distribution, and shape on settling rate after fluidization vapor is cut off.
b) Maximum size which will permit satisfactory horizontal flow.
cl Physical data such as voids fraction, surface area, density, and bulk density.
7
24 The examination of the effect of vacuum on fluidization in the pressure
region where the mean free path of the gas is of the order of the parti- cle size to determine:
a) If fluidization is affected,
b) The probable depth below the surface where the fluidization is
altered,
4 Maximum gas flows allowable without violent bubbling, and
4 The effect on bed expansion and pressure drop through the bed.
D. ACKNOWLEDGEMENTS
The authors wish to acknowledge the effective laboratory work carried out by
Mr. Leigh R. Middleton, Research Technician, who performed the particle sizing and both the atmospheric pressure and vacuum fluidization experiments.
Our thanks is given to Barbara G. Fox and Thomas W. Langley for microphoto-
graphs of particles and to Bernard D. Von Cannon and Thomas E. Kagels for photographs of the fluidized-flow experiments.
8

II. EXPERIMENTAL WORK
A. MATERIALS USED IN FLUIDIZATION STUDIES
1. Particle Shapes
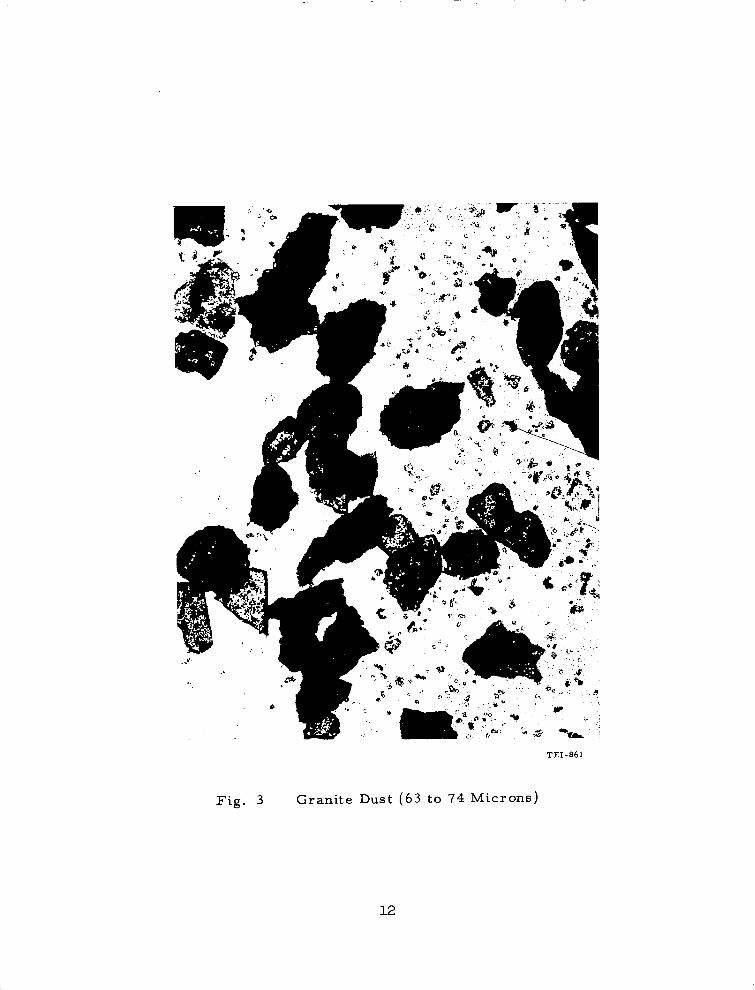
Materials for fluidization studies were chosen to represent a variety of shapes, porosities, and possible simulations of lunar soils. The nonporous materials were: glass microspheres (spherical) shown in Fig. 1, talc (flat particles) shown in Fig. 2, and granite dust (rough blocky) shown in Fig. 3. Porous materials were: fluid catalytic cracking unit (FCCU) catalyst (medium poro-
s ity - generally spherical) shown in Fig. 4, F-2-25 catalyst (high porosity - smooth irregular shape) shown in Fig. 5,. and fluidized-ash-flow tuff (low porosity - rough shape) shown in Fig. 6. This latter picture shows the shape of the small particles (below 44 microns) of fluidized-ash flow, and the gen- eral shapes are retained in the larger particles as well. Figure 7 shows re- presentative particles larger than 6.35 mm (l/4 in. ). These are smoothly rounded but generally vesiculated. Figure 8 shows particles in the 590 to 840 micron range. In this size, it is possible to see several types of parti- cles and, as will be of interest in a later section, it was found that the parti- cle densities also varied. The appearance and density are tabulated as follows:
Photo appearance Particle appearance Particle Density, g/cm3
Black Black, nonporous Dark brown, nonporous
2.37 2.40
White Translucent or clear, nonporous
2.55
Gray White, porous or vesiculated 1.43
2. Source of Materials.
The source of the materials is shown in Table I.
3. Particle Size and Distribution
The materials as received were analyzed for particle size distribution by standard sieve techniques. The screening was done by using a rotary tapping
9

Fig. 1
TEI-859
Glass Microspheres No. 4000 (Approx. 20 to 40 Microns)
10

P I ‘
Fig. 2 Talc No. 325 (Smaller Than 44 Microns)
TEI-861
Fig. 3 Granite Dust (63 to 74 Microns)
I2

Fig. 4
(Smaller Than 105 Microns) Fluid Catalytic Cracking Unit (FCCU) Catalyst, Unsized
13

-
1
, 4%
Fig. 5 F-2-25 Catalyst, Unsized (20 to 105 Microns)
14

-.---_--_
..e.d* ,
* .3
Fig. 6 Fluidized Ash Flow Tuff (Smaller Than 44 Microns)
15

Fig. 7 Fluidized Ash Flow Tuff (Larger Than 6. 35 mm)
16

Fig. 8 Fluidized Ash Flow Tuff (590 to 840 Microns)
-. .._ ..-.-. .- _._._- - ~

Material
Table I
MATERIALS USED IN FLUIDIZATION STUDIES
Glass microspheres No. 4000 No. 2332. 5
Talc (Steatite)
Granite Dust (Granite gneiss)
FCCU Catalyst Regenerated catalyst
(sodium aluminum silicate)
F-2-25 Catalyst (high alumina)
AlaO, 2870, SiOa 71.691
Unwelded Ash Flow Tuff From Bandelier Rhyolite
Tuff near Totavi, New Mexico
Source
Microbeads, Inc.
Jackson, Mississippi
Liberty Talc Mines, Inc.
Sykesville,
Maryland
Boscobel Quarries
M anakin, Virginia
Texaco Inc.
Los Angeles Plant
Wilmington, California
W. R. Grace and Co. Davison Chemical Division
Baltimore, Maryland
Obtained by Mr. Morris Estes Texaco District Office
Albuquerque, New Mexico
Sample location recommended by R. L. Smith, USGS and described in reference (16).
18

apparatus and standard screens which were chosen from the series shown in Table II. For particles smaller than 400 mesh (37 microns), special micro- screens made by Buckbee Mears* (30, 20, 10, and 5 microns) were used. In a number of instances where narrow-size cuts or blends of cuts were used in the fluidization studies, sufficient amounts of materialewere screened to provide the desired quantities. In the case of granite< it was necessary to grind material in a ball mill to obtain enough of some of the smaller sizes.
Two samples of glass .microbeads were obtained (No. 4000 and No. 2332.5). The sieve analyses are given in Tables III and IV. Both are fairly narrow cuts containing predominantly 37 to 30 micron beads with the No. 4000 sample having some material smaller, and the No. 2332. 5 having some material both larger and smaller. The No. 2332.5 sample was used as-received for several experiments , and substantial portions werescreened to obtain individual nar- row cuts to determine the effect of size on-certain variables.
The analysis of the No. 325 talc is given in Table V. The major portions were between 44 and 20 microns. No separation was carried out.
The size distribution of the crushed granite dust as-received is shown in Table VI. A synthetic mixture of cuts (Granite Mix No. 1) was prepared to essentially duplicate the size distribution of FCCU catalyst to be described below. The composition of the mix is given in Table VII.
Two samples of synthetic catalyst employed in fluidized beds for petroleum processing were used. The FCCU catalyst (Table VIII) had been regenerated after use in catalytic cracking operations and contained only moderate particle porosity but the particles were well rounded. The size distribution was re- latively similar to the new catalyst F-2-25 (Table IX). The new catalyst was of different chemical composition, contained a higher degree of particle porosity, and was more irregular in shape.
The screen analysis for the unwelded-ash-flow tuff is given in Table X. The size distribution in ash flow is of considerable interest. Published data are few, but Moore (17) indicated that the distribution of nuke ardente deposits from the Crater Lake region appeared to follow Rosin’s law (18). This law has been of use in the study of crushed materials, especially coal, and is usually given in the form
R = 100 e-(x/k)n
* Buckbee Mears Co., St. Paul, Minn.
19

Table II
SCREENS USED FOR PARTICLE SIZING
Nominal Dimensions Based on ASTM Fine Series Specifications (E 11-58T)
Size or Sieve (Mesh) Designation
Microns Number mm ln. -
5660 4760 4000 3360 2830 2380 2000 1680 1410 1190 1000
840 710 590 500 420 350 297 250 210 177 149 125 105
88 74 63 53 44 37
3-l/2 4 5 6 7 8
10 12 14 16 18 20 25 30 35 40 45 50 60 70 80
100 120 140 170 200 230 270 325 400
Special Sieves (Buckbee-Mears)
5.66 0.223 4.76 0.187 4.00 0.157 3.36 0.132 2.83 0.111 2.38 0.0937 2.00 0.0787 1.68 0.0661 1.41 0.0555 1.19 0.0469 1.00 0.0394 0.84 0.0331 0.71 0.0280 0.59 0.0232 0.50 0.0197 0.42 0.0165 0.35 0.0138 0.297 0.0117 0.250 0.0098 0.210 0.0083 0.177 0.0070 0.149 0.0059 0.125 0.0049 0.105 0.0041 0.088 0.0035 0.074 0.0029 0.063 0.0025 0.053 0.0021 0.044 0.0017 0.037 0.0015
30 0.030 0.0012
20 0.020 0.0008
10 0.011 0.0004
5 0.005 0.0002
Sieve Opening
20

Table III
SIEVE ANALYSIS OF NO. 4000 GLASS MICROSPHERES
200 gm sample
Particle Size, p
‘53
53 -44
44-37
37-30
30-20
20-10
10-5
<5
Wt. Percent
0
0.30
2. io
76.50
19.47
0.97
0
0
Table IV
SIEVE ANALYSIS OF NO. 2332.5 GLASS MICROSPHERES
Particle Size, p
‘62
62-53
53 -44
44-37
37-30
30-20
20-10
10-5
<5
Wt. Percent
0.67
0.35
1. 52
16.02
72.50
9.10
. 48
0
0
21

Table V
Particle Size, F
> 88
88 - 74
74 - 62
62 - 53
53 - 44
44 - 37
37 - 30
30 - 20
20 - 10
10 - 5
<5
SIEVE ANALYSIS OF NO. 325 TALC
200 gm sample
Weight Percent
0.40
0.98
2.03
1.93
7.65
11.55
36.95
31.11
5.15
0
0
22

Table VI
Particle Size, p
>4760
4760 - 2000
2000 - 840
840 - 590
590 - 420
420 - 210
210 - 149
149 - 105
105 - 74
74- 63
63 - 53
53 - 44
< 44
SIEVE ANALYSIS OF CRUSHED GRANITE DUST 200 gm sample
Avg. Particle Size. mm
> 4.76
3.38
1.42
0.718
0.575
0.315
0.1795
0.127
0.0895
0.0685
0.058
0.0485
< 0.044
Wt. percent
1.15
25.75
26.70
8.25
9.80
9.90
4.25
2.90
2.85
1.50
0.20
1.10
5.15
Cumulative Wt. per.cent
1.15
26.90
53.60
61.85
71.65
81.55
85.80
88.70
91.55
93.05
93.25
94.35
99.50
23

Table VII
COMPOSITION OF GRANITE MIX NO. 1 r
Particle Size, p
125 - 105
105 - 88
88 - 74
74 - 63
63 - 53
53 - 44
44 - 37
< 37
Weight Percent
1:2
3.2
8.0
14.8
0.9
30.9
12.8
27.7
24

Table VIII
SIEVE ANALYSIS OF FCCU REGENERATED CATALYST 200 gm sample
Particle Size, p Weight Percent
> 420 0.05
420 - 297 0.08
297 - 250 0.10
250 - 210 0.13
210 - 177 0.10
177 - 149 0.18
149 - 125 0.23
125 - 105 0.60
105 - 88 3.20
88 - 74 7.98
74 - 63 14.53
63 - 53 0.93
53 - 44 30.90
44 - 37 12.68
< 37 27.68
25

Table IX
SIEVE ANALYSIS OF F-2-25 CATALYST 200 gm sample
Particle Size, p
> 297
297 - 250
250 - 177
177 - 149
149 - 125
125 - 105
105 - 88
88 - 74
74 - 63
63 - 53
53 - 44
44 - 37
37 - 30
30 - 20
20 - IO
10 - 5
<5
Weight Percent
0
0
0
0.15
0.28
0.93
3.08
7. 25
25.03
1.50
17. 23
19.43
21.22
2. 28
0.48
0
0
26

Particle Size, p
> 12,700
12.700 - 6,350
6,350 - 4,760
4.760 - 2.000
2,000 - 840
840 - 590
590 - 420
420 - 297
297 - 250
250 - 210
210 - 177
177 - 149
149 - 125
125 - 105
105 - 88
88 - 74
74 - 62
62 - 53
53 - 44
44 - 37
37 - 30
30 - 20
20 - 10
10 - 5
<5
Table X
SIEVE ANALYSIS OF UNWELDED ASH FLOW TUFF 200 gm sample
Avg. Particle Size, mm
> 12.7
9.525
5.555
3.380
1.420
0.715
0.505
0.3585
0.2735
0.230
0.1935
0.163
0.137
0.115
0.0965
0.0810
0.0680
0.0575
0.0485
0.0405
0.0335
0.0250
0.0150
0.0075
< 0.005
Weight, gm Weight Percent
3.03 1.52
3.48 1.74
3.07 1.53
13.50 6.75
36.20 18.10
16.40 8. 20
18.80 9.40
10.00 5.00
5.20 2.60
5.60 2.80
5.10 2.55
7.35 3.68
5.20 2.60
4.60 2.30
7.70 3.85
7.00 3.50
6.60 3.30
1.70 0.85
7.55 3.78
5.55 2.78
9.13 4.56
6.82 3.41
5.83 2.92
0.22 0.11
0. 0.
Cumulative Weight Percent
1.52
3.26
4.79
11.54
29.64
37.84
47.24
52.24
54.84
57.64
60.19
63.87
66.47
68.77
72.62
76.12
79.42
80.27
84.05
86.83
91.39
94.80
97.72
97.83
0.
27

where R is the weight percent retained on a screen of mesh x, and k and n are constants for any given material.
A good discussion of this law and its application to sediments and the natural disintegration of rock sources by crushing or random breakage of the mate- rial is given by Krumbine and Tisdel (19). If the cumulative weight percent is plotted versus particle size, using an empirical scale developed by Geer and Yancy (20), those materials following Rosin’s law will give a straight line. This is illustrated by Fig. 9. Crushed granite (Table VI) shows es- sentially a straight line and follows Rosin’s law. The unwelded-ash-flow sample examined in this program, however, does not follow the law. The full range material and a heart cut made by excluding large and small parti- cles (Tables X and XI) both show distinct curvature. They indicate a higher proportion of small-particle size material than would be expected from natural crushing. It is believed possible that this is caused by the relative friability of the porous tuff and the tendency to break more readily into smaller particles during handling and screening.+
4. Physical Measurements of Particles
In addition to particle size, a number of physical measurements were made to help characterize the various particles. Pore volume and surface area were measured by the BET nitrogen absorption method+:: and the material density (skeletal density) was determined by isopropyl alcohol displacement after drying for 1 hour at 400°C. From these data, the particle densities of porous materials were calculated. Bulk densities were obtained in the flu- idization columns. The bulk densities (BD) and resultant void fractions were measured under three bed conditions: packed, settled, and fully ex- panded. This was done by weighing the materials into a fluidization column of known diameter and measuring the height in the column under the three conditions.
Summary physical data are given in Table XII and the detailed data of bulk density determinations for settled and expanded beds are given in Table XIII.
In the summary table, the pore volumes (cm3/g) of the three porous materials are shown. This information, together with the material density (solid material
9,: A subsequent screen analysis made with an Allen-Bradley Sonic Sifter under conditions to eliminate any particle breakage shows the same curvature as Fig. 9 and verifies a high proportion of small particles in the ash-flow tuff.
:k:Z Brunauer, Emmett and Teller (Ref 21). See also (22) for detailed description.
28

99
95 s
g so W ii
2 80
$ 70
: 60 5 50 u 40
30 20
IO
2
UNWELDED ASH FLOW TUFF
0 HEART CUT
0 FULL RANGE
CRUSHED GRANITE
6
Fig.
2 1.0 0.8 0.6 0.4 0.2 _ 0.1 0.08 0.06 0.04 0.02
DIAMETER, mm
Rosin’s Law Applied to Granite and Ash Flow Tuff
29
-

Table XI
SIEVE ANALYSIS 0~ UNWELDED ASH-FLOW TIFF (HEART CUT)
Adjusted by Removing Very-Large and Very-Small Particles
Avg. Particle Size, mm
3.380
1.420
0.7.15
0.505
0.3585
0.2735
0. 230 5.60 3.42
0.1935 5.10 3. Pl
0.163 7.35 4.49
0.137 5.20 3.17
0.115 4.60 2.81
0.0965 7.70
0.0810 7000
0.0680 6.60
0.0575 1.70
0.0485 7.55
Weight, gm
13.50
36.20
16.40
18.80
10.00
5.20
Weight Percent
8.22
22.07
10.00
11.45
6.09
3.17
4.70
4.26
4.03
1.03
4.60
Cumulative Wt. Percent
8.22
30.29
40.29
51.74
57.83
61.00
64.42
67.53
72002
75.19
78000
82.70
86.96
90.99
92.02
96.62
100.00 0.0405 5.55 3038
30

41 LO .?.I6 0
2.03 0
2.57 0
2.455 0.28
2.358 0.88
2.473 0.06
0 2.40 - 1.37 0.418 1.21 0.513 I.O.2 0.509 1.19
53 10 0 1.83 5.0 0.85 0.700 0.655 0.769 0.313 0.868 1.76
1.0, 0.681 0.95 0.63 1.05 0.592 0.00 0.658
0 2.5, 1.1 1.x 0.525 1.03 0.599 0.85 0.669 0.98 0.619 0.16 0.101 0.93 0.638 0.7' O.-/L, 0.90 0.650 0.72 0.72
00 110 110 LOO 270 325
100 17, 119 I. 13 I. L9 1.21 I.29 1.31 1.25
400(a) 105 X7(=’ 0.40, 1.455 1s 0.95 0.0, 0.669 1.2,
110 105 LO 0.675 0.76, 423 0.51 0.440 0.269 1.61
Unwelded A.b Blow Tdl
120 125 5 0.129 2.154 1.3 0.945 0.164 0.52, 1.15

Table XIII
BULK DENSITY (gm/cm’) OF FLUIDIZED MATERIALS
No. 2332.5 Glass Microspheres No. 325 Talc
Settled Expanded Bed Bed
1.22 1.01
1.21 1.01
1.22 1.04
1.21 1.02
1.22 1.01
1.22 1.05
1.22 1.12
1.16 0.96
1.18 0.96
Avg. 1.21 1.02
Settled Bed
7 0.685
0.66
0.65
0.646
0.632
Avg. 0.655
F-2-25 Catalyst (Unsized)
Settled Bed
0.448
Expanded Bed
0.269
Unwelded Ash Flow Tuff (5-125 p)
Settled Expanded Bed Bed
0.785 0.525
0.764 0.518
0.755 0.527
0.767 0.531
0.750 0.535
Avg. 0.764 0.527
Expanded Bed
0.392
0.37
0.366
0.364
0.374
0.373
Regenerated FCCU Catalyst (Unsized)
Settled Expanded Bed Bed
0.88 0.673
0.83 0.66
0.816 0.666
0.812 0.671
0.810 0.675
Avg. 0.83 0.669
32

only) permits calculation of the particle voidage (void fraction in the particle) and the particle density. The F-2-25 catalyst contains 67.5 volume percent
voids within the particles and thus has a particle density of only 0.767 g/cm3. The FCCU catalyst has moderate porosity (40.7 percent) with a particle den- sity of 1.455, and the ash-flow tuff has a lower porosity (12.9 percent) with a density of 2. 154. The other materials have no porosity so the particle den- sity is the same as the material density.
The surface area (square meters per gram) is 423 for the porous F-2-25. catalyst and 75 for the FCCU catalyst. Surprisingly, the ash-flow tuff has a surface area of only 4.3, comparable to the granite and talc areas of 4.4 and 5.3, respectively. This may reflect a relatively smooth surface similar to a glazed or glassy material. The area is not necessarily related to porosity and that of the tuff is distinctly different from those of the synthetic catalysts.
The void fraction in settled and expanded beds increases with decreasing ‘particle size. This may be seen in Table XII in the case of granite. The bed expansion ratio also increases with decreasing particle size.
33

B. SETTLING RATES
One of the first properties to be considered in attempting to define the impor- tant flow properties of a fluidized material is that of settling rate. The abil- ity of a material to flow depends to a large extent on how long the material remains in a fluidized state. A knowledge of settling ratess and the factors affecting settling rates9 should supply- this information. Apparatus used in obtaining settling rate data is shown in Fig. 10. It consists of a vertical glass tube - the fluidizing column - in which the materials are fluidized and the actual settling rates determined, and an associated gas metering system. The fluidization column is 4. 8-cm ID and 120-cm long. A fritted glass disc, having a porosity of 25 to 50 microns, sealed into the tube near one end served to support the bed material and to disperse the incoming gas. Gas flow was controlled by sonic orifice flowmeters. These devices deliver a constant mass flow of gas which is dependent only on the upstream pressure of the gas. Variations downstream of the orifice do not affect the mass flow of gas through the orifice so long as the pressure drop across the orifice is at least 2:l. Unless otherwise noted, dry nitrogen was used as the fluidizing medium throughout the investigation. A filter over the upper end of the fluid- ization column prevented elutriated particles from being discharged into the laboratory. All materials were dried in a vacuum oven before use. In a typical run, a weighed amount of the material under investigation was placed in the fluidization column and the flow of gas through the column gradually in- creased until the material became fluidized. Gas flow was adjusted to pro- duce maximum expansion of the material without excessive slugging or bub- bling . ‘Once stable fluidization of the column was obtained, the gas flow was diverted from the fluidization column by means of a three-way electric solo- noid valve and the time required for the column to settle a given distance was determined. Settling rates were obtained from a plot of decrease in columnhelg)lc as a function of time. For each test, the weight of material used, the ex- panded and settled bed heights, the flow rate of gas, and the settling rate were recorded.
Figure 11 shows typical settling rate plots for the various materials used in this investigation. All measurements were made at 1 atmosphere pressure and at room temperature. Although size distributions vary somewhat from one material to another9 the range of sizes is approximately the same for all materials used in Fig. 11. The effect of particle size and size distribution will be discussed in detail later. As can be seen from the graph, settling rates vary considerably from one material to another. For example, glass microspheres have a settling rate of 0. 33 cm/set while granite of compar- a.ble size settles at a rate of 1. 8 cm/set. Other materials fall between these values. In general9 materials composed of smooths rounded particles
34

EXHAUST
1
FILTER
COLUMN
SONIC ORIFICE FLOW METER
e PRESSURE REGULATOR
3 - WAY SOLENOID VALVE
TEI - IOSI
Fig. 10 Experimental Set-up for Studying Settling Rates of a Fluidized Bed
35
DRY NITROGEN

3
4
5
6
17
I8
19
20
21
22
D~t-l” TCUDFRATIIRF ‘s I.““... . b”.. b..r.. 1n.m
-\
I ATMOSPHERE P;RESSURE -\ --.
NITROGEN CARRIER
I-
---
I I I I I I I LrEklll29 1\
0 5 IO I5 20 25 30 35 40 45
TIME, sec. EXPANSION RATIO INITIAL SETTLING RATES,
cm/set
l - GLASS MICROSPHERE, NO.4000 1.2 0.33
n- FCCU CATALYST, UNSIZED 1.3 0.65
0 - TALC, NO. 325 I.7 I.6
X- GRANITE, MIX NO.1 1.3 I.8
- F-2-25 CATALYST, UNSIZED I.6 0.55
- ASH FLOW TUFF, < 125~ 1.4 0.73
Fig. 11 Effect of Particle Shape on Settling Rates
36

fluidize more uniformly and with greater ease and give slower settling rate than the more irregular, sharp-edged particles. In addition, the settling rates of these materials were linear over most of the settling distance, while in the more irregularly shaped materials (granite and talc), settling rates are rapid at first and decrease with time. This variation in settling rates is apparently related to the manner in which fluidization in these materials occurs. Instead of a uniform fluidization throughout the bed, where each particle is separated from its neighbors, granite and talc parti- cles tended to agglomerate into rather large masses. These larger masses would be expected to have faster settling rates.
One of the conditions necessary for fluidization is that the back pressure of the gas at the bottom of the column must equal the pressure due to the weight of the column. Because of the difficulty of obtaining uniform fluidization of granite particles, several comparisons of back pressure and column pres- sures were made to determine whether or not conditions were satisfactory for fluidization. In each case tested, the back pressure equaled or slightly exceeded the column. For example, 1000 grams of granite in a 5. O-cm ID column:: exerts a pressure of 0. 113 lb/cm’. The back pressure of the fluid- izing gas was measured and found to be 0. 112 lb/cm”. The agreement is quite good and indicates the conditions were satisfactory for fluidization of the bed. A plot of back pressure as a function of column weight for granite is shown in Fig. 12. Little dependence was observed on particle size. The pressure gradient in the fluidized granite bed was 0. 64-mm Hg per centi- meter depth.
The effect of bed depth on settling rates was investigated for a number of different materials. The purpose of these experiments was to determine the feasibility of extrapolating the present data to beds of greater depth. Results obtained with the FCCU catalyst are shown in Fig. 13. The data are quite consistent and show that, with the exception of the very shallow bed, the settling rate of the bed is independent of bed depth. Results also show that expansion ratios (height of expanded column to settled column), which in this case were of the order of 1. 3, were also unaffected by bed depth. Sim- ilar results were obtained with other materials used.
The effect of column diameter on settling rates is shown in Fig. 14. For the present studies, it was desirable to use as small a diameter column as possible to minimize the amount of material required for the individual tests. At the same time, it was important t.o use a column large enough in diameter so that wall effects would be insignificant. Comparative tests were conducted in 4.8-cm and 6. 3-cm ID columns using glass microspheres as the bed mate- rial. No difference in settling rates’in the two columns was detected, indi- cating that the 4.8-cm ID column used in most of the experiments, was sufficiently large to eliminate any appreciable wall effects.
+ A 5. O-cm ID column was used in early work with granite.
37

0 <44p 2- . 44-53/L
0 63-74~ I 88-105~
1 A 105-125~ I- A MIX NO.1
+ DISC ONLY AP=0.64 mm Hg/cm BED HEIGHT
s - 0 100 200 300 400 500 600 700 800 900 1000
WEIGHT OF COLUMN, gms
Fig. 12 Effect of Column Weight on Back Pressure of Fluidized Granite Column 4. 8-cm ID

j-
0008AA COLUMN HEIGHT, SETTLED, cm 7.3 14.6 20.9 37.2 59.3 62.1 COLUMN HEIGHT, EXPANDED, cm 9.2 18.9 27.0 48.2 74.0 81 J EXPANSION RATIO 1.26 1.29 1.29 1.29 1.25 I. SETTLING RATE, cm/set 0.54 0.65 0.65 0.65 0.65 0.
ROOM TEMPERATURE I ATMOSPHERE PRESSURE NITROGEN CARRIER
; o- 30 65
1 I I I I I I TEI-I!
-- -- -- -- IO I5 20 25
TIME, set
.
Fig. 13 Effect of Bed Depth on Settling Rate of Unsized FCCU Catalyst
39

73
72
71
70
69
60
$ 67 I-- g 66
3 65 s 3 64
’ 63
62
61
60
59
58
III III I III Ill I III I II
a 0 COLUMN DIAMETER, cm. 4.8- 6.3 SETTLING COLUMN DIAMETER, cm. 4.8- 6.3 SETTLING RATE, cm/set 0.24 0.25
- ROOM TEMPERATURE ROOM TEMPERATURE I ATMOSPHERE PRESSURE I ATMOSPHERE PRESSURE NITROGEN CARRIER NITROGEN CARRIER
024 6 8 IO I2 14 I6 I8 20 22 24 26 28 30 32 34 36 38 40 42 44
TIME, sec.
Fig. 14 Effect of Column Diameter on Settling Rates (Bed Material No. 2332. 5 Glass Microspheres)
40

Figure 15 shows the effect of bed expansion on settling rates. For a given bed, it is possible to control the amount of bed expansion to some extent by regulating the flow of the fluidizing medium. When the pressure drop across the bed is equal to the weight of the bed, the bed becomes fluidized. Further increases in flow cause additional bed expansion. At some point, expans ion will cease and large gas bubbles will begin to form in the bed and rise to the surface, producing a rather violent boiling or slugjing effect. In deter- mining settling rates, it is important to know the effect of bed expansion on these rates. Figure 15 shows the results of this study. Glass microspheres were used as the bed material. Below the point at which slugging occurs, settling rates are linear over most of the settling distance and increase slightly with increasing expansion. When the bed is expanded to the point of slugging, the settling rate is quite rapid at first and decreases with time. Thus, in studying settling rates, it is important to know the expansion ratio for which the settling rate was determined. Unless otherwise stated, all settling rates in this investigation were determined at maximum bed expan- s ion without s lugging.
The effect of changing the fluidizing medium is shown in Fig. 16. Here, nitrogen was replaced with argon and the effect on settling rates determined. Settling rates in an argon atmosphere were faster than those in a nitrogen atmosphere (0.43 cm/set for argon compared with 0. 37 cm/set for nitrogen). These results are in general agreement with Leva’s equation (23) and in- dicates that a greater mass flow of argon is required to fluidize a given bed than nitrogen.
According to Leva, the minimum flow rate Gmf (gm/cm”-set) to fluidize a powder is given by:
G mf = 1. 09 x I O-3 DpleE2 (of p, g )“.94
0.88 CL
. . . . where D
(gm/cm3)1 ps P
is the particle diameter (cm), pf is the density of the fluid is the density of the solid particle, g is the acceleration of
gravity (cm/sec2), and p is the viscosity of the fluid (poises = gm/cm-set). For a given powder, this reduces to
G mf z
K pf o.94 0.88
P
41
t
i -..

81
80
79
78
77
76
75
69
68
67
66
65
64
l ,“““I”““““““’ ‘,a \ .- EXPANSION RATIO = 1.35
\ \ X - EXPANSION RATIO =I.30
o- EXPANSION RATIO =I.25
ROOM TEMPERATURE
I ATMOSPHERE PRESSURE NITROGEN CARRIER
TEI-802
11111111111111111111~ I 0 I 2345678 9 IO II I2 I3 I4 I5 I6 I7 I8 I9 20 21 22 23
TIME,sec
Fig. 15 Effect of Bed Expansion on Settling Rates (Bed Material No. 4000 Glass Microspheres)
42

0
2
E 0 . 4 !i 52 W I
6
- FLUIDIZING MEDIUM
0 NITROGEN
0 ARGON -
SETTLING RATE --
0.37 cm/set
0.43 cm/see
EXPANSION RATIO
:::: _
ROOM TEMPERATURE
I ATMOSPHERE PRESSURE FCCU CATALYST (*53/d
I4 I I I I I I I I I I I 1 TM-73 Ll 0 2 4 6 s IO I2 I4 I6 I8 20 22 24
TIME, see
Fig. 16 Effect of Fluidizing Medium on Settling Rates
43

Using the values at 25°C:
Pf = 1.146 x low3 gm/cm3 and TV= 177.8 x lo-& poises for nitrogen
Pf = 1. 634 x 10e3 gm/cm3 and ,JL= 226.2 x 10m6 poises for argon
we find that the ratio
G,f (nitrogen)
G mf (argon)
(pn) O’ * (pa) Om8’ = (Pa)o** (,+)“-8g =
This means that a greater mass flow of argon is required to fluidize a given
bed than nitrogen. This would imply that the settling rate in argon should be faster than the settling rate in nitrogen. This was found to be the case. The
ratio of Settling rates, SR, determined experimentally, is:
SR (nitrogen) = 0.37 cm/set
0.43 cm/set = 0.86
SR (argon)
The agreement is quite good.
Leva’s equation, as given above, relates the minimum mass flow for fluidi- zation to particle size. It is of interest to compare the minimum mass flow
and also the mass flow actually used to maintain steady fluidization (with near maximum bed expansion) with particle size. This has been done with the glass microspheres and with unwelded ash-flow tuff, using nitrogen gas at
25°C and 1 atmosphere. Employing a glass particle density of 2.48 gm/cm, and the nitrogen density and viscosity previously stated, the expression for
the microspheres reduces to:
G,f = 5.697 Dplo8 ’
The calculated minimum flow rate for five sizes of spheres, the experi-
mentally determined minimum flow, and the actual flow rate to maintain ex- panded bed fluidization are tabulated in Table XIV and the resuits shown
graphically in Fig. 17. The minimum flow was determined by gradually
increasing the gas flow through the settled bed until the observed pressure
drop no longer increased. At this point, the bed just began to expand.
Minimum flow was measured with only two sizes of particles, but results were repeated several times and the values checked very well. The meas - ured G,f for the two sizes agree fairly well with the calculated values and
the two curves have the same shape.
44
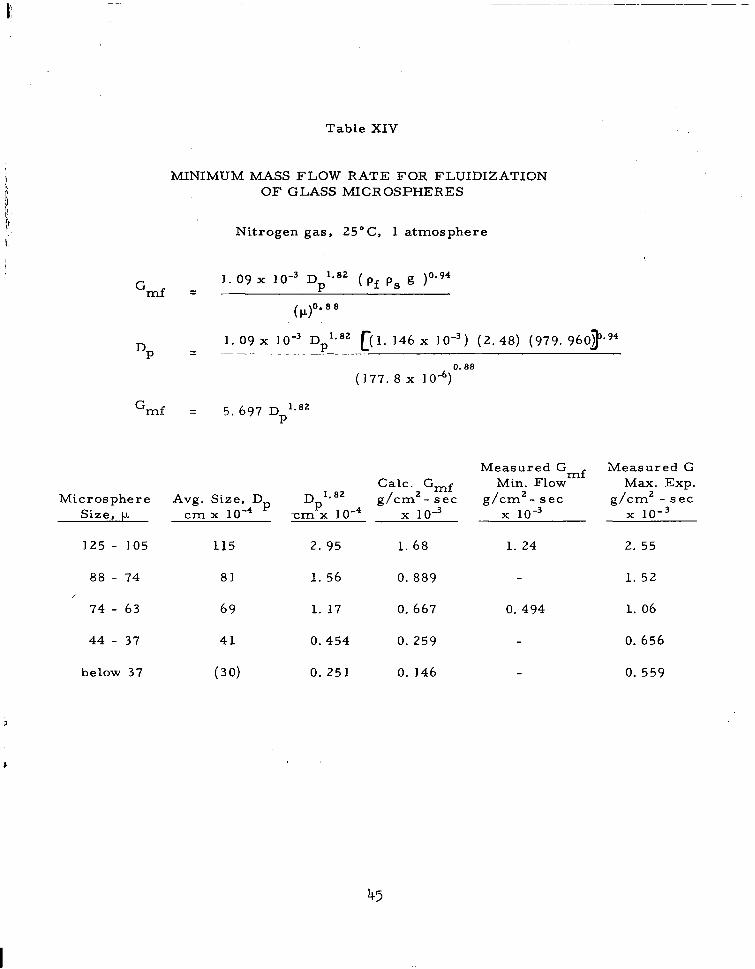
G mf
DP
G mf
Table XIV
MINIMUM MASS FLOW RATE FOR FLUIDIZATION OF GLASS MICROSPHERES
Nitrogen gas, 25”C, 1 atmosphere
1. 09 x 1O-3 Dpl**’ ( pf p, g )“‘94
(4 0.8 8
1. 09 x IO-3 Dpl*” [( 1. 146 x 10-3) (2. 48) (979. 960j’.94 .__-. -
0. aa (177. 8 x IO”)
5. 697 D 1.a2 P
Calc. G,f Measured Gmf
Min. Flow Microsphere Avg. Size, Dp Dpl*” g/cm2- set g/cm2- set
Size, t.t cm x 10m4 -cm x low4 x 1o-3 x 1o-3
125 - JO5 115 2. 95 1. 68 1. 24
88 - 74 81 1. 56 0.889
74 - 63 69 1. 17 0.667 0.494
44 - 37 41 0.454 0.259
below 37 (30) 0.251 0.146
Measured G Max. Exp.
g/cm2 - set x 1o-3
2. 55
1. 52
1. 06
0.656
0.559
45

Io-3xlc
8
6
4
1 -1 7
GLASS MICROSPHERES, DENSITY 2.48 pm/cm3 NITROGEN GAS, 25 OC, I atm
0 MASS FLOW RATE FOR MAXIMUM EXPANSION
cl MEASURED Gmf
A CALCULATED Gmf
I I
TEI-1134
IO 20 40 60 ‘00
PARTICLE SIZE, microns
200
-
Fig. 17 Minimum Mass Flow Rate (Gmf) as a Function of Particle Diameter - Glass Microspheres
46

In the case of the flow to maintain maximum expansion, the curve for the larger size particles appears to follow the same slope and relationship, but for smaller sizes, the agreement is less satisfactory and this is believed to be caused by the tendency for the smaller particles to agglomerate. Under these circumstances, individual particle size tends to lose its meaning. This has been observed by others (24) who report that for synthetic cracking catalyst, the 10 TV size has severe cohesion and balling, the 25 i.~ size has cohesion but balling is not too apparent, and that the 40 i.~ size and above gives good fluidization.
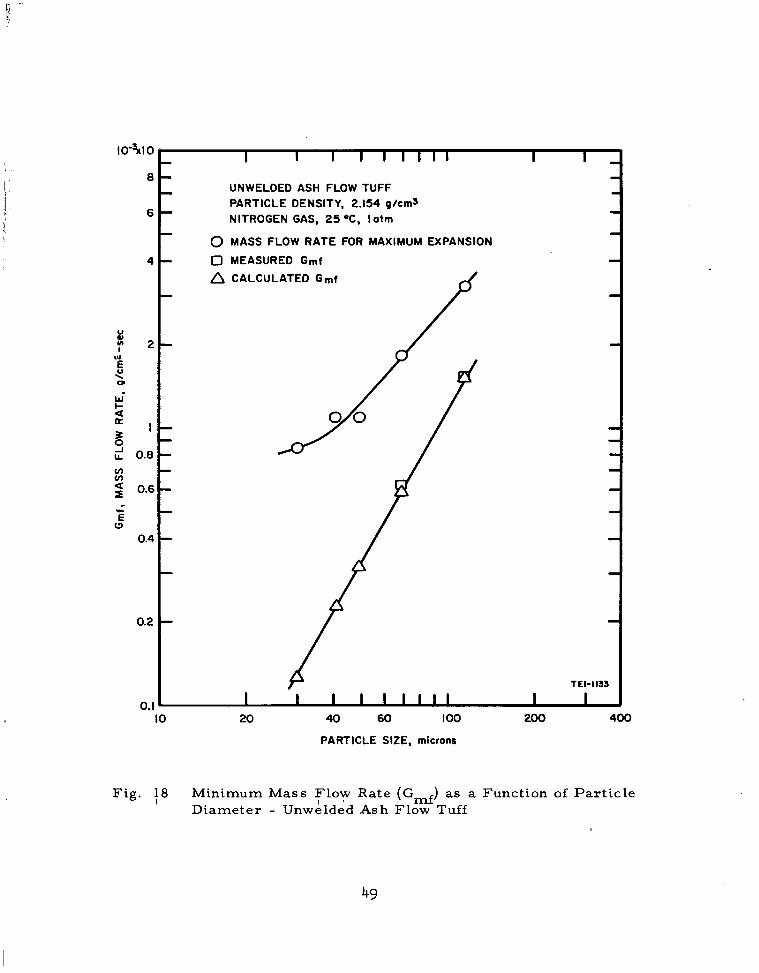
Similar results are shown with the unwelded ash-flow tuff. Using a particle density of 2. 154 g/cm3, the minimum mass flow becomes:
G mf = 4. 990 Dp l-82
The calculated Gmf, the measured Gmf, and the mass flow for maximum expansion are shown in Table XV and Fig. 18. For the two values of measured minimum flow, the agreement with the calculated values is excel- lent. Once again the flow to maintain maximum expansion appears to follow the same general slope for larger particles but deviates appreciably at smaller sizes, presumably due to agglomeration.
It is interesting to compare the flow rates for the irregularly shaped ash-flow particles to the spherical-glass particles. Although the calculated Gmf for ash flow is less than that for the glass because of the lower particle density, the measured Gmf required and the measured mass flow for expanded bed is greater for the ash flow. Using the data for the larger particle size
(115 P ) , where the correlation appears best, it may be seen that the ratio for G,f of ash flow to glass spheres is 1. 533/l. 24 = 1. 24 and the ratio of G (expanded bed) for ash flow to glass spheres is 3. 2/2. 55 = 1. 25. It may also be noted that the ratio of mass flow for the fully expanded bed to the minimum flow for the ash flow is 3. 2/l. 533 = 2. 09 and for the glass spheres is 2. 55/l. 24 = 2. 05. The various ratio for smaller size particles differ from the above, possibly because of agglomeration problems.
One might expect a similar relationship to hold between settling rates and particle diameter, although the results are known to be affected to some extent by the amount of expansion of the bed.
Results of studies of the effect of particle size on settling rates are shown for glass microspheres (Table XVI) for ash-flow tuff (Table XVII), and for granite (Table XVIII). The results for spheres and ash flow are plotted in Fig. 19, along with the slope of the curves for calculated G,f from previous
47

Table XV
MINIMUM MASS FLOW RATE FOR FLUIDIZATION OF UNWELDED ASH-FLOW TUFF
Nitrogen gas, 25”C, 1 atmosphere Particle density 2. 154 g/cm’
G mf = 4. 990 Dp1*82
Measured G
,, 1.82 Calc. Gmf
Measured Gmf Min. Flow
g/cm2-set Max. Exp.
Particle Avg. Size, D cmx 1O-4 ’
g/cm2-s ec g/cm2-set Size, p cmxP10-4 x 1o-3 x 1o-3 x 1o-3
125 - 105 115 2. 95 1. 47 1. 533 3. 2
74 - 63 69 1. 17 0. 585 0. 621 1. 81
53 - 44 49 0. 625 0. 312 -- 1. 09
44 - 37 41 0.454 0. 226 -- 1. 09
< 37 (30) 0. 251 0. 125 -- 0. 845
48
lo-%I0
6
6
4
z I 2
I” E Y 01 c
E z
B I
i 0.6
El 2 0.6
L
5 0.4
0.2
0.
I I I I I Ill1
UNWELDED ASH FLOW TUFF PARTICLE DENSITY, 2.154 g/cm3 NITROGEN GAS, 25 *C, lotm
0 MASS FLOW RATE FOR MAXIMUM EXPANSION
0 MEASURED Gmf
I I
TEI-II3
IO 20 40 60 100
PARTICLE SIZE, microns
200 400
Fig. $8 Minimum Mass Flow Rate (Gmf) as a Function of Particle Diameter - UnwAlded Ash k’low Tuff
49

Table XVI
EFFECT OF PARTICLE SIZE ON SETTLING RATE OF GLASS MICROSPHERES
Particle Size, Settling Rate, cm/set
125 - 105 1.75
88 - 74 1.20
74 - 63 0. 75
44 - 37 0.53
less than 37 0. 36
Room temp., Nr carrier, 1 atm pressure
Table XVII EFFECT OF PARTICLE SIZE ON SETTLING RATES
OF UNWELDED ASH-FLOW TUFF
Particle Size, Settling Rate, cm/set
125 - 105 2. 0
74 - 63 0. 86
53 - 44 0. 76
44 - 37 0. 72
less than 37?6 1.0
Room temp., Nz carrier, 1 atm pressure
* did not fluidize well
T able XVIII EFFECT OF PARTICLE SIZE ON SETTLING RATE
OF CRUSHED GRANITE
Particle Size, Settling Rate, cm/set
125 - 105 1. 6
74 - 63 1. 6
53 - 44 1. 8
less than 44 2.2
Mix No. 1 1. 8
Room temp., Nz carrier, 1 atm pressure
50

IO
8
6
4
0.4
0.2
0.1
m
SETTLING RATES m A ASH FLOW
m 0 MICROSPHERES
SLOPE OF MINIMUM MASS FLOW RATE, Gmf
MICROSPHTRES
----- ASH FLOW
IO
I
40 60 80 100
PARTICLE SIZE, microns
TEI- 1137
I I
200 400
Fig. 19 Effect of Particle Size on Settling Rate
51

Figures 17 and 18. As would be expected, settling rates decrease with
particle size. The slopes of the curves are generally similar, with fair agreement for larger sizes, but more divergence with the smaller particles. This is again believed due to the tendency for small-particle agglomeration and, in the case of glass at least, is abetted by the hygroscopic nature of glass which caused some difficulty in obtaining reproducibility of results and necessitated careful drying of the material before each test.
In the case of granite, Table XVIII, no particular difference in settling rates as a function of particle size is apparent. This, as in the case of the small particles of ash-flow tuff, is probably caused by the irregular shape of the particles causing them to agglomerate.
The effect of size distribution on settling rates of unwelded ash-flow tuff is shown in Table XIX. All particles 125 microns and less in diameter were separated from a fairly large sample of ash-flow tuff and used as the bed material in these experiments. Settling rates of the material were deter- mined as the smaller particles were removed from the sample. The impor- tance of the smaller particles is obvious. As they are removed from the sample, the settling rate of the sample increases. Oddly enough, the settling rate of the smaller particles - less than 37 microns - alone is appreciably higher than when larger particles are also present. Larger particles tend to prevent agglomeration of the smaller particles and in so doing, increase the effectiveness of the smaller particles in controlling the settling rate. Table XX shows how size distribution affects the expansion ratio of the same sample of ash-flow tuff. Removal of the smaller particles cause a reduction in the expansion ratio. Again, the importance of small particles in a sample is obvious.
The effect of particle size on the expansion ratio of unwelded ash-flow tuff is shown in Table XXI. This type of information, coupled with settling rate data, is of value in determining the length of time required for a fluidized column to settle or the length of time available for the material to flow in a fluidized state. As indicated in the table, expansion ratio increases as particle size decreases.
52
- I

Table XIX
EFFECT OF SIZE DISTRIBUTION ON SETTLING RATES OF UNWELDED ASH-FLOW TUFF
Particle Size, td Settling Rate, cm/set
125 - 37 0. 86
125 - 53 1. 00
125 - 74 1. 34
Table XX
EFFECT OF SIZE DISTRIBUTION ON EXPANSION RATIO OF UNWELDED ASH-FLOW TUFF
Particle Size, p Expansion Ratio
125- 5 I. 45
125 - 37 I. 22
125 - 53 1. 12
125 - 74 1. 09
Table XXI
EFFECT OF PARTICLE SIZE ON EXPANSION RATIO OF UNWELDED ASH-FLOW TUFF
Particle Size, p Expansion Ratio
125 - 105 1. 10
74 - 63 1. 16
53 - 44 1. 20
44 - 37 1. 31
< 37 1. 50
53

C. FLOW PROPERTIES
1. Horizontal Flow Velocities
While settling rate studies are useful in determining the length of time re-
quired for a fluidized bed of material to settle, and hence the time available
for the material to flow, some knowledge of the horizontal flow properties of the material is required before attempting to predict how far a given material will flow under a given set of conditions. With this in mind, an apparatus was constructed which permitted a measure of horizontal flow velocity and, at the
same time, gave a comparative measure of the distance various materials
would flow under identical conditions. The apparatus was similar to that
used in the settling rate studies, except that the fluidization column was equip-
ped with a removable bottom. The removable section housed the gas disper-
sion or fluidizer unit and was designed to fit flush with the bottom of the fluidi-
zation column. The unit was connected to the flow control system by means of a flexible hose. The fluidization column, a 4.8-cm ID glass tube, was mounted vertically above a large plywood tray on which a grid had been painted to aid
in determining distance of travel of the flowing material. A high-speed motion picture camera, mounted above and to one side of the tray, was used to photo- graph the material as it flowed across the plane. A sketch of the apparatus is
shown in Fig. 20.
In actual operation, the fluidizer unit was placed in position and the material
to be tested was added to the glass tube. The gas flow was turned on and ad-
justed until good fluidization of the material was obtained. With the motion picture camera operating, the fluidizer unit was quickly removed from the
bottom of the tube, allowing the fluidized material to fall onto the plywood
tray. The resulting flow of material across the tray was photographed and
the flow velocity determined. Results of the measurements are summarized
in Table XXII. In all cases, the depth of the settled bed. was approximately
the same (35 cm). Most of the measurements were made with the lower end of the glass fluidizer column 11 cm above the tray. In the case of the F-2-25 k
catalyst, this distance was reduced to 5 cm to prevent the material from flow- ing completely across the tray and bouncing off the walls. Even with the re- duced height, this material traveled across the plane with a velocity of 107
cm/s ec, equal to the fastest velocity obtained with the other materials at a
drop height of 11 cm. The effect of drop height - the height of the bottom of
the glass tube above the tray - can be seen by comparing the flow velocities
of the -44 micron diameter granite at drop heights of 11 and 20. 5 cm. At
54

FLUIDIZED MATERIAL
REMOVABLE FLUIDIZER UNI FLEXIBLE TUBE
- FLUIDIZING GAS FLOW
-FLOW PLANE
Fig. 20 Experimental Set-up for Determining Flow Properties of Fluidized Materials
55

Material
Table XXII
HORIZONTAL FLOW VELOCITIES
Flow Velocities, cm/set
11 cm drop height Fluidized Unfluidized
Granite - less than 44~
Granite - 88 - 74~
46
53
No. 325 Talc 91
FCCU - less than 37i 80
greater than 37~ 71
Ash Flow Tuff - less than 125~ 107
5 cm drop height
107
20.5 cm drop height
128
F-2-25 - unsized
Granite - less than 44 p
27
25
23
40
32
80 (1)
60 (2)
(1) Velocity for first 5 cm of travel
(2) Velocity for first 10 cm of travel
56

11 cm, the flow velocity was 46 cm/sect while at 20.5 cm the velocity increased to 128 cm/set. Although particle size had a relatively minor effect on flow velocity over the range of sizes investigated, the results observed in granite were contrary to what one might expect and to the results obtained with the FCCU catalyst. That is, the larger granite particles showed a slightly higher flow velocity than the smaller ones. This is probably due to the tendency of the smaller granite particles to agglomerate. Flow velocities of the unfluidi- zed materials are also included in the table. As might be expected, there is a considerable difference in the flow velocities of the fluidized and the unfluid- ized materials. The F-2-25 catalyst exhibits the. highest flow velocity of any of the materials tested with the unwelded ash-flow tuff in second place and the talc in third place.
2. Flow Distances
In addition to the actual flow velocities of the various materials, it is impor- tant to know something about the distance these same materials will flow under identical conditions. Such information, combined with settling rate data and flow velocities, should tell a great deal about the characteristics and properties of fluidized flow. The apparatus used for these determinations was the same as that described above, except that the plane was tilted at a slight angle in order to determine the effect of incline on flow. The material was fluidized in the usual manner, the fluidizer removed, and the material allowed to fall and spread across the plane. Dimensions of the flow pattern were obtained. Maximum distances down the plane as well as across the plane were recorded. Results are summarized in Table XXIII. All tests were made under as nearly identical conditions as possible. In all cases the drop height was 11 cm and the plane was inclined at an angle of 5” 45’ with the horizontal. Settled bed depths were held at approximately 35 cm. Flow distances for both fluidized and unfluidized materials are reported. Again the F-2-25 catalyst exhibited the best flow properties, followed, in this case, by the FCCU catalyst and then the ash-flow tuff. Some indications of the effect of the particle size on flow properties may be obtained from an analysis of the granite data. Here a de- crease in particle size results in an increase in distance traveled. Glass microspheres show a similar trend. Although no narrow cuts were investiga- ted in the case of ash-flow tuff, the importance of the smaller particles in determining the flow properties of the material is obvious. In both samples shown in Table XXIII, the larger particles appear to have little effect other than to prevent agglomeration of the smaller particles. Flow properties are determined primarily by the smaller particles.
57

Material
FCCU
Talc
Granite
Granite
Granite
Glass Beads
Glass Beads
F-2-25
Size, microns
’ 37 > 37
53-10 53-10
Settling Rate, cm/set
0.65
Depth of Bed, cm settled expanded
34.5 42.5
35.6
1.6 36.0 51.0 34.0
177-149 177-149
1.8 34.5 40.0 34.5
88-74 88-74
1.8 34.5 42.0 34.5
< 44 < 44
125-105 125-105
2.2 33.2 40.0 33.0
1.75 35.5 40.0 35.5
aa-74 1.2 36.0 42.0
aa-74 36.0
105-20 0.55 34.5 49.0
105-20 34. !J
Ash-Flow Tuff < 125 a. 73 34.5 49.5 < 125 34.5
Ash-Flow Tuff -Z 297 0. a7 35.5 35.5
47.8 -.
Table XXIII
FLOW PROPERTIES OF FLUIDIZED MATERIALS Drop height 11 cm Plane Angle 5’45’
Expansion Ratio
1.23
1.42
1.16
1.22
1.20
1.12
1.16
1.42
1.44
1.35
Suread. cm down plane across plane
a2 79 30 29
52 42 30 30
30 29 28 28
34 34 22 23
38 39 26 29
52 52 44 43
59 58 46 44
12ot (1) a7t (1) 26 26
69 72 22 21
75 69 23 24
(1) Material traveled maximum dimensions of tray

Some typical flow patterns for both fluidized and unfluidized materials are shown in Fig. 21 through 24. The effect of fluidisation on the flow properties of the materials is obvious. Apparent discrepancies between photographs and data recorded in Table XXIII are due to variations in drop height or in the amount of material used in the test. An increase in either of these parameters results in an increase in the size of the flow pattern. The effect of drop height can be seen in the series of photographs in Fig. 24. The first photograph (a) shows the flow pattern resulting from unfluidieed granite (-325 mesh) being dropped from a height of 11 cm. The second photograph (b) shows the flow pattern of this same material when fluidised. Again the drop height was 11 cm. In the third photograph (c), the same material was dropped from a height of 20.5 cm. The increase in the size of the flow pattern with increasing drop height is apparent. Fig. 25 and 26 were obtained using a column with a hole in the side near the bottom. Instead of removing the fluidiser and allowing the fluidized material to fall onto the plane, the fluidized material was allowed to flow from the side hole. The center of this hole was 6 cm above the level of the plane. Both flow velocity and distance traveled were determined. Again, the F-2-25 catalyst exhibited the better flow properties. This material had a flow velocity of 160 cm/set and traveled the entire length of the plane (120 cm), while the ash-flow tuff had a flow velocity of only 80 cm/set and travel- ed only 90 cm. These results are in general agreement with flow velocities and travel distances reported earlier.
Since the distance traveled by the particles under a standard set of conditions is the most important factor in choosing a material for large-scale demonstra- tion, it was wondered if there were any relationship of properties which could be used to predict the results. Table XXIV lists the materials in decreasing order of distance traveled. The settling rate appears to give a good general idea, with the lowest rate permitting the greatest travel distance. Horizontal flow velocities were not as meaningful. However, it has been found that the expansion ratio divided by the particle density and settling rate gives a better correlation. Values are shown in Table XXIV and plotted in Fig. 27. It is not known whether this relationship has any theoretical justification, but it is interesting to note the dimensional relationship in the plot of distance traveled vs Expansion Ratio
(density) (settling rate)
cm
cm
vs
vs
1
(g/cm3) (cdsec)
cm’ set
59

60

! .i
i 6
(4 Unfluidized Material
Fig. 22 Flow Pattern of Unwelded Ash Flow Tuff (All Particles Less Than 125~~ 11 -cm Drop Height)
61
I

(4 Unfluidized Material
(b) Fluidized Material
Fig. 23 Flow Pattern of No. 325 Talc (Unsized, 1 l-cm Drop Height)
62

4 I.
Fig. 24
(4 Unfluidized Material
(b) Fluidized Material
:I Fluidized Material (20. 5-cm Drop Heigh d
ir Pattern of Crushed Granite (Parti
9 325 Mesh, 11-cm Drop Height)
cle 6 Less Than
63

Fig. 25 Flow Pattern of F-2-25 Catalyst - Side Ejection
Fig. 26 Flow Pattern of Unwelded Ash Flow Tuff - Side Ejection
64

Table XXIV
FACTORS AFFECTING DISTANCE TRAVELED
E S P Ekpans ion Settling Rate Particle
Ratio cm/set Density g/cm’ 2 ps Material
Size Microns
Distance Traveled cm
F-2-25 105-20 120t 1.42 0.55 0.767 3.36
FCCU c?
AFT
< 37 a2 1.23 0.65 1.455 1.30
< 125 69-72 1.44 0.73 2.154 0.92 < 297 69-75 1.35 0.87 2.154 0.72
Glass 88-74 59 1.16 1.2 2.48 0.39 125-105 52 1.12 1.75 2.48 0.26
Talc 53-10
< 44 m-74
177-149
52 1.42 1.6 2.83 0.314
Granite 38 1.2 2.2 2.57 0,213 34 1.22 1.8 2.57 0.26 30 1.16 1.8 2.57 0.25
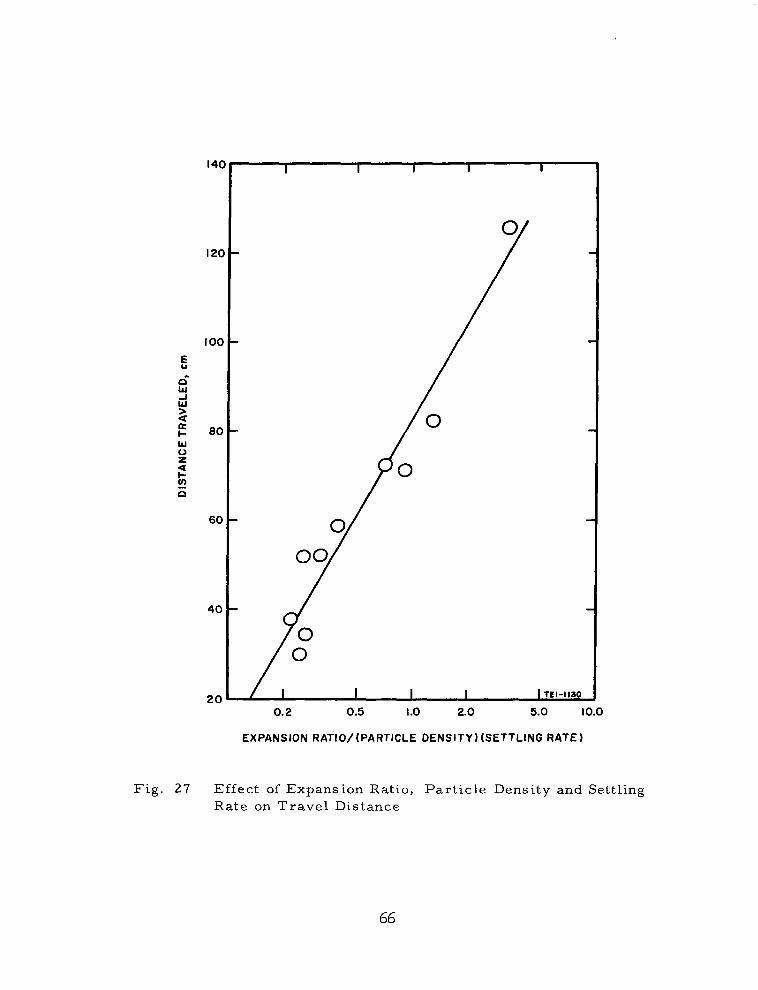
14c
12c
IOC
60
40
20 I I I I 1 TEI-I 130
0.2
EXPANSION
0.5 1.0 2.0 5.0 10.0
RATIO/(PARTICLE DENSITY) (SETTLING RATE 1
Effect of Expansion Ratio, Particle Density and Settling Rate on Travel Distance
66

or in dimensional analysis /Q -R2tm-l
R - R (/Qt m-l)
The dimensions 2 t m” are those of fluidity.
I Thus 1 N 2 (units of fluidity)
3. Particle Separation
During the determination of the flow properties of the unwelded ash-flow tuff (smaller than 297 microns), it was noticed that particle fractionation of some sort was occurring in the fluidization column. This may be seen in Fig. 28, where there is a distinct band of material differing in color and texture from the rest of the samples. Attempts to remove the material for examination were not successful because remixing could not be avoided. However, exami- nation of larger particle size material (590 to 840 micron) under a binocular microscope showed a variety of particles, some porous and some nonporous. This is illustrated in the previously discussed Fig. 8. The material could be separated by tweezers and the densities of the different types of particles could be measured.
The nonporous material, which resembles the band of material separated in the fluidization column, had densities in the range of 2.37 to 2.55 g/cm3. The porous material, which is similar to the upper material in the column, had an average density of 1.43 g/cm3. It is believed that the separation ob- served in Fig. 28 represents a density fractionation with the harder, non- porous, non-vesiculated material being concentrated toward the bottom of the fluidization column.
67

Fig. 28 Particle Fractionation Resulting From Fluidization of Ash Flow Tuff (Smaller Than 297 Microns)
68

D. VACUUM FLUIDIZATION
In any study of lunar fluidized-ash flow, one of the chief technical questions to be considered is the effect of vacuum on the fluidization process. For example, what happens in a fluidized column when the pressure above the column is reduced to the point wherePoiseuille’s law is no longer operative? Is it still possible to obtain uniform fluidization under these conditions ? If so, how far below the surface is the column affected by a reduction in pressure above the column?
In an attempt to answer such questions as these, the vacuum fluidization system shown in Fig. 29 was constructed. The system was designed to op- erate over a pressure range from 0. 3 torr to I. 0 atmosphere with special emphasis on the lower pressures. Of primary importance was that region where the mean free path of the gas approximated the particle diameter. In the present investigation, this was in the vicinity of 2 torr. At this pres- sure and room temperature, the mean free path of nitrogen molecules used as the fluidizing gas was approximately 35 microns. This is comparable to the size of the particles used in most of the low pressure studies. A plot of the mean free path of nitrogen molecules as a function of pressure is shown in Fig. 30.
The system was similar in many respects to the system used in studies at atmospheric pressure. Additional pressure gauges were installed at various points in the system to monitor pressure, and a high capacity vacuum pump (Kinny, Model KD30) was used to control the pressure. The vacuum system was connected to the fluidization column through a large (250 liter) buffer tank. The purpose of the tank was to smooth out any fluctuations in column pressure originating in the vacuum pump. Pressure in the column was con- trolled by means of a vacuum valve located between the pump and the buffer tank. A filter unit, installed just ahead of the buffer tank, prevented ex- cessive amounts of elutriated material from entering the pump. Gas pres- sure above the bed was measured on a Dubrovin gauge covering a range 0 to 20 torr and capable of being read accurately to 0. I torr. Fluidizing gas flows were controlled by sonic-orifice flowmeters. .
Although a number of different materials were investigated under near vac- uum conditions, a majority of the results were obtained with FCCU catalyst primarily because of the smoother and more consistent behavior of this material. AllSmaterials tested showed the same general behavior. The F-2-25 catalyst was quite difficult to fluidize at pressures below about 3 0 torr and elutriation of this material was quite bad. While operating at a
69
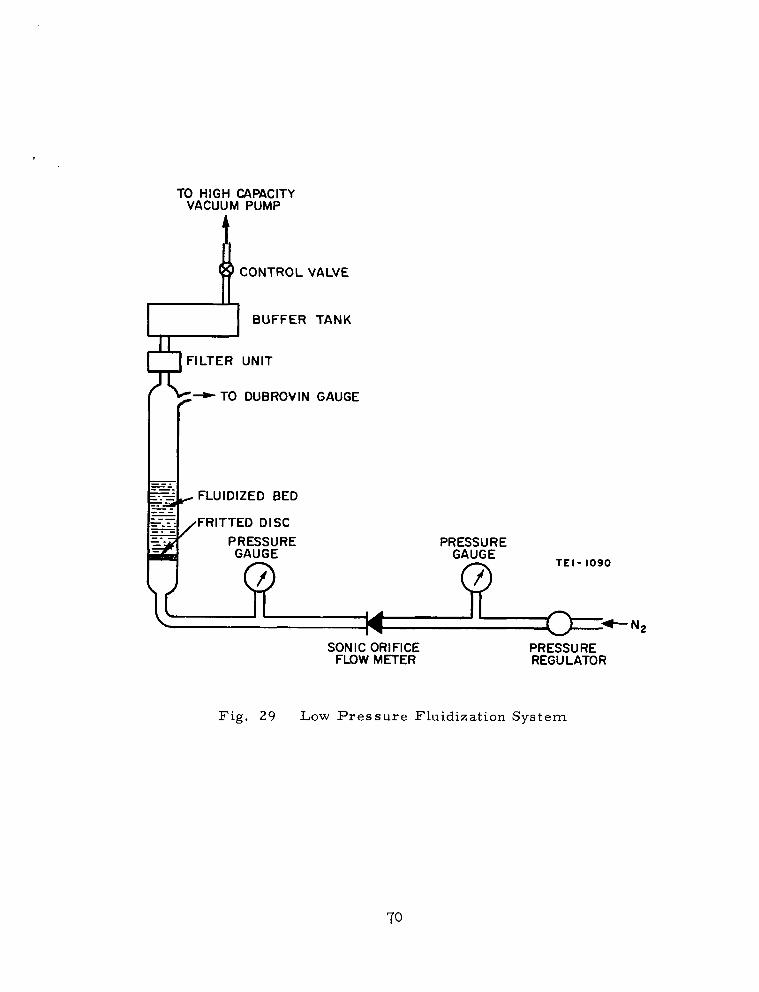
TO HIGH CAPACITY VACUUM PUMP
CONTROL VALVE
BUFFER TANK
FILTER UNIT
-TO DUBROVIN GAUGE
FLUIDIZED BED
FRITTED DISC
TEI- 1090
SONIC ORIFICE FLOW METER
N2
PRESSURE REGULATOR
Fig. 29 Low Pressure Fluidization System
70

100 80
60
40
20
IO 8
k 6 2 Li 4 LL ?J
B 2 %
I 0.8
0.6
0.4
0.2
0.1 I 2 4 6 810 20 40 60 80 IO0 200 400 600 1000
MEAN FREE PATH, microns
Fig. 30 Mean Free Path of Nitrogen Molecules as a Function of Pressure

pressure of 2 torr, using particles 37 microns and less in diameter, approxi- mately 35 cc of material was lost by elutriation in 30 minutes. Ash-flow tuff of similar size was equally as difficult to fluidize. No uniform fluidization could be obtained under any conditions with this material at pressures below about 5 torr. Elutriation was about the same as with the F-2-25 catalyst.
Glass beads (No. 4000) had some tendency to agglomerate but could be flu- idized at pressures as low as 0.4 torr provided the column of material was not too deep. Increasing the depth of bed material tended to reduce the amount of expansion of the column and made fluidization more difficult.
This effect of bed depth was also observed with unsized FCCU catalyst where an increase from 10 to 22.6 cm decreased the maximum expansion ratio of the bed from 1. 16 to 1. 04 at a pressure of 0. 7 to 0. 9 torr. Results with 37 to 53 micron FCCU catalyst show that, for a given bed depth, the expansion ratio of the bed was quite sensitive to changes in pressure at the surface of the bed, particularly in the pressure range where Poiseuille’s law begins to fail. This is shown graphically in Fig. 31 (data, in addition to the two points discussed above, are from Tables XXV and XXVII) where expansion ratio is plotted as a function of pressure for different bed depths. At the lower pres- sures - below about 1 torr, practically no expansion of the column occurs. Further increase in gas flow resulted in rather violent agitation or slugging of the column but no increase in expansion.
A cross plot, taken from smoothed data of previous Fig. 31, of expansion ratio versus bed depth at 1 torr is shown in Fig. 32. This demonstrates that even with the FCCU catalyst, (which was more smoothly fluidized at very low pressures than any of the other materials), there is a limit to the bed depth at which fluidization can occur. The expansion ratio appears to approach unity (no expansion) at a bed depth between 40 and 50 cm.
Referring again to Fig. 31, as the pressure was increased, expansion of the column increased although it was still not possible to obtain uniform or steady fluidization. For the size particles used in these runs, the critical pres- sure - where the mean free path in the gas equals the particle diameter - is about 2 torr. At pressures greater than this, the expansion ratio of the bed begins to increase rather rapidly.
In the vicinity of this “critical pressure”, with proper adjustments of flow and pressure, it is possible to obtain stable, uniform fluidization of the bed for a limited time. This is shown in Fig. 33 where the top of the flu- idized bed is relatively stable. Some powder sticks to the wall, partially obscuring the view of the top surface. This stable fluidization lasts for
72

1.5
1.4
0
5 1.3 (t
B FJ
f ii 12 . W
I.1
I.0
SETTLED BED DEPTH, cm
X IO
X 0 15.5
n 22.6
Cl 29.6
I I TEI-1132
I IO 100 1000
PRESSURE, torr
Fig. 31 Effect of Vacuum on Expansion Ratio of FCCU Catalyst
73

Table XXV
Summary of Low-Pressure Fluidization Data of 37-53 micron
FCCU catalyst at a Settled Bed Depth of 15. 5 cm
p (above bed), mm Hg
@(bed + disc), cm Hg
4.4
1.1
10.1
1.2
Flow, cm3/sec 0.24 0.35
Fluidization smooth smooth
Expanded ht., cm 18. 1 19.5
Expansion ratio 1.17 1. 26
@/cm of expansion ht. 0.061 0.061
Comparison of pressure drop across bed and pressure due to weight of bed.
Pressure drop = 1.1 cm Hg = 14.9 gm/cm’
Pressure due to weight of column:
(0.83 gm/cm3) (15. 5 cm) = 12.9 gm/cm2
The pressure drop slightly exceeds the weight of bed material. Agreement is reasonably good and difference is probably due to pressure drop across
disc.
74

Table XXVI
Summary of Low-Pressure Fluidization Data of 37-53 micron FCCU catalyst at a Settled Bed Depth of 28. 9 cm
p (above bed), mm Hg 0. 5
Ap (bed + disc), Cm Hg I. 6
2. 2
2. I
Flow, cm3/s ec 0.137 0. 215 0. 39
Fluidization :::
no expansion burping smooth
Expanded ht., cm 29. 8 31. 5 36. 0
Expansion ratio 1.03 1. 09 !. 25
&P /cm of expans ion ht. 0. 054 0. 067 0. 067
Comparison of pressure drop across bed and pressure due to weight of bed.
Pressure drop of 1. 6 cm Hg = 2!. 7 gm/cm2 ::: ::: 9:
’
Pressure due to weight of column: (. 83 gm/cm3) (28. 9 cm) = 24 gm/cm2
Pressure drop of 2. 1 cm Hg = 28. 5 gmjcm’ ~‘~*‘.-‘.~‘.
Under these conditions the bed expanded less than I. 0 cm. Any in- crease in flow caused considerable burping of the column but no increase in expansion.
Increase in pressure drop here is probably due to pressure drop across disc. Flow is higher here than in other runs. Similar result was observed in earlier runs.
Pressure drop is slightly below weight of material. Conditions for fluidization are not met. Column showed no appreciable expansion. However, a slight increase in flow (or back pressure) caused burping.
This is slightly in excess of the weight of bed material.
75

Table XXVII
Summary of Low-Pressure Fluidization Data of 37-53 micron FCCU catalyst at a Settled Bed Depth of 29. 8 cm
p mm Hg (above bed), 2. 2 2. 0 4. 4
Ap cm Hg (bed + disc), I. a 2. 1 2. 0
Flow, cm3/sec 0. 192 0.190 0. 206
Fluidization burping burping smooth
Expansion Ht., cm 31.0 31.4 31.7
Expansion ratio, 1. 04 1. 05 1. 06
AP /cm of expansion ht. 0. 058 0. 067 0.063
4. 2
2. 2
0. 24
smooth
33. 5
I. 12
0.066
9. 8 6. I 9. 8 8. 0
2. 0 2. I 2. 2 2. 3
0.326 0.31 0.345 0.333
smooth smooth smooth smooth
36. 0 35. 4 36. 7 36. 2
1. 21 1. 185 1. 23 1. 21
0. 056 0.059 0. 060 0. 064
Comparison of pressure drop across bed and pressure due to weight of bed.
Pressure drop at 1. 8 cm Hg : 24.4 gm/cm’
Pressure drop (average) = 2. 1 cm Hg = 28. 5 gm/cm”
Pressure due to weight of column: (0. 83 gdcn-?) (29. 8 cm) = 25 gm/cm’
The first AP of 1. 8 cm Hg is below weight of column and conditions for fluidization are not met.
For average value of AP = 2. 1 cm Hg or 28.5 gm/cm’, this is slightly in excess of weight of bed material and the bed should be fluidized.
With flow adjusted to give maximum expansion:
p (above bed), mm Hg lo. 6
Ap (bed + disc), cm Hg 2. 2
Flow, cm3/sec 0. 36
Expansion ht., cm 37.
Expansion ratio 1. 24
AP /cm of expansion ht. 0. 060
Under these conditions, the bed expanded to 37 cm and remained at this height for approximately 60 seconds. During this time the bed was quite stable. After about 60 seconds, the bed became rather turbulent, and collapsed to a height of 30. 2 cm. After settling, the bed would again slowly expand to a height of about 37 cm, stabilize for about 60 seconds, and then collapse again.
76

50
40
E 0 30 a.
c
I2
ifi 20
IO
C
FCCU CATALYST
0 37-53p
A UNSIZED
1.0 1.04 1.06 1.12 I.16 1.20
EXPANSION RATIO
Fig. 32 Bed Expansion as a Function of Bed Depth at 1. 0 Torr
77

Fig. 33 Photograph of Stable Fluidization of FCCU Catalyst Under Vacuum Conditions

about 1 to 2 minutes. Then suddenly, the surface of the bed begins bubbling rather violently. Figure 34 was taken at an instant when the violent bub- bling erupted and caused a rise of about 5. 5 to 6 cm. After 10 to 15 seconds of bubbling, the surface calms down and the bed becomes stable for another 1 to 2 minutes, then the action is repeated. A similar action was observed in the case of glass microspheres. At pressures above about 5 torr---the exact pressure depends on the type of material being fluidized---the erratic behavior ceases and uniform fluidization of the column is achieved.
It is of interest in the case of a vacuum to estimate the depth below the sur- face of a fluidized bed where the pressure is above the critical so that PoiseuilWs law can operate. Presumably, below this depth normal fluidi- zation might take place. Pressure drop data through the bed were obtained in a series of vacuum runs for various pressures above the bed and for several depths of bed, using 37 to 53 PFCCU particles. The results are shown in Tables XXV, XXVI, and XXVII.
The pressure drop, AP (bed t disc), represents the actual pressure drop across the bed and diffuser disc. It is the difference between the back pres- sure on the column and the pressure above the column. At the low flows used, the pressure drop through the disc was not measured but is rela- tively low. By comparing the AP (bed t disc) to the weight of the material in the column for all the runs, the AP (bed t disc) averages about 16 per- cent high. This is probably due to the pressure drop through the disc.
The data of Tables XXV through XXVII show the expanded height of the bed and the measured pressure drop AP (bed t disc). The average of all these values is 0. 062 AP/cm of expanded bed height. Adjusting this value for the I6 percent pressure drop due to the disc, the approximate pressure drop is (0. 062) (0. 84) = 0. 052 cm Hg/cm bed height.
For the 37 to 53 p.FCCU particles, the critical pressure where the mean free path of the gas is the same as the size of the smaller particles is about 1. 5 to 2 torr. The bed depth from the top to give 2 torr (0. 2 cm) is 0. 2/O. 052 = 3. 85 cm. For smooth fluidization and moderate expansion of the bed, the pressure required is about 4 torr. This would require a depth from the top of 0.4/O. 052 = 7. 7 cm. These values must be used with caution since the 3. 85 cm represents a hypothetical layer at the top of the column which would not be fluidized. If vapors continue to fluidize the lower part of the column, they must pass out through this hypothetical layer. The latter must be raised upward either in a burping action as was experimentally observed at the very low flows near the critical region or else blown violently upward into a dilute phase as was observed when
79

Fig. 34 Photograph of Erupting FCCU Catalyst Under Vacuum Conditions

appreciable elutriation took place at moderate flows. In a lunar eruption where large mass flows were taking place during all but the latter stages of the eruption, the top layer must be blown into an extensive dilute phase.
81
I.

E. DISCUSSION OF RESULTS
Settling rates of fluidized particles could be measured with reasonable pre-
cision. They appear to be a strong indication of the distance a fluidized bed
may travel horizontally after being released from the fluidizing column. The settling rates are independent of bed height but may be initially slightly high
at very high bed expansions. Particle size has a definite effect on settling
rate, the larger particles settling more rapidly. For narrow size cuts, they appear to follow the same slope relationship as predicted by Leva’s equations for calculating minimum gas flow required for fluidization. That is, the settling rate for the larger particles appear to be proportional to the particle
diameter to the 1.82 power. Smaller particles, however, diverge from this relationship and appear to settle faster than would be predicted. This is
believed to be caused by small-particle agglomeration. On broad cuts, the settling rate increases as smaller particles are removed. However, large particles tend to prevent agglomeration of smaller particles and increase the effectiveness of small particles in controlling settling rate.
The expansion ratio is indicative of the void fraction of fluidized beds. The
ratio increases for narrow cuts, as the particle size is reduced. Similarly, the expansion ratio for broad cuts increases with the proportion of small
particles present. The expansion ratio, with the exception of talc, was
greater for the lighter, more porous materials such as F-2-25 catalyst, ash flow tuff, and FCCU catalyst. Granite and glass microbeads were re-
latively low. The talc had a high ratio, presumably because of its flat-
platelet particle shape.
The minimum gas flow, G,f, for fluidization is well described by Leva’s
equation. This equation can be used to show the effect of different fluidizing
gases or vapors and the effect of particle size and density. In comparing various size glass microspheres and ash-flow tuff, several things may be
noted. The observed minimum gas flow for the glass beads was less than that calculated from the equation, while that observed for the ash flow was just slightly higher than that calculated. In addition, because of lower density, calculated gas required for ash flow appears less than for the glass spheres. Actually, the observed minimum gas flow for ash-flow tuff was 1. 25 times that
for the beads. This difference suggests that a suitable shape factor may be required. The usual shape factor, which is commonly employed in Stoke’s low relationships,assumes unity for a sphere and below unity for all other
shapes. This is the wrong direction for the observations made here, and the
non-spherical particles require a factor greater than unity.
82

It should also be noted that the Leva equation works well for larger size particles, but below about 40 to 60 micron size particles, the fine material begins to show substantial deviation, This is believed caused by small particle agglomeration.
Flow velocities and horizontal flow distances were, of course, studied in the absence of gases emitted from the particles or without gases rising from below as would occur in a natural ash flow. Therefore, the values measured are low and are valid only for a comparison of the materials studied and as an indication of what to expect in a large-scale laboratory demonstration. The horizontal flow velocities were highest for F-2- 25 catalyst, ash-flow tuff, and talc. In general, the smaller the particles the greater the velocity but this may be negated at very small size where agglomeration may take over.
The horizontal distance traveled was greatest for F-2-25 catalyst, FCCU catalyst, and ash-flow tuff. In general, decrease in particle size gave greater distance. Obviously, the height at which the particles were dis- charged above the surface (kinetic energy) was a major variable. A good first approximation of the distance a material will travel is given by the in- verse of its settling rate. The best correlation,. however, appears to be given by dividing the expansion ratio by the particle density and the settling rate.
In using the above information to choose a material for large-scale laboratory demonstration, it must be recognized that a number of factors were not or could not be readily studied. These include the previously mentioned lack of emitted steam or of vapors rising through the particle during horizontal flow and, in addition, the studies were not made on freshly fractured sur- faces at high temperature as would be possible in the fine grinding process. Whether this latter factor of fresh surface would enhance steam retention at the particle surface and allow it to be emitted from the surface during the flow can not be easily determined. However, the experimental results ob- tained indicate clearly that a room temperature, large-scale demonstration can be made with available materials.
The best flow characteristics were possessed by the F-2-25 catalyst and this material is sufficiently similar in shape and porosity to an ash-flow tuff that it is the recommended material for a large scale demonstration. Such a demonstration could show the general principles involved in a dense- phase flow and could illustrate the formation of ghost craters. The effect of lunar hard vacuum to produce a dilute-phase cloud and final surface patterns of a completed eruption could not be simulated in large scale but some of these factors might be shown in special experiments.
83

The study of the vacuum effect on fluidization is the first work of this nature, so far as is known, which has been conducted. The work is quite interesting in that it bears out predictions made concerning the real effect of pressure below the “critical pressure” where the mean free path of the fluidizing gas
is greater than the particle size. Under these conditions, fluidization does indeed become difficult and, at some point, ceases entirely.
Experiments at pressures just above and just below the critical point were possible only by reducing vapor flows to very low values. The corresponding expansion ratios were lower and at very low pressures approached unity, indication no fluidization. At higher gas rates, violent bubbling began.
F-2-25 catalyst was very difficult to fluidize below about 10 torr and at 2 torr (the critical pressure for 37 micron material), substantial elutriation resulted. The ash-flow tuff would give no uniform fluidization below 5 torr and also had high elutriation loss. Glass micropheres which were smooth, could be fluidized as low as 0.4 torr if the column height was small, but additional bed height made fluidization very difficult. The FCCU catalyst, 37 to 55 p size, was the easiest to fluidize at low pressure, but at a pres- sure of 1 torr, increases in bed height decreased expansion ratio so that it approached unity somewhere between 40 and 50 cm of bed. This may in- dicate a maximum bed height for vacuum fluidization in the critical region.
The FCCU catalyst did maintain smooth fluidization at 2. 2 torr for 1 to 2 minutes followed by 10 to 15 seconds eruptions where material was thrown up from the surface to a height of 5. 5 to 6 cm. The system then became quiescent and the cycle was repeated. At higher vapor rates, violent bub- bling with considerable dilute phase and elutriation would result. However, above 4 to 5 torr, normal fluidization would occur.
It was found that the pressure drop through 3. 85 cm of FCCU bed would equal 0. 2 cm (2 torr) and, through 7. 7 cm, would equal 0. 4 cm (4 torr). Somewhere between these values the critical pressure would be exceeded so that a hypothetical layer about 4 to 8 cm thick would not be fluidized while at all lower depths, fluidization could occur. Actually, of course, the mass flow of gases fluidizing the low portions of the bed would continue to rise. Because of the reducing pressure above, the gases would expand and the gas ’ velocity would be increasing. Finally when the gas reached the hypothetical unfluidized layer, this material would be blown upward to form a dilute phase or cloud. The extension of this description to a lunar ash flow will be obvious.
84

III. C ONC LUSIONS
1. The fluidization properties of a number of materials could be rated so that the best material for a large scale demonstration of fluidized-ash flow could be made in the laboratory.
2. F-2-25 catalyst had the best fluidized properties judged by: a) flowing the greatest distance, b) having the highest travel velocity, and c) having the slowest settling rate after fluidization vapor is cut off.
3. Settling rate is independent of bed height but is affected by particle
size and size distribution. The rate decreases with particle size but below 40 to 60 micron size, does not decrease as rapidly because of small particle agglomeration. On broad cut materials, the settling rate increases as smaller particles are removed; the presence of large particles tend to pre- vent agglomeration of smaller particles and enable the latter to control the
settling rate.
4. Horizontal flow distance increases with smaller particle size but this may be negated at very small size (20 microns or less) where excessive
agglomeration may take place. The flow distance correlates well with the factor of expansion ratio divided by particle density and settling rate.
5. Full range material such as the 20 to 105 micron size of F-2-25 catalyst is satisfactory for flow and no separation or grinding appears
necessary.
6. Fluidization is affected by low pressure in the range where the mean free path of the vapor becomes larger than the particle dimensions.
7. For fluidization of 37 to 53 micron FCCU catalyst at a pressure of 2 torr, the maximum gas flow through the bed without violet bubbling is about 1.27 x lo- 5 g/cm2 sec. This is 10 to 20 times less than the minimum gas flow for fluidization at 1 atmosphere.
8. The hypothetical distance below the surface where fluidization can still occur in a vacuum is between 3.85 and 7.7 cm for the FCCU catalyst, based on pressure drop determinations.
9. Bed expansion ratio is decreased as pressure is lowered near the critical point and approaches unity (no expansion) rapidly below 1 torr.
85

10. Bed expansion ratio for FCCU catalyst is decreased as the bed height is increased. It approaches unity between 40 to 50 cm of bed height.
11. In a fluidized system of major dimensions, the effect of vacuum . will be to cause the top surface to erupt into a dilute phase and to cause ex- tensive elutriation.
86

IV. RECOMMENDATIONS
It is recommended that the F-2-25 catalyst be used for a large scale demon- stration of fluidized ash flow and that recognition be given to the effect that vacuum has had on the mechanism of a lunar ash flow. The significance of the vacuum effect is that, in addition to possible dense phase flow, similar to terrestrial ash flows, lunar flows must have been accompanied by an ex- tensive dilute phase wherein particles have been blown upward. These then must fall back to the surface near and immediately following the end of the eruption. Since these particles will remain very hot for long periods of time, and since the particle surfaces are newly formed and have not under- gone reaction with an atmosphere such as on earth, there is a good proba- bility of “vacuum” welding. The nature of the resultant surface can be studied experimentally and a suggested program is given in the following section.
87

V. FUTURE WORK
Results of the current program suggest additional studies which merit con-
sideration. These include: 1) the large scale demonstration of fluidized ash
flow; 2) the determination of the surface characteristics resulting from the
settling back of the dilute-phase flow caused by the lunar vacuum; 3) measure-
ment of the rock temperature and degree of vesiculation resulting from libera-
ting water of crystallization from simulated lunar rocks; and 4) study of Si02 content enhancement which might result from sorting phenomena during fluidi- zation (both elutriation sorting and density sorting were observed in this pro-
gram).
The large scale demonstration could show all aspects of dense phase fluidized- ash flow and could be arranged to simulate dilute phase flow. It would illustrate
the formation of ghost craters and should convincingly indicate the nature of
the phenomenon by means of moving pictures. It can be carried out easily
at room temperature using the F-2-25 catalyst. Because of the temperature
and pressure, however, it will not indicate the probable final welded nature of
the ash flow surface which can be better demonstrated as outlined in the next
section.
It is felt that the dilute phase flow caused by the lunar vacuum will be very hot (about 850°C) and will cool only very slowly. Because particle surfaces are “clean”, there will be a strong tendency to weld when the particles fall back
to the lunar surface. It is suggested that this may be experimentally studied by observing the pattern obtained by dropping particles of unwelded ash-flow tuff onto a plane surface in a vacuum and then heating to red heat. The pro- perties of the resultant vacuum-welded material can be determined. The
measurement of the photometric response curve can also be carried out and compared to that obtained from the moon.
The temperature at which water is liberated from various rocks, and the degree
of vesiculation can be measured to give a better understanding of this mechanism
as it affects fluidization. Radio frequency heating of activated charcoal has been conducted here and the resultant liberation of adsorbed water has given an excellent simulation of fluidization. This RF technique (or ordinary con- ductive and convective heating) can be applied to water-bearing rocks such as
serpentine. This will provide fluidization, permit temperature measurements
to be made, and show the degree of particle fragmentation and vesiculation.
88

Silica concentration enhancement by fluidization may occur by the natural sorting which was observed in this program. If it can be shown that Si02 tends to concentrate, this may offer an explanation for the high Si02 content of tek - tites and glasses which have been hypothesized to have come from the moon. In fluidization, the more crushable and friable materials will produce smaller diameter particles and these will be preferentially carried upward and into the dilute phase. Additionally, material which contains less water and is less vesiculated as the result of an eruption will have fewer voids and a higher particle density. This material will be sorted from lesser density materials and tend to remain at lower portions of a fluidized zone. This could be experi- mentally studied by fluidization of an unwelded ash.-flow tuff. Chemical analysis of sorted fractions resulting from elutriation and density fractionation should show the extent of Si02 concentration changes.
89

REFERENCES
1. Ralph B. Baldwin, “The Nature of the Lunar Surface and Major Structural
2.
3.
4.
5.
6.
7.
8.
9.
10.
11.
Features”, Proceedings of the Conference on Lunar Exploration, I,
Paper VII, Bulletin of the Virginia Polytechnic Institute, Blacksburg, Va.
LVI, No. 7, 1963.
H. C. Urey, The Planets, Yale University Press, New Haven, 1952.
T. Gold, Vistas in Astronautics: II Annual Astron. Symp., Pergamon
Press, 1959, pp. 261-266.
E. M. Shoemaker and R. J. Hackman, “Procellarian System”, Astrogeo-
logic Studies, Semi-Annual Progress Report, U. S. Geological Survey,
1961, p. 2.
John A. O’Keefe and Winifred S. Cameron, “Evidence from the Moon’s
Surface Features for the Production of Lunar Granites”, Icarus, 1, 1962, - pp. 27 1-28 5.
John A. O’Keefe and Ernst W. Adams, “Tektite Structure and Lunar Ash
Flows”, Journal of Geophysical Research 70, 1965, pp. 3819-3829. -
Clarence S. Ross and Robert L. Smith, “Ash-Flow Tuffs: Their Origin, Geologic Relations and Identification”, Geological Survey Professional
Paper 366, U. S. Govt. Printing Office, Washington, D. C., 1961.
C. N. Fenner, The Origin and Mode of Emplacement of the Great Tuff Deposit in the Valley of the Ten Thousand Smokes, National Geographic Sot. Contributed Technical Papers, Katmai serial no. 1, 1923, p. 72.
R. F. Griggs, The Valley of the Ten Thousand Smokes (Alaska), Wash- ington, D. C. National Geographic Society, 1922, p. 253.
J. Westerveld, Geol. Sot. America Bull., 63, 1952, p. 561. -
Abraham Dolgoff, The Volcanic Geology of the Pahranagat Range and
Certain Adjacent Areas, Lincoln County, Southeastern Nevada, PhD Thesis, Rice Institute, Houston, Texas, 1960, p. 24.

-
12.
13.
14.
15.
16.
17.
18.
19.
20.
21.
22.
F. R. Boyd, “Rhyolite Plateau, Yellowstone Park, Wyoming, ” Bulletin Geol. Sot. Am. 72, 1961, pp. 387-426. -
N. A. Kozyrov, “Spectroscopic Proofs for Existence of Volcanic Pro- cesses on the Moon”, The Moon, Ed. by Z. Kopal and Z. K. Mikhailov, Academic Press, N. Y., 1962, p. 263.
E. M. Shoemaker and R. J. Hackman, Interplanetary Correlation of Geologic Time, 7th Annual Meeting, American Astronautical Society, Dallas, Texas, Jan. 1961.
A. Lacroix, La Montagne Pelke et ses eruptions, Masson et Cie, Paris, 1904.
Robert L. Smith, “Ash Flows”, Bulletin of the Geol. Sot. Am. 71 -’ 1960, pp. 795-842.
B. N. Moore, “Deposits of Possible Nude Ardente Origin in the Crater
Lake Region, Oregon”, Journal of Geology 42, 1934, pp. 358-375. -
P. 0. Rosin and E. Rammler, “Die Kornzusammensetzung des Mahlgutes im Lichte der Wahrscheinlichkeitslehre”, Kolloid Zeits. 67, 1934, pp. - 16-26.
W. C. Krumbein and F. W. Tisdel”, Size Distribution of Source Rocks of Sediments ” American Journal of Science 238, 1940, pp. 296-305.
M. R. Geer and H. F. Yancey, “Expression and Interpretation of the Size Composition of Coal”, Inst. Min. and Met. Eng., Tech. Pub1 948, 1938.
Stephen Brunauer, P. H. Emmett, and Edward Teller, “Adsorption of Gases in Multimolecular Layers”, J. Am. Chem. Sot. 60, 1938, pp. - 309-319.
W. E. Barr and Victor J. Anhorn , Scientific and Industrial Glass Blow- ing and Laboratory Techniques, Ch. XII Gas Adsorption Apparatus for Measuring Surface Areas, Instruments Publishing Co., Pittsburgh, Pa., 1949, pp. 257-283.
91

23. M. Leva, “Fixed Bed and Onset of Fluidization” Chapter 3, Fluidization, McGraw-Hill, New York, 1959.
24. G. L. Matheson, W. A. Herbst, and P. H. Holt, II, “Characteristics of Fluid-Solid Systems”, Ind. and Eng. Chem., 41, 1949, pp. 1099-1104. -
92 NASA-Langley, 1966 ~~-627


![Welcome [] · Welcome DRE 124 Structural ... accuracy for fine sieve analysis, 0.5 g accuracy for coarse sieve analysis Sieves Mechanical Sieve Shaker- 6. MATERIALS Fine Aggregate](https://static.fdocuments.net/doc/165x107/5ae713887f8b9a29048e4d16/welcome-dre-124-structural-accuracy-for-fine-sieve-analysis-05-g-accuracy.jpg)