
an experiment on the prevention of shoplifting - Center for Problem
27
AN EXPERIMENT ON THE PREVENTION OF SHOPLIFTING by David P. Farrington Institute of Criminology, Cambridge University Sean Bowen Dixons Stores Group, London Abigail Buckle St. Catharine's College, Cambridge University Tony Burns-Howell Dixons Stores Group, London John Burrows Morgan Harris Burrows, Crime Management Consultants and Martin Speed Dixons Stores Group, London Abstract* The aim of this experiment was to evaluate the effectiveness of crime analysis and situational prevention in preventing shoplifting. Three prevention techniques were compared: electronic tagging, store redesign, and deployment of a uniformed guard. Shoplifting was measured by systematically counting specified items every day and comparing the number of missing items with the number sold, given away or used in the store. Nine stores with high shoplifting Address for correspondence: Professor David P. Farrington, Cambridge University, Institute of Criminology, 7 West Road, Cambridge CB3 9DT, England. -93-
Transcript of an experiment on the prevention of shoplifting - Center for Problem

AN EXPERIMENT ON THE
PREVENTION OF SHOPLIFTING
by
David P. Farrington
Institute of Criminology, Cambridge University
Sean Bowen
Dixons Stores Group, London
Abigail BuckleSt. Catharine's College, Cambridge University
Tony Burns-Howell
Dixons Stores Group, London
John BurrowsMorgan Harris Burrows, Crime Management Consultants
and
Martin Speed
Dixons Stores Group, London
Abstract* The aim of this experiment was to evaluate the effectiveness of crimeanalysis and situational prevention in preventing shoplifting. Three preventiontechniques were compared: electronic tagging, store redesign, and deploymentof a uniformed guard. Shoplifting was measured by systematically countingspecified items every day and comparing the number of missing items with thenumber sold, given away or used in the store. Nine stores with high shoplifting
Address for correspondence: Professor David P. Farrington, Cambridge University,Institute of Criminology, 7 West Road, Cambridge CB3 9DT, England.
-93-

94 DAVID P. FARRINGTON et al.
rates were identified in a prior study. Electronic tagging was introduced in two,store redesign in two, a uniformed guard in two; and the remaining three servedas controls, receiving no intervention. Shoplifting was measured during the weekbefore the intervention, the week after, and three to six weeks later. The resultsshowed that: electronic tagging caused a lasting decrease in shoplifting; storeredesign caused an immediate decrease that was wearing off after six weeks; andthe uniformed guard had no effect on shoplifting. A program of research focusingon crime analysis and situational prevention of shoplifting is recommended,especially aiming to achieve lasting benefits from store redesign.
BACKGROUND TO THE EXPERIMENT
Shoplifting, like other types of offending behavior, arises from theinteraction between an individual, with a certain potential for offending,and the environment or situation, which provides opportunities foroffending. It is plausible to suggest that the individual potential foroffending, or antisocial tendency, depends on energizing, directing andinhibiting processes. Whether a person with a certain potential commitsan offense in any given situation depends on situational factors such asopportunities, costs and benefits, and on a person's subjective probabil-ities of the possible outcomes. (For a more detailed exposition of thistheory, see Farrington, 1993.) It follows from this theory that shopliftingmight be prevented by targeting either the individual's energizing,directing or inhibiting processes, or the situational factors. This paperfocuses on the situational prevention of shoplifting.
Situational Prevention
Most of the initial emphasis of situational crime prevention (Clarke,1980, 1982, 1983) was on decreasing opportunities for offending bytarget hardening and environmental management, but there was soon anequal emphasis on increasing the probability of detection (e.g., byincreasing surveillance). The latest definition is as follows:
Situational prevention comprises opportunity-reducing measures that are (1)directed at highly specific forms of crime, (2) that involve the management,design or manipulation of the immediate environment in as systematic andpermanent a way as possible, (3) so as to increase the effort and risks ofcrime and reduce the rewards as perceived by a wide range of offenders[Clarke, 1992:4].
The effort might be increased by target hardening or access control, therisks might be increased by entry/exit screening or surveillance, and therewards might be decreased by target removal or property marking(Clarke, 1992:13).

AN EXPERIMENT ON THE PREVENTION OF SHOPLIFTING 95
According to Clarke (1992), any situational prevention project shouldinclude the following elements: (1) collection of data about the natureand dimensions of the specific crime problem; (2) analysis of thesituational conditions that permit or facilitate offending; (3) study ofpossible methods of blocking crime opportunities; (4) implementationof the most promising, feasible and economic measures; and (5) moni-toring of results and dissemination of experience. As pointed out below,specifically in connection with shoplifting, these elements have oftenbeen termed "crime analysis." In our view, it is essential to evaluate thesuccess of crime prevention initiatives in rigorously controlled experi-ments (see, for example, Farrington, 1983). At a minimum, there shouldbe pretest measurement, an experimental intervention, and posttestmeasurement.
The theory that has guided situational crime prevention is rationalchoice theory (expounded in detail by Clarke and Cornish, 1985, andby Cornish and Clarke, 1986). Essentially, this suggests that potentialoffenders weigh the likely benefits of crime against the likely costs, andchoose to offend if the net expected benefits of crime outweigh the netexpected benefits of alternative behavior. Rational choice ideas have along history in criminology, psychology, economics and other behavioraland social sciences (see, for example, Farrington and Kidd, 1977; Cook,1980; Trasler, 1986). These ideas suggest that offenders can be deterredby increasing their subjective probability of being caught or by increas-ing their subjective costs of being caught.
The major problem facing situational crime prevention is displace-ment: Offenders might choose different targets, different methods ordifferent types of offenses altogether, rather than desisting from offend-ing (see, for example, Barr and Pease, 1990; Gabor, 1990). Advancingknowledge about displacement is likely to depend crucially on knowledgeabout specialization or versatility in criminal careers (see, for example,Farrington, 1992). Several researchers (e.g., Trasler, 1986; LeBlancand Frechette, 1989) have suggested that there are essentially two typesof offenders: situational (opportunistic) and chronic (persistent). Situa-tional crime prevention may be more successful with situational offend-ers, while displacement may be more of a problem with chronicoffenders.
Preventing Shoplifting
Many shoplifters report that they are influenced by rational orutilitarian considerations, suggesting that rational choice theory andsituational prevention might be applicable to shoplifting. For example,

96 DAVID P. FARRINGTON et al.
Carroll and Weaver (1986; see also Weaver and Carroll, 1985) askedexperienced and novice shoplifters to think aloud in stores, and foundthat both were concerned with the accessibility of items and with therisks of being caught. However, the experienced shoplifters were lesseasily deterred and developed plans for overcoming the difficulties posed(e-g-> by security devices). Similarly, deterrence research shows that thefrequency of shoplifting is negatively related to the subjective probabilityof being arrested (e.g., Montmarquette et al., 1985). However, otherstudies show that other motivations are also important in shoplifting,such as seeking excitement (West and Farrington, 1977), depression(Ray, 1987) and interpersonal problems (Schlueter et al., 1989).
Crime analysis has been advocated as an important technique forpreventing shoplifting (see Ekblom, 1986, 1988; Burrows, 1988; Hope,1991), and this general approach is used here. The first step is to identifywhen and where losses occur most often, the differential vulnerabilityof items, shoplifting opportunities, and who are the offenders. On thebasis of this information, the second step is to identify and chooseprevention methods, such as changes in store design (e.g., increasingvisibility of items to staff), publicity notices (e.g., warning shoplifters,emphasizing the antisocial nature of shoplifting), security devices (e.g.,mirrors, locked cabinets, closed-circuit television, electronic tagging),security staff (e.g., uniformed guards and plain-clothes store detectives),and other staff (e.g., increasing surveillance of high-risk groups ofcustomers). The third step is to implement and monitor the preventionprogram, and the fourth step is to evaluate its effectiveness. The surveyby Farrington and Burrows (1993) showed that the use by large Britishretail chains of closed-circuit television, loop alarms/display protection,electronic tagging, uniformed guards and warning notices all increasedbetween 1985 and 1990, but the use of store detectives did not.
Previous experiments on the prevention of shoplifting have focusedon the impact of warning notices, despite much evidence of the ineffec-tiveness of publicity campaigns against shoplifting (e.g., Sacco, 1985).McNees et al. (1976) argued that notices specifying that shoplifting wasa crime had a reductive effect on shoplifting (although this effect is notclear in their Figure 1). More convincingly, they showed that markingfrequently stolen items with a red star and posting warning noticesidentifying such items as frequently taken by shoplifters caused asignificant decrease in the theft of these items, presumably because ofdeterrence. These results were replicated by Carter et al. (1979) inSweden, but not by Thurber and Snow (1980) in the Pacific Northwest.Carter et al. (1988) also showed that providing store employees withregular information about the most frequently stolen items caused a
AN EXPERIMENT ON THE PREVENTION OF SHOPLIFTING 97
decrease in shoplifting, presumably because of increased surveillance.However, none of these experiments addressed the issues of staff theftand displacement.
Measuring Shoplifting
A major problem in studying shoplifting is to measure accurately itsnature and extent. Stock audits reveal stock "shrinkage," or the disap-pearance from stores of merchandise that has not been sold, but it isimpossible to know how much of this shrinkage is caused by shoplifting,as opposed to other causes such as staff theft, falsified deliveries,shop-soiled goods, system errors, in-store use of items and items givenaway to clinch sales. Generally, retailers are only able to attribute a smallpercentage of their total audit loss to specific causes, leaving most ofthis loss unexplained.
Information about shoplifting can be obtained from surveys ofretailers (e.g., U.K. Home Office Standing Conference on CrimePrevention, 1986; Farrington and Burrows, 1993), from police records(e.g., Burrows and Lewis, 1987; Poyner and Woodall, 1987), fromself-reported offending surveys (e.g., West and Farrington, 1977;Cooper, 1989), or from store detectives' records (e.g., Ekblom, 1986).However, all of these methods are indirect, biased and likely to under-estimate the true rate of shoplifting. More accurate measures can beobtained by following shoppers and systematically observing shopliftingas it occurs (e.g., Buckle and Farrington, 1984). However, systematicobservation is very expensive in terms of resources and difficult toimplement on a large scale.
None of these measurement techniques is adequate for evaluating thelarge-scale implementation of strategies designed to prevent shoplifting.One of the most useful measurement techniques for this purpose seemsto be the repeated, systematic counting of specified items. If items ondisplays are counted at least once a day, the removal of items can bedetected, and shoplifting can be inferred if the items have not been sold,given away, used in the store, stolen by staff, damaged or moved to otherlocations. This technique seems to have been pioneered by McNees etal. (1976, 1980) in Tennessee. They attached tags or sticky labels tospecified items that were removed by the cashier when the items weresold and made daily inventory counts. Similar methods were used byThurber and Snow (1980) in the Pacific Northwest, and by Carter et al.(1979) in Sweden. Masuda (1992) compared systematic counting withcomputerized records to discover and correct inventory discrepanciesand system weaknesses, and to reduce opportunities for theft (especially

98 DAVID P. FARRINGTON et al.
by staff). Carter et al. (1988) relied on electronic stock control methodsto measure shoplifting, but our experience suggests that this techniquemight be prone to considerable staff and system error.
The existing studies of shoplifting using systematic counting havetwo major limitations. First, each project was carried out in only onestore, making it unclear how far this method could be implemented ona large scale. Second, our experience of using this method shows thatthere is great scope for errors by store staff (e.g., in not removing stickylabels) and by those making the counts, unless the whole project is varycarefully monitored. There are hints of difficulties in the existingliterature; for example, McNees et al. (1976) discussed the problem ofitems being removed from the clothing department (the site of theresearch) to other parts of the store by customers or store personnel.However, it is not entirely clear that the necessary rigorous qualitycontrol was achieved in previous research projects.
The 1990 Measurement Study
The main aim of the 1990 measurement study, which was describedin detail by Buckle et al. (1992), was to assess the usefulness of themethod of measuring shoplifting by repeated, systematic counting andthe feasibility of implementing it on a large scale. The research wascarried out in Dixons and Currys electrical stores, which are both ownedby the Dixons Group in the U.K. While some of the same types of smallelectrical goods are sold in both types of stores, Dixons stores specializein electronic merchandise such as stereos, video recorders, and televi-sions, while Currys stores specialize in domestic appliances such aswashing machines, dishwashers and refrigerators (see, for example,Burrows, 1988).
In the Dixons Group, small items such as audiotapes and films arereferred to as "essentials," while larger items such as televisions orwashing machines are referred to as "majors." The shoplifting ofessentials is unlikely to be noticed, unless a large number disappear ina short time from one particular store location. The shoplifting of amajor item may be noticed and reported to the Security Department(which maintains a database on reported shoplifting) but, often, storestaff will surmise that missing items must have been sold. The aim ofthe research was to measure the shoplifting of essentials.
Thirty Dixons and Currys stores were chosen for study, drawn fromall areas of Great Britain, in most cases because they were thought likelyto have a high level of shoplifting. Fifteen management trainees eachmeasured shoplifting in two stores during a full six-day trading week.
AN EXPERIMENT ON THE PREVENTION OF SHOPLIFTING 99
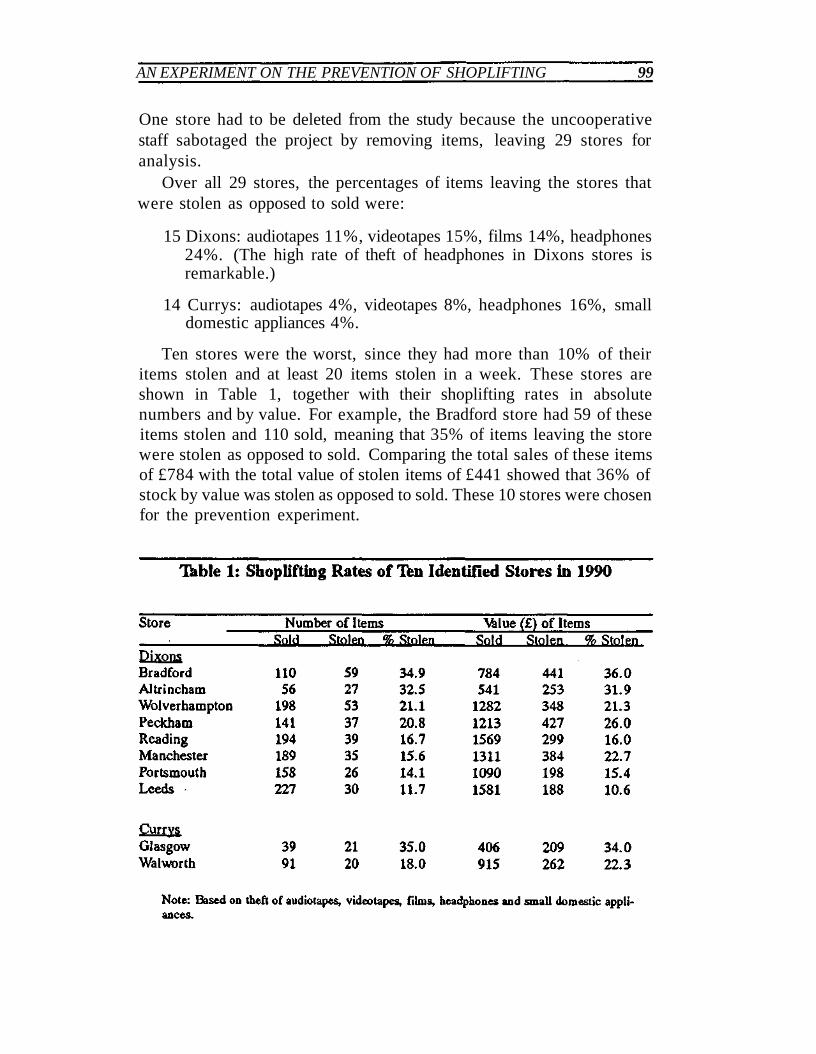
One store had to be deleted from the study because the uncooperativestaff sabotaged the project by removing items, leaving 29 stores foranalysis.
Over all 29 stores, the percentages of items leaving the stores thatwere stolen as opposed to sold were:
15 Dixons: audiotapes 11%, videotapes 15%, films 14%, headphones24%. (The high rate of theft of headphones in Dixons stores isremarkable.)
14 Currys: audiotapes 4%, videotapes 8%, headphones 16%, smalldomestic appliances 4%.
Ten stores were the worst, since they had more than 10% of theiritems stolen and at least 20 items stolen in a week. These stores areshown in Table 1, together with their shoplifting rates in absolutenumbers and by value. For example, the Bradford store had 59 of theseitems stolen and 110 sold, meaning that 35% of items leaving the storewere stolen as opposed to sold. Comparing the total sales of these itemsof £784 with the total value of stolen items of £441 showed that 36% ofstock by value was stolen as opposed to sold. These 10 stores were chosenfor the prevention experiment.

100 DAVID P. FARRINGTON et al.
The average value of these essentials stolen in one week in these 10stores was almost exactly £300 per store, or £50 per day. Bearing inmind the fact that the measurement study was carried out in January, ata time when stores are quiet, this gives an indication of the minimumpotential savings that might be achieved if the shoplifting of theseessentials could be prevented.
The measurement study showed that the method of measuring shop-lifting by repeated, systematic counting was valid. The observed salesof essentials recorded by management trainees in the study week weresignificantly correlated (r= .49) with the average weekly sales of essen-tials according to stock audit figures. Exactly 3.4% of total sales byvalue were of essentials, according to stock audit figures and accordingto the observed sales expressed as a function of that week's sales in the29 stores.
The observed shoplifting rate of essentials in the study week wassignificantly correlated (r= .52) with the recorded shoplifting loss ofmajor items in the previous year, expressed as a percentage of the totalsales by value. Hence, the stores with high recorded shoplifting ratesfor major items also tended to have high observed shoplifting rates foressentials in the measurement study. This increases our confidence inthe validity of the project measurement of shoplifting and also suggeststhat the major determinant of the rate of all kinds of shoplifting mightbe the type of area and the clientele of the store.
Overall, Buckle et al. (1992) concluded that the counting method hadsufficiently high validity to be used on a large scale to evaluate thesuccess of experiments designed to prevent or reduce shoplifting.
THE 1991 PREVENTION EXPERIMENT
The aim of the 1991 prevention experiment was to evaluate theeffectiveness of three methods of preventing shoplifting: electronictagging (T), store redesign (R) and a uniformed guard (G). The storeredesign was essentially intended to decrease opportunities for shoplift-ing by making it more difficult, while electronic tagging and theuniformed guard were intended to have a deterrent effect by increasingthe subjective probability of detection. Warning notices, security cam-eras, loop alarms and locked cabinets were already used in most DixonsGroup stores, while plain-clothes store detectives were not used. Inregard to other possible preventive options, restricting access of high-risk customers to stores would be problematic, placing more items inlocked cabinets might lead to fewer sales, and hiring more staff wouldprobably be uneconomic.

AN EXPERIMENT ON THE PREVENTION OF SHOPLIFTING 101
In addition to the three prevention conditions, there was also a controlcondition (C) in which no prevention strategy was introduced, to controlfor changes or fluctuations in shoplifting that were unconnected with theexperiment. The rate of shoplifting of essentials was measured using thesame method of counting and labelling by management trainees asbefore. (We are very grateful to the management trainees for theirassistance.) The effect on shoplifting was assessed using a pretest/post-test design.
Method of Measurement
Shoplifting was measured by repeatedly, systematically countingspecified essential items each day, and by detecting disappearances ofitems that could not be otherwise explained. A small sticky label wasattached to all such items on open display and not protected by loopalarms. Labels of different shapes and colors were used to identifydifferent types of items in different store locations. The managementtrainees were asked to label audiotapes, videotapes, films, headphonesand small domestic appliances.
Whenever an item was sold, given away or used in the store, the staffmembers were asked to peel off the label and stick it on a tally sheetheld by the till. The trainees counted and recorded the number of eachtype of item in each store location, and attached labels on the day beforethe project began (the preparation day). They then counted and recordedthe number of each type of item at the start and end of each day. Bycomparing the number of missing items with the number sold, givenaway or used in the store, a measure of the number of items shopliftedwas obtained. The trainees were also asked to check the till rolls toensure that items had not been sold without staff peeling off the labels.At the end of each day, the trainees completed a daily summary sheetshowing the numbers of each type of item sold and stolen, and mailedit to the senior researcher in Cambridge. They were required to do thiseach day so that potential problems could be detected and rectified at anearly stage.
The management trainees were responsible for replenishing stock,making sure that all relevant items on display were labelled and makingsure that staff were efficient in removing the labels. They also monitoredany rearrangement of displays and any transfer of minor items into orout of the store. They were told that they were not there to sell. Stafftheft from the displays was unlikely during the week of the project, sincethe staff knew that the displays were being checked each day, and themanagers were asked to increase the frequency of staff searches during

102 DAVID P. FARRINGTON et al.
the time of the project. All trainees were visited during the project by amember of the research team, to check that the measurement was beingcarried out efficiently and to discuss and resolve any difficulties inparticular stores. All trainees came to Cambridge for a detailed briefingday just before the pretest week and for a detailed debriefing day justafter the posttest week. These visits were very important for ensuringthe quality of their work, resolving questions and establishing the validityof the data collection.
Design
It had been planned to measure shoplifting during a full six-daytrading week in the pretest, then implement the strategy (T, R or G),and then measure shoplifting again during a full week in the posttest.Unfortunately, resource constraints meant that the pretest and posttestperiods were restricted to only four days (Wednesday to Saturday). Inthe measurement study, the average shoplifting rate for Wednesday toSaturday (10.5%) was similar to the average rate for the full six-dayweek (10.9%). The majority of sales (73.8%) and shoplifting (71.3%)in the full week occurred between Wednesday and Saturday.
The pretest was conducted from January 30 to February 2, and theposttest from February 6 to 9. Unfortunately, there was heavy snow inthe posttest week, particularly on Friday, February 8, which meant thatstores were open for shorter hours and had fewer customers. The snowprevented one management trainee (in Peckham) from carrying out theposttest measurement, reducing the number of stores in the experimentto nine. Two other trainees could not get into their stores on one day butwere nevertheless able to complete the counting satisfactorily.
The plan had been to use matched pairs of stores to evaluate theprevention strategies, but the loss of Peckham meant that the design ofthe experiment is best viewed as follows:
(1) Bradford (R) versus Altrincham (T);(2) Wolverhampton (T) versus Reading (G) versus Manchester (C);(3) Portsmouth (C) versus Leeds (G);(4) Glasgow (R) versus Walworth (C).The stores within each group were reasonably comparable in size and
in sales volume in 1990, as well as in measured shoplifting rates. Thestores were either in shopping precincts in city centers (Altrincham,Bradford, Manchester, Portsmouth, Wolverhampton) or on main roadsin city centers or inner-city areas (Glasgow, Leeds, Reading, Walworth).This design allows the comparison of each experimental condition (T,R or G) with a control condition (C), and also the comparison of T with

AN EXPERIMENT ON THE PREVENTION OF SHOPLIFTING 103
both R and G. However, the pretest/posttest comparisons are probablymore important than the experimental-control comparisons.
In addition to the posttest, which was designed to reveal the immedi-ate effects of the prevention strategies, a longer term follow-up wascarried out since it was felt that immediate effects might not be lasting.In most cases, the follow-up measurement was carried out by store staffrather than by management trainees, and less information is availableabout it. However, the staff were specially trained, and they werefamiliar with the measurement technique as a result of their contactswith the trainees in the pretest and posttest weeks. All stores were visitedduring the follow-up weeks by a member of the research team to checkthat the measurement was being carried out efficiently. One effect ofusing store staff was that in some cases only a more limited range ofitems could be counted in the follow-up (only audiotapes, videotapesand headphones).
For the G conditions (Reading and Leeds) and for the C condition(Portsmouth), the follow-up was carried out three weeks after theposttest, that is, from Wednesday February 27 to Saturday March 2. Thiswas the fourth and last week that the guard was stationed in Reading andLeeds. For the T conditions (Altrincham and Wolverhampton), for theR condition (Bradford), and for the C condition (Walworth), the follow-up was carried out six weeks after the posttest, that is, from WednesdayMarch 20 to Saturday March 23. This was the seventh week of thetagging for Altrincham and Wolverhampton.
It was not possible to arrange a follow-up measurement in Glasgow.A follow-up was carried out in Manchester, but the results wereunreliable. Similarly, the results were unreliable in the pretest inReading. Unless the counting and checking are done very carefully andconscientiously, there is the danger that items will be recorded as stolenwhen in fact they have been sold. There are many opportunities for stafferror, including giving away or selling items, and breaking up multi-packs into single items without removing the sticky labels. We have onlyincluded results when we are confident that they are valid.
An attempt was made to rectify the missing pretest at Reading bymeasuring shoplifting there between Wednesday, April 24 and Saturday,April 27, eight weeks after the guard had been withdrawn. This madeit possible to compare a no-guard with a guard condition in Reading.For ease of exposition, this April week will be referred to as the "pretest"week in Reading.

104 DAVID P. FARRINGTON et al
Changes Between 1990 and 1991
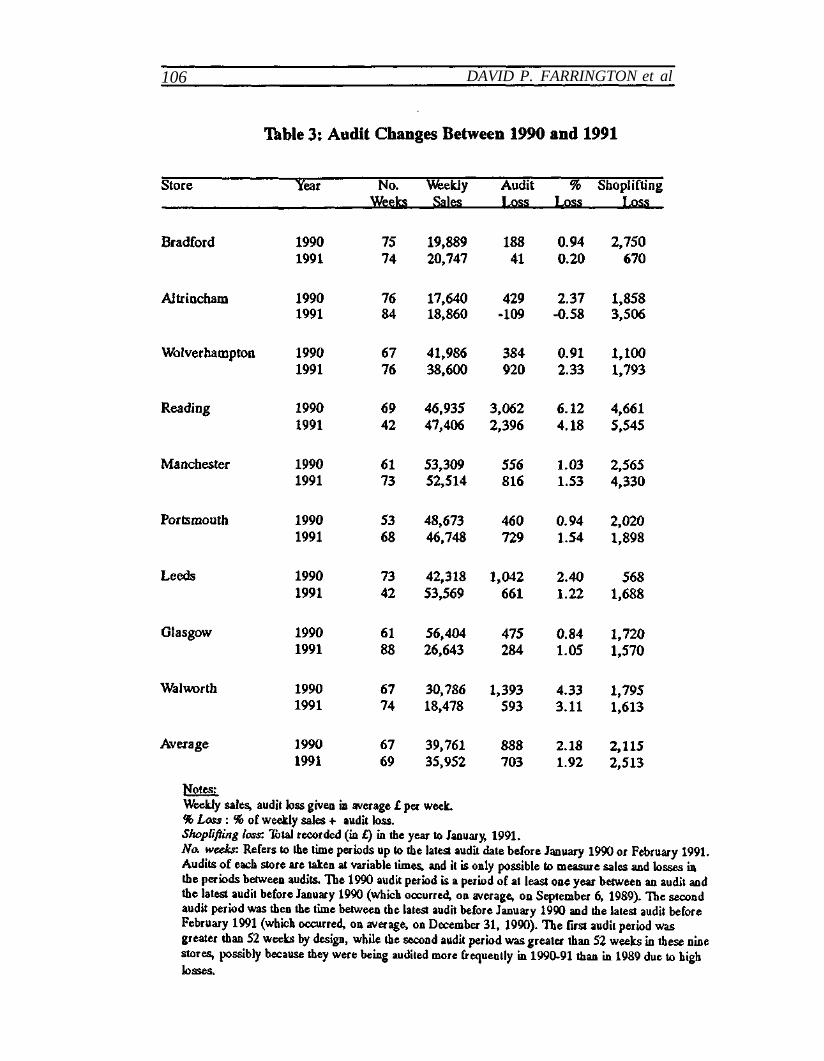
The most important change between January 1990 and January 1991was that the Leeds store had a major refit in the summer of 1990 andmoved to a different location in the same street. Its sales area was morethan doubled, from 2,217 square feet to 5,274 square feet. Hence, Leedsin 1991 was a rather different store from Leeds in 1990. The other eightstores were essentially unchanged.
Tables 2 and 3 show some of the changes occurring between January1990 and January 1991. The same manager survived in only three ofthe nine stores, perhaps reflecting the fact that they were generally incity-center locations with rough customers. The average store had justover 2,500 square feet of sales area in 1991 and six or seven staffmembers usually on duty (according to the management trainees). Theaverage weekly sales of the stores declined by about 10% between 1990and 1991, from £39,761 to £35,952. The decline in sales was especiallymarked for the two Currys stores in Glasgow and Walworth (both in veryrough locations).
The average audit loss also declined, so that on average 1.92% of theitems leaving the store were lost rather than sold in 1991, compared with2.18% in 1990. This decline may have occurred because some of thesestores had been identified for their high audit losses, and correctiveaction had been taken. The recorded shoplifting loss in the year endingJanuary 1991 increased by nearly 20% over the previous year, from£2,115 to £2,513. This only covers large, costly major items whosedisappearance was noticed. It can be seen that the recorded shopliftingloss, at about £50 per week, was far less than the previously measuredloss of essentials, at about £300 per week.
In regard to existing security devices, these stores generally usedloop alarms for large valuable items, kept small valuable items in lockedcabinets and had security cameras (although these were not working inPortsmouth or Walworth). Hence, only the essentials, which wereusually kept in front of the cash desk, were unprotected. After themeasurement study revealed the very high rate of theft of headphones,a new headphone stand was introduced from which it was harder toremove headphones (and harder to knock them onto the floor). Staffwere searched regularly (usually daily) in all stores except Leeds andWalworth.
Table 4 shows the comparability of the shoplifting rates between 1990and the 1991 pretest. For any given store, the comparisons are restrictedto items measured in both years in that store, which means that eachstore is not always exactly comparable to every other store. Also, as

AN EXPERIMENT ON THE PREVENTION OF SHOPLIFTING 105
106 DAVID P. FARRINGTON et al

AN EXPERIMENT ON THE PREVENTION OF SHOPLIFTING 107
already explained, the 1990 figures were based on six days and the 1991pretest figures on four days. Nevertheless, the 1990 shoplifting rategenerally agrees quite well with the 1991 rate, although 1991 rates tendto be lower. In no case was the 1991 rate significantly different from the1990 rate on a difference-of-proportions test, although the Reading rateswere nearly significantly different (p= .06), perhaps because the Read-ing "pretest" was carried out later, as explained above.
RESULTS OF THE EXPERIMENT
Effectiveness of Prevention Techniques
Table 5 summarizes the main results of the experiment. The numberof items measured in each store was restricted to make the pretest,posttest and follow-up measurements comparable. For example, inLeeds, Portsmouth and Wolverhampton, films were measured in thepretest and posttest but not in the follow-up. The restriction of itemsmeant that the results were based on smaller numbers but otherwise didnot materially affect the conclusions. As before, the figures are lesscomparable among stores than over time, although comparability be-tween stores is generally quite good.
The figures in Table 5 show the percentage of items stolen among allthose leaving the store (stolen or sold) and the denominator on whicheach percentage is based. For example, in the Bradford pretest, 61 itemswere stolen and 106 sold, which meant that 36.5% of the 167 items

AN EXPERIMENT ON THE PREVENTION OF SHOPLIFTING 109
leaving the store were stolen. In the Bradford posttest, 10 items werestolen and 56 sold, which meant that 15.2% of the 66 items leaving thestore were stolen. Table 5 also shows the results of difference-of-pro-portions significance tests comparing changes over time and differencesbetween stores. For example, comparing the pretest and posttest inBradford, 15.2% of 66 is significantly (p= .0002) less than 36.5% of167.
Electronic tagging caused a significant decrease in the shopliftingrate in the posttest compared with the pretest in both Altrincham andWolverhampton. Furthermore, in both stores the rate in the follow-upwas significantly less than in the pretest, showing that the benefits oftagging were maintained for several weeks after it was introduced.
Redesigning the store also caused a significant decrease in theshoplifting rate in the posttest compared with the pretest in both Bradfordand Glasgow. However, these benefits were not maintained over time inthe one store (Bradford) where follow-up data were obtained. Six weeksafter the posttest, the shoplifting rate in Bradford was no longersignificantly less than in the pretest.
There was no significant effect of the guard on shoplifting in eitherReading or Leeds, when the posttest was compared with the pretest.However, in the follow-up three weeks after the posttest, the rate washigher in Leeds than it had been in the pretest. The follow-up rate wasnot significantly different from the pretest rate in Reading. These resultsshow that the guards were ineffectual in preventing shoplifting.
In the control conditions, the posttest shoplifting rate was justsignificantly (p= .04) higher than the pretest rate in Walworth, but notsignificantly different (as expected) in Manchester and Portsmouth. Bythe time of the follow-up in Walworth six weeks later, the shopliftingrate was no longer significantly higher than the pretest rate, and thePortsmouth follow-up rate was also very similar to the pretest rate.Hence, the higher posttest rate in Walworth probably reflects a chancefluctuation, and it is likely that there was no marked underlying tendencyfor the shoplifting rate to change nationally during the short time periodof this experiment. During the posttest week, as already mentioned,there was heavy snow. Also, there was a perpetual inventory count in allstores on the Wednesday of the posttest week, which might have resultedin more staff hovering round the displays and hence more deterrence ofthe shoplifting of essentials.
Comparing the tagging and control conditions, Wolverhampton (T)had a significantly lower shoplifting rate in the posttest than Manchester(C), although the two rates had not been significantly different in thepretest. This again confirms the effectiveness of tagging in reducing

110 DAVID P. FARRINGTON et al
shoplifting. However, Wolverhampton (T) was not significantly differentfrom Reading (G), although it was clear that the decrease in shopliftingwas far greater in Wolverhampton. Comparing the tagging and redesignconditions, Altrincham (T) and Bradford (R) were not significantlydifferent either in the pretest or in the posttest, because in both casesshoplifting declined significantly. However, in the follow-up, Bradford(R) had a significantly higher shoplifting rate than Altrincham (T),essentially because the benefits of redesign disappeared over time,whereas the benefits of tagging were maintained.
Comparing the redesign and control conditions, Glasgow (R) andWalworth (C) were not significantly different in the pretest but weresignificantly different in the posttest, essentially because the shopliftingrate decreased in Glasgow (R) and increased in Walworth (C). Theseresults again show the short-term benefits of store redesign. Comparingthe guard and control conditions, Reading (G) was not significantlydifferent from Manchester (C) in either the pretest or the posttest, againshowing the ineffectiveness of the guard. The shoplifting rate in Leeds(G) was lower than in Portsmouth (C) in the pretest, which meant thatthese two stores were less comparable in 1991 than they had been in1990, no doubt because of the major refit of the Leeds store. However,their shoplifting rates were not significantly different in the follow-up.
It can be concluded that: (1) tagging caused a decrease in shopliftingthat was maintained over time; (2) redesign caused a decrease inshoplifting that was not maintained over time; and (3) the guard had nobeneficial effect on shoplifting. The reasons for these results will nowbe discussed.
Tagging
The electronic tagging systems were installed by the Actron company,which also conducted staff training sessions. An alarm was supposed tosound if a tagged item was taken through the door of the store, whichhad been fitted with electronic gates. In some cases, these gates madeit difficult to deliver large items to the store. When the alarm sounded,staff were supposed to approach the customer politely and ask to checkthe tagged item at the till for a possible error. It is extremely difficultto estimate the cost of this electronic tagging system in the long term,but the cost might be of the order of £10 per day per store if it wasassumed that the system would be replaced after five years.
In Altrincham, the staff did not think that the detection rate of taggeditems was very high, but felt that the equipment was a good deterrent toshoplifting. The staff thought that shoplifters would gradually discover

AN EXPERIMENT ON THE PREVENTION OF SHOPLIFTING HI
ways of stealing without activating the alarm, so that any effect of thetagging would gradually wear off. For example, it was possible to leavethe shop with a tagged item by shielding the tag with a coin. The storewas short-staffed, but the staff members were aware of shoplifting andalert. They were efficient in responding to the frequent (almost invari-ably false) loop alarms and never left locked cabinets open. The taggingalarm sounded three times in the posttest week, twice because of stafferror in deactivating tags and once because it was activated by a securitypass. Four essential items (value £39) were stolen in the posttest weekwithout activating the alarm, in comparison with 12 in the pretest week(value £110), so about £18 per day was saved on essentials. In thefollow-up week, two items (value £25) were stolen, representing a savingof about £21 per day.
In Wolverhampton, the staff members were aware of shoplifting butmade no effort to prevent it. There had been a new manager since lastyear, and the store was now better run. The staff became fed up withthe time-consuming process of applying the tags and they were some-times too busy to respond to alarms. The staff thought that the equipmentprobably deterred shoplifters from entering the store, but that potentialoffenders would soon find out that the tags could be peeled off in 30seconds. Indeed, in the first few days some tags were found stuck todisplay shelves, presumably after deliberate removal by customers. Also,items held close to the body would not activate the alarm, and neitherwould items in foil bags (e.g., freezer bags). There were also problemsif a group of people went out together or if people ran through the doorsquickly. The tags were unsuitable for items with a high metal contentsuch as batteries or high quality audiotapes. The trainee thought that thetagging system was unlikely to affect sales but might make staff lessvigilant. The alarm was activated twice in the posttest week, by hoteland factory pass keys. One essential item (value £8) was stolen in theposttest week without activating the alarm, in comparison with 18 in thepretest week (value £242), so about £59 per day was saved on essentials.In the follow-up week, five items (value £65) were stolen, representinga lower saving of about £44 per day.
Store Redesign
The strategy in the redesigned stores was to use the results obtainedin the pretest week to inform changes made before the posttest week(typically, on the Tuesday of the posttest week). Hence, it may be thatpart of the success of this strategy was attributable to the staff'sheightened awareness of the items that were being stolen and the store

112 DAVID P. FARRINGTON et al.
locations that were the most vulnerable. Also, the management traineeswere given a great deal of responsibility in this condition, since to alarge extent they were asked to show initiative and put their own ideasinto practice. Both trainees were highly motivated, but it is unlikely thattheir stake in the success of the measures led to any biasing of theirmeasurement.
The Glasgow store was in a rough area with rough customers. Thestaff members were resigned to shoplifting and did not care much aboutit. The trainee told staff about essentials that were stolen in the pretestweek, but the staff had not noticed anything missing. The main itemsstolen in the pretest week were small packs containing two or threehigh-quality four-hour videotapes from near the floor, in front of thecash desk out of the vision of staff members working at the till.Consequently, the trainee moved these items in the posttest week to ahigher-up, more visible location and replaced them with multi-packs(nine-packs) of videotapes. The staff members were puzzled by this anddoubted if it would do any good, but no videotapes were stolen in theposttest week. The trainee also put up posters warning that securitycameras were operating (although this was not true). The posters weregreeted with cynicism by the staff, but the trainee thought that they werenoticed by teenagers who might be potential shoplifters. On the Tuesdayof the posttest week, the trainee talked to the staff about security, usingthe pretest results and the Dixons security booklet, and thought that staffbecame more sensitive to shoplifting in this week. The trainee alsorecommended placing a perspex shield in front of the shavers andfocusing an operating security camera on the items in front of the cashdesk.
Bradford, like, Glasgow, was a relatively small store, and this limitedthe scope for redesign. Also, Bradford was understaffed. In the pretestweek, the trainee found that essentials in front of the cash desk wereparticularly vulnerable to shoplifting. Consequently, in the posttest weekshe moved some of these items to the stockroom and condensed theremaining items to the front of the stands to make the displays look full.This made it easier to see when an item was taken and also increasedthe staff's visibility of the items. Previously, their vision had beenobstructed by items piled high around the cash desk. The trainee alsodecreased the number of items piled up in dump bins. She would haveliked to move more items into the stockroom but was limited by the spaceavailable.
There were two security cameras in Bradford in the pretest week,but they were not mounted in sensible directions and there were nowarning notices. Consequently, in the second week the trainee cleaned

AN EXPERIMENT ON THE PREVENTION OF SHOPLIFTING 113
up the cameras, pointed them in sensible directions (moving the old-styleheadphone stand in front of one of them), and put up warning noticessaying that security cameras were now recording. She also moved a large9-pack videotape display from a dark corner. The trainee thought thatthe counting did not make the staff more aware of shoplifting, althoughthey did pay attention to groups of schoolchildren and teenagers.
By the follow-up week, the displays had been changed. Indeed, themanager and staff changed displays almost on a daily basis in the interestsof maximizing sales. The display in front of the cash desk was no longerneat. However, the warning notices were still in place. The store waseven more short-staffed, and the effects of the store redesign wereprobably wearing off because the redesign was not maintained over time.
GuardIn Reading, there had been a major security problem about seven
months before, when all existing staff had been dismissed. Conse-quently, security was on everyone's minds. There was high staff aware-ness of local shoplifters and their methods of working, and suspectedshoplifters were carefully watched. A guard came on the Wednesday ofthe posttest week, but no guard came on the Thursday, presumablybecause of the snow (despite promises made in response to repeatedtelephone calls). A different guard came on the Friday and Saturday. Hehad never worked before as a security guard and asked the trainee whathe should do. Both guards were in uniform but were relatively small instature. They spent their time walking around the store and concentratedon the cash desk and doors.
The Leeds store, as mentioned, had moved to a new location in thesame street since the previous year. It was busy and well-staffed. Theessentials were now all behind or very close to the cash desk, whereasthey were displayed more openly last year. This could be one reason forthe decreased shoplifting rate in this store in 1991. The staff memberswere not sensitive to shoplifting and did not think of the implicationsfor shoplifting when they were arranging displays. They thought thatthere was no shoplifting problem. There was no staff training inpreventing shoplifting, and the main priority was on sales. However, themanager was aware that headphones were being stolen. The headphonestand was in a blind spot. The guard was aged nearly 60 and was smalland not well-built. He stood mainly by the door but also walked aroundthe store. He was vigilant towards customers and went over to groupsof young people. However, most customers did not seem to notice him.The staff thought that having a guard was a waste of time, and that a

114 DAVID P. FARRINGTON et al.
guard should be young, tall and strong-looking, with more of a physicalpresence. However, the staff seemed to be even less vigilant when theguard was present.
Hence, the ineffectiveness of the guard condition could have beenpartly a function of the inappropriateness or poor quality of the particularindividuals employed as guards. The cost of a guard was of the order of£50 per day.
ControlsThe trainees in control stores were asked not to tell the staff what
items were being taken or what were the vulnerable store locations sothat there would be no changes in the store between the pretest andposttest weeks.
The Walworth store was in a rough area, with rough customers. Thestaff turnover was high; only one member of staff was left since theprevious year. The staff knew that shoplifting occurred but thought thatthere was nothing they could do to stop it. The trainee thought that thecounting did not make the staff more aware of shoplifting.
In Portsmouth, nearly all essentials were kept in front of the cashdesk, and the staff's view of them was often obscured. Some videotapeswere kept in an open bin. Most items were stolen from the top shelfdisplay in front of the cash desk. The staff members were either boredbecause of the lack of customers or were milling around the cash desk,which may have deterred shoplifters. However, at busy times there werealso customers milling around the cash desk.
In Manchester, the trainee thought that the counting made the staffmore aware of shoplifting. The staff members were very busy and putsecurity far down on their list of priorities. They did not respondpromptly to loop alarms and sometimes left cabinets unlocked. Theheadphones were still on old-style hooks and were in small packets thatwere easy to steal. There were still open bins, audiotapes and videotapeswere in blind spots, and the headphones at the edge of the cash deskcould not be seen. Large groups of youths came into the store andsometimes knocked items off displays and picked them up. However,fewer youths entered in the second week because they were moreinterested in playing in the snow and throwing snowballs.
CONCLUSIONS
The experiment was successful in showing the effectiveness ofelectronic tagging, the short-lived effectiveness of store redesign, and

AN EXPERIMENT ON THE PREVENTION OF SHOPLIFTING 115
the ineffectiveness of the guard. As already mentioned, the ineffective-ness of the guard may have been partly a function of the particularindividuals employed as guards, but it seems unlikely that a guard couldbe cost-effective in preventing shoplifting in the majority of Dixonsstores.
The amount saved by electronic tagging probably exceeds its long-term costs. However, it is not clear whether its effectiveness willgradually wear off as customers devise ways of beating the system.Another problem is displacement. In Peckham, where tagging wasintroduced into the Dixons store, the manager of the nearby Currys storethought that his shoplifting rate had increased markedly as a result. Itwould be desirable to investigate displacement in future experiments.Tagging would not be cost-effective if it merely displaced shopliftersfrom some Dixons Group stores to other Dixons Group stores.
A guard or electronic tagging may possibly be effective and desirablein some stores. However, in the majority of stores, redesign seems themost attractive option. This is a relatively inexpensive strategy. Theexperiment shows that redesign can lead to a marked decrease inshoplifting, but that the decrease is not maintained over time. Thechallenge for the future is to develop a redesign strategy with lastingeffects. This will involve making staff more concerned about shoplifting.At present, staff members are mainly concerned with sales, and shop-lifting has a very low priority, partly because in most cases staff are notaware of it. However, the profits of a store depend not only onmaximizing sales but also on minimizing losses and costs. It is desirableto develop some system of incentives for staff to minimize losses.
Our experience with research on shoplifting in Dixons Group storessuggests that in many cases it would be possible, within one hour ofvisiting the average store, to recommend changes in displays that wouldcause a significant decrease in the shoplifting of essentials. Somechanges might be applicable to all stores. For example, previous researchusing the counting method has highlighted the vulnerability of open binsand of headphones, leading to the company policy to eliminate open binsand to the development of the new headphone stand.
While it is possible to make redesign recommendations based onexperience, recommendations based on one week of measuring shoplift-ing using the counting method may be more convincing to the store staff.This method is likely to be most cost-effective in relatively small storesin inner-city areas with the greatest shoplifting problems. It would bedesirable to carry out further experiments using management trainees.Quite apart from any other consideration, measuring shoplifting bysystematic counting is a useful learning exercise for trainees. It makes

116 DAVID P. FARRINGTON et al.
them more sensitive to shoplifting and also to wider security problemsthrough their contact with the Security Department.
This research was carried out at minimal cost. If significant financialresources were available, items could be counted over a longer timeperiod. It would be desirable to allow more time initially for trainingand practice, and a longer follow-up period after the experimentalintervention. With more financial resources, trained research assistantscould be used rather than management trainees, and reliability checkscould be carried out more effectively. Also, a variety of different retailchains could be studied to see how far the results obtained in Dixonsand Currys stores are generalizable. In our opinion, it would becost-effective to invest in a program of situational prevention of shop-lifting, focusing primarily on store redesign.
The systematic counting method is labor-intensive and laborious, butit yields valid results in most cases. Eventually, computerized stockcontrol methods might be used to measure shoplifting, but these arecurrently prone to staff and system errors, and it seems likely that theywould have to be used in conjunction with systematic counting of stock.A priority for future research is to devise more efficient and moreaccurate methods of measuring shoplifting.
Three key issues were not addressed in our experimental project. Thefirst is the prevalence of staff theft and the effect of shopliftingprevention methods on staff theft. We tried to minimize staff theft in ourresearch. The second issue is the effect of shoplifting preventiontechniques on sales. This could not be investigated in our researchbecause of the freak weather in the posttest week. The third issue isdisplacement. Future research should be designed to address all threeof these important topics.
Our major conclusion is that the method of crime analysis, focusingparticularly on situational prevention, can be used effectively to preventshoplifting. A larger research program on this topic should help tospecify in more detail the conditions (e.g., types of stores, types of area,types of merchandise) under which crime analysis and situationalprevention are more or less effective. The cumulative knowledge thusobtained should help to develop guiding theories (such as rationalchoice), and more detailed prescriptions about crime analysis andsituational prevention, so that shoplifting can be minimized.

AN EXPERIMENT ON THE PREVENTION OF SHOPLIFTING 117
Acknowledgements. We are grateful to the following managementtrainees who collected the data in the nine stores: Elaine Barrowman,Tim Beetham, Sarah Cooke, Matthew Corbyn, Karen Harrison, JoannaMackie, Louise Meadows, Jenny Murphy, and Dominic Sleath.
REFERENCES
Barr, R. and K. Pease (1990). "Crime Placement, Displacement, and Deflec-tion." In: M. Tonry and N. Morris (eds.), Crime and Justice, Volume 12.Chicago: University of Chicago Press.
Buckle, A. andD.P. Farrington (1984). "An Observational Study of Shoplifting."British Journal of Criminology 24:63-73.D.P. Farrington, J. Burrows, M. Speed and T. Burns-Howell (1992)"Measuring Shoplifting by Repeated Systematic Counting." Security Jour-nal 3:137-146.
Burrows, X (1988). Retail Crime: Prevention Through Crime Analysis. London:U.K. Home Office Crime Prevention Unitand A. Lewis (1987). "Stereotyping Shoplifters." Policing 3:226-232.
Carroll, X and F. >\feaver (1986), "Shoplifters' Perceptions of Crime Opportuni-ties: A Process-Tracing Study." In: DR Cornish and R.V. Clarke (eds.),The Reasoning Criminal: Rational Choice Perspectives on Offending. NewYork: Springer-Verlag.
Carter, N., L. Hansson, R Holmberg and L. Melin (1979). "ShopliftingReduction through the Use of Specific Signs." Journal of OrganisationalBehavior Management 2:73-84.A. Holstrom, M. Simpanen and L. Melin (1988). "Theft Reduction in aGrocery Store Through Product Identification and Graphing of Losses forEmployees." Journal of Applied Behavior Analysis 21:385-389.
Clarke, R.V. (1980). "Situational Crime Prevention: Theory and Practice."British Journal of Criminology 20:136-147.(1982). "Crime Prevention Through Environmental Management and
Design." In: X Gunn and D.P. Farrington (eds.), Abnormal Offenders,Delinquency and the Criminal Justice System. Chichester, UK: Wiley.(1983). "Situational Crime Prevention: Its Theoretical Basis and PracticalScope." In: M. Tonry and N. Morris (eds.), Crime and Justice, Volume 4.Chicago: University of Chicago Press.(1992). "Introduction." In: R.V. Clarke (ed.), Situational Crime Prevention:Successful Case Studies. Albany, NY: Harrow and Heston.and D.R Cornish (1985). "Modeling Offenders' Decisions: A Frameworkfor Research and Policy." In: M. Tonry and N. Morris (eds.), Crime andJustice, Volume 6. Chicago: University of Chicago Press.
Cook, P.X (1980). "Research in Criminal Deterrence: Laying the Groundworkfor the Second Decade." In: M. Tonry and N. Morris (eds.), Crime andJustice, Volume 2. Chicago: University of Chicago Press.

118 DAVID P. FARRINGTON et al.
Cooper, R (1989). The Management and Prevention o/Juvenile Crime Problems.London: U.K Home Office Crime Prevention Unit
Cornish, D.E and R.V. Clarke (1986). "Introduction." In: D.B Cornish andR.V. Clarke (eds.), The Reasoning Criminal: Rational Choice Perspectiveson Offending. New York: Springer-Verlag.
Ekblom, P. (1986). The Prevention of Shop Theft: An Approach Through CrimeAnalysis. London: U.K. Home Office Crime Prevention Unit(1988). Getting the Best Out of Crime Analysis. London: U.K Home OfficeCrime Prevention Unit
Farrington, D.P. (1983). "Randomized Experiments on Crime and Justice." In:M. Tonry and N. Morris (eds.), Crime and Justice, Volume 4. Chicago:University of Chicago Press.(1992). "Criminal Career Research: Lessons for Crime Prevention." Studieson Crime and Crime Prevention 1:7-29.(1993). "Motivations for Conduct Disorder and Delinquency." Developmentand Psychopathology 5:223-239.and X Burrows (1993). "Did Shoplifting Really Decrease?" British Journalof Criminology 33:57-69.and R.F. Kidd (1977). "Is Financial Dishonesty a Rational Decision?" BritishJournal of Social and Clinical Psychology 16:139-146.
Gabor, T. (1990). "Crime Displacement and Situational Prevention." CanadianJournal of Criminology 32:41-73.
Hope, T.J. (1991). "Crime Information in Retailing: Prevention Through Anal-ysis. " Security Journal 2:240-245.
LeBlanc, M. and M. Frechette (1989). Male Criminal Activity from ChildhoodThrough Youth. New York: Springer-Verlag.
Masuda, B (1992). "Displacement vs. Diffusion of Benefits and the Reductionof Inventory Losses in a Retail Environment" Security Journal 3:131-136.
McNees, M.P., D.S. Egli, R.S. Marshall, XF. SchneUe and T.R. Risley (1976)."Shoplifting Prevention: Providing Information Through Signs." Journal ofApplied Behavior Analysis 9:399-405.M. Kennon, XF. Schnelle, R.E. Kirchner and M.M. Thomas (1980). "AnExperimental Analysis of a Program to Reduce Retail Theft." AmericanJournal of Community Psychology 8:379-385.
Montmarquette, C, M. Nerlove and P. Forest (1985). "Deterrence and Delin-quency: An Analysis of Individual Data." Journal of Quantitative Criminol-ogy 1:37-58.
Poyner, B and R. Woodall (1987). Preventing Shoplifting. London: PoliceFoundation.
Ray, X (1987). "Every Twelfth Shopper: Who Shoplifts and Why?" SocialCasework 68:234-239.
Sacco, V.F. (1985). "Shoplifting Prevention: The Role of Communication-BasedIntervention Strategies." Canadian Journal of Criminology 27:15-29.
Schlueter, G.R., EC O'Neal, I Hickey and G.L. Seiler (1989). "Rational vs.Nonrational Shoplifting Types: The Implications for Loss Strategies."

AN EXPERIMENT ON THE PREVENTION OF SHOPLIFTING 119
International Journal of Offender Therapy and Comparative Criminology33:227-239.
Thurber, & and M. Snow (1980). "Signs May Prompt Antisocial Behavior."Journal of Social Psychology 112:309-310.
Trasler, G (1986). "Situational Crime Control and Rational Choice: A Critique."In: K. Heal and G. Laycock (eds.), Situational Crime Prevention: FromTheory into Practice. London: Her Majesty's Stationery Office.
U.K Home Office Standing Conference on Crime Prevention (1986). Report ofthe Working Group on Shop Theft. London: author.
Weaver, F.M. and IS. Carroll (1985). "Crime Perceptions in a Natural Settingby Expert and Novice Shoplifters." Social Psychology Quarterly 48:349-359.
West, DLJ. and D.P. Farrington (1977). The Delinquent Way of Life. London:Heinemann.


