MSc Statistics MSc Statistics (Financial Statistics) MSc ...

1
Statistical Potential of Administrative Records
An Examination of Data Holdingsin Six Government Departments
Working Report
For further information, please contact Gerry Brady, Social StatisticsIntegration Division, CSO, 01 498 4006
Central Statistics Office
September 2003

2

3
Contents
PagePreface .............................................................................................................................9
Chapter 1 Background.................................................................................................................111.1 Introduction.........................................................................................................121.2 National Statistics Board Strategy 2003-2008 ...................................................121.3 Steering Group on Social and Equality Statistics...............................................131.4 Examination of data holdings in six government departments ..........................131.5 Brief outline of the report....................................................................................14
Chapter 2 Department of Education and Science ....................................................................152.1 Role and functions of Department ....................................................................162.2 Thematic categorisation of needs and grouping of sources ..............................192.3 Data Sources ....................................................................................................212.4 Main conclusions and recommendations..........................................................292.5 Additional proposals..........................................................................................31
Chapter 3 Department of the Environment, Heritage and Local Government.......................353.1 Introduction.........................................................................................................363.2 Integrated housing system.................................................................................363.3 House price system............................................................................................383.4 Private Residential Tenancies Register .............................................................393.5 National Vehicle & Driver File ............................................................................403.6 Register of Electors............................................................................................423.7 Other data sources.............................................................................................433.8 Statistical potential .............................................................................................443.9 Conclusions and recommendations...................................................................45
Chapter 4 Department of Health and Children..........................................................................474.1 Introduction.........................................................................................................484.2 Examination of individual data sources..............................................................494.3 Other data sources.............................................................................................634.4 Statistical potential .............................................................................................634.5 Overall conclusions and recommendations .......................................................64
Chapter 5 Department of Justice, Equality and Law Reform ..................................................695.1 Introduction.........................................................................................................705.2 The Garda PULSE system.................................................................................715.3 The Courts Case Tracking System ....................................................................725.4 Prisoner Record System ....................................................................................725.5 Registered non-EEA nationals ...........................................................................735.6 Asylum seekers..................................................................................................745.7 Other data sources.............................................................................................755.8 Statistical potential .............................................................................................775.9 Conclusions and recommendations...................................................................77
Chapter 6 Department of Social and Family Affairs .................................................................816.1 Introduction.........................................................................................................826.2 The Central Records System.............................................................................846.3 The Service Delivery Model ...............................................................................866.4 Integrated Short Term Schemes (ISTS) ............................................................876.5 PENLIVE ............................................................................................................89

4
6.6 Review of DSFA claim forms .............................................................................906.7 Classifications and coding practices ..................................................................906.8 Cross cutting aspects.........................................................................................916.9 Overall conclusions and recommendations .......................................................93
Chapter 7 Office of the Revenue Commissioners ....................................................................957.1 Introduction.........................................................................................................967.2 Income Tax system ............................................................................................967.3 Particulars Delivered (PD) Form – ST 21 ........................................................1017.4 Gift/Inheritance Tax Self-Assessment return (IT38).........................................1027.5 Inland Revenue Affidavit form CA24 and CA4.................................................1037.6 Data sources for economic statistics ...............................................................1047.7 Statistical potential ...........................................................................................1047.8 Conclusions......................................................................................................1057.9 Summary recommendations ............................................................................108
Chapter 8 Cross-cutting Statistical Issues..............................................................................1098.1 Introduction.......................................................................................................1108.2 Data integration................................................................................................1108.3 Spatial aspects.................................................................................................1118.4 Data classifications and coding practices ........................................................1138.5 Statistical management of data sources ..........................................................1158.6 Typical strengths in administrative records......................................................1178.7 Typical statistical weaknesses in administrative records.................................1178.8 Access to surveys funded by government departments ..................................118
Chapter 9 Conclusions and Recommendations .....................................................................1219.1 Introduction.......................................................................................................1229.2 A brief review of the policy context ..................................................................1229.3 Conclusions and recommendations.................................................................122
Appendices .........................................................................................................................127
Appendix 1 Membership of CSO teams......................................................................................129
Appendix 2 Reference documents..............................................................................................130
Appendix 3 List of data sources examined................................................................................132
Appendix 4 Data sources questionnaire ....................................................................................136
Appendix 5 Age coding in selected data sources.....................................................................141
Appendix 6 Gender coding in selected data sources ...............................................................142
Appendix 7 Marital status coding in selected data sources ....................................................143
Appendix 8 Nationality coding in selected data sources .........................................................144
Appendix 9 CSO Classifications and Standards Section .........................................................145
Appendix 10 UN fundamental principles of official statistics ....................................................148

5
TablesPage
Table 4.1 Data sources and data holders ................................................................... 49
Table 7.1 Gift/Inheritance tax thresholds.................................................................. 102
Table 8.1 Analysis of selected classification variables........................................... 114
Table 8.2 Examples of nationality codes used for EU and accession states ........ 115
Table 8.3 Some examples of outsourced Department funded social surveys ...... 119

6
Abbreviations
BCG Bacillus Calmette-Guerin vaccine against TuberculosisBUPA British United Provident AssociationCAO Central Applications OfficeCARS Classifications and Related StandardsCAT Capital Acquisitions TaxCB Child BenefitCCEI Central Client Eligibility IndexCCTS Courts Case Tracking SystemCIDR Computerised Infectious Disease ReportingCIS Client Identity ServicesCN Combined NomenclatureCOP Census of PopulationCPA Classification of Products by ActivityCPC Central Product ClassificationCRO Companies Registration OfficeCRS Civil Registration ServicesCRS Central Records SystemCSO Central Statistics OfficeDB Disability BenefitDES Department of Education and ScienceDETE Department of Enterprise, Trade and EmploymentDHC Department of Health and ChildrenDIRT Deposit Interest Retention TaxDJELR Department of Justice, Equality and Law ReformDOB Date of BirthDoEHLG Department of the Environment, Heritage and Local GovernmentDPS Drugs Payment SchemeDSFA Department of Social and Family AffairsED Electoral DivisionEEA European Economic AreaEPA Environmental Protection AgencyERC Education Research CentreERHA Eastern Regional Health AuthorityESF European Social FundESI Educational Services InteractiveESRI Economic and Social Research InstituteEUROCAT European Concerted Action on Congenital Anomalies and TwinsEU-SILC EU Statistics on Income and Living ConditionsFÁS Foras Áiseanna SaothairFOI Freedom of Information ActGCEB Giving Children an Even BreakGIS Geographic Information SystemsGMS General Medical ServicesGMSPB General Medical Services (Payments) BoardGNIB Garda National Immigration BureauGRO General Register OfficeHBS Household Budget SurveyHBSC Health Behaviours in School-aged ChildrenHEA Higher Education AuthorityHIPE Hospital In-patient EnquiryHRB Health Research BoardHS Harmonised SystemIALS International Adult Literacy SurveyIBC Irish Born ChildICBD International Clearinghouse for Birth Defects Monitoring SystemsICD International Classification of DiseasesILO International Labour OrganisationINSPIRE Infrastructure for Spatial Information In Europe

7
ISCED International Standard Classification of EducationISDI Irish Spatial Data InfrastructureISIC International Standard Industrial ClassificationISO International Standards OrganisationISTS Integrated Short Term SchemesJCSP Junior Certificate School ProgrammeLA Local AuthorityLCVP Leaving Certificate Vocational ProgrammeLGCSB Local Government Computer Services BoardNACE General industrial classification of economic activities within the EUNAPS National Anti-Poverty StrategyNBSB National Breast Screening BoardNBSP National Breast Screening ProgrammeNCEA National Council for Educational AwardsNCRB National Cancer Registry BoardNCRI National Cancer Registry of IrelandNCS National Children’s StrategyNCT National Car TestNCTE National Centre for Technology in EducationNDP National Development PlanNDSC National Disease Surveillance CentreNEPS National Educational Psychological Service AgencyNESC National Economic and Social CouncilNESF National Economic and Social ForumNHIS National Health Information StrategyNIDD Notifiable Infectious Diseases DatabaseNISRA Northern Ireland Statistics and Research AgencyNPDF National Planning Data FormNPIPRS National Psychiatric In-Patient Reporting SystemNSB National Statistics BoardNSHQ National Survey of Housing QualityNSS National Spatial StrategyNUI National University of IrelandNUTS Nomenclature des Unites Territorial StatistiqueNVDF National Vehicle and Driver FileODTR Office of the Director of Telecommunications RegulationOECD Organisation for Economic Co-operation and DevelopmentOIB Occupational Injury BenefitOLR On-Line ReviewONS Office for National Statistics (UK)OSI Office for Social InclusionPAYE Pay As You EarnPD Particulars DeliveredPENLIVE Pensions Live systemPES Principal Economic StatusPISA Program for International Student AssessmentPMI Precision Marketing Information LtdPPD Primary Pupils DatabasePPF Programme for Prosperity and FairnessPPS Number Personal Public Service NumberPQ Parliamentary QuestionPRETA Pre-Retirement AllowancePRIS Prisoner Records Information SystemPRSI Pay Related Social InsurancePRTB Private Residential Tenancies BoardPSI Public Service Identity databasePULSE Police using Leading Systems EffectivelyQNHS Quarterly National Household SurveyRAC Refugee Applications CommissionerRACTS Registration and Case Tracking System
8
RAT Refugee Applications TribunalRevenue Office of the Revenue CommissionersRIA Reception Integration AgencySDI Spatial Data InfrastructureSDM Service Delivery ModelSES Socio-Economic StatusSGSES Steering Group on Social and Equality StatisticsSLAN Survey of Lifestyles, Attitudes and NutritionSnoMed Standard Nomenclature for clinical termsSOGSI Senior Officials Group on Social InclusionSP Service ProviderSPAR Statistical Potential of Administrative RecordsSPC Social Protection CommitteeSW Social WelfareSWA Supplementary Welfare AllowanceTCA Tax Consolidation ActUA Unemployment AllowanceUB Unemployment BenefitUNESCO United Nations Educational, Scientific and Cultural OrganisationUPI Unique Patient IdentifierVHI Voluntary Health InsuranceVPT Vocational Preparation TaskVRT Vehicle Registration TaxVRU Vehicle Registration UnitVTOS Vocational Training Opportunity SchemeWHO World Health Organisation
9
Preface
Arising from the report of the National Statistics Board (NSB) on social and equalitystatistics1, the Government requested the CSO to take a lead role in the development of thepotential of administrative data across government departments and agencies in conjunctionwith the Senior Officials Group on Social Inclusion (SOGSI). The Government also decidedthat a formal data/statistics strategy be developed within each department as part of itsinformation strategy; and that the NSB, supported by the CSO, should develop best practiceguidelines for departments for the preparation and implementation of a formal data/statisticsstrategy.
In response to the Government request, the CSO established teams to examine thestatistical potential in six government departments and to prepare a report by end-July. Theexamination was designed to focus mainly on areas of social statistics and also to identifythe potential additional value to be gained if some of the administrative data holdings couldbe integrated.
This report should be considered to be a "working report" and reflects the interactionsbetween the CSO teams and a selection of contacts in the six departments. Nevertheless,because some key issues are addressed and valuable recommendations made, the report isbeing made widely available and has also been released on the CSO website (www.cso.ie).The intention is to continue the review of the potential for social statistics in a further three orfour departments; and then to consider (with the NSB) the potential of administrative data forother fields of statistics.
Chapters 2 to 7 of this report present the analyses and main recommendations of the teamsin each of the six departments. Chapter 8 addresses some key issues which would facilitatethe integration of data for statistical and analysis purposes across government departmentsand which would ultimately be of benefit to the public in the form of better policy responsesand more cost-effective public administration. Among these important issues are the wideruse of the Personal Public Service (PPS) Number; the benefits and efficiencies of usingstandard classifications and coding systems as widely as possible; the importance ofstructuring data to support the National Spatial Strategy and the provision of regional datagenerally. The report concludes in chapter 9 with a list of 21 recommendations; nine of whichare specific to particular departments and twelve of which are of a cross-cutting nature tofacilitate the development of a more comprehensive and integrated system of statisticsacross the public service. The recommendations are best understood in the context of thediscussion in the various chapters.
Readers will be struck by the key, central importance of the PPS Number in integrating datafor statistical and analysis purposes. It is not difficult to think of situations where a wider useof the PPS Number could be of direct benefit to individuals and to society. Therefore, asrecommended by the NSB, the CSO will be developing protocols in relation to the properuse of administrative data for statistical purposes within a framework which is acceptable tothe Data Protection Commissioner.
Donal GarveyDirector General
1 NSB (2003): “Developing Irish Social and Equality Statistics to meet Policy Needs”

10

11
Chapter 1Background

12
1.1 Introduction
This report presents the findings of an examination of the data holdings in six governmentdepartments2. The report is primarily focussed on data holdings in the six departments ofrelevance to social statistics. The report was compiled by the CSO in response to aGovernment decision that the CSO should take the lead role in the development of thepotential of administrative data across government departments and agencies and otherbodies reporting to these Departments3. This chapter describes the background to thisdecision and the initial work being undertaken by the CSO to implement it.
1.2 National Statistics Board Strategy 2003-2008
The NSB is responsible to Government for setting priorities for the compilation anddevelopment of official statistics in Ireland and for guiding the strategic direction of theCentral Statistics Office (CSO). In its Strategy 2003-20084, the NSB outlined its approach fordeveloping the Irish Statistical System. It recommended a networked approach, acrossgovernment departments and agencies, to ensure that statistics were delivered cost-effectively and that statistical surveys and information collected through administrativesources were fully integrated into the system of official statistics. Such a whole-systemapproach was seen as necessary to ensure that Ireland could produce statistics thatpermitted objective evaluation and monitoring of economic and social progress in Ireland. Inthe case of administrative data, the NSB recommended a strategy whereby:
♦ Data in individual departments and agencies would be capable of integrationboth within and across departments;
♦ Data in individual departments and agencies would be capable of being used forlongitudinal analysis; and
♦ The burden on users of State services and those delivering the services inrespect of generating data capable of statistical analysis would be minimised.
The NSB concluded that a network approach across government departments was requiredto implement this strategy effectively. The NSB proposed that the CSO should take a centralrole in the development of the potential of administrative data across governmentdepartments in conjunction with senior cross-department management groups, such as theSenior Officials Group on Social Inclusion (SOGSI) in the case of social statistics5. TheNSB’s view is that the provision of adequate statistical information should be regarded as adesired output of administrative data sources in the public sector. The statistical potential ofthese data sources should be assessed, the potential fully developed where appropriate,and greater consistency in their statistical management should add significantly to theirinformation value.
2 Education and Science; Environment, Heritage and Local Government; Health and Children; Justice, Equalityand Law Reform; Social and Family Affairs; and the Office of the Revenue Commissioners.3 For convenience, these departments, agencies and bodies will generally be referred to as governmentdepartments throughout this report4 NSB (2003), “Strategy for Statistics 2003-2008”5 The central role for the CSO in the development of administrative records for statistical purposes is alreadyestablished in the Statistics Act, 1993.

13
1.3 Steering Group on Social and Equality Statistics
A Steering Group on Social and Equality Statistics (SGSES) was established in mid-2002 toundertake a scoping study on Irish social and equality statistics. The group comprised keypolicy and statistical staff in relevant government departments, CSO staff and experts withexperience in analysing social data in Ireland. The group published its report in April 20036.The Government memorandum accompanying the SGSES report contained the followingprovisions:
♦ The CSO will take a lead role in the development of the potential ofadministrative data across government departments and agencies in conjunctionwith the SOGSI. In particular, two actions are essential to tap into the potentialdata resources at both departmental and agency level:
• Increased standardisation, co-ordination and classification of datacollection and maintenance to be agreed inter-departmentally; and
• Investigation of the expanded use of common identifiers, such as thePersonal Public Service Number (PPS Number) or postal codes, ifdeveloped.
The Government and social partners included this commitment in the social partnershipagreement 2003-2005, Sustaining Progress7.
1.4 Examination of data holdings in six government departments
With a view to giving effect to the commitments set out in the SGSES report, the DirectorGeneral of the CSO established six CSO teams to examine the statistical potential of dataholdings in six government departments. This initial examination, known as the SPARproject (Statistical Potential of Administrative Records), was designed to identify the potentialvalue in the individual data holdings in these departments and the potential additional valueto be gained if some of these data sources could be integrated. The membership of theteams comprised a mix of experienced Senior Statisticians and Statisticians in the Cork andDublin offices of the CSO (see Appendix 1). The Director General secured the support of theSecretary General of each of the six departments and agreed contact persons in thedepartments for the work of the SPAR teams.
The following were the terms of reference given to the teams by the Director General:
♦ To prepare a report, by end-July, on the statistical potential for key policypurposes of departmental data holdings.
♦ The report should take account of the variables already available in certain dataholdings and how they are captured (whether in standard or non-standardformats). It should comment on the additional value to be gained by capturing thedata according to recognised statistical classifications and standards.
♦ In the context of cross cutting issues, the report should make proposals on theadded value potential of capturing as part of the data sets a linking capability (the
6 NSB (2003): “Developing Irish Social and Equality Statistics to meet Policy Needs”7 Department of the Taoiseach (2003): “Sustaining Progress, Social Partnership Agreement 2003-2005”

14
PPS Number) or additional or re-oriented variables (e.g. date of birth instead ofage).
♦ While the focus of the SGSES work related to social statistics, this effort shouldtake into account (to the extent feasible) other important departmental dataholdings that may exist.
The main objective of the project was to identify possibilities for enhancing the long-termstatistical potential of the data holdings in the six government departments.
Working procedures
Initial internal meetings were held, where the teams reviewed the SGSES report and agreeda questionnaire to ensure that a consistent approach was taken across the six departments.The teams were also briefed on the main points of the NSB’s 2003-2008 Strategy to ensurethat their approach was consistent with the principles outlined in the Strategy. The NSBproposed that all official statistics produced in Ireland should be compiled to bestinternational standards and that all the cross cutting potential of existing data sources ingovernment departments should be fully realised.
The teams conducted their work with the six departments, and their associated bodies,through a mixture of direct meetings, telephone and e-mail contact. As well as holding aconsiderable number of meetings directly with contact officials in each department, theteams also met with staff in a number of departmental bodies, e.g. the Higher EducationAuthority and the General Medical Services (Payment) Board. In addition, the teamspresented their draft chapters for comment to the staff with whom they worked in the variousdepartments. The project was co-ordinated through regular meetings of the six team leadersand support staff mainly from the Social Statistics Integration Division of the CSO.
The CSO, on behalf of the teams, would like to thank the staff in the six departments for theirconsiderable input into this report.
1.5 Brief outline of the report
Chapters 2 to 7 present the findings of the teams in each department. The findings aregenerally presented as reviews of the individual major data sources or systems in the sixdepartments.
Chapter 8 describes the Client Records System (CRS) operated by the DSFA and therelated issue of the use of the PPS Number. Chapter 8 also outlines the keyrecommendations of the teams on common inter-departmental issues such as the benefit ofusing standard data classifications, statistical management of the individual data sourcesand other cross-cutting issues.
Chapter 9 summarises the key conclusions and recommendations of the teams.

15
Chapter 2Department of
Education and Science

16
2.1 Role and functions of Department
The mission of the Department of Education and Science, as set out in its statement ofstrategy 2003-2005, is to provide for high-quality education, which will:
♦ Enable individuals to achieve their full potential and to participate fully asmembers of society; and
♦ Contribute to Ireland's social, cultural and economic development.
This mission statement explicitly reflects the dual aim of the education system. It is focussedon the needs of the individual. It is also focussed on the needs of society. The Department isinvolved in the provision of education at pre-school, primary and post-primary school, and atuniversities and other third level institutions as well as adult and further education.
The major functions of the Department are in respect of policy formulation, resourceallocation and the evaluation of performance and educational outputs. These three majorfunctions are of course interlinked, as the evaluation of performance and outputs from theeducation system feed directly into the areas of policy formulation and resource allocation.
In recent decades, there has been a growing awareness that education is broader than justthe delivery of curricula in schools. Education is seen as a lifelong process in which schoolsplay a crucial role. Data on educational spending, resources, enrolment and outcomes needto be placed in the context of lifelong learning and the information needs of variousstakeholders. The quality of educational outcomes and their relationship to learningprocesses in schools has come to the fore in international comparisons as well as policyanalysis at national level. There is increased pressure to go beyond statistics of enrolment,teachers and spending - crucial as these are to policy planning and information - and todevelop indicators of system performance and quality of educational outcomes, inputs andprocesses.
Some key areas of policy priority relate to:
♦ Social inclusion and broader educational equality and equity issues. The mostrecent partnership agreement8 states that "education has a fundamental role inproviding full access to life chances and breaking the cycle of disadvantage";
♦ Benchmarking of skills in the adult population;
♦ Indicators of educational achievement at primary and second level;
♦ Trends (past and projected) in enrolment, teaching staff and expenditure at eachlevel of education;
♦ International comparisons across all areas of education;
♦ School-level indicators of performance;
♦ Special needs education and associated indicators and measures; and
♦ Participation in education, training and learning outside the formal educationsector (including early childhood education and care). This particular areaunderscores the necessity for cross-departmental co-operation.
8 Department of the Taoiseach (2003): “Sustaining Progress, Social Partnership Agreement 2003-2005”

17
Traditionally, the Department has been focussed on operational matters and educationalinputs. However, following on from a report on the Department’s operation, systems andstaffing, chaired by Mr. Séan Cromien (former Secretary of the Department of Finance), theDepartment’s latest Statement of Strategy has highlighted the "absolute need to shift from itsoverwhelming focus on day-to-day operational matters to a situation where serious attentioncould be given to the vital areas of policy development, planning and evaluation". This up-front acknowledgement that, to date, the Department has not been in a position to giveserious attention to policy development and evaluation provides a useful insight into howdepartmental data holdings have been regarded historically. The Statement of Strategycommits the Department to developing a stronger planning capacity and to making betteruse of existing evidence and research.
Location of data holdings and role of the Statistics Section
While there is quite an amount of data in existence, meeting the key policy needs of theDepartment will require more than a greater appreciation of the existing data. There areareas where it will require more fundamental evaluation of the type of data that should becollected and held by the Department. This is because the range of sources currentlyavailable to the Department (surveys and administrative sources) allows identification ofoutcomes at a general level only. The current sources do not, however, provide an adequatebasis for decisions on educational interventions and monitoring at the level of the individualpupil.
There are, in all, 27 bodies or agencies under the aegis of the Department. Some of thesebodies maintain their own administrative data holdings. The Higher Education Authority(HEA) is perhaps the largest body falling under this category. The National Centre forTechnology in Education (NCTE) also maintains its own data sources. Also, quite an amountof research is conducted by outside organisations - the Educational Research Centre (ERC),the ESRI and many other external organisations conduct research commissioned by theDepartment or by its agencies. Where research is conducted by an external organisation,the norm is that the raw micro data are held by that external organisation.
Within the Department, data holdings are held and maintained by line sections. This has ledto a situation whereby data holdings are not well connected in a physical or conceptualsense.
Within the Department there is a small Statistics Section. This section consists of a SeniorStatistician, a Statistician and seven (full-time equivalent) administrative staff. The bulk of thework of the administrative staff is taken up with the collection of information for the AnnualCensus of Primary Schools and the collation of aggregated data from other sources (otherline sections within the Department and outside agencies such as HEA). Much of this work isfor the purpose of producing the Department's Annual Statistical Report, which is acomprehensive publication giving detailed information primarily concerning educationalinputs (number of pupils, number of teachers, certain expenditures). The Senior Statisticianand Statistician service policy areas of the Department by collating and analysing data - forinstance projecting future enrolments and supply and demand for teachers, sourcing data forPQ responses, reporting on equity issues at third level, interpretation of results ofeducational research, etc. Servicing international requests for information (from EU, OECD,UNESCO) has also been consuming a growing proportion of the resources of the section.

18
Approach of SPAR team
The initial approach adopted by the DES SPAR team was to list and prioritise thedepartmental data holdings with a view to investigating:
♦ The potential for aligning the data sources more closely with departmentalneeds;
♦ The potential to draw on existing information from data holdings of otherdepartments; and
♦ The potential to share information from DES data holdings with otherdepartments with a view to meeting their data needs.
In essence, the SPAR project was to be a "bottom up" exercise which primarily focussed ondata sources. This approach, however, was predicated on having detailed information aboutthe contents of each data source. The main point of contact with the Department was withthe staff of the Statistics Section, who were not in a position to readily supply lists ofvariables together with coding frames. In some cases the documentation required did notexist in readily accessible formats. In other cases, it simply was not possible to contact all ofthe relevant outside agencies in the time available. There were, in all, 34 sources listed as aresult of the SGSES exercise. With the benefit of hindsight, it is now apparent that theDepartment was probably too thorough in its compilation of the initial list. Line sections listedsources that were essentially once-off surveys rather than major or recurring data sources.However, even a superficial appraisal of these sources by the SPAR team and the staff ofthe Statistics Section was time consuming. It is worth noting that the lack of a structured wayof sharing information (e.g. groupware) within the Department made it difficult for the staff ofthe Statistics Section to point us in the precise direction of all relevant information.
In the event, even a preliminary appraisal of the 34 listed sources led us to consider thecoherence of the data holdings and the purposes they served. This led us back toconsideration of departmental needs. This could be considered a "top-down" approach. Thecontents of this chapter are, therefore, the output of a process that attempts to marry themain needs to the supporting data infrastructure. This was a difficult and ambitious task asthe development of a stronger statistical and information base in the Department will requirea more precise articulation of the links between statistics, needs for policy purposes,administrative needs and evaluation than is available at present.
Departmental needs and sources
An inventory of data needs was supplied for the SGSES report. This work was also co-ordinated by the Statistics Section. All policy sections were contacted and each specified itsown needs. As well as ongoing administrative needs, many newer needs (generated byNAPS, NDP and Sustaining Progress) were included. Also, each need was categorised as towhether or not it was being met and by a priority indicator. From this, it is apparent that manyhigh-priority needs have yet to be met. In fact, it is difficult to see how some of the needscould be met from existing sources. Also, of the higher priority needs that are being met,there are question marks over the quality of some of the indicators in use9.
The issues of educational disadvantage (see Section 2.5) and educational interventions arerecurring features of the data needs of the Department. The importance of early identificationof educational disadvantage and subsequent intervention is considered critical. 9 This latter point is particularly relevant to those indicators that refer to, or need to be disaggregated by, socio-economic status or educational disadvantage

19
Disaggregation of many indicators by ethnicity, socio-economic status and schooldisadvantaged status are included in the list of needs. However, at primary level, no data atindividual pupil level are held by the Department. Annual reporting is at the level of theschool, grade and class. Making recommendations involving minor changes to this sourcewould not be productive, since the Department has recognised that a Primary PupilDatabase (at individual level) needs to be introduced. Instead, we propose a possiblesolution that may enable an elementary database to be operational relatively quickly,whether as an interim measure or otherwise.
At tertiary level, the Department is responsible for the administration of Institutes ofTechnology and certain other institutions. The HEA is responsible for Universities and someother colleges. At present, the type of data holdings differ according to the type of institution.However, it is planned that the HEA will assume responsibility for all third level institutions in2004. In light of this, we spoke directly to the HEA to establish their plans for data holdingsfrom 2004, rather than focussing on the existing third level sources maintained by theDepartment.
2.2 Thematic categorisation of needs and grouping of sources
Instead of addressing the stated needs individually, we deemed it more appropriate tocategorise them thematically. This made it possible to deal with every source (or group ofsources) and to consider the potential of each source to meet needs around each theme.This was done in recognition of the fact that the expressed needs may not be fixed - wewould expect that improving the potential of a source would lead to a refocusing of needs.The themes we identified were:
♦ Equity and equality issues, including access, educational disadvantage, andeducational interventions;
♦ Attainment and achievement, retention issues, and effectiveness of theeducational system; and
♦ Life outcomes for individuals.
Obvious themes that are not included are expenditure, physical infrastructure and enrolmentprojections.
The data sources were categorised as follows -
♦ Primary level sources - the Annual Census of Primary Schools;
♦ Second level sources - the Post Primary Pupils database;
♦ Surveys of achievement at Primary and Secondary level (ERC);
♦ State Examination Results;
♦ Third level administrative sources, and the National Survey of Access to HigherEducation;
♦ Destination of exits surveys - Survey of School Leavers (ESRI) and the FirstDestination Report (HEA) ; and
♦ General Population Surveys (QNHS, EU-SILC, HBS, IALS).

20
2.2.1 Measuring inputs and outcomes - potential use of PPS Number
It is sometimes assumed that data needs for administration are different to data needs forstatistical purposes. However, it could be argued that this is not the case in DES. Themission statement makes clear that a primary focus of the education system is on the needsof the individual. Many of the needs expressed by the Department relate to educationaloutcomes (for the individual). Many of the newer needs reflect a focus on targeted outcomesfor educationally disadvantaged children10. There are many schemes targeted atdisadvantaged children (or more often, targeted at schools deemed to have measuredconcentrations of disadvantaged children). However, in order to target disadvantagedchildren, one must first identify them. In order to assess the effectiveness of the targetededucational interventions, one must have the capacity to measure the outcomes for thoseindividuals. In other words, there needs to be a strong capacity for longitudinal tracking ofindividuals through the education system - and beyond. There is already an amount ofinformation held system-wide which relates to certain outcomes for individuals through thesocial welfare system and revenue files, and these sources hold the PPS Number. However,currently there is no systematic method used to relate these particular individual outcomes toeducational inputs - the initial demographic and socio-economic characteristics of theindividual, the educational institutions attended, the types of educational interventions or thelevels of attainment reached.
At the initial stage of the educational cycle (primary level) no information is currently held onthe background of the individual pupil. However, DSFA holds much information relating tothe demographic and socio-economic situation of families (through means tested schemesand the child benefit system).
A recurring feature of this chapter is the highlighting of the role that could be played byRevenue and DSFA sources in measuring both inputs to the educational system andoutcomes for individuals through more systematic use of the PPS Number.
2.2.2 Geographic coding, catchment areas, and enrolment projections
Many departmental sources include address information. In many cases (pupil/studentdatabases, whether existing or proposed) the addresses are those of individual students.Usually, the address data is coded to county level (or for Dublin, postal district). Theavailability, and use of, an automatic geo-coding system across all departments wouldgreatly enhance the value of this data, while simultaneously reducing the overheads involvedin assigning county codes to address strings.
For instance, there are reasons why the Department might be interested in the catchmentarea of schools or third level institutions. Also, when projecting enrolments, the Department'spractice is to project from the number of births, while making assumptions about inward andoutward flows. As PPS Numbers are assigned to every child born and the address of a childis held on the DSFA Central Records System (for the purposes of administering the childbenefit scheme), it may be that the accuracy of enrolment projections at a local level couldbe enhanced.
In Section 8.3 there is a description of developments in unique addresses and geo-coding.
10 The Education Act defines educational disadvantage as "the impediments to education arising from social oreconomic disadvantage which prevent students from deriving appropriate benefit from education in schools".
21
2.3 Data Sources
2.3.1 Primary level sources - the Annual Census of Primary Schools
The Annual Census of Primary Schools is conducted by means of paper questionnaire toalmost 3,300 principals of aided primary schools. The returned questionnaires are keyed bystaff of the Statistics Unit (for the most recent census, this work was outsourced). Schoolprincipals complete the questionnaire. The information requested is at aggregate level. Arow of the questionnaire is allocated to each class within the school. In each row, there arefields for number of pupils by gender, as well as number of pupils by year of birth. Someinformation (at school level) on the number of children with special needs taught in specialclasses within ordinary schools is included - the Department uses its own disability codingstructure (13 types in all). Although called "disability", this variable includes codes referringto special or social needs as well as disability.
It is acknowledged by the Department that this source is inadequate for the needs (policyand administrative) of the Department. Central to this thinking are issues around thedesignation of disadvantage and the allocation of resources to counter disadvantage. TheDepartment uses the concept of "disadvantaged school status" as a means of deciding onthe type and level of additional resources that should be allocated to a school. This status isallocated partly by estimates of the numbers of pupils whose families qualify for medicalcards. These estimates are made by school principals. It is not clear whether the estimationprocedure is carried out using the same objective criteria by all principals. Many of the listedperformance or effectiveness needs at primary level include disaggregation by "schooldisadvantaged status". Some also refer to disaggregation by ethnicity, refugee status,membership of the traveller community as well as socio-economic status.
A departmental priority is the establishment of a Primary Pupils Database - at individual pupillevel. A project team within the Department is currently undertaking a requirement analysis.This is part of a wider initiative - the Educational Services Interactive Project (ESI). InSection 2.5, we outline an approach that the Department may wish to consider as an interimsolution, pending the development of a more advanced system.
One of the major advantages of having a Primary Pupils Database would be that pupil PPSNumbers could be collected. It would be difficult to overstate the value of this information. Interms of educational disadvantage, it should facilitate designation of disadvantaged status toan individual rather than a school, by referencing data on means tested schemes in DSFA.In terms of disability and special needs, an indicator could be attached to the individual -again, using records of other departments that include the PPS Number. Obviously, not allrelevant information may be available from other departmental holdings. The systematiccollection of data on variables related to educational disadvantage and other variablesknown to affect the educational attainment/achievement of children needs to be seriouslyconsidered. There are issues around whether that data should be collected by schools andreported to the Department or whether the collection should be done centrally by theDepartment (for instance postal questionnaire to the homes of all entrants to the primarysystem). The latter would be appropriate if it were considered that certain relevantcharacteristics were sensitive and need not be known to the school or teacher foreducational purposes.
As regards educational interventions or specific schemes addressing educationalinterventions, an indication of the intervention or scheme from which the pupil has benefitedcould be included in the record (rather than indications of schemes that the school has beenentitled to). This would facilitate evaluation of the effectiveness of various schemes. Forinstance, when choosing a sample to test literacy or numeracy attainment at various stagesof the cycle (see section 2.3.3), having access to demographic and socio-economic

22
information, as well as information on interventions at individual level, would be powerfulauxiliary information in selecting samples for testing. As well as providing a solid weightingstructure to extrapolate results to national level, it would provide a basis for evaluating andcontrasting attainment according to the type of educational intervention.
As a source of indicators of outcomes in adult life, the inclusion of the PPS Number atprimary stage would allow an individual’s educational record to be related to employmentand other outcomes in later life - either through administrative sources or household surveysin which the PPS Number is collected.
2.3.2 Second level sources - the Post Primary Pupils database
Unlike the Primary Schools data, Post Primary data are held at individual student level.Every October, each of the approximately 750 schools submits a return directly to theDepartment. Most of the returns are made on diskette using one of two software packages(both of which are supplied by external companies). A large amount of information is heldrelating to each individual student. The main variables held are student name, address, dateof birth, sex, nationality (if not Irish), entry date, course or programme code, programme yearand repeat year indicators. Importantly, the PPS Number is included (at the moment, PPSNumbers are not collected by the school for new entrants, but are matched with DSFA usingaddress strings and the PPS Number is then issued to the school through the Department).About 95% of students currently have a valid PPS Number attached. Importantly, for thosestudents who left school without completing the senior cycle a "Left Early Indicator" isattached to the student's record. As well as the date left (which is for the previous academicyear) a variable indicating the destination (whether pursuing further education in anotherschool or third level institution, gone into employment, apprenticeship, etc.) of the student isincluded. This is particularly relevant to Section 2.3.6, which deals with destination of exitssurveys.
The system also caters for ESF funded initiatives (VTOS and VPT2). The system also actsas an application point for State examinations. Subject markers are attached to eachstudent, with indicators of subject level for those due to sit examinations (Junior Certificate,JCSP, Leaving Certificate, and LCVP). Upon receipt of the file, examination numbers areissued - while PPS Number is not included in examination databases, a one-to-one linkbetween PPS Number and examination number is available (provided that the year of sittingthe examination is known).
The system also includes information at the level of the school: unique school number;school year; official school name and address and contact details; and Health Board Areaand Community Care Area (for EHB and SHB only) - most of the school level details wouldremain constant from year to year.
As data entry is mainly carried out locally by the school using customised packages, thereare logistical difficulties for the Department in ensuring timely and accurate returns. A verydetailed manual is supplied to schools each year that highlights any changes to the systemfrom the previous year. However, delays and quality problems arise if "the person whoknows how to use the package" within the school is not available. Also, as the system issupplied by a private company, implementing year on year changes can be problematic (andexpensive) for the Department.
The introduction of a Primary Pupil Database would have implications for operation of thePost Primary Database. For instance, the availability of the PPS Number on the primarydatabase will mean that information can be carried through directly from it to the post

23
primary database11. Issues relating to educational disadvantage, disability and special orsocial needs (referred to in the previous section) are of course also relevant at post primarylevel.
2.3.3 Surveys of achievement at First and Second level
The ERC conducts a number of surveys of educational achievement at various levels of theprimary and second level cycle on behalf of the Department. Among these are:
♦ National Assessment of English Reading, which is an investigation of standardsof reading among pupils in 5th class. Almost 4,000 pupils in 150 schools areassessed. It was carried out in 2003 and will be repeated in 2006 (in order tomeasure achievement of target set out in NAPS);
♦ National Survey of Mathematics Achievement, which was conducted in 1999among pupils in 4th class. Almost 5,000 pupils in 120 schools were assessed bymeans of written test. It is intended that the results of this survey will providebenchmarks to assess performance when the survey is repeated, probably in2005;
♦ Suirbhé Náisiúnta Inniúlachta sa Ghaeilge I Rang a Sé, which was conducted in2000 and was a study of the achievement in the Irish language of pupils in 6th
class. About 4,000 pupils in about 220 schools participated; and
♦ Survey of Reading Literacy in Designated Disadvantaged Schools, a survey ofabout 1,200 pupils in 70 schools designated as disadvantaged (see discussion ofdesignation criteria in Section 2.5). It was carried out in 2003 and will berepeated in 2006 (in order to measure achievement of target set out in NAPS).
The above were all conducted by means of testing with supplementary questionnaires forthe school and parent. All are designed to establish the factors that influence achievementincluding, of course socio-economic and other factors at the level of the individual pupil. Allare relied on heavily to produce many of the indicators listed as data needs by theDepartment.
Program for International Student Assessment (PISA)
The Program for International Student Assessment was carried out by the ERC on behalf ofthe Department. It was part of an international exercise, 27 other OECD countries and fourother countries participated. In Ireland, almost 4,000 students in 139 schools wereadministered tests to assess achievement in reading literacy, mathematics literacy andscientific literacy. PISA is run on a three years cycle. In 2000 the major focus was on readingliteracy, while in 2003 and 2006 the major focus will be on mathematical literacy andscientific literacy, respectively. As well as the tests, questionnaires are also administered tostudents with questions concerning family structure, socio-economic status of parents, andhighest level of education of parents. A questionnaire is also completed by schools whichcollects information on the school environment.
The results of the 2000 PISA study for Ireland highlighted certain factors that affectperformance. For instance, socio-economic status and highest level of educationalattainment of parents were found to be significant predictors of performance. Being from a
11 There are arrangements between primary schools and secondary schools regarding the forwarding ofinformation at the individual pupil level. Links between the two pupil databases could formalise this transfer ofinformation so that the flow of data would be between schools and the department.
24
large family or part of a lone parent family were found to have a negative influence onperformance.
While aggregate findings like these are extremely valuable from a policy perspective, theybring even more into focus the need for a Primary Pupil Database, which would includeindicators of the factors influencing performance. Such a database could be used as asampling frame for testing, while simultaneously controlling for educational intervention sothat measures of effectiveness of the intervention could be more precisely developed. Ofcourse, the availability of individual databases at primary and secondary level would facilitatelongitudinal testing which would be a powerful tool from the perspective of educationalresearch.
Individual level databases (with the relevant indicators) could be used in conjunction withmore widespread testing to measure the effectiveness of schools12. Results of testing(whether once off or as part of a longitudinal programme) could be evaluated in the contextof individual pupil characteristics as captured on the pupil database.
2.3.4 State examination results
The Post Primary Pupil Database is the initial source for the identifier information held on theexamination database. The pupil database contains indicators of examination entries,including information on subjects and levels to be taken. Details of pupil name, address,gender, as well as the school identifier are fed from the pupil database to the examinationdatabase which is held by the newly established Examinations Commission (formerly theExamination Section of the Department). Recently, the PPS Number has also been suppliedalthough this is not yet used systematically.
In order to confirm medical card status, the Examination Commission issues a form to allstudents. This information is required to assess eligibility for (waiving of) examination fees.This information on medical card eligibility is currently the only source of socio-economicinformation about examination entrants. This is mentioned because it is significant that somedirect collection of information at individual level is already carried out around the time ofstate examinations. It is relevant to Section 2.5, where the idea is proposed of collectingmore complete socio-economic information at this stage of the education cycle.
Essentially, the above identifier details (with the notable exception of PPS Number) arepassed to the Central Applications Office (CAO) along with examination outcomes so thatapplications for third level places can be processed.
Links at individual level between the examination database and the Post Primary PupilDatabase are possible but tortuous. This process would be greatly simplified if the PPSNumber were forwarded directly.
2.3.5 Third level administrative sources and National Survey of Access to HigherEducation
As the HEA is due to assume administrative responsibility for all third level institutes from2004, it is more appropriate to describe its planned data holdings rather than address thedata holdings currently held by the Department for institutes of technology and some otherthird level institutes. The HEA is currently building a data collection system that will
12 School effectiveness cannot be assessed by measuring achievements in literacy or numeracy alone. It shouldalso be pointed out that we haven't been told by the Department that this type of measure is a current need. Wemention it because it may become a departmental need in the future, especially if the statistical infrastructureexists to support it.

25
eventually be used by all third level institutions. The impetus for this system comes in partfrom a recommendation of the Higher Education Statistical Review Group. This group,chaired by the HEA, also included representatives from the Department, Forfás, NCEA,CAO, Universities and other third level institutions and ESRI.
Each institution will provide a file to the HEA (in standard format) which will include detailsfor all students in the current and previous academic year. This forms the basis of the annualEnrolment and Graduand Report (which was a recommendation of the expert group).
Data concerning the course and programme pursued are contained in this source. Field ofstudy is coded to ISCED three digit level. Also, characteristics for each student are recorded.These characteristics include fields indicating whether the student benefits under the freefees initiative and whether the student is in receipt of assistance towards the registration fee.No information on entitlement to maintenance grant is included. The other variables can begrouped into those relating to academic history of the student and the student's socio-economic background.
For previous academic history the following variables are included:
♦ From CAO, the school at which the applicant first took the Leaving Certificateexamination;
♦ From CAO, the points score achieved at Leaving Certificate;
♦ From CAO, the year at which the Leaving Certificate was taken for the last time;
♦ From CAO, the subjects and level taken and grades achieved at last LeavingCertificate sitting;
♦ The last awarding institution attended and the year of leaving this institution; and
♦ Highest qualification attained prior to course entry.
From the above, it is apparent that certain CAO fields are passed directly to the institutionswho then individually feed some of this information to the HEA. There is an obviousargument for streamlining this process - if examination results and CAO files contained thePPS Number, it would be possible for the HEA (or Department, or both) to have directaccess to this information.
For socio-economic background, the following variables are to be collected:
♦ Principal Economic Status of both father and mother;
♦ Occupation of father and mother (previous occupation where relevant);
♦ Employment status of father and mother (i.e. whether employee, self employedetc); and
♦ Farm size (where relevant).
The above variables are to be collected by the institutions at registration. They are traditionalCensus of Population (COP) variables. This is a very deliberate approach as the capture ofthis socio-economic information is prompted by equality and access considerations whichhave been addressed up to now by the National Survey of Access to Higher Education.

26
National Survey of Access to Higher Education
This survey has been conducted at intervals of 6 years since 1980. The latest survey was in1998. The target population is all first time entrants to third level educational institutions. Theprimary purpose of this series of surveys is to monitor participation rates by socio-demographic background13. There have been differences in the operation of the survey overtime - for instance, in 1992 survey forms were issued with CAO forms, whereas in 1998 theywere sent separately by CAO. There were almost 33,000 responses to the 1998 survey,which represented a decrease in the response rate from 1992. The change in the way thesurvey was administered probably accounts for the drop in response rates between the twosurvey occurrences.
The drop in response rates posed an additional problem for the researchers. Variousanalyses were carried out to check the representativeness of the 1998 survey respondents.These analyses, and indeed the whole survey process, lean heavily on the availability of"whole population" COP information. This is because the entrants to higher educationconstitute one side of the equation. Obviously, the other side is made up of those who don'tenter third level. Essentially the survey uses COP classifications to place third level entrantsin the context of the socio-economic profile of the population as a whole. Changes in COPoccupation coding have caused problems for the researchers in deriving socio-economicvariables, as the time series element of the surveys is an important consideration. At times,a dual-coding operation has been carried out by the researchers in order to provide a link tofacilitate comparability over time.
The survey combines the direct responses from students with CAO information and someinformation supplied by each third level institution. The third level institutions suppliedinformation on the course of study, county of origin and source of financial aid. The CAOinformation supplied was in respect of school attended. The identifier used to link the threesources was the CAO number (which was included on the form sent to students),
The data that the HEA intends to collect from each institution (as outlined in the previoussection) are very similar to the data collected in this survey. Presumably this is deliberate, sothat analysis similar to that conducted at six-yearly intervals could become available annuallyfrom administrative sources.
However, a lot of effort is expended in relating the population of third level entrants to thegeneral population. This effort would not be necessary if the socio-economic background ofall students at a particular stage of second level education were collected and not onlyinformation for those who enter third level institutions. As long as a unique individualidentifier is available (the PPS Number) at the two stages (second level stage and entry tothird level) then the output of this survey would be directly derivable from administrativesources (and annually, rather than every six years). An appropriate stage of second leveleducation at which this information might be collected would be at the end of compulsoryeducation - i.e. around the time of the Junior Certificate examinations. Note that PPSNumber is already available on the Post Primary Pupil Database.
A further advantage of collecting socio-economic data at Junior Certificate stage is that itcould feed directly into the survey of school leavers which is considered in the next section.
13 The survey achieves more than this - for instance, participation rates are broken down by field of study, type ofschool attended, gender, etc.
27
2.3.6 Destination of exits surveys - the First Destination Report and the Survey ofSchool Leavers
First Destination Report
The first destination report is produced by the HEA on the basis of data collected by eachindividual institution - usually in respect of a period about 18 months after graduation. Thedata collection is carried out by postal survey. The survey has been conducted annuallysince 1982. For the most recent survey for which results are available (2000), there were23,000 respondents from a population of 37,500, giving a response rate of 62%.
The survey classifies respondents as to whether they are in employment, seekingemployment or not available for employment. For those in employment, sector and earningsinformation is collected.
Non-response is clearly a serious issue for this exercise. Also, the fact that the datacollection and (to some extent) survey procedures are under the control of individualinstitutes may be an issue.
Again, if the PPS Number were to be available from the HEA individual student database,this would open up the possibility of collecting much of the information from administrativesources. For instance, Revenue files would contain PPS Number, sector of employment,date of commencement of employment and earnings information. The DSFA sources wouldalso be relevant. Not all of the relevant information would be available from theseadministrative sources so some direct data collection might still be necessary. However, thiscould be organised centrally and the relevant information fed back to the institutions.
Survey of School Leavers
The Survey of School Leavers is carried out by ESRI on behalf of the Department. Thesurvey was conducted for the first time in 1980 and until relatively recently was conductedannually. The latest survey was conducted in 2003 in respect of those leaving secondaryschool in the academic year 2000/2001. The sample size is approximately 2,500 and theresponse rate is approximately 73%. Data are collected by means of personal interview(although some response is proxy - the selected individual may be unavailable due to havingleft the country or for some other reason). While 73% would be considered high for a surveyof this nature, a lack of information for 27% of the target population is clearly an issue for asurvey concerned primarily with destination of school leavers.
For the 2003 survey, the sample was selected centrally by the Department. Individuals werecontacted by the Department initially, which allowed selected individuals to opt out of thesurvey. The population of early school leavers, those who left school before completion ofthe Leaving Certificate cycle, was over-sampled in order to achieve a representativeresponse for this sub-group (because the number of early school leavers is much lower thanthe number who complete second level).
The survey questionnaire is long and detailed. One reason for this is that it is assumed thatnothing is known about the respondent until the interview occurs. So, for instance,information about the last exam taken (including subjects taken and results), the stage ofeducation on leaving and whether the respondent later attended another school to undertakea post-Leaving Certificate or VPT course are asked. Questions relating to third leveleducation are also asked: whether the respondent is enrolled in a full-time or part-timecourse; the college or institution at which enrolled; the programme of study; whether degree,diploma, certificate or other qualification is being pursued; and whether maintenance or other
28
forms of grant aid is received. Other questions aimed at those working full-time – relating tothe nature of the work, pay, sector, etc. are included. Detailed questions aboutunemployment periods are also included.
Even though the questionnaire is long and detailed, there are large segments of it that arenot relevant to many respondents. This, of course, is a consequence of the approach taken -to assume nothing is known about the respondent until the interview occurs.
It is clear that reliable information on the above topics is already, or could easily be made,available. Given that the Post Primary Pupil Database contains the PPS Number,information about subsequent enrolment in other schools should already be available.Information concerning registered unemployment and all other short-term allowance orbenefit schemes is already contained in DSFA sources - the CRS and ISTS. Information onemployment (dates of commencement, cessation, earnings, sector of activity) is contained inRevenue files. Indeed, most of this Revenue information is already fed directly to the DSFACRS system, so that by referencing one source only, a large amount of information relevantto some of the topics of the survey would be available.
Of course, it would also be possible to have available the subjects studied and the level andresults of exams taken. Also, the capture of the PPS Number at entry to third level (by, forinstance, feeding it from the Pupil Database to the examination database through the CAOsystem) would mean that precise information would be available to augment (or replace) thisaspect of the survey of school leavers.
A section of the questionnaire is devoted to questions about Principal Economic Status(PES) and occupation of parents. These questions are almost identical to those included inthe National Survey of Access to Higher Education and in the proposed student database tobe introduced by the HEA. We have already indicated that there is a strong case that thisinformation be collected at the end of compulsory school attendance (at junior certificatelevel) rather than be collected only for those who enter third level education. If this was thecase, it is likely that those questions would be unnecessary in the survey of school leavers(as the information would already be known).
There may be an issue with regard to the role that destination of exit surveys play in thestatistical infrastructure of the Department. When the Survey of School Leavers was initiatedin 1980, its primary function was related to the issue of youth unemployment. Sources ofunemployment data have greatly improved since then (because of the development of theQNHS and DSFA sources). It is clear that the focus of the survey has broadened but we areunsure whether this was because the survey evolved in its own right or as a response toclearly articulated needs. In any event (if the survey is to continue into the future), there is aclear case for using all of the available information for purposes of sample stratification andhence survey weighting. Using that information would also allow for more targeted questionsto the various sub-groups. It could be the case that questionnaires could be customised forsome clearly identifiable sub-groups.
2.3.7 General population surveys
Quarterly National Household Survey
The Quarterly National Household Survey (QNHS), which contains questions on educationalattainment, is an important source for the Department in monitoring the educational profile ofthe population. This information can be analysed in conjunction with the large amount ofinformation that exists in the QNHS concerning household characteristics and thedemographic and socio-economic characteristics of the population. We are aware of a
29
current issue regarding the categorisation of educational attainment for departmentalpurposes. This is the subject of discussions between the Department and the CSO.
The inclusion of PPS Number in the QNHS may be desirable in the future from adepartmental perspective. However, this would involve a long-term perspective, as theeducational sources that capture PPS Number would have to exist before this would beuseful.
Household Budget Survey
The Household Budget Survey (HBS) has been used by the Department as its only sourceof household expenditure on private education. As the HBS occurs only every 5 years, itmay be more appropriate to consider collecting this information from the QNHS. Apart fromthe much larger sample size, there may be advantages for the Department in having a"social module" on the subject of private education included at regular intervals in the QNHS.
EU Statistics on Income and Living Conditions
The EU Statistics on Income and Living Conditions (EU-SILC) which is the successor to theLiving In Ireland Survey, also includes educational variables and from this year will capturePPS Numbers directly from households.
International Adult Literacy Survey
The International Adult Literacy Survey (IALS) was conducted by the ERC on behalf of theDepartment in 1994. This was part of a co-ordinated international exercise. A sample of over2,000 individuals was included in the survey. Comprehensive literacy testing was carried outalongside the collection of demographic and socio-economic variables. The survey isexpensive and is to be repeated for many participating countries. As of now, it is unclearwhether the Department intends to participate in the next stage of the programme. This is animportant issue, as information from this source would be used to monitor NAPS targets, aswell as being a direct input to the United Nations Development Programme Human PovertyIndex 2 (UNDP HPI2).
2.4 Main conclusions and recommendations
(i) The introduction of a Primary Pupil Database is crucial and urgent. The capturing ofthe PPS Number is essential for coherence with other sources and to enable effectivetargeting of educational disadvantage. With this in mind, we give an outline (in Section2.5) of a possible method that could be used to introduce a basic but functionaldatabase relatively quickly.
(ii) The systematic use of the PPS Number at all stages of education is essential for theadministrative and statistical needs of the Department. The PPS Number should becaptured at primary level and fed through the system to second level, examinationsdatabases and third level. Schemes for other state-aided education and training (part-time education, further education, apprenticeships, etc.) should also capture the PPSNumber and those sources should be available to the Department, whether or not theDepartment is involved in their funding. The legal situation of data collection fromprivate schools should also be addressed so that the Department has access toinformation relating to all children and students.

30
(iii) The Department should liaise closely with DSFA to ascertain precisely the informationthat is available now from its CRS and ISTS systems and its potential usefulness foradministering and monitoring the outcomes of the education system.
(iv) The available individual level databases should be exploited to provide the samplingframe for efficient sample selection for testing purposes. This includes testing for thepurpose of longitudinal research.
(v) The Department should consider the case for direct data collection from students andhouseholds at various stages of the educational cycle. We believe there is a strongcase for the collection of demographic and socio-economic information at entry toprimary education. There is also a very strong case for collection of this information atJunior Certificate examination stage. If this were done, the National Survey of Accessto Higher Education would be redundant.
(vi) The role that destination of exit surveys play in the statistical infrastructure of theDepartment should be re-appraised.
(vii) The Department should be the ultimate owner of the micro data for all surveys that itfunds.
(viii) Information on the data sources, and associated metadata, owned by the Departmentshould be clearly publicised both internally and externally.
(ix) The development of coding frames for disability and special or social needs as well asethnicity should be pursued with CSO, DSFA and the Equality Authority.
(x) The Department should begin an iterative process to identify more precisely itsinformation needs and the sources it intends to develop to meet those needs. Thisshould be an iterative process as needs are sometimes expressed in the context ofavailable sources and therefore Department needs will develop as better data becomeavailable.

31
2.5 Additional proposals
Designation of disadvantaged school status
As the issue of educational disadvantage is highly important for schools at both first andsecond level, we give a brief outline of the current methods used by the Department inidentifying disadvantage.
There are currently three types of scheme:
♦ Schemes such as "Giving Children an Even Break" (GCEB) which are aimed atschools containing even a small number of disadvantaged children. Under thisscheme, the school identifies qualifying children and additional resources areallocated to the school. The amount depends on the number of qualifyingchildren.
♦ Schemes such as Early Start and the School Completion Programme which areaimed at schools that have a proportion of disadvantaged students which isabove a certain threshold.
♦ Schemes based on the area of the school. These schemes are usually part ofcross- departmental area-based initiatives.
The identification of educational disadvantage has been achieved in the past by means ofquestionnaires to school principals. For many schemes, this involved the principalsestimating the number of children whose families are entitled to medical cards and reportingthese aggregate figures to the Department. Within the Department, concern has beenexpressed about the appropriateness of this measure as well as the consistency of reportingfrom school to school.
There is a clear case for using a more consistent and appropriate measure of socio-economic disadvantage. The availability of a Primary Pupil Database with the PPS Numberidentifier is central to the development of such a measure. There are two reasons for this:
♦ It would allow direct linking at individual and family level to the DSFA CentralRecords System and other systems (e.g. ISTS) which feed directly into the CRS.
♦ It would provide a unique pupil identifier, with home address, which could beused for issuing questionnaires to households.
The latter point would be particularly relevant if sufficient information could not be accessedvia DSFA sources, or if it were deemed necessary to collect other background informationfor families (e.g. highest educational attainment of parents).
Because of the importance of the Primary Pupil Database, we give a broad outline here of apossible method to collect PPS Numbers of pupils which might be established relativelyquickly.

32
Introducing a Primary Pupils Database
A project team from within the Department is currently undertaking a requirements analysisfor a Primary Pupil Database, the introduction of which is, as has been stated earlier, adepartmental priority. The results of the analysis will be used in the development andimplementation of the database as part of the Educational Services Interactive (ESI) Project,which is due to begin in late 2003.
The objectives are:
♦ To gather valuable, reliable and timely information about primary school childrenand primary schools;
♦ To minimise the number of requests by the Department to schools forinformation; and
♦ To provide schools with a web-based application to input the requiredinformation.
However, full database implementation may be some time away and, accordingly, we putforward here a possible interim solution.
There are almost 3,300 primary schools in the state. Each of these schools will be supplyingthe individual level information that will feed into the Primary Pupil Database. It would seem,therefore, that a system that would allow schools to easily compile and transfer thisinformation to the Department is desirable. The easy compilation of the information wouldinvolve familiarity with the software package that is used. Consideration should be given tousing spreadsheets as the initial source of data capture at the school level. The systemcould work as follows:
1. Each school would list (by class or standard) the name of all pupils in the schoolin one column of the spreadsheet. Each row would then become a record for anindividual pupil. The record would include PPS Number, date of birth, addressand any other relevant pupil characteristics. Other relevant characteristics might,for instance, include a field for special needs or an indicator of socio-economicbackground. Those fields could be filled using a "drop-down" menu codingsystem attached to each field.
2. The spreadsheet could then be transferred to the Department electronicallyeither by encoded e-mail or via a departmental "secure deposit box" using theinternet.
3. Upon receipt of the spreadsheet file, the Department would open the file andimport the fields directly into a common statistical analysis package (there aremany available). A customised edit program could then be run on the data fromthe school to check for obvious errors. The school could be alerted immediatelyto any errors or problems with the file so that it could be re-submitted quickly.
4. The data from each school could then be aggregated (within the same statisticalpackage) to provide one file for all schools and all pupils. It could then be fed intoa longitudinal database of whatever design the Department chooses.
Clearly there will be longitudinal considerations in the way the data is held in a centraldatabase (addresses can change, names can change, etc.). However, this would be the

33
case no matter how the data is to be collected from the source schools. Provision can bemade for year to year changes within the source spreadsheet.
Some advantages of such a system are given below:
♦ All schools have PC's and most, presumably, already have commonspreadsheet packages. It is likely that there would be a broad level ofunderstanding of spreadsheet packages already available in most schools. Thetraining requirements (which might be very substantial using alternativeapproaches) could therefore be minimised. For the Post Primary PupilsDatabase (returns for which are supplied by about 750 schools), timeliness of thereturns can be dependent on the availability of the (often one) person who hasused the software previously. With a spreadsheet approach, anyone with a basicknowledge of common spreadsheet applications could complete the annualreturn;
♦ Class lists could be retained and used for other school purposes. Also, rolloverfrom year to year would be straightforward. In fact, one could envisage ascenario whereby the task of maintaining the lists could be delegated (a list couldbe maintained for each class) and the final return could be an amalgamation ofthese separate lists. In other words, it wouldn't be necessary for schools to waiton the issue of "this year's" version of a custom written software package;
♦ A high level of pre-formatting of the spreadsheets could be achieved. Forinstance, the Department could make available annually (on its web site) a blankpreformatted spreadsheet that could be downloaded and completed by eachschool;
♦ A significant degree of flexibility could be achieved with control of the processresiding entirely within the Department. For instance, fields could beadded/deleted from year to year reflecting needs as they arise. There would beno need to involve outside consultants in implementing changes. We doappreciate, however, that the key identifier fields should be kept as constant aspossible from year to year - as an aid to schools, if for no other reason; and
♦ From time to time, information at the level of the school is required. This could beincorporated as part of the annual return simply by using another worksheetwithin the spreadsheet. Within this, drop down coding frames for categoricalquestions could be used.
A possible disadvantage (although it is debatable whether it is indeed a disadvantage) wouldbe that the skills and resources would need to be available within the Department to operatesuch a data collection system. However, the skills required are mainly those that wouldnormally fall into the category of end-user computing and involve some spreadsheetknowledge as well as some knowledge of a statistical analysis package.
Direct collection of socio-economic and other indicators at an individual level
Once an individual primary database with PPS Number is available (using whatever datacollection system is deemed appropriate), the possibility of centrally collecting socio-economic and other data at the individual pupil level is greatly facilitated. This collectioncould be carried out at entry to primary level or at any other stage (see recommendationregarding the appropriateness of data collection at entry to the Junior Certificateexamination). One data collection model would be to print questionnaires which are

34
customised (name of pupil and PPS Number could be printed on each questionnaire). ThePPS Number would then become the key so that each completed questionnaire could bescanned upon return and the information captured with a minimum of manual intervention.Questionnaires could be issued through schools or directly to home addresses. Dependingon the type of information collected, the questionnaires could be returned either directly tothe Department or through the school.

35
Chapter 3Department of the
Environment, Heritageand Local Government

36
3.1 Introduction
The functions of the Department of the Environment, Heritage and Local Government(DoEHLG) are wide-ranging and include Housing, Roads, Environment, Heritage, LocalGovernment, Planning, Water Services, etc. Each of these areas contains sources ofinformation derived principally from administrative records. There are also a number ofpublic bodies operating under the aegis of the Department, such as An Bord Pleanála, theEnvironmental Protection Agency, the National Safety Council, An ChomhairleLeabharlanna, Comhar, the Dublin Docklands Development Authority, the DublinTransportation Office, the Local Government Computer Services Board (LGCSB), the FireServices Council, the Housing Finance Agency, etc.
The Steering Group on Social and Equality Statistics (SGSES) identified 24 data holdingsheld within the DoEHLG or in Local Authorities (LAs) or other bodies operating under itsaegis. Two-thirds of these data sources relate to the various housing schemes administeredby the Local Authorities. The remaining sources related to the House Price system, theNational Survey of Housing Quality (conducted for the department by the ESRI), the NationalVehicle & Driver File, the Register of Electors, Fire Statistics, and the EPA's annual“Environment in Focus” report.
The DoEHLG SPAR team considered these and other sources in the light of the data needsidentified in the SGSES Report. Given the tight time constraint for the SPAR Project, theteam decided to concentrate on the following sources:
♦ The new Integrated Housing System (which is subsuming the bulk of the datasources identified in the SGSES Report);
♦ The new House Price system being put in place;
♦ The planned Private Residential Tenancies Register (a new source not listed inSGSES);
♦ The National Vehicle & Driver File; and
♦ The Register of Electors.
These prioritised DoEHLG data sources are discussed in the following sections.
3.2 Integrated housing system
While the DoEHLG is responsible for policy and legislation in the area of housing, theservices are virtually all delivered through the local authorities. They include:
♦ Provision, maintenance, and management of local authority housing;
♦ Provision of traveller accommodation;
♦ Delivery of accommodation services for homeless people;
♦ Support for the provision of social housing projects by voluntary housing bodies;
♦ Improvement works to privately owned houses in lieu of local authority housing;
♦ Shared ownership;

37
♦ Affordable housing;
♦ Sale of local authority houses to tenants;
♦ Loans for house purchase and improvement;
♦ Low cost housing sites;
♦ Mortgage allowance scheme;
♦ Disabled persons grants; and
♦ Essential repairs grants.
These services involve a wide range of schemes, and each authority has its own computersystem to manage these schemes. However, under the Integrated Housing Project, which isunderway at the moment, the aim is to computerise all the housing schemes using acommon system (and, probably, a single database). The project is fairly advanced and asystem is being commissioned by the LGCSB. A pilot implementation will be carried out inone particular local authority later this year, though it is expected that it will be 2005 beforethere is a full roll-out of the product. Application forms, which currently differ across the LAs,will be standardised. Data will be recorded by each LA, and the LA will only have access toits own data. The DoEHLG will have sufficient access to the database to generate thereports they need.
The system will hold information on people, property, rents, repairs and allocations.Information on people will include PPS Number, sex, date of birth, marital status, andrelationship to head of household. The income of individuals and households will becaptured14. Some information will be collected on occupation (nine categories) andemployment sector. Nationality (not ethnicity or place of birth) will be collected. It will also bepossible to see who's on the housing list, the rehousing/transfer list, the Traveller list, andthe homeless list.
The properties to be included in the system will be those constructed, owned, leased orrented by the LAs, whether occupied or not, including Traveller halting sites and haltingbays. Currently, there are about 100,000 occupied LA dwellings in the State. The system willcapture many property attributes, such as acquisition date, heating/insulation/plumbing,parking, number of bedrooms, etc. The system will not include details on private properties,or B&Bs (apart from addresses), or properties operated by voluntary associations, even ifthey are used to house LA applicants. However, details will be included on the LA clientshoused in such properties. It has not yet been decided if the Geographic InformationSystems (GIS) co-ordinates of properties will be held in the system. Currently, it is notplanned to use the An Post/Ordnance Survey Ireland GeoDirectory in the project.
There are essentially 88 LAs, though it is unclear yet how many authorities will bedistinguished in the new system. Some Local Authorities split the housing function into a fewhousing authority areas. However, it will be possible to aggregate the data to the level ofCounty.
Of the 24 SGSES sources relating to DoEHLG, the following 16 are being subsumed into thenew integrated system:
14 Applicants will have to supply their P60 where relevant.

38
♦ Affordable Housing Scheme;
♦ Affordable Housing Scheme Loans (new houses only);
♦ Annual House Letting Survey;
♦ Assessment of Need for Social Rented Housing Accommodation;
♦ Homeless (as part of triennial Housing Needs Assessment);
♦ House Purchase Loans;
♦ Housing Loan/early redemption/special payments;
♦ Mortgage Allowance Scheme;
♦ Rental of LA dwellings;
♦ Sale of Local Authority Housing;
♦ Sale of Site scheme;
♦ Shared Ownership Loans;
♦ Shared Ownership Scheme;
♦ Tenant Purchase Loans;
♦ Tenant Purchase Scheme - LA returns to Housing Policy and Supply, DoEHLG;and
♦ Traveller Accommodation (Annual Count).
As this is a new system being put in place, it is not possibly to assess the quality at thisstage.
3.3 House price system
The situation here is also in the process of change. Currently, the DoEHLG collects quarterlyreturns from mortgage lending institutions, local authorities and the Central Bank, which ituses to compile the house price series published in the quarterly Housing Statistics Bulletin.The returns provide information on the aggregate value and number of loan approvals foreach lending institution. Data are not separately provided for each mortgage transaction.Average prices are derived from the loan approvals data for all dwellings, and for housesand apartments separately, for the country as a whole and for the five main urban areas(Cork, Dublin, Limerick, Waterford, Galway). The derived house price data do not takeaccount of changes in the mix of dwelling types. The Department also publishes in theBulletin an annual profile of borrowers based on voluntary returns from the individuals takingout loans. The forms, which are returned by the lenders, provide information on borrowers inrelation to house prices, previous tenure, marital status, income and occupation.
Under a new system, now being developed, the mortgage institutions will provide thedepartment each month, by the middle of the following month, with an electronic file of

39
individual (though anonymised) transactions, giving details on the borrower, the property,and the loan. A record will be forwarded both at loan approval stage and at first drawdown(mortgage commencement) stage. The new system, with its improved frequency, detail andtimeliness, will provide useful new statistical information on borrowers and will allow thecompilation of a new mix-adjusted house price index. All relevant lenders will provide theinformation under the Housing (Miscellaneous Provisions) Act, 2002. An added incentive forthe lenders is that they will have access to an anonymised version of the micro datadatabase for analysis, with some details (including the identification of the lending institution)omitted. As the new file specification required from the lenders calls for changes to theircomputer systems, including mortgage application forms and data capture processes, thecollection of various variables has been prioritised by the department in order to easeimplementation. While it is expected that the system will be operational from the start of2004, not all variables will be collected from that date, and the quality of data will have to betested prior to any publications or analysis.
For the main and second borrower, the system will collect age, sex, marital status,employment status, employment sector, income information, and current tenure (type andlocation). For the property, the information will include the purchase price, new/second-hand,location (county, postal code), year of construction, dwelling type, construction type, area,number of rooms, details of additional costs, etc. Details will also be collected on the loan.
Geographic coding for the location of the current tenure and the location of the property willbe at the level of administrative county, with postal code areas being distinguished in Dublin.It is also hoped that there will be sufficient information to distinguish between urban and rurallocations.
While the lenders themselves have the PPS Numbers of the borrowers, they will not includethem on the transaction file forwarded to the department. The Act states the information theMinister seeks from the lending institutions “shall not include information that directlyidentifies or may identify a person and, in particular, it shall not include the names, dates ofbirth or addresses of persons”.
The system will not collect information on non-mortgage based transactions, which areestimated to cover about 29% of all transactions. However, relevant information pertaining tothe transfer of property is collected by the Capital Taxes Branch of the RevenueCommissioners for stamp duty purposes. This may be a useful source of information onproperties that are purchased without a mortgage (see section 7.3).
It is likely that the data will be complete (all mortgage-based transactions will be covered)and that data quality will be high.
3.4 Private Residential Tenancies Register
The report of the Commission on the Private Rented Residential Sector, published in 2000,proposed the establishment of a Private Residential Tenancies Board (PRTB), whose mainfunctions would be to provide a mediation service and to maintain a register of all tenancies.(In theory, landlords are obliged under current legislation to register tenancies with therelevant local authority - in practice no more than 20% of properties have been registered.)The Government set up the PRTB on an ad hoc non-statutory basis in October 2001, andpublished the Residential Tenancies Bill, 2003 in June. It is expected that the Bill will beenacted before the end of 2003.
From a SPAR perspective, interest is concentrated on the proposal (likely to become realityat the start of 2004) to set up and maintain a single central register of every private
40
residential tenancy in Ireland. It is not known how many such tenancies are in existence butit is estimated to be about 150,000 nationally. Each tenancy registered will be given a uniqueregistration code. That code number will apply to the particular tenancy (i.e. letting) and willremain valid while the tenancy remains in existence. However, each tenancy willautomatically terminate after four years, and a new tenancy may be commenced. Associatedwith each tenancy will be details of the landlord, as well as details of each tenant15.
The system is being computerised at the moment, using a system called RACTS(Registration and Case Tracking System). A paper registration form will apply, followed bymanual checking and manual data entry. Electronic entry systems (e.g. web registration) willbe considered in future. The registration data required in respect of each new or updatedregistration will include:
♦ Information on Tenancy: Date and terms of tenancy (commencement date,period of tenancy, rent amount, frequency of payment); Registration date;
♦ Information on Property: Address; Name of authority where dwelling is located;Description (bedsit, apartment, terraced, semi-detached house, etc); Number ofbedrooms; Number of bed spaces; Floor area;
♦ Information on Landlord: Name and address; PPS Number; CRO Number, if thelandlord is a company; and
♦ Information on Tenant(s): Number of occupants; Name; PPS Number.
The geographic classification will be based on Local Authority regions, with postal codes inDublin.
The value of the new register as a data source will largely depend on its completeness.There will be a legal obligation on landlords to comply, and the PRTB states that it will be inthe interest of a landlord to register and anticipates that the compliance rate will be high. TheBoard’s policy will be to prosecute landlords who do not register.
3.5 National Vehicle & Driver File
The National Vehicle and Driver File (NVDF) consists of a very complex database, withdetails of all registered vehicles and all licensed drivers in the country. It is supported andmaintained in the office of the Vehicle Registration Unit (VRU) of the DoEHLG in Shannon.All vehicle and driver licence transaction processing that takes place in the Motor Taxnetwork, and change of ownership processing in VRU, is facilitated through the NVDF, andthe database is updated in real-time. The database is also used by the Garda Síochána, theRevenue Commissioners (they conduct the registration process, which collects the VRT, anddetails are transferred from Revenue's motor registration database to the NVDF), theDepartment of Transport, the Department of Social and Family Affairs (e.g., for anti-fraudpurposes), the NCT, and the CSO.
Conceptually, the NVDF can be regarded as consisting of two separate databases - one ofvehicles and one of drivers.
15 Registered tenants, being those with whom the landlord agrees the tenancy, do not necessarily correspond tooccupants. If, say, a family unit rents a property, then it is likely that only a single adult from that unit would beclassified as the tenant.

41
Vehicle records are complete on the live database back to 1993, and are retained forvehicles that are no longer under current licence. The number of vehicles under licence isabout 1.8 million. The primary database key is the registration number of the vehicle, whichis unique and never changes. If a vehicle is scrapped, it is marked as such only if the VRUreceives formal notification of the fact. Under environmental legislation, a new system, basedon the use of registered scrappers, will be put in place: the scrappers will be obliged toforward to the VRU details of all scrapped vehicles, and the vehicle records will be updatedaccordingly.
There are many variables on the database giving details on the vehicle: make/model, year ofmanufacture, engine CC, Certificate of Roadworthiness, name of insurance company,number of previous owners, NCT pass and due dates etc. Details of NCT failures are notrecorded. Limited ownership details are also part of the vehicle record. These consist of firstname/surname or company name, address, and phone number. No other owner details arecollected. In about 30% of cases the owner is a business; this could be a registeredcompany, a private company, or a partnership. The possibility of asking for the CRO numberfor registered companies will be considered, but it would not be easy to apply a similarsolution for unregistered companies. The complete ownership history is retained in thedatabase. The County designation in the file is based on the Motor Tax divisions of theState. So, for instance, Dublin is treated as a single county while Limerick is treated as twocounties. One of the fields indicates whether the vehicle is exempt from paying motor tax byvirtue of its use for disabled drivers or passengers. In this case the vehicle must beregistered to an individual and not a business.
Driver records are complete on the live database back to 1989, and the NVDF containsabout two million people with a current driver licence (including provisional). The primary keyis the Driver Number, which is unique and never changes. The PPS Number is collected andcaptured, but only from 2001. The provision of the PPS Number is mandatory – it is notpossible to get a licence unless a valid number is provided. As driver licences can last for upto ten years, it will essentially be late 2009 before all drivers have a PPS Number on thesystem. The first exposure of an individual to the system occurs when he or she takes theTheory Test, which must be successfully completed before a Provisional Licence can beobtained.
Apart from the reference numbers and the name and address details, the driver informationincludes date of birth, country of birth, sex, details of endorsements or disqualifications, andthe answers given to 11 yes/no health and fitness questions; these questions relate toeyesight, hearing, need for vehicle modification, etc. Some special restrictions may be heldas special codes on the physical licence, such as 01 (must wear corrective lenses), or 40(modified steering). Details of the Certificate of Competency are held, but no details leadingup to the receipt of the certificate (i.e., no details of Driving Test failures). Penalty Points arerecorded on the system. Currently, about 38,000 drivers have Penalty Points. Theadministrative action that triggers the updating of this field in the NVDF occurs when thedriver turns up with his/her driving licence to pay the fine involved.
There is no explicit connection between vehicle and driver details. While it would often bepossible to identify the driver of a vehicle by doing a search on name and address, there isno link between the name and address of the owner on the vehicle record and the name andaddress of the driver on the driver record. Indeed, they will often be different because theowner is not the driver, for example in the case where a company is recorded as the ownerof a range of cars. There are no plans currently to collect the PPS Numbers of owners on thevehicle record.
The quality of the NVDF data is considered very high. Timeliness is not an issue – thedatabase is kept up to date, with records being added and updated daily. There are no

42
problems with duplicates. The quality of the address information is high for vehicle owners: asample tested automatically by An Post showed that 98% of the addresses were valid.Moreover, of over a quarter of a million notices posted out each month, less than a thousandare returned with address unknown.
To obtain his/her first provisional licence, a person must produce a birth certificate (or, fornon-EU applicants, a passport). This is used to check the date of birth on the applicationform. It is also used to check the person's name, and documentary evidence must beproduced if the names are different.
3.6 Register of Electors
The Register of Electors is used for Presidential, Dáil, European and Local elections.Conceptually a single register, it is in fact a set of separate registers maintained by theregistration authorities. Policy, co-ordination and legislation are handled by FranchiseSection, DoEHLG.
Each of the 34 Registration Authorities - there's one for each administrative county -maintains its own register. While each register is separate, they are all computerised usingthe same LGCSB system. A consolidated version is not yet available or being planned, butmay become available at some stage.
Each authority updates its register each year. This is based on a simple application form.Apart from name and address, the form asks for date of birth and citizenship (distinguishingthe four categories Irish, British, Other EU, Non-EU). Date of birth, the collection of whichonly started last year, is not given on the published register, but it is captured in thecomputer system. After the local authority publishes the register in February of each year,anyone not on the register may apply for inclusion in the Supplement. At the time of anelection, the persons entitled to vote, depending on their citizenship type, are those on themain register as well as those on the supplement a specified number of days before theelection. The reason for the two registers is purely administrative, and in practice the registerfor a particular authority may be considered to be the two combined. The number on thesupplement would amount to only a few thousand - a tiny fraction of the number on theregister.
The register cannot be considered complete, and there is no legal requirement to register.Currently, the combined registers have a total of 2.9 million records, which exceeds thenumber of persons aged 18 and over in the country. Some of these records relate todeceased persons, and some are duplicates.
The register has two particular subsets. The first is the Postal Voters List, which includeswhole-time members of the Defence Forces and Irish diplomats posted abroad and theirspouses. The following may also apply: members of the Garda Síochána; persons living athome who are unable to go to a polling station to vote because of a physical illness ordisability; and persons whose occupations are likely to prevent them from voting at their localpolling station on election day, including full-time students registered at home who are livingelsewhere while attending an educational institution in the State. The second subset is theSpecial Voters List. This consists of electors with a physical illness or disability living inhospitals, nursing homes or similar institutions who wish to vote at these locations. In orderto qualify, an elector's physical illness or disability must be likely to continue for the durationof the register and prevent him/her from going to a polling station to vote. Neither of thesesubsets can be considered complete. For instance, a Garda may decide not to apply for thepostal option, or a person in an institution might not apply for the special list. Information onoccupations or disability is not held on the computer system - instead the system maintains a

43
flag on a record if it is part of the postal list or the special list, and this translates to a specialletter code on the published register. The total number of postal voters is about 13,000 andthe total number of special voters is about 3,000.
A company called Precision Marketing Information Ltd (PMI), an associate company of AnPost, takes the existing registers, combines them, adds household identifiers (by mergingaddresses), and eliminates some of the duplication. The resulting database is soldcommercially for creating national mailing campaigns, for generating samples for surveys,etc. The CSO retain the services of PMI annually for this database - it is used in theHousehold Travel Survey for sampling, and, in part, for grossing the results. PMI also usedthe database as a basis for its own lifestyle survey, which went to over a million households.The resultant detailed lifestyle database of over 250,000 records is also sold commercially.Recent statistical legislation limits what PMI and others can do with the register. Theapplication form for the Register of Electors now contains the question “Do you wish yourregistration details to be available for use for a purpose other than electoral or other statutoryuse?”. In future, registration authorities will publish two versions of the register - the editedregister and the full register. The edited register will contain persons who have indicated thattheir details can be used for other purposes. The full register will list everyone who is entitledto vote. When the edited version is published, the full one may only be used for an electoralor other statutory purpose.
The SPAR team was informed of the following data protection issue that arose. TheDoEHLG wanted all persons reaching the age of 18 to receive, automatically, an invitation tojoin the Electoral Register. So they asked the Department of Social and Family Affairs toprovide the relevant names and addresses to them. This was refused, citing data protectionconcerns.
3.7 Other data sources
This section briefly mentions some sources in the SGSES Report that the SPAR team didnot investigate in detail.
Fire Statistics
DoEHLG publishes annual fire statistics, which gives an analysis of call-outs, fatalities, etc.The statistics are based on information provided by the individual Fire Authorities, notablyusing the Fire Fatalities Report. This form is completed by the Fire Services if they are calledout and if there are deaths caused by fire. The information collected is: date/time of fire;deaths by sex and age group; type of premises/location; cause of fire; origin of fire; whethera smoke alarm is present. The Farrell Grant Sparks Report on the Review of Fire Safety andFire Services in Ireland, published in March 2002, sets out recommendations for the futuredevelopment of the service. The consultants examined all matters relating to the fire service,including the collection of statistical data. In this regard they identified lack of comprehensivestatistical data and lack of proper research and analysis as an area that needs to bedeveloped. One of the findings in the report was that “there are no definitive fire deathstatistics (there are only statistics for incidents to which the Fire Service responds),information on non-fatal fire injuries is extremely patchy, there is no reliable information onthe causes of fire, there is no available assessment of the cost of damage by fire and noinformation on the savings accruing from Fire Service intervention.”
44
National Survey of Housing Quality (NSHQ):
This survey was carried out in 2000/2001 by the ESRI for the DoEHLG with a sample of37,500 households. It is normally carried out every ten years. This survey provides detailedinformation on the housing stock in Ireland. The main purpose is to provide DoEHLG with anassessment of the current national housing stock and the condition thereof. It will facilitatethe analysis of results for households such as large families, lone parents, elderly personsliving alone, etc. The ESRI will forward the database of anonymous confidential data to theDoEHLG. The PPS Number is not collected. The survey was previously called the HouseConditions Survey and was undertaken by Housing Inspectors, who assessed the propertiesas part of the survey. The latest survey was conducted by interview, so the answers arebased on the perceptions of residents and tenants of the conditions of the properties.
This survey is more detailed than the QNHS housing module and generally includes allquestions on the module. The QNHS housing module was undertaken in 1998Q3 and will beundertaken again in 2003Q3. In considering the cost of the QNHS module and the NSHQ,and looking at the purposes they serve, questions must be asked as to whether there is amore efficient way to fulfil these purposes. Is there a need for a QHNS module every fiveyears? Should the timing of the QNHS module be altered to five years after NSHQ? Couldthe QNHS incorporate the NSHQ, or would there be too much detail?
Environment statistics
The Environmental Protection Agency (EPA) monitors the environmental health of the Stateand publishes reports on the state of the environment. A range of environmental indicators isavailable, each of which measures some aspect of the state of the environment. The annualpublication Environment in Focus 2002 contains 50 indicators, covering water quality, wastemanagement, air pollution, climate change, urban environment, transport, biodiversity, eco-efficiency, etc.
3.8 Statistical potential
Integrated Housing System
Statistics derived from the systems currently in place (see the department's quarterlyHousing Statistics Bulletin) are based on aggregate returns made by the 88 LAs to thedepartment. Further breakdown or cross-classification is not possible. But the new systemwill be a database of micro data common to all LAs, consistently maintained according tocommon standards, and will therefore have considerable potential. The ability to cross-classify the microdata (using age, family structure, location, income, nationality, etc) willprovide much more useful statistical information on tenants, households, and schemes. Thedatabase of tenants and those on the various housing lists could be used as a samplingframe, permitting surveys of marginalised groups.
House Price system
The new system, based on a comprehensive database of micro data, will permit new usefulstatistical information and cross-classifications, such as analysis by type of property, houseprice by location (county, or postal code in Dublin), age/income profile of borrowers,relationship between income, loan and house price, information on joint purchases, etc.
45
Private Residential Tenancies Register
The system should be able to provide useful statistical information on the rented sector,broken down by local authority area (and by postal code area in Dublin), such as averagerent by property type, number of rented units by bed spaces or property type, number oflandlords with multiple/single properties, average percentage change in rent, etc. It mightalso be possible to construct an index of the cost of private tenancies by accommodationtype, size (bed spaces), floor area and location. The Register also has potential use as asampling frame. If the register is complete and kept up to date, it would be of considerablebenefit to the CSO in the areas of National Accounts (to improve the accuracy of the imputedrents) and Consumer Prices (for monitoring residential rents).
National Vehicle & Driver File
As it stands, this data system is already a source, directly or indirectly, of publishedstatistics. Most of the tables in the Department's annual “Irish Bulletin of Vehicle and DriverStatistics” are sourced from the NVDF. These give statistics of vehicles under CurrentLicence, of vehicles licensed in the year, and of current driver licences. The NVDF isoccasionally used to perform analyses on foot of an external request. The database is alsoused by the CSO for the monthly compilation of new vehicle statistics, and as a samplingbasis for the Road Freight Inquiry. New statistical information should come from the analysisof penalty points.
Register of Electors
The register is analysed statistically and the results published. As it stands, it has littleadditional direct statistical potential. However, it may have additional use as a registersource, despite its lack of classification information such as sex or marital status. The date ofbirth is available, but is only collected since 2002.
3.9 Conclusions and recommendations
(i) Integrated Housing System: With the system being put in place, the opportunityshould be taken at the testing and implementation phases to ensure that allinformation is collected completely and accurately. For properties, it is recommendedthat the GIS co-ordinates of properties be recorded and held in the system. This couldbe done by using the An Post/Ordnance Survey Ireland GeoDirectory, or otherwise.
(ii) House Price System: The cross-cutting potential of this new source would berealisable if the lenders could include the PPS Numbers of the borrowers on the filesthey send to the Department. If it was decided from a policy perspective that the PPSNumber was in fact required, (after consideration of issues such as data protection), itwould appear to require an amendment to Housing (Miscellaneous Provisions) Act,2002.
(iii) Private Residential Tenancies Register: Every effort should be made with this newsystem to ensure that the register is as complete as practicable, that information oneach tenancy is complete and accurate, and that the register is kept up to date.
(iv) Register of Electors: The inclusion of the PPS Number as part of the registrationprocess should be considered. It would confer administrative advantages: improved

46
verification at registration stage; handling of address changes; elimination ofduplicates; elimination of records of deceased persons; overcoming the problem ofpeople at the same address having the same name (e.g. father and son). But it wouldalso, of course, confer statistical and policy advantages: for example, the registercould be analysed to examine the enrolment rate for young adults.

47
Chapter 4Department of Health
and Children
48
4.1 Introduction
In the preparatory work for its report “Developing Irish Social and Equality Statistics to meetPolicy Needs”, the Steering Group on Social and Equality Statistics (SGSES) identified 24potentially relevant individual data holdings administered either directly within theDepartment of Health and Children (DHC) or by bodies operating under the Department’sauspices. In the context of the terms of reference of the SPAR Project, these sources, alongwith the information collected by the General Register Office, were to be the focus ofattention. The main objective of the Project was to examine the possibilities for enhancingthe statistical potential of existing data rather than how such enhancement might beachieved or who would undertake the necessary tasks. The DHC SPAR team was alsoconscious of the information needs for policy purposes identified by SGSES and was hopefulthat its investigations would determine, at least in some cases, whether these could beaddressed.
Much of the information, which the DHC holds or has access to, is derived from primary datacollected or reported at local or regional level (by health service providers, regional healthboards, etc). For the purposes of undertaking the examination, the team met officials in theInformation Management Unit of the DHC and this contact was maintained on an ongoingbasis throughout the project. Given the time and resource constraints, it was decided thatthe focus of the examination would centre on a selection of the data available, whetherdirectly or indirectly, to the DHC. The selected sources covered a variety of types ofinformation, for example: registrations of vital events (births, marriages, deaths), informationrequired for the operation of the payments system for the Medical Card Scheme and theDrugs Payment Scheme, data on the physical and mental health of the population, statisticson the interaction of patients with hospital services. They also included national survey-based data designed to collect information on health behaviours and social andenvironmental conditions. These surveys, usually repeated periodically, are generally carriedout by outside bodies on behalf of the department.
Apart from a specific contact made with the ERHA concerning one particular data source(see Section 4.2.4), the team did not have any contact with health boards or regional or localbodies concerned with the health service provision. However, as a great deal of theinformation available to the DHC is compiled outside the department, contacts were madewith officials in bodies operating as executive units of DHC (e.g. the General Register Office– GRO16), and officials working for agencies in close formal or informal co-operation with theDHC (e.g. the National Cancer Registry of Ireland – NCRI17, the National DiseaseSurveillance Centre – NDSC18, the General Medical Services (Payments) Board – GMSPB19,the Health Research Board – HRB20, the Economic and Social Research Institute – ESRI,the Department of Health Promotion of the National University of Ireland – Galway). Thesecontacts were made via meetings, telephone calls or e-mail.
To be aware of the broader policy context in health, the team familiarised itself with anumber of key recent strategic documents and reports. These included the Government’sHealth Strategy (Quality and Fairness: A Health System for You), the Brennan Report(Report of Commission on Financial Management and Control Systems in the Health
16 The GRO is the central civil repository for records relating to vital events (births, deaths and marriages) in theRepublic of Ireland.17 NCRI: The Registry was set up under statute, and is wholly funded by the Department of Health and Children.The overall direction of the Registry is the responsibility of the National Cancer Registry Board.18 The NDSC was set up in 1998 conjointly by Ireland’s seven Health Boards along with the ERHA and with theapproval of the Minister for Health and Children.19 The GMSPB is a joint Board composed of officers from the regional health boards and the DHC.20 The HRB is a statutory body that promotes, funds, commissions and conducts medical, epidemiological andhealth service research in Ireland.

49
Service), the Prospectus Report (Audit of Structures and Functions in the Health System onbehalf of the Department of Health and Children) and the recent Government proposals onrestructuring the health service (The Health Service Reform Programme). In addition, theteam was also broadly aware of the matters currently being dealt with in preparing theNational Health Information Strategy (NHIS) which, according to the DHC, will be publishedshortly. The published reports clearly state the need for better based, more robust and morestandardised health information and they prepare the ground for the reforms andimprovements which are expected to be advanced by the NHIS.
In pursuing its main objective, the team was anxious to highlight some specific ways in whichthe existing health information sources could be improved to better serve wider statisticalrequirements of the health sector including data linkages. It was conscious of the possibilitythat any changes that may occur in the structure and functions of the overall health servicesystem would have important implications for collecting and compiling statistical information.However, the team is of the view that implementation of the recommendations of the reportsreferred to above, will have the positive outcome of adding value to the vast body ofinformation which currently exists within the DHC and its bodies. Moreover, the fact thathealth issues cut across a number of government departments underscores the need for asolid basis for the integration of statistical information over a number of statistical domains.
4.2 Examination of individual data sources
At the outset of the project, the DHC SPAR team and the DHC identified 12 (out of 24)specific data sources for priority examination along with data compiled by the GRO. Thenumber of data sources considered was largely determined by tight time constraints for theproject, while the basis for each source selection was determined by both perceived datavalue and potential for enhancing that value. The team had the intention of examiningadditional sources if time permitted, but in the end it was only possible to look at one furtherdata source. The table below lists all fourteen data sources examined along with the namesof the associated data holders.
Table 4.1 Data sources and data holders
Data source Data holderCivil Registry of Births, Deaths and Marriages General Register Office (GRO)General Medical Services Database for Primary CareReimbursement
General Medical Services (Payments) Board(GMSPB)
National Perinatal Reporting System ESRI/DHCERHA Register of Congenital Anomalies ERHA, Department of Public HealthHospital Waiting Lists Department of Health and Children (DHC)Hospital In-Patient Enquiry Database ESRI/DHCNational Cancer Registry of Ireland (NCRI) National Cancer Registry Board (NCRB)National Breast Screening Programme (NBSP) National Breast Screening Board (NBSB)National Intellectual Disability Database Health Research Board/DHCNational Psychiatric In-Patient Reporting System(NPIPRS)
Health Research Board/DHC
Notifiable Infectious Diseases Database (NIDD) National Disease Surveillance Centre (NDSC)Survey of Long-Stay Units Department of Health and Children (DHC)Survey of Health Behaviour in School-aged Children(HBSC)
National University of Ireland – Galway,Department of Health Promotion
Survey of Lifestyles, Attitudes and Nutrition (SLÁN) National University of Ireland – Galway,Department of Health Promotion
50
The descriptions that follow have not been assigned a particular ranking order. The datasources described first relate to events or transactions concerning the entire population,followed by those that relate to health concerns of subsets of the population interacting withparticular branches of the health system. The last two data sources (HBSC and SLÁN) relateto information collected periodically by way of sample survey on the health behavioural andattitudinal characteristics of people.
4.2.1 Civil Registry of Births, Deaths and Marriages
This information which is held by the General Register Office (GRO) concerns theregistration of vital events in Ireland in a central civil repository. The civil registration processhas been paper-based since its inception about 150 years ago but efforts have beenunderway for some time to modernise the system through computerisation. Progress,however, has been slower than originally anticipated but the availability of an electronicsearch facility for births, marriages and deaths records from 1 July this year at GROheadquarters is a welcome advancement. Records currently relate to births, marriages,deaths and adoptions in the Republic of Ireland. The data on births, marriages and deathsare collected locally by (about 300) local Registrars, while the information on adoptions issupplied to the GRO by the Adoption Board. It is intended that divorces and civil nullities (butnot separations and church nullities) will be included on the new database. The data will becaptured and transferred electronically by the Courts Service to the GRO.
The recording of vital events includes the capture of relevant (i.e. in the context of births,marriages, deaths, etc.) categorisation information relating to individuals e.g. addressdetails, age/date of birth, gender, marital status, occupation (where the event is a marriageor death; in the case of a birth the occupations of both parents are recorded) and nationality(of parents in the case of a birth event).
The births, marriages and deaths information is currently recorded in paper form and istransferred within the specified time limits to the GRO. Data, anonymised in some cases,may then be passed on to other bodies (e.g. the ESRI – see Section 4.2.3, CSO, DSFA,Passport Office, Directors of Community Care, Hospitals, Gardaí) in compliance withrelevant legislation. Compilation of vital statistics (births, deaths and marriages) by CSO isone of the major uses of the information. However, a particular concern to the CSO hasbeen the non-availability of the national Marriage Register since 1996 resulting in theabsence of detailed marriage statistics in Ireland since then.
The relevant details from the GRO paper records are electronically captured by the CSO andthe results are published quarterly and annually in accordance with the provisions of the VitalStatistics and Births, Marriages and Deaths Act, 1952. In addition, and under therequirements of the Births, Deaths, and Marriages Registration Act, 1972, the CSO providesthe DHC with an anonymised computerised file of the GRO data.
Statistical quality assessment
The GRO is in the process of computerising at source the information it collects– the CivilRegistration Service. Apart from the information on births, marriages, deaths and legaladoptions currently collected, details of divorces and civil marriage annulments will becaptured from information provided by the Courts Service. The fact that separations andchurch nullities will not be included renders the information to some extent incomplete in astatistical sense as the variable ‘marital status’ cannot be fully determined from the GROinformation. As it stands, the GRO data can only be categorised to the top level of the CSO’sclassification of marital status (Single, Married, Widowed, Divorced, Unknown); the moredetailed sub-categories under ‘married’ (to show separations and remarriage) cannot be
51
obtained at present. The PPS Number will be recorded in all cases (where it exists). Atpresent, where the PPS Number is available, the GRO information can be linked to DSFAinformation.
4.2.2 General Medical Services Payments Board database for primary carereimbursement
The General Medical Services (GMS) Scheme is concerned with the provision of freegeneral medical services for all persons 70 years old and over and for persons under 70years who are unable to obtain general practitioner medical and surgical services withoutundue hardship (i.e. Medical Card holders). The Drugs Payment Scheme (DPS) isconcerned with the reimbursement of payments in excess of €70 per month by eligibleindividuals or families ordinarily resident in the State who do not have a current Medical Cardfor their purchases of approved drugs, medicines and appliances. The GMSPB validatesclaims and makes payments to general practitioners, community pharmacists,optometrists/ophthalmologists and dentists operating under the GMS, DPS and otherhealthcare related schemes (e.g. Long-term Illness Scheme, Dental Treatment ServicesScheme). In order to exercise its functions the GMSPB maintains a computerised databasecontaining relevant information on all of its clients. Individual patient details held on theGMSPB central patient table are mainly supplied electronically in batch form on a monthlybasis by the regional health boards.
The bulk of the information on the database relates to the GMS and DPS schemes. Atpresent, details concerning around 2.5 million individuals are included in the database (GMS- 1.2 million; DPS - 1.3 million). In principle, all individuals in the State are eligible undereither scheme but at present there is significant under-coverage in the DPS, as many peopledo not as yet avail of the Scheme. However, coverage is quickly increasing as publicawareness improves of the possibility of capping family/household expenditure on drugs.The PPS Number is recorded for all individuals covered by the DPS; in the case of the GMS,about 60% of the records include a PPS Number (for all GMS cases, of course, a MedicalCard Number is recorded).
The database holds individual characteristics as follows: date of birth, gender, marital status(not completed in many cases for DPS records), individual’s county of residence and healthboard area, phone number (incomplete). The first level of the geographical coding is healthboard and the second level identifies county.
The GMSPB is concerned about the existence of a significant number of duplicate individualrecords on the system. Under present arrangements, an individual may have contact withdifferent health boards and, consequently, may be allocated more than one medical card(i.e. resulting in different Medical Card Numbers for the same individual). Work is underwayin the GMSPB in collaboration with the health boards to remove such duplicate records. Themarking of ‘inactive’ records (e.g. as a result of deaths) is also a major focus of the GMSPB.
As part of a long-term solution to this issue, the Board has embarked on building a CentralClient Eligibility Index (CCEI), which it views as a corner stone in developing a UniquePatient Identifier (UPI) Scheme. This, in turn, concerns the development of an integratedregional/national IT system and related infrastructure as one of the main components tounderpin the delivery of integrated health care. The Board greatly favours the use of the PPSNumber as the individual identifier. The availability of a PPS Number for all individualswould, in the Board’s view, facilitate the desired improvement in the integrity of the databaseinformation and, in practice, allow for the increased linking of GMSPB data with informationavailable in other relevant authorities. A current drawback, however, is that many individuals,particularly in the older age groups, do not have a PPS Number. Nevertheless, over time thissituation will improve and, in principle, all individuals in the State will eventually have a PPS

52
Number allocated. The use of the PPS Number for linking diverse pieces of information heldin diverse ways on particular individuals and for sharing this information is not currentlyprovided for in legislation. Assuming that any technical or legal barriers can be surmounted,the greater use of the PPS Number would facilitate the expanded statistical potential of theGMSPB data. While the GMSPB uses the PPS Number where it is available, in themeantime and in the absence of a PPS Number in all cases, the payments system mustcontinue to be administered on an ongoing basis. To do this, the CCEI system automaticallyallocates an identification number to each individual. In addition, a Household Number isallocated so that persons within the household can be linked for DPS payment purposes.Over time, it is expected that the PPS Number will replace the CCEI number. Currently,where a PPS Number is not available, a Medical Card Number or a Medical ServicesNumber, in addition to address and date of birth data have to be used to identify individualsand to facilitate the removal of duplicate records.
The Board publishes an Annual Report giving details of payments made and information ondevelopments.
Statistical quality assessment
The details held by individual health boards are more extensive but these are not passed onto the GMSPB currently as the information is not critical to administering and processing thenecessary payments. In addition, the range and detail of information at health board levelcan vary significantly, as can the coding and classification of the data.
4.2.3 National Perinatal Reporting System
The National Perinatal Reporting System is operated and maintained by the ESRI on behalfof the DHC. Its purpose is to provide national annual statistics on perinatal events (e.g.pregnancy outcomes, perinatal mortality) with a variety of analyses of the results. Thecoverage is of all live births and late foetal deaths (stillbirths). Data collection began in thelate 1970s and a complete database only became established in 1984. In 1999 – the latestyear for which data have been published – over 54,000 births were recorded in the system.
The source of the basic data is GRO births registration forms (there are four slightly differentversions of the form that are sent to the following: GRO; Director of Public Health &Medicine; ESRI (Perinatal System); Hospitals). As such, the National Perinatal Reportingsystem is part of the birth registration system which ensures 100% coverage but has no linkwith registration files on other data sets.
The Birth Notification Form (Part 3) is returned to the ESRI for coding and electronic datacapture. A range of data is collected about the birth (e.g. date of birth, gender, birth weight,gestation period, occurrence of perinatal death, cause of death, morbidity, length of stay,type of antenatal care, type of feeding, whether admission was booked, maternal immunityto rubella, method of delivery, administration of BCG). Information is also capturedconcerning the mother and father (including date of birth, age, place of residence of parents(only county code) and their occupations. In addition, further specific information on themother is collected (marital status, number of mother's previous live births, children still living(including children in foster care, adopted out), stillbirths and spontaneous abortions. Thecollection of nationality of mother and father has been introduced during 2003; nationalitycoding has yet to be decided. In the 1999 results, occupations of both mother and father arecoded and grouped, with minor modifications, according to the CSO system of socio-economic groupings as used in the 1991 Census of Population. The 9th Revision of theInternational Classification of Diseases is used for disease coding. Following capture by theESRI, the information is validated using a combination of manual and automated checking.Procedures are in place to ensure that there are no duplicate records held.
53
The published results (see Report on Perinatal Statistics for 1999 published by the ESRI inassociation with the DHC) are used by clinicians, epidemiologists, health administrators,policy-makers, politicians, researchers and the media.
Statistical quality assessment
The database holds a considerable amount of useful data, is continually being updated fornew births and also uses some standard classifications. Data for 1999 is the latest availableessentially because the system is paper based. Modernisation of the registration system bythe General Register Office (GRO – see Section 4.2.1) should improve the timeliness of theresults as the information will be electronically captured and transferred by the hospitals.
4.2.4 EUROCAT (ERHA Register of Congenital Anomalies)
Surveillance of congenital anomalies in the ERHA region, with a population of 1.4 millionpeople and approximately 20,000 births annually, is undertaken by the Dublin EUROCATRegistry (European Registration of Congenital Anomalies). The Dublin Registry, operatedand maintained by the Department of Public Health of the Eastern Regional Health Authority,monitors trends in the prevalence of birth defects in the eastern region of Ireland. TheRegistry was established in 1979 by the Medico-Social Research Board as one of two pilotregistries that led to the formation of EUROCAT, a European network of almost 30population based congenital anomaly registers, the central registry for which is based at theUniversity of Ulster, Newtownabbey, Co. Antrim (http://www.eurocat.ulster.ac.uk/). Multiplesources of case ascertainment are used for adding new records to the Registry includingbirth notifications, data from the Hospital In-patient Enquiry System (HIPE), deathcertificates, pathology reports, and the Domiciliary Care Allowance Scheme. Informationcollected through child developmental screening clinics and Public Health Nurses are othersources of notification. The data are computerised and retained in encrypted form; access isrestricted to a nominated account, protected by password. Only births to mothers resident inthe ERHA region at the time of birth are included. Data are collected from birth to five yearsof age as, while some anomalies may be obvious at birth such as spina bifida, others do notbecome apparent until early childhood, for example, some forms of congenital heart disease.
The following variables are routinely collected for each case: birthdate, gender, birthweight,length of gestation, type of birth, presence of congenital malformations, mother's and father'sbirthdate, marital status of mother, an ED variable to record area of residence of mother anda family status variable based on previous live births. The denominator populations,consisting of births to mothers resident in the ERHA region during a particular period, aresourced from vital statistics data compiled by the Central Statistics Office. The registercontains a unique reference number assigned to the birth notification form, the intent ofwhich is the avoidance of possible duplicate entries. Coding is provided by EUROCAT.
The objectives of the Registry are:
♦ To provide baseline epidemiological information on congenital anomalies in theEastern Region;
♦ To detect and investigate trends in the frequency of congenital anomalies inorder to assess the impact of known or suspected risk factors;
♦ To evaluate the effectiveness and efficiency of health services (primaryprevention and treatment);
♦ To provide a well-documented database for etiologic and clinical research; and

54
♦ To act as an information centre that can respond to specific needs, such as theassessment of the impact of environmental accidents or change, or the suspicionof teratogenic influences from food, drugs or other exposures.
Statistical quality assessment
Data on approximately 13,000 cases relating to the ERHA area are captured on the register.Data obtained are from a wide variety of sources and are collected in a standardised form.Although the focus is to ascertain cases in their first instance, data is updated whenpossible. As data is collected using EUROCAT coding structures, it already complies withEuropean Standardised classifications and can be used in the compilation of statistics at aEuropean level. The Dublin Registry is an active member of the EUROCAT internationalequivalent - the International Clearinghouse for Birth Defect Monitoring Systems (ICDS).
4.2.5 Hospital Waiting Lists
This information on the numbers of persons waiting over three months for public in-patientand day-case hospital procedures in public hospitals is compiled by the DHC from quarterlyhealth board returns of aggregated data supplied by hospitals in the individual health boardareas. This information, compiled in its present format since 1993, gives aggregate numbersof people on hospital waiting lists for each acute hospital categorised by: broad age groups(child, adult); speciality required (e.g. ophthalmology, orthopaedic, general surgery); and bylength of time waiting i.e. from the time the medical consultant makes the appointment for ahospital procedure to the end of the reporting reference quarter. Currently, the results arepublished showing two waiting time bands: 3-12 months and over 12 months. Apart from thebroad child/adult categories and health board breakdown, no other demographic or socio-economic classifications are used.
The end-December 2002 results were published by the DHC on its website in May 2003.
Given the proposals on restructuring the national health services, responsibility for collectingand publishing information on hospital procedure waiting lists may be transferred from theDHC to a different body.
Statistical quality assessment
The data provides very important broad indicative information to policy-makers, healthservice providers, researchers and the general public. However, the fact that it is compiled inaggregate form, and without the possibility of detailed analysis by age, sex, area ofresidence or socio-economic grouping, limits the extended statistical usefulness of theexisting data for broader social analysis. As regards the ‘age’ variable, the current child/adultcategorisation is based on a child being usually defined as under 14 years of age. Collectionof a ‘date of birth’ variable and an analysis of the results by an appropriate age bandcategory would greatly improve the data. A further significant gap in the data is the lack ofinformation on persons waiting up to 3 months for hospital procedures. The addition of thiscategory would enhance the data and complete the picture for the ‘length of time waiting’variable. Moreover, the inclusion of average waiting time would facilitate a betterunderstanding and interpretation of the data, particularly where demographic movementscan affect the absolute numbers of persons shown. In terms of current data availability anddissemination, the DHC’s intention to publish a more detailed waiting time breakdown foradults and children (i.e. 3-6, 6-12, 12-24, over 24 months) is to be welcomed.
From the viewpoint of the public’s perception of the data, it may be worthwhile for the DHCto review the existing definition of waiting time and to consider extending it so that it covers
55
the entire period of time from referral by the General Practitioner to hospital/consultant. Thepossibility of the HIPE system collecting information from the patient on admission tohospital on the length of time waiting for admission is suggested in the next section.
4.2.6 Hospital In-Patient Enquiry
The purpose of the Hospital In-Patient Enquiry (HIPE) database for which data are collectedby the ESRI on behalf of the Department of Health and Children, is to record in-patient andday-case activity in acute hospitals. Individual information is collected and reports21 areprepared by the ESRI giving aggregate statistical analyses of the results e.g. numbers ofpeople discharged from publicly funded acute hospitals (including day-cases), length of stay,diagnoses, procedures performed, etc. Statistical information from HIPE is also supplied tothe EU Statistical Office (Eurostat), the World Health Organisation and OECD. The HIPEdata are of interest to clinicians, epidemiologists, health administrators, policy-makers,politicians, researchers and the media.
Data on HIPE relate to all discharges from both publicly funded (including voluntary) acutehospitals and two private acute hospitals that voluntarily report to the HIPE system. Atpresent, over 950,000 cases are reported annually. This represents about 95% of cases inthese hospitals. Reporting by private hospitals is expected to improve with time. Theinformation provided to DHC-ESRI is linked to Patient Administration systems withinhospitals. The vast bulk of the data is transferred electronically to the ESRI on a monthlybasis as most hospitals have a windows-based HIPE data collection system operating. Whileindividual identification information is available in the case of the Medical Record Numberassigned by the hospital (and may be available in the case of the Medical Card Number), thePPS Number is not collected.
Given that HIPE is not a patient-based database, duplicate information (e.g. personaldetails/demographics) is collected on an individual if they present at a different hospital. AUnique Medical Record Number is assigned to each individual on admission to a hospital butthis number is only unique to that hospital and is not used by other hospitals. A GMSNumber is collected where available but not all people admitted to hospital have a medicalcard. Details of date of birth, gender, marital status, area of residence (basically county withextra detail for city areas) are also collected. Nationality data are not collected but for short-stay visitors to Ireland information is available on their normal country of residence. A pilotproject has been initiated to investigate the feasibility of collecting information on ethnicity(including Travellers and other ethnic groups). The International Classification of Diseases,Ninth Revision, Clinical Modification (ICD-9-CM) developed and used in the U.S. is used tocode diagnoses and procedures. Otherwise, standard classifications do not appear to beused.
Statistical quality assessment
This data source has excellent coverage and provides very useful information on theinteractions of individuals with the publicly funded hospital system after they are admitted.Currently there is no obligation on private hospitals to submit data; their inclusion in thedatabase would be desirable and it is expected that over time, a growing number will submitreports.
The major statistical consideration with this database as it currently stands is that it isdischarge-based and not patient-based. Hence, it would be difficult to track events relating toan individual.
21 HIPE ten year report (1990-1999), Public Health Information System; Casemix statistics.
56
On the specific question of capturing race/ethnicity data in the future, if a decision is taken tocollect this information, the development of a classification on race/ethnicity that can be usedfor statistical purposes needs to be addressed. In this context, a co-ordination role for theEquality Authority in the development of such a classification has been discussed andagreed in principle with the CSO.
In addition, in order to connect with the information available from the Hospitals Waiting ListSurvey (see Section 4.2.5), the possibility should be investigated of collecting data from thepatient, at the time of admission to hospital, on the length of time waiting from the time ofinitial referral by the General Practitioner to the hospital/consultant to the time of admission.
4.2.7 National Cancer Registry of Ireland
The National Cancer Registry of Ireland (NCRI) database records cancer incident cases inthe State. Established in 1991, data collection commenced in 1994 and the registry isadministered by the National Cancer Registry Board. About 20,000 cases are recordedannually. The NCRI collects data continuously from different health settings such aspathology, GPs, etc. Information is actively sought by Tumour Registration Officers based inhospitals and the data are captured from hospital administration sources, medical records,and from laboratories. Data from the DHC-ESRI HIPE (using Medical Record Number) andfrom deaths information from the GRO is also obtained by a mixture of manual andautomated linkages. In addition, a small element of the data is obtained from GPs. Trainedcancer registry nurses gather much of the morbidity data. Information on deaths is currentlycaptured manually from GRO records. The computerisation of GRO data will improve thecapture and timeliness of NCRI data.
The main focus of the Registry is on the occurrence of a cancer case, not the individualinvolved, although information on individuals is of significant importance. All records areconsidered relevant and active even after patient death. New cancers for the same personare entered and personal details are updated at the same time. Apart from details of thetumour and treatment, the NCRI captures information on age, gender, marital status,occupation, address (ED coding is being undertaken). Nationality information is not collectedand cancers are only registered for Irish residents (based on address of residence inIreland). There is provision for recording the PPS Number but in general it is not currentlycollected. The intention is to do so in future if the PPS Number is permitted to be usedgenerally. At present, each registered individual is assigned a unique personal identificationnumber by the NCRI. This allows multiple cancers in the same person to be linked over time.As part of the data capture, the Medical Record Number and the GMS Number are recorded(if available). Information is missing for some fields (if not in medical record) and occupationis only entered in about 50% of cases (particularly older/retired people). The United KingdomOffice for National Statistics (ONS) classification is used to code occupation (this isconsistent with the CSO’s) and the WHO’s International Classification of Diseases is used toclassify cancers and treatments. New treatment data are entered up to six months afterdiagnosis. Records are also updated in the case of death (with cause of death entered).Duplicate information is removed at source where identified. Manual and automatedprocedures are operated on an ongoing basis to identify and remove such duplicates. Inaddition, manual and automated checking is undertaken for inter-item consistency.
Overall, the NCRI covers about 95% of cancer cases and there are ongoing efforts to haveexhaustive coverage. At the time of examination of the database (July 2003), about 97% ofthe 2001 data and about 85% of the 2002 data had been captured. The NCRI publishes anAnnual Report on incidence, mortality, treatment and survival data on cancer. Thisinformation is used by health professionals and managers, researchers and the publicgenerally.

57
Statistical quality assessment
The NCRI data source is currently very useful for collecting and disseminating data oncancer incidences and treatments. There are ongoing arrangements to maintain andimprove the integrity of the data. The permanency of the database and the fact that it iscontinually being updated should tend to improve what appears to be already good qualitydata, In addition, the fact that the occupation coding used by the NCRI is consistent withCSO’s coding further enhances the statistical potential of the data. Use of GeoDirectoryinformation from An Post/Ordnance Survey of Ireland could be investigated as a means ofoptimising geographical analysis of the data.
4.2.8 National Breast Screening Programme
Breast Check, the National Breast Screening Programme was set up to screen women in thetarget population (50 to 64 years) for breast cancer every two years. Its aim is to reducemortality from breast cancer of the women screened by 20% in ten years. The programme isavailable by invitation to all women in the age cohort by Electoral Division (ED) within countyarea and is free of charge. Phase 1 of the programme began screening women in the areascovered by the ERHA, the NEHB and the MHB in February 2000 and targeted over 60,000eligible women to the end of December 2001. Almost three-quarters of those eligiblepresented for screening. Phase 2 will extend screening to the whole country, covering over290,000 eligible women and is expected to begin in 2005.
The list of eligible women was compiled from data supplied by DSFA, the GMSPB, VHI andBUPA – each of which provides two files every month concerning (a) details of new womenentering the programme and (b) updated information on existing women in the scheme.Procedures are in place to identify and remove any duplicate records - new records areuploaded onto the computerised database. In addition, information regarding deaths frombreast cancer is supplied by the National Cancer Registry of Ireland (NCRI) and there is alsoa facility for self-registration by candidates. Records are continually updated from informationreceived from all of these sources and from death notices in the press. ‘Inactive’ records aremarked 'excluded', 'deceased', 'over age', etc. but are not permanently deleted.
The PPS Number is not currently used but the intention is to collect it if legally permitted todo so. At present, a unique 6-digit identification number is automatically generated by thecomputer system. Address information is not coded, but an ED code is allocated. In addition,the telephone Area Code is captured. Disability is only captured when the information issupplied by the client but it is not specifically categorised except as special needs. NBSPsystems have the capacity to capture the nationality variable but it is not captured currently.There is little or no use of classifications or coding systems.
Monthly statistical reports are produced one month in arrears and more detailed informationis provided six months in arrears. An annual report was published for 2001-2002 containingstatistics from commencement of the BreastCheck programme in February 2000 to end2001. The main users of the data are policy-makers, service providers, public healthspecialists, epidemiologists within the programme and the public.
Statistical quality assessment
As it stands and given the present incomplete coverage of the basic information sources, theNBSB is aware that the programme is covering about 92% of the targeted population.Ongoing efforts are being made by the NBSB to address this element of under-coverage,especially through promotion of self registration, and it is expected that complete coveragewill be achieved over time. In addition, the present 75% take up by the public is expected to
58
increase over time as awareness of the programme increases through promotion,advertising, etc.
This is a potentially useful data source and should become even more useful as coverageincreases and with the planned extension to nation-wide screening in 2005.
4.2.9 National Intellectual Disability Database
The National Intellectual Disability Database is operated and maintained by the DisabilityDatabases Division of the Health Research Board (HRB). The database contains informationon specialised health services either currently used or needed by people with intellectualdisability. It contains information on degrees of intellectual disability of the individualsconcerned but (deliberately) it does not contain diagnostic information. Established in 1995,the database informs the strategic planning for intellectual disability services. It also acts asa monitor of demographic change in the population of persons with intellectual disability, andfacilitates relevant and approved research and audit.
The intention is that the database should cover all persons with moderate, severe, andprofound intellectual disability and those with mild intellectual disability accessing orrequiring specialised health services. Participation in the database is voluntary (informedconsent is obtained) and some 27,000 people are currently registered. Reports of non-consent from health boards (the data collection co-ordinators) are very low.
The process of gathering the information into the database occurs in three-stages. Firstly, aNational Planning Data Form (NPDF) which may be a paper or electronic record iscompleted/updated by a Service Provider (SP) twice yearly for each registered individual.The SP may be a health board, a non-statutory/voluntary body, a person responsible for aCommunity Care Area or a school principal. The second stage sees Regional database co-ordinators in each health board receiving the information gathered twice yearly by thedesignated service providers in their region. While a twice-yearly update is recommendedsome health boards choose to implement just one update each year. The regional co-ordinators collate the information and check the integrity of the data. If it is not already thecase, all records are computerised at this stage. The data collected at this point of theprocess form a 'Regional Intellectual Disability Database'. At the third stage, the nationaldatabase is updated using electronic returns (excluding personal data) from the sevenregional health boards and the Eastern Regional Health Authority. Health Boards makereturns to HRB once a year.
To facilitate data integrity, each individual on initial registration is assigned a unique six-digitPersonal Identification Number (PIN) which is retained even if the individual moves betweenservice provider or health board. The first digit of the number indicates health board in whichfirst registration occurred. Procedures are in place to ensure that all potential newregistrations are verified by the Regional Database Co-ordinator before any new PIN isallocated.
The following administrative variable categories are among those captured on the NPDF:age, gender, health board and community care area codes, as well as Planning Area andED codes (to denote place of residence) and county code. In addition, separate variablesare included for health boards with responsibility for (a) funding current services and (b)funding future services. Details of whether registered person is of no fixed abode are alsocaptured. Optional data items include a planning area code (developed by individual healthboards and therefore not unique), ED code and phone numbers of next of kin. Next of kindetails are not incorporated in the HRB database. The World Health Organisation (WHO)International Classification of Diseases is used to classify the degree of intellectual disability.
59
National intellectual disability statistics are published by HRB in an Annual Report of theNational Intellectual Disability Database Committee. The 2001 Annual Report is the latestavailable. Ad hoc reports for service planners primarily in DHC are also produced. Theprimary users of the data are health administrators, policy-makers, service planners in DHC,health boards, non-statutory bodies, lobby groups and approved researchers.
Statistical quality assessment
The database was set up solely to capture administrative data to determine current andfuture intellectual disability service requirements and, as such, does not capture informationon specific intellectual disabilities, socio-economic or demographic details (other than area ofresidence, age and gender). These variables, if they were to be collected in the future, maybroaden the usefulness and potential of the data source. At present, as rates of consent toparticipate in the database are high, the database is probably quite complete. Furthermore,arrangements to maintain the integrity of the data appear to be quite robust. The use of thePIN and computerised edits reduce the impact of duplicate data. Data validation checks arealso conducted. Timeliness of supply of data has improved significantly in 2003 with allhealth boards submitting their data within two weeks of the required deadline.
4.2.10 National Psychiatric In-Patient Reporting System (NPIPRS)
This database, which was initiated in 1963, is administered by the Health Research Board(HRB). It provides national and regional information on in-patient psychiatric services and onthe users of these services. Cross-sectional data are presented nationally, regionally (byhealth board area), locally (by individual hospital) and by hospital type. The informationproduced has been used for planning, research and policy purposes in the mental healtharea since 1965. The database captures the total psychiatric (hospital and unit) in-patientpopulation in terms of admissions and discharges (as well as deaths). It is therefore eventbased and, in the context of its principal purpose referred to above, it is not especiallyconcerned with the linking of events associated with individuals or with the compilation ofperson-based statistics. The database structure is also used in carrying out decennialcensuses of the in-patient population. Thus, as the database is event-based and not person-based, a person may have several admissions during the course of the year, eachadmission being recorded separately.
All psychiatric hospitals, units, private hospitals and children's centres report to the HRB onan annual basis (quarterly from 2003) giving details of admissions and discharges at anindividual level. Returns are made in both paper and electronic form. In addition to diagnosisinformation captured on admission and discharge (classified according to the WHO’sInternational Classification of Diseases), details are collected on age, gender, marital status,address (health board area, townland, county), occupation (using CSO Census of Population1996 classification), and employment status (unemployed/employed, retired, student, houseduties). In addition, legal category of admission (voluntary, non-voluntary) and order ofadmission (first ever, other), along with discharge reason and length of stay are recorded. Allfields are mandatory and true missing values are recorded as such.
In 2001, there were 24,446 admissions (of which 7,301 were new admissions) and 24,304discharges (including 266 deaths). At any point in time there are about 4,000 in-patientsresiding in these hospitals.
Results are published annually (Activities of Irish Psychiatric Services) with annual regionalbulletins for each health board area. Relevant database information has been included onthe Public Health Information System from 2003. The information is used by clinicians,epidemiologists, health administrators, policy-makers, researchers, the general public alongwith various mental health advocacy groups.

60
Statistical quality assessment
This long-established database holds very useful data on admissions and discharges andsome key categorisation details are captured. It provides a comprehensive national pictureof provision, use and users of the psychiatric in-patient services in Ireland. Regular validationof the data is carried out throughout the process and finally before publication. In addition,once an individual is discharged his/her record relating to the event recorded is not carriedforward (but it is archived). As mentioned, the database records are event based, andbecause there is no unique personal identifier used, certain categorisation data relating toindividuals can understandably be duplicated (or possibly even recorded differently ondifferent occasions) on the database under different event records (e.g. if the same personwas admitted to different hospitals and was allocated different local patient numbers).Hence, and while acknowledging that the database was not established to do so, it is notreadily possible to track data relating to an individual in a current or in a historical sense. Asregards timeliness, there is about a one year timelag in the publication of results but this willimprove with the move to quarterly collection.
4.2.11 Notifiable Infectious Diseases Database
The National Disease Surveillance Centre (NDSC) maintains reporting systems for notifiableand non-notifiable infectious diseases, antimicrobial resistance, immunisation and infectiousdisease outbreaks.
These systems were introduced in the late 1990s and are concerned with recordingstatutorily notifiable disease events and other data (as reported by GPs, hospitals or clinicaltesting laboratories and, in a related way, all persons in the State presenting with notifiableinfectious diseases). The Department of Health has been responsible for monitoring theincidence of infectious diseases since 1947 and data collection on this subject thereforepredates the establishment of NDSC. The 2001 Annual Infectious Diseases Statistical reportcontains time series of data from 1982 to 2001, although reporting to DHC and NDSC priorto July 2000 was in aggregate form.
At present, the NDSC data is abstracted from information captured locally (health boardarea). Apart from data specific to the disease reported, the current minimum datasetcomprises: health board identifier, disease, date of onset, date of diagnosis, gender, date ofbirth, age, country of birth, vaccination status, laboratory confirmed, organism and date ofnotification. Apart from the use of the WHO International Classification of Diseases forclassifying the various diseases and the Standard Nomenclature (SnoMed) for clinical terms,standard classifications are not used for other categorisation variables. The NDSC datasource cannot be linked directly to any register system.
Currently, it is thought that only a small proportion of all notifiable infectious disease casesare reported by GPs, hospitals etc. In the case of serious diseases, however, reporting isthought to be virtually complete. Despite the significant under-reporting of infectious diseaseit is felt that this is reasonably constant, allowing analysis of trends. Nonetheless, the lowreporting level must have negative implications for enhancing the statistical potential of thedata as it currently stands. It is hoped that revised infectious disease regulations will improvethis situation. In addition, the impact of duplicate individual data is a concern to the NDSCand work is ongoing to remove duplicate and inactive records.
A new Computerised Infectious Disease Reporting (CIDR) database system is beingdeveloped by NDSC with a view to implementation in 2004. It is intended that the relevantinformation from clinical notifications and from laboratories will be captured electronically atlocal level and linked appropriately. The new system should facilitate faster publication of the
61
results and the intention is to move as closely as possible to a ‘real time’ data-reportingbasis. Apart from the information referred to above, additional data will be collected inrelevant disease specific cases (e.g. nationality, race/ethnicity, membership of Travellercommunity, occupation). Geographical assignment to an individual case i.e. by county,community care area or Electoral Division will be possible in the future. If use of the PPSNumber is permitted then the integrity of the data will improve as the possibility of duplicateinformation for individual persons (as distinct from disease events) should be greatlyreduced.
The NDSC publishes weekly (quarterly in some instances) and annual data on reportedcases of notifiable infectious diseases with breakdowns by age, gender and health boardarea. Quarterly data for Sexually Transmitted Infections are also published. The annual 2002data are not available as yet (but weekly data are published on the NDSC’s website. As itstands, the NDSC data is used by DHC (policy, planning), researchers, public healthdepartments, health boards as well as environmental and agricultural and food processinginterests.
Statistical quality assessment
Very useful data are available from this database, particularly for the more serious notifiableinfectious diseases for which reporting is excellent. For the less serious diseases, the lowcurrent level of reporting probably limits the expanded statistical use of the data. In addition,the collection of only a limited amount of demographic and socio-economic data i.e. only forcertain diseases, further constrains the expanded statistical quality of the data. However, theintroduction of the new decentralised computer system (CIDR) should greatly help inremoving some of these shortcomings.
4.2.12 Annual Survey of Long Stay Units
DHC collects aggregate data on activities of over 550 long-stay units22 (i.e. public and privatenursing homes) in the various health board areas in order to compile statistics on thenumber of beds available for long term care, how the beds are used and the types ofpatients occupying them. The information collected by the DHC covers the number ofpatients classified by age (in age band), gender, health board area as well as level ofdependency, socio-medical status (chronic mental illness, chronic physical illness, mentalinfirmity/dementia, mental handicap, social reasons, physical disability, terminal illness,convalescence or rehabilitation, other reasons), source of admission, destination ondischarge and length of stay. No individual person data are returned to the DHC.
The results are published annually by the DHC, the latest report relating to 2001. In 2002,495 or approximately 87% of registered nursing homes made returns for these unitscovering over 20,000 patients, almost two-thirds of whom are over 80 years of age.
Statistical quality assessment
Individual record data is not available to the DHC. Aggregate information is collected foreach long-stay unit and the results are compiled for a very specific statistical purpose thatthe data serve. As such, there is very little information collected to allow further keycategorisation of the aggregate data (e.g. there is no information on marital status or onsocio-economic grouping). The limitations in linking aggregate data would have to be tackledbefore any further progress can be made in terms of linkages to other data internal orexternal to the DHC.
22 The categories are: health board geriatric home/hospital, welfare home, district/community hospital, voluntarygeriatric home/hospital, private nursing home.
62
4.2.13 Health Behaviours in School-aged Children
The Health Behaviours in School-aged Children (HBSC) survey is a cross sectional studyconducted every four years on behalf of the Department of Health and Children by theDepartment of Health Promotion, National University of Ireland – Galway. The survey wasfirst undertaken in Ireland in 1998 and is part of a World Health Organisation Cross-NationalHBSC Study which is a research study of the health behaviours and health of adolescentsacross a significant number of European and North American countries. The results providebaseline information on health related and social behaviours among school-going youngpeople aged 10-17 years. The survey is of a tick box format and collects a wide range ofinformation on health behavioural characteristics and social attitudes and relationships ofyoung people. It is self-completed by respondents. Information is collected on age, sex,parental occupation and employment status, perceived family affluence and lifestyle and thehealth board area of the school attended. In addition, information on the respondent’s livingarrangements and relationships within the immediate and extended family is collected. Noindividual identifier is collected and standard classifications of characteristics are not used.
In 2002, 176 schools (out of a total of 351 contacted from the Department of Education andScience school lists) covering 8,316 pupils participated in the Survey. Of these, responsesfrom 5,712 pupils from 93 schools were selected to maintain seasonal comparability with thedata from the initial (1998) Survey. The main findings are published in the report - TheNational Health & Lifestyle Surveys.
Statistical quality assessment
The HBSC survey instrument is an international standard questionnaire used by allparticipating countries. It enables the collection of a vast amount of standardised data andthus enables the quantification of patterns of key health behaviours, health indicators andcontextual variables. These data allow cross-national comparisons to be made and, withsuccessive surveys, trend data is gathered and may be examined at both the national andinternational level. The HBSC International Reports that contain the published data areuseful for policy-makers as they can compare the position of their country in relation toothers not only on health behaviours and health outcome measures but also on healthdeterminants. The information, however, is more qualitative than quantitative and relates toyoung people’s perception of their living conditions, behaviour and lifestyles.
4.2.14 Survey of lifestyles, attitudes and nutrition (SLÁN)
This survey was introduced in 1998 and is conducted at four-yearly intervals. Its purpose isto provide baseline information on health related behaviours among adults 18 years andover. It is closely related in form and content to the Survey on Health Behaviour in School-aged Children and is conducted on behalf of the DHC by the Department of HealthPromotion, NUI Galway and the Department of Epidemiology and Public Health, UCD.Potential participants are selected from the electoral register. In 1998, 10,515 were coveredby the sample while 11,212 were sampled in 2002. Response reached 5,992 (or 53%) in2002. The survey is designed in a tick box format and is generally seeking qualitative dataalthough some quantitative information is requested. The survey collects a range ofinformation on individuals’ lifestyles, attitudes, health status, nutrition, relationships, etc. Thefollowing categorisation variables are captured: age, gender, marital status, occupation,education, categories of household net income, the ED and County of residence, long-termillness/disability, nationality (as per Census 2002 question), membership of religiousgrouping, farm/non-farm household, holder of Medical Card and car ownership. A uniquepersonal identifier is not used. Standard classifications are generally not used, although
63
where possible, recommendations from the EU health monitoring programme have beenincorporated.
The latest 2002 results are published in the report - The National Health & LifestyleSurveys. The results are used by a range of stakeholders including policy-makers, serviceproviders, public health specialists and researchers.
Statistical quality assessment
This is a cross-sectional point-in-time survey conducted at four-yearly intervals whichprovides very valuable qualitative information on the behaviours, and perceptions of peoplein the general context of overall health and well-being. While quite a number of keycategorisation variables are collected (in tick box format) there is little use of standardclassifications and coding (apart from the use of recommendations from the EU health-monitoring programme where possible). Nor is the PPS Number (or other type of uniqueidentifier) used.
4.3 Other data sources
There was not sufficient time in this project to examine in detail the remaining data sourcesidentified by the SGSES. However, it is probable that the same issues would emerge, andsimilar conclusions be drawn, as for the sources examined.
4.4 Statistical potential
All of the data sources examined were fulfilling already specified statistical purposes and anumber were also addressing administrative needs. While it was clear that there are somelinkages between some data sources, these linkages were primarily designed to assist indatabase establishment (e.g. in identifying clients) or in facilitating basic data input andimproving data quality. The team did not find any instance in the sources examined wherestatistical outputs were linked across databases across the ambit of the DHC. Suchpossibilities would greatly enhance the existing statistical potential of the data sources.
To realise this potential within the health domain and assuming the appropriate legislativearrangements were put in place, it would be necessary to adopt the use of a unique personalidentification number (such as the PPS Number) in all the data sources examined. Thiswould potentially enable information on individuals to be linked at individual record level fromall health-related data sources and for a greatly expanded range of aggregate statisticaloutputs to be produced. However, to enable meaningful analysis, the demographic andsocio-economic variables of interest (e.g. date of birth, area of residence - or othergeographical variable, marital status, occupation, nationality, ethnicity and socio-economicgrouping) would also have to be available using recognised commonly used classificationsand coding systems. In addition, the use of standardised definitions and concepts incapturing data, as well as the education of all involved on the importance of the data’s widerstatistical information context, would be needed ‘across the board’ to underpin accurate datacapture and improved results compilation. The possibility of being able to produce a soundstatistical health profile of the population from birth to death seems very attractive and, ifrealisable, would be extremely useful for guiding policy-making in the health area. Apart frompoint in time statistics, an integrated framework of health data would enable longitudinalanalyses of the population from the point of view of their health status and their interactionswith health services over time and under changing conditions (e.g. if residence or occupationchanged).
64
Apart from purely health related statistics, the use of the PPS Number for linking individualhealth data with data held in other government departments could lead to an even moreexpanded statistical picture of the population in the context of health, education, housing,taxation, poverty, etc. and the way these factors impact on the different social dimensions ofthe population. A much strengthened body of information for policy and other needs wouldresult.
4.5 Overall conclusions and recommendations
4.5.1 Conclusions
The field of health statistics is wide ranging, the various data sources being developed overthe years to address both administrative and statistical needs as defined by the DHC. Thedata sources examined were primarily chosen for the following reasons:
♦ Where it was felt there may be scope to enhance and/or improve already existingnational administrative data systems (e.g. GMSPB, GRO);
♦ Where the data sources provide significant information concerning the state ofgeneral health of the population or subsets thereof (e.g. NCRI, HBSC,BreastCheck, NDSC, Perinatal Data, SLÁN Survey, etc.); and
♦ Where the data sources provide information on the interactions between thepopulation requiring health services and the provision of these services (HIPE,Hospital Waiting Lists, Survey of Long-Stay Units, NPIPRS, National IntellectualDisability Database).
In examining these sources, the team generally concluded that while they essentiallyaddress the specific statistical requirements they were designed to meet within DHC (andapart from their administrative purposes), they largely exist as isolated islands of informationwhich cannot currently be integrated. If such integration became possible for statisticalpurposes at least e.g. through a legally permitted use of the PPS Number for linkinganonymised individual records, then a vastly expanded statistical potential could result fromintegrating these sources not only internally within the DHC but also on a cross-departmentalbasis (e.g. with DES, DSFA, DoEHLG and Revenue data). A comprehensive statisticalprofile of the population (or subsets thereof) could then be produced for both cross-sectionaland longitudinal analyses.
The health domain data needs, identified as high priority and requiring development indepartmental submissions to the SGSES, may not in some cases have been fullyelaborated. It was clear to the team, however, that data relevant to some needs articulated inthe work of the SGSES are available from DHC sources (e.g. HBSC, SLÁN) and from CSOsources (Quarterly National Household Survey, EU Survey on Income and Living Conditionsand Vital Statistics).
The DHC SPAR team’s specific conclusions may be described as follows:
(i) There is a vast body of data on health service provision and health status matters inexistence across all the sources examined. In most cases, the information systemswere originally designed to serve specifically defined administrative, policy-making andstatistical requirements. There are ongoing efforts on the part of data holders toimprove the quality of the information to meet these needs.
65
(ii) Much of the data used is currently captured at local or regional level (e.g. healthboards, hospitals, GPs). There appears to be some variation in the type of informationcollection and capture guidelines interpretation at local and regional level.Furthermore, in many cases data are captured and processed in a fragmented andnon-standardised way. As a result, there may be: (a) variation in the range and type ofinformation required; (b) different definitions in some cases where an attempt is beingmade to collect the same variables; and (c) different classifications and codingsystems in use for key categorisation variables (e.g. occupation, marital status, andlocation of residence).
(iii) In general it was found that while there may be provision within systems for collectingparticular variables, the information may not end up being captured. In addition, incertain cases, information may be captured on paper records but may not becomputerised in the end. Due to time constraints in this examination, a full statisticalanalysis of the various data sources was not possible. However, such an exercisewould be required to establish the degree of completeness of each data holding.
(iv) In some cases the information available to the DHC may be a subset or selection ofthe information collected at individual record level. The availability centrally ofcomplete statistical information at an individual record level would enhance thestatistical potential of the data.
(v) Computer processing systems different to those available within DHC may be used atlocal or regional level and this can therefore hinder the task of integrating datacentrally.
(vi) The team considered that some enhancements could be made to the data in certaincases with a view to making it more useful for broader social statistical analysis. TheDepartment’s Public Health Information System brings together detailed informationfrom a wide range of health sources to meet a number of broad aims. However, eachinformation system remains a discrete and unlinked operation and by and large doesnot contain data on variables which would improve its value for social analysis. Up tonow this latter aspect has been considered of secondary importance to the mainpurposes for which the data sources were developed. Introduction of anyenhancements to data sets would inevitably involve some cost to data holders whilethe benefits would be spread among a larger group of users.
(vii) Maintenance of the integrity of individual health data records can be difficult becauseof the lack of a standard centrally generated unique personal identifier. Different datarequirements may use a variety of identifiers and an individual may be allocated asecond (or third) identification number by different authorities. This can result induplicate, redundant or incorrect data being held on databases making crosscomparisons and linkages with other data sources extremely difficult.
(viii) Database integrity maintenance is a concern to those departments or authorities thatadminister such databases (e.g. the DSFA Central Records System and the GMSPBCentral Client Eligibility Index). A large amount of duplication of effort can exist acrossthese bodies, each essentially attempting to ensure, in varying degrees of isolation,that it has accurate categorisation information captured on each individual and that ithas no duplicate records. It would seem to make sense not only from a statisticalviewpoint but also from an administrative one that key categorisation be capturedcentrally only once and that it be maintained up to date thereafter.
4.5.2 Recommendations
It has already been noted in Section 4.5.1 that the possibility of the data sources examinedbeing used in a wider statistical context either in aggregate terms, or through linkage atindividual record level, has to date been thought of as secondary to the principal use of the
66
data. However the DHC SPAR team considered that in certain cases some enhancementscould be made to data with a view to making it more useful for broader social statisticalanalysis. These enhancements would materially address some of the concerns raised in therecent Brennan and Prospectus reports about the capture, maintenance and analyticalcapabilities of existing data. They are also broadly in line with the Government’s proposalson improved information availability through the establishment of the Health Information andQuality Authority. In addition, according to the DHC, the intention of the National HealthInformation Strategy which is expected to be published shortly, is to ensure that the bestinformation available should be used at all points in the health care system in order to:
(i) Enable better management of finite health resources;
(ii) Provide better information to the public; and
(iii) Deliver effective and efficient services to all.
The team is of the view that its recommendations will probably coincide broadly with thoselikely to emerge in the Strategy concerning information gathering, dissemination andanalysis.
The following general recommendations are made by the DHC SPAR team:
(i) Where it does not exist, greater standardisation should be implemented within theDHC for paper and electronic form design and in the definition and specification of keydemographic and socio-economic categorisation variables (date of birth, gender,marital status, location of residence, nationality, race/ethnicity, substance intake,occupation, socio-economic grouping, etc.) and in their related classification andcoding systems. Two options can be considered for this:
(a) Capture of the relevant data locally for each DHC data source; or
(b) Capture of data once in a centrally maintained database.
The first option is probably feasible but leads to the same information being collectedrepeatedly and is therefore sub-optimal. Multiple capture of the same data makes itdifficult to ensure the integrity of the data and is less efficient overall than the secondapproach. The second option involves the data being captured and, where relevant,being updated by the DHC authority responsible for the operation and administration ofthe database. The centralised key data capture and maintenance approach shouldresult in a much more robust body of critical categorisation information. While initialcosts could be significant, the potential savings over time from dispensing with theneed for multiple non-integratable databases should also be significant.
(ii) While the previous general recommendation focussed on data management within theDHC, the SPAR team was of the view that the second option could be considered in amore general light for administrative data holdings pertaining to social statistics acrossa number of departments and bodies. Under this scenario, it is envisaged that anindependent body would be responsible for the maintenance and administration of thecentralised key individual information.
(iii) Effective and efficient implementation of the two previous recommendations would becontingent on the implementation of standardised use of and access to the PPSNumber, with appropriate legal arrangements for data protection covering prescribeduse of the data. Assuming the legal safeguards and assurances were to be put inplace, use of the PPS Number should be facilitated for the purposes of maintaining theintegrity of individualised data records held and for linking different data sources atindividual record level in order to facilitate production of improved statistical
67
information. The use of the PPS Number, along with the use of key demographic andsocio-economic information (date of birth, gender, marital status, occupation, socio-economic grouping, location of residence, nationality, race/ethnicity) and relatedstandardised classifications and coding systems, would enable the integration ofindividual records from different data sources and the compilation of a greater range ofanalyses giving a more comprehensive statistical picture of the population of healthservice users. The team recognises the difficulties to date in introducing the PPSNumber into the health sector particularly in those areas where there is mix of publicand private activity in the provision of services. This issue was highlighted earlier in theHealth Strategy (Quality and Fairness: A Health System for You) and also featuredprominently in the 2002 Annual Report of the Data Protection Commissioner. The roleand use of the PPS Number for improving the statistical potential of administrative datais addressed specifically in Chapter 8 of this present Report.
(iv) Given that ‘marital status’ is a key socio-demographic variable, and as the GRO dataon this variable is confined to marriages, divorces and civil nullities registered withinthe State, it is recommended that the GRO data capture arrangements be extended tocollect additional data on legal separations occurring within the State. This wouldfacilitate the generation of more complete analysis of information on the basis ofmarital status.
(v) In addition and in the interest of compiling the full range of vital statistics, it isrecommended that the modernisation of the GRO’s system of registration of all vitalevents be completed as soon as possible.
(vi) In the interest of improving the information on hospital waiting lists in the short-term, itis recommended that:
(a) Average waiting times; and
(b) The category ‘waiting times up to 3 months’ be included in the results.
Beyond this, it is recommended that the DHC review its definition of waiting time tocover the entire period from the time of initial referral by the General Practitioner to thedate of hospital admission.
(vii) In order to connect with the information from the Hospital Waiting List Survey, it isrecommended that the HIPE system captures, from the patient on admission tohospital, the waiting time from the date of initial referral by the General Practitioner tothe hospital/consultant to the date of admission.
(viii) The use of the GeoDirectory (maintained jointly by An Post and the Ordnance Surveyof Ireland) or an equivalent facility for assigning geographical (x,y) co-ordinates tostandardised address fields should be considered. The use of this type of locationalattribution, along with the use of suitable mapping software, enables the generation ofgeographical analysis at county, ED, postal district or other defined area.
(ix) Greater encouragement and education at national, regional and local level on thewider statistical use of the data captured and the need to have complete informationrecorded in a standardised way.
(x) Implementation of compatible computer processing arrangements to facilitate datasharing.
(xi) Implementation of improved data dissemination arrangements concerning thefrequency and timeliness of information and its analytical presentation in terms of thedemographic and socio-economic classifications used. Over time, it could beenvisaged that key statistical information of interest to policy-makers, planners, serviceproviders, researchers and the public at large could and should be available on avirtually ‘real time’ basis.

68
69
Chapter 5 Department of Justice,
Equality and LawReform

70
5.1 Introduction
The main areas of responsibility of the Department of Justice, Equality and Law Reform(DJELR) are:
♦ Crime and security;
♦ The Criminal justice system (the Gardaí, the Courts and the Prisons);
♦ Reform of the criminal law and updating areas of the civil law;
♦ Immigration policy and strategy in relation to asylum seekers; and
♦ Policy in relation to equal treatment generally, anti-racism, disability, equality andchildcare.
In the criminal justice area, the principal data holdings within the department and itsagencies are:
♦ The Garda PULSE system, which maintains all police records;
♦ The Courts Case Tracking System (CCTS) which covers criminal records withinthe courts system; and
♦ The Prisoner Records Information System (PRS) which maintains all prisonerrecords.
The two key data holdings in the immigration area are:
♦ Registered non-EEA nationals; and
♦ The Refugee Asylum Commissioner database.
A number of other data sources, which are not of major significance from the point of view oftheir statistical potential, also exist. These include:
♦ Dedicated one-off surveys in the gender equality area on housing, parental leaveand transport;
♦ Measures set out in the National Development Plan on equality;
♦ Gender equality in the membership of State Boards;
♦ Data holdings in respect of civil and criminal legal aid;
♦ Child abduction; and
♦ Maintenance recovery.
71
5.2 The Garda PULSE system
The PULSE system, which was introduced in 1999, supports the work of the GardaSíochána by enabling relevant information to be recorded, processed, stored and retrieved.PULSE is primarily an operational tool providing the Gardaí with information on the recordingand subsequent investigation of reported crime, thereby servicing operational and strategicdecision making and informing the efficient deployment of resources within the force.
The PULSE system also underlies the publication of annual crime statistics, which areissued as part of the report of the Garda Commissioner to the Minister of Justice, Equalityand Law Reform. In July 2002, the Government established an expert group on crimestatistics to examine and make recommendations on the collation and presentation ofinformation relating to reported crime. The Group was constituted in early 2003 and had itsfirst meeting in March 2003. It has met on a monthly basis since then.
The main terms of reference given to the Group were:
♦ To examine the collation of information relating to crimes reported to andrecorded by the Garda Síochána, mindful of the capabilities of the PULSEsystem;
♦ Examine the 'Principal Offence' rule which is used by the Garda Síochána, whichis 'incident focused' rather than 'victim focused', and other counting rules used bythe Garda Síochána;
♦ Examine the distinctions currently made between offences classified asindictable and non-indictable, as contained in the Commissioner's Report, havingregard to the seriousness of the crime committed, with a view to possiblechanges in the classification of offences; and
♦ Examine the collation of information relating to other crimes where the GardaSíochána is not the prosecuting authority, for example, 'white collar' crimesprosecuted by the Revenue Commissioners.
The expert group has effectively been mandated to realise the statistical potential of theGarda PULSE system. The work of the group was informed by a public consultation process,the results of which identified a number of shortcomings in the present method of compilingcrime statistics. These include poor timeliness, absence of a satisfactory level of geographicbreakdown of the published data, and the need for regular crime victimisation surveys. Otherlimitations, which were identified, include a lack of consistency in the published data overtime, poor methodological notes, and unsatisfactory publication arrangements.
Notwithstanding the fact that the expert group has been charged with carrying out a detailedanalysis of the potential of the PULSE system to produce crime statistics, the SPAR teamwould have wished to have been able to carry out a preliminary analysis of its own at thisstage. However, given that the full record layout of the PULSE file was not made available tothe SPAR team, this analysis was effectively precluded.
The expert group, in collaboration with the Garda authorities, is currently focussing on thefollowing statistical processes used to derive crime statistics from the PULSE system: targetpopulation (i.e. the distinction between reported and recorded crime), data capture, codingrules and manuals, classifications, editing procedures, data quality assessment andpresentation and publication of results (including release mechanisms).
72
The setting up of the expert group underscores the general level of dissatisfaction that existsamong the user community in relation to the quality of the existing crime statistics. The grouphas a year from the date of its inauguration in which to issue its findings.
5.3 The Courts Case Tracking System
The Courts Case Tracking System (CCTS), an Oracle relational database, is in operation inthe Dublin Metropolitan District Courts and Limerick District Court offices. Deployment ofCCTS nationwide will commence later on in 2003.
The CCTS application provides for the processing, scheduling, enforcement and reporting ofcriminal cases. Each case is assigned a unique identifier. The system enables users tocreate cases, add and adjourn court hearings, produce summonses and warrants and copyorders and a variety of other documents that are required in the course of a criminal case.
The system provides the facility to search for information by a variety of means includingdefendant and prosecutor names, case number, courtroom date, etc. Another advantage isthe ability to derive statistics through the use of automated queries rather than the manualmethods used heretofore.
Future developments of CCTS planned for later in 2003 will allow the transfer of selecteddata electronically between the Courts Service, the Gardaí, and the Department ofEnvironment and Local Government. This new feature will facilitate the introduction of the fullPenalty Points system on a nation-wide basis. The CCTS database will be rolled out to allDistrict Courts by the end of 2003.
The main focus of the CCTS has, to date, been on criminal cases prosecuted by the Gardaí.However, non-Garda offences, such as those prosecuted by An Post and the CompaniesRegistration Office, are also catered for in the system.
The extension of the CCTS to cover criminal cases in higher courts and to embrace thewider area of civil cases is being planned at present.
The main function of the database is to support the administration of the courts system andto provide management information to ensure its smooth running. The impression formedfrom the available information is of a comprehensive database capable of yielding goodquality data mainly of interest to agencies in the criminal justice area. The managementinformation capabilities of the system would tend to outweigh its statistical potential.
5.4 Prisoner Record System
The Irish Prison Service uses a system called PRS, the Prisoner Record System. The PRSserves two purposes. The first of these relates to the administration of records of prisoners incustody and holds personal details such as name, age, address, socio-economic status andnationality. Each prisoner is given a unique reference number (PRIS number) which is usedto track the prisoner through the system. Daily files are supplied to Garda headquarters bythe Irish Prisons Service, detailing those committed and released, to allow the Gardaí tokeep their records up to date.
The second purpose of the PRS is to provide data to feed into the management reports andthe annual report of the Irish Prison Service. The annual report deals with developments inthe Prison Service in the previous year and contains statistics on activity levels. Detailsrelating to the number of committals by age, gender, county, nationality, type of offence and

73
length of service are also provided. However, where a person enters two different prisons inthe one year, the PRS records this as two committals and hence there is a distinctionbetween the number of committals each year and the average number of prisoners incustody.
It is vital from a social policy and sociological perspective to be able to examine in detail theprofile of the prison population to help to throw greater light on the causes of crime. Adetailed profile of the prison population by age, socio-economic status, home district andnationality is a necessary requirement of any policy analysis of crime and its causes. Byestablishing the profile of a typical offender committing a typical offence or crime, policy-makers can derive the factors or potential causes that influence certain people to commitcrimes.
While at the overall level, the output from the PRS system is relatively comprehensive, thesystem itself does suffer from a number of shortcomings. Not all information on the system ismandatory and in some cases the service is dependent on the goodwill of the individualbeing committed to volunteer certain information. In addition, the PULSE number used bythe Gardaí in recording the crime is not held on the system but is held separately on anothersystem. Individual prisons appear to operate independently of each other when using thePRS. Therefore, the details of a prisoner who has served in another prison cannot beaccessed. Notwithstanding these shortcomings, the PRS is a valuable potential source ofuseful statistical data.
5.5 Registered non-EEA nationals
The Garda National Immigration Bureau (GNIB) was set up in May 2000 and is responsiblefor all policing matters on immigration. While the immigration process was computerised atthe time the GNIB was set up it did not go live until September 2001. This system keepstrack of all registered non-EEA nationals23, a process that has been in existence since 1946.The system is now live in 23 locations with other locations filling out paper forms that aresubsequently added to the system. The system interfaces with information from othergovernment departments, namely: work permits, visas and asylum seekers. Each of thesethree areas is updated weekly.
All non-EEA nationals who remain in the State for more than three months are required toregister with their local Garda Registration Office, which is located at the nearest GardaSuperintendent's Office or, in the case of those within the Dublin Metropolitan Area, with theGarda National Immigration Bureau's Registration Office, 13-14 Burgh Quay, Dublin 2. Theforegoing does not apply to asylum applicants who are given a temporary residencecertificate by the Refugee Applications Commissioner. During 2002, over 97,000 non-EEAnationals presented for registration in the State. This figure excludes persons under the ageof 16, female spouses of Irish nationals as well as persons seeking asylum and is not a pointin time stock figure.
The non-EEA nationals database is potentially a very valuable one whose coverage extendsto all non-EEA immigrants. The following basic demographic variables are maintained foreach person on the database: sex, date of birth, marital status, country of birth and countryof nationality. Given the scope and coverage of the registration system involved, it should bepossible to compile accurate stocks and flow figures for the relevant target population. This
23 A non-EEA national is defined as a person from outside the European Economic Area (i.e. the EU, Norway,Liechtenstein and Iceland). Switzerland also has a free movement agreement with the EU but is not a member ofthe EEA.
74
would be of major importance in improving the accuracy of the annual population estimatespublished by the CSO.
The situation in relation to information on immigrants, held by other governmentdepartments, is less satisfactory and can best be described as patchy and disjointed atpresent. In a number of cases where country of birth and nationality is asked, the relevantinformation is not always captured and even where it is, the level of disaggregation may beminimal.
A person coming to Ireland from a visa24 required country must apply for a visa in advance oftravel. Applications are made in Irish embassies or consulates abroad. In countries wherethere is no representation, applications can be made to the Department of Foreign Affairs inDublin. The embassy data has not been fully computerised and, in particular, does notdistinguish details of nationality. The data is supplied about six months after the end of therelevant year. Computerisation of the issue of visas is currently under consideration by theDepartments of Justice, Equality and Law Reform and Foreign Affairs. About 100,000 visaswere issued in 2002 compared with 35,000 three years previously. The availability of suchinformation on a timely basis would also add to the accuracy of migration estimates.
5.6 Asylum seekers
DJELR is responsible for asylum policy. In order to discharge this policy, DJELR requiresstatistics on applications, trends, flows, etc. from the various agencies. These include theRefugee Application Commissioner (RAC) and the Refugee Application Tribunal (RAT) – forappeals and the Reception Integration Agency (RIA) which looks after the direct provision ofaccommodation for refugee applicants.
Under the UN Convention on the treatment of refugees (1951), all persons who arrive at ourborders and claim asylum must be allowed into the country. All asylum seekers are providedwith accommodation and given some money for living expenses by the RIA.
Detailed statistics are available on the number of applications and numbers processed bynationality and by country. However, data retrieval presents a major problem. DJELRrecently commissioned a report by a private consultant to see how IT systems can beimproved to enable the information on them to be integrated. The report recommended anintegrated case management system for the RAC and RAT with a system which will track aperson through the whole asylum process and link to the Reception Integration Agency (RIA)for those person who are granted refugee status. Implementation of this system could costup to €8 million.
Up to half of all refugee applicants fail to turn up for their meeting at the RAC. This may bedue in part to large numbers of them staying in the State for short periods and then movingback to the UK. Once granted refugee status the applicant moves onto the register of non-EEA nationals. The backlog on the asylum seekers system is defined as anyone in thesystem for more then six months. At present this backlog is 1,700 persons.
In the past about half of all asylum seekers moved on to the so-called Irish born childscheme (IBC), whereby the parents of a child born in Ireland apply for residency status.However, since the Supreme Court judgement in January 2003, which found that parents of
24 The granting of a visa allows the holder to present himself or herself at Irish immigration controls to seek entryinto the State. Not all non-EEA nationals are visa required. The Aliens Amendment (Visas) Order, 2002 sets outwhich nationalities are exempt from the visa requirement.

75
an Irish born child have no automatic rights of residency, this pattern of movement onto theIBC scheme may alter.
There is general acceptance that the full statistical potential of the immigration databases isnot being realised at present. In this context, the need for a dedicated statistical resourcewithin the area has been articulated.
5.7 Other data sources
Dedicated one-off surveys
The Irish Government has adopted mainstreaming of equality as a strategy to promote equalopportunities between women and men in the National Development Plan 2000 to 2006(NDP). Mainstreaming equality between women and men means the ‘(re)organisation,improvement, development and evaluation of policy processes, so that a gender equalityperspective is incorporated in all policies at all levels and at all stages, by the actors normallyinvolved in policy-making’ (Council of Europe definition). The NDP provides funding for over130 measures, in six operational programmes - employment and human resources;productive investment; economic and social infrastructure; Peace, and two regionalprogrammes. Equality between women and men must be mainstreamed in all but six of theNDP measures.
In order to assist implementing departments and bodies in meeting their mainstreamingrequirements, the NDP Gender Equality Unit of the Department of Justice, Equality and LawReform was set up in 2000, to provide advice, training, information and statistics relevant togender equality to these bodies. Research was commissioned on the availability of existinggender-disaggregated statistics. This pointed out areas where there was a dearth of data.
Arising from this research, one-off surveys were carried out in the Housing and Transportsectors - two areas with poor statistical provision. The results were published in two reports.
Research was also commissioned to obtain reliable information on the uptake levels ofparental and force majeure leave. A postal survey of some 655 employers accounting for67,182 employees was carried out in July/August 2001. The main findings were published ina report dated 29 April 200225.
Equality measures in NDP
Statistics are provided on projects carried out under the Equality for Women measure of theNDP. These include aggregate funding and number of projects classified by five key strandsand by NUTS2 Region. The 5 key strands are:
♦ Access to employment, education and training, with a particular emphasis onretraining and upskilling of women;
♦ Career development for women;
♦ Entrepreneurship among women;
♦ Innovative projects for disadvantaged women aged over 50 years of age; and
♦ Promoting gender balance in decision making.
25 See Report of the Working Group on the Review of the Parental Leave Act 1998 on DJELR website.
76
This information can be considered more as management type information rather thanofficial statistics.
Gender equality in the membership of State Boards
Basic data is maintained on the number of women on State Boards and on the percentagewho are chairpersons of State Boards. Details on total board membership, and theproportion of which is appointed by the Government, are also maintained. Clearly this is animportant measure within the gender equality area. However, other than satisfying theimmediate policy needs, there appears to be no further potential from a statisticalperspective.
Data holdings in respect of civil and criminal legal aid
Data relating to Criminal Legal Aid deals with claims for payments made by senior and juniorcounsel arising from legal services provided in criminal cases where defendants do not havethe means to pay their own legal costs. In this system, the barrister making the claim is theclient rather than the person who is availing of the service. Financial and activity datadetailing the number of claims processed with reference to the type of court and by barristerare produced on a monthly basis and circulated within DJELR. There is no annual report orpublished statistical data.
The CSO does not see any potential for further development of this data source, whichserves principally as a management and financial reporting facility.
The Legal Aid Board provides legal aid and advice in civil cases to persons who satisfy therequirements of the Civil Legal Aid Act, 1995. The primary requirements for assistance underthe scheme are based on a means tested income threshold and a requirement that theremust be merit in the case concerned. The Board supplies the services of solicitors andwhere necessary barristers through 30 local law centres situated around the country. Inaddition the Board has responsibility for handling the Refugee Legal Service which provideslegal advice and assistance to asylum seekers at the various stages of the asylum processincluding representation before the Refugee Appeals Tribunal.
The Board produces an annual report that is based on its activity in the previous year.Statistics relating to the total number of cases, number of cases for legal advice only andnumber of cases for legal aid by law centre, by type of case are published as part of thereport. In addition, the report also deals with administrative issues such as corporateplanning, sample cases and the financial statements of the Board.
Because this scheme is restricted to that section of the population whose income is below acertain threshold, the data produced by the Board has limited value from a statistical point ofview other than as serving the requirements of reporting on the activity of the Legal AidBoard. There is no potential for any further enhancement in the data produced.
Parental child abduction and recovery of maintenance payments
Ireland is party to a number of international agreements in respect of international parentalchild abduction and the recovery of maintenance payments from persons residing abroad.The statistics are reproduced in the DJELR Annual Report.
Neither of these sources is of major statistical importance (e.g. there were 102 cases ofparental child abduction in 2001 and 34 cases of recovery of maintenance payments).

77
5.8 Statistical potential
Within the criminal justice system, the single greatest potential source of statistics is theGarda PULSE system. While this system is currently being utilised to generate statistics,(see the statistical Appendix dealing with crime statistics in the annual report of the GardaCommissioner to the Minister for Justice, Equality and Law Reform), it is acknowledged thatthe compilation of crime statistics is in need of major overhaul. The Expert Group on CrimeStatistics was set up specifically to carry out this review. The output from this examinationwill hopefully be a set of crime statistics which is perceived by the public to be objective,timely, and compiled using best statistical practice.
While the main agencies involved in the criminal justice area (namely, the Gardaí, the Courtsand the Prison Service) are autonomous, there is a high degree of interdependence betweenthem. It is recognised within the department that this interdependence requires that theirdatabases should be fully integrated primarily with a view to achieving operational efficiencyby eliminating the duplication, gaps and inaccuracies of the current manual interfaces. Asignificant by-product would be improved information and statistics for policy-makers and thepublic.
A DJELR policy document on integration across the Justice agencies within the CriminalJustice area was agreed to in 1999. The policy, which was contained in the department'sStrategy Statement 2001-2004, states inter alia that electronic transfers will be used whereappropriate. The implementation of the policy would require, in particular, a commonsoftware platform, appropriate network infrastructure and a common data model (consistentwith the PULSE system).
To date, the Justice Sector Data Network has been activated for all associated agenciesother than the Gardaí while some work has been carried out on the development of acommon data model. A common identifier across all systems has been identified as a keyissue and the PPS Number has been singled out as the most suitable. However, anamendment to the Data Protection legislation may be required to facilitate such an approach.These issues are under consideration within DJELR at the moment.
5.9 Conclusions and recommendations
The Garda PULSE system is the key data source within the criminal justice area and iscurrently being examined by an Expert Group on Crime Statistics. Realising the full statisticalpotential of PULSE will depend to a large extent on what recommendations the group comesup with and the extent to which these recommendations will be capable of being carried outby the Gardaí.
Integration of the data sources in the criminal justice area would have a positive spin-off interms of more comprehensive statistical output.
Realising the full statistical potential of the immigration databases may require dedicatedstatistical resources within that area. However, it should be possible to compile accuratestocks and flow figures for the relevant target populations on the registered non-EEAnationals database. This would be of major importance in improving the accuracy of theannual population estimates published by the CSO.
On a general level, the power to assess the statistical potential of the records of publicauthorities is set out as part of the functions of CSO in Section 10 of the Statistics Act, 1993as follows:

78
(1) The functions of the Office shall be the collection, compilation, extractionand dissemination for statistical purposes of information relating toeconomic, social and general activities and conditions in the State.
(2) The Office shall have authority to co-ordinate official statistics compiled bypublic authorities to ensure, in particular, adherence to statistical standardsand the use of appropriate classifications.
(3) The Office shall have authority to assess the statistical potential of therecords maintained by public authorities and, in conjunction with them, toensure that this potential is realised in so far as resources permit.
This power is brought into sharper focus in sub-section 31(1) of the Act as follows:
The Director General may request any public authority to consult and co-operatewith him for the purpose of assessing the potential of the records of the authorityas a source of statistical information and, where appropriate and practicable,developing its recording methods and systems for statistical purposes, and thepublic authority shall comply with any such request, in so far as resourcespermit.
However, the provisions of sub-section 31(1):
shall not apply to records pertaining to a Court, the Garda Síochána or the prisonadministration.
The Statistics Act therefore does not offer any legal underpinning to CSO specifically inrelation to the administrative data holdings of agencies in the criminal justice area.
Dealing with the PULSE system in particular, the CSO is on record as stating that it is willingto provide relevant professional assistance to the Gardaí if requested to do so. This couldcover areas such as:
♦ Technical advice on data handling;
♦ Adherence to statistical standards;
♦ Classifications;
♦ Data flows;
♦ Data quality assessment,
♦ Data integrity; and
♦ Presentation and publication of results.
For the courts and prison systems, the requirement for such professional statisticalassistance may not be as pronounced as for the Gardaí.
The department is reactivating a proposal which it originally surfaced in its 1998 IT Strategyin relation to the creation of a criminal history repository. What is intended is the creation of asingle location which would hold anonymised data from the information systems of the Irish

79
Criminal Justice System. Ideally this would require a common data model for the PULSE,CCTS and PRIS systems (i.e. shared definitions of codes). While this proposal did not enjoymuch success in the past, it is likely to become more of a priority now in the context of theDepartment data strategy that will be required from late 2003 onwards.

80

81
Chapter 6 Department of Social
and Family Affairs

82
6.1 Introduction
The DSFA is an important source of secondary data across a broad range of domains but inparticular in relation to the provision of information on vulnerable groups. The extent to whichthis data can be exploited is largely dependent on the ability to link the data available withinDSFA with other government departments and of course CSO statistical instruments.
Traditionally, the primary use for data held within Departments is the administration andmanagement of the schemes and services provided. The statistical emphasis has been onthe production of data that allows departments to monitor the performance of their schemes(programme indicators). However in recent years there has been a change, in particularwithin the DSFA with the formation of the National Office for Social Inclusion (OSI) set up aspart of the National Anti-Poverty Strategy (NAPS). The OSI has been given the lead role inthe development of a research and data strategy on poverty and related issues.
The primary sources of social information, especially in relation to the NAPS and NAPinclindicators, are the Quarterly National Household Survey (QNHS) and EU Statistics onIncome and Living Conditions (EU-SILC). These two surveys alone provide 17 of the 18Laeken indicators (they cover four aspects of social inclusion: financial poverty, employment,health and education). However, a significant limitation of these two surveys is their inabilityto provide statistical information on the main vulnerable groups in our society. Primarily thisis due to the fact that these groups cannot be targeted during sample selection to ensureadequate coverage in the sample which would allow the calculation of accurate estimatesfrom the survey. The data holdings within the DSFA have the potential to be a major sourceof information on these groups categorised by geography, age, family status and benefit-history. Significant value could be added to the DSFA data holdings and the CSO householdsurvey data, if it were possible to link the sources.
In terms of data holdings (and the structure of these holdings), DSFA is perhaps in a muchstronger position than many other government departments. While some of the existingsystems are effectively old legacy systems (ISTS and PENLIVE), there is a clear strategy tomove over to a pure relational database type structure through the Service Delivery Model(SDM). Over time, schemes will be migrated from the old legacy systems to the new SDM.This will provide the department with a unique opportunity to review the structure andcontent of its existing data holdings.
SDM is a ten-year programme of change. The current roll-out plan is as follows:
Phase 1 Child benefit (2002);Phase 2 Retirement and old age contributory pension, related household benefit
and bereavement grant (estimated implementation mid-2005);Phase 3 Invalidity, widow/ers contributory pension (including occupational injury
benefit widows), orphans contributory allowance and related householdbenefits;
Phase 4 Old age, widows and orphans non-contributory pension, carers anddisability allowance, blind person’s pension and related householdbenefits;
Phase 5 Non DSW household benefits, disablement, rent allowance, desertedwives benefit/allowance, prisoners wives allowance; and
Phase 6 Short-term schemes (sub-phases to be decided).
Extensive use of the PPS Number on all schemes and consequently on all systems addsconsiderable value to the DSFA data holdings. It is widely acknowledged that the primarykey to unlocking the full potential of administrative records for statistical purposes cannot beachieved without the widespread use of the PPS Number. In terms of register development,
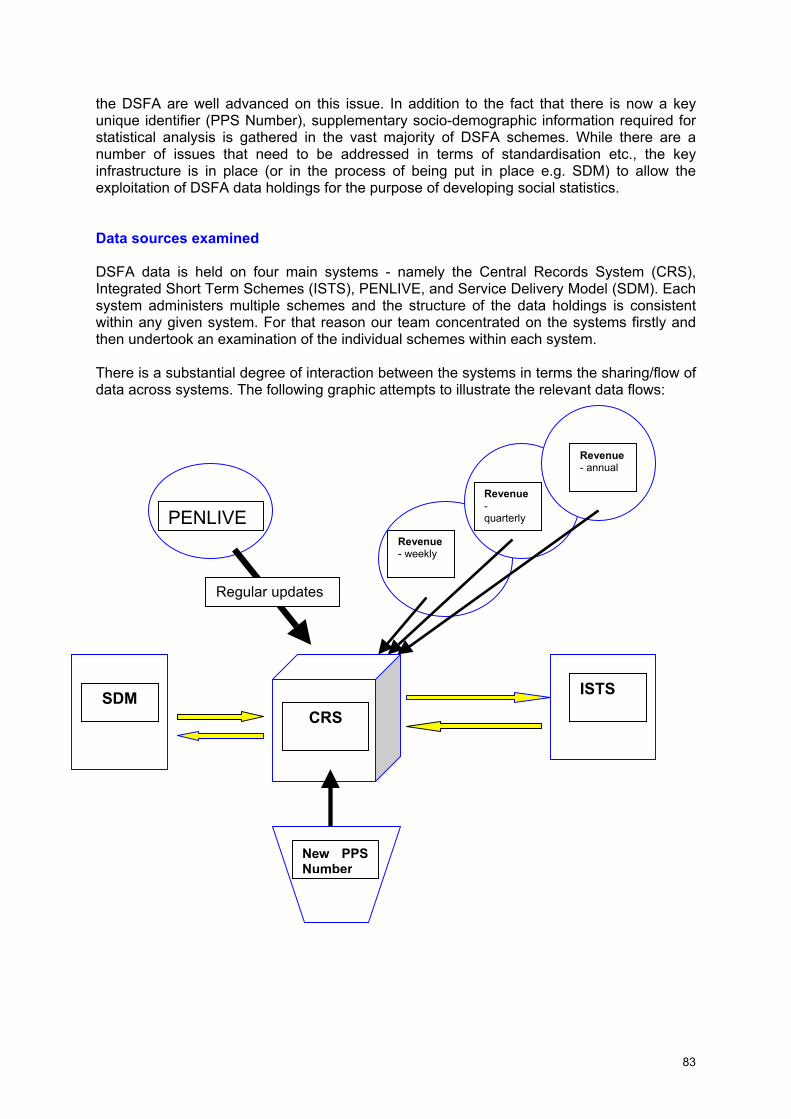
83
the DSFA are well advanced on this issue. In addition to the fact that there is now a keyunique identifier (PPS Number), supplementary socio-demographic information required forstatistical analysis is gathered in the vast majority of DSFA schemes. While there are anumber of issues that need to be addressed in terms of standardisation etc., the keyinfrastructure is in place (or in the process of being put in place e.g. SDM) to allow theexploitation of DSFA data holdings for the purpose of developing social statistics.
Data sources examined
DSFA data is held on four main systems - namely the Central Records System (CRS),Integrated Short Term Schemes (ISTS), PENLIVE, and Service Delivery Model (SDM). Eachsystem administers multiple schemes and the structure of the data holdings is consistentwithin any given system. For that reason our team concentrated on the systems firstly andthen undertook an examination of the individual schemes within each system.
There is a substantial degree of interaction between the systems in terms the sharing/flow ofdata across systems. The following graphic attempts to illustrate the relevant data flows:
SDM ISTS
PENLIVE
CRS
New PPSNumber
Regular updates
Revenue- annual
Revenue-quarterly
Revenue- weekly

84
6.2 The Central Records System
The Central Records System (CRS) is a central repository of selected data held on differentsystems within the DSFA, namely ISTS, PENLIVE and SDM, and the P35 employer andsocial contributions data which comes from the Revenue Commissioners. CRS holdsrecords on an individual basis and uses the Personal Public Service (PPS) Number as itsidentifier. The PPS Number was introduced in the Social Welfare Act 1998 to assist in thedevelopment of eGovernment and replaced the existing Revenue and Social Insurancenumber. The CRS is effectively a register of all PPS Numbers issued and therefore coversall persons who: pay tax; claim Social Welfare benefit or assistance; claim child benefit orreceive a contributory or non-contributory pension. This effectively covers every normallyresident person in the State and so is believed to have close to full population coverage. Thesystem was developed into a relational database in 1994 and now operates in tandem withthe new Service Delivery Model (SDM) and the ISTS systems in that there is a seamlessdata flow between all three systems. New records are added to the CRS through the issuingof new PPS Numbers by the Client Identity Services section in DSFA. The issuing of newPPS Numbers is now done following strict procedures and only on the basis of accurate andverified information. At present, all children are issued a PPS Number upon application forChild Benefit payment. Under a new system, ready to go live under the Reach initiative, thiswill change with the introduction of a new E-link to the GRO whereby PPS Numbers for new-born children will be assigned upon registration of birth.
CRS Data
The client table on the CRS holds a range of the key socio-demographic variables of interestfor policy purposes, in particular sex, date of birth, date of marriage, marital status andnationality. Other key data of interest is held in a variety of other tables including householdID number, income data, relationship data, occupation codes, employer details and a countof jobs for persons in multiple employment. All employment and employer data is updatedfrom files from the Revenue Commissioners. A Social Welfare Advice File is received everyweek, which contains details of any changes in employment status during that period for allemployers and employees. Every quarter a Business Name and Address file is receivedcontaining all employer names and addresses, trading status, industry codes, cessationdates, etc. Once a year a file containing up to date data on income earned and socialwelfare contributions paid by, or on behalf of, all persons who were employed during theperiod is supplied to DSFA from Revenue. Income data on the CRS other than that coveringPAYE type income is incomplete (i.e. self-employed etc.). The data on the self-employedcan be accessed on the Revenue files via the PPS Number (see Chapter 7).
6.2.1 Statistical quality assessment
The quality and completeness of all the data on the CRS varies considerably depending onthe data in question and the source of the data. For example, while the relationship datasourced from the SDM/ISTS systems for dependants and their families is extensive andincludes all parent / child and sibling relationships, that sourced from the PENLIVE systemsis less complete. The CRS is to a large extent an amalgamation of data from differentsystems and direct entry into the system is extremely limited. The quality of the data on theCRS is only as good as that of the data system from which it originates and this is discussedin more detail in the relevant ISTS, SDM, and PENLIVE sections.
A detailed study of the quality of the data on the CRS was outside the scope of this report.An exercise undertaken within the department in February 2002 examined the extent ofmissing values of some of the core demographic variables. The results are limited in theiruse however, as they include approximately 550,000 records subsequently identified asredundant, and a more detailed analysis would need to be undertaken before any firm

85
conclusion could be drawn. An extensive data cleansing exercise is now underway whichaims to verify all client identity type information within each record (name against sex etc.),and to clean the existing data (remove titles from the first name field, correct overflows ofdata from one address field into the adjacent one, etc.). This data cleansing exercise is alsoaimed at addressing the issue of missing values within the client identity information. Thedevelopment of the Public Service Identity (PSI) database, which will rely heavily on theCRS, will no doubt add to the business need to address additional data quality issues.
One of the more important tables within the CRS system from an analysis point of view isthat which is designed to hold the detailed geographic information. However, this table is notcurrently populated, and as it is the only table that holds ED and street/townland codes, thismeans the CRS has no useful geography coding, apart from county codes. It should benoted however that the system does hold the address text strings. A similar problem existswith the client occupation table as it is not populated.
Coverage
While the CRS is believed to have almost full coverage for every normally resident person inthe State, a key exception to this is elderly persons claiming state pensions that areadministered at present through a claim number on the PENLIVE system. An exercise tomerge these records onto the CRS was undertaken recently. As all of the various pensionand long-term schemes administered by the PENLIVE system are migrated onto the newSDM over the coming years all remaining records will be assigned, or matched with, a PPSNumber and merged onto the CRS. Secondly, it is possible that there are a very smallnumber of other persons not included on the CRS i.e. elderly men or women who havenever worked outside the home, never claimed a pension and never claimed any SWassistance. As the stated business aim of the CRS is to only hold information on personsnecessary for administrative purposes, the Client Identity Services section of CRSadministration have no plans in place to systematically add these persons as there is atpresent no business need to do so. However, with the development of the PSI database andthe increasing use of the PPS Number by a wide range of Government bodies and agenciesover the coming years, it may become necessary for all persons to be registered.
The total number of person records currently on the CRS, before any clean-up exercise,exceeds five million whereas the Census 2002 results show 3.85 million usually residentpersons. The CRS does not at present systematically mark inactive or redundant records onthe database.
As mentioned previously, an exercise was undertaken last year that identified approximately550,000 inactive records (for 7 years or more). These records were marked dormant, andexcluded from CRS statistics. They can be accessed and "re-activated" by all departmentalstaff and in fact a small number have been re-activated since being marked as dormant. Thesecond phase of the project (still being developed) is to have all re-activations alerted to aControl Area which would follow up on these to ensure the use of the number was valid.From a register perspective, the marking of records as inactive or dormant as distinct fromremoving them from the database is good practice as it allows historical analysis of the dataif required. This was a once-off exercise although there are now plans under the current datacleansing project to repeat the exercise and restrict the ‘inactive period’ to five years.
Initial comparisons with the results of Census 2002 (using CRS data before redundantrecords were purged) indicate the biggest differences are in the 23 to 40 age brackets, andin the over 70s. A more detailed comparison of numbers between the CRS file and thesummary Census 2002 results of age, sex and marital status would prove useful inidentifying specific groups for further investigation.
86
The date of death and a deceased indicator are held as part of the client information on theregister, though this is only captured systematically where it is needed for administrativepurposes (pensions, SW assistance stopping). It is not captured systematically for personsin employment or receiving private pensions, for example. Secondly, a date of death entrydoes not trigger the record to be marked redundant (as there can be ‘activity’ on a case eventhough a person is dead). Under the new E-link with the GRO, due to go live shortly, it will befeasible to have all deaths notified to DSFA and updated automatically onto the CRS,subject to the required legislation being in place. In addition, there are tentative plans inplace to address the issue of historical deaths and systematically match this information ontothe register, but this will be sometime in the future.
While there can be no duplicate PPS Numbers on the CRS, DSFA acknowledge that thereare duplicate persons, which they divide into two types, accidental and malicious. While it isdifficult to identify the latter group and their number is unknown, it is not thought to besignificant. Accidental duplicates exist through the administrative practice in the past ofissuing a second PPS Number if a person had lost or forgotten their first number. The datacleansing exercise referred to above aims to verify all client identity type information withineach record (name against sex etc.) and, to identify duplicates and purge them. Thecompletion timeframe for this exercise is end 2004.
6.2.2 Statistical potential
As things stand there are limitations to the use of the CRS for statistical purposes given theissues raised previously i.e. redundant records, missing PENLIVE claimants (elderly),duplicates, updates to socio-demographic variables (in particular marital status) basedprimarily on claims data. Many of these problems relate primarily to the historical records.Current procedures ensure full and accurate capture of the socio-demographic data for allactive records which when combined with the PPS Number offers significant statisticalpotential.
The absence of detailed geographic data below county level has been identified as aweakness of the CRS. However, the data to populate these tables is in existence from boththe Ordnance Survey, through the use of the GeoDirectory, and the actual detailed addressdata captured on all DSFA claim forms. The use of postcodes, which is currently underdiscussion, could also resolve this problem.
The CRS provides good and up-to-date income data for all employees at any given timethrough the P35 employer and social contributions data from Revenue. The same can not besaid of the self-employed as DSFA receive a limited amount of data on the self-employedfrom Revenue. The provision of more comprehensive income data on the self-employed toDSFA by Revenue would add significantly to the overall income holdings on the CRS.
The DSFA data strategy, the Reach initiative and the modernisation of the GRO will drive thecleaning process of the CRS. As PENLIVE and ISTS schemes are migrated to the SDM, adetailed investigation of the data will take place and it is hoped that this will lead to animprovement in the overall quality of the data available. The ability to link with the GROshould aid the process of the identification of redundant records. The GRO link should intime also be able to provide a mechanism for updating marital status of individuals.
6.3 The Service Delivery Model
The Service Delivery Model (SDM) is a relational database system that will ultimately beused to process all schemes operated by the department. To-date, only the Child Benefitscheme (CB/SDM) has been completely migrated onto the new system. The system holds
87
all key demographic data such as first names, surnames, addresses, sex, date of birth, dateof marriage, marital status, spouses’ names, mothers birth surname, nationality and phonenumbers. In addition, it holds other useful information including a school identity number for16-19 year olds and comprehensive relationship data on all clients covering spouse, parent /child and sibling relationships. The system also holds a variable that identifies why aparticular payment was stopped or extended e.g. child is in full-time education, medicalcertification, child has left the State, child has left household, child is in care, child has died,child has left school.
An important point to note about the SDM system, however, is that it primarily holds datanecessary to process payments. While this generally covers all demographic data there areadditional questions asked on all the various Social Welfare claim forms that are notcaptured in the SDM system. This is a common feature and a key weakness, from astatistical point of view of the Social Welfare systems generally. In the case of child benefit,the following is asked on all CB forms and not captured: previous address if moved recently,details of benefits received from other countries (country, name of payment, date ofpayment), employment details from work abroad (social security number, country, date lastworked), immigration details if arrived from abroad (date arrived, address abroad, nationality,spouse’s nationality), spouse’s details (address if different, claim details, work abroaddetails), name and date of birth of children in hospital/home, the course, school and studentidentification data for children age 16-19.
6.3.1 Statistical quality assessment and statistical potential
The Child Benefit payment is unique in that there are no PRSI conditions and a claimantdoes not have to satisfy a means test in order to qualify. This would indicate that fullcoverage of all children should be expected. Current application procedures and checkingsystems are believed to be strict enough that duplicates are not thought to be a problem.Child Benefit is paid to a qualified person in respect of a qualified child, so essentially thechild must be ordinarily resident in the State and the child must be normally resident with theperson, usually the mother, for the person to qualify. Asylum Seekers, Work Permit holdersor Non-EU or Non-EEA citizens must have documentation to establish their right to reside inthe State, an asylum seeker card, work permit or certificate of registration from the GNIB(Garda National Immigration Bureau). Once the residency position has been confirmedthese claims are dealt with in the same manner as all other claims and remain in payment aslong as the child is qualified. In order to apply for a new-born child, the birth must beregistered, and a birth certificate must accompany the application. At present a new PPSNumber is assigned upon application for Child Benefit but the new GRO link will replace this.
The ability to identify the family unit (relationships) is particularly useful from a statisticalperspective. Like many other DSFA schemes, the household unit may only be identified if‘other usual residents’ are captured on the claim forms. While the capture of these additionalhousehold members may not be required for administrative purposes, their capture for socialstatistical purposes would be extremely beneficial. That said, it is acknowledged that theidentification of the complete household may be very difficult to achieve and perhaps is notfeasible in an administrative data holding environment.
6.4 Integrated Short Term Schemes (ISTS)
The ISTS system provides for the operation and administration of the DSFA short-termschemes. ISTS was the first system to be developed by the department on an integratedbasis and replaced a number of systems that had been operating independently of oneanother.
88
ISTS, a legacy system, has been in operation since 1994 and holds information on claimantsof Unemployment Benefit and Assistance, Disability Benefit (DB), Supplementary WelfareAllowance (SWA), Maternity Payments, Occupational Injury Benefit (OIB), Pre-RetirementAllowance (PRETA) and payments under the Back to Work, Enterprise and Educationschemes.
There are three scheme types within ISTS. ISTS SWA relates to SWAs which cater forpersons ineligible for other DSFA schemes (or pending these payments) or those in need ofemergency payments and is administered by Community Welfare Offices. ISTSUnemployment covers Back to Work, Enterprise and Education, UA, UB and PRETA (CSOreceives aggregated data for the number of claimants for these schemes at Local SocialWelfare Office level for use in compilation of the Live Register). ISTS Disability coversschemes operated for cases of temporary illness or disability, including those caused as aresult of accidents at work and maternity benefit. The ISTS files are the same for all threescheme types however certain variables have access restrictions according to type ofscheme. A different front end faces operators of the three different scheme types. Animportant distinction within the system is between open and closed claims.
The PPS Number is the unique identifier on the ISTS file and allows relevant ClientIdentification data updates to CRS (name and address, date of birth, marital status). Thesocio-demographic client data on ISTS is of a high quality given the links to CRS via thePPS Number.
As is the case with PENLIVE, in assessing the ISTS data holdings it is important to draw adistinction between what is collected (i.e. on the claim forms) and what is captured (i.e. whatgets input to the ISTS system from the claim form).
6.4.1 Statistical quality assessment
Good quality socio-demographic client data are available on the ISTS system. There is aconsiderable level of useful socio-demographic information captured on the system which isnot captured on PENLIVE (nationality, breakdown of means, incapacity codes, claimcategory and occupation codes).
Given the short-term nature of the schemes, in general ISTS gives poor coverage of thevarious population groups. There are no reference populations for comparison with ISTSSWA and ISTS Disability (excluding maternity benefit).
6.4.2 Statistical potential
The incomplete transfer of useful data from paper to system is common throughout the ISTSschemes and represents a significant loss of information to the department that may not onlybe useful within the department but to society as a whole. This is not a problem in relation tothe clients’ personal details as these should be available on the CRS. However, there areother relevant variables that should be examined. For example, all educational attainments(second and third level courses) are collected on the claim form for the Back to EducationProgramme. However, this information is not captured by ISTS. Also, ISTS SWA schemescollect data specific to the nature of the scheme which is not captured but would be ofinterest (e.g. weekly costs of childcare and registration details of childcare facilities arecollected for the Creche Supplement scheme). In assessing the usefulness of such data itshould be stressed that the coverage of various schemes may only relate to restrictedgroups.
ISTS and its links to CB/SDM through CRS enables the identification of the family unit andallows the derivation of relationships between family members. Like CB/SDM the
89
identification of the household is not possible. Additionally, it is important to note that thesystem caters for the capture of data on non-dependants (which would aid the identificationof the household) but there is no guarantee that this data is collected on all claims.
6.5 PENLIVE
PENLIVE is used to manage schemes relating to pensions, lone parents, free travel,household benefit packages, invalidity, certain allowances (Carers, Disability) and otherlong-term claims paid via a book system. It is an old legacy system with data dispersed over11 to 12 separate files. However, these files can be linked using one of three uniqueidentifiers used in the system. These identifiers are PPS No, client/pension number andclaim number. The PPS Number is only available on claims post 1994 and as the systemwas developed in the 1980s, the PPS Number is not the main identifier on the system.However, almost 95% of all ‘live/relevant’ claims now have the PPS Number attached to therelevant record.
Administrative data are normally collected with the operation of the organisation in mindrather than with a view towards statistical analysis. This is especially true of the PENLIVEsystem which is effectively a payments driven system. In assessing the PENLIVE holdings itis important to draw a distinction between what is collected (i.e. on the paper claim forms)and what is captured (i.e. what gets input to the PENLIVE system from the claim form). Ingeneral, the only data captured is that which is required to drive a payment.
6.5.1 Statistical quality assessment
The socio-demographic client data on PENLIVE is of a high quality. In particular, details ofname and address, date of birth, marital status/date of marriage and date of death areaccurate. These fields are updated to CRS for confirmed PPS Numbers. PENLIVE holds along time series of data, as records are not systematically erased from the system.
There is a limited amount of client data held on the system with details of dependants onlyadded in the 1990s. Compared to ISTS/SDM, there is a considerable level of usefulinformation not captured on the system (nationality, breakdown of means, incapacity codes,position prior/claim category and occupation codes).
While it is possible to identify claimants with a disability via the scheme code, there is little orno information on the disability. Furthermore, in relation to claimants with a disability, andspecifically those claiming through the Disability Allowance, the fact that this scheme ismeans tested does have an impact on the possible usefulness of the data due to theassociated coverage issue.
A fundamental aspect that needs to be addressed within PENLIVE is the inability to identifythe date a claim stopped (not recorded), which makes searches and register matchesdifficult. Client data for stopped claims may be of low value, depending on the date the claimstopped. The group with no PPS Number is getting smaller so this is less of an issue withthe passing years.
6.5.2 Statistical Potential
The incomplete transfer of data from paper to system is common throughout the PENLIVEschemes and represents a significant loss of information that may not only be useful withinthe department but to society as a whole. This is not a problem in relation to the clientspersonal details as these should be available on the CRS. However, there are other relevantvariables that should be examined. These include residence in the state, non-dependentspouse and child details. Significant value-added could accrue were this data to be captured
90
especially given the existence of the PPS Number and the possible links to data sourcessuch as EU-SILC.
The ability to identify the family unit is a key analysis variable in terms of social statisticsanalysis. Currently it is not possible to identify family units directly within PENLIVE as onlydata on dependants (whether adults or children) is actually captured on the system andthere are no relationship codes. The collection of data relating to the spouse/partner andchildren, regardless of whether deemed dependants or not, should be given seriousconsideration. In particular, consideration should be given to the collection and capture of allthe socio-demographic data plus the PPS Number of the spouse/partner and children.
6.6 Review of DSFA claim forms
During the first contact with prospective customers a detailed claim/application form iscompleted. This varies by scheme, covering a broad range of issues including clientpersonal details, employment related information and information relevant to the calculationof an individuals means (where required).
DSFA claim forms have a similar look and feel. There are variables that appear on themajority of the claim forms, however, these are sometimes asked in different ways orsometimes a related but different question is asked. For example, on the DisabilityAllowance claim form the applicant is asked for his/her “Nationality”. However, on the BlindPerson’s claim form, the applicant is asked - “What country were you born in?”
From a statistical perspective one could argue that a standard set of questions, regardless ofthe scheme, should be considered for the client and spouse, where appropriate. Thecollection of demographic details for the remaining household members, includingrelationship codes, would also allow the identification of the family unit and household.However, it has already been acknowledged that the achievement of the latter may not bepossible in an administrative data holding environment.
6.7 Classifications and coding practices
The classifications for any given variable are not standard/common across the systems,however they are within the systems (SDM/ISTS/PENLIVE ). A notable exception relates tothe One Parent Family Payment claim form where an additional category is used to identify aclaimant whose spouse/partner is a prisoner. While the need to identify this group is clear, itis important to retain the distinction between classifications and questions. Effectively themarital status of a claimant in this situation is “married”. A subsequent clarification of thismarital status should be addressed through an additional question and not through a changein the classification.
A decision to adopt a standard set of classifications to be used by all data collectingagencies (public and private) should be taken as this is a key issue in relation to thesuccessful analysis of data (micro and macro). The classifications to be used for the mainsocio-demographic variables should be those used by the CSO.
ISTS codes sex as M-male and W-female while SDM codes sex as M-male, F-female, andU-undetermined. PENLIVE uses just two categories M-male and F-female. The countydetails within addresses are not coded in ISTS/SDM but during the up-load procedure toCRS a code is assigned. In general, occupation coding by the DSFA does not follow anycurrent internationally recognised classification (e.g. Standard Occupational Classification).
91
The classifications and coding practices applied to the data held within the CRS are in effectinherited from the source data holding (ISTS, PENLIVE, SDM, Revenue, etc.). As such, thestandardisation in classifications and coding practices across all systems both within DSFAand outside, will eventually be reflected within the CRS.
As the schemes in ISTS/PENLIVE move over to SDM, the opportunity to standardise theclassifications should be taken. The classifications to be used for the main socio-demographic variables should be those employed by the CSO.
Within ISTS Disability (which covers Disability Benefit, OIB, Maternity Benefit) there is acomprehensive incapacity classification used which provides details on the type ofillness/disability being endured by the claimant. If this was extended to all illness/disabilityrelated schemes, it could add significant value to the DSFA data holdings on these relatedtopics.
6.8 Cross cutting aspects
6.8.1 CRS
The CRS has the potential to act as a hub allowing the merging and matching of data(administrative and statistical) from different sources through the use of the PPS Number,subject to data protection legislation.
Legislation enacted in 2002 provides for the development of a PSI database as part of thePublic Services Broker, under the Reach Initiative. It will contain a limited set of keydemographic variables and is being developed to assist government agencies in theauthentication of identity as well as providing some additional services e.g. find a PPSNumber, find a customer for a PPS Number etc. The PSI data consists of: surname,forename, date of birth, place of birth, sex, mother’s birth surname, birth surname, address,nationality, date of death, and in the case of a person who is under 18 years, mother’s PSIand father’s PSI. The initial strategy is to provide a copy of this data from the CRS, whichholds all the required data with the exception of place of birth.
Part of the role of the Client Identity Services of CRS is to assist other organisations in theuse of the PPS Number. Many agencies have adopted the PPS Number, mainly by directlyrequesting the PPS Number from their customers. Projects were undertaken to supply PPSNumbers to the Education post primary database and the General Medical Services(Payments) Board in respect of medical card holders.
In addition, the PPS Number is now used by the following bodies: Central Statistics Office,Revenue, the Department of Education and Science, the Department of the Environment,Heritage and Local Government, some Local Authorities, the Irish Cervical Screening andBreast-Check Programmes, the Government Special Savings Incentive Scheme, theDepartment of Health Immunisation Programmes, the General Register Office, the GeneralMedical Services (Payments) Board, the Medical Card and Drugs Payment Schemes andthe Department of Agriculture and Food.
6.8.2 SDM
Maintaining accurate data on an individual from birth to death has significant statisticalopportunities in terms of capturing socio-demographic information in conjunction with aunique identifier. The CB/SDM provides the information based on the first point of contactwith an individual and starts that process of information gathering at the micro level. The useof the PPS Number as the identifier allows analysis of data from a myriad of administrative

92
and statistical sources. Examples of the type of analysis that could be achieved include thelink between education and earnings, indicators of early mortality (education, income, etc.),impact of family situation on life events etc.
6.8.3 ISTS
ISTS holds data on some of the key social groups where there is currently a considerablelack of information e.g. low-income families, homeless, asylum seekers. The claim categorycode used for Supplementary Welfare Allowances enable the identification of these groupsalthough it is important to keep in mind the qualification rules for any given scheme. WithinISTS, it is possible to undertake analysis of these groups given the broad range of socio-demographic data available. The income related data collected for means purposes can alsoprovide some interesting analysis.
The DJELR have indicated a need for Unemployment Assistance and Benefits data to bebroken down by nationals and non-nationals. Nationality of applicants for ISTSUnemployment and ISTS SWA schemes are collected but not captured in all cases. This is aproblem but the data required to meet this demand does reside within the department.
6.8.4 PENLIVE
PENLIVE holds data on some of the key social groups where there is currently aconsiderable lack of information e.g. one parent families, carers, the disabled and theelderly. The scheme codes used within PENLIVE allow for the identification of these groupsalthough it is important to keep in mind the qualification rules for any given scheme. WithinPENLIVE itself, it is possible to undertake analysis of these groups given the broad range ofsocio-demographic data available, and the income related data collected for meanspurposes can also provide some interesting analysis.
The EU has agreed a set of 18 common indicators (Laeken indicators) covering four aspectsof social inclusion: financial poverty, employment, health and education. The QNHS and EU-SILC combined provide the source data for 17 of these 18 indicators. The main challenge,facing all involved in the provision of this data is how it can be disaggregated to providethese indicators at the level of the different marginalised/vulnerable sub-groups. It isconceivable that the combination of administrative data and the CSO household surveyscould provide us with an opportunity to derive these indicators for these sub-groups.
The QNHS, while concentrating primarily on labour market issues, also covers educationrelated issues in a comprehensive manner. Changes to the survey in 2002 and furtherchanges planned for the latter part of 2003 will provide a wealth of information on this topic.Again combining this data with the PENLIVE data holdings could provide some usefulinsights into the groups mentioned above.
6.8.5 General
There are significant value added opportunities to be exploited by linking PENLIVE/ISTSholdings with the QNHS and/or EU-SILC via the PPS Number. The labour market datacollected through the QNHS (note the PPS Number is not yet collected in the QNHS)combined with the poverty/deprivation data collected through EU-SILC, could allow asignificant level of analysis at the micro level and subsequently the macro/aggregate level(obviously dependent on achieving an adequate sample).
One of the advantages that an accurate and up to date CRS file would provide is the abilityfor the CSO to review how samples are stratified and selected for the main household
93
surveys. This could allow for more targeted sampling of specific groups and thus theprovision of valuable information that heretofore has not been available from these sources.
The ability to identify the disabled from DSFA data has been raised by a number of differentorganisations. This study indicates that the disabled population would be difficult to identifybased on DSFA data holdings alone. In effect, the disabled are covered in a number ofdifferent DSFA schemes including Occupational Injury Benefit, Disability Benefit, (both short-term), Disablement Benefit, Disability Allowance and Invalidity Pension. A disabled personcan move between these schemes depending on the duration of the disability, theemployment status of the individual and their contribution records. Add to that the fact that anumber of the schemes are means tested, it is difficult to assess the coverage of thedisabled population within DSFA data holdings.
There are plans to investigate the feasibility of identifying those with disabilities within theQNHS. The need for the identification of the disabled is well documented and if the inclusionof a categorical question on this topic is successful within the QNHS then data on the ILOstatus, PES status, education levels, etc. of individuals identifying that they have a disabilitywill be possible. Using the QNHS as a benchmark figure could add significant value toadministrative data holdings on the disabled.
The Health and Safety Authority have expressed a strong interest in obtaining data onaccidents in the work place. Injury benefit, one the benefits available under the OccupationalInjuries Benefits scheme covers short-term (up to 26 weeks) payments made to personsunable to work due to an accident in the workplace or illness contracted due to the type ofwork the person performs. Data on the numbers of claimants and their disability, at a point intime and flows on and off the scheme, should be readily available from the ISTS file. Thenature of the disability/incapacity is collected and coded in the system.
It should be noted that Injury Benefit is a short-term scheme. If the disability persists theperson would become entitled to Disablement Benefit which is not recorded under ISTS(Disablement Benefit data is held on a separate system but the type of data held is of little orno use from a statistical perspective). Also, the schemes are restricted to certain insuranceclasses and also to a prescribed list of occupational illnesses.
6.9 Overall conclusions and recommendations
The DSFA are well advanced in the development of a technical infrastructure that will enablethe exploitation of their existing data holdings. The task now facing the Department (incommon with other departments) is to develop their data holdings in such a way that willallow meaningful analysis to better inform social policy.
The emphasis of the study has been to highlight the statistical potential of existingadministrative data holdings with a view to the development of social statistics. This can onlybe achieved through the full exploitation of all government data holdings and in many casesthe linking of multiple data sources spread across numerous government departments.
During this study, it was difficult to get an in-depth statistical analysis of the data holdings.Realistically, the achievement of this would require much more time and access to the dataholdings themselves. In certain circumstances the presence of a variable does notautomatically infer that the variable is useful from a statistical perspective as one would needto be able to analyse the quality of the coding applied to the variable e.g. nationality. Thisstudy did not allow for analysis of this type.
In terms of the DSFA, we have identified a number of conclusions and recommendationsthat will contribute to the achievement of the overall strategy:
94
(i) Priority should be given to the cleaning of the CRS;
(ii) Geographic coding of data on the basis of the Ordnance Survey GeoDirectory shouldbe considered;
(iii) The identification of the household unit and the relationships within the household areimportant analysis variables from a social policy perspective. In reality it is verydifficult to see how these variables could form part of administrative data sets in theshort to medium term. Even as a long-term objective it may be considered ambitious;
(iv) A standardised core set of socio-demographic questions (covering details such asaddress information, sex, date of birth, marital status and nationality) should be askedon the claim forms for all schemes the first time the PPS Number is captured on thesystem. Thereafter, those details subject to change, e.g. marital status, need only beupdated;
(v) An additional set of variables that would be of considerable interest from a socialperspective, should be considered for inclusion on all claim forms (where appropriate).These include usual place (country) of residence, occupation, Principal EconomicStatus (PES), living alone indicator, and a standard set of means related questions;
(vi) The identification of vulnerable groups is a corner-stone in terms of the development ofsocial statistics. To meet this objective, consideration should be given to the inclusionof categorical type questions that would identify ethnic groups and those with adisability;
(vii) Specifically in relation to disability, consideration should be given to the extended useof the incapacity classification (where feasible and appropriate) currently used withinISTS to all schemes capturing any illness/disability type data;
(viii) Coverage is a difficult issue to address given that many schemes are means tested.This effectively creates an administrative population as distinct from an actualpopulation;
(ix) Use of agreed standard classifications should be applied across all systems andschemes; and
(x) Electronic capture of all data that is collected on the paper forms.

95
Chapter 7 Office of the Revenue
Commissioners
96
7.1 Introduction
The Office of the Revenue Commissioners (Revenue) administers the State’s tax system. Itsactivities mean that the Office interacts with almost every citizen and business in the State.As a result, the administrative data it collects is a very extensive and useful source ofstatistical information.
The SGSES report identified several data items within Revenue’s administrative systemsthat might provide useful additional social statistics. The remit of the SPAR team was toexamine these in more detail and to assess their statistical potential. While the primary focusof the exercise was on social statistics, the SPAR team was also asked, if possible, to lookat other data holdings to assess their usefulness for statistics. In the event, the limited timeavailable meant that this was not possible and this study is largely confined to those datasources identified in the SGSES report as being of social interest. However, Revenue’s dataholdings primarily contain financial and business information and it is expected that theirprimary usefulness will be in the area of economic statistics. It is intended that this aspectwill be examined later in more detail in an additional study, which will examine the potentialof administrative records for economic and environmental statistics. This report thereforeonly covers this issue in a cursory manner.
A total of 22 separate sources were identified in the SGSES report. The majority of thesewere derived from the income tax system which covers both PAYE and self-employed. Aftermeeting with officials from Revenue, the SPAR team agreed that for the social statisticsstudy only two main data systems required in-depth analysis. These were the income taxand the capital tax systems. The information collected and the conclusions of the SPARteam are reported in this chapter. For completeness, the other data holdings mentioned inthe SGSES report are also described.
7.2 Income Tax system
The Income Tax system comprises individuals who are in receipt of income in their capacityas employees, as self-employed or as investors. The method of collecting and assessingtaxes payable depends on the employment status of the taxable person.
In the case of employees, income tax is assessed and collected through a combination ofPAYE and on-line review (OLR). The operation of the PAYE system is enabled primarilythrough the compliance of employers. An on-line review is undertaken on a more ad hocbasis and may be carried out by Revenue on its own initiative or at the request of thetaxpayer.
Income tax of self-employed persons and investors is generally collected on an annual basisthrough a self-assessment system. This is a compulsory system, and stiff penalties andinterest payments are levied for non-compliance.
Up until 2001, the income tax year differed from the calendar year, but the two have beenaligned since January 2002. However, self-employed persons are still allowed to choose anaccounting year that differs from the calendar year. This limits comparisons betweenincomes of self-employed persons and those on PAYE.
A more detailed description of the income tax data sources follows.

97
7.2.1 PAYE file
Under the PAYE system, employees have income tax deducted directly from their wages.The employer, on the basis of instructions issued by Revenue, calculates the income taxpayable by each employee. The amounts vary and are dependent on entitlements toallowances, tax credits, tax rates and tax bands. These are generally determined by anindividual’s marital status.
The employer is also obliged to deduct a Pay Related Social Insurance (PRSI) contributionfrom the employee’s gross wages. The employer also pays an additional top-up PRSIcontribution in respect of each employee. The rules for calculating PRSI are complex andthe contribution depends on a number of variables including the type of employment and thelevel of wages. Most employees are covered by Class A1 which entitles them to access anumber of schemes under the Social Welfare Acts, including unemployment, disability andmaternity benefits and old age and widow/widower pensions. These schemes were coveredin Chapter 6. In administering contributions under these schemes, employers and Revenueact as agents for the DSFA.
An employer remits PAYE and PRSI deductions to the tax office every month. Theremittance is supported by a statement (Form P30), which indicates the total amount ofPAYE and PRSI deducted in the month. This information is provided only at an aggregatedlevel and it is not possible to determine the amount paid per individual employee.
However, an employer is also obliged to submit a Form P35 within six weeks of the end ofthe tax year together with any balancing PAYE or PRSI payment that may be due in order tobalance with the twelve monthly P30 forms. Form P35 provides detailed information on eachindividual employee, including:
♦ PPS Number;
♦ Total pay earned in respect of the employment;
♦ Total PAYE deducted (or refunded);
♦ Employee’s share of PRSI;
♦ Total PRSI deducted (includes employer’s and employee’s share);
♦ PRSI class and number of weeks in insurable employment; and
♦ Where an individual commences or leaves the employment during the particularIncome Tax year, these dates are also provided.
If an employee’s PPS Number is not known, the employer must provide details of theemployee’s date of birth and mother’s maiden name in order that a number can be suppliedto the employee subsequently. This number is generated by Client Identity Services sectionof the DSFA (see Chapter 6).
The form P35 is an important document, as it is needed to determine an individual’s taxcredits and social welfare entitlements. It is understood that there is excellent coverage, withdefaulting employers (less than 4%) being pursued rigorously.
98
An employer is also obliged to issue a form P45 when an employee ceases work. This formis in multiple parts and contains similar information to that contained on the P35. The P45 isused by Revenue to update the PAYE file with the employment cessation date of theparticular employee. If the employee gets another job, the same form P45 is used to recordthe commencement date of the new job. This information is primarily used for tax and socialwelfare administration purposes, but a by-product of the P45 system is the ability to generatestatistics of the numbers of persons entering or leaving an employment. These inflows andoutflows have been analysed quarterly for a number of years. When the Labour ForceSurvey was undertaken annually, they were used as short-term indications of trends inemployment between survey dates. The Quarterly National Household Survey now providessuch information.
7.2.2 On-Line Review file
In addition to the P35 return made by employers, taxpayers can also complete and submitan annual tax return (Form 12), which includes details of all sources of income and of theclaims for allowances or deductions to which they may be entitled. Nowadays, someallowances are deducted at source while many others can be obtained without completing afull tax return. The allowances and credits that taxpayers can claim include:
♦ A blind person’s credit, including a credit for having a guide dog;
♦ Age allowance, once taxpayer reaches 65 years of age;
♦ Incapacitated child credit, where the taxpayer looks after a dependent child;
♦ Dependent relative credit, where the taxpayer looks after an elderly or infirmperson or a widowed parent;
♦ Home carer’s credit to a spouse who works at home to care for children, an agedperson or incapacitated person;
♦ An allowance for employing a person to take care of an incapacitated individual;
♦ Medical expenses incurred over a specified threshold;
♦ Medical Insurance premiums (relief is granted at source from 6 April 2001);
♦ Mortgage interest relief (relief is granted at source from 1 January 2002);
♦ Premiums paid on long-term care insurance policies which have been taken outto provide for future care;
♦ Needs of certain individuals (relief is granted at source);
♦ Rents paid by tenants; Persons aged over 55 years can claim double the reliefallowed to under 55 year olds; and
♦ Fees paid to third level colleges and for approved training courses.
Revenue has for many years moved away from requiring each PAYE taxpayer to submit anannual tax return. Such returns are now principally submitted by taxpayers, who are seekingreviews or who are specifically requested to do so by the tax inspector. Revenue issueseach year approximately 100,000 to 120,000 Tax Return Forms (Forms 12) to selected

99
PAYE cases. These are targeted on the basis of their income levels, income sources or thereliefs they claim. Claims for tax credits and tax reliefs, etc. can also be processed over thetelephone, in public offices or by correspondence (including email), and no longer need to besupported with a tax return form. However, the PAYE data sets are automatically updatedwith all information obtained in such contacts.
The assessment and recording of incomes and taxes in the case of single individuals isstraightforward. The arrangements in the case of married persons are more complex. Underthe income tax system, married couples can choose to be jointly assessed, separatelyassessed or singly assessed. In the case of joint assessment, only one return of income isrequired which contains details of the respective incomes of both spouses together with anyclaims for allowances and credit
7.2.3 Direct Assessing (Self-assessment) file
The Taxes Acts require that individuals who are in receipt of self employed incomes orinvestment incomes are obliged to submit a completed return of income (Form 11) eachyear, from which their liability to both income tax and PRSI is assessed. This is known as theSelf-Assessment system. Directors owning more than 15% of equity in a company(proprietary directors) are also covered by this system. There are strict deadlines andreporting requirements and failure to comply carries interest and surcharge penalties.
Self-assessment was introduced in the Tax year 1988/89 and has therefore been operatingfor almost 15 years. The taxpayer makes an interim payment of income tax, referred to asPreliminary Tax, followed by a payment of any outstanding liability after the submission ofthe income tax return.
The tax return provided by the self-employed is more detailed than that completed byemployees and provides for a further breakdown of the types of income. The returns will alsohave copies of accounts for the business annexed to them. However, details of the claimsfor personal allowances and tax credits are identical to those on the PAYE form.
7.2.4 All Persons file
Revenue has a Forecasting and Statistics Branch that analyses the income tax returns andpublishes results in the annual Statistical Report of the Revenue Commissioners. Tofacilitate their analyses, the Branch combines the data collected on the P35, the On-LineReview and the direct assessing systems to produce an ‘All Persons file’. Duplicates areremoved from the P35 file where similar details have been separately captured in the on-linereview and directly assessing data sets. The ‘All Persons file’ captures virtually all the basicinformation that is collected as part of the income tax system. The SPAR team thereforedecided that it was this combined file that would be examined and assessed for quality.
7.2.5 Statistical quality assessment
Scope of income variables
The scope of the income variables on the income tax system is restricted to thosecomponents covered by the Taxes Acts. It is therefore not an exhaustive list of income fromall sources. In particular, gross income as defined for tax purposes does not include, or onlypartially includes, the following items:
♦ Social welfare assistance payments, maternity and child benefits and paymentsfrom non-contributory schemes - gross income does, however, include social

100
welfare payments made under contributory schemes such as unemploymentbenefit and contributory pension schemes;
♦ Interest received which has been subject to deposit interest retention tax (DIRT)or interest which has been paid by An Post from their Instalment SavingsSchemes;
♦ Tax exempt incomes such as stallion fees, earnings of writers, composers andartists and profits from commercial forestry;
♦ Statutory redundancy payments and certain lump sum payments made uponcessation of employment; and
♦ Employees’ superannuation contributions - income reported for tax is net of suchcontributions.
Population coverage
In terms of the numbers of taxable cases, the PAYE data set is virtually complete and has noduplication. There is a high level of compliance with about 96% coverage. This data set isupdated annually using information from the P35 returns made by employers. Almost 50% ofthese returns are made within three months of the end of the income tax year. The balanceis submitted within six months and outstanding returns are pursued rigorously. Data arearchived for many years.
The coverage of the self-employed direct assessing system is more uncertain. It is believedthat the detailed statistics are based on about 90% of all self-assessable taxpayers.
There is low coverage of incomes earned by persons from non-PAYE sources who are notsystematically or annually processed in the tax system because they have consistently lowindividual incomes. Such cases are not routinely assessed to income tax and the incomeupdates are captured only when the inspector of taxes intermittently requests the completionof a self-assessment tax return. If that return is judged appropriate to go through the formaltax assessment process, even if the ultimate outcome is a zero tax bill, the incomeparticulars will be captured on computer record. While required under the Taxes Acts, theseforms are not formally pursued unless the inspector wishes to investigate a particulartaxpayer.
Completeness of records
All the information reported by employers and employees is recorded comprehensively andaccurately on the data files. However, some information in the income tax system may bedated or incomplete. As explained earlier, some PAYE taxpayers do not submit an annualincome tax return and the personal details of these taxpayers and information on allowancesand claims may not always be up to date.
In the PAYE system, some non-PAYE incomes may not be recorded gross. When PAYEtaxpayers have non-PAYE incomes, Revenue sometimes collects the taxes due on theseincomes by reducing tax credits and increasing the PAYE income tax contributions. Theseadditional sources of income are therefore not captured gross in the system unless thetaxpayer also submits an income tax return that is processed by the tax inspector using theOn-Line Review system. It is not possible to quantify the amounts of income thus excludedbut it is unlikely to be significant because the additional incomes need to be low in order tobe collected through the PAYE system.

101
Certain key social variables, such as age or date of birth, are not included on the tax files.These are of no direct interest for tax assessment and are therefore not captured orrecorded in the tax system. There is also a difficulty with the identification of gender, in thecase of jointly assessed married couples. When both spouses earn, either spouse maycomplete the income tax form and include details relating to ‘Self’ and ‘Spouse’ rather than‘husband’ and ‘wife’. This means that it is not possible to identify from the tax statistics files,which of the spouses’ incomes belong to the wife and the husband.
Income details can also relate to different time periods. As mentioned earlier, self-employedpersons are allowed to report their trading profit for an accounting year, which often differsfrom the calendar year. This, therefore, provides limitations when making comparisonsbetween incomes earned by self-employed persons and employees, whose incomes arereported on a calendar year basis.
The Inflow and Outflow statistics mentioned above, and referred to in the SGSES report,have also sometimes been found to be weak indicators of short-term movements in and outof the work force. There are a number of reasons for this, including the fact that the correctdate of commencement or cessation may not be entered onto the system until the annualform P35 has been processed. This can be up to six months after the end of the income taxyear.
7.3 Particulars Delivered (PD) Form – ST 21
A completed form ST 21 (Particulars Delivered) must be submitted to a Stamp Duty Office inrespect of:
♦ All documents giving effect to the transfer of any building and land or anyinterest in such property;
♦ The grant of any lease for a term exceeding 30 years; and
♦ The assignment of a lease where the remaining term exceeds 30 years.
A Particulars Delivered stamp must be impressed on the document. This requirementapplies even where no stamp duty is payable. There are, however, two exceptions:
♦ Any transaction creating a joint tenancy between spouses to which Section 14 ofthe Family Home Protection Act, 1976 relates; and
♦ A conveyance, transfer or lease by or to a housing authority to which Section 8of the Housing (Miscellaneous Provisions) Act, 1992 relates.
Form ST 21 collects information on the property transferred or leased and of the parties tothe transaction. The details provided include name, address and tax reference number of thetransferor (or lessor) and of the transferee (or lessee). The PPS Number is required forindividuals and the Corporation Tax number is used for companies. The form also providesthe address (including townland for rural cases) of the property and the folio number, whereavailable. The type of property transferred is broken down into the following categories:
♦ Private house/apartment (with a separate tick box to identify new properties);
102
♦ Agricultural land (separate tick box to indicate if dwelling is included);
♦ Non-agricultural land;
♦ Commercial/industrial premises; and
♦ Other property.
For the last two categories, a further brief description of the type of property must beprovided in writing.
If the property being transferred exceeds one acre, the land area must also be specified. Inthe case of a sale or the assignment of a lease, the full amount paid is reported on the form.In the case of a lease, information is provided on both the annual rent and the premium paid,if any. There is also a separate identifier to indicate if the property has been transferred atless than open market value.
Statistical quality assessment
This is a good comprehensive source of information on transfers of real property becausethe documents need to be stamped for legal purposes. Almost 130,000 returns weresubmitted last year. Data from 2001 to January 2003 have been electronically captured andthe transfer of these data into the Ingres-based Stamp Duty Administration System (SDAS)is in the process of being tested. All information provided on the ST21 form is captured eitherby SDAS when a deed of transaction is presented for stamping or by separate data input ofthe ST 21 forms. The linkup between the ST 21 data and SDAS is facilitated by a commonidentification number originally generated in SDAS. There is no coding of variables orstandardisation of formats of names and addresses.
7.4 Gift/Inheritance Tax Self-Assessment return (IT38)
A beneficiary of a gift or inheritance is obliged to submit a return within four months of thevaluation date where the aggregate value of all taxable gifts and inheritances exceeds 80%of a group threshold. For the purpose of Capital Acquisitions Tax (CAT), otherwise known asGift and Inheritance Tax, the relationship between the person who provided the gift orinheritance (the disponer) and the person who received the gift or inheritance (thebeneficiary), determines the group threshold. The three group thresholds operating in 2003were as follows:
Table 7.1 Gift/Inheritance tax thresholds
Group Relationship to the disponer Threshold in 2003
I Son or daughter or child of deceased son ordaughter. Also includes parents who take aninheritance from a deceased son or daughter.
€441,198
II Lineal descendant, ancestor or brother, sister, niece,nephew or child of a brother or sister of the disponer.
€44,120
III Anyone not qualifying for group I or II. €22,060
103
Form IT38 collects information on both the disponer and the beneficiary. Details collectedinclude the PPS Number of both parties, name and address, country of domicile, relationshipto the disponer, the value of the property being disposed with business assets andagricultural assets identified separately.
Beneficiaries can claim exemptions and reliefs. For example, the first €3,000 taken as a giftin any one year from a disponer is exempt. Spouses are not liable to CAT regardless of thelevel of the benefit. There is also no liability to tax when inheriting a dwelling house where ithas been the main or only residence of the recipient for a period of three years and remainsso for a further six years. Other exemptions and reliefs apply when a beneficiary inheritsagricultural property and certain business assets.
Statistical quality assessment
The information captured is of good quality and is complete in respect of its targetpopulation. However, the high threshold and various reliefs and exemptions applying meanthat coverage is limited.
7.5 Inland Revenue Affidavit form CA24 and CA4
Inland Revenue Affidavit form CA24
The form CA24 is completed by the executor of a will in order that grant of Probate can betaken out. The procedure is to complete the affidavit providing a schedule of assets of theestate, excluding assets passing on joint survivorship (e.g. joint ownership by spouses), andlisting the names of the beneficiaries under the will. The affidavit is sworn in at the grant ofprobate office. The form is then certified and passed to Capital Taxes branch, whichassesses any inheritance tax liability on the assets of the estate. If a liability arises, thebeneficiaries are obliged to submit their calculations and payment of inheritance taxes withinfour months.
The only data that is currently being captured electronically in capital taxes branch is thegross and net value of the estate's assets.
Form CA4
This form is completed by anyone entitled to benefit from a financial account held in eitherjoint names with a deceased person or in the sole name of the deceased person, where it isagreed that either an original or amended form CA24 affidavit is not required. Once Revenueis happy that no liability to inheritance tax arises, a certificate is issued to enable the financialinstitution to release the funds to the beneficiary.
Statistical quality assessment
Form CA24 captures only a portion of the value of assets passing on death because it doesnot cover assets passing on joint survivorship.
Data from the form CA4 is not recorded electronically. It is an administrative documentrequired for clearance purposes and applies in only a limited number of cases.
104
7.6 Data sources for economic statistics
The primary focus of the SPAR project was to analyse the usefulness for social statistics ofthe administrative data systems listed in the SGSES report. However, the terms of referencealso requested SPAR teams visiting Departments to investigate, as far as possible, otherdata sets that could also be a useful source of statistics.
It has long been realised that Revenue’s data holdings are an invaluable source ofinformation for the development of economic statistics. Indeed, there is a long history of co-operation between Revenue and the CSO in this area. Ireland was one of the first countriesin the world to compile National Accounts, based on information collected through the taxsystem. Much of this information, including data from the Corporation and Income Taxsystems, continues to be used today. Another traditional source of economic statistics is theimport and export customs declarations, which are used to compile the State’s officialexternal trade statistics. Since the introduction of the Single Market and the simplification ofcustoms procedures for movements of goods between EU Member States, the VIMA branchof Revenue in Dundalk conducts the Intrastat survey for intra-EU trade and provides the datato the CSO for publication.
Nonetheless, it is recognised that other Revenue data holdings could also be better utilisedto produce economic statistics and possibly reduce the existing reporting burden onenterprises. The CSO has never used the PAYE system as a source of information onearnings for the National Accounts but is now planning to investigate this possibility. TheSPAR team is also aware that the CSO and the Revenue Commissioners are currentlydiscussing the possibility of using the PAYE system to update employment records on theCSO’s business register on a quarterly basis. This will significantly improve the quality andusefulness of the business register. It is intended that this new system will be implementedbefore the end of this year.
Another source whose potential usefulness is not being fully realised is the VAT system.Currently the CSO’s Business Register uses this system as a primary source for informationon the births of enterprises. However, in most EU Member States, the VAT system is alsoone of the main sources of statistics on the turnover of enterprises. In Ireland, theinformation on turnover in the VAT system is incomplete because there is a large zero-ratedsector. An additional difficulty is that some Traders’ Annual VAT 3 paper returns are scannedand held as images. The data are not captured as individual variables and cannot beautomatically processed for statistical analysis.
Because of the limited time available on this project, the SPAR team could not pursue theseissues. A more detailed analysis will therefore have to be undertaken later when the NSB’sinitiative on social statistics is extended to the economic and environmental statistics areas.
7.7 Statistical potential
Income Tax file
Much of the data available in the income tax system is already analysed in detail by theStatistics Branch of Revenue. However, this analysis primarily concentrates on those itemsof most interest in the administration of the tax system. The SPAR team concluded that, byutilising additional information that can be derived from the existing system, the presentanalyses could be extended to provide some additional useful information on the distributionof incomes and the structure of employment. However, it is recognised that these additionalanalyses cannot be produced easily and would require rewrites of existing IT systems.
105
Some key social demographic variables are not currently captured in the tax system and it istherefore not possible to use the Revenue Commissioners’ data sets to generate additionaldata such as an analysis of incomes classified by age. This would be possible if the PPSNumber were used to link the tax data to the CRS system in DSFA. Income could also beclassified by other key socio-economic variables identified on the CRS.
ST21 form
The usefulness of this information for social statistics appears limited. However, asdescribed above, the source is a good comprehensive source of information on transfers ofreal property and, if more extensively processed, it could well provide useful support materialfor economic statistics. In fact, the ST21 details are also supplied to the Valuation Office,which processes them and builds up a comprehensive profile of land transfers coded bygeographic region. This information is currently used by the CSO as the data source for itsquarterly publication on agricultural land sales.
Inheritance/Gift Tax
Given the high threshold and the existence of various reliefs and exemptions, it is unlikelythat this data set would provide useful social statistics.
Forms CA24 and CA4
Again, the incomplete coverage of both of these forms means they are of little interest forsocial statistics.
7.8 Conclusions
Income distribution statistics
Information on income levels is most useful when results are analysed by social anddemographic variables such as gender, age, regions and household compositions. However,the information collected in the tax system is essentially the core data needed to administerthe tax systems and such classifiers are often not available. It seems impractical to try toextend the tax reports to collect additional information. This would be expensive and difficultand might ultimately be unsuccessful. A better and more cost effective option would be toextract the required classification variables from elsewhere. The statistical potential ofRevenue’s income statistics would be greatly enhanced if linkages could be developed to theDSFA’s Central Records System (CRS). As described in Chapter 6, the CRS containsdemographic and socio-economic descriptors and these could be imported onto theRevenue records using the PPS Number that is common to the two files. Cross-departmental linkages like this are discussed further in Chapter 8 and may take some time todevelop.
In the meanwhile, it is worth considering whether the information provided in the existingIncome Distribution tables in Revenue’s Statistical Report could be enhanced based on theinformation currently available in the tax system. Despite its shortcomings, the income taxsystem is still the most comprehensive annual sources of information on incomes in theState and should be analysed to the greatest extent possible. The existing analysespublished by Revenue show the numbers of tax cases in different income bands, classifiedby type of taxpayer. Jointly assessed married couples with both spouses working arerecorded as a single tax case and the income shown is the combined income of the twopartners. Information in the basic tax system (but not in the combined data set used forexisting statistical analyses) may make it possible to separate out the gross income and sex
106
of the individual partners. If this information is not always currently available, Revenueshould consider the insertion of “husband” and “wife” labels on the Income Tax returns inorder to improve gender-based statistics. This would allow classification of individualincomes by gender and provide useful additional information on the relative incomes of menand women. It should be noted that such an analysis is only meaningful for pre-tax incomes.In the case of jointly assessed married couples, the couple determines the amount of taxcredits allocated to each partner and it is not sensible to look at the net of tax income ofindividual partners.
Possibilities for other useful cross-classifications are limited. One could produce analyses ofincomes for certain sub-groups such as lone parents and retired persons, since suchmarkers are on the tax files. However, the majority of these will be low-income cases and, asmentioned earlier, their coverage on the tax files may not be comprehensive or up to date.This seriously diminishes the usefulness of the existing data for income distributionanalyses.
The long-term goal should therefore be to produce regular and more comprehensive reportson the distribution of the after-tax incomes of families and households, by enhancing theinformation in the tax system with data from other sources. As explained earlier, the existinginformation on incomes in the income tax system is incomplete. Certain types of incomesand low-income families are not always captured in the system. Incomes are also onlyavailable for tax cases (single or married), while income distribution analysis is mostconcerned with the composition and combined incomes of families and households. Anymeaningful analyses would have to include low-income households, whose incomes may notbe subject to tax and it is proposed that information on these should be also obtainedthrough linkages with DSFA’s data holdings. Their systems can provide information on socialwelfare payments by PPS Number and this information could be merged with the tax recordsto provide a much more comprehensive picture of incomes than currently exists. This,however, requires that the two departments classify social welfare payments in a way that isrecognisable by both systems, given that some are subject to income tax and will already becaptured as income in the tax files. The analysis also needs to be undertaken at the level ofthe family or household and this is a more difficult issue. However, the DSFA’s PRETAscheme already captures information on all persons in the household regardless of theirdependency status and one of the recommendations in this report is that this informationshould be collected in all social welfare schemes (see Chapter 6). This would allowindividuals, identified by PPS Number, to be combined into households and data on incomesto be aggregated to give overall household incomes. National experts in the field of incomedistribution analysis should be consulted before detailed specifications are drawn up for theproduction of the enhanced income statistics.
Structure of employment
Additional microanalysis of the information provided in the P35 forms returned by employerscould provide additional useful information on the structure and nature of employment.However, any analysis will be somewhat limited without an “hours worked” indicator. Theinclusion of such an indicator would be desirable but is likely to create an unacceptablereporting burden on employers. Nonetheless the P35 return still provides a completecoverage of employees since every employer must complete a return and report for eachemployee: the PPS Number; the taxable income; and the dates of commencement andtermination of employment. Using PPS Number classified by employer number and dates ofemployment, it should be possible to statistically analyse movements from one employmentto another (PPS Number captured leaving one employment and subsequently appearing onanother employer’s return). Cases of multiple employments (same PPS Number in two ormore P35 returns and covering the same employment period) could also be identified and

107
linked to the levels of income, although as mentioned earlier, the usefulness of suchinformation is diminished by the absence of data on hours worked.
When analysing the P35 data system, care will have to be taken to separately identifyrecords relating to the payment of pensions to retired persons. Some occupational pensionsare within the scope of the PAYE system and the various pension schemes must submit P35returns. The numbers of such schemes are limited and, if necessary, they could be manuallyidentified and separately processed. Existing data on occupational pension schemes is verylimited and the information on these schemes obtainable from the P35 system would in itselfbe valuable.
The macro-analysis of employment and income statistics will also be greatly enhanced whenthe activity coding of Revenue records is updated in line with the new international activityclassifications. The Director General of the CSO has agreed that the CSO will provideassistance in this area and the necessary work is already underway.
Incomes by regions
The SGSES report identified considerable demand for information on incomes classified byregions. After examining the income tax system, the SPAR team is of the view that someplace of work and place of residence linkages are possible by matching the Form P35employer address file with the employee address file. However, the usefulness of thisanalysis is limited. All employees of a company are usually included in a single P35 return.These employees may work in separate locations in different branches of the company, butthe P35 return may record only a single address designated for tax purposes. The location ofthe actual place of work cannot therefore be identified in the tax system.
ST21 form
The ST21 captures details of house sales not involving a mortgage. It therefore has thecapacity to provide information on house prices that would complement the informationalready available to the DoEHLG from mortgage lenders. Information from the ST21 formcould also provide useful statistics on new building and construction projects. However,while the ST21 system comprehensively records property transfers, it is not an exhaustivedata source for new residential, commercial or industrial developments. At present, the formdistinguishes between new and second-hand property only in the case of dwellings. Thisdistinction would also need to be introduced for industrial and commercial properties. Eventhen, certain types of new developments would not be captured. For instance, if adevelopment company buys land for building purposes, the transfer will be recorded on theST21 return. If the company then builds an office block or shopping there is no requirementto complete another ST21 form regarding the new building unless it is actually sold or letunder a lease of 30 years or more. Extensions of existing buildings or new buildingsdeveloped on the grounds of existing buildings may also be excluded. Therefore, the ST21system will never be capable of providing comprehensive information on new building outputbut it has the potential to be a very useful check for verifying the comprehensiveness ofconstruction statistics.
The SPAR team therefore recommends that the ST21 form be expanded to separatelyidentify new properties also in the case of commercial and industrial developments. Theteam also recommends that the CSO liaise with the Valuation Office to determine if theexisting information on agricultural land sales, which is partly based on the ST21 information,could be expanded to provide information on the sales of other properties.
108
7.9 Summary recommendations
(i) Develop a new set of annual employment statistics based on the existing P35 incometax returns.
(ii) Investigate the possibility of separately identifying the gross incomes of husbands andwives in order to produce additional breakdowns of income by gender in the IncomeDistribution tables published in Revenue’s Annual Statistical Report.
(iii) Expand the property breakdown in the ST 21 form to separately distinguish transfers ofnew commercial and industrial properties, with a view to providing useful data forbuilding and construction statistics. The CSO should also liaise with the ValuationOffice to determine if the information they currently provide on agricultural land salescan be extended to cover information on the sales of other properties.
(iv) Extend the coverage of incomes on the Revenue files by merging information on non-taxable incomes from the DSFA data holdings. In the longer term, the possibility ofcompiling annual household income estimates using individual-household linkagescollected in DSFA schemes should be considered.

109
Chapter 8 Cross-cutting
Statistical Issues
110
8.1 Introduction
This chapter examines a number of issues that would simplify taking a cross-cuttingapproach to policy-making across the six departments examined in this report. Progress onthese issues would clarify the inter-relationships between policy questions in differentdepartments. These issues are such that they can best be progressed through high-levelinter-departmental co-operation. They include:
♦ The use, for statistical purposes, of a common personal reference number (thePPS Number) for all transactions between individuals and governmentdepartments (see Section 8.2);
♦ The use of address postcodes or geo-reference co-ordinates to assist in thecompilation of small area statistics (see Section 8.3);
♦ The use of and sharing of expertise on standard classifications and codingsystems (see Section 8.4); and
♦ Statistical management practices that increase the statistical potential of the dataholdings (see Section 8.5).
The chapter ends with a summary of the typical statistical strengths and weaknesses foundin administrative records, and with a brief review of the situation with respect to surveys thatare funded by government departments and undertaken, on their behalf, by outside bodies.
8.2 Data integration
The PPS Number was introduced in the 1998 Social Welfare Act as the unique personalidentifier for transactions between individuals and government departments and agenciesdesignated in the Social Welfare Acts. As indicated in Section 6.8.1, these include keydepartments for social statistics such as Education and Science; Environment, Heritage andLocal Government; Health and Children; and the Office of the Revenue Commissioners.Legislation provides that only designated public bodies may use the PPS Number. The CSOis a designated body. The SPAR teams found that the PPS Number was being used in 63 ofthe data holdings examined in this report (see Appendix 3).
The Central Records System (CRS) file maintained by the DSFA is a register of all PPSNumbers. The CRS holds key demographic and socio-economic information of interest forpolicy purposes, such as sex, date of birth, date of marriage, marital status, nationality,household ID number, income data, occupation and employer details.
Apart from its administrative use, the CRS has the potential to be of enormous statisticalbenefit. The CRS is already being used by the CSO to reduce the statistical burden onrespondents in household surveys. For example, the new CSO survey on Statistics ofIncome and Living Conditions (EU-SILC) asks interviewees to allow the CSO to use theirPPS Number to obtain financial information directly from DSFA and Revenue rather thandirectly during the interview. The PPS Number is also being collected in the CSO’s newNational Employment Survey. From a statistical perspective, this usage reduces theresponse burden and provides the CSO with more detailed and more accurate information. Italso makes more effective use of interviewers’ time, allowing the collection of information notavailable through administrative sources such as perceived health status, and unreportedcrime.
111
On a broader level, many issues of importance to society can only be fully understood ifinformation from different data sources can be combined. This requirement applies to bothdata sources held within the same department and to data sources held in differentdepartments. The use of a common reference number would allow the CSO to increase thestatistical value of the separate individual sources, and to support the kind of in-depthanalyses needed by policy-makers and business analysts. Significant statistical analysescould be undertaken across public sector databases, resulting in a comprehensive statisticalprofile of the population in terms of education, health, employment etc., if the individual datasources could be brought together at the person, family and household levels. For example,the progress of individual pupils through the education system could be more thoroughlystudied if pupil databases existed that could be integrated across first, second and third levelcycles.
Under the Statistics Act, 1993, the CSO is responsible for ensuring that the statisticalpotential of the records maintained by public authorities is realised. Section 30 of the Actgives the CSO right of access26 to the data holdings held by, or funded by, governmentdepartments. Maximising the potential and value of administrative data will require the CSOto integrate administrative data files. Such integration would allow the provision of acomprehensive demographic and socio-economic background to the key Irish socialstatistics. The SGSES report also acknowledged the essential importance of data integrationand recommended an approach to allay any fears the public may have about thepreservation of the data protection rights of individuals. The NSB proposed that:
♦ The CSO be asked to set out formally how its process of data integration and thesubsequent treatment of statistics generated by data integration (includingaccess for research) can be safely employed without data protection problems;
♦ The NSB in conjunction with the SOGSI should be asked to set out formally howdepartments would use and protect individual data available to them forstatistical purposes; and
♦ These documents should be referred to the Data Protection Commissioner forconfirmation that this process does not undermine the data protection rights ofindividuals.
The SPAR teams endorse this approach.
8.3 Spatial aspects
The Government published the National Spatial Strategy 2002-2020 (NSS) in May 2003.The NSS is a planning framework designed to achieve a better balance of social, economicand physical development, and population growth between regions. The high growth ratesachieved in Ireland during the 1990s have altered the socio-economic geography of Ireland.It is essential that data holdings in departments should contain detailed and consistentgeographical identifiers to enable policy-makers to accurately measure these regionalchanges. We are also aware that in some countries (e.g. the UK) there has been significantinvestment in developing neighbourhood statistics to support “joined-up” policy responses.This section briefly examines three recent developments in this area.
26 The Act does not give the CSO automatic right of access to records pertaining to a Court, the Garda Síochánaor the prison administration. The agreement of the Minister for Health and Children is required for access tomedical records that are not publicly available.
112
Irish Spatial Data Infrastructure
The Government's Action Plan for developing an Information Society, New Connections,was published in March 2002. It included plans for a national Spatial Data Infrastructure(SDI) to be progressed as a strategic priority in the context of the overall development of thee-Government process. The DoEHLG was given the central role in establishing the SDI.
In essence, a SDI is an initiative to ensure that spatial data are organised in ways that moreeffectively describe the national economy, promote social inclusion, meet citizens’ needs,deliver services more effectively, and help protect or enhance the environment.
In SDI, a distinction is made between reference data (direct information for a position inspace such as the course of a river or an administrative boundary), and statistical data, suchas population, that can be related to position in space. A SDI is not primarily concerned withthe actual statistical information but only with the way in which it is linked or ‘tagged’ tospatial location. There is a need to ensure that the reference information and the tagging areorganised so as to achieve the benefits associated with the coherent organisation of spatialinformation.
The SDI is an important cross-cutting initiative that should increase the potential ofadministrative data, particularly if proper standards are agreed and adhered to. TheDoEHLG has established an ISDI (Irish SDI) Work Group, comprising GeographicalInformation Systems and spatial experts. The CSO became a member of the ISDI WorkGroup in July 2003. This group will report to the National Spatial Strategy ImplementationCommittee. At its inaugural meeting earlier this year, the Work Group agreed a two-prongedapproach:
♦ To determine user needs in this area; and
♦ To undertake a scoping study to identify which organisations generate and holdsignificant amounts of spatial data, and to obtain details regarding key featuresof the data (metadata, accuracy, format, frequency of updating, etc.).
There are similarities between the ISDI and SGSES/SPAR initiatives to the extent that bothare concerned with data availability, data needs, and standards to improve the accessibilityand usability of the information. Indeed, the DoEHLG have indicated that they consider itnecessary for them to examine in detail the findings of the current SPAR Project beforeundertaking any research initiative in the area of SDI.
Although the Spatial Data Initiative is still at a very formative stage, the SPAR teams stronglyrecommend that all relevant organisations be fully aware of the needs of the emerging SDIinitiative and take it into account when organising the spatial elements of their data.
GeoDirectory
The GeoDirectory is a collaboration between An Post and Ordnance Survey Ireland (OSi).The purpose of the directory is to create a definitive reference directory of addresses inIreland and to assign them accurate postal and geographical addresses. To this end, AnPost and OSi propose using a standard format for all addresses in Ireland. The directoryincludes a geographical address (grid reference co-ordinates) but it does not include aPostcode.

113
Postcodes
The SPAR teams support the introduction of an addressing system that wouldunambiguously identify the location of an address independently of the address description.ComReg published a consultation paper on the Regulation of Postal Services in November200227. The paper invited opinions on a number of issues including the possible introductionof postcodes. Both the CSO and the NSB responded with opinions in favour of theirintroduction. Standardised postcodes would facilitate the integration of results from separatesurveys at a small geographical level in a much more exact way than attempting to derivegeographical area information from text addresses or grid reference co-ordinates. The ISDIworking group should examine and make recommendations on the need for postcodes.
8.4 Data classifications and coding practices
The processing of data from a survey or administrative scheme generally requires the use ofdata classifications and coding. For example, employment schemes need to record theprevious occupations of applicants. To analyse these in an efficient and effective manner, itis necessary to adopt a consistent level of detail for recording a person’s occupation and forsubsequently coding that information in a computerised format.
In the late 1990s, the CSO set up an office-wide Classification and Standards Section(CARS) with responsibility for this the establishment of classifications standards and the co-ordination of their use within the CSO (see Appendix 9). The CARS Section has to-dateprimarily focussed on itemising and standardising the coding systems in use within the CSO.They have also recently begun consulting with statisticians in other governmentdepartments. The SPAR teams recommend that this practice be formalised and that CARSsection should take a more proactive role in ensuring that standard coding systems arebeing used throughout the public service. For many variables, it should be sufficient for theCSO to make available to departments a recommended standard classification/codingsystem. However, for a complex variable such as occupation, it may be necessary for theCSO to take a more active role such as developing and sharing software that facilitatesautomated coding of text descriptions. Using these tools, it is possible to make considerabletime and cost savings in such coding.
Table 8.1 examines the classification information returned to the CSO in connection with thedata sources examined by the SPAR teams (see Appendix 3). The table shows that there isa wide variety of coding systems being used under each classification variable. In somecases, it may be possible to establish one-to-one relationships between some of thesecodes. However even that may not be possible over time unless those coding systems arebeing kept up to date.
Age coding information was received in relation to 65 of the data sources that were reviewedby the SPAR teams28. While there were nine different age coding systems in use (seeAppendix 5), 51 of the 65 coding systems were consistent with CSO best practice. A lessfavourable situation exists for nationality. There were nine different nationality-codingsystems in use. Of the 37 sources where nationality-coding details were provided, only twowere using what would be regarded by the CSO as a standard classification. Given theimportance of immigration to understanding recent social change in Ireland, there is a clearneed to be able to reliably classify information by nationality. An example of the need forsuch information is in CSO population projections - the models behind these projections
27 ODTR (2002): ODTR 02/95 - Regulation of Postal Services.28 Appendix 3 contains a list of the data sources reviewed by the SPAR teams. Age information is not necessarilycollected in each of these data sources.
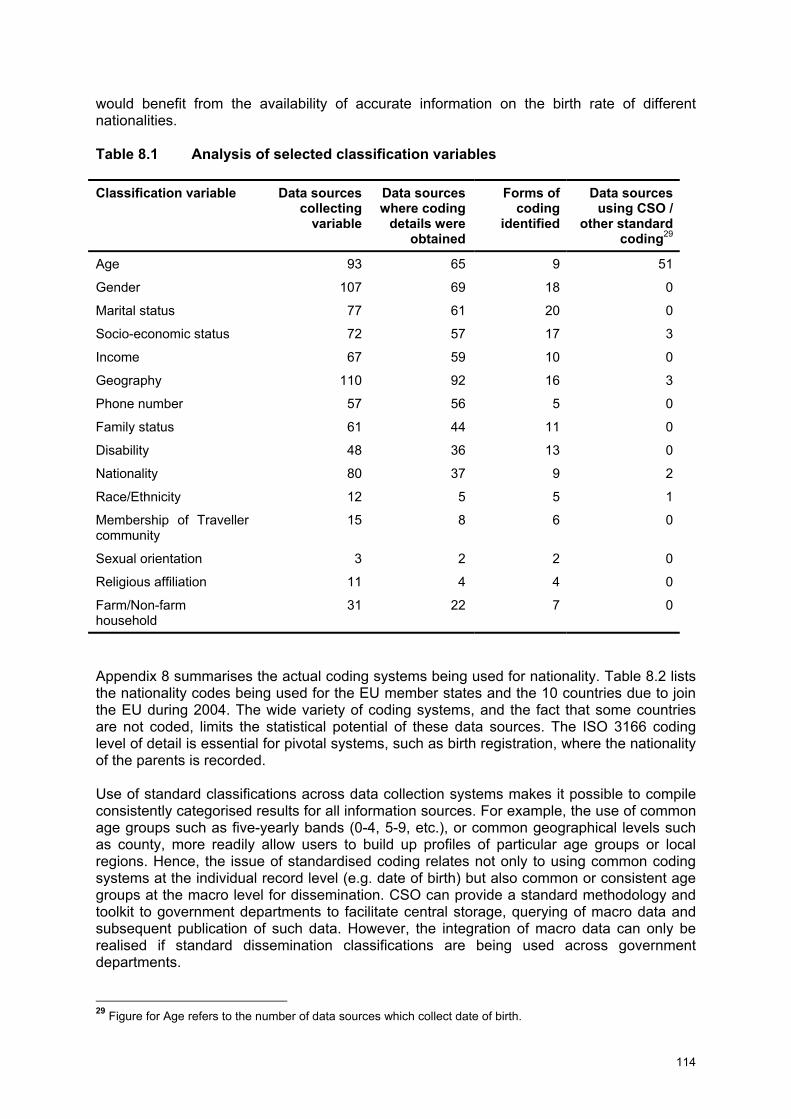
114
would benefit from the availability of accurate information on the birth rate of differentnationalities.
Table 8.1 Analysis of selected classification variables
Classification variable Data sourcescollecting
variable
Data sourceswhere coding
details wereobtained
Forms ofcoding
identified
Data sourcesusing CSO /
other standardcoding29
Age 93 65 9 51
Gender 107 69 18 0
Marital status 77 61 20 0
Socio-economic status 72 57 17 3
Income 67 59 10 0
Geography 110 92 16 3
Phone number 57 56 5 0
Family status 61 44 11 0
Disability 48 36 13 0
Nationality 80 37 9 2
Race/Ethnicity 12 5 5 1
Membership of Travellercommunity
15 8 6 0
Sexual orientation 3 2 2 0
Religious affiliation 11 4 4 0
Farm/Non-farmhousehold
31 22 7 0
Appendix 8 summarises the actual coding systems being used for nationality. Table 8.2 liststhe nationality codes being used for the EU member states and the 10 countries due to jointhe EU during 2004. The wide variety of coding systems, and the fact that some countriesare not coded, limits the statistical potential of these data sources. The ISO 3166 codinglevel of detail is essential for pivotal systems, such as birth registration, where the nationalityof the parents is recorded.
Use of standard classifications across data collection systems makes it possible to compileconsistently categorised results for all information sources. For example, the use of commonage groups such as five-yearly bands (0-4, 5-9, etc.), or common geographical levels suchas county, more readily allow users to build up profiles of particular age groups or localregions. Hence, the issue of standardised coding relates not only to using common codingsystems at the individual record level (e.g. date of birth) but also common or consistent agegroups at the macro level for dissemination. CSO can provide a standard methodology andtoolkit to government departments to facilitate central storage, querying of macro data andsubsequent publication of such data. However, the integration of macro data can only berealised if standard dissemination classifications are being used across governmentdepartments.
29 Figure for Age refers to the number of data sources which collect date of birth.

115
Table 8.2 Examples of nationality codes used for EU and accession states
Country ISO 3166 /CSO Standard30
DSFA –ISTS
DSFA -PENLIVE
GRO DES Post-Primary Pupil
Database
Belgium BE BEL 107 21 56Denmark DK DEN 109 56 208Germany DE GER 156 79 276Greece GR GRE 110 82 300Spain ES SPA 112 198 724France FR FRA 105 72 250Ireland IE IRL 0 103 372Italy IT ITA 108 105 380Luxembourg LU LUX 111 125 442Netherlands NL NET 106 152 528Austria AT AUS 115 14 40Portugal PT POR 113 172 620Finland FI FIN 125 71 246Sweden SE SWE 123 204 752United Kingdom GB UK 157 223 826Cyprus CY CYP 146 54 196Czech Republic CZ - - 55 202Estonia EE - - 66 228Hungary HU - 150 95 348Latvia LV - - 118 420Lithuania LT - - 124 440Malta MT - 122 133 470Poland PL POL 139 171 616Slovakia SK - - 192 672Slovenia SI - - 193 676
8.5 Statistical management of data sources
To ensure that the statistical potential of the data holdings is fully realised, it is essential thatstaff responsible for these data sources are aware of best practice in maintaining registers,processing the completed forms, and disseminating the results. Statistical managementencompasses issues such as:
♦ Register procedures that clearly distinguish between current and inactiverecords;
♦ Capturing the raw data once and at the point closest to the data provider;
♦ Data capturing practices that are consistent with recognised internationalstatistical classifications and standards;
30 The CSO standard classification of countries is based on the ISO-3166-1:1997, but includes ahierarchical element, which accommodates the constituent parts of the United Kingdom.
116
♦ Procedures that clearly document treatment of missing and suspect data; and
♦ Management of the IT aspects of statistical systems in an integrated and clearlydocumented manner.
The SPAR teams encountered many problems relating to the management of registers thatlimited the statistical potential of the associated data sources. These included problems withhow to handle exits from the register, recording the timing of events such as new entries, oramendments to existing entries such as updating educational qualifications. Thesedifficulties are particularly limiting if such registers are being used for selecting samples orfor grossing the results of sample surveys to the population. The inclusion of key additionalvariables on a register can also result in selecting more efficient and smaller samples.
Examples of IT management of statistical systems that are consistent with facilitating dataintegration are evident in a number of departments. For example, DSFA has reduced thevariety of their IT systems by grouping their individual schemes into a small number ofsystems.
The Integrated Housing Project currently being developed in DoEHLG is bringing together16 previously independent systems into one common system. The project involvesstandardising the application forms across these schemes and capturing a considerableamount of applicant information that was previously only available on paper.
The new DoEHLG House Price System represents another example of good practice. Atpresent, various institutions compile price trend reports based on potentially non-representative subsets of house purchase data. Under the new system, the department willreceive an electronic file from the mortgage institutions of the individual mortgagetransactions in an anonymised form. The new system should result in cost savings (databeing captured once), improved timeliness and extra detail on the borrower and on theproperty. This will allow more comprehensive statistical analyses to be compiled including amore exact distinction of the price trends for different types of properties (e.g. new/second-hand, location, type, size, and period of construction).
The redesign of IT systems or the establishment of new data holdings provide idealopportunities for departments to review the quality of their statistical management practices.Recognising this, the NSB has asked the CSO to take a lead role, in line with its remit underthe Statistics Act, 1993 in developing a collaborative network among data producers31:
“This should involve all government departments and agencies that hold administrativedata capable of generating worthwhile statistics. An immediate consequence is thatdepartments and agencies should consult with the CSO when they are undertakingnew data collection or changing information technology systems. It is easiest tomaximise the statistical potential of administrative records if this is built in at the designstage of IT systems.”
Given the CSO experience in these issues, sections in departments and agenciesadministering data sources should, as a matter of course, seek advice from the CSO ongood practice in the statistical management of data holdings. Although not discussed here indetail, such practices also include a focus on completeness and accuracy of data capture,data editing processes for checking and correcting data, and estimating for missinginformation. They also include practices that ensure all procedures and data holdings are
31 NSB (2003), “Strategy for Statistics 2003-2008”
117
fully documented. Indeed, the CSO is currently undertaking a major exercise to improve thequality of its survey metadata so that all relevant documentation is attached to, or in closeproximity, to the data file itself.
8.6 Typical strengths in administrative records
In recent years, there has been a significant increase in the extent to which administrativerecords have been computerised and in the coverage of administrative schemes. The CSOrecognises the benefit in optimising the use of existing administrative data holdings beforeformulating proposals for new surveys to meet the increasing national and internationaldemands for statistics. Records available through administrative sources have a number ofpotential advantages over attempting to collect the same information by means of astatistical survey. Some of these advantages are:
♦ The cost is often significantly lower as the statistics are collected as an add-on toan existing administrative scheme;
♦ Administrative schemes often have a higher and more timely responseparticularly if there is an administrative obligation or an economic incentive toparticipate;
♦ Such schemes can cover specific sub-groups of the population in a moreeffective way than is feasible using general household sample surveys;
♦ It is easier to collect financial information; and
♦ The workload is often spread across local offices.
8.7 Typical statistical weaknesses in administrative records
Throughout Chapters 2-7, a number of recurring weaknesses have been identified that tendto limit the potential use of administrative records for statistical purposes. These weaknessesinclude:
♦ Administrative systems are often application or case-based rather than personbased;
♦ In some departments, data capture and processing is very fragmented andstatistical procedures are often not applied consistently at local level;
♦ For a number of data holdings, only aggregated information is available. Thisprevents the undertaking of more thorough analyses and longitudinal studies;
♦ There is an increasing tendency to use the PPS Number as a unique referencenumber. However, increased use of this identifier is subject to meeting dataprotection requirements;
♦ Without widespread use of a common personal identifier, there is no readymechanism to combine individual related data holdings for cross-cuttinganalyses either within or across departments;
118
♦ There is repetitive data collection across and within departments. In some cases,departments are duplicating compilation of client registers with very significantoverlap e.g. CRS, GMSPB, Electoral register;
♦ There may be a lack of central awareness within a department of all its dataholdings;
♦ It is difficult to aggregate administrative records at the individual level to largerunits such as the family or household;
♦ There is a lack of usage of standard classifications and coding systems;
♦ Administrative forms are sometimes only partially computerised;
♦ The publication of statistical information from administrative schemes should bewithin regular time deadlines;
♦ The voluntary nature of many schemes often means that all eligible applicants donot apply;
♦ The absence of an agreed core set of demographic and socio-economicvariable, for inclusion in each scheme, has reduced the statistical value of eachdata holding.
♦ While it is important to retain inactive records in administrative registers, thereneeds to be a clear method of marking critical events such as the time at which arecord first became active or ceased to be active; and
♦ There are difficulties in updating useful statistical information, such aseducational qualifications, where such data are not essential to theadministration of a scheme.
8.8 Access to surveys funded by government departments
The NSB called for a broader and more collaborative approach to the collection of publicservice statistics in its Strategy for Statistics 2003-2008. The NSB asked the CSO toexamine how the statistical potential of administrative records and department-fundedsurveys could be better integrated into official statistics to meet the increasing needs ofusers. Throughout this report, there have been various instances of statistical work beingundertaken by outside organisations on behalf of departments.
Table 8.3 outlines some of the key government funded surveys undertaken on behalf ofgovernment departments. The method of public dissemination for these surveys varies froma standard statistical report to the irregular release of specialised analytical reports. Thesedata sources have a broad societal and policy interest. Standard statistical reports should bepublished from publicly funded surveys and the funding department should be the ultimateowner of, and have full access to, the raw data. The NSB also expressed the view (Section3.3 of Strategy for Statistics 2003-2008) that data from all such surveys conducted at thetaxpayers expense are automatically part of Ireland’s official statistics and must beaccessible by the CSO.

119
Table 8.3 Some examples of outsourced Department funded social surveys
Department Survey
Education Annual School Leavers Survey
International Adult Literacy Survey
Program for International Student Assessment
Surveys of achievement at Primary and Secondary level
National Assessment of English Reading
National Assessment of Mathematics Achievement
Suirbhé Náisiúnta Inniúlachta sa Ghaeilge I Rang a Sé
Survey of Reading Literacy in Designated Disadvantaged Schools
Environment National Survey of Housing Quality
Health National Perinatal Reporting System
Hospital In-patient Enquiry
Justice EU Migration Network
Social and Family Affairs Living in Ireland Survey
Other European Social Survey
National Survey of Domestic Abuse

120

121
Chapter 9Conclusions and
Recommendations

122
9.1 Introduction
Some detailed conclusions and recommendations have already been presented in Chapters2-8. This chapter focuses principally on the general conclusions and key recommendationsthat could have significant outcomes for a specific data holding or for a cross-cutting issue.The chapter also includes a brief review of the policy context driving an increased demandfor official statistics.
9.2 A brief review of the policy context
In recent years, there has been an increasing demand from society and Government forstatistical evidence on which to base and evaluate policy. The Government articulated itssocial objectives in a range of reports such as the Social Partnership Agreements, theNational Anti-Poverty Strategy (NAPS), the National Children’s Strategy32 (NCS) and theNational Spatial Strategy. The NAPS recognised that poverty is mainly concentrated inhouseholds with no person in employment or only persons in low-paid employment. Theseinclude households with elderly people, people with disabilities, carers, one-parent families,larger families and minority groups. The NCS recognised the need for consistent, timely andrelevant information on children and concluded that a national longitudinal study of childrenwas needed to correct the existing information deficit.
The new demands were partially met by the CSO developing the QNHS as a means ofcollecting a broad range of information on social issues through the incorporation of specialsurvey modules on topics such as crime, pensions, disability and childcare. However, theNSB and CSO realised that a more fundamental structural approach was needed to identifyand meet the key needs of users. The NSB reviewed these developments in depth duringthe development of its new strategy for statistics. It concluded that the new demands forinformation were such that a new statistics network needed to be developed acrossdepartments. It was envisaged that this network would work in a collaborative manner toensure that the production of the new statistics being demanded by society and Governmentwould be imbedded into the system. Essentially, the challenge to the statistical system hasbecome one of anticipating future statistical needs and establishing a framework that iscomprehensive and flexible enough to deliver them. This Report has attempted to identifysome of the practical steps involved, and some of the value that might be unlocked, inimplementing this whole-system approach.
9.3 Conclusions and recommendations
The SPAR teams are satisfied that all of the major social data sources in the sixdepartments have been reviewed and that these are sufficiently representative for the teamsto draw useful conclusions and recommendations. The data sources contain a vast amountof information on topics of central interest to Irish society. However, in most cases, they arecontained in stand-alone information systems primarily designed to meet administrativerequirements rather than the needs of policy-makers. While there are significant ongoingefforts on the part of data holders to improve the quality of the statistical information beingderived from these sources, these efforts need to be organised in a more structured andstrategic framework.
Many of the recommendations made by the SPAR teams are with the intention of adaptingthe data sources to optimise their statistical potential. Development of this potential will alsohelp departments to meet their own internal data needs. This should be of use to 32 DHC (2000): “National Children’s Strategy”
123
departments when they are formulating the data/statistics strategies requested by theGovernment in response to the SGSES memorandum. The teams found that there was noready repository of summary information on all of the data holdings being held within adepartment and its agencies. In addition, departments did not always have access to the fullrange of information held by agencies and other department bodies.
The SPAR teams encountered recurring problems relating to the management of registersthat limited the statistical potential of the associated data sources. These difficulties reducethe potential value of the registers for maintaining up-to-date and comprehensive informationand for selecting or grossing survey samples if required. In addition, the inclusion of keyadditional variables on a register would facilitate the selection of more efficient and smallersurvey samples.
The data protection laws in Ireland strictly limit the potential use of the PPS Number forsharing of administrative information between departments. While these limitations protectthe rights to privacy of citizens, they may also conceivably operate to the detriment ofindividual citizens in certain circumstances. Furthermore, they also result in a higher burdenof administration and repetitive form filling than would be the case if the statistical aspects ofthis information could be shared between government departments. For example, therewould be significant cost savings and statistical benefits if the key demographic and socio-economic information on all persons living in Ireland could be collected centrally and sharedboth within and between departments under strict legal agreements. This would avoid thecurrent situation where departments for different purposes are separately duplicating effortand response burden in constructing their own partial population registers.
A culture of good practice in managing data holdings has developed over time in the CSO.The teams consider that it would be of significant benefit to departments if they also had thisexpertise available to them either internally or through the CSO. Increasing the collaborationbetween producers of official statistics is one of the key priorities in the NSB’s strategy 2003-2008. The CSO has recently placed a number of statisticians in government departmentsand this approach could, over time, contribute to developing the statistical competency ofproducers and users of statistical data in those departments. However, for these staff to befully effective within these departments and as part of the broader public service statisticalsystem, they need to operate as a central statistical unit and have a key input intostandardising the collection, processing and dissemination of each department’s dataholdings. In addition, such units would need to work closely with the CSO. These changesare needed to ensure that consistent standards are in use throughout the administrative dataprocess which ranges from the initial conceptualisation of the information required through todesigning application forms or survey questionnaires, specifying IT procedures for captureand editing of data, integration of data at the micro level, and the dissemination of results.Only then can departments be confident that they will have the cross-sectional andlongitudinal statistics that will enable them to fully understand the key determining factorsinfluencing social, health and educational outcomes.
General recommendations
These recommendations are of a cross-cutting nature largely directed towards thedevelopment of an integrated and comprehensive approach to the production of statisticsacross the public service. Implementation of these recommendations will greatly facilitate theundertaking of cross-sectional and longitudinal analyses that explore more fully thecomplexity of society in Ireland.
Recommendation 1: Departments should ensure that related data sources are capable ofbeing integrated at the individual record level.
124
Recommendation 2: There should be greater collaboration between governmentdepartments and the CSO to ensure that the statistical potential of administrative records isrealised efficiently, and that duplication within the system is minimised.
Recommendation 3: Departments should establish mechanisms to regularly review theirinformation needs as the statistical information available from official data sources develops.
Recommendation 4: Some social statistics are more meaningful at the individual, family orhousehold level. Where relevant, data holdings should be structured so that case-level orevent-based information can be aggregated to compile individual, household and familystatistics.
Recommendation 5: All official data sources should use standard classifications andcoding-systems. The CSO should take a lead role in promoting, maintaining anddisseminating these classifications.
Recommendation 6: The CSO should work with departments to develop a core set ofdemographic and socio-economic variables. These could either be independently collectedin administrative schemes and surveys or preferably, subject to meeting data protectionrestrictions, available via a central repository such as the CRS. Spatial information andnationality should be included in this core set.
Recommendation 7: Individual departments should develop a common look and content inthe design of their administrative scheme application forms. This will ensure that the coreinformation is collected in an identical manner across all schemes.
Recommendation 8: Departments should give priority to developing the data holdings thathave information on persons not living in permanent households, i.e. the homeless andpersons living in institutions, as these are outside the coverage of the CSO samplehousehold surveys.
Recommendation 9: All statistics compiled in government departments should adhere tothe UN Fundamental Principles of Official Statistics (see Appendix 10). In addition, wherestatistical reports are published from department data holdings, these should be published ina consistent format and adhere to a defined publication timeliness.
Recommendation 10: All departments should be aware of the emerging SDI initiative andtake it into account when organising the spatial elements of their data. The ISDI shouldexamine the policy needs for postcodes.
Recommendation 11: Departments should increase the level of statistical competency indata processing and analysis among their staff.
Recommendation 12: Departments should ensure that all statistical information of use topolicy-making, collected in administrative schemes, is computerised.
Specific recommendations
Although each of these recommendations is specific to an individual department,implementation of them would have cross-cutting benefits in many cases.
Recommendation 13: DES should take measures to develop an integrated individual pupildatabase covering first, second and third level cycles of education. The PPS Number shouldbe included in the State examination databases.
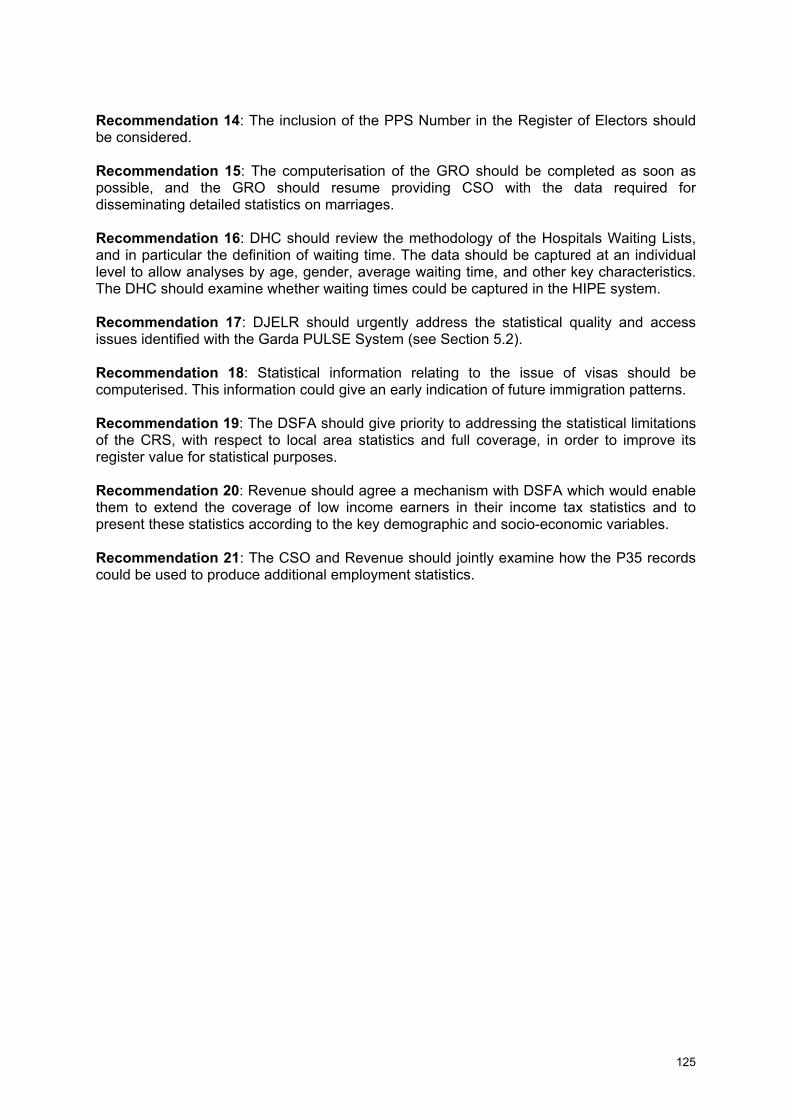
125
Recommendation 14: The inclusion of the PPS Number in the Register of Electors shouldbe considered.
Recommendation 15: The computerisation of the GRO should be completed as soon aspossible, and the GRO should resume providing CSO with the data required fordisseminating detailed statistics on marriages.
Recommendation 16: DHC should review the methodology of the Hospitals Waiting Lists,and in particular the definition of waiting time. The data should be captured at an individuallevel to allow analyses by age, gender, average waiting time, and other key characteristics.The DHC should examine whether waiting times could be captured in the HIPE system.
Recommendation 17: DJELR should urgently address the statistical quality and accessissues identified with the Garda PULSE System (see Section 5.2).
Recommendation 18: Statistical information relating to the issue of visas should becomputerised. This information could give an early indication of future immigration patterns.
Recommendation 19: The DSFA should give priority to addressing the statistical limitationsof the CRS, with respect to local area statistics and full coverage, in order to improve itsregister value for statistical purposes.
Recommendation 20: Revenue should agree a mechanism with DSFA which would enablethem to extend the coverage of low income earners in their income tax statistics and topresent these statistics according to the key demographic and socio-economic variables.
Recommendation 21: The CSO and Revenue should jointly examine how the P35 recordscould be used to produce additional employment statistics.

126

127
Appendices

128

129
Appendix 1 Membership of CSO teams
Focus Department CSO team CSO support team
Education and Science Ger HealyDiarmuid ReidyGillian Wall
Steve MacFeelyJohn O'Leary
Environment, Heritageand Local Government
Adrian RedmondJim DunneJohn Dunne
Gerry WalkerJoe Madden
Health and Children John FitzpatrickGordon CavanaghNiall O'Hanlon
Paddy McDonaldKevin McCormack
Justice, Equality & LawReform
Aidan PunchMark DavisPaul J Crowley
John O'HaganLiam Hogan
Office of the RevenueCommissioners
Mick LuceyMáire O'MahonyKevin Phelan
Pat FanningElaine Lucey
Social and Family Affairs Padraig DaltonDeirdre CullenRichard McMahon
Catherine FinneranTom McMahon
CSO support team Gerry BradyDenis MurphyPatrick QuillGillian Roche
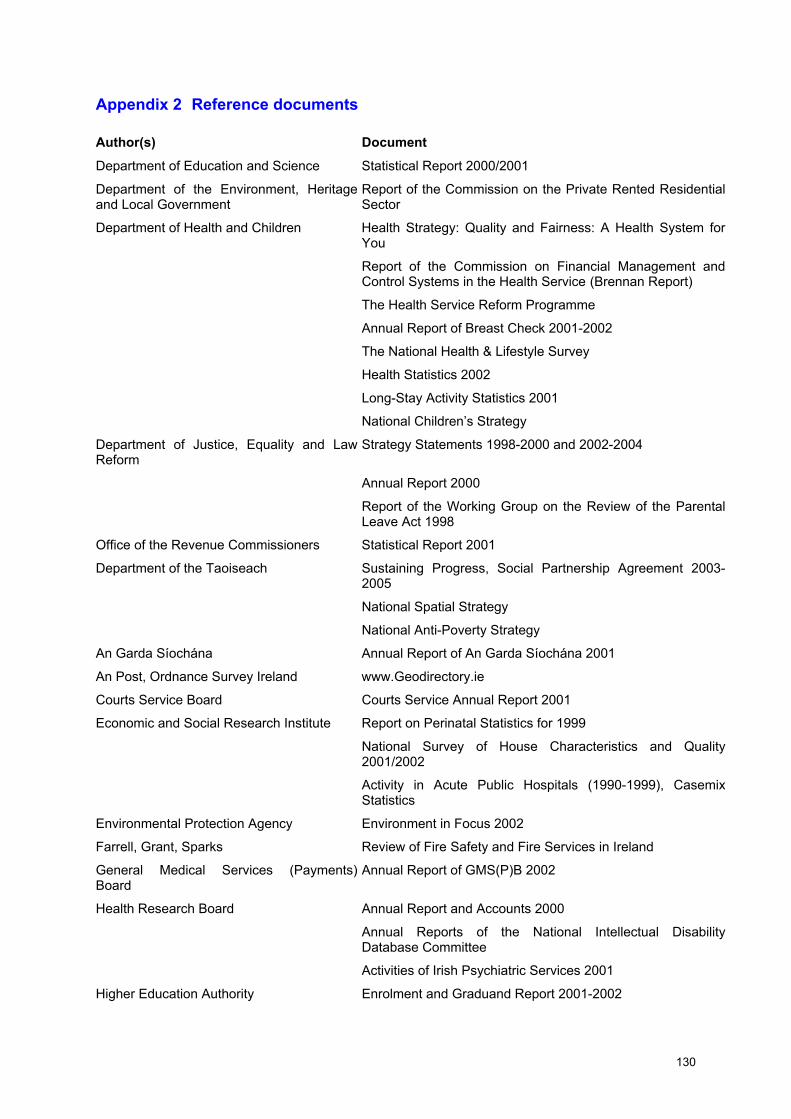
130
Appendix 2 Reference documents
Author(s) Document
Department of Education and Science Statistical Report 2000/2001
Department of the Environment, Heritageand Local Government
Report of the Commission on the Private Rented ResidentialSector
Department of Health and Children Health Strategy: Quality and Fairness: A Health System forYou
Report of the Commission on Financial Management andControl Systems in the Health Service (Brennan Report)
The Health Service Reform Programme
Annual Report of Breast Check 2001-2002
The National Health & Lifestyle Survey
Health Statistics 2002
Long-Stay Activity Statistics 2001
National Children’s Strategy
Department of Justice, Equality and LawReform
Strategy Statements 1998-2000 and 2002-2004
Annual Report 2000
Report of the Working Group on the Review of the ParentalLeave Act 1998
Office of the Revenue Commissioners Statistical Report 2001
Department of the Taoiseach Sustaining Progress, Social Partnership Agreement 2003-2005
National Spatial Strategy
National Anti-Poverty Strategy
An Garda Síochána Annual Report of An Garda Síochána 2001
An Post, Ordnance Survey Ireland www.Geodirectory.ie
Courts Service Board Courts Service Annual Report 2001
Economic and Social Research Institute Report on Perinatal Statistics for 1999
National Survey of House Characteristics and Quality2001/2002
Activity in Acute Public Hospitals (1990-1999), CasemixStatistics
Environmental Protection Agency Environment in Focus 2002
Farrell, Grant, Sparks Review of Fire Safety and Fire Services in Ireland
General Medical Services (Payments)Board
Annual Report of GMS(P)B 2002
Health Research Board Annual Report and Accounts 2000
Annual Reports of the National Intellectual DisabilityDatabase Committee
Activities of Irish Psychiatric Services 2001
Higher Education Authority Enrolment and Graduand Report 2001-2002

131
Author(s) Document
National Survey of Access to Higher Education
Irish Prison Service Irish Prison Service Annual Report 2001
Legal Aid Board Annual Report 2000
National Disease Surveillance Centre Notifiable Infectious Diseases in Ireland Reports
National Statistics Board Developing Irish Social and Equality Statistics to meet PolicyNeeds (SGSES Report)
Strategy for Statistics 2003-2008
Office of the Data Protection Commissioner Fourteenth Annual Report of the Data ProtectionCommissioner, 2002
Prospectus - Watson Wyatt Worldwide Audit of Structures and Functions in the Health System 2003

132
App
endi
x 3
List
of d
ata
sour
ces
exam
ined
Dat
a so
urce
title
PP
SA
geG
ende
rM
/S33
S/E
33In
com
eG
/C33
P/N
33F/
S33
Dis
-ab
ility
Nat
ion-
ality
R/E
33T/
C33
S/O
33R
/A33
Farm
Hou
se P
rice
Info
rmat
ion
prop
osed
to b
esu
pplie
d to
Hou
sing
Pol
icy
and
Sup
ply,
DoE
HLG
by
Mor
tgag
e Le
nder
s -
PR
OP
ER
TIE
S
XX
Hou
se P
rice
Info
rmat
ion
prop
osed
to b
esu
pplie
d to
Hou
sing
Pol
icy
and
Sup
ply,
DoE
HLG
by
Mor
tgag
e Le
nder
s -
BO
RR
OW
ER
S
XX
XX
XX
X
Nat
iona
l Hou
se C
ondi
tion
Sur
vey
- HO
US
ES
XX
XX
XX
Nat
iona
l Hou
se C
ondi
tion
Sur
vey
- PE
RS
ON
SX
XX
XX
XX
XX
Nat
iona
l Veh
icle
& D
river
File
- O
WN
ER
SX
XN
atio
nal V
ehic
le &
Driv
er F
ile -
DR
IVE
RS
XX
XX
XX
XR
egis
ter o
f Ele
ctor
sX
XX
XX
XR
egis
ter o
f Priv
ate
Tena
ncie
sX
XP
ropo
sed
Inte
grat
ed H
ousi
ng S
yste
m -
PE
RS
ON
SX
XX
XX
XX
XX
XX
X
Pro
pose
d In
tegr
ated
Hou
sing
Sys
tem
-P
RO
PE
RTI
ES
XX
XX
Ann
ual C
ensu
s of
Prim
ary
Sch
ools
XX
XX
XX
XA
nnua
l Ret
urns
(Hig
her E
duca
tion
Col
lege
s)X
XX
XX
XX
Ann
ual S
choo
l Lea
vers
Sur
vey
XX
XX
XX
XX
XA
nnua
l Sta
tistic
al R
etur
n of
stu
dent
s in
full-
time
3rd
leve
l edu
catio
n fo
r non
-HE
A In
stitu
tes
XX
XX
X
Cur
ricul
um P
rovi
sion
and
Inte
grat
ion
amon
gFi
rst Y
ear S
tude
nts
XX
XX
XX
XX
X
Eur
opea
n S
ocia
l Sur
vey
XX
XX
XX
XX
XX
XX
XFi
rst D
estin
atio
n R
epor
tX
XX
XX
XH
EA
Ann
ual S
tude
nt S
tatis
tics
Rep
ort
XX
XX
XIn
tern
atio
nal A
dult
Lite
racy
Sur
vey
(IALS
,19
94)
XX
XX
XX
XX
XX
Livi
ng In
Irel
and
Sur
vey
XX
XX
XX
XX
XN
atio
nal A
sses
smen
t of E
nglis
h R
eadi
ngX
XX
XX
Nat
iona
l Con
tribu
tor t
o E
uros
tude
nt S
urve
y -
Soc
ial a
nd E
cono
mic
con
ditio
ns o
f stu
dent
life
in E
urop
eX
XX
XX
XX
X
Nat
iona
l Dev
elop
men
t Pla
n In
-Car
eer
Dev
elop
men
t Uni
t ele
men
tX
XX
Nat
iona
l Sur
vey
of A
cces
s to
Hig
her E
duca
tion
XX
XX
Nat
iona
l Sur
vey
of M
athe
mat
ics
Ach
ieve
men
t(1
999)
XX
XX
XX
XX
33 M
/S =
Mar
ital S
tatu
s, S
/E =
Soc
io-E
cono
mic
Sta
tus,
G/C
= G
eogr
aphi
cal c
odin
g, P
/N =
Pho
ne N
umbe
r, F/
S =
Fam
ily S
tatu
s, R
/E =
Rac
e/E
thni
city
, T/C
= M
embe
rshi
p of
the
Trav
elle
r Com
mun
ity, S
/O =
Sex
ual O
rient
atio
n, R
/A =
Rel
igio
us A
ffilia
tion

133
Dat
a so
urce
title
PP
SA
geG
ende
rM
/S33
S/E
33In
com
eG
/C33
P/N
33F/
S33
Dis
-ab
ility
Nat
ion-
ality
R/E
33T/
C33
S/O
33R
/A33
Farm
NC
TE C
ensu
s of
Sch
ools
XP
ost-P
rimar
y P
upils
Dat
abas
eX
XX
XX
Pos
t-Prim
ary
Teac
her P
ayro
llX
XX
XX
Prim
ary
Teac
hers
Sal
ary
Ret
urn
Form
XX
XX
XP
rogr
amm
e fo
r Int
erna
tiona
l Stu
dent
Ass
essm
ent (
PIS
A)
XX
XX
XX
XX
Sec
ond-
leve
l par
t-tim
e ce
nsus
for v
ocat
iona
l,co
mm
unity
and
com
preh
ensi
ve s
choo
lsX
XX
X
SO
CR
ATE
S -
ER
AS
MU
S in
Irel
and
XX
XX
XS
taff
retu
rns
for H
EA
des
igna
ted
Inst
itute
sX
Sta
tistic
al S
ectio
n, E
xam
inat
ions
Bra
nch
XX
XX
Stu
dy o
f Rem
edia
l Edu
catio
n in
Iris
h P
rimar
yS
choo
ls (1
997)
XX
XX
Sui
rbhé
Nái
siún
ta In
niúl
acht
a sa
Gha
eilg
e I
Ran
g a
Sé
XX
XX
XX
XX
Sur
vey
of d
isad
vant
age
in p
rimar
y sc
hool
sX
XX
XX
XX
Sur
vey
of R
eadi
ng L
itera
cy in
Des
igna
ted
Dis
adva
ntag
ed S
choo
ls (2
003-
2006
)X
XX
XX
XX
X
Third
-leve
l par
t-tim
e ce
nsus
for I
oT's
DIT
,Ti
pper
ary
Inst
itute
and
Kill
ybeg
s H
TCX
XX
X
Ann
ual S
urve
y of
Lon
g S
tay
Uni
tsX
XX
XE
UR
OC
AT
(ER
HA
Reg
iste
r of C
onge
nita
lA
nom
alie
s)X
XX
XX
X
Hos
pita
l In-
patie
nt E
nqui
ry (H
IPE
)X
XX
XX
XH
ospi
tal W
aitin
g Li
sts
XX
Not
ifiab
le In
fect
ious
Dis
ease
s D
atab
ase
XX
XX
XX
XX
XX
XX
XX
XG
MS
PB
Dat
abas
e fo
r Prim
ary
Car
eR
eim
burs
emen
tX
XX
XX
XX
Nat
iona
l Can
cer R
egis
tryX
XX
XX
XX
XN
atio
nal I
ntel
lect
ual D
isab
ility
Dat
abas
eX
XX
XX
Nat
iona
l Per
inat
al R
epor
ting
Sys
tem
XX
XX
XX
XX
Nat
iona
l Psy
chia
tric
In-P
atie
nt R
epor
ting
Sys
tem
(NP
IRS
).X
XX
XX
XX
X
Sur
vey
of li
fest
yles
, atti
tude
s an
d nu
tritio
n(S
LÁN
)X
XX
XX
XX
XX
X
Nat
iona
l Bre
ast S
cree
ning
Pro
gram
me
XX
XX
XH
ealth
beh
avio
urs
in s
choo
l-age
d ch
ildre
n(H
BS
C)
XX
XX
XX
X
Civ
il R
egis
try o
f Birt
hs, D
eath
s, a
nd M
arria
ges
XX
XX
XX
XX
Ann
ual r
epor
t of A
n G
arda
Sio
chan
aX
XA
sylu
m M
anag
emen
t Liv
e S
yste
mX
XX
XX
XX
XX
XX
Cen
tral A
utho
rity
for C
hild
Abd
uctio
nIn
form
atio
nX
XX
X
Cen
tral A
utho
rity
for M
aint
enan
ce R
ecov
ery
Info
rmat
ion
XX
XX
X
Civ
il Le
gal A
idX
XX
XX
XX
XX

134
Dat
a so
urce
title
PP
SA
geG
ende
rM
/S33
S/E
33In
com
eG
/C33
P/N
33F/
S33
Dis
-ab
ility
Nat
ion-
ality
R/E
33T/
C33
S/O
33R
/A33
Farm
Crim
inal
Leg
al A
idX
XX
XX
Equ
ality
for W
omen
Mea
sure
of t
he N
DP
2000
-6X
XX
XX
XX
XX
XX
Gar
da C
ompl
aint
s B
oard
XX
Mem
bers
hip
of s
tate
boa
rds
XP
rison
er R
ecor
ds S
yste
mX
XX
XX
XX
XX
XX
XP
ULS
E S
yste
mX
XX
XX
XX
Rec
eptio
n an
d In
tegr
atio
n A
genc
y da
taba
ses
-D
AS
S a
nd L
OC
ATI
ON
SX
XX
XX
XX
X
Sur
vey
on H
ousi
ngX
XX
XX
XS
urve
y on
Par
enta
l Lea
veX
XX
XS
urve
y on
Tra
nspo
rtX
XX
XX
XG
arda
Nat
iona
l Im
mig
ratio
n B
urea
uX
XX
XX
XX
XX
XC
ourts
Tra
ckin
g S
yste
mX
XX
Blin
d P
erso
nX
XX
XX
XX
XX
XX
Dep
enda
nt R
elat
ive
XX
XX
XX
XX
XX
Don
atio
ns to
Sch
ools
XX
XX
XX
XX
XG
ift/In
herit
ance
Tax
Sel
f-Ass
essm
ent R
etur
n(IT
38)
XX
XX
XX
XX
Hea
lth E
xpen
ses
XX
XX
XX
XX
XH
ome
Loan
Inte
rest
XX
XX
XX
XX
XH
omec
arer
cre
dit
XX
XX
XX
XX
XX
Hou
seke
eper
/inca
paci
tate
d ta
xpay
erX
XX
XX
XX
XX
XIn
capa
cita
ted
Chi
ldX
XX
XX
XX
XX
XIn
com
e D
istri
butio
n of
indi
vidu
als
on ta
xre
cord
sX
XX
XX
XX
XX
Inla
nd R
even
ue A
ffida
vit (
CA
24)
XX
XX
XX
XX
Mai
nten
ance
Pay
men
tsX
XX
XX
XX
XX
Med
ical
Insu
ranc
eX
XX
XX
XX
XX
Par
ticul
ars
Del
iver
ed (P
D) F
orm
- S
T21
XP
erm
anen
t Hea
lth B
enef
itX
XX
XX
XX
XX
Qua
rterly
repo
rt of
inflo
ws
and
outfl
ows
to a
ndfro
m P
AYE
reco
rdX
XX
X
Que
stio
nnai
re F
orm
CA
4X
XX
XX
XR
ent R
elie
f - A
ged
Per
sons
XX
XX
XX
XX
XX
XR
ent R
elie
f (no
n-ag
ed p
erso
ns)
XX
XX
XX
XX
XS
ervi
ce C
harg
esX
XX
XX
XX
XX
Tax
Pop
ulat
ion
XX
XX
XX
XTh
ird L
evel
Edu
catio
n Fe
esX
XX
XX
XX
XX
Bac
k to
Edu
catio
n A
llow
ance
XX
XX
XX
XX
XX
Bac
k to
Wor
k A
llow
ance
XX
XX
XX
XX
XX
Bac
k to
Wor
k E
nter
pris
e A
llow
ance
XX
XX
XX
XX
XX
Bas
ic S
uppl
emen
tary
Wel
fare
Allo
wan
ceX
XX
XX
XX
XX
XB
lind
Per
son'
s P
ensi
onX
XX
XX
XX
XX
XA
ll O
ther
Sup
plem
enta
ry W
elfa
re A
llow
ance
XX
XX
XX
XX
XX
Car
er's
Allo
wan
ceX
XX
XX
XX
XX
X
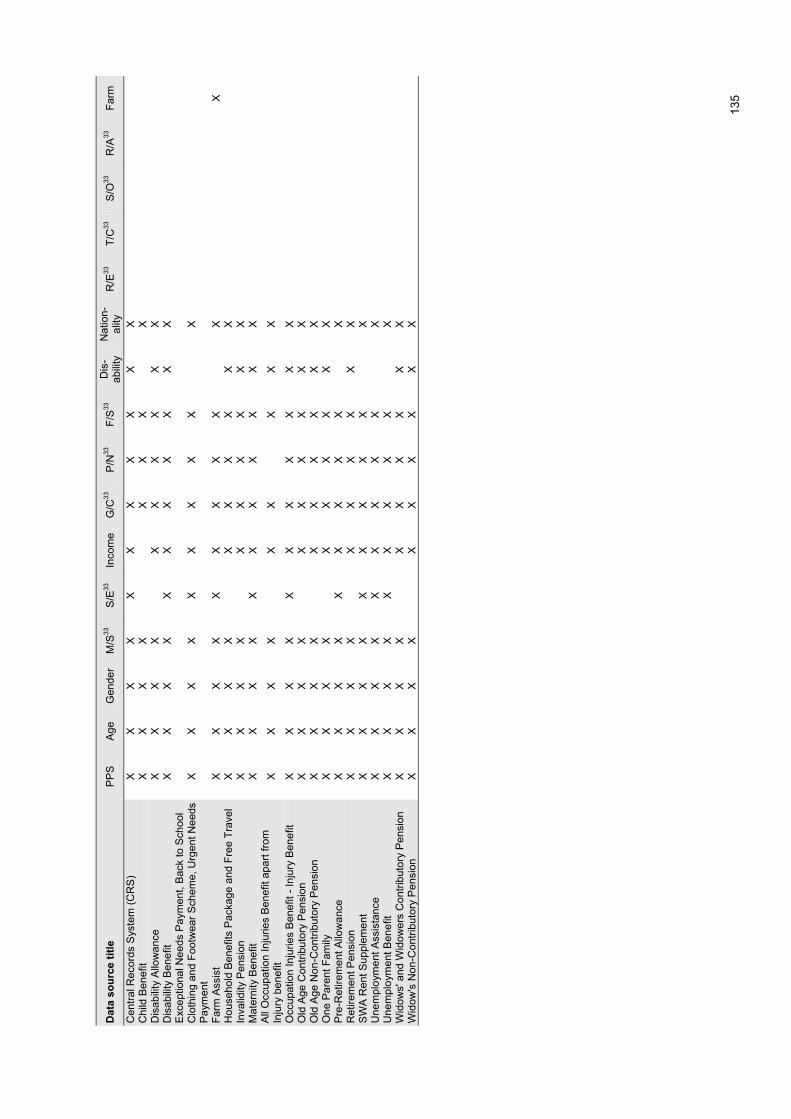
135
Dat
a so
urce
title
PP
SA
geG
ende
rM
/S33
S/E
33In
com
eG
/C33
P/N
33F/
S33
Dis
-ab
ility
Nat
ion-
ality
R/E
33T/
C33
S/O
33R
/A33
Farm
Cen
tral R
ecor
ds S
yste
m (C
RS
)X
XX
XX
XX
XX
XX
Chi
ld B
enef
itX
XX
XX
XX
XD
isab
ility
Allo
wan
ceX
XX
XX
XX
XX
XD
isab
ility
Ben
efit
XX
XX
XX
XX
XX
XE
xcep
tiona
l Nee
ds P
aym
ent,
Bac
k to
Sch
ool
Clo
thin
g an
d Fo
otw
ear S
chem
e, U
rgen
t Nee
dsP
aym
ent
XX
XX
XX
XX
XX
Farm
Ass
ist
XX
XX
XX
XX
XX
XH
ouse
hold
Ben
efits
Pac
kage
and
Fre
e Tr
avel
XX
XX
XX
XX
XX
Inva
lidity
Pen
sion
XX
XX
XX
XX
XX
Mat
erni
ty B
enef
itX
XX
XX
XX
XX
XX
All
Occ
upat
ion
Inju
ries
Ben
efit
apar
t fro
mIn
jury
ben
efit
XX
XX
XX
XX
X
Occ
upat
ion
Inju
ries
Ben
efit
- Inj
ury
Ben
efit
XX
XX
XX
XX
XX
XO
ld A
ge C
ontri
buto
ry P
ensi
onX
XX
XX
XX
XX
XO
ld A
ge N
on-C
ontri
buto
ry P
ensi
onX
XX
XX
XX
XX
XO
ne P
aren
t Fam
ilyX
XX
XX
XX
XX
XP
re-R
etire
men
t Allo
wan
ceX
XX
XX
XX
XX
XR
etire
men
t Pen
sion
XX
XX
XX
XX
XX
SW
A R
ent S
uppl
emen
tX
XX
XX
XX
XX
XU
nem
ploy
men
t Ass
ista
nce
XX
XX
XX
XX
XX
Une
mpl
oym
ent B
enef
itX
XX
XX
XX
XX
XW
idow
s' a
nd W
idow
ers
Con
tribu
tory
Pen
sion
XX
XX
XX
XX
XX
Wid
ow's
Non
-Con
tribu
tory
Pen
sion
XX
XX
XX
XX
XX
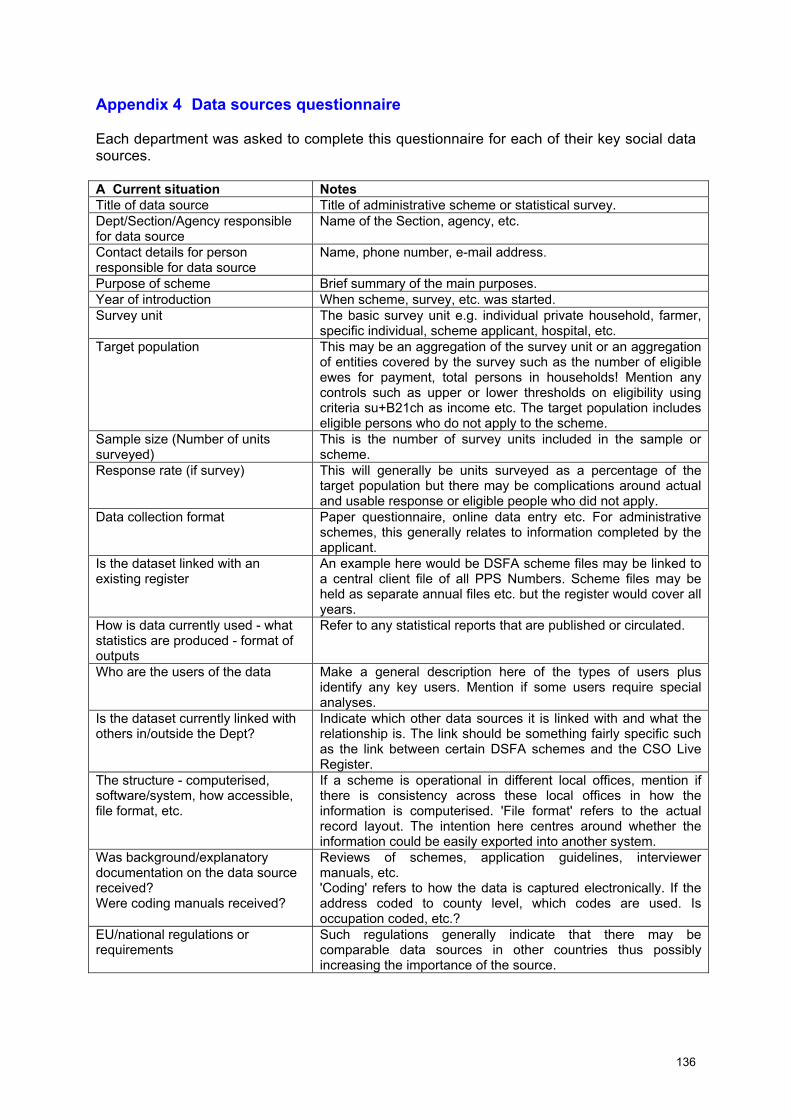
136
Appendix 4 Data sources questionnaire
Each department was asked to complete this questionnaire for each of their key social datasources.
A Current situation NotesTitle of data source Title of administrative scheme or statistical survey.Dept/Section/Agency responsiblefor data source
Name of the Section, agency, etc.
Contact details for personresponsible for data source
Name, phone number, e-mail address.
Purpose of scheme Brief summary of the main purposes.Year of introduction When scheme, survey, etc. was started.Survey unit The basic survey unit e.g. individual private household, farmer,
specific individual, scheme applicant, hospital, etc.Target population This may be an aggregation of the survey unit or an aggregation
of entities covered by the survey such as the number of eligibleewes for payment, total persons in households! Mention anycontrols such as upper or lower thresholds on eligibility usingcriteria su+B21ch as income etc. The target population includeseligible persons who do not apply to the scheme.
Sample size (Number of unitssurveyed)
This is the number of survey units included in the sample orscheme.
Response rate (if survey) This will generally be units surveyed as a percentage of thetarget population but there may be complications around actualand usable response or eligible people who did not apply.
Data collection format Paper questionnaire, online data entry etc. For administrativeschemes, this generally relates to information completed by theapplicant.
Is the dataset linked with anexisting register
An example here would be DSFA scheme files may be linked toa central client file of all PPS Numbers. Scheme files may beheld as separate annual files etc. but the register would cover allyears.
How is data currently used - whatstatistics are produced - format ofoutputs
Refer to any statistical reports that are published or circulated.
Who are the users of the data Make a general description here of the types of users plusidentify any key users. Mention if some users require specialanalyses.
Is the dataset currently linked withothers in/outside the Dept?
Indicate which other data sources it is linked with and what therelationship is. The link should be something fairly specific suchas the link between certain DSFA schemes and the CSO LiveRegister.
The structure - computerised,software/system, how accessible,file format, etc.
If a scheme is operational in different local offices, mention ifthere is consistency across these local offices in how theinformation is computerised. 'File format' refers to the actualrecord layout. The intention here centres around whether theinformation could be easily exported into another system.
Was background/explanatorydocumentation on the data sourcereceived?Were coding manuals received?
Reviews of schemes, application guidelines, interviewermanuals, etc.'Coding' refers to how the data is captured electronically. If theaddress coded to county level, which codes are used. Isoccupation coded, etc.?
EU/national regulations orrequirements
Such regulations generally indicate that there may becomparable data sources in other countries thus possiblyincreasing the importance of the source.

137
B Classification variables The variables on the dataset - how they are collected, coded,are they stored electronically?Mention below if any of these classification variables arecollected and not computerised. Mention also if the variable isbadly completed or if it is often left blank. [NOTE: Coding manualshould be supplied to CSO]
Title of data source Title of administrative scheme or statistical survey.Use of PPS Number State whether the PPS Number is collected, what the
completion/quality is like and whether a formal legal agreementexists to allow use of the PPS Number.
Use of other unique identifier The identifier should be common across either files for differentperiods of the same scheme (longitudinal) or across schemes.An example is the Department of Agriculture herd number.Describe who generates the reference number and who thevarious users of it are.
Age/DOB Describe the format age is held in and when it is captured. Forexample, is it coded as date of birth, or the age a person waswhen they applied to a scheme or an age-group range or thatthey qualify on age grounds for a scheme (over 65). Date of birthis the preferred format as it allows age to be generated on anongoing basis and can assist in matching individuals.
Gender Describe the format gender is held in and the coding system. Forexample, female=F and male=M. Mention if gender is not codedbut can be deduced from the name of the person or the natureof the scheme.
Marital Status Describe whether this information is collected and what answeroptions are allowed.
Socio-economic status Mention if socio-economic status or group is collected andwhether there are guidelines defining the individual categoriese.g. skilled manual workers versus non-skilled manual workers.
Income Describe the question asked, how income is defined, whatperiod any income figures relate to (per week, the year prior toapplication to a scheme, etc.). Is this information updated onregular basis. Is it in punts or euro?
Geography Is geography hard-coded or only derivable indirectly through thetext information in a person's address. If coded, to what level(county, townland, urban/rural, etc.). Mention how these areasare defined e.g. urban versus rural and give copies of the codingsystems to the teams. Mention if the information captured refersto somewhere other than main residence e.g. workplace ortemporary/weekday residence. Mention also if therecorded/coded address represents the postal address or thegrid reference address e.g. some households use a postaladdress of a neighbouring county.
Phone Number If this is recorded, describe the format e.g. is area code askedfor?
Family Status Family status refers to whether a person has dependent childrenor has primary responsibility for an adult with a disability, whorequires a high degree of support and attention.
Disability Are disabled persons identified, i.e. persons having a total orpartial absence of bodily or mental facilities, chronic disease,learning and personality disorders.
Nationality Based on either country of birth or citizenship. Mention if thenationality is described e.g. Ireland or coded.
Race/Ethnicity Includes race, colour and ethnic origin. Indicate which, if any, ofthese categories are recorded and how they are defined.
Membership of TravellerCommunity
Mention if travellers are identified, include those living inpermanent accommodation.
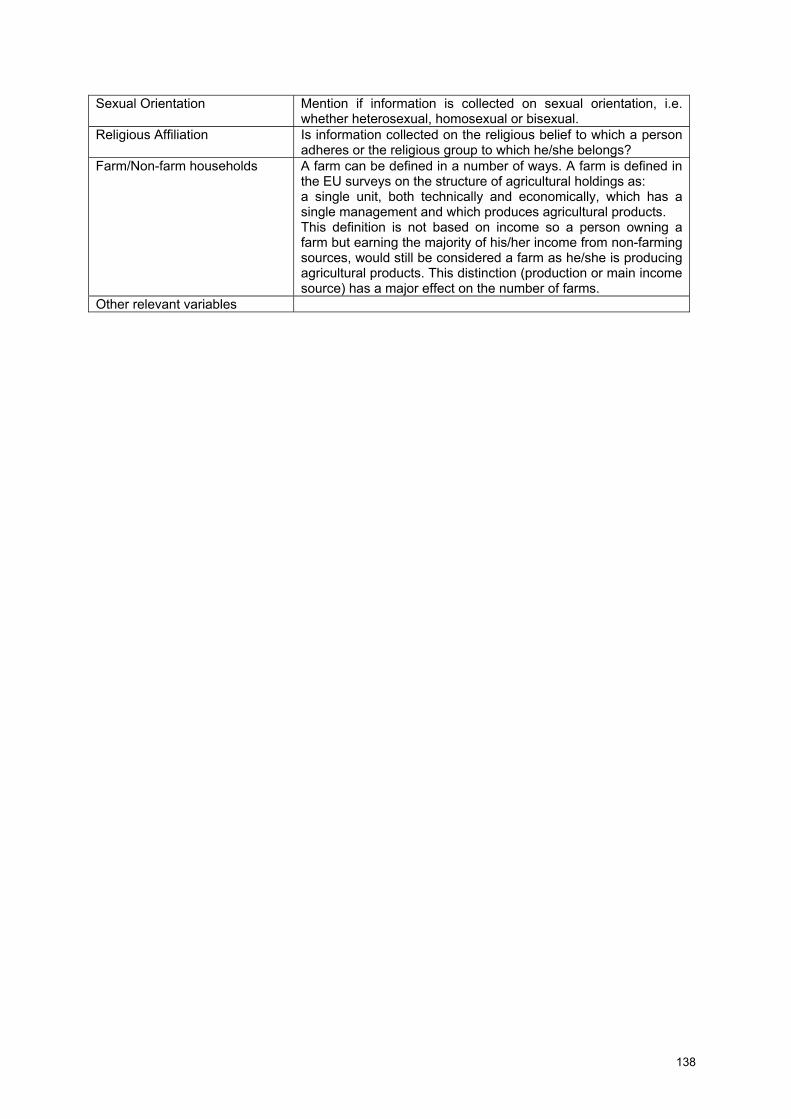
138
Sexual Orientation Mention if information is collected on sexual orientation, i.e.whether heterosexual, homosexual or bisexual.
Religious Affiliation Is information collected on the religious belief to which a personadheres or the religious group to which he/she belongs?
Farm/Non-farm households A farm can be defined in a number of ways. A farm is defined inthe EU surveys on the structure of agricultural holdings as:a single unit, both technically and economically, which has asingle management and which produces agricultural products.This definition is not based on income so a person owning afarm but earning the majority of his/her income from non-farmingsources, would still be considered a farm as he/she is producingagricultural products. This distinction (production or main incomesource) has a major effect on the number of farms.
Other relevant variables
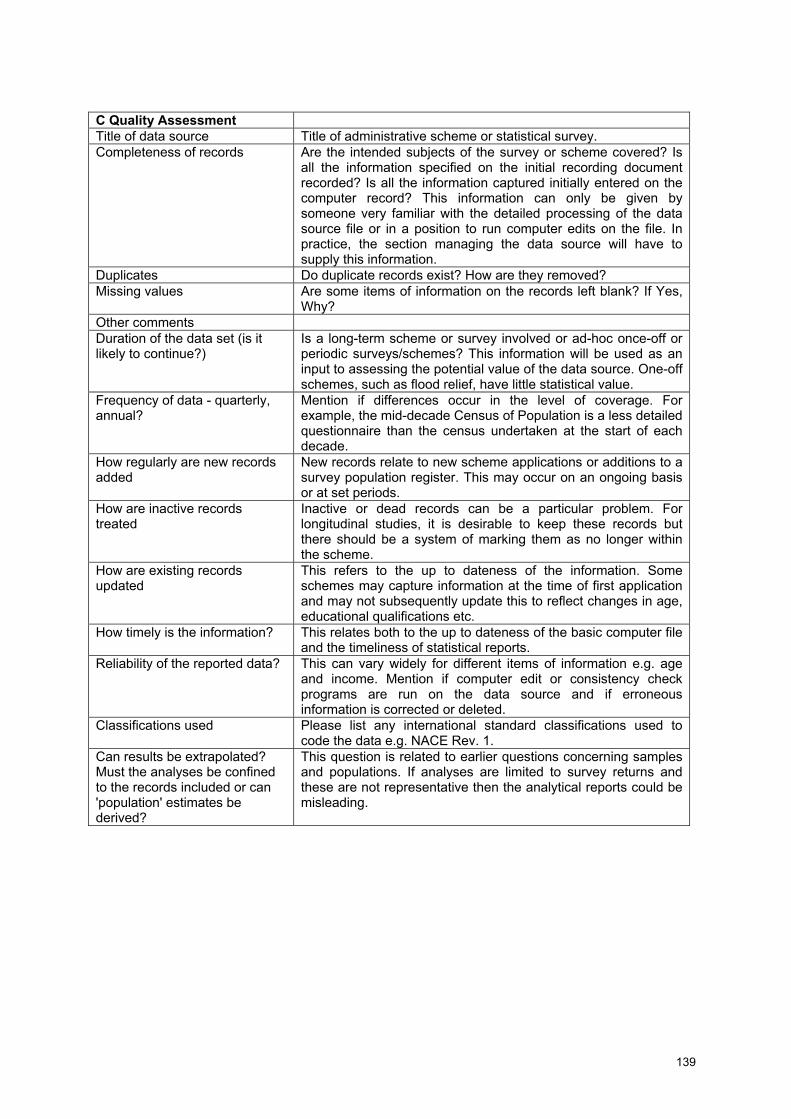
139
C Quality AssessmentTitle of data source Title of administrative scheme or statistical survey.Completeness of records Are the intended subjects of the survey or scheme covered? Is
all the information specified on the initial recording documentrecorded? Is all the information captured initially entered on thecomputer record? This information can only be given bysomeone very familiar with the detailed processing of the datasource file or in a position to run computer edits on the file. Inpractice, the section managing the data source will have tosupply this information.
Duplicates Do duplicate records exist? How are they removed?Missing values Are some items of information on the records left blank? If Yes,
Why?Other commentsDuration of the data set (is itlikely to continue?)
Is a long-term scheme or survey involved or ad-hoc once-off orperiodic surveys/schemes? This information will be used as aninput to assessing the potential value of the data source. One-offschemes, such as flood relief, have little statistical value.
Frequency of data - quarterly,annual?
Mention if differences occur in the level of coverage. Forexample, the mid-decade Census of Population is a less detailedquestionnaire than the census undertaken at the start of eachdecade.
How regularly are new recordsadded
New records relate to new scheme applications or additions to asurvey population register. This may occur on an ongoing basisor at set periods.
How are inactive recordstreated
Inactive or dead records can be a particular problem. Forlongitudinal studies, it is desirable to keep these records butthere should be a system of marking them as no longer withinthe scheme.
How are existing recordsupdated
This refers to the up to dateness of the information. Someschemes may capture information at the time of first applicationand may not subsequently update this to reflect changes in age,educational qualifications etc.
How timely is the information? This relates both to the up to dateness of the basic computer fileand the timeliness of statistical reports.
Reliability of the reported data? This can vary widely for different items of information e.g. ageand income. Mention if computer edit or consistency checkprograms are run on the data source and if erroneousinformation is corrected or deleted.
Classifications used Please list any international standard classifications used tocode the data e.g. NACE Rev. 1.
Can results be extrapolated?Must the analyses be confinedto the records included or can'population' estimates bederived?
This question is related to earlier questions concerning samplesand populations. If analyses are limited to survey returns andthese are not representative then the analytical reports could bemisleading.

140
D Future potential The items in D are FOR COMPLETION BY CSOData source code This code is generated by CSO and will be used to link
different excel spreadsheets.Title of data source Title of administrative scheme or statistical survey.Can useful additional informationbe produced from the existing datafor internal or external use?
This item refers to whether more complex analyses could beundertaken than those currently published. These analysesmay require more complex programming or involve mergingdata sources relating to different years to undertake alongitudinal analysis.
Are useful linkages possiblebetween the existing data sets andother data holdings either internalor external?
This partially relates to cross-cutting issues. For example,would it be useful to link the data source with one fromanother department such as educational qualifications or tolink data sources on a thematic basis across and withindepartments such as those related to disability.
How can the data sets be adaptedto enhance their usefulness forstatistics e.g. standardclassifications, additional variables,unique identifiers to enable cross-linkages, etc ? There is need forclear demonstration of what resultscan be achieved and who will usethem?
The use of standard classifications has a number ofadvantages: a centralised body such as the CSO may undertake all thework involved in compiling the classification/coding system; output tables can be produced using categories that areconsistent with other reports e.g. age groups.Mention any data sources or variables that you know wouldadd value to the data source e.g. nationality of parents ofnew babies.
Is there a potential use forenhancing CSO statisticalcompilation
This item relates to the value of the data source to existingCSO surveys. For example, information that would improvethe compilation of the National Accounts or Balance ofPayments.

141
Appendix 5 Age coding in selected data sources
Coding Datasources
1 Date of birth 51
2 Age in years 2
3 Year of birth 2
4 Year and month of birth 3
5
6
7
8
9
Age bands Child / Adult.
< 14,14 - 16,17 – 20, 21+.
15 - 24, 25 - 34, 35 - 49, 50 - 64, 64+.
< 40, 40 - 64, 65 - 69, 70 - 74, 75 - 79, 80 - 84, 85+.
Over 65.
2
1
2
1
1
Total 65
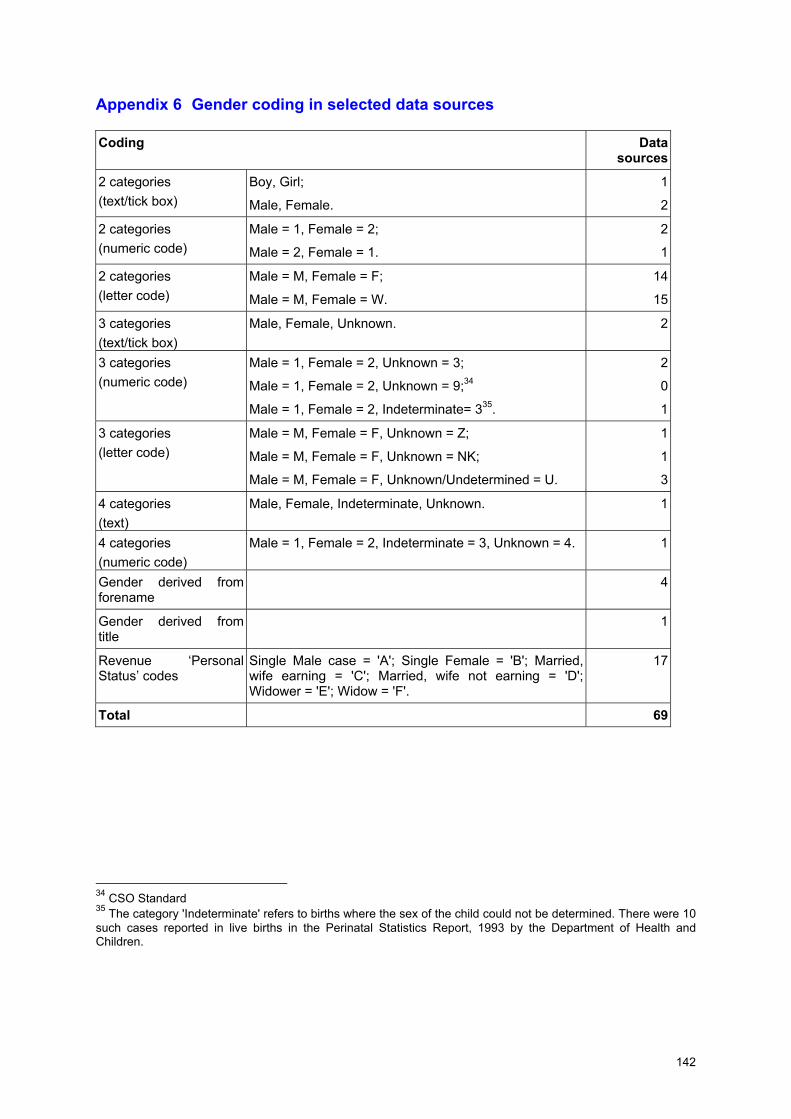
142
Appendix 6 Gender coding in selected data sources
Coding Datasources
2 categories(text/tick box)
Boy, Girl;
Male, Female.
1
2
2 categories(numeric code)
Male = 1, Female = 2;
Male = 2, Female = 1.
2
1
2 categories(letter code)
Male = M, Female = F;
Male = M, Female = W.
14
15
3 categories(text/tick box)
Male, Female, Unknown. 2
3 categories(numeric code)
Male = 1, Female = 2, Unknown = 3;
Male = 1, Female = 2, Unknown = 9;34
Male = 1, Female = 2, Indeterminate= 335.
2
0
1
3 categories(letter code)
Male = M, Female = F, Unknown = Z;
Male = M, Female = F, Unknown = NK;
Male = M, Female = F, Unknown/Undetermined = U.
1
1
3
4 categories(text)
Male, Female, Indeterminate, Unknown. 1
4 categories(numeric code)
Male = 1, Female = 2, Indeterminate = 3, Unknown = 4. 1
Gender derived fromforename
4
Gender derived fromtitle
1
Revenue ‘PersonalStatus’ codes
Single Male case = 'A'; Single Female = 'B'; Married,wife earning = 'C'; Married, wife not earning = 'D';Widower = 'E'; Widow = 'F'.
17
Total 69
34 CSO Standard35 The category 'Indeterminate' refers to births where the sex of the child could not be determined. There were 10such cases reported in live births in the Perinatal Statistics Report, 1993 by the Department of Health andChildren.
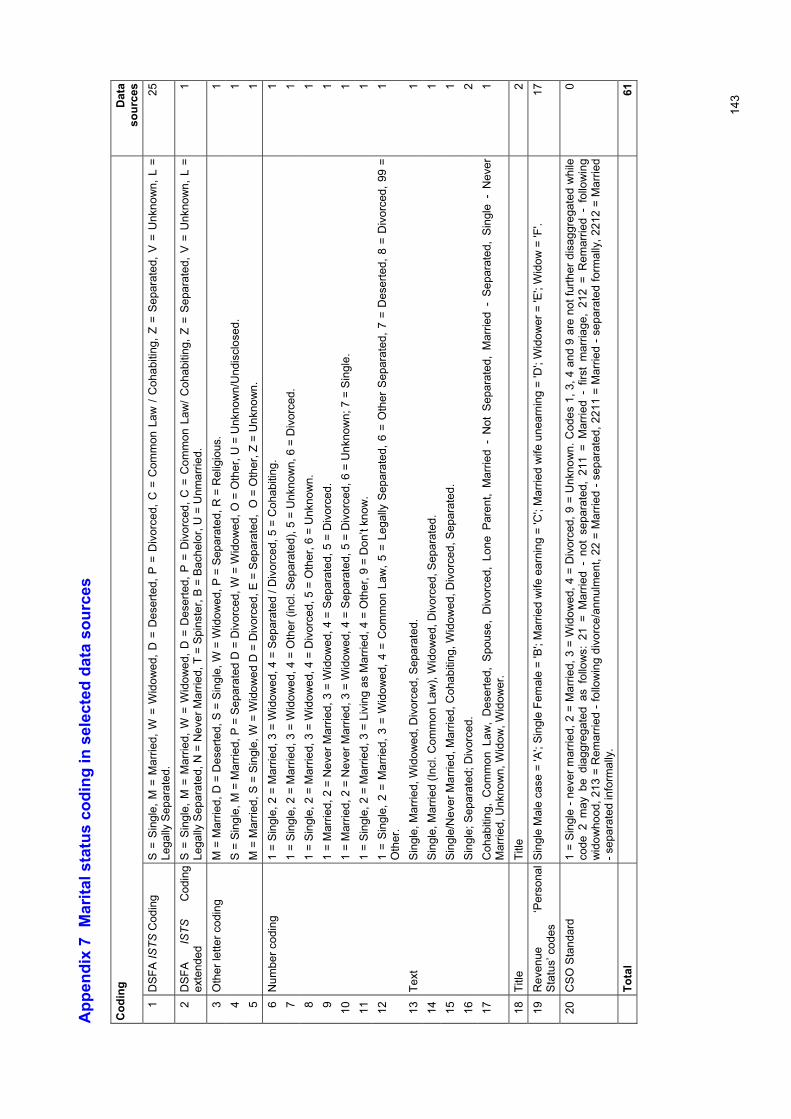
143
App
endi
x 7
Mar
ital s
tatu
s co
ding
in s
elec
ted
data
sou
rces
Cod
ing
Dat
aso
urce
s1
DSF
A IS
TS C
odin
gS
= S
ingl
e, M
= M
arrie
d, W
= W
idow
ed, D
= D
eser
ted,
P =
Div
orce
d, C
= C
omm
on L
aw /
Coh
abiti
ng, Z
= S
epar
ated
, V =
Unk
now
n, L
=Le
gally
Sep
arat
ed.
25
2D
SFA
IS
TS
Cod
ing
exte
nded
S =
Sin
gle,
M =
Mar
ried,
W =
Wid
owed
, D =
Des
erte
d, P
= D
ivor
ced,
C =
Com
mon
Law
/ Coh
abiti
ng, Z
= S
epar
ated
, V =
Unk
now
n, L
=Le
gally
Sep
arat
ed, N
= N
ever
Mar
ried,
T =
Spi
nste
r, B
= B
ache
lor,
U =
Unm
arrie
d.1
3O
ther
lette
r cod
ing
M =
Mar
ried,
D =
Des
erte
d, S
= S
ingl
e, W
= W
idow
ed, P
= S
epar
ated
, R =
Rel
igio
us.
14
S =
Sin
gle,
M =
Mar
ried,
P =
Sep
arat
ed D
= D
ivor
ced,
W =
Wid
owed
, O =
Oth
er, U
= U
nkno
wn/
Und
iscl
osed
.1
5M
= M
arrie
d, S
= S
ingl
e, W
= W
idow
ed D
= D
ivor
ced,
E =
Sep
arat
ed,
O =
Oth
er, Z
= U
nkno
wn.
1
6N
umbe
r cod
ing
1 =
Sin
gle,
2 =
Mar
ried,
3 =
Wid
owed
, 4 =
Sep
arat
ed /
Div
orce
d, 5
= C
ohab
iting
.1
71
= S
ingl
e, 2
= M
arrie
d, 3
= W
idow
ed, 4
= O
ther
(inc
l. S
epar
ated
), 5
= U
nkno
wn,
6 =
Div
orce
d.1
81
= S
ingl
e, 2
= M
arrie
d, 3
= W
idow
ed, 4
= D
ivor
ced,
5 =
Oth
er, 6
= U
nkno
wn.
19
1 =
Mar
ried,
2 =
Nev
er M
arrie
d, 3
= W
idow
ed, 4
= S
epar
ated
, 5 =
Div
orce
d.1
101
= M
arrie
d, 2
= N
ever
Mar
ried,
3 =
Wid
owed
, 4 =
Sep
arat
ed, 5
= D
ivor
ced,
6 =
Unk
now
n; 7
= S
ingl
e.1
111
= S
ingl
e, 2
= M
arrie
d, 3
= L
ivin
g as
Mar
ried,
4 =
Oth
er, 9
= D
on’t
know
.1
121
= S
ingl
e, 2
= M
arrie
d, 3
= W
idow
ed, 4
= C
omm
on L
aw, 5
= L
egal
ly S
epar
ated
, 6 =
Oth
er S
epar
ated
, 7 =
Des
erte
d, 8
= D
ivor
ced,
99
=O
ther
.1
13Te
xtS
ingl
e, M
arrie
d, W
idow
ed, D
ivor
ced,
Sep
arat
ed.
114
Sin
gle,
Mar
ried
(Incl
. Com
mon
Law
), W
idow
ed, D
ivor
ced,
Sep
arat
ed.
115
Sin
gle/
Nev
er M
arrie
d, M
arrie
d, C
ohab
iting
, Wid
owed
, Div
orce
d, S
epar
ated
.1
16S
ingl
e; S
epar
ated
; Div
orce
d.2
17C
ohab
iting
, C
omm
on L
aw,
Des
erte
d, S
pous
e, D
ivor
ced,
Lon
e P
aren
t, M
arrie
d -
Not
Sep
arat
ed,
Mar
ried
- S
epar
ated
, Si
ngle
- N
ever
Mar
ried,
Unk
now
n, W
idow
, Wid
ower
.1
18Ti
tleTi
tle2
19R
even
ue
‘Per
sona
lS
tatu
s’ c
odes
Sin
gle
Mal
e ca
se =
'A';
Sing
le F
emal
e =
'B';
Mar
ried
wife
ear
ning
= 'C
'; M
arrie
d w
ife u
near
ning
= 'D
'; W
idow
er =
'E';
Wid
ow =
'F'.
17
20C
SO
Sta
ndar
d1
= S
ingl
e - n
ever
mar
ried,
2 =
Mar
ried,
3 =
Wid
owed
, 4 =
Div
orce
d, 9
= U
nkno
wn.
Cod
es 1
, 3, 4
and
9 a
re n
ot fu
rther
dis
aggr
egat
ed w
hile
code
2 m
ay b
e di
aggr
egat
ed a
s fo
llow
s: 2
1 =
Mar
ried
- no
t se
para
ted,
211
= M
arrie
d -
first
mar
riage
, 21
2 =
Rem
arrie
d -
follo
win
gw
idow
hood
, 213
= R
emar
ried
- fol
low
ing
divo
rce/
annu
lmen
t, 22
= M
arrie
d - s
epar
ated
, 221
1 =
Mar
ried
- sep
arat
ed fo
rmal
ly, 2
212
= M
arrie
d- s
epar
ated
info
rmal
ly.
0
Tota
l61

144
Appendix 8 Nationality coding in selected data sources
Coding Data sources
1 ISO 3166Flat classification consisting of 239 categories. Countries are assigned a twoletter code.
2
2 CSO standardClassification of countries based on the ISO-3166-1:1997. It is essentially aflat classification, but it includes a hierarchical element, whichaccommodates the constituent parts of the United Kingdom. There are 249categories in total in this classification. These categories consist of the 239ISO-3166 categories plus 10 additional categories broken down as follows: Two residual categories; Three categories for Guernsey, Jersey and the Isle of Man; Five sub-categories for the constituent parts of the United Kingdom.
0
3 Census of PopulationCSO standard classification of countries + 11 additional nationalitycategories.
1
4 GROFlat classification with 242 categories. Countries are listed in alphabeticalorder and assigned a number from 1-244 (101 and 102 are excluded). Thelist of countries excludes four countries listed in ISO-3166, and includes fiveadditional categories for the Channel Islands and the constituent parts of theUnited Kingdom. There is one residual category. This classification alsocontains two separate codes for Ireland and Éire.
1
5 ESRI codes – 10 categories, Ireland, Britain, and continents. 16 DES country codes - 3 digit numeric codes. 17 DSFA ISTS/CRS
38 categories – 37 country codes and one residual category.28
8 Irish / British / Other EU / Non-EU. 1
9 National / Non-national. 2
Total 37

145
Appendix 9 CSO Classifications and Standards Section
The Central Statistics Office has a statutory role to play in the co-ordination of officialstatistics in Ireland. In particular, it has the authority to ensure that appropriate standardclassifications are used for this purpose. To this end, the Statistics Act 1993, 10(2), statesthat ’The Office (viz. Central Statistics Office) shall have authority to co-ordinate officialstatistics compiled by public authorities to ensure, in particular, adherence to statisticalstandards and the use of appropriate classifications.’
A classification is a useful tool for anyone developing statistical surveys. It is a frameworkwhich both simplifies the topic being studied and makes it easy to categorise all data orresponses received. A classification consists of codes and descriptors and allows surveyresponses to be put into meaningful categories in order to produce useful data.
It is generally accepted that a standard classification will usually meet a number of mainrequirements that are outlined below.
Requirement DescriptionMutually exclusivecategories
Each survey response should fit into only one category in theclassification.
Exhaustive categories All survey responses need to fit into the classificationstructure somewhere.
Precise and meaningfuldescriptors for categories
The content of each category in the classification should beclearly defined.
Conceptually sound The classification should have a conceptual basis and alogical structure.
Statistically balanced In general, survey responses should not fall heavily into onecategory and sparsely into the other categories.
Operationally feasible There is no point in having a classification that cannot beimplemented in practice.
Statistically robust The classification should be able to be used for a number ofyears without revision.
Internationally comparable The classification should be comparable with anyinternational standard classification.
While many international standards exist, it is often necessary for individual NationalStatistical Institutes to adapt or modify these in order to cater for the needs of their owncountry or region. In Ireland, within the Central Statistics Office, a standard classification isone that has been approved by the Classifications Board as the official classification to beused for collecting, processing and outputting data on a particular topic. These standards aredeveloped following extensive research of the topic in close consultation with stakeholders.

146
Benefits of Standard Classifications
1. Data integration: The use of statistical standards allows the integration of data from avariety of sources and between different periods of time.
2. Improved survey efficiency: Using standard classifications reduces the resources andtime requirements associated with many aspects of survey development and maintenance.They assist in planning new survey developments and in reviews of existing surveys. Once astandard exists, it can be used in new surveys, thus eliminating the need to create afreshthe conceptual definitions, code-files and coding rules that comprise the standard.
3. Meeting user requirements: Standard classifications are created in close consultationwith stakeholders who are involved in developing statistical surveys. This ensures thatclassifications used to collect data in surveys will meet users’ needs.
4. Data comparability: Standard classifications ensure that data is comparable over timeand between different surveys, as they can be used to provide a link between differentdatasets.
5. Efficient use of resources: The use of standard code structures simplifies dataprocessing and means only one version of the code numbers needs to be stored. Greateruse of standard classifications increases and thus enriches the data produced by the Office.
6. More reliable statistics: The use of standard classifications gives reason for increasedconfidence in the reliability of statistics.
CSO standard classifications
The CSO Standard Sex Classification is a classification of sex based on the biologicaldifference between male and female. This classification was approved by the CSOClassifications Board on June 12th, 2002. It is used within the CSO by the followingsections: Census of Population, Household Budget Survey, Quarterly Industry, QuarterlyNational Household Survey, Tourism and Travel Section and Vital Statistics Section.
The CSO Standard Marital Status Classification is a four-level classification of marital statusbased on the marriage laws or customs of Ireland. This classification was approved by theCSO Classifications Board on June 12th, 2002. This classification will be used by theQuarterly National Household Survey (QNHS), Household Budget Survey (HBS), andCensus of Population Surveys. It has links with the EU SILC Marital Status Classificationand the General Registration Office (GRO) Marital Status Classification.
The CSO Standard Country Classification is a classification of countries based on the ISO-3166-1 (1997). The ISO 3166-1 is an international classification developed by theInternational Standards Organisation (ISO), and based on a listing of country categoriesmaintained by the United Nations Statistics Division. It must be reviewed at no longer than 5-year intervals and updates are made available on the Internet. It is essentially a flatclassification, but it includes a hierarchical element to accommodate the constituent parts ofthe United Kingdom. There are 249 categories in the classification in total. This classificationwas approved by the CSO Classifications Board on May 6th, 2003 and will be adopted bythe following areas in the CSO: Annual Services Inquiry, Balance Of Payments, BusinessRegister, Census of Industrial Production, Census Of Population, Data Office, EU-SILC,Quarterly National Household Survey, Tourism, Transport and Trade.

147
The CSO Standard Classification of Industrial Activity, NACE Rev.1.1, is a statisticalclassification of economic activities (General Industrial Classification of Economic Activitieswithin the European Communities). NACE Rev.1.1 is designed to allow comparisons ofeconomic activities at national, European and global levels. On January 1st, 2003 NACERev.1.1 became an official CSO standard classification. The following is a list of theclassifications with official links to NACE Rev.1.1:
♦ ISIC Rev.3.1 (International Standard Industrial Classification of All EconomicActivities, Third Revision);
♦ CPA (Statistical Classification of Products by Activity in the European EconomicCommunity);
♦ NACE 70 (General Industrial Classification of Economic Activities within theEuropean Communities, NACE 70);
♦ CPC (Central Product Classification);
♦ HS (Harmonised System);
♦ CN (Combined Nomenclature); and
♦ PRODCOM (The List of Products of the European Community).

148
Appendix 10 UN fundamental principles of official statistics
The Economic Commission for Europe36
Bearing in mind that official statistical information is an essential basis for development in theeconomic, demographic, social and environmental fields and for mutual knowledge andtrade among the States and peoples of the world.
Bearing in mind that the essential trust of the public in official statistical information dependsto a large extent on respect for the fundamental values and principles which are the basis ofany society which seeks to understand itself and to respect the rights of its members.
Bearing in mind that the quality of official statistics, and thus the quality of the informationavailable to the Government, the economy and the public depends largely on the co-operation of citizens, enterprises, and other respondents in providing appropriate dataneeded for necessary statistical compilations.
Recalling the general provisions and standards adopted to this end by the EuropeanConvention on Human Rights, the Convention of the Council of Europe of 28 January 1991for the Protection of Individuals with regard to automatic processing of personal data, theFinal Act of the Helsinki Conference on Security and Co-Operation in Europe and theCharter of Paris for a New Europe,
Recalling the efforts of governmental and non-governmental organisations active in statisticsto establish standards and concepts to allow comparisons among countries:
Recalling also the International Statistical Institute Declaration of Professional Ethics,
Having taken cognisance of the consensus reached within the Conference of EuropeanStatisticians on the need to define the principles governing the activities of the officialstatistical agencies in the region and in the member States,
Adopts the present resolution:
Principle 1: Official statistics provide an indispensable element in the information system ofa society, serving the government, the economy and the public with data about theeconomic, demographic, social and environmental situation. To this end, official statisticsthat meet the test of practical utility are to be compiled and made available on an impartialbasis by official statistical agencies to honour citizens’ entitlement to public information.
Principle 2: To retain trust in official statistics, the statistical agencies need to decideaccording to strictly professional considerations, including scientific principles andprofessional ethics, on the methods and procedures for the collection, processing, storageand presentation of statistical data.
Principle 3: To facilitate a correct interpretation of the data, the statistical agencies are topresent information according to scientific standards on the sources, methods andprocedures of the statistics.
Principle 4: The statistical agencies are entitled to comment on erroneous interpretation andmisuse of statistics.
36 Decision C(47) adopted by the Economic Commission for Europe at its April 1992 session.

149
Principle 5: Data for statistical purposes may be drawn from all types of sources, be theystatistical surveys or administrative records. Statistical agencies are to choose the sourcewith regard to quality, timeliness, costs and the burden on respondents.
Principle 6: Individual data collected by statistical agencies for statistical compilation,whether they refer to natural or legal persons, are to be strictly confidential and usedexclusively for statistical purposes.
Principle 7: The laws, regulations and measures under which the statistical systems operateare to be made public.
Principle 8: Co-ordination among statistical agencies within countries is essential to achieveconsistency and efficiency in the statistical system.
Principle 9: The use by statistical agencies in each country of international concepts,classifications and methods promotes the consistency and efficiency of statistical systems atall official levels.
Principle 10: Bilateral and multilateral co-operation in statistics contributes to theimprovement of systems of official statistics in all countries.
The conference of European Statisticians, at intervals of not more than three years, willdiscuss these principles, consider ways to contribute to their application and report to theCommission.