An Evaluation of the Groundwater Microbial Community's ...
85
Louisiana State University LSU Digital Commons LSU Master's eses Graduate School 1-6-2018 An Evaluation of the Groundwater Microbial Community's Toluene Biogenesis Potential at a Site in Southeast Louisiana Michael A. Griffin Jr. Louisiana State University and Agricultural and Mechanical College, [email protected] Follow this and additional works at: hps://digitalcommons.lsu.edu/gradschool_theses Part of the Environmental Engineering Commons is esis is brought to you for free and open access by the Graduate School at LSU Digital Commons. It has been accepted for inclusion in LSU Master's eses by an authorized graduate school editor of LSU Digital Commons. For more information, please contact [email protected]. Recommended Citation Griffin, Michael A. Jr., "An Evaluation of the Groundwater Microbial Community's Toluene Biogenesis Potential at a Site in Southeast Louisiana" (2018). LSU Master's eses. 4369. hps://digitalcommons.lsu.edu/gradschool_theses/4369
Transcript of An Evaluation of the Groundwater Microbial Community's ...

Louisiana State UniversityLSU Digital Commons
LSU Master's Theses Graduate School
1-6-2018
An Evaluation of the Groundwater MicrobialCommunity's Toluene Biogenesis Potential at a Sitein Southeast LouisianaMichael A. Griffin Jr.Louisiana State University and Agricultural and Mechanical College, [email protected]
Follow this and additional works at: https://digitalcommons.lsu.edu/gradschool_theses
Part of the Environmental Engineering Commons
This Thesis is brought to you for free and open access by the Graduate School at LSU Digital Commons. It has been accepted for inclusion in LSUMaster's Theses by an authorized graduate school editor of LSU Digital Commons. For more information, please contact [email protected].
Recommended CitationGriffin, Michael A. Jr., "An Evaluation of the Groundwater Microbial Community's Toluene Biogenesis Potential at a Site in SoutheastLouisiana" (2018). LSU Master's Theses. 4369.https://digitalcommons.lsu.edu/gradschool_theses/4369

AN EVALUATION OF THE GROUNDWATER MICROBIAL
COMMUNITY’S TOLUENE BIOGENESIS POTENTIAL AT A
SITE IN SOUTHEAST LOUISIANA
A Thesis
Submitted to the Graduate Faculty of the
Louisiana State University and
Agricultural and Mechanical College
in partial fulfillment of the
requirements of the degree of
Master of Science in Civil Engineering
in
The Department of Civil and Environmental Engineering
by
Michael Aaron Griffin Jr.
B.S, Louisiana State University, 2015
May 2018

ii
ACKNOWLEDGEMENTS
I would like to sincerely thank my advisor, Dr. William M. Moe, for his guidance and
support in completing this thesis. I would also like to thank him for his mentorship during both
my undergraduate and graduate studies. Special thanks to Trent Key for his indispensable advice
and technical assistance in helping me establish better laboratory techniques.
The work described in this thesis was financially supported by a consortium of
petrochemical companies as well as the state of Louisiana Governor's Biotechnology Initiative.
Finally, I would like to thank my life partner and mother of my children, Tabitha Vu,
without whose vast intellect and endless support none of this would have been possible.

iii
TABLE OF CONTENTS
AKNOWLEDGEMENTS……………………………………………………………………..
ABSTRACT…………………………………………………………………………………...
1. INTRODUCTION…………………………..……………………………………………....
1.1 Objectives and Approach………………………………………….…………………….
1.2 Thesis Organization……………………………………………….…………………….
2. LITERATURE REVIEW…………………………………………………………………...
2.1 Overview of Toluene’s Industrial Use, Health Hazards, and Environmental
Regulations….…………………………………………………………………………
2.2 Biological Toluene Production………………………………………………………….
2.3 Detailed Description of the Genus Tolumonus………………………………………….
2.4 Biological Toluene Degradation………………………………………………………..
3. STUDIES AIMED AT UNDERSTANDING THE POTENTIAL FOR
BIOLOGICALLY-MEDIATED TOLUENE FORMATION…………………………...
3.1 Site Location and Background………………………………………………………….
3.2 Site Monitoring Data……………………………………………………………………
3.3 Experimental Methods…………………………………………………………………..
3.4 Results and Discussion…………………………………………………………………
4. OVERALL CONCLUSIONS AND RECOMMENDATIONS FOR FUTURE
RESEARCH……...……………………………………………………………………….
5. REFERENCES………………………………………………………………………….…..
APPENDIX A: PROTOCOL FOR PREPARATION OF MEDIUM…………………………
APPENDIX B: GROUNDWATER CONTAMINANT AND GEOCHEMISTRY DATA……
APPENDIX C: COPYRIGHTS CLEARANCE AND PERMISSION STATEMENTS..……..
VITA…………………………………………………………………………………………...
ii
iv
1
1
2
3
3
4
10
15
26
26
27
28
34
52
54
60
67
73
79

iv
ABSTRACT
The broad goal of the research described in this thesis was to better understand the potential
for biological toluene production to occur in groundwater at a Superfund Site located in southeast
Louisiana. Previous literature reported that bacterial isolates under laboratory test conditions and
undefined microbial communities in anaerobic sludge digesters and seasonally stratified lakes can
produce toluene biogenically. Most of the research reported on this subject previously, however,
has been on systems in Europe and little research has been reported previously on such phenomena
in North America.
In the research described here, studies were conducted utilizing groundwater from a
Superfund site employing an enhanced bioremediation strategy to reductively dehalogenate
chlorinated solvents. When incubated at ambient room temperature (~22˚C) and provided glucose
and either phenylalanine or phenylacetic acid, microbial communities originating from the
groundwater displayed the ability to biogenically produce toluene. When provided with 0.8 mM
(132 mg/L) phenylalanine, cultures grown in liquid media accumulated toluene to aqueous-phase
concentrations 0.44 mM to 0.54 mM of toluene, 41 mg/L and 50 mg/L respectively, in less than
30 days. In experiments in which an enrichment culture derived from site groundwater was
supplied with either phenylacetic acid or phenylalanine at concentrations ranging from 0-400 mg/L
(0-2.42 mM and 0-2.94 mM respectively), there was a high correlation between toluene
accumulated at the end of a 28-day incubation period and the concentration of phenyl-containing
precursor supplied. The observed toluene yield was 0.52 moles toluene produced per mole
phenylacetic acid supplied and 0.575 moles toluene produced per mole phenylalanine supplied.
The toluene-producing capabilities of the enrichment cultures were maintained during propagation
through four sequential transfers and after long-term (~15 months) storage at 4°C.

v
The finding that groundwater microbial communities in areas undergoing enhanced
bioremediation to treat chlorinated solvent contamination can produce toluene at levels in excess
of drinking water standards has important implications for the field of bioremediation. Further
research is necessary to identify how widespread biogenic toluene production is in areas
undergoing enhanced remediation. Further research is also required to identify the microbes
responsible for toluene production.
1
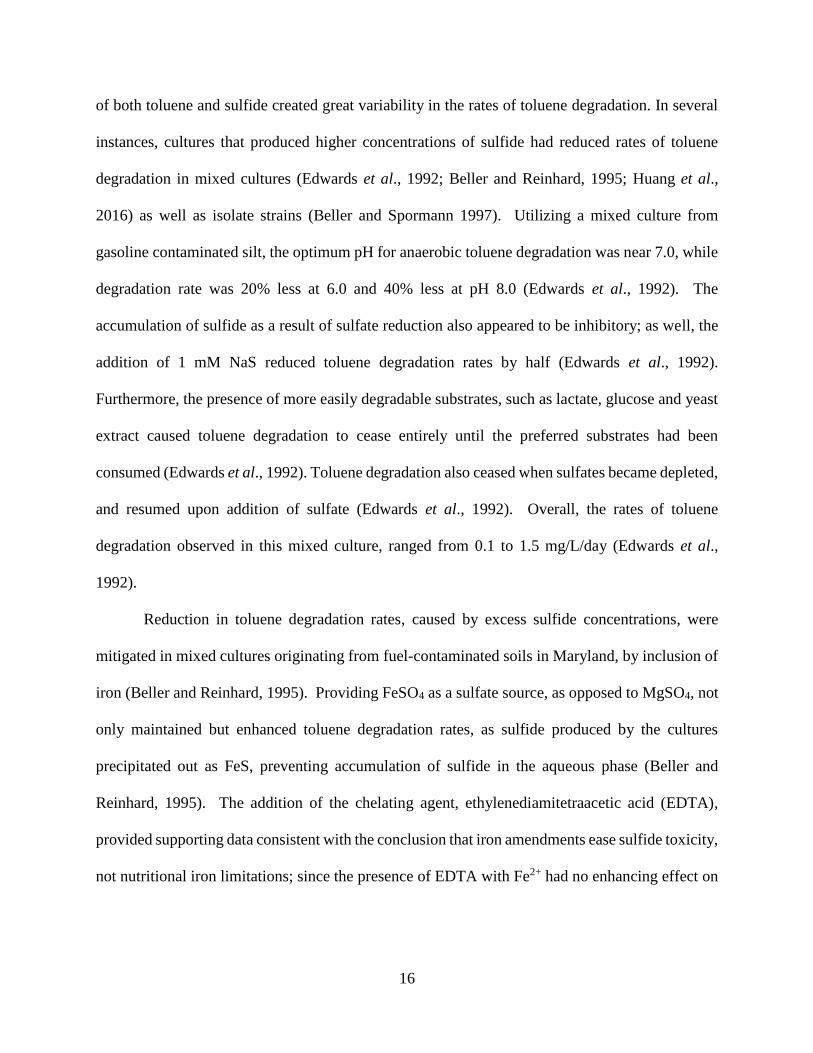
1 INTRODUCTION
Because it is a constituent of gasoline and other consumer products that have been widely
released into the environment by human activities, the presence of toluene in many environments
has generally been viewed as directly resulting from anthropogenic pollution. A growing body of
research, however, suggests that a portion of the toluene found in the environment may not result
from direct anthropogenic release of the compound, especially in cases where toluene is not
accompanied by other BTEX (benzene/toluene/ethylbenzene/xylene) compounds.
During an effort that involved subsurface injection of agricultural feed grade molasses into
the subsurface in an effort to stimulate indigenous bacterial populations’ biodegradation of
chlorinated aliphatic compounds at a Superfund site in south Louisiana, toluene was observed in
the groundwater at concentrations that exceed drinking water standards.
Previous reports in the scientific literature demonstrated that toluene can be biologically
produced from aromatic precursor compounds under anaerobic conditions. The literature reported
finding of biological toluene production under natural conditions, such as seasonally stratified
lakes, as well as more artificial conditions, namely anaerobic wastewater-sludge digesters. The
thesis research described here describes an effort conducted to ascertain if a contaminated waste
site supplemented with an easily fermentable substrate could similarly stimulate anaerobic
microbial communities into biologically producing toluene at a faster rate than it could be
degraded, resulting in toluene accumulation as an aqueous-phase pollutant.
1.1 Objectives and Approach
The overall objective of the research described in this thesis was to better understand the
potential for biological toluene production to occur in groundwater at a Superfund Site located in

2
southeast Louisiana. To achieve this objective, the research was divided into three tasks that
involved:
(1) Evaluation of the groundwater microbial populations’ ability to produce toluene under
laboratory conditions
(2) Establishment and propagation of enrichment cultures, and
(3) Testing to assess the ability of enrichment cultures to utilize various carbon sources and
potential precursors for toluene production
1.2 Thesis Organization
Chapter 2 of this thesis contains a literature review that contains a brief overview of
toluene’s properties, a discussion of what has been reported previously regarding biogenically
produced toluene, and a description of bacteria currently classified in the genus Tolumonas with a
particular emphasis on the species Tolumonas auensis. Chapter 3 describes concentrations of
aromatic hydrocarbons detected at a Louisiana field site following the initiation of an in situ
biostimulation remediation strategy as well as methods and results from a series of experiments
performed to assess the capacity of the site’s groundwater microbial community to produce toluene
under laboratory test conditions. Chapter 4 contains overall conclusions and recommendations for
future research. Chapter 5 contains a compilation of references cited throughout the thesis.

3
2 LITERATURE REVIEW
This chapter contains a review of literature related to multiple aspects of the thesis research.
Section 2.1 provides an overview of toluene’s industrial use, potential health hazards, and
environmental regulations. Section 2.2 discusses previous research related to the potential for
toluene biogenesis in the environment and in engineered waste treatment systems. Section 2.3
contains a detailed description of the genus Tolumonus and previous research regarding its
potential to produce toluene. Section 2.4 describes previous research and anaerobic toluene
biodegradation.
2.1 Overview of Toluene’s Industrial Use, Health Hazards, and Environmental
Regulations
Toluene (C7H8) is used in a wide variety of industrial applications, primarily as a chemical
feedstock in the production of benzene and xylene (ASTDR, 2015). It is also used to boost the
octane rating in gasoline and is present in many consumer products such as paints, adhesives,
resins and rubbers (ASTDR, 2015). Through accidental leaks and spills of various toluene-
containing liquid fuels, and atmospheric emission of incompletely combusted materials,
significant amounts of toluene have been introduced into the environment. In 2016, 21 million
pounds (9.6 million kilograms) in toluene releases were reported in the US EPA Toxic Release
Inventory (TRI), predominantly as point-source and fugitive air emissions (TRI, 2016). However,
45,000 pounds of toluene were reported as surface impoundments and land disposal, and 7,500
pounds of toluene were in surface water discharges reported (TRI, 2016). Because not all
industrial facilities in the United States are required to report their releases to the TRI, the figures
reported here serve as a lower-bound estimate of actual releases of toluene nationwide (ASTDR,
2015).

4
Long-term consumption of toluene-contaminated water has been linked to damage of the
nervous system, kidneys, and liver (EPA, 2015). To protect public health, the United States
Environmental Protection Agency (EPA) has set a maximum contaminant level (MCL) of 1 mg/L
for toluene in drinking water (EPA, 2015). Inhalation of toluene-contaminated air also poses a
health hazard. Locally high concentrations of gas-phase toluene may occur in indoor or outdoor
air due to volatilization from household products containing toluene, cigarette smoke, and
automobile exhaust (EPA 2015). The Occupational Safety and Health Administration (OSHA)
regulatory permissible exposure limit (PEL) for toluene is set at 754 mg/m3 (EPA 2015). Various
physicochemical properties of toluene are summarized in Table 2.1.
Table 2.1. Physicochemical properties of toluene
Parameter Value Reference
Molecular Formula C6H5CH3 pubchem.gov
CAS # 108-88-3 pubchem.gov
Molecular Weight (g/mole) 92.141 pubchem.gov
Density at 20ºC (g/mL) 0.867 pubchem.gov
Boiling point (°C) 110.6 pubchem.gov
Log KOW (dimensionless) 2.73 pubchem.gov
Water Solubility at 25°C (mg/L) 526 pubchem.gov
Henry’s Law Constant at 22°C
(atm·m3/mol)
(unitless)
5.06×10⁻³
0.209
Peng and Wan, 1997
Vapor Pressure (kPa at 25 °C) 3.8 pubchem.gov
2.2 Biological Toluene Production
The presence of toluene in most urban and human-impacted environments is generally
thought to originate from anthropogenic sources (e.g., pollution from refined petroleum products
in widespread use). In the 1980s, however, evidence began to mount suggesting that contemporary
biological sources could be responsible for some occurrences of aromatic hydrocarbons in the
environment. The bacterium “Clostridium aerofoetidum” strain WS was reported to produce
toluene in the presence of phenylacetic acid or in the presence of both phenylalanine and

5
methionine together (Pons et al., 1984). Other aromatic compounds such as phenol, p-cresol and
skatole have also been shown to be biogenically produced from anaerobic transformation of amino
acids that contain aromatic side chains (phenylalanine, tryptophan, and tyrosine), modified amino
acids, or organic acids that contain an aromatic-group (Yokotama and Carlson, 1981; Fischer-
Romero et al., 1996; Whitehead et al., 2008). A diagram of these compounds and their respective
precursors are displayed in Figure 2.1.
Likely due to its use in consumer products and automobile fuels, toluene is frequently
present in urban stormwater runoff and in the influent of wastewater entering municipal
wastewater treatment plants. A study of VOCs in storm water runoff found that toluene was the
most frequently detected BTEX compound (Delzer et al., 1996). In 16 major cities across the
United States, 62 different VOCs were measured in 592 samples of storm water runoff taken over
a 4 years period (1991-1995) (Delzer et al., 1996). While concentrations ranged from detectable
levels (0.2 μg/L) to as high as 6.6 μg/L, the median concentration was only 0.3 μg/L (Delzer et al.,
1996).
Studies at two municipal wastewater treatment plants in Chicago reported that of the 11
VOCs detected in influent wastewater, toluene had by far the highest concentration of 86 μg/L,
whereas all remaining VOCs were at much lower concentrations (< 20 μg/L) (Namkung and
Rittman, 1987). Models indicated that of the five compounds known to be biodegraded under
aerobic conditions (toluene, benzene, chlorobenzene, ethylbenzene, and methylene chloride),
~92% of the removal could be attributed to biodegradation. Adsorption as a mechanism for
removal was determined to be negligible by models and was further confirmed when laboratory
scale systems determined that adsorption of toluene to solids comprised less than 1% of removal
mechanisms (Namkung and Rittman, 1987).

6
Figure 2.1. Chemical structures of compounds reported to be produced biogenically (right) and
their respective precursors (left). [Structures taken from chemspider.com]

7
The presence of high concentrations of toluene in anaerobic sludge digesters of several
municipal wastewater treatment plants in the United Kingdom were suspected to be of a biological
source when concentrations of toluene exiting some treatment works were at slightly higher
concentrations than that of the influent (Wilson et al., 1994). Laboratory analysis of digester
sludge samples taken from these treatment plants and were analyzed for 1,1-DCE; 1,2-DCE; 1,2-
DCA; chloroform; 1,1-TCA; 1,1,2-TCA; TCE carbon tetrachloride, tetrachloroethene (PCE);
benzene; toluene; ethylbenzene; o-xylene, and m- plus p-xylene (Wilson et al., 1994). Of these
compounds, toluene was by far the highest in concentrations among all volatile organic compounds
(VOCs) analyzed, accounting for 91% of total mean aromatic VOC concentration (Wilson et al.,
1994). Analysis of sludge taken from 12 different wastewater treatment plants had a mean toluene
concentration of 87 ±172 mg/kg (dry weight), with concentrations at one site of 549 mg/kg (14,900
μg/L) (Wilson et al., 1994). While toluene concentrations in sludge varied greatly from site to
site, no apparent correlation was found between the VOC concentrations found in wastewater
treatment sludges and the percent of industrial influent, population served, solids content, or
method of treatment used at each wastewater treatment plant (Wilson et al., 1994).
Raw wastewater at one plant was reported to be as high as ~115 μg/L, while the effluent
averaged 30 μg/L (Suschka et al., 1996). Field studies indicated that air stripping and aerobic
biological mechanisms were estimated to account for 55.6% removal of toluene (Suschka et al.,
1996); however, when compared to measured concentrations in raw wastewater a toluene mass
balance could not explain the high toluene concentrations measured in anaerobically digested
sludge supernatant in comparison to measured concentrations of raw wastewater (Mrowiec et al.,
2005). This led to laboratory experiments of anaerobic sludge digestion, utilizing biosolids from
one of the treatment plants studied, in Skoczow, Poland. While not identifying a specific organism

8
or pathway, it was noted that a strong correlation existed between increases in toluene
concentrations during a time of increased volatile fatty acids during the anaerobic sludge digestion
process (Mrowiec et al., 2005). Their findings concluded, “biosynthesis of toluene occurs in the
acidogenic phase [ORP -170 to -200 mV], while biodegradation was prevalent in the methanogenic
phase [ORP -220 to -280 mv]” (Mrowiec et al., 2005). Depending on the type of experiment,
toluene levels in the first stage of anaerobic digestion increased from a base value of 200 μg/L to
20,000 and 42,000 μg/L (Mrowiec et al., 2005). Under the subsequent methane-production stage
of digestion, toluene was estimated to decrease at a rate ranging from 400 to 900 μg/L-day
(Mrowiec et al., 2005). Their finding “excluded the origin of toluene from external sources
including the municipal wastewater itself” (Mrowiec et al., 2005).
A substantial body of research has also been dedicated to investigating the presence of
toluene in seasonally stratified lakes in Central Europe (Jüttner and Henatsch, 1986). Toluene
concentrations fluctuated with seasons as well as depth, 0.008 μg/L at 1m depth and 0.133 μg/L at
10 m depth in June compared to 0.03 μg/L at 1 m and 1.565 μg/L at 10 m depth in October (see
Figure 2.2); however anthropogenic compounds such as xylenes and ethyltoluenes were not
detected (Jüttner and Henatsch, 1986). Similar results in six additional lakes that experienced
anoxic stratification suggested that the findings are perhaps a widespread phenomenon (Jüttner,
1990). As the concentrations of toluene were found to be inversely related to concentrations of
nitrate-N, they concluded that the formation of toluene, a likely result of anoxic degradation of
protein matter, could surpass its degradation rate under anoxic denitrifying conditions (Jüttner,
1991).

9
Figure 2.2. Seasonal depth profiles of the concentrations of toluene (area of circles). The numbers
beside or within the circles represent the toluene concentrations (ng l-1). The stepped horizontal
line indicates the upper boundary of the anoxic part in the Schleinsee 1984 and 1985. [Reprinted
by permission from Macmillan Publishers Ltd: Nature, Jüttner F. and Henatsch J.J., Anoxic
Hypolimnion is a Significant Source of Biogenic Toluene. 323: 797 – 798. © 1986]
In addition, to further investigate a potential for biogenic toluene production in freshwater
lake systems, samples of anoxic freshwater sediments collected from Lake Edebergsee (Holstein,
North Germany) were used to inoculate basal medium under laboratory conditions. Utilizing
glucose as a carbon source and various phenyl-containing precursors, at a concentration of 0.4
mmol/L, toluene was confirmed to be biogenically produced, using glucose as a carbon source,
from: phenylacetate, phenylpyruvate, phenyllactate, and phenylalanine (Jüttner, 1991). The
chemical structures for these compounds can be seen in Figure 2.1. Jüttner (1991) also noted that
unlike the previous finding of Pons et al. (1984), when utilizing phenylalanine, the presence of
methionine had an inhibitory effect on toluene production in their laboratory culture(s) inoculated
with lake sediment (Jüttner, 1991). Samples which used phenylalanine as a precursor had the

10
shortest initial lag period of approximately 7 days before toluene production was recorded, and
then showed a ten-fold increase in toluene concentrations within 12 days of inoculation (Jüttner,
1991). However, phenylacetate had the highest formation of toluene, accumulating to 25.2 mg/L,
after 31 days of incubation (Jüttner, 1991). Results of various phenyl precursors are shown in
Table 2.2. When the undefined mixed culture was supplied with radiolabeled phenylalanine [ L-
phenyl-d5-alanine-3,3-d2 (99.4 atom % D)], radiolabeled toluene was produced and after a 27-day
incubation unlabeled toluene made up less than 1% of total toluene produced by the undefined
mixed culture (Jüttner, 1991).
Table 2.2. The effect of different precursor compounds (0.4 mmol/l) on the formation of toluene
after 31 days incubation. Reprinted from: Springer, Verh Int Verein Limnol, Jüttner F., (1990)
Distribution of Toluene in Stratified Lakes and River Dams of Southwest Germany. 24: 279 –
281. With permission of Springer.
Precursor Toluene (mg/L)
Phenylacetate 25.2
Phenylpyruvate 19.0
Phenylalanine 13.0
Phenyllactate 12.3
2-Phenylethanol 5.3
Phenylacetaldehyde 1.7
Ethyl-phenylacetate 1.4
Benzaldehyde 0.05
Cennamate 0.04
Null 0.001
2.3 Detailed Description of the Genus Tolumonus
An important step in understanding potential biogenic toluene production came in 1996
when Fischer-Romero et al. (1996) reported the isolation and taxonomic characterization of a
toluene-producing bacterium originating from anoxic sediments collected from Lake Au, a
separate part of Lake Zurich, Switzerland. Strain TA 4T was capable of both growth and toluene
production when transferred to liquid medium (Fischer-Romero et al., 1996). This nonmotile,
Gram-negative rod shaped (0.9 to 1.2 by 2.5 to 3.2 µm) bacterium produced toluene using

11
phenylalanine, phenyllactate, phenylpyruvate and phenylacetate and a carbon source and was
designated as the type strain of a new genus and species with name Tolumonas auensis (Fischer-
Romero et al., 1996). Type strain TA 4T was also reported to transform tyrosine into phenol
(Fischer-Romero et al., 1996). Toluene formation, which only occurred when one of these
precursors and a carbon source were present, by strain TA 4T was reported at a temperature range
of 12° - 25° C, and at pH ranging from 6.0 to 7.5, with optimum production at 22° C and 7.2
respectively (Fischer-Romero et al., 1996). Strain TA 4T reportedly grew anaerobically on a wide
variety of sugars tested, including D-arabinose, D-cellobiose, D-fructose, D-glucose, glycogen,
Inulin, maltose, D-mannose, D-melezitose, melibiose, D-raffinose, L-rhamnose, D-ribose, salicin,
sucrose, and D-trehalose (Fischer-Romero et al., 1996). It did not grow anaerobically on cellulose,
L-fucose, D-lactose, or D-xylose (Fischer-Romero et al., 1996). Major fermentation products were
acetate, formate, and ethanol when grown on glucose. Both growth and toluene production were
reportedly observed under aerobic conditions as well (Fischer-Romero et al., 1996).
The type strain of a second novel bacteria species in the genus Tolumonas, Tolumonas
osonensis, was first isolated from anoxic freshwater sediment from Oso Creek in Corpus Christie,
Texas (Caldwell et al., 2011). The type strain, designated as OCF 7T, is a Gram-negative, non-
motile, facultatively anaerobic bacterium grew optimally at 22° C and pH 7.5 (Caldwell et al.,
2011). Major fermentation products from glucose were formate, acetate, ethanol and lactate.
Comparative 16S rRNA gene sequence analysis indicated that strain OCF 7T was phylogenetically
related to the type strain of Tolumonas auensis (97.2% similarity) (Caldwell et al., 2011). While
strain OCF 7T did not exhibit the ability to transform phenylacetate, phenylalanine and substituted
aromatic acids into toluene, biochemical and polar lipid data are all compatible with the genus
Tolumonas (Caldwell et al., 2011). Caldwell et al. (2011) thus emended the Tolumonas genus

12
description with the following changes: “May or may not produce toluene from phenylacetate or
phenylalanine in the presence of another carbon source. May or may not produce phenol from
tyrosine in the presence of another carbon source. May or may not utilize arabinose, fumarate,
lactose or pyruvate. May or may not have the ability to hydrolyse urea. End products from glucose
are acetate, ethanol, formate and/or lactate. Grows between pH 5.5 and 8.5.” (Caldwell et al.,
2011).
In 2015, a third novel species in the genus Tolumonas, T. lignolytica, was reported
following isolation from rain forest soil samples collected from Puerto Rico (Billings et al., 2015).
Cells of BRL6-1T, the type strain of T. lignolytica, was described as mesophilic, non-spore
forming, Gram-negative rods that are oxidase and catalase negative and had been isolated based
on its ability to utilize lignin as a sole carbon source (Billings et al., 2015). The strain grew
optimally at a temperature of 30° C and a pH of 7. Growth was noted to occur from 15-37° C, and
grew well aerobically and anaerobically (Billings et al., 2015). Carbon sources which supported
anaerobic growth included N-acetyl-D-glucosamine, L-arabinose, D-fructose, D-galactose, D-
gluconic acid, α-D-glucose, L-lyxose, maltose, D-mannitol, D-mannose, matotriose, D-melibiose, D-
robose, D-sorbitol, sucrose, Tween 20, Tween 40, Tween 80, and D-trehalose (Billings et al., 2015).
A summary comparison between the species of the genus Tolumonas is shown in Table 2.3, and
the placement of type strains from the genus Tolumonas relative to other bacteria in the order
Aeromonadales in a phylogenetic tree constructed based on 16S rRNA gene sequences is shown
in Figure 2.3.

13
Table 2.3. Comparison of various properties of the type strains of the three species currently
assigned to the genus Tolumonas.
Species name T. auensis T. osonensis T. lignolytica
Type strain DSM 9187T OCF 7T BRL6-1T
Temp range (optimum) 12 – 25°C (22°C) 15 – 37°C (22°C) 15-37°C (30°C)
pH range (optimum) 6.0 – 7.5 (7.2) 5.5-8.5 (7.5) 4.5-8.5 (7)
Produces toluene Yes No Not reported
Produces phenol Yes No Not reported
Hydrolysis of Urea No Yes Not reported
Major fermentation
products from glucose
Acetate, ethanol,
formate
Acetate, ethanol,
formate, lactate.
Not reported
Motility Non-motile Non-motile Not reported
Gram Test Negative Negative Negative
DNA mol% G+C content 52% 49% 47.56%
While Fischer-Romero (1996) described the genus Tolumonas and the species T. auensis
based on the ability of the type strain TA 4T to produce toluene, Zargar et al. (2016) reported that
after obtaining the type strain (=DSM 9187T) from the Deutsche Sammlung von Mikroorganismen
un Zellkulturne (DSMZ), they were unable to replicate the anaerobic or aerobic biosynthesis of
toluene from phenylacetate toluene in media described by Fischer-Romero et al. (1996) or in
DSMZ Medium 500. While unable to replicate toluene production by the type strain of T. auensis,
Zargar et al. (2016) were successful in developing a toluene-producing enrichment culture using
sludge from the East Bay Utility District wastewater treatment plant (Oakland, CA) as the
inoculum in a growth medium modified from the TP Medium published by Fischer-Romero
(Zargar et al., 2016). The modification of the growth medium utilized by Zargar et al. (2016)
included replacing the bicarbonate buffer with an organic buffer (HEPES, 18 mM) and reducing
the sulfate concentration (in order to limit sulfide production) by replacing a portion of MgSO4
with MgCl. A side-by-side comparison of the media formulations can be found in Table A1 of
Appendix A. The recovery of 13C labeled toluene from Zargar et al. (2016) enrichment cultures
supplied with 13C labeled phenylacetic acid and 13C labeled phenylalanine provide compelling

14
evidence of toluene biosynthesis from these substrates even if the responsible microorganisms
have not yet been identified.
Figure 2.3. Phylogenetic tree highlighting the position of Tolumonas lignolytica BRL6-1T among
the Aeromonadales. The phylogenetic tree based on on 16S ribosomal RNA gene sequence was
inferred using the Neighbor-Joining method within MEGA6. Bootstrap values of 1000 replicate
trees are shown at the branches. The tree is drawn to scale, with branch lengths in the same unites
as those of the evolutionary distances used to infer the phylogenetic tree. The evolutionary
distances were computed using the Jukes-Cantor method and are in units of the number of base
substitutions per site. All positions containing gaps and missing data were eliminated, creating a
total of 1234 positions in the final dataset. GenBank accession numbers are shown in parentheses
after strain numbers. Type strains are indicated with a superscript T. Organisms with genomes
available are indicated by and asterisk before the name. [Figure and caption re-printed from
Billings et al., 2015]
In experiments utilizing the mixed culture derived from wastewater sludge in conjunction
with labeled 13C-phenylacetatic acid, an approximately 1 to 1 molar ratio of 13C-toluene produced

15
per 13C-phenylacetate consumed was determined (Zargar et al., 2016). For cultures supplied with
13C-phenylalanine, the molar ratio of 13C-toluene produced per 13C-phenylalanine consumed was
0.35 to 1 (Zargar et al., 2016). Cell-free extracts provided with both phenylacetate and p-
hydroxyphenylacetate showed a resulting correlation of toluene and p-cresol, suggesting that the
same enzyme could be responsible for catalyzing decarboxylation of both phenylacetate and p-
hydroxyphenylacetate (Zargar et al., 2016). Furthermore, activities of cell-free extracts were
irreversibly inactivated by exposure to oxygen (Zargar et al., 2016). Using, fast protein liquid
chromatography (FPLC) fractionation, notably absent from the proteins of the toluene-producing
mixed culture was any identification of the well-characterized Clostridial p-hydroxyphenylacetate
decarboxylase (CsdBC) protein (Zargar et al., 2016). In addition, experimentation utilizing CsdBC
showed it was unable to catalyze phenylacetate decarboxylation (Zargar et al., 2016). This led
Zargar et al. (2016) to conclude that toluene production was catalyzed by a novel phenylacetate
decarboxylase rather than p-hydroxyphenylacetate decarboxylase (Zargar et al., 2016).
2.4 Biological Toluene Degradation
Prior to the 1980s it was widely believed that microbial degradation of toluene was not
possible in the absence of oxygen (Grbic-Galic and Vogel, 1987). Since that time, however, a
multitude of studies published in the literature on the topic of toluene biodegradation have
demonstrated that toluene may be biodegraded under denitrifying, sulfate-reducing, dissimilatory
iron-reducing, and methanogenic conditions. As further discussed below, several bacterial species
with an ability to biodegrade toluene in the absence of oxygen have been reported.
Under sulfate-reducing conditions, supporting evidence has been shown that sulfate was
the terminal electron acceptor during toluene degradation by mixed cultures (Edwards et al., 1992).
Several factors, including pH, availability of sulfate and/or preferred substrates, and concentrations
16
of both toluene and sulfide created great variability in the rates of toluene degradation. In several
instances, cultures that produced higher concentrations of sulfide had reduced rates of toluene
degradation in mixed cultures (Edwards et al., 1992; Beller and Reinhard, 1995; Huang et al.,
2016) as well as isolate strains (Beller and Spormann 1997). Utilizing a mixed culture from
gasoline contaminated silt, the optimum pH for anaerobic toluene degradation was near 7.0, while
degradation rate was 20% less at 6.0 and 40% less at pH 8.0 (Edwards et al., 1992). The
accumulation of sulfide as a result of sulfate reduction also appeared to be inhibitory; as well, the
addition of 1 mM NaS reduced toluene degradation rates by half (Edwards et al., 1992).
Furthermore, the presence of more easily degradable substrates, such as lactate, glucose and yeast
extract caused toluene degradation to cease entirely until the preferred substrates had been
consumed (Edwards et al., 1992). Toluene degradation also ceased when sulfates became depleted,
and resumed upon addition of sulfate (Edwards et al., 1992). Overall, the rates of toluene
degradation observed in this mixed culture, ranged from 0.1 to 1.5 mg/L/day (Edwards et al.,
1992).
Reduction in toluene degradation rates, caused by excess sulfide concentrations, were
mitigated in mixed cultures originating from fuel-contaminated soils in Maryland, by inclusion of
iron (Beller and Reinhard, 1995). Providing FeSO4 as a sulfate source, as opposed to MgSO4, not
only maintained but enhanced toluene degradation rates, as sulfide produced by the cultures
precipitated out as FeS, preventing accumulation of sulfide in the aqueous phase (Beller and
Reinhard, 1995). The addition of the chelating agent, ethylenediamitetraacetic acid (EDTA),
provided supporting data consistent with the conclusion that iron amendments ease sulfide toxicity,
not nutritional iron limitations; since the presence of EDTA with Fe2+ had no enhancing effect on

17
toluene degradation, showing similar degradation results as cultures where iron was not provided
and sulfide concentrations increased over time (Beller and Reinhard, 1995).
Studies at Stanford University utilized a mixed methanogenic inoculum from a stable
consortium, originally enriched from sewage (Grbic-Galic and Vogel 1987). Noting that previous
observations showed that toluene and benzene moderately inhibit methanogenesis, an initial lag
phase was reported, in a pre-experimental period, of 4 and 16 days with 1.5 mM of both toluene
and benzene, and of 15 mM toluene, respectively (Grbic-Galic and Vogel 1987). Further lag times
were avoided by sufficiently acclimating culture to the substrates, over a 3-month period, so that
transformation could start immediately (Grbic-Galic and Vogel 1987). The resulting data showed
higher levels of labelled 14CO2 were produced from methyl labeled toluene than from ring-labeled
toluene, suggesting that methyl carbon is likely converted to carbon dioxide and not methane,
although CH4 was admittedly not measured (Grbic-Galic and Vogel, 1987). It was also noted that
when added methanol was present in cultures, the transformation of toluene was slowed resulting
in higher concentrations of toluene at the end of the 60-day incubation period (Grbic-Galic and
Vogel 1987).
In 1994, further studies examined methanogenic cultures’ ability to anaerobically degrade
toluene. A culture was enriched by taking solids from a creosote-contaminated aquifer and
refeeding active microcosms toluene and o-xylene (Edwards and Grbic-Galic 1994). The putative
intermediates p-cresol and phenol were amended in some cases in an attempt to stimulate toluene
degradation, however significantly long lag times were still observed prior to onset of toluene
degradation; 100 days for toluene with p-cresol and 120 days for toluene without p-cresol
(Edwards and Grbic-Galic 1994). For this methanogenic culture, the optimum pH for toluene
degradation was determined to be near 6.0, while 75% of that degradation rate was achieved at pH

18
of 7.0 (Edwards and Grbic-Galic 1994). After two years of continuous enrichment, the culture’s
degradation rate had increased 10-fold primarily as a result of increased biomass concentration
(Edwards and Grbic-Galic 1994). Alternate electron donors, nitrate and sulfate had an inhibitory
effect (shown in Figure 2.4) (Edwards and Grbic-Galic 1994).
Figure 2.4. Inhibition of toluene degradation by alternative electron donors Nitrate (A) and Sulfate
(B). [Figure reprinted from Edwards and Grbic-Galic (1994)]
Several denitrifying, toluene degrading, bacteria have been identified, including but not
limited to those within the genera of Aromatoleum, Azoarcus, Dechloromaonas, and Thauera
(Altenschimdt and Fuchs, 1991; Hurek et al., 1995; Rabus and Widdel 1995; Zhou et al., 1995;
Coates et al., 2001; Shinoda et al., 2004). There have also been a number of microorganisms
reportedly linked to toluene degradation under sulfate-reducing conditions such as those in the
genera Desulfotomaculum (Ficker et al., 1999; Morasch et al., 2004), Desulfotignum (Ommedal
and Torsvik, 2007), and Desulfosporosinus (Liu, et al., 2004; Sun and Cupples, 2012). Toluene
degradation has also been noted under iron-reducing conditions by bacteria associated with the
genera Geobacter (Kane et al., 2002) and Desulfuromonas (Kim et al., 2013) and by members of
both Methanosaeta and Methanospirillum under methanogenic conditions (Ficker et al., 1999).
In 1995, a review of toluene degradation under anaerobic conditions, utilizing information
available at the time, put forth the proposed pathways shown in Figure 2.5 (Frazer et al., 1995).

19
While it was noted that the pathways proposed were consistent with certain experimental
observations, they acknowledged that definitive proof was not available for any of the routes
summarized (Frazer et al., 1995). Further investigations of anaerobic toluene catabolic pathways,
in particular those involving the cell-free extracts of the denitrifying bacterial species Thauera
aromatica, found that benzylsuccinate, of which fumarate was shown to be the cosubstrate during
formation, was a true intermediate in the O2-independent oxidation of toluene to benzoyl-CoA
(Biegert et al., 1996). When (2H8)toluene was used as a substrate, analysis indicated that
(2H7)benzylsuccinate was indeed formed from (2H8)toluene. In addition, experiments utilizing
labeled benzylsuccinate found that a decrease in [14C]benzylsuccinate coincided with an increase
in labeled benzoyl-CoA (Biegert et al., 1996). In determining requirements for the formation of
intermediates, results indicated that toluene was not oxidized to benzoyl-CoA and benzoate when
either nitrate or coenzyme A were missing in the assay (Biegert et al., 1996). These finding were
further supported during biochemical and genetic characterization, which purified the enzyme
responsible for catalyzing the reaction, benzylsuccinate synthase (Leutwein et al., 1998).
Furthermore, while cell extracts routinely catalyzed the fumarate-dependent formation of
[14C]benzylsuccinate from [14C]toluene, the enzyme was rapidly inactivated by exposure to
oxygen, and could not be reactivated upon transfer into anaerobic vials (Leutwein et al., 1998). It
was postulated that the four genes, designated bssDCAB, for benzylsuccinate synthase and the
activating enzyme were organized as a single operon, for which transcription was induced by the
presence of toluene; enzyme activity was only detected in the extracts of cells grown anaerobically
on toluene but not in cells grown on other aromatic substrates (Leutwein et al., 1998). Additional
experimentation with cell extracts of T. aromatica indicate the pathway of benzylsuccinate
oxidation required activation of the free acid to a CoA-thioester, catalyzed by succinyl-CoA-

20
dependent CoA-transferase, which would eventually lead to the proposed pathway depicted in
Figure 2.6 (Leutwein and Heider, 1999).
Figure 2.5. Proposed pathways for toluene metabolism via methyl group hydroxylation of toluene
(lower) or of p-cresol (upper) following the para-hydroxylation of the toluene ring. Enzyme
activities in cell extracts have been demonstrated for all the transformations except those indicated
with dashed line. [Reprinted from Anaerobe, 1 (6), Frazer, A.C., Coschigano, P.W., and Young,
L.Y., Toluene Metabolism under Anaerobic Conditions, 293 – 303, Copyright 1995, with
permission from Elsevier]
While the benzylsuccinate synthase, which catalyzes the addition of fumarate to the methyl
carbon of toluene, has been previously reported in aerobic toluene-degrading, denitrifying, and
sulfate-reducing bacteria, detection of high benzylsuccinate synthase was also reported in a highly
enriched toluene-degrading, methanogenic culture (Beller and Edwards, 2000). The methanogenic
culture utilized by Beller and Edwards (2000) was the same culture used in Edwards and Grbic-
Galic (1994), which was originally obtained from a creosote-contaminated aquifer (Ficker et al.,
1999). The culture had been maintained in a batch mode and amended with approximately 1 mM
toluene every 2 weeks and had consistently produced 85 to 100% of the theoretical methane yield
(4.3 mol of methane/mol of toluene) for approximately 10 years with toluene as the only carbon
source and electron donor (Beller and Edwards, 2000).

21
Figure 2.6. Proposed pathway of anaerobic toluene degradation. Enzymes: BSS, (R)-
benzylsuccinate synthase; BSCT, succinyl-CoA:(R)-benzylsuccinate CoA-transferase; BSDH,
(R)-benzylsuccinyl-CoA dehydrogenase; PIH, (E)-Phenylitaconyl-CoA hydratase; HADH, 3-
hydroxyacyl-CoA dehydrogenase; BST, benzoylsuccinyl-CoA thiolase; SDH, succinate
dehydrogenase. Chiral C atoms of as-yet-unknown configuration are indicated with circles [Figure
and caption reprinted from Leutwein and Heider, 2001]
Previous genomic analysis of this culture indicated that it was dominated by two archaeal species
presumed to play complimentary roles in the syntrophic culture (members of the genera
Methanosaeta and Methanospirillum), and two eubacterial species, one belonging to the genus
Desulfotomaculum, the other a eubacterial organism designated as OTU Eub-6 (Ficker et al.,

22
1999). It had been proposed that OTU Eub-6 represents the organism that initiated the degradation
of toluene (Ficker et al., 1999). Benzylsuccinate formation from toluene and fumarate accounted
for >85% of toluene consumed in this methanogenic culture (Beller and Edwards, 2000). It was
noted at the time “Benzylsuccinate, which is apparently the first metabolite of toluene
mineralization in this culture is one of a number of candidates for interspecies metabolite transfer”
(Beller and Edwards 2000).
In 2005, investigating possible in situ biotransformation of BTEX compounds at a gasoline
spill, it was noted that while natural attenuation could be enhanced by the addition of sulfate and/or
nitrate, due to the lack of groundwater flow at large spill sites, the supply of electron acceptors can
be constrained in a manner such that methanogenesis may be the only possible mechanism of
removal (Reinhard et al., 2005). In the study, BTEX and other organics as well as existing electron
acceptors (nitrate and sulfate) and dissolved oxygen and residual BTEX was removed with a
helium-purged gas-stripping tower (Reinhard et al., 2005). After returning the waters ionic
strength to levels approximately equal to that of the original groundwater, the experimental volume
was augmented with benzene, toluene, ethylbenzene, and o-xylene (Reinhard et al., 2005).
All experiments showed that toluene and o- and m-xylenes, when present, were rapidly
transformed within the first 25 days and bromide tracer concentrations indicated no dilution from
groundwater crossflow (Reinhard et al., 2005). While toluene degradation rates were initially
slower, there was no observed lag phase (Reinhard et al., 2005). It was noted that while the
comparison of transformation rates calculated for all the BTEX compounds fell in the lower rages
to those values previously reported in the literature under methanogenic conditions, it was
expected since the reported values came from laboratory enrichment cultures and would not
necessarily represent values for in situ transformation (Reinhard et al., 2005).

23
Enriched anaerobic cultures taken from petroleum contaminated sediment in an
Amsterdam harbor indicated the ability to biologically oxidize toluene to CO2 when coupled with
humus respiration (Cervantes et al., 2001). In the study, highly purified soil humic acids (HPSHA)
and quinone moiety of hummus, anthraquinone-2,6-disulfonate (AQDS) were utilized as terminal
electron acceptors allowing for the recovery of 50 and 85% of labeled 13C toluene as 13CO2
(Cervantes et al., 2001). In the absence of humic acids, the culture supported toluene degradation
when utilizing nitrate and Mn(IV) as electron acceptors, however showed no degradation of
toluene under sulfate-reducing, methanogenic, or iron-reducing conditions after 4-month
incubations (Cervantes et al., 2001). However, stimulation of toluene degradation occurred when
sediment mixtures were amended with goethite (FeOOH, 50 mM) with a sub-stochiometric
amount of humic acids (2 g/L) (Cervantes et al., 2001). While the amount of humic acids could
only account for biodegradation of 1.7% of toluene, when low levels of humic acid was added,
more than 65% of toluene had been depleted after 11 weeks; negligible conversion of toluene was
reported in goethite supplemented cultures when humic acids were omitted (Cervantes et al.,
2001). Furthermore, availability of humic acids also reduced the lag time of cultures utilizing Mn
(IV) as an electron acceptor (Cervantes et al., 2001). While it was noted that Goethite was not
utilized directly as an electron acceptor, conversion of toluene was made possible only by
supplementing goethite-containing cultures with sub-stoichiometric levels of humic acid, leading
to the postulation that stimulation can only be accounted for by a chelating effect of humic acids
with Fe(III) or a redox-mediating effect (Cervantes et al., 2001). A list of various reactions
involved in the degradation of toluene and the respective Gibbs free energy calculated by
Cervantes et al. (2001) is presented in Table 2.4.

24
Table 2.4. Thermodynamic comparisons of biodegradation of toluene with alternative electron
acceptors. (Table reprinted from Cervantes et al., 2001, whom utilized additional data collected
from Langenhoff, 1997; Sober, 1970; and Thauer et al., 1977)
Reaction ΔG˚′ (kJ/mol)
C7H8 + 36 Fe3+ + 21 H2O 36 Fe2+ + 43 H+ + 7 HCO3- -3,629.6
C7H8 + 7.2 NO3- + 0.2 H+ 3.6 N2 + 0.6 H2O + 7 HCO3
- -3,554.8
C7H8 + 18 MnO2 + 18 H2CO3 7 CO2 + MnCO3 + 22 H2O -3,358.8
C7H8 + 36 FeO(OH) + 36 H+ 7 CO2 + 36 Fe(OH)+ + 22 H2O -1,443.6
C7H8 + 18 AQDS + 21 H2O 18 AH2QDS + 7 H+ + 7 HCO3- -319.7
C7H8 + 4.5 SO42- + 3 H2O 4.5 HS- + 2.4 H+ + 7 HCO3
- -205.2
C7H8 + 7.5 H2O 4.5 CH4 + 2.5 H+ + 2.5 HCO3- -130.7
While multiple anaerobic toluene biotransformation pathways have been postulated (see
Figure 2.5 and 2.6), more recent reports have indicated that abiotic formation of cresols and phenol
are also possible. While studying a methanogenic toluene-degrading mixed culture originating
from a gas condensate-contaminated aquifer, it was noted that formation of cresols and phenol,
among other hydroxylated compounds, had formed in abiotic controls; particularly when those
controls were exposed to oxygen prior to extraction (Fowler et al., 2012). Furthermore, while
studying anaerobic degradation of benzene in an iron-reducing enrichment culture, a similar
phenomenon was observed (Kunapuli et al., 2008). Here it was reported that phenol was formed
abiotically by autoxidation of benzene during the sampling, leading to the hypothesis that ferrous
iron reacting with oxygen formed hydroxyl radicals, which in turn formed abiotically-produced
phenol when these radicals reacted with benzene (Kunapuli et al., 2008). This prompted Fowler
et al. (2012) to note that care should be taken when extracting highly reduced anaerobic cultures,
as “…exposure to oxygen must be minimized, and even then, the origin of compounds observed
in metabolite analysis should be confirmed using isotope labelling…” (Fowler et al., 2012).
However, they were able to confirm benzylsuccinate as a veritable metabolite as it was observed
to be 13C labelled in incubations with 13C7 toluene (Fowler et al., 2012). They also noted that a

25
BssA gene fragment was amplified from this enrichment culture using PCR, supporting fumarate
addition as a key mechanism for toluene degradation under methanogenic conditions (Fowler et
al., 2012).

26
3 STUDIES AIMED AT UNDERSTANDING THE POTENTIAL FOR
BIOLOGICALLY-MEDIATED TOLUENE FORMATION
This chapter contains a description of experiments conducted to evaluate the potential for
toluene biogenesis by microbial populations in the distal plume area of a south Louisiana
Superfund site. The chapter also presents data from the field sites from which samples were
collected.
3.1 Site Location and Background
For the purposes of this thesis, the “distal plume area” refers to an area of an aquifer
approximately two miles downgradient from where petrochemicals, including a variety of free-
phase chlorinated solvents, were disposed of by direct discharge to unlined earthen lagoons
between 1961 and 1980. In an effort to halt further downgradient migration of aqueous-phase
pollutants, a system of wells was installed in late 2011 and early 2012 to allow subsurface injection
of electron donors to facilitate in situ reductive dechlorination. Locations of selected wells
sampled during the course of experiments conducted in the course of research described in this
thesis are shown in Table 3.1.
Table 3.1. Locations of groundwater wells sampled during the course of this research
Class-V Injection DTZ Well No. SP013 SP024
Well serial number 974196 974206
Date installed 1-18-12 1-13-12
Latitude (NAD 83) 30° 35’ 41.0796” 30° 35’ 43.1102”
Longitude (NAD 83) 91° 14’ 43.4671” 91° 14’ 43.3337”
Depth (feet bgsa) 93 feet 113 feet
Screened interval (feet bgsa) 51-91 feet 55-119 feet
Top of casing elevation (NAVD 88) 75.61 feet 76.94 feet a bgs = below ground surface
The subsurface injection of molasses via injection well extraction and recirculation in the
distal plume treatment zone commenced in June 2013, and again in August 2015. Dates are
displayed in Table 3.2.

27
Table 3.2. Molasses injection dates for Well SP024.
Well SP024
6/10/13 – 6/13/13
8/15/15** (approx.)
3.2 Site Monitoring Data
Groundwater samples collected from various injection wells and monitoring wells at
multiple times were analyzed for VOCs and geochemical parameters. Analyses were conducted
at a certified analytical laboratory (Gulf Coast Analytical, Baton Rouge, LA). As with
groundwater monitoring data previously reported for the same site by Bowman et al. (2006);
concentrations of volatile organic compounds were measured using US EPA method 624
(Bowman et al., 2006). Dissolved ethene, ethane, and methane were measured using method RSK
175 (Bowman et al., 2006). Nitrate and nitrite were measured using US EPA method 353.2
(Bowman et al., 2006). Chloride was measured using US EPA method 252.2 (Bowman et al.,
2006). Sulfate was measured by ion chromatography using US EPA method 300.0 (Bowman et
al., 2006). Sulfide was measured using US EPA method 376.2 (Bowman et al., 2006). Ferrous
iron was measured using US EPA method 3500-Fe D (Bowman et al., 2006). Total organic carbon
was measured using US EPA method 5310B (Bowman et al., 2006). Detailed descriptions of the
US EPA analytical methods referenced above are available elsewhere (National Environmental
Index, http://www.nemi.gov/). Tabulated data are shown in Appendix B.
Well SP024 received an injection of molasses on June 10, 2013. Analysis on June 10, 2013
had toluene levels less than 0.001 mg/L. Over three months later, on September 25, toluene levels
were still relatively low at 0.139 mg/L. However, the following analysis on February 4, 2014
indicated toluene had increased dramatically to 29.0 mg/L (Figure 3.1). While toluene
concentrations receded in the months following, concentrations as high at 15.0 mg/L were still
recorded 10 months after the molasses injection.

28
Analysis of SP024 groundwater two months after the second injection of molasses in
August 2015 again indicated relatively low levels of toluene (0.103 mg/L). Then on November 3,
2015, nearly three months after the injection, toluene levels again rose dramatically to 19.0 mg/L
remaining as high as 14.9 mg/L on December 16, four months after initial injection. By March 3,
2016, 6 months after injection, toluene levels had receded once again, to 0.146 mg/L.
Figure 3.1. BTE (Benzene, Toluene, Ethylbenzene) concentration over time in groundwater
sampled from well SP024. Arrows denote molasses injection dates. For compounds not detected
(benzene, ethylbenzene), concentration of their respective detection limit is plotted.
3.3 Experimental Methods
The groundwater was collected in sterile 1-L nominal capacity glass media bottles filled
leaving little or no gas headspace. Immediately after collection of samples for microcosms and
enrichment cultures, additional samples were collected by NPC Services personnel for analysis of
VOCs and geochemical parameters (analyses performed at Gulf Coast Analytical – see Appendix
B1 for results).
0
5,000
10,000
15,000
20,000
25,000
30,000
5/16/13 10/15/13 3/16/14 8/15/14 1/15/15 6/16/15 11/15/15 4/16/16
Conce
ntr
atio
n (
µg/L
)
Date
Toluene (µg/L) Benzene (µg/L) Ethylbenzene (µg/L)
6/10/13 8/15/15

29
All enrichment cultures used media and/or groundwater aseptically dispensed under
anaerobic conditions in an anaerobic chamber (Coy Laboratory Products, Grass Lake, MI)
supplied with an anaerobic gas mix comprised of 80% N2, 10% H2, and 10% CO2. Glass serum
bottles (Wheaton) were autoclaved (121°C, 15 psi, 20 min) prior to use and were sealed with sterile
butyl rubber stoppers and aluminum crimp caps prior to removal from the anaerobic chamber.
Unless otherwise noted, the gas headspace of bottles dispensed and sealed in the anaerobic
chamber were purged for a minimum for 25 seconds with a filter-sterilized gas mixture comprised
of 5% CO2 balance N2 under 10 psi pressure with 20-gauge hypodermic needles. An effort was
made to maintain a similar ratio of liquid to gas head space in each experiment, regardless of bottle
size. Experiments utilizing 25 mL serum bottles had 15 mL liquid and 10 mL headspace. Those
using 162 mL bottles, had 100 mL liquid and 62 mL headspace.
3.3.1 Analytical Techniques
Toluene concentrations were measured using an Agilent Technologies Gas Chromatograph
(GC) Model 7820A with a flame ionization detector (FID) and an Agilent (123-1364) DB-624
capillary column (60 m × 0.32 mm × 1.80 μm). The GC was programmed starting with a five-
minute hold at 40° C (minutes 0-5), a 20° C/minute temperature ramp for 11 minutes (minutes 5-
16), and a 3-minute hold at 260° C (minutes 16-19).
Gas headspace samples were introduced to the GC via splitless injection using a Pressure-
Lok® 100-μl gas-tight syringe from VICI Precision Sampling Inc. Aqueous-phase samples were
introduced to the GC utilizing a Teledyne Tekmar AQUAtek 100 auto sampler in conjunction with
a Teledyne Tekmar Purge and Trap (Model #: 14-9800-100).

30
3.3.2 Media Preparation
Initial experiments utilized anaerobic TP medium (Fischer-Romero et al., 1996) as
previously described for use in the isolation and cultivation of Tolumonas auensis TA4T but with
the modification that resauzurin was added to a final concentration of 1 mg/L to serve as a redox
indicator, zinc chloride in the trace element solution was replaced with an equal molar
concentration of zinc acetate, and the glucose concentration was increased to 2 g/L (from 1 g/L in
the medium described by Fischer-Romero et al. (1996).
After preliminary experiments utilizing TP medium, as described by Fischer-Romero et al.
(1996), failed to accumulate toluene, the medium was further modified by removal of Na2S·9H2O.
This formulation, hereafter referred to as Modified TP medium, contained the following
constituents (per liter): KH2PO4, 0.25 g; NH4Cl, 0.34 g; KCl, 0.34 g; MgSO4·7H2O, 0.5 g;
CaCl·2H2O, 0.25 g; glucose, 2 g; NaHCO3, 1.5 g; phenylalanine, 132 mg; resazurin, 1 mg; yeast
extract, 10 mg; Vitamin B12, 0.02mg; FeCl2·4H2O, 1.5 mg; H3BO3, 0.006 mg; MnCl2·4H2O, 0.1
mg; CoCl2·6H2O, 0.19 mg; Zinc Acetate ·2H2O, 0.144 mg; NiCl2 ·6H2O, 0.024 mg; CuCl2 ·2H2O,
0.002 mg; Na2MoO4 ·2H2O, 0.036 mg. A detailed protocol for how this anaerobic medium was
made is provided in Appendix A1.
In an attempt to establish a growth medium to enable propagation of a toluene-producing
culture, the Modified TP medium was, in some cases, further altered by substituting phenylalanine
for phenylacetic acid, as well as the addition of, and substituting for glucose, of various alternative
carbon sources as further described in Section 3.3.4.2.
Later in the research process, the propagation of a toluene-producing culture employed a
growth medium as described by Zargar et al. (2016). The medium as described by Zargar et al.
(2016) (full protocol outlined in Appendix A2) contained the following constituents (per liter):

31
KH2PO4, 0.25 g; NH4Cl 0.34 g; KCl 0.34 g; MgCl2·6H2O 1 g; MgSO4·7H2O 0.1 g; CaCl·2H2O
0.125 g; Sodium HEPES 4.685 g; glucose 1.0 g; yeast extract, 10 mg; phenylacetic acid, 27.2 mg;
vitamin B12, .029 mg; FeSO4·7H2O, 1.05 mg; MnCl2·4H2O 0.05mg; CoCl2·6H2O 0.095mg; ZnCl2,
0.035mg; NiCl2·6H2O, 0.012, CuCl2·2H2O, 0.001 mg; Na2MoO4·2H2O, 0.018 mg; H3BO3, 0.003
mg. After medium was completed, 7.1 mL (1 M HCl) was added to achieve a pH of 7.1-7.2,
approximately.
3.3.3 Potential for Toluene Production
To investigate the potential for microbial communities to biologically toluene production
in the groundwater rather than a defined growth medium, groundwater collected from Well SP024
on November 18, 2015 was amended with various combinations of glucose and/or phenylalanine.
Prior to the addition of amendments, the groundwater samples were purged with a filter-sterilized
gas mixture comprised of 5% CO2 and 95% N2 for 10 minutes in an effort to remove toluene
present in the aqueous phase. After purging, each bottle received one of five treatments. The first
treatment received 11 mL of glucose solution (100 g/L, see Appendix A1 for preparation protocol)
to 550 mL of groundwater, resulting in a final glucose concentration of 2000 mg/L). A second
treatment received 11 mL of phenylalanine solution (6.6 g/L, see Appendix A1 for preparation
protocol) to 550 mL of groundwater, resulting in a final amended phenylalanine concentration of
132 mg/L). A third treatment received 11 mL of glucose solution and 11 mL of phenylalanine
solution to 550 mL of groundwater, resulting in final amended concentrations of 2000 mg/L
glucose and 132 mg/L phenylalanine. The fourth treatment, a control, received no additional
amendments. The final treatment, received no additional amendments and was then autoclaved to
serve as an abiotic negative control. Each treatment was inverted several times to provide mixing.
For each treatment, 15 mL aliquots were aseptically dispensed into 34 separate, sterile, glass 25-

32
mL serum bottles under anaerobic conditions. Headspace of each bottle was then purged for 30
seconds at 10 psi with a filter-sterilized gas mixture comprised of 5% CO2 balance N2. Bottles
were incubated in the dark without mixing at ambient laboratory temperature (approximately
22˚C). At regular intervals, triplicate bottles were sacrificed for analysis of aqueous-phase toluene
concentrations via purge-and-trap gas chromatography as described in Section 3.3.1.
3.3.4 Enrichment, Propagation, and Testing of Various Carbon Sources and Phenyl Containing
Precursor concentrations
3.3.4.1 Enrichment Cultures
To establish enrichment cultures, groundwater was collected from various sample wells at
over an 18-month time span. Modified TP medium, utilizing various carbon sources and either
phenylalanine or phenylacetic acid, was inoculated with groundwater at 5% (volume/volume) in
25-mL serum bottles with a total of 15 mL medium/inoculum and 10 mL gas headspace. Bottles
were incubated in the dark without mixing at ambient laboratory temperature (approximately
22˚C). At regular time intervals, replicate bottles were sacrificed for analysis of aqueous-phase
toluene concentrations via purge-and-trap gas chromatography as described in Section 3.3.1.
3.3.4.2 Testing of Various Carbon Sources
Effects of various carbon sources on toluene production were determined by utilizing as an
inoculum what would later be referred to as “October 2015 microcosm”, which was previously
shown to produce toluene in Modified TP medium. The culture to be used for inoculation of
experiments testing various carbon sources, had been stored at 4˚C for approximately 9 months,
since it was initially collected from Well SP024 on 10/14/15. The Modified TP medium
formulation was used as a basis, but with varying carbon sources, and in one series altering the
precursor. That series replaced phenylalanine with phenylacetic acid (82 mg/L) while all
remaining series contained phenylalanine (132 mg/L) as a precursor. Carbon sources used

33
included: Lignin (600 mg/L) both with and without glucose (2,000 mg/L), ‘Avicel’ (cellulose)
(500 mg/L) both with and without glucose (2,000 mg/L), and agricultural-feed grade molasses
(Westway) both with and without Iron (III) Nitrilotriacetate (0.7 mM).
3.3.4.3 Propagation Experiments
Replicates from experiments that accumulated an appreciable concentration of toluene
(≥20 mg/L over initial inoculated concentration) were used to inoculate either Modified TP
medium at varying glucose concentrations (0, 0.3, and 2 g/L) or, in later experiments, medium as
described by Zargar et al. (2016) (1 g/L) in attempts to propagate an enrichment culture. Modified
TP medium utilized phenylalanine and medium as described by Zargar et al. (2016) utilized
phenylacetic acid as precursors. Bottles of varying volumes were incubated in the dark without
mixing at ambient laboratory temperature (approximately 22˚C). At regular intervals, replicate
bottles were sacrificed for analysis of aqueous-phase toluene concentrations via purge-and-trap
gas chromatography as described in Section 3.3.1.
3.3.4.4 Varying Precursor Concentration Experiments
Using an enrichment culture observed to consistently accumulate toluene, and propagated
through 3 generations in growth medium as described by Zargar et al. (2016), an experiment
varying precursor concentration with 5% inoculum (vol./vol.) was established based on the
medium as described by Zargar et al. (2016). One series was set up with varying concentration of
phenylalanine, while another was set up with varying concentrations of phenylacetic acid.
Precursor (i.e., phenylacetic acid or phenylalanine) stock solutions were established at 3000, 2250,
1500, 1125, 750, 600, 450, 300, 150 and 75 mg/L. Final concentrations of each precursor
following addition to the completed medium were 5, 10, 20, 30, 40, 50, 75, 100, 150, 200, 300,
and 400 mg/L; being reached by injecting 1 mL of stock solution into each bottle, with the

34
exception of those with precursor concentrations of 300 and 400 mg/L. Due to solubility
constraints, final concentrations for 300 and 400 mg/L were achieved by injecting 1.5 mL of the
highest concentration (3000 mg/L) to achieve 300 mg/L and 2 mL to achieve 400 mg/L. It should
be noted that while adding precursors from stock solutions were taken into consideration when
preparing the medium, it was not accounted for the additional volume for two highest
concentrations. As a result, the remaining constituents’ concentrations would have been reduced
by ~6% for the 400 mg/L series, and ~3% for the 300 mg/L series. Four replicates were established
at each concentration level. Bottles were then incubated in the dark without mixing at ambient
laboratory temperature (approximately 22˚C). Replicates from each series were analyzed for
aqueous-phase toluene concentrations after 28 days incubation.
To facilitate mass balance calculations, the amount of toluene per bottle was calculated
using an assumed dimensionless Henry’s Law Constant of 0.209 [=0.00506 atm·m3/mol] (Peng
and Wan, 1997). [https://www3.epa.gov/ceampubl/learn2model/part-two/onsite/esthenry.html]
3.4 Results and Discussion
3.4.1 Microcosm Experiments and Enrichment Cultures Using Groundwater from Well SP024
Sampled October 14, 2015
Groundwater collected from well SP024 on October 14, 2015 was used to establish
microcosm experiments as well as inoculate enrichment cultures. After transport to the LSU
laboratory, the groundwater sample bottles were transferred into an anaerobic chamber. For the
microcosm experiment, 100 mL aliquots of groundwater were dispensed into each of eight sterile,
160 mL glass serum bottles that were capped with butyl rubber stoppers and aluminum crimp caps
with no additional media supplements. For enrichment culture experiments, 400 mL aliquots of
TP medium, with the formulation of Fischer-Romero et al. (1996) with exceptions as previously
noted in Section 3.3.2, prepared at double-strength concentration was mixed with an equal volume

35
of groundwater. This resulted in final medium concentrations as described by Fischer-Romero et
al. (1996) [aside from minor exceptions as noted in Section 3.3.2]. 100 mL aliquots of the growth
medium/groundwater mixtures were dispensed into sterile 160 mL serum bottles that were capped
with butyl rubber stoppers and aluminum crimp caps. All bottles were incubated at ambient
laboratory temperature (approximately 22˚C).
At 7-day intervals, headspace gas samples from two microcosm replicates and two
enrichment culture replicates were analyzed by gas-phase chromatography to quantify toluene.
For the groundwater-only microcosms, the gas-phase toluene headspace concentration increased
from 0.6 ±0.1 mg/L on Day 7 to 8.6 ±0.4 mg/L on Day 14 (Figure 3.2). Using Henry’s Law to
estimate the aqueous concentration gave calculated aqueous-phase concentrations of 2.9 ±0.5
mg/L on Day 7 increasing to 41.1 ±2.0 mg/L on Day 14. Subsequent replicates analyzed on Day
21 showed an average gas-phase concentration of 8.1 ±0.2 mg/L. This corresponds to an aqueous-
phase toluene concentration calculated using Henry’s Law to be 38.7 ±1.0 mg/L. Following
analysis, microcosm replicates were stored at 4°C.
To confirm the magnitude of toluene production and directly measure the aqueous-phase
toluene concentrations in microcosms, on Day 21, liquid aliquots from two microcosm bottles
were transferred to 40 mL VOA vials, sealed with Teflon-lined septa, and then were analyzed by
EPA Method 8260B at a certified analytical lab (Gulf Coast Analytical Laboratories, Baton Rouge,
LA). Results of the two replicates showed aqueous-phase toluene from Day 21 were 37.2 and 39.7
mg/L, consistent with the values calculated based on measured gas-phase headspace
concentrations and dimensionless Henry’s Law Constant of 0.209. Benzene, ethylbenzene, and
xylenes were below detection in the aqueous-phase samples analyzed on Day 21 and were not
detected in any of the gas-phase analyses.

36
Figure 3.2. Gas-phase concentration of toluene over time in microcosms established using
groundwater from Well SP024 collected on 10/14/15.
To assess whether the observed toluene accumulation in the laboratory microcosms (Figure
3.2) correlated with toluene accumulation in the site groundwater, groundwater from well SP024
was collected by NPC Services personnel on November 3, 2015 (which was Day 19 of the
laboratory microcosm experiment) for analysis using EPA method 8260B (analyzed by GCAL).
Analysis indicated that corresponding in situ aqueous-phase toluene concentrations had increased
from 0.103 mg/L on October 14, 2015 (Day 0 of the laboratory incubation) to 19.0 mg/L on
November 3, 2015 (Day 19 of the laboratory incubation) [tabulated data and other geochemical
parameters are shown in Table B7 of Appendix B]. As shown previously in Figure 3.1, the
elevated toluene concentration in the SP024 well persisted over time before decreasing, with 14.9
mg/L toluene present in samples collected on December 16, 2015 before decreasing to 0.146 mg/L
on March 3, 2016 and 0.003 mg/L on July 18, 2016 (tabulated data in Table B7). During this time
interval, benzene and ethylbenzene were below detection in the SP024 groundwater (with
detection limits ranging from 0.2 to 40 μg/L as noted in Table B7).
0
1
2
3
4
5
6
7
8
9
10
0 5 10 15 20 25 30 35 40
Tolu
ene
Conce
ntr
atio
n (
mg/L
)
Time (days)

37
The rapid increase in toluene concentration measured in the SP024 groundwater (field
measurements) and microcosms (laboratory experiments) occurred in the timeframe of two to three
months after the most recent subsurface injection of molasses in well SP024. The toluene
concentration increase observed in laboratory microcosms can exclude the possibility that the
toluene concentration increase observed in the field data was due to advection or other external
introduction during this time interval. Additionally, toluene was not detected in the upgradient
well SBP-089 sampled on October 14, 2015 (<1 μg/L).
While toluene accumulated to high levels in the groundwater microcosm serum bottles
(groundwater only), no toluene was detected in the gas headspace analysis for enrichment cultures
prepared using the double-strength TP medium in any of the replicates analyzed over the 28-day
incubation time following inoculation with the same groundwater.
In an effort to determine if the presence of sulfide as a reducing agent in the TP medium
or the presence of H2 in the gas headspace of enrichment culture serum bottles were potential
reasons why toluene was not produced in the enrichment cultures but was produced in the
groundwater-only microcosms, groundwater microcosms analyzed on Day 21 were used to
inoculate four different treatments. This experiment utilized a series containing TP medium, as
described by Fischer-Romero et al. (1996) with Na2S·9H2O at a final concentration of 5 mM, and
a Modified TP medium (without Na2S·9H2O); both series supplied with phenylalanine and glucose
at 132 and 2,000 mg/L, respectively. Both series utilized 25-mL serum bottles with 10 mL of gas
headspace and were inoculated with 5% (vol./vol.) with groundwater microcosms analyzed on Day
21. A portion of the replicate serum bottles with and without sulfide as a reducing agent were
purged with a gas mixture containing 5% CO2 balance N2, while the remaining bottles from each
treatment were purged with a gas mixture consisting of 10% CO2, 10% H2, balance N2.

38
After an initial lag phase, there was a marked increase in toluene over time in bottles with
both gas headspace compositions for media prepared without Na2S. Results presented in Figure
3.3 display an average of toluene concentration of replicates analyzed over time. Toluene
concentrations of 15.7 ±0.6 mg/L were observed in replicates of the series without Na2S/without
H2, 10 days after inoculation. The highest toluene concentrations observed were recorded on Day
16 of 47.2 ±0.8 mg/L. In series without Na2S/with H2, toluene concentrations reached 13.7 ±0.01
mg/L, 10 days after inoculation, with the highest concentration on Day 16 of 44.5 ±0.01 mg/L.
The presence of H2 gas in the headspace did not appear to have a dramatic impact on accumulation
of toluene. Toluene levels in either series containing Na2S did not show an increase in toluene
concentration over time, and in some cases slightly decreased. Analysis of negative controls,
which consisted of un-inoculated growth medium, showed no measurable concentration of toluene
(<0.1 mg/L).
Figure 3.3. Toluene concentration as a function of time in time-series experiment utilizing
Modified TP medium with and without Na2S, with and without H2 in the gas headspace.
0
10
20
30
40
50
60
0 5 10 15 20 25
Tolu
ene
Conce
ntr
atio
n (
mg/L
)
Time (days)
+H2 / +Na2S -H2 / +Na2S +H2 / -Na2S -H2 / -Na2S

39
Experiments to further propagate the toluene-producing culture, following the incubation
period depicted in Figure 3.3, was attempted in Modified TP medium (without sulfide) in two
consecutive experiments; however, toluene did not accumulate to an appreciable level in any
replicates analyzed (data not shown). An additional attempt to propagate the toluene-producing
culture utilizing Modified TP medium amended with methionine to a final concentration of 200
mg/L also did not accumulate toluene (data not shown).
3.4.2 Microcosms and Enrichment Cultures Established Using Groundwater from Well SP024
Sampled November 18, 2015
Groundwater collected from Well SP024 on November 18, 2015 was aseptically
transferred to glass serum bottles (160 mL) which were sealed with butyl rubber stoppers and
aluminum crimp seals. One series of replicate bottles contained groundwater amended with both
glucose and phenylalanine from concentrated stock solutions. Other series of replicate bottles
contained groundwater amended with only glucose or only phenylalanine. Still other replicate
bottles contained groundwater that were not amended with any supplements. A portion of these
replicates not receiving any amendments (i.e., groundwater only) were autoclaved to serve as
abiotic controls. For groundwater that was amended with both phenylalanine and glucose, a
distinct increase in toluene concentration was observed by Day 12 (see Figure 3.4), when the
toluene concentration reached 9.0 ±1.5 mg/L (mean ± standard deviation). The highest toluene
concentrations, 55.6 ±1.1 mg/L, were recorded on Day 18 after which time toluene concentrations
slowly declined.
The series containing phenylalanine without addition of glucose also exhibited
considerable toluene accumulation but with a much longer lag period and slower rate of
accumulation. A noticeable increase in toluene concentration was not observed until replicates
sacrificed 32 days after inoculation (Figure 3.4). This was further confirmed after subsequent

40
analysis showed 13.0 ±4.4 mg/L and 50.5 ±1.5 mg/L on Days 41 and 63, respectively. All series
without added phenylalanine showed no appreciable accumulation in toluene concentration, and
in most cases observed concentrations of toluene decreased, albeit very slightly, over time (Figure
3.4).
Figure 3.4. Toluene concentration as a function of time in time-series experiment utilizing
amended groundwater collected from SP024 on November 18, 2015.
The fact that both series of enrichments amended with phenylalanine (with and without
glucose) eventually produced toluene at relatively high and similar concentrations, while
enrichments without phenylalanine did not accumulate toluene, suggests that access to a sufficient
precursor could be a limiting factor. That toluene accumulation occurred with a shorter lag period
and higher rate in phenylalanine-supplemented bottles with glucose than without, clearly
demonstrates that glucose impacted the process. The fact that groundwater-only microcosms
established from groundwater collected on November 18, 2015 did not accumulate toluene, in
sharp contrast to those established using groundwater collected on October 15, 2015, may reflect
0
5
10
15
20
25
30
35
40
45
50
55
60
0 10 20 30 40 50 60 70
Tolu
ene
Conce
ntr
atio
n (
mg/L
)
Time (days)
GW +Glu +PA
GW +PA
GW only
GW +Glu
GW (sterile)
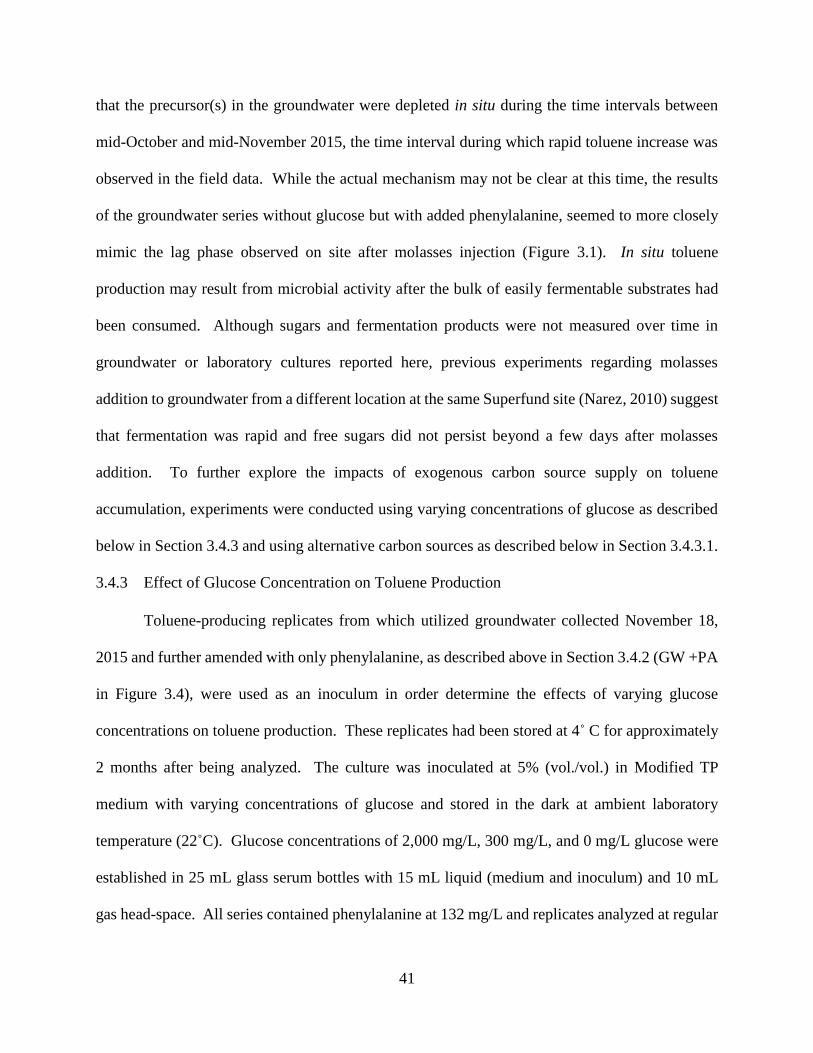
41
that the precursor(s) in the groundwater were depleted in situ during the time intervals between
mid-October and mid-November 2015, the time interval during which rapid toluene increase was
observed in the field data. While the actual mechanism may not be clear at this time, the results
of the groundwater series without glucose but with added phenylalanine, seemed to more closely
mimic the lag phase observed on site after molasses injection (Figure 3.1). In situ toluene
production may result from microbial activity after the bulk of easily fermentable substrates had
been consumed. Although sugars and fermentation products were not measured over time in
groundwater or laboratory cultures reported here, previous experiments regarding molasses
addition to groundwater from a different location at the same Superfund site (Narez, 2010) suggest
that fermentation was rapid and free sugars did not persist beyond a few days after molasses
addition. To further explore the impacts of exogenous carbon source supply on toluene
accumulation, experiments were conducted using varying concentrations of glucose as described
below in Section 3.4.3 and using alternative carbon sources as described below in Section 3.4.3.1.
3.4.3 Effect of Glucose Concentration on Toluene Production
Toluene-producing replicates from which utilized groundwater collected November 18,
2015 and further amended with only phenylalanine, as described above in Section 3.4.2 (GW +PA
in Figure 3.4), were used as an inoculum in order determine the effects of varying glucose
concentrations on toluene production. These replicates had been stored at 4˚ C for approximately
2 months after being analyzed. The culture was inoculated at 5% (vol./vol.) in Modified TP
medium with varying concentrations of glucose and stored in the dark at ambient laboratory
temperature (22˚C). Glucose concentrations of 2,000 mg/L, 300 mg/L, and 0 mg/L glucose were
established in 25 mL glass serum bottles with 15 mL liquid (medium and inoculum) and 10 mL
gas head-space. All series contained phenylalanine at 132 mg/L and replicates analyzed at regular

42
intervals. Results of analysis are presented graphically in Figure 3.5. While toluene concentrations
were nearly indistinguishable 7 days after inoculation, by Day 14 the resulting toluene
accumulation was distinct for series supplied with different glucose concentrations. The series
containing 2,000 mg/L glucose accumulated by far the most toluene, reaching its highest
concentrations of 40.1 ±1.7 mg/L on Day 28. The series supplied with 300 mg/L glucose
accumulated toluene to a maximum aqueous-phase concentration of 12.04 ±0.01 mg/L on Day 19,
while the series not supplied with any glucose, accumulated toluene to a maximum of 8.64 ±1.0
mg/L on Day 32. Analysis on Day 35 of all negative controls, which consisted of un-inoculated
Modified TP medium both with glucose (2000 mg/L) and without, had no measurable
concentrations of toluene (<0.1 mg/L), indicating that the toluene production was not abiotic.
Attempts to further propagate these cultures in Modified TP medium were unsuccessful at
accumulating appreciable levels of toluene (data not shown).
Figure 3.5. Toluene concentration as a function of time in time-series experiment utilizing
Modified TP medium with “full-strength” glucose (2 g/L), reduced glucose (0.3 g/L), and no
glucose.
0
5
10
15
20
25
30
35
40
45
0 5 10 15 20 25 30 35 40 45
Tolu
ene
Conce
ntr
atio
n (
mg/L
)
Time (days)
0.3g/L No Glu 2g/L

43
3.4.4 Effect of Carbon Sources on Toluene Production
A time series experiment to study the effects of varying carbon sources on toluene
production was established utilizing a groundwater-only microcosm, established from
groundwater sampled on October 14, 2015 from Well SP024 (Figure 3.2), as the inoculum (5%
volume/volume). The microcosm had been stored at 4˚ C for approximately 9 months prior to its
use as an inoculum. Several series of various carbon sources were established, using the Modified
TP Medium formulation as a basis. Series contained carbon sources Avicel or lignin in addition
to glucose as well as Avicel or lignin instead of glucose. Two additional series utilized agricultural
feed grade molasses (2 g/L) instead of glucose and agricultural feed grade molasses (2 g/L) with
Iron(III) Nitrilotriacetate (1 mM final concentration) instead of glucose.
Resulting analysis of toluene concentrations from each series are described below in Figure
3.6. Comparing series of Modified TP medium with 2g/L glucose (B) to that of medium with no
glucose (A), toluene accumulation was again higher in the series with glucose than without. This
is consistent with results shown previously (Figure 3.5) for a culture that came from the same well,
approximately a month apart from each other. Comparing the results of series no glucose +lignin
(C) and no glucose +Avicel (E) to that of no glucose (A) would seem to suggest that the presence
of lignin and Avicel (cellulose) had some inhibitory effect on toluene production when no glucose
was available. Also, while the series with lignin and glucose (D) had nearly indistinguishable
effects on toluene accumulation to series with glucose only (B), the series with both glucose and
Avicel (F) had noticeably less toluene accumulation. The series with agricultural feed grade
molasses (H) exhibited toluene accumulation at a rate and extent quite similar observed for
medium with glucose only (B), however the series with addition of Iron(III) Nitrilotriacetate (G),
however, exhibited dramatically lower toluene concentrations. Analysis of all negative controls,

44
which consisted of un-inoculated growth medium of the same formulation in each series, had no
measurable concentration of toluene (<0.1 mg/L), indicating that toluene production was
biologically mediated. Attempts to propagate toluene-producing replicates utilizing the same
formulations as their respective inoculum, as well as DSMZ Medium 500, were unsuccessful (data
not shown).
Figure 3.6. Toluene concentration as a function of time in time-series experiment utilizing
Modified TP medium formulation with varying carbon sources [A – H]

45
3.4.5 Further Propagation Using October 2015 Microcosms and Effect of Varying
Phenylalanine Concentration on Toluene Production
After multiple attempts to propagate toluene-producing cultures were unsuccessful (as
noted in previous sub-sections), an experiment to study the effects of varying phenylalanine
concentrations was established using the Modified TP Medium formulation. Final concentrations
of phenylalanine were established at 0, 22, 44, 66, 88, 132, 220 and 440 mg/L. A replicate from
the groundwater only microcosm experiment (Fig 3.2) established using groundwater collected
from Well SP024 on 10/14/15 was used as the inoculum. After initial analysis (approximately 25
days after collection), the serum bottle used as inoculum had been stored at 4˚ C for approximately
15 months prior to use as inoculate. Inoculation was 5% (volume/volume) in 25 mL glass serum
bottles containing 15 mL liquid medium. Bottles were analyzed for toluene after 42 days
incubation at ambient laboratory temperature (22° C).
While this experiment did not provide consistent results (many replicates produced little or
no toluene as shown in Appendix A1 Figure A.1), possibly due to low cell concentration after 15
months of storage, two replicates did produce a sizable concentration of toluene after the six-week
incubation. One replicate supplied with 220 mg/L phenylalanine had accumulated 40.76 mg/L
aqueous-phase toluene; another supplied 132 mg/L phenylalanine accumulated 31.57 mg/L
aqueous-phase toluene.
Subsequently, 2 mL of the replicate which had accumulated 40.76 mg/L aqueous-phase
toluene was used to inoculate two 160 mL serum bottles, each containing 100 mL of different
growth medium. One formulation was based on the same medium as described by Zargar et al.
(2016), (full protocol listed in Appendix A2: Zargar Medium). The other was the Modified TP
medium, the variant based on the Fischer-Romero, (1996 formulation), which had been previously
shown to produce toluene in first generation cultures but never in a serially-transferred generation.
46
For both medium formulations, phenylalanine was replaced with phenylacetic acid; both media
had the same phenylacetic acid concentration, 27.2 mg/L.
After 18 days incubation, the medium based on that of Zargar et al. (2016) had accumulated
toluene to an aqueous-phase concentration of 19.4 mg/L. The replicate which utilized Modified
TP medium based on the formulation of Fischer-Romero (1996) failed to accumulate aqueous
phase toluene at detectable limits (<0.1 mg/L).
The production of toluene observed here was the first successful second-generation
toluene-producing culture (considering the October 2015 microcosm shown in Figure 3.2 to be
generation 0). The culture was again transferred into identical medium formulations, to that which
it had come from, as described by Zargar et al. (2016). As previous, 2 mL of inoculum was used
to inoculate three replicate 160 mL bottles, each containing 100 mL of growth medium (based on
that of Zargar et al. (2016). After 28 days, analysis indicated that all three replicates had
accumulated over 19 mg/L aqueous-phase toluene [third generation], providing a successful third
generation propagation of the toluene producing culture. It is unknown why the TP medium based
on that described by Fischer-Romero et al. (1996) was ineffective at sustaining toluene
accumulation over multiple serial transfers. Nevertheless, the results demonstrate that the culture
derived from Well SP024 could be successfully propagated in the medium based on that described
by Zargar et al. (2016). The medium based on that described by Zargar et.al. (2016), thus, was
employed in subsequent experiments aimed at assessing the effects of varying phenyl-containing
precursor concentrations on toluene accumulation.

47
3.4.6 Varying Precursor Concentration Experimental Results
Utilizing a growth medium as described by Zargar et al. (2016), and another based on a
similar formulation but replacing phenylacetic acid with phenylalanine, a varied precursor
concentration experiment was established (see full details in Sec 3.3.4.4). Both formulations were
inoculated with the second-generation enrichment culture, described above (Sec 3.4.5) which had
a toluene concentration of 19.4 mg/L at the end of its incubation (prior to use as inoculum).
Inoculation was 5% (volume/volume) in 25 mL serum bottles containing 15 mL medium and
incubated at ambient laboratory temperature (22˚C). Aqueous-phase toluene concentrations
measured after 28 days incubation are shown in Figure 3.7 (for phenylacetic acid) and Figure 3.8
(for phenylalanine). At the highest concentration of phenylacetic acid supplied, 2.94 mM (400
mg/L), the final aqueous-phase concentration of toluene was 1.23 ±0.05mM (113.4 ±4.9 mg/L).
At the highest concentration of phenylalanine supplied, 2.42 mM (400 mg/L), the final aqueous-
phase concentration of toluene was 1.28 ±0.11 mM (117.9 ±10.1 mg/L)
The total amount of toluene accumulated per bottle, shown in Figure 3.9 and Figure 3.10,
was calculated assuming a Henry’s Law dimensionless constant of 0.209; the experimentally
measured aqueous-phase concentration and liquid and gas volumes per bottle. The sum of the
aqueous-phase and gas phase concentrations multiplied by their respective volumes gave the total
toluene produced (y-axis) which was plotted versus the total amount of precursor provided in the
growth medium (x-axis). A linear regression was then fit to the data with correlation coefficients
as shown in the figures.

48
Figure 3.7. Aqueous-phase toluene concentration as a function of initial phenylacetic acid
concentration provided in medium as described by Zargar et al. (2016) after 28 days incubation.
Figure 3.8. Aqueous-phase toluene concentration as a function of initial phenylalanine
concentration provided in medium as described by Zargar et al. (2016) after 28 days incubation.
y = 0.4495x + 0.0506
R² = 0.948
0.0
0.2
0.4
0.6
0.8
1.0
1.2
1.4
1.6
0.0 0.5 1.0 1.5 2.0 2.5 3.0 3.5
Tolu
ene
conce
ntr
atio
n (
mM
)
Phenylacetic acid provided (mM)
y = 0.5144x - 0.0099
R² = 0.988
0.0
0.2
0.4
0.6
0.8
1.0
1.2
1.4
0.0 0.5 1.0 1.5 2.0 2.5 3.0
Tolu
ene
conce
ntr
atio
n (
mM
)
Phenylalanine provided (mM)

49
The molar ratio of toluene accumulated per phenylacetic acid provided was 0.52, lower
than the yield reported by Zargar et al. (2016) for a wastewater-derived enrichment culture of
1.098 moles toluene produced per mole phenylacetic acid supplied. The lower toluene yield
observed in the study reported here could be due to the potential sorption of some toluene to the
butyl rubber stoppers used, as opposed to Zargar et al. (2016) experiments which utilized PTFE
stoppers. Additionally, a portion of the phenylacetic acid precursor may have not been
transformed by the culture resulting in a larger denominator term relative to the results reported
by Zargar et al. (2016) who experimentally measured the amount of precursor consumed rather
than calculating based on the amount of precursor initially provided. The molar ratio of toluene
accumulated per phenylalanine supplied for the groundwater-derived enrichment culture reported
herein was 0.575, somewhat higher than the 0.346 moles toluene accumulated per mole of
phenylalanine consumed reported by Zargar et al. (2016). The apparently higher toluene yield
from phenylalanine reported here may have been influenced by the culture being initially enriched
using phenylalanine as a precursor. Regardless, there was a clear correlation between the supply
of phenyl-containing precursor and the amount of toluene accumulation for both phenylacetic acid
and phenylalanine.

50
Figure 3.9. Total toluene accumulated per bottle as a function of initial phenylacetic acid provided
in medium as described by Zargar et al. (2016) after 28 days incubation.
Figure 3.10. Total toluene produced per bottle as a function of initial phenylalanine provided in
medium as described by Zargar et al. (2016) after 28 days incubation.
y = 0.5197x + 0.0008
R² = 0.9571
0.000
0.005
0.010
0.015
0.020
0.025
0.030
0.000 0.005 0.010 0.015 0.020 0.025 0.030 0.035 0.040 0.045 0.050
Tota
l T
olu
ene
Acc
um
ula
ted (
mm
ole
s/bott
le)
Total Phenylacetic acid provided (mmoles/bottle)
y = 0.5748x - 0.0002
R² = 0.988
0.000
0.005
0.010
0.015
0.020
0.025
0.000 0.005 0.010 0.015 0.020 0.025 0.030 0.035 0.040 0.045Tota
l T
olu
ene
Acc
um
ula
ted (
mm
ole
s/bott
le)
Total Phenylalanine provided (mmole/bottle)

51
3.4.7 Enrichment Cultures Established on Other Sampling Dates
Additional attempts to establish toluene-producing enrichment cultures utilizing
groundwater collected at later dates as inoculum provided inconsistent results. However,
groundwater collected from Well SP024 on July 18, 2016 showed a distinct potential for toluene
production, seven months after the last notable in situ toluene concentration at this location. The
groundwater obtained was transferred into Modified TP medium with phenylalanine (132 mg/L)
as a precursor. While toluene concentrations were initially below 0.1 mg/L, two replicates
analyzed on Day 30 showed aqueous-phase toluene concentrations of 42.8 mg/L and 45.5 mg/L;
another replicate analyzed on Day 51 had an aqueous-phase toluene concentration of 25.5 mg/L.
However, none of the other 21 replicates analyzed from this experimental series during the course
of an incubation period lasting a total of 62 days, had detectable levels of toluene greater than 0.1
mg/L.
Groundwater collected from Well SP013 on November 21, 2016, also showed potential for
toluene production, nine months after that last in situ toluene concentration above the 1 mg/L
drinking water MCL at this location. The groundwater, which was transferred into Modified TP
medium with phenylacetic acid (82 mg/L) as a precursor, had initial toluene concentrations below
the detection limit (<0.1 mg/L). Of the duplicate serum bottles analyzed at 12 time-steps, over an
incubation period lasting 21 days, a single replicate of the 24 bottles analyzed showed appreciable
aqueous-phase toluene accumulation with 13.0 mg/L on Day 17. A plausible explanation for these
inconsistent results could be a lack of viable cells present at high enough concentrations in the
inoculum groundwater.

52
4 OVERALL CONCLUSIONS AND RECOMMENDATIONS FOR
FUTURE RESEARCH
Experimental results described in this thesis provide compelling support for the notion that
in situ microbial populations can biologically produce toluene in groundwater following
subsurface injection of molasses. Furthermore, microbial populations able to produce toluene
persisted in groundwater over time. Groundwater samples collected from Well SP024 in October
2015, November 2015, and July 2016 all yielded cultures that produced toluene under laboratory
conditions. The toluene-production ability of the groundwater microbial population was able to
persist in laboratory samples stored at 4˚C for over 15 months. The toluene-producing microbial
community was also found to be spatially distributed within the distal plume treatment zone with
successful laboratory enrichment from groundwater collected from wells SP013 as well as SP024.
Results of enrichment experiments provide supporting evidence that toluene producing cultures
can be propagated utilizing medium as described by Zargar et al. (2016). Furthermore, with direct
correlation of precursor supplied to toluene accumulated, there is strong evidence that both
phenylalanine and phenylacetic acid can be converted into toluene.
Now that a viable medium has been identified, which appears capable of propagating a
toluene-producing culture, there are multiple options available for future research. One
recommendation for future research is to explore the pH range of which the cultures are capable
of producing toluene. This may provide some insights, for those performing enhanced
bioremediation treatment, on pH ranges which may avoid unintended toluene.
Further study could also be dedicated to on site monitoring of phenylalanine and phenyl
acetate concentrations on site to distinguish which, if either, may be the underlying causes of in
situ toluene production. In the same scope, as Fischer-Romero et al. (1996) also reported
conversion of both phenyllactate and phenylpyruvate into toluene, in addition to the precursors

53
studied above, further study could be dedicated into other possible precursors which may be
utilized by the enrichment cultures (or potential isolates).
Another recommendation for future research, would be the isolation and description of the
microbial organism(s) responsible for toluene production. Because neither the TP medium as
described by Fischer-Romero et al. (1996) nor the DSMZ 500 medium seemed to produce toluene,
biogenically formed toluene at the site reported on in this thesis may be caused by a novel toluene-
producing species. Identification of the microorganisms responsible for toluene production would
facilitate development of techniques for monitoring their presence or abundance and could prove
useful for ultimately identifying locations where enhanced bioremediation activities could
unintentionally stimulation toluene production.

54
5 REFERENCES
Agency for Toxic Substances and Disease Registry (ASTDR). (2015) Toxicological Profile for
Toluene. U.S. Department of Health and Human Services, Atlanta, GA.
Altenschmidt, U., and Fuchs, G., (1991) Anaerobic Degradation of Toluene in Denitrifying
Pseudomonas sp.: Indication for Toluene Methylhydroxylation and Benzoyl-CoA as
Central Aromatic Intermediate. Archives of Mircobiology, 156: 152 – 158.
Beller H. R., and Edwards E. A., (2000) Anaerobic Toluene Activation by Benzylsuccinate
Synthase in a Highly Methanogenic Culture. Applied and Environmental Microbiology,
66 (12): 5503-5505. [doi: 10.1128/AEM.66.12.5503-5505.2000]
Beller H.R., and Spormann, A.M., (1997) Benzylsuccinate Formation as a Means of Anaeroic
Toluene Activation by Sufate-Reducing Strain PRTOL1. Applied and Environmental
Microbiology, 63 (9): 3729 – 3731. [doi: 0099-2240/97]
Beller H.R., and Reinhard M., (1995) The Role of Iron in Enhancing Anaerobic Toluene
Degradation in Sulfate-Reducing Enrichment Cultures. Microbial Ecology 30: 105 – 114.
[doi: 10.1007/BF00184517]
Biegert, T., Fuchs, G., and Heider, J., (1996) Evidence that Anaerobic Oxidation of Toluene in
the Denitrifying Bacterium Thauera aromatica is Initiated by Formation of
Benzylsuccinate from Toluene and Fumarate. European Journal of Biochemistry, 238:
661 – 668. [doi: 10.1111/j.1432-1033.1996.0661w.x]
Billings A., Fortney J., Hazen T., Simmons B., Davenport K., Goodwin L., Ivanova N., Kyrpides
N., Mavromatis K., Woyke T., and DeAngelis K., (2015) Genome Sequence and
Description of the Anaerobic Lignin-Degrading Bacterium Tolumonas lignolytica sp.
nov. Standards in Genomic Sciences, 10: 106 [doi: 10.1186/s40793-015-0100-3]
Bowman, K. S., Moe, W. M., Rash, B. A., Bae, H. S. and Rainey, F. A., (2006). Bacterial
diversity of an acidic Louisiana groundwater contaminated by dense nonaqueous-phase
liquid containing chloroethanes and other solvents. FEMS Microbiol Ecol, 58: 120 – 133.
Caldwell M.E., Allen T.D., Lawson P.A., and Tanner R.S., (2011) Tolumonas osonensis sp. nov.,
Isolated from Anoxic Freshwater Sediment, and Emended Description of the Genus
Tolumonas. International Journal of Systematic and Evolutionary Microbiology, 61:
2659 – 2663. [doi: 10.1099/ijs.0.023853-0]
Cervantes, F.J., Kijksma, W., Duong-Dac, T., Ivanova, A., Lettinga, G., and Field, J.A. (2001)
Anaerobic Mineralization of Toluene by Enriched Sediments with Quinones and Humus
as Terminal Electron Acceptors. Applied and Environmental Microbiology, 67 (10): 4471
– 4478. [doi: 10.1128/AEM.67.10.4471-4478.2001]

55
Coates, J.D., Chakraborty, R., Lack, J.G., O’Connor, S.M., Cole, K.A., Bender, K.S., and
Achenbach, L.A., (2001) Anaerobic Benzene Oxidation Coupled to Nitrate Reduction in
Pure Culture by Two Strains of Dechloromonas. Nature, 411: 1039 – 1043 [doi:
10.1038/35082545]
Delzer, G.C., Zogorski, J.S., Lopes, T.J., and Bosshart, R.L., (1996) Occurrence of the Gasoline
Oxygenate MTBE and BTEX Compounds in Urban Stormwater in the United States,
1991-95. Water-Resource Investigations Report, U.S. Geological Survey 96-4145.
Edwards, E. A., Wills, L.E., Reinhard, M., and Grbic-Galic, D., (1992) Anaerobic Degradation
of Toluene and Xylene by Aquifer Microorganisms under Sulfate-Reducing Conditions.
Applied and Environmental Microbiology 58 (3): 794 – 800. [doi: 0099-2240/92/030794-
07]
Edwards E., and Grbic-Galic, D., (1994) Anaerobic Degradation of Toluene and o-Xylene by a
Methanogenic Consortium. Applied and Environmental Microbiology, 60 (1): 313-322
[doi: 0099-2240/94]
Eichler B., and Pfennig N. (1988) A new purple sulfur bacterium from stratified freshwater
lakes, Amoebobacter purpureus sp. nov. Archives of Microbiology, 149:395-400.
EPA (2015) WEB. http://water.epa.gov/drink/contaminants/basicinformation/toluene.cfm
Ficker, M., Krastel, K., Orlicky, S., and Edwards, E., (1999) Molecular Characterization of a
Toluene-Degrading Methanogenic Consortium. Applied and Environmental
Microbiology, 65 (12): 5576 – 5585. [doi: 0099-2240/99]
Fischer-Romero C., Tindall B.J., and Jüttner F., (1996) Tolumonas auensis gen. nov., sp. nov., a
Toluene-Producing Bacterium from Anoxic Sediments of a Freshwater Lake.
International Journal of Systematic Bacteriology, 46 (1): 183 – 188. [doi:
10.1099/00207713-46-1-183]
Fowler, J.S, Dong, X., Sensen, C.W., Suflita, J.M., and Gleg, L.M., (2012) Methanogenic
Toluene Metabolism: Community Structure and Intermediates. Environmental
Microbiology, 14 (3): 754 – 764. [doi: 10.1111/j.1462-2920.2011.02631.x]
Frazer, A.C., Coschigano, P.W., and Young, L.Y., (1995) Toluene Metabolism under Anaerobic
Conditions. Anaerobe, 1 (6): 293 – 303 [doi: 10.1006/anae.1995.1030]
Grbic-Galic, Dunja and Vogel, Timothy M., (1987) Transformation of Toluene and Benzene by
Mixed Methanogenic Cultures. Applied and Environmental Microbiology, 54 (2): 254 –
260. [doi: 0099-2240/87/020254-07]

56
Hurek, T., and Reinhold-Hurek, B., (1995) Identification of Grass-Associated and Toluene-
Degrading Diazotrophs, Azoarcus spp., by Analyses of Partial 16S Ribosomal DNA
Sequences. Applied and Environmental Microbiology, 61 (6): 2257 – 2261. [doi: 0099-
2240/95]
Huang, WH., Dong, CD., Chen, CW., Surampalli, R.Y., Kao, C.M., (2017) Application of
Sulfate Reduction Mechanisms for the Simultaneous Bioremediation of Toluene and
Copper Contaminated Groundwater. International Biodeteriouration & Biodegradation,
124: 215 – 222. [doi: 10.1016/j.ibiod.2017.03.017]
Jüttner F. and Henatsch J.J., (1986) Anoxic Hypolimnion is a Significant Source of Biogenic
Toluene. Nature, 323: 797 – 798. [doi:10.1038/323797a0]
Jüttner F., (1990) Distribution of Toluene in Stratified Lakes and River Dams of Southwest
Germany. Verh Int Verein Limnol. 24: 279 – 281. Print
Kanapuli, U., Griebler, C., Beller, H.R, and Meckenstock, R.U., (2008) Identification of
Intermediates Formed During Anaerobic Benzene Degradation by an Iron-Reducing
Enrichment Culture. Environmental Microbiology, 10 (7): 1703-1712. [doi:
10.1111/j.1462-2920.2008.01588.x]
Kane, S.R., Beller, H.R., Legler, T.C., and Anderson, R.T. (2002) Biochemical and Genetic
Evidence of Benzylsuccinate Synthase in Toluene-Degrading, Ferric Iron-Reducing
Geobacter metallireducens. Biodegradation, 13: 149 – 154. [doi:
10.1023/A:1020454831407]
Kim, S.J., Park, S.J., Cha, I.T., Min, D., Kim, J.S., Chung, W.H., Chae, J.C., Jeon, C.O., and
Rhee, S.K., (2013) Metabolic Versatility of Toluene-Degrading, Iron-Reducing Bacteria
in Tidal Flat Sediment, Characterized by Stable Isotope Probing-Based Metagenomic
Analysis. Environmental Microbiology, 16 (1): 189 – 204. [doi: 10.1111/1462-
2920.12277]
Langenhoff, A.A.M., (1997) Ph.D. thesis. Biodegradation of Toluene, Benzene and Naphthalene
under Anaerobic Conditions. Wageningen University, Wageningen, The Netherlands.
Leuthner, B., Leutwein, C., Schulz, H., Horth, P., Haehnel, W., Schiltz, E., Schagger, H., and
Heider, J., (1998) Biochemical and Genetic Characterization of benzylsuccinate synthase
from Thauera aromatica: a New Glyclyl Radical Enzyme Catalyisng the First Step in
Anaerobic Toluene Metabolism. Molecular Microbiology, 28 (3): 615 – 628. [doi:
10.1046/j.1365-2958.1998.00826.x]
Leutwein, C., and Heider, J., (1999) Anaerobic Toluene-Catabolic Pathway in Denitrifying
Thauera aromatica: Activation and β-Oxidation of the First Intermediate, (R)-(+)-
Benzylsuccinate. Microbiology, 145: 3265 – 3271. [doi: 10.1099/00221287-145-11-
3265]

57
Leutwein, C., and Heider, J., (2001) Succinyl-CoA: (R)-Benzylsuccinate CoA-Transferase: and
Enzyme of the Anaerobic Toluene Catabolic Pathway in Denitrifying Bacteria. Journal of
Bacteriology, 183 (14): 4288 – 4295. [doi: 10.1128/JB.183.14.4288-4295.2001]
Liu, A., Garcia-Dominguez, E., Rhine, E.D., Young, L.Y., (2004) A Novel Arsenate Respiring
Isolate That Can Utilize Aromatic Substrates. FEMS Microbiology Ecology, 48 (3): 323 –
332. [doi: 10.1016/j.femsec.2004.02.008]
Marczak, M., Wolska, L., and Namiesnik, J., (2006) Determination of Toluene Formed During
Fermentation of Sewage Sludge. International Journal of Environmental Studies, 63 (2):
171 – 178. [doi: 10.1080/00207230600662310]
Morasch, B., Schink, B., Tebbe, C.C., Meckenstock, R.U., (2004) Degradation of o-xylene and
m-xylene by a novel sulfate-reducer belonging to the genus Desulfotomaculum. Archives
of Microbiology, 181 (6): 407 – 417. [doi: 10.1007/s00203-004-0672-6]
Mrowiec B., Suschka, J., and Keener, T., (2005) Formation and Biodegradation of Toluene in the
Anaerobic Sludge Digestion Process. Water Environment Research, 77 (3): 274 – 278.
[doi:10.2175/106143005x41852]
Mrowiec B., (2014) Toluene in Sewage and Sludge in Wastewater Treatment Plants. Water
Science & Technology, 69 (1):128 – 34. [doi: 10.2166/wst.2013.563]
Namdunk, E. and Rittmann, B.E., (1987) Estimating Volitile Organic Compound Emissions
from Publicly Owned Treatment Works. Journal of the Water Pollution Control
Federation, 59 (7): 670 – 678. PRINT
Narez, H., (2010) Master’s thesis. Hydrogen Production from Molasses Using Chlorinated
Alkane-Contaminated Groundwater as an Inoculum. Lousiana State University. Baton
Rouge, Louisisna.
Ommedal, H. and Torsvik, T. (2007) Desulfotignum toluenicum sp. nov., a Novel Toluene-
Degrading, Sulfate-Reducing Bacterium Isolatied from an Oil-Reservoir Model Column.
International Journal of Systematic Bacteriology. 57: 2865 – 2869. [doi:
10.1099/ijs.065067-0]
Peng, J. and Wan, A., (1997) Measurement of Henry’s Constants of High-Volatility Organic
Compounds Using a Headspace Autosampler. Environmental Acience and Technology,
31 (10): 2998 – 3003. [doi:10.1021/es970240n]
Pfennig N., and Trüper H.G. (1981) Isolation of members of the families Chromatiaceae and
Chlorobiaceae. In Starr HP, Stolp H, Trüper H.G., Balows A. and Schlegel HG (eds) The
Prokaryotes. A HandBook on Habitats, Isolation, and Identification of Bacteria.
Springer, Berlin Heidelberg New York, pp 179-289.

58
Pons J.L., Rimbault A., Darbord J.C. and Leluan G., (1984) Biosynthèse de toluène chez
Clostridium aerofoetidum souche WS (Biosythesis of toluene by Clostridium
aerofoetidum strain WS). Annales de Microbiologie, B135 (2), 219 – 222. (Abstract in
English, article in French) [doi: 10.1016/S0769-2609(84)80029-0]
Rabus, R., Nordhaus, R., Ludwig, W., and Widdel, F., (1993) Complete Oxidation of Toluene
under Strictly Anoxic Conditions by a New Sulfate-Reducing Bacterium. Applied and
Environmental Microbiology, 49 (5): 1444 – 1451. [doi: 0099-2240/93/05144-08]
Rabus, R. and Widdel, F., (1995) Anaerobic degradation of Etheylbenzene and Other Aromatic
Hydrocarbons by New Denitrifying Bacteria. Archives of Microbiology, 163 (2): 96 –
103. [doi: 10.1007/s002030050177]
Reinhard, M., Hopkins, G., Steinle-Darling, E., and LeBron, C., (2005) In Situ Biotransformation
of BTEX Compounds under Methanogenic Conditions. Ground Water Monitoring &
Remediation 25 (4): 50 – 59. [doi: 10.1111/j.1745-6592.2005.00046.x]
Shinoda, Y., Sakai, Y., Uenishi, H., Uchihashi, Y., Hiraishi, A., Yukawa, H., Yurimoto, H., and
Kato, N., (2004) Aerobic and Anaerobic Toluene Degradation by a Newly Isolated
Denitrifying Bacterium, Thauerra sp. Strain DNT-1. Applied and Environmental
Microbiology, 70 (3) 1385 – 1392. [doi: 10.1128/AEM.70.3.1385-1392.2004
Sober, H.A. (1970) Handbook on Biochemistry: Selected Data for Molecular Biology. The
Chemical Rubber Co., Cleveland, Ohio.
Suschka J., Mrowiec B., and Kuszmider G., (1996) Volatile Organic Compounds (VOC) at
Some Sewage Treatment Plants in Poland. Water Science and Technology, 33 (12): 273 –
276. [doi:10.1016/0273-1223(96)00485-4]
Thauer, R.K., Jungermann, K., and Decker, K., (1977) Energy Conservation in Chemotrophic
Anaerobic Bacteria. Bacteriology Reviews, 41 (1): 100 – 180.
Toxic Releases Inventory (TRI) Report (2016) EPA. WEB. https://www.epa.gov/toxics-release-
inventory-tri-program/tri-data-and-tools
Trautwein, K., Kuhner, S., Wohlbrand, L., Halder, T., Kuchta, K., Steinbuchel, S., and Rabus,
R., (2008) Solvent Stress Response of the Denitrifying Bacterium “Aromatoleum
Aromaticum” Strain EbN1. Applied and Environmental Microbiology, 74 (8) 2267 –
2274. [doi: 10.1128/AEM.02381-07]
Whitehead, T.R., Price, N.P., Drake, H.L., and Cotta, M.A., (2008) Catabolic Pathway for the
Production of Skatole and Indoleacetic Acid by the Acetogen Clostridium drakei,
Clostridium scatologene, and Swine Manure. Applied and Environmental Microbiology,
74 (6), 1950 – 1953 [doi:0099-2240/08]
59
Wilson S.C., Burnett V., Waterhouse K.S., and Jones K.C., (1994) Volatile Organic Compounds
in Digested United Kingdom Sewage. Environ. Sci. Technol., 28 (2), 259 – 266. [doi:
10.1021/es00051a012]
Yokotama, M. and Carlson, J., (1981) Production of Skatole and para-Cresol by a Rumen
Lactocacillus sp.. Applied and Environmental Microbiology, 41 (1): 71-76. [doi: 0099-
2240/81/010071-06]
Zargar, K., Saville, R., Phelan, R.M., Tringe, S.G., Petzold, C.J., Keasling, J.D. and Beller H.R.,
(2016) In Vitro Characterization of Phenylacetate decarboxylase, a Novel Enzyme
Catalyzing Toluene Biosynthesis in an Anaerobic Microbial Community. Scientific
Reports, 6 (1). [doi:10.1038/srep31362]
Zhou, J., Fries, M.R., Chee-Sanford, J.C., Tiedje, J.M., (1995) Phylogenetic Analyses of a New
Group of Denitrifiers Capable of Anaerobic Growth on Toluene and Description of
Azoarcus tolulyticus sp. nov.. International Journal of Systematic Bacteriology. 45: 500 –
506. [doi:10.1099/00207713-45-3-500]

60
APPENDIX A: PROTOCOL FOR PREPARATION OF MEDIUM
A1: General protocol for Modified TP medium
For initial toluene-production experiments, a modification of medium used for enrichment and
isolation of Tolumonas auensis strains by Fischer-Romero et al. (1996) was employed. The
medium as described by Fischer-Romero et al. (1996) was a modification of a medium (Eichler
and Pfennig, 1988) that was a modification of a medium reported by Pfennig and Trüper (1981).
Using a clean 1 L orange-capped media bottle, add the following:
Constituent Amount
Deionized water 936 mL
KH2PO4 250 mg
NH4Cl 340 mg
KCl 340 mg
MgSO4·7H2O 500 mg
CaCl·2H2O 250 mg
Resazurin solution (1 mg/mL) * 1 mL
* Note: different from Fischer-Romero et al. (1996)
Tightly cap and then autoclave on liquids cycle (121°C and 15 psi, 15 min). Using a newly-
sterilized needle and filter-sterilized gas supply, purge the liquid with filter sterilized N2/CO2
gas. Once cool, add the following (recipes appear on following pages):
Constituent Amount
Vitamin B12 solution 1 mL
Trace element solution SL10 1 mL
NaHCO3 solution 10 mL
Glucose solution 20 mL
Yeast extract solution 2 mL
Phenylalanine solution 20 mL
The constituents listed in the table above can be added to the bottle of cooled medium inside an
anaerobic chamber. After adding the constituents, use a sterile sampling device (sterile pipette or
sterile syringe) to transfer a small aliquot (~5 mL) to a small container and measure pH. Adjust
to pH 7.2 using 2 M sterile stock solution of anoxic HCl or NaOH.
Vitamin B12 solution
In a clean glass container, add 2 mg vitamin B12 to 100 mL distilled water. Filter sterilize,
transferring to a sterile serum bottle. Seal with sterile butyl rubber stopper and aluminum
crimp cap and then purge headspace gas with filter-sterilized N2 or N2/CO2 for 5 minutes.

61
Trace Element Solution SL10
Using a clean 1 L orange-capped media bottle, add the following:
Constituent Amount
Deionized water 500 mL
HCl (37%) 4.25 mL
FeCl2·4H2O 0.75 g
H3BO3 3 mg
MnCl2·4H2O 50 mg
CoCl2·6H2O 95 mg
Zinc Acetate ·2H2O* 72 mg
NiCl2 ·6H2O 12 mg
CuCl2 ·2H2O 1 mg
Na2MoO4 ·2H2O 18 mg
*Note: different from Fischer-Romero et al. (1996)
Cap bottle and shake to dissolve all constituents. Then, divide the resulting 500 mL of solution
evenly between two sterile 500 mL serum bottles (i.e., 250 mL each). Cap with aluminum crimp
caps and butyl rubber stoppers. Purge gas headspace with N2 or N2/CO2, and then autoclave.
NaHCO3 solution
NaHCO3 15 g
Water fill to 100 mL
Dissolve 15 g NaHCO3 into 100 mL total volume using distilled water in a 162 mL serum
bottle. Seal the bottle with rubber stopper and aluminum cap, and purge the headspace with
N2 or N2/CO2 gas for 5 min. Autoclave the bottle on liquid cycle (121oC) for 15 min.
Glucose solution
Glucose 20 g
Water fill to 200 mL
Dissolve 20 g glucose in a clean 500-mL beaker along with deionized water to reach a final
liquid volume of 200 mL. Filter sterilize solution into autoclaved serum bottles on clean
bench using aseptic techniques. Cap with sterile butyl rubber stopper and aluminum crimp
cap, and then purge the gas headspace with filter sterilized N2 or N2/CO2 gas for 5 min.
Yeast extract solution
Yeast extract 0.5 g
Water 50 mL
Place 0.5 g yeast extract in a 100-mL serum bottle along with 50 mL deionized water. Cap
with butyl rubber stopper and aluminum crimp cap, and then purge the headspace with N2 or
N2/CO2 gas for 5 min. Autoclave the bottle on liquid cycle (121oC) for 15 min.

62
Phenylalanine solution
Phenylalanine 660 mg
Water 100 mL
Place 660 mg phenylalanine and 100 mL water in a 162-mL serum. Filter sterilize solution
into autoclaved serum bottles on clean bench using aseptic techniques. Cap with butyl rubber
stopper and aluminum crimp cap, and then purge the headspace with N2 or N2/CO2 gas for 5
min.
A2: General protocol for Zargar Medium
Protocol for Preparation of “Zargar (2016) medium”
Boil water for 20 minutes. While water is heating and boiling, add the constituents listed below
to a clean 500 mL glass serum bottle. Carefully pour 350 mL boiled water into the serum bottle,
and then cap with red butyl rubber stopper. Insert a hypodermic needle through the butyl stopper
(to serve as a gas vent), and then insert a long (6”) stainless steel needle connected to an O2-free
gas cylinder (95% N2: 5% CO2) through the butyl stopper and until it reaches near bottom of the
liquid. Purge with anaerobic gas 5 minutes. Withdraw the vent needle, and then 5 seconds later
withdraw the gas supply syringe. Autoclave to sterilize (use liquids cycle, 121°C, 15 min, 1.43
atm).
The list of constituents for Zargar (2016) medium and the quantity of those constituents per 0.35L
Constituent
Quantity
per 0.35 L
KH2PO4 87.5 mg
NH4Cl 119 mg
KCl 119 mg
Sodium HEPES 1,640 mg
Glucose 350 mg
MgCl2·6H2O 350 mg
MgSO4·7H2O 35 mg
CaCl2·2H2O 43.8 mg
Phenylacetic acid stock solution 3.5 mL
Yeast extract stock solution (see attached) 3.5 mL
Trace element solution (see attached) 0.175 mL
1M HCl solution* 2.5 mL*
*Note: after adding all of the above constituents to 350 mL boiled water, purging, and
autoclaving, the pH of solution is about 7.9 IF the 1 M HCl solution is omitted. Note that there
will be some particulate material visible in the bottles prior to pH adjustment. Most or all of the
visible particulate material will dissolve when the pH is adjusted from 7.9 to 7.1.
**For varying concentration experiment, phenylacetic acid solutions of varying concentrations
will be added (all at 1.0 mL volumes) after media has been dispense, but prior to inoculation.
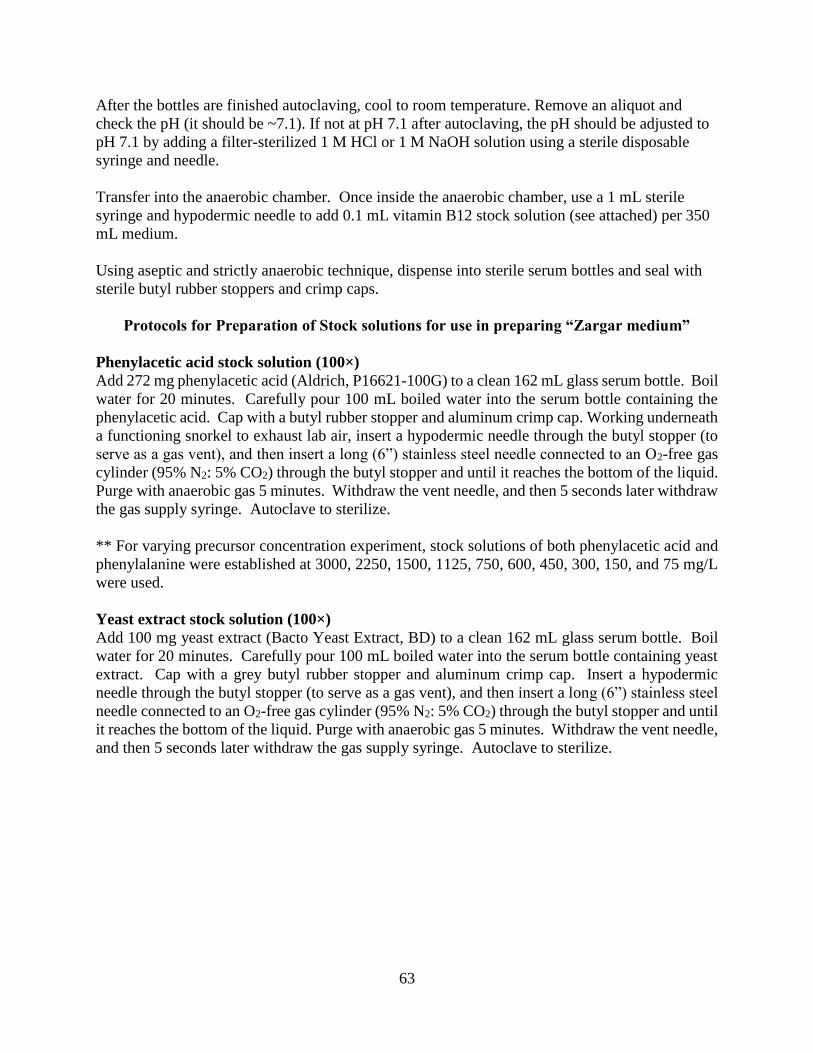
63
After the bottles are finished autoclaving, cool to room temperature. Remove an aliquot and
check the pH (it should be ~7.1). If not at pH 7.1 after autoclaving, the pH should be adjusted to
pH 7.1 by adding a filter-sterilized 1 M HCl or 1 M NaOH solution using a sterile disposable
syringe and needle.
Transfer into the anaerobic chamber. Once inside the anaerobic chamber, use a 1 mL sterile
syringe and hypodermic needle to add 0.1 mL vitamin B12 stock solution (see attached) per 350
mL medium.
Using aseptic and strictly anaerobic technique, dispense into sterile serum bottles and seal with
sterile butyl rubber stoppers and crimp caps.
Protocols for Preparation of Stock solutions for use in preparing “Zargar medium”
Phenylacetic acid stock solution (100×)
Add 272 mg phenylacetic acid (Aldrich, P16621-100G) to a clean 162 mL glass serum bottle. Boil
water for 20 minutes. Carefully pour 100 mL boiled water into the serum bottle containing the
phenylacetic acid. Cap with a butyl rubber stopper and aluminum crimp cap. Working underneath
a functioning snorkel to exhaust lab air, insert a hypodermic needle through the butyl stopper (to
serve as a gas vent), and then insert a long (6”) stainless steel needle connected to an O2-free gas
cylinder (95% N2: 5% CO2) through the butyl stopper and until it reaches the bottom of the liquid.
Purge with anaerobic gas 5 minutes. Withdraw the vent needle, and then 5 seconds later withdraw
the gas supply syringe. Autoclave to sterilize.
** For varying precursor concentration experiment, stock solutions of both phenylacetic acid and
phenylalanine were established at 3000, 2250, 1500, 1125, 750, 600, 450, 300, 150, and 75 mg/L
were used.
Yeast extract stock solution (100×)
Add 100 mg yeast extract (Bacto Yeast Extract, BD) to a clean 162 mL glass serum bottle. Boil
water for 20 minutes. Carefully pour 100 mL boiled water into the serum bottle containing yeast
extract. Cap with a grey butyl rubber stopper and aluminum crimp cap. Insert a hypodermic
needle through the butyl stopper (to serve as a gas vent), and then insert a long (6”) stainless steel
needle connected to an O2-free gas cylinder (95% N2: 5% CO2) through the butyl stopper and until
it reaches the bottom of the liquid. Purge with anaerobic gas 5 minutes. Withdraw the vent needle,
and then 5 seconds later withdraw the gas supply syringe. Autoclave to sterilize.

64
Trace element solution (2000×)
Prepare the trace element solution by Zargar et al., (2016) by dissolving the following constituents
in 100 mL of deionized water in a 162-mL glass serum bottle. Seal with grey butyl rubber stopper
and aluminum crimp cap. Insert a disposable needle connected to an O2-free gas cylinder (95%
N2: 5% CO2) through the butyl stopper into the gas headspace and insert a separate vent
hypodermic needle through the butyl stopper to serve as a vent. Purge the gas headspace with
anaerobic gas 5 minutes. Withdraw the vent needle, and then 5 seconds later withdraw the gas
supply syringe. Autoclave to sterilize.
Constituent Quantity
per 100
mL
7.7 N (25%) HCl* 1.25 mL
FeSO4·7H2O 210 mg
MnCl2·4H2O 10 mg
CoCl2·6H2O 19 mg
ZnCl2 7 mg
NiCl2** 1.3 mg
CuCl2·2H2O 0.2 mg
Na2MoO4·2H2O 3.6 mg
H3BO3 0.6 mg
* In making trace element solution on 3/16/17, used 37% HCl and changed volume to 0.83 mL
to get same concentration in final solution using the acid that we had in lab
** added in the form of NiCl2·6H2O, so added 2.4 mg to match molar concentration
Vitamin B12 stock solution (5000×)
Add 10 mg vitamin B12 (Sigma-Aldrich cat. # V2876-100mg) to a clean beaker. Add 100 mL
deionized water. Stir with a pipette to dissolve. Filter sterilize (using a Fisher Brand 0.2 μm
sterile nylon filter, cat # 09-719C) and transfer to sterile 162 mL glass serum bottle. Cap with a
sterile grey butyl rubber stopper and aluminum crimp cap. Wrap the bottle in aluminum foil or
opaque tape. Using a filter-sterilized gas supply, purge the gas headspace with O2-free gas for 5
minutes Withdraw the vent needle, and then 5 seconds later withdraw the gas supply syringe.
Store in refrigerator.

65
Table A2 Side by side comparison of relevant medium formulations
Tolumonas
isolation
(Fischer-
Romero et al.,
1996)
Modified
TP
Medium
Zargar et al.
(2016)
enrichment
medium
KH2PO4 250 mg/L 250 mg/L 250 mg/L
NH4Cl 340 mg/L 340 mg/L 340 mg/L
KCl 340 mg/L 340 mg/L 340 mg/L
MgSO4 * 7H2O 500 mg/L 500 mg/L 100 mg/L
CaCl2 * 2H2O 250 mg/L 250 mg/L 125 mg/L
MgCl2·6H2O --- --- 1000 mg/L
FeCl2 * 4H2O 0.75 mg/L 0.75 g/L ---
H3BO3 0.003 mg/L 0.003 mg/L 0.003 mg/L
MnCl2 * 4H2O 0.05 mg/L 0.05 mg/L 0.05 mg/L
CoCl2 *6H2O 0.095 mg/L 0.095 mg/L 0.095 mg/L
ZnCl2 0.035 mg/L --- 0.035 mg/L
Zinc Acetate --- 0.047 mg/L ---
NiCl2 *6H2O 0.012 mg/L 0.012 mg/L 0.012 mg/L
CuCl2 * 2H2O 0.001 mg/L 0.001 mg/L 0.001 mg/L
Na2MoO4 * 2H2O 0.018 mg/L 0.018 mg/L 0.018 mg/L
FeSO4·7H2O --- --- 1.05 mg/L
NaHCO3 1.5 g/L 1.5 g/L ---
Sodium HEPES --- --- 4.685 g/L
Na2S 5 mmol Na2S --- ---
C6H12O6 (Glucose) 1 g/L 2 g/L 1 g/L
yeast extract 10 mg/L 10 mg/L 10 mg/L
Vitamin B12 .02 mg/L .02 mg/L .03 mg/L
Adjusted pH [using
sterile HCl or NaOH
(2M each)]
7.2
7.2 7.1

66
Figure A.1. Toluene concentration per bottle as a function of initial phenylalanine concentration
after 6 weeks of incubation.
0.000
0.050
0.100
0.150
0.200
0.250
0.300
0.350
0.400
0.450
0.500
0.00 0.50 1.00 1.50 2.00 2.50 3.00
Fin
al T
olu
ene
Conce
ntr
atio
n (
mm
ol)
Initial Phenylalanine Conc (mmol)
2g/Lglucose
0.3 glucose
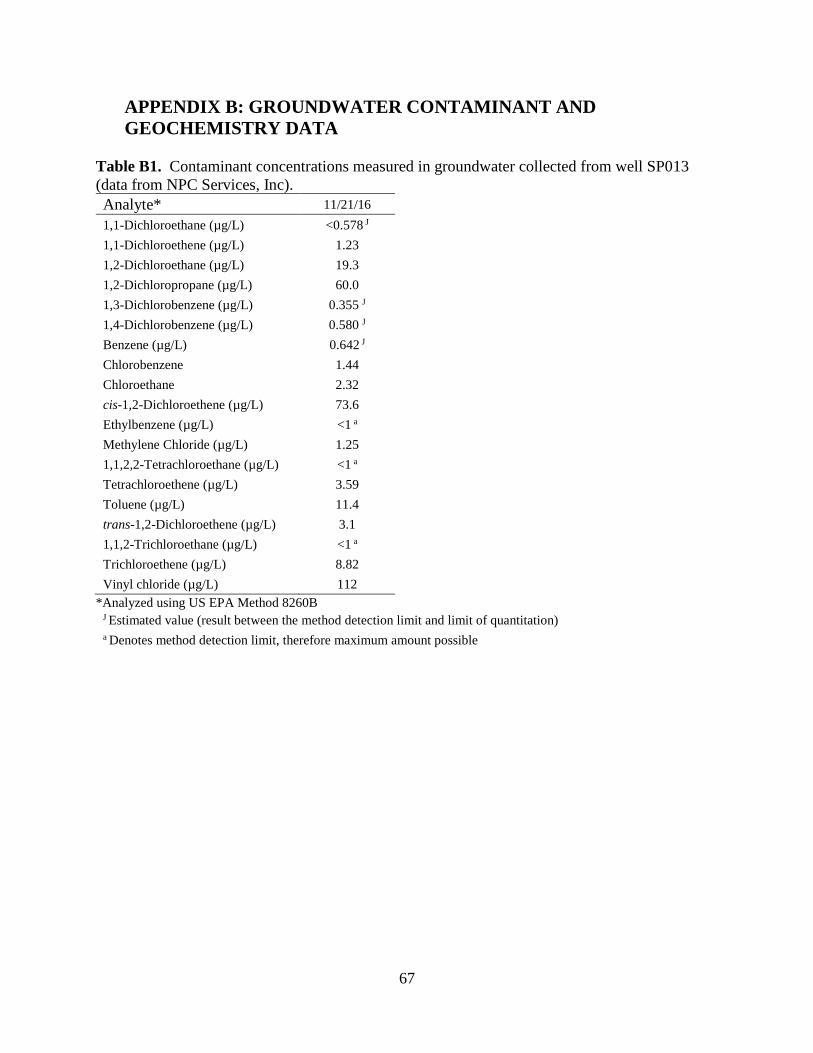
67
APPENDIX B: GROUNDWATER CONTAMINANT AND
GEOCHEMISTRY DATA
Table B1. Contaminant concentrations measured in groundwater collected from well SP013
(data from NPC Services, Inc).
Analyte* 11/21/16
1,1-Dichloroethane (µg/L) <0.578 J
1,1-Dichloroethene (µg/L) 1.23
1,2-Dichloroethane (µg/L) 19.3
1,2-Dichloropropane (µg/L) 60.0
1,3-Dichlorobenzene (µg/L) 0.355 J
1,4-Dichlorobenzene (µg/L) 0.580 J
Benzene (µg/L) 0.642 J
Chlorobenzene 1.44
Chloroethane 2.32
cis-1,2-Dichloroethene (µg/L) 73.6
Ethylbenzene (µg/L) <1 a
Methylene Chloride (µg/L) 1.25
1,1,2,2-Tetrachloroethane (µg/L) <1 a
Tetrachloroethene (µg/L) 3.59
Toluene (µg/L) 11.4
trans-1,2-Dichloroethene (µg/L) 3.1
1,1,2-Trichloroethane (µg/L) <1 a
Trichloroethene (µg/L) 8.82
Vinyl chloride (µg/L) 112
*Analyzed using US EPA Method 8260B J Estimated value (result between the method detection limit and limit of quantitation)
a Denotes method detection limit, therefore maximum amount possible

68
Table B2. Geochemical parameters measured in groundwater collected from well SP013 (data
from NPC Services, Inc).
Analyte* 11/21/16
Ethane (µg/L) 0.293 J
Ethene (µg/L) 3.41
Methane (µg/L) 13700
Nitrate (mg/L-N) <0.01 a
Nitrite (mg/L-N) 0.02
Sulfate (mg/L) 2.39
Total Alkalinity (mg/L as CaCO3) 1770
Ferrous iron (mg/L) 16.6
Chloride (mg/L) 6760
Sulfide (mg/L) 3.21
Total organic carbon (mg/L) 974
*Analyzed as described by Bowman et al. (2006) J Estimated value (result between the method detection limit and limit of quantitation)
a Denotes upper detection limit, therefore maximum amount possible

69
Table B3. Contaminant concentrations measured in groundwater collected from well SP024 (data from NPC Services, Inc).
Analyte* 5/22/13 6/13/13 9/25/13 2/4/14 4/23/14 7/14/14 2/26/15 8/6/15 10/14/15 11/3/15 11/18/15
1,1-Dichloroethane (µg/L) <1 a <1 a <1 a <500 a <200 a <50 a <1 a <5 a <0.2 a <40 a <4 a
1,1-Dichloroethene (µg/L) <1 a <1 a <1 a <500 a <200 a <50 a <1 a <5 a <0.2 a <40 a <4 a
1,2-Dichloroethane (µg/L) 2.42 3.24 3 <500 a <200 a <50 a <1 a 9.11 5.36 <40 a <4 a
1,2-Dichloropropane (µg/L) 2.12 5.47 2.9 <500 a <200 a <50 a <1 a 0.659 <0.2 a <40 a <4 a
Benzene (µg/L) <1 a <1 a 0.264 J <500 a <200 a <50 a <1 a <5 a <0.2 a <40 a <4 a
Chlorobenzene (µg/L) <1 a <1 a <1 a <500 a <200 a <50 a <1 a <5 a <0.2 a <40 a <4 a
cis-1,2-Dichloroethene (µg/L) <1 a 0.54 J 8.45 <500 a <200 a <50 a <1 a <5 a <0.2 a <40 a <4 a
Ethylbenzene (µg/L) <1 a <1 a <1 a <500 a <200 a <50 a <1 a <5 a <0.2 a <40 a <4 a
Methylene Chloride (µg/L) <1 a <1 a <1 a <500 a <200 a <50 a <1 a <5 a <0.2 a <40 a <4 a
1,1,2,2-Tetrachloroethane (µg/L) <1 a <1 a <1 a <500 a <200 a <50 a <1 a <5 a <0.2 a <40 a <4 a
Tetrachloroethene (µg/L) <1 a ** ** ** ** <50 a <1 a <5 a 0.926 J <40 a <4 a
Toluene (µg/L) <1 a <1 a 139 29000 15000 4800 1.19 1.77 103 19000 2,790
trans-1,2-Dichloroethene (µg/L) <1 a <1 a <1 a <500 a <200 a <50 a <1 a <5 a <0.2 a <40 a <4 a
1,1,2-Trichloroethane (µg/L) 8.87 14.3 <1 a <500 a <200 a <50 a <1 a 0.951 <0.2 a <40 a <4 a
Trichloroethene (µg/L) <1 a ** ** ** ** <50 a <1 a <5 a 0.718 J <40 a <4 a
Vinyl chloride (µg/L) <1 a 1.33 <1 a <500 a <200 a <50 a 1.03 <5 a <0.2 a <40 a <4 a
*Analyzed using US EPA Method 8260B
**data not available J Estimated value (result between the method detection limit and limit of quantitation)
a Denotes upper detection limit, therefore maximum amount possible
(Table B3. Continued)

70
Analyte* 12/16/15 3/3/16 7/18/16
1,1-Dichloroethane (µg/L) <20 a <0.2 a <0.2 a
1,1-Dichloroethene (µg/L) <20 a <0.2 <0.2 a
1,2-Dichloroethane (µg/L) <20 a 0.416 J <0.2 a
1,2-Dichloropropane (µg/L) <20 a 0.504 J 0.689 J
Benzene (µg/L) <20 a <0.2 a <0.2 a
Chlorobenzene (µg/L) <20 a <0.2 a <0.2 a
cis-1,2-Dichloroethene (µg/L) <20 a 0.557 J <0.2 a
Ethylbenzene (µg/L) <20 a <0.2 a <0.2 a
Methylene Chloride (µg/L) <20 a <0.2 a <0.2 a
1,1,2,2-Tetrachloroethane (µg/L) <20 a <0.2 a <0.2 a
Tetrachloroethene (µg/L) <20 a <0.2 a <0.2 a
Toluene (µg/L) 14,900 146 2.71
trans-1,2-Dichloroethene (µg/L) <20 a <0.2 a <0.2 a
1,1,2-Trichloroethane (µg/L) <20 a <0.2 a <0.2 a
Trichloroethene (µg/L) <20 a <0.2 a <0.2 a
Vinyl chloride (µg/L) <20 a 0.821 <0.2 a
*Analyzed using US EPA Method 8260B J Estimated value (result between the method detection limit and limit of quantitation)
a Denotes upper detection limit, therefore maximum amount possible
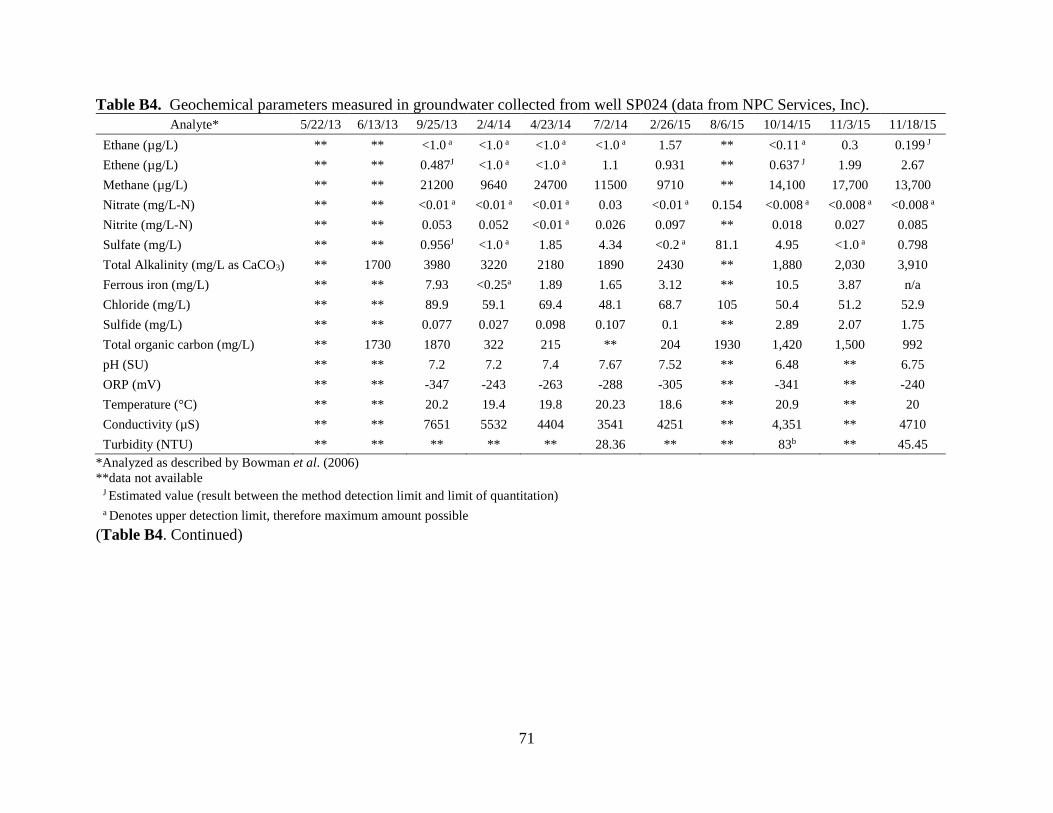
71
Table B4. Geochemical parameters measured in groundwater collected from well SP024 (data from NPC Services, Inc).
Analyte* 5/22/13 6/13/13 9/25/13 2/4/14 4/23/14 7/2/14 2/26/15 8/6/15 10/14/15 11/3/15 11/18/15
Ethane (µg/L) ** ** <1.0 a <1.0 a <1.0 a <1.0 a 1.57 ** <0.11 a 0.3 0.199 J
Ethene (µg/L) ** ** 0.487J <1.0 a <1.0 a 1.1 0.931 ** 0.637 J 1.99 2.67
Methane (µg/L) ** ** 21200 9640 24700 11500 9710 ** 14,100 17,700 13,700
Nitrate (mg/L-N) ** ** <0.01 a <0.01 a <0.01 a 0.03 <0.01 a 0.154 <0.008 a <0.008 a <0.008 a
Nitrite (mg/L-N) ** ** 0.053 0.052 <0.01 a 0.026 0.097 ** 0.018 0.027 0.085
Sulfate (mg/L) ** ** 0.956J <1.0 a 1.85 4.34 <0.2 a 81.1 4.95 <1.0 a 0.798
Total Alkalinity (mg/L as CaCO3) ** 1700 3980 3220 2180 1890 2430 ** 1,880 2,030 3,910
Ferrous iron (mg/L) ** ** 7.93 <0.25a 1.89 1.65 3.12 ** 10.5 3.87 n/a
Chloride (mg/L) ** ** 89.9 59.1 69.4 48.1 68.7 105 50.4 51.2 52.9
Sulfide (mg/L) ** ** 0.077 0.027 0.098 0.107 0.1 ** 2.89 2.07 1.75
Total organic carbon (mg/L) ** 1730 1870 322 215 ** 204 1930 1,420 1,500 992
pH (SU) ** ** 7.2 7.2 7.4 7.67 7.52 ** 6.48 ** 6.75
ORP (mV) ** ** -347 -243 -263 -288 -305 ** -341 ** -240
Temperature (°C) ** ** 20.2 19.4 19.8 20.23 18.6 ** 20.9 ** 20
Conductivity (µS) ** ** 7651 5532 4404 3541 4251 ** 4,351 ** 4710
Turbidity (NTU) ** ** ** ** ** 28.36 ** ** 83b ** 45.45
*Analyzed as described by Bowman et al. (2006)
**data not available J Estimated value (result between the method detection limit and limit of quantitation)
a Denotes upper detection limit, therefore maximum amount possible
(Table B4. Continued)

72
Analyte* 12/16/15 3/3/16 7/18/16
Ethane (µg/L) <0.11 a 3.3 7.53
Ethene (µg/L) 2.59 3.01 <0.15 a
Methane (µg/L) 10,400 14300 23000
Nitrate (mg/L-N) <0.008 a <0.008 a <0.008 a
Nitrite (mg/L-N) 0.026 0.017 0.022
Sulfate (mg/L) 1.22 2.34 1.24 J
Total Alkalinity (mg/L as CaCO3) 2,800 2370 1430
Ferrous iron (mg/L) 4.39 3.25 2.58
Chloride (mg/L) 64.7 66.3 52.2
Sulfide (mg/L) 0.029 1.87 <0.098 a
Total organic carbon (mg/L) 123 102 88.3
pH (SU) 7.15 7.32 7.04
ORP (mV) -234 -255 -211
Temperature (°C) 20 20.2 20.4
Conductivity (µS) 4731 4519 2906
Turbidity (NTU) 30.57 30.6 10.7
*Analyzed as described by Bowman et al. (2006)
**data not available J Estimated value (result between the method detection limit and limit of quantitation)
a Denotes upper detection limit, therefore maximum amount possible

73
APPENDIX C: COPYRIGHTS CLEARANCE AND PERMISSION
The permission below applies to information in Figure 2.4 of Chapter 2
74
The permission below applies to information in Table 2.4 of Chapter 2

75
The permission below applies to information in Figure 2.2 of Chapter 2

76
The permission below applies to information in Table 2.2 of Chapter 2

77
The permission below applies to information in Figure 2.5 of Chapter 2
78
The permission below applies to information in Figure 2.6 of Chapter 2

79
VITA
M. Aaron Griffin Jr., first born of Michael Griffin and Jerrianne Landaiche, was raised in
St. Gabriel, La. Aaron spent a substantial portion of his youth attending a multitude of LSU
sporting events with the most dedicated LSU sports fan, his grandmother Dora Landaiche. After
graduating from East Ascension High School, Aaron moved to Atlanta, Ga. where he worked as a
Portability Specialist for the H.U.D. Section 8 - Rental Assistance Program administered by the
State of Georgia. After learning of LSU’s bachelor's in environmental engineering program, Aaron
returned to Louisiana and began attending LSU in Spring of 2012. After completing his Bachelor
of Science in Environmental Engineering in May 2015, Aaron was inspired to apply to graduate
school by his professor and mentor Dr. William Moe, with whom as an undergrad, he was
employed as a lab assistant. Aaron is a candidate to receive his Master’s of Science degree in Civil
Engineering and plans to collect his diploma during the May 2018 commencement ceremony.