![A New Intuitionistic Fuzzy ELECTRE II approach to …making[11] are some of the developed methods in ELECTRE. In this paper a new method is developed in which Intuitionistic fuzzy](https://static.fdocuments.net/doc/165x107/5f3a61ebea628003b15dbe26/a-new-intuitionistic-fuzzy-electre-ii-approach-to-making11-are-some-of-the-developed.jpg)
An evaluation of multi-criteria methods in integrated ... · Methods compared include value and...
28
JOURNAL OF MULTI-CRITERIA DECISION ANALYSIS J. Multi-Crit. Decis. Anal. 10: 229–256 (2001) DOI: 10.1002/mcda.305 An Evaluation of Multi-Criteria Methods in Integrated Assessment of Climate Policy MICHELLE L. BELL*, BENJAMIN F. HOBBS, EMILY M. ELLIOTT, HUGH ELLIS, and ZACHARY ROBINSON Department of Geography and Environmental Engineering,The Johns Hopkins University, USA ABSTRACT Those who conduct integrated assessments (IAs) are aware of the need to explicitly consider multiple criteria and uncertainties when evaluating policies for preventing global warming. MCDM methods are potentially useful for understanding tradeoffs and evaluating risks associated with climate policy alternatives. A difficulty facing potential MCDM users is the wide range of different techniques that have been proposed, each with distinct advantages. Methods differ in terms of validity, ease of use, and appropriateness to the problem. Alternative methods also can yield strikingly different rankings of alternatives. A workshop was held in which climate change experts and policy- makers evaluated the usefulness of MCDM for IA. Participants applied several methods in the context of a hypothetical greenhouse gas policy decision. Methods compared include value and utility functions, goal programming, ELECTRE, fuzzy sets, stochastic dominance, min max regret, and several weight selection methods. Ranges, rather than point estimates, were provided for some questions to incorporate imprecision regarding weights. Additionally, several visualization methods for both deterministic and uncertain cases were used and evaluated. Analysis of method results and participant feedback through questionnaires and discussion provide the basis for conclusions regarding the use of MCDM methods for climate change policy and IA analyses. Hypotheses are examined concerning predictive and convergent validity of methods, existence of splitting bias among experts, perceived ability of methods to aid decision-making, and whether expressing imprecision can change ranking results. Because participants gained from viewing a problem from several perspectives and results from different methods often significantly differed, it appears worthwhile to apply several MCDM methods to increase user confidence and insight. The participants themselves recommended such multimethod approaches for policymaking. Yet they preferred the freedom of unaided decision-making most of all, challenging the MCDM community to create transparent methods that permit maximum user control. Copyright # 2002 John Wiley & Sons, Ltd. KEY WORDS: integrated assessment; method evaluation; multi-criteria decision-making; climate change; experiment; weight selection; policy analysis 1. INTRODUCTION ‘‘Greenhouse gases,’’ such as carbon dioxide, methane, nitrous oxide, and water vapor, raise the earth’s temperature by altering the planet’s radiation balance. Anthropogenic emissions of greenhouse gases have increased significantly since the industrial revolution and may enhance the greenhouse effect. If such global warming occurs, grave ecological, social, and economic conse- quences could result. Impacts could include sea- level rise, changed crop yields, stressed ecosystems, and water shortages. Human health may be affected due to heat-related mortality and changes in air pollution and infectious disease patterns. Predicting such impacts involves consideration of interactions between terrestrial, atmospheric, and hydrologic systems, as well as social, political, and economic systems. However, climate change experts are faced with numerous uncertainties and disagree on the magnitude, distribution, and timeframe of global warming impacts (IPCC, 1995; Morgan and Keith, 1995). The possibility of global warming has generated much research and political interest. In 1988, the Intergovern- mental Panel on Climate Change (IPCC), com- prised of 2500 leading climate scientists, was established to assess scientific, technical, and Received 8 January 1999 Accepted 15 November 2001 Copyright # 2002 John Wiley & Sons, Ltd. Published online 14 January 2002 *Correspondence to: DOGEE, The Johns Hopkins University, 313 Ames Hall, 3400 North Charles St., Baltimore, MD 21218, USA. E-mail: [email protected] Contract/grant sponsor: National Science foundation; contract/grant number: NSF SBR9634336.
Transcript of An evaluation of multi-criteria methods in integrated ... · Methods compared include value and...
JOURNAL OF MULTI-CRITERIA DECISION ANALYSIS
J. Multi-Crit. Decis. Anal. 10: 229–256 (2001)
DOI: 10.1002/mcda.305
An Evaluation of Multi-Criteria Methods in Integrated Assessmentof Climate Policy
MICHELLEL. BELL*, BENJAMINF. HOBBS, EMILYM. ELLIOTT, HUGHELLIS, andZACHARYROBINSONDepartment of Geography and Environmental Engineering,TheJohns Hopkins University, USA
ABSTRACT
Those who conduct integrated assessments (IAs) are aware of the need to explicitly consider multiple criteria anduncertainties when evaluating policies for preventing global warming. MCDM methods are potentially useful forunderstanding tradeoffs and evaluating risks associated with climate policy alternatives. A difficulty facing potentialMCDM users is the wide range of different techniques that have been proposed, each with distinct advantages.Methods differ in terms of validity, ease of use, and appropriateness to the problem. Alternative methods also canyield strikingly different rankings of alternatives. A workshop was held in which climate change experts and policy-makers evaluated the usefulness of MCDM for IA. Participants applied several methods in the context of ahypothetical greenhouse gas policy decision. Methods compared include value and utility functions, goalprogramming, ELECTRE, fuzzy sets, stochastic dominance, min max regret, and several weight selection methods.Ranges, rather than point estimates, were provided for some questions to incorporate imprecision regarding weights.Additionally, several visualization methods for both deterministic and uncertain cases were used and evaluated.Analysis of method results and participant feedback through questionnaires and discussion provide the basis forconclusions regarding the use of MCDM methods for climate change policy and IA analyses. Hypotheses areexamined concerning predictive and convergent validity of methods, existence of splitting bias among experts,perceived ability of methods to aid decision-making, and whether expressing imprecision can change ranking results.Because participants gained from viewing a problem from several perspectives and results from different methodsoften significantly differed, it appears worthwhile to apply several MCDM methods to increase user confidence andinsight. The participants themselves recommended such multimethod approaches for policymaking. Yet theypreferred the freedom of unaided decision-making most of all, challenging the MCDM community to createtransparent methods that permit maximum user control. Copyright # 2002 John Wiley & Sons, Ltd.
KEY WORDS: integrated assessment; method evaluation; multi-criteria decision-making; climate change;experiment; weight selection; policy analysis
1. INTRODUCTION
‘‘Greenhouse gases,’’ such as carbon dioxide,methane, nitrous oxide, and water vapor, raisethe earth’s temperature by altering the planet’sradiation balance. Anthropogenic emissions ofgreenhouse gases have increased significantly sincethe industrial revolution and may enhance thegreenhouse effect. If such global warming occurs,grave ecological, social, and economic conse-
quences could result. Impacts could include sea-level rise, changed crop yields, stressed ecosystems,and water shortages. Human health may beaffected due to heat-related mortality and changesin air pollution and infectious disease patterns.
Predicting such impacts involves considerationof interactions between terrestrial, atmospheric,and hydrologic systems, as well as social, political,and economic systems. However, climate changeexperts are faced with numerous uncertainties anddisagree on the magnitude, distribution, andtimeframe of global warming impacts (IPCC,1995; Morgan and Keith, 1995). The possibilityof global warming has generated much researchand political interest. In 1988, the Intergovern-mental Panel on Climate Change (IPCC), com-prised of 2500 leading climate scientists, wasestablished to assess scientific, technical, and
Received 8 January 1999
Accepted 15 November 2001Copyright # 2002 John Wiley & Sons, Ltd. Published online 14 January 2002
*Correspondence to: DOGEE, The Johns HopkinsUniversity, 313 Ames Hall, 3400 North Charles St.,Baltimore, MD 21218, USA. E-mail: [email protected]
Contract/grant sponsor: National Science foundation;contract/grant number: NSF SBR9634336.

socioeconomic information relating to climatechange. At a December 1997 conference in Kyoto,Japan, parties to the United Nations FrameworkConvention on Climate Change agreed to limitgreenhouse gas emissions to below 1990 levels;but the US subsequently announced its withdrawalfrom the agreement, citing economic impactsand scientific uncertainty. Given the importanceand complexity of the issues, climate changepolicy evaluation may benefit from the applica-tion of multi-criteria decision-making (MCDM)methods.
Integrated assessment (IA) aids the understand-ing of climate change consequences by usingcomprehensive models with interrelationshipsand feedbacks among system components (Dow-latabadi and Morgan, 1993; Parson and Fisher-Vanden, 1995; Shlyakhter et al., 1995). The basicfunction of most IAs is system modelling, thesimulation of the response of physical, biological,and/or social systems to changes in inputs,assumptions, and policies. The ultimate purposeof such efforts is to provide policy-makers withunderstanding of how assumptions and policiesaffect system behaviour and associated impacts(Gardiner and Ford, 1980). Some IAs alsoincorporate decision evaluation, the comparisonof options in terms of their risks and performanceon important criteria and the application of valuejudgments to rank or screen alternatives (Rotmansand Dowlatabadi, 1998).
IAs are most useful to policy makers if they areexplicitly linked to decision-making (Bernabo andEglinton, 1992; NAPAP, 1991). This linkage canbe accomplished by building formal decisionanalytic capabilities into models, such as multi-objective tradeoff displays or decision trees. Alter-natively, ‘‘policy-oriented assessments’’ canprovide information on the performance and risksof policy options for use in decision processestaking place outside the IA system (Meo, 1991). Acentral aim of the workshop and the focus of thisarticle is to help bridge the gap between IA systemmodeling and policy evaluation.
Climate change policy-makers face uniquechallenges, such as the lack of a single decision-maker, uncertainties, long time horizons, and theirreversibility of effects. Structured numericalanalysis can aid understanding by managing andanalyzing information and alternatives (Arrowet al., 1996a). The use of MCDM methods hasthe potential to improve the quality of decision byproviding information on tradeoffs, increasing
confidence in the decision, and documenting theprocess. MCDM can thereby function as one ofthe mediums through which decision-makers useand process IA information. Stewart (2000)identifies three distinct roles for decision analysisin such public sector problems: (1) initial impactassessment and screening; (2) ‘‘within interest’’structuring and evaluation; and (3) ‘‘betweeninterest’’ negotiation and decision-making.MCDM can play each of these roles in IA. Thispaper explores the use of MCDM methods in IAto aid policy-oriented impact assessment.
Decision analysis has been used previously tocompare climate policies under uncertainty (Peckand Teisberg, 1996), address tradeoffs involved inassigning relative responsibility for greenhouse gasreduction (Ridgley, 1996), and evaluate sequentialdecision strategies for abating climate change(Hammitt et al., 1992; Valverde et al., 1999). Forinstance, Manne and Richels (1992) compared theeconomic impacts under uncertainty of threeforms of greenhouse ‘‘insurance’’: (1) intensiveresearch to reduce climate and impact uncertain-ties; (2) development of new energy supply andconservation technologies to reduce greenhousegas abatement costs; and (3) immediate reductionsin emissions to slow climate warming. In thispaper, we systematically compare the results of arange of MCDM methods and their potentialusefulness based upon a workshop in whichclimate experts and IA practitioners appliedseveral MCDM methods in the context of IA.
The MCDM methods are summarized inAppendix A. The experiments conducted in theworkshop are unusual in that MCDM methodswere applied and assessed by climate changeexperts, rather than less experienced subjects, suchas students. The specific purposes of the workshopwere to: (1) compare method results and predictivevalidity; (2) evaluate each method’s appropriate-ness and ease of use for climate change policy-making; (3) evaluate multiple visualization techni-ques for displaying tradeoffs for both deterministicand uncertain scenarios; and (4) expose workshopparticipants to MCDM methods and their appli-cation. This paper presents results from theworkshop and discusses their potential implica-tions for the decision analysis community.
Both user evaluations and analysis of methodresults are necessary to evaluate decision supportsystems (Evans and Riha, 1989; Gunderson et al.,1995; Hobbs et al., 1992). Therefore, methodperformance, appropriateness, and ease of use
M. L. BELL ET AL.230
Copyright # 2002 John Wiley & Sons, Ltd. J. Multi-Crit. Decis. Anal. 10: 229–256 (2001)

were assessed through participant feedback (ques-tionnaires and structured discussions), whilemethod results and validity were compared bystatistical analysis of weights and policy rankings.Several limitations of the experiments, such assmall sample size, prevent definitive conclusionsregarding the relative merits of the methods.Nonetheless, such case studies or quasi-experi-ments can provide useful information (Adelman,1991). For instance, such studies often possess anecological validity (realism of problem setting andsophistication of participants) lacked by bettercontrolled experiments, such as those involvinglarge numbers of undergraduates (e.g., Corner andBuchanan, 1997; Le !oon, 1997; Stillwell et al., 1987).Results of quasi-experiments with real practi-tioners and those from controlled experimentswith less experienced subjects can yield moredefinitive conclusions than each type of studyalone (Elmes et al., 1995). Many similar fieldstudies have been conducted with useful results(see reviews in Hobbs, 1986; Huber, 1974; Johnand Edwards, 1978; Leung, 1978; von Winterfeldtand Edwards, 1986).
The following section describes the experimentaldesign and process, including the climate changepolicies considered, the MCDM approaches ex-plored, and experimental design limitations. Thenwe describe the testing of several hypotheses andour conclusions.
2. EXPERIMENTAL DESIGN AND PROCESS
2.1. Climate policies consideredThe workshop explored the following policies forlimiting greenhouse gas emissions and impacts:base case (no new emissions limits); globally
applied tax of $75, $150, or $300 per ton ofcarbon dioxide (CO2) emitted; relaxed sulfurdioxide (SO2) emission standards (which can havea cooling effect); promotion of nuclear powerthrough subsidies for nuclear fuel; and promotionof biomass energy. The policies were comparedrelative to six attributes, which were chosen priorto the workshop to represent key features of theproblem. Although many more attributes wouldbe used in practice, the number was limited to sixso that the problem would be manageable giventhe workshop’s time limitations. The attributesconsidered are temperature increase (from 1990 to2050), ecosystem stress (in 2050), sea-level rise(from 1990 to 2050), annualized SO2 emissions(from 1990 to 2050), annualized nuclear wastegeneration (from 1990 to 2050), and annualizedcontrol cost compared to the base case (in 2050)).Some exercises used four attributes for simplicity(temperature increase, SO2 emissions, nuclearwaste, and cost). Attribute values were globalaggregate estimates obtained from an IA model(Holmes and Ellis, 1996, 1997).
The attribute scores for each alternative alongwith ranges (minimum, maximum) were given toparticipants in each MCDM exercise. Uncertaintyscenarios were generated with Monte Carlosimulation using probabilistic inputs for climatesensitivity, SO2 cooling effect, energy efficiency,labor productivity, natural gas reserves, andpopulation growth. The hypothetical climatechange scenarios were constructed to provideplausible attribute values for each policy alter-native for the purpose of evaluating MCDMmethods, not to provide definitive values. Meanattribute values for each of the non-dominatedalternatives from results using the uncertain inputsare provided in Table I.
Table I. Attribute values for climate policy alternatives
Attribute x1: Global
Temperature
Increase
[oC]
x2: Annualized
SO2 Emissions
[106 tons/yr]
x3: Annualized
Nuclear
Waste
[103tons/yr]
x4: Annualized
Cost
[109$/yr]
x5: Sea-Level
Rise
[cm]
x6: Ecosystem
Stress
[106 hectares]
Base Case 1.35 159.5 11.7 0.0 26.2 3229
$75/ton CO2 Tax 1.33 136.8 15.4 37.0 25.9 3190
$150/ton CO2 Tax 1.29 118.8 19.3 142.7 24.2 3095
$300/ton CO2 Tax 1.15 93.5 26.0 519.8 22.4 2740
Nuclear Promotion 1.24 149.9 22.2 62.1 24.3 2977
Relaxed SO2 Standards 1.25 189.9 10.9 �3.6 24.4 3002
Biomass Promotion 1.30 153.4 11.6 7.1 25.4 3121
INTEGRATED ASSESSMENT OF CLIMATE POLICY 231
Copyright # 2002 John Wiley & Sons, Ltd. J. Multi-Crit. Decis. Anal. 10: 229–256 (2001)

While climate change is a dynamic problem,attribute values were calculated for a specific time(2050) or time interval (change between 1990 and2050). This approach provided a manageable set ofinformation that we hoped would be familiar andeasily understood, as it is comparable to otheranalyses of climate change impacts (e.g., IPCCestimates of temperature increase). Values forsome attributes were discounted so that impactsin the distant future received less emphasis thanthose in the near future. Issues involved in thiscrucial weighting judgment are reviewed in Arrowet al. (1996b) and Schubert (1994).
We explained the attribute definitions anddiscounting procedure to the workshop partici-pants. Although no participants questioned theuse of a 1990 baseline or the discounting process,our decision to use these metrics affected theattribute values and therefor the value judgments.We do not know how participants’ value judg-ments would differ had we, say, modeled impactsto 2100, used a different discounting procedure, orprovided a full time series for each attribute ratherthan just means (e.g., temperature in each year).
2.2. MCDM methodsThe MCDM methods compared in this workshopfall into three groups: weighting methods, deter-ministic ranking methods, and uncertainty rankingmethods. The weighting methods address userpreferences among the attributes (i.e., whichattributes are more important to the user and byhow much?). Deterministic and uncertainty rank-ing methods combine those preferences in order torank or screen alternatives. Each method is definedbriefly in Appendix A.
The methods selected are useful for evaluatingdiscrete alternatives, can be conveyed to thoseunfamiliar with decision analysis, and in mostcases have been widely applied elsewhere. Theyrepresent a range of divergent philosophies regard-ing decision-making. (For an in-depth discussionof conceptual differences among MCDMmethods,see Stewart, 1992). For example, in direct assess-ments of importance weights, weighting values aretransparent and under control of the decision-maker, whereas with the traditional AHP weight-ing method, weights are inferred from pairwiseratio comparisons of attributes (e.g., attribute i istwice as important as attribute j). However, it iswidely argued (e.g., Belton, 1986; Schoemaker,1981) that the notion of attribute ‘‘importance’’ isvaguely defined in both direct and AHP assess-
ments, and may diverge greatly from the rates atwhich users are willing to tradeoff one attribute foranother. The latter is the precise definition ofimportance required by value and utility theorymethods, and is what swing and tradeoff weightingmethods attempt to capture. In this study, a hybridswing/AHP method is tested that attempts tocombine AHP’s ease of use with swing weighting’smore precise notion of attribute importance.
Several approaches to combining attributes andranking alternatives also were compared by theworkshop participants. Value or utility methodsuse each alternative’s performance on each attri-bute along with attribute weights to create aperformance score for each option. Goal program-ming methods require the user to set a target valuefor each attribute and minimize deviations, in oneor both directions, from that target. Outrankingmethods, such as ELECTRE, do not necessarilygenerate a complete ranking of alternatives as theyallow two alternatives to be ‘incomparable’ (i.e.,neither alternative outranks the other). Thesemethods define a kernel or set of non-dominatedalternatives.
2.3. The experimentThe workshop was held June 1–2, 1998, at TheJohns Hopkins University. The participants in-cluded twenty climate change experts, policy-makers, and IA practitioners, from a range ofprivate and public institutions including academic,governmental, national laboratory, and corporateorganizations (Appendix B). Of the 16 participantswho filled out the questionnaire regarding pre-vious use of MCDM, 44% either had usedMCDM before or were familiar with the use ofMCDM by their organization, and 19% hadexperience using MCDM in IA.
Before the formal MCDM methods wereintroduced, participants completed a holisticassessment of the policy options (ranks of 1–7and ratings of 0–100). Although time limitspresented a challenge, each method was thenexplained to provide participants with the con-ceptual understanding necessary to answer thequestionnaires that we used to elicit informationneeded to apply the methods. Additionally, work-shop organizers were available to answer questionsindividually throughout the process to helpameliorate any confusion about the methods orevaluations. After completion of the methodquestionnaires, MCDM results were calculatedand returned to the participants for each group of
M. L. BELL ET AL.232
Copyright # 2002 John Wiley & Sons, Ltd. J. Multi-Crit. Decis. Anal. 10: 229–256 (2001)
methods (weighting, deterministic ranking, uncer-tainty ranking). Participants then reviewed andrevised their weights for the four attribute case(revised weights). They also compared the originalholistic assessment to the MCDM method ranksfor the deterministic and uncertain cases. Theelicitation portion of the workshop then concludedby asking participants to provide revised holisticranks for the policies (final holistic assessment).
In addition to elicitations, round robin or‘‘nominal group’’ discussions (Delbecq et al.,1975) were held to record participant views onthe methods and their application to IA and togain insight into the thought processes behindtheir answers to the questionnaires. In the nominalgroup discussions, each participant was able toexpress his/her views for a limited time. After allparticipants had a turn, each person was givenanother opportunity to speak. This continued untilall views were expressed or time limitationsprevented further discussion. At the close of theworkshop, participants were asked to complete anevaluation questionnaire in which they rated eachmethod on a scale of 1 (worst) to 5 (best) for avariety of criteria (e.g., ease of use, ability of eachmethod to increase confidence in decision), and toprovide suggestions for potential uses for themethods. Similar questionnaires have been usedpreviously to evaluate MCDM methods (e.g.,Hobbs and Meier, 2000; Le !oon, 1997; Zapateroet al., 1997).
2.4. Limitations of experimental designThis results of this experiment must be viewed inlight of its limitations. In particular, the internalvalidity of the results may suffer from limitations(e.g., small sample size) that preclude the controlfor alternate hypotheses (Adelman, 1991). Wehypothesize that differences in method results canoccur because of the fundamental differences in thetypes of responses each method elicits fromthe participants. However, it is also possible thatthe exact wording of questions or even misunder-standing by the participants may have affected ourresults. As another example, variations in methodresults also may have been due to an order effect(e.g., simpler methods were presented before moreadvanced ones). Order effects can arise because theprocess of completing MCDM exercises, andrelated discussions can provide insights to theparticipants. Therefore, the results of methodsmay diverge due to participants learning andchanging their opinions about alternatives or
attributes, rather than because of a true differencein methods.
Although a rigorous experimental design wasnot possible due to sample size and time limits, theresults can nevertheless be helpful to those whowould apply MCDM to IA. The experiment’sexternal validity was increased by the use ofparticipants who may actually use MCDM meth-ods to analyze IA results for climate change policy.An identification of differences in method resultsand appropriateness is useful to potential users bydocumenting possible method advantages anddisadvantages and alerting them to the possibilitythat different techniques can lead to divergentconclusions. Finally, general insights voiced by theexperts regarding how MCDM could be used inIA are an important outcome of this research, andare not subject to these limitations.
3. HYPOTHESES, RESULTS, ANDDISCUSSION
This section presents hypotheses tested by theexperiment and the associated results. Each of thehypotheses was formulated to illuminate differ-ences among the methods (e.g., perceived ease ofuse and appropriateness, validity, and results).
Hypothesis 1.MCDM methods differ in their ease of use and intheir ability to aid decision-making in integratedassessment.
This hypothesis addresses the ‘‘user-friendliness’’ of different MCDM methods andwhether the methods are appropriate for actualclimate change decision-making. After all methodshad been applied and results distributed to theparticipants, evaluation questionnaires asked par-ticipants to rate each method from 1 (worst) to 5(best) for a variety of questions. Figures 1a and bprovide the average participant evaluation of eachmethod for these categories.
For the deterministic methods (Figure 1a),holistic assessment was rated higher than all othermethods in all categories for which it wasevaluated. Holistic assessment was rated signifi-cantly higher than other methods for ‘‘ease ofunderstanding concepts’’ (Wilcoxon matched-pairs signed rank test p-values 50.03), ‘‘makessense’’ (p50.03), ‘‘skills reasonably acquired’’(p50.05), and ‘‘amount of effort required
INTEGRATED ASSESSMENT OF CLIMATE POLICY 233
Copyright # 2002 John Wiley & Sons, Ltd. J. Multi-Crit. Decis. Anal. 10: 229–256 (2001)

reasonable’’ (p50.03). In contrast, goal program-ming and ELECTRE received poor evaluationsacross all categories. However the participantssuggested that ELECTRE could facilitate consen-sus among groups better than some other meth-ods. This is likely because the method produces akernel, rather than definitive ranking, and thekernel can include a diversity of options.
Overall, participants did not believe that theanalytical methods had much potential for im-proving consistency or confidence, as evidenced bythe low ratings for these categories. However, thisdoes not indicate that MCDM methods are uselessfor climate change policy. The primary benefits ofMCDM include structuring the problem so that
large amounts of information become manageable,helping users learn how they think about thedecision, and exploring value judgements. Partici-pants stated that they gained insights from usingthe methods, nonetheless they did not believe themethods would help improve consistency orconfidence. This raises questions about the benefitsof MCDM in IA and suggests that MCDM maybe better for helping users think about the decision(e.g., exploring tradeoffs) rather than in formingtheir actual choice (e.g., improving consistency indecisions).
Holistic assessment also rated highly among theuncertainty methods, receiving the highest ratingfor most categories for which it was evaluated
1 2 3 4 5
Ease of Understanding Concepts
Makes Sense
Ease of Providing Inputs
Skills Reasonably Acquired
Amount of EffortRequired Reasonable
Potential for Increasing Confidence
Recommended for Actual Climate Change
Decision-Making
Focuses on Important Issues
Could FacilitateConsensus Among
Groups
Potential for Improving Consistency
Does Not Hinder Free and Creative Judgement
BestAverage EvaluationWorst
Holistic AssessmentNon-Linear Value Function
ELECTRE Goal ProgrammingRevision of Alternative Rankings
Linear Value Function: Point Allocation Weights Swing Weighting / AHP Tradeoff Weights Revised Weights
Recommended for Actual Climate Change
Decision-Making
Potential for Increasing Confidence
Ease ofUnderstanding
Concepts
Makes Sense
Ease ofProviding Inputs
Skills Reasonably Acquired
Amount of EffortRequired
Reasonable
Focuses on Important Issues
Could FacilitateConsensus Among
Groups
BestAverage Evaluation
1 2 3 4 5
Worst
Holistic AssessmentUtility Function Stochastic Dominance
Min Max Regret Revision of Alternative Rankings
(a) (b)
Figure 1. (a) Participant evaluation of certainty ranking methods; (b) participant evaluation of uncertainty rankingmethods.
M. L. BELL ET AL.234
Copyright # 2002 John Wiley & Sons, Ltd. J. Multi-Crit. Decis. Anal. 10: 229–256 (2001)
(Figure 1b). It rated significantly better than othermethods for the ‘‘ease of understanding concepts’’(p50.04) and ‘‘makes sense’’ categories (p50.03,except for the comparison with utility functions).Stochastic dominance had the lowest evaluationfor almost all questions. On average, participantsfelt that all methods had approximately the samepotential for increasing confidence.
MCDM methods may be able to facilitateconsensus among groups by moving the discussionfrom alternatives to fundamental objectives andtheir tradeoffs (Keeney and Raiffa, 1976). Byhighlighting common interests, the methods dis-courage focusing on a preferred alternative (Raif-fa, 1982). Consistent with this notion, participantsbelieved that the utility function ‘‘could facilitateconsensus among groups’’ better than all otheruncertainty methods, but not significantly so.However, this method had only the third highestscore for ‘‘recommended for greenhouse gasevaluation’’ (out of five methods). This suggeststhat the ability of an MCDM method to helppeople better understand their own preferencesmay be more important than its ability to facilitatenegotiation and group consensus.
For the ‘‘recommended for actual climatechange decision-making’’ question, holistic assess-ment received the top average rating for bothdeterministic and uncertainty methods. The highrating of holistic assessment may indicate thedesire of the users to retain control of the decisionprocess. For uncertainty methods, the secondhighest rated method was reconciliation of alter-native rankings, in which users consider andresolve the results of two or more methods. Fordeterministic methods, the second highest evalua-tion was a tie between linear value function withrevised weights and, again, reconciliation ofalternative rankings. This supports the conceptthat use of multiple methods is beneficial, becauseparticipants recommend both use of revisedweights (reconciliation of results from severalweighting methods) and reconciliation of rankingresults from several methods.
Also supporting the use of multiple methods isthe fact that except for stochastic dominance, eachMCDM method was most highly recommendedfor decision-making by at least one person. Nomethod dominated the others. For instance, of the14 people who recommended at least one determi-nistic approach over the others, 9 rated holisticrating most highly, while 3, 3, and 8 persons gavetheir highest recommendation to ELECTRE, Goal
Programming, and some version of additive valuefunctions, respectively (some persons used ties,giving more than one method the highest recom-mendation). Meanwhile, each of these fourapproaches was also given the lowest recommen-dation by at least one person. Only one participantstrictly perferred holistic assessment to all otherapproaches.
Participants also ranked three weighting meth-ods (1 for most preferred, 3 for least preferred). Allthree procedures had roughly the same mean rank:2.04 for swing weighting/AHP, 2.07 for tradeoffweighting, and 1.89 for direct point allocation.This contrasts with earlier studies where thetradeoff method was relatively disliked (e.g.,Hobbs and Horn, 1997).
Hypothesis 2.MCDM methods have different predictivevalidities.
MCDM results should be valid (i.e., they shouldreflect decision-makers’ actual preferences). Be-cause preferences are fundamentally subjective andoften imprecise, there exists no universally ac-cepted objective measure of validity (Hobbs, 1986;Larichev, 1992). One type of validity is ‘‘predictivevalidity’’} defined here as a method’s ability topredict the final holistic (unaided) ranking ofalternatives after an iterative process of applyingseveral MCDM methods and reviewing results(e.g., Corner and Buchanan, 1997; Hadley et al.,1997; Hobbs and Horn, 1997; Lai and Hopkins,1995). By this definition, a method has a highvalidity if its results correctly anticipate the user’sfinal (and presumably most informed) preferences,perhaps because it has helped the user constructthem. Note, however, that this does not suggestthat methods with poor predictive validity areineffective at providing insights into the problem.
To evaluate the hypothesis that some methodshave higher predictive validity than others, weexamined Spearman’s correlations between eachmethod’s policy rankings (1–7) and the finalholistic rankings. Such an ‘‘intermethodcorrelation’’ is defined as the correlation betweentwo methods’ results for a specific user, averagedacross all users: ð1=W
PWa¼1 covðrsa; rtaÞ=srsasrta
where rsa and rta are the participant a’s rankingsfor methods s and t, respectively; cov( ) is thecovariance; and W the number of users (Figure 2).
The deterministic methods differ in their abilityto predict the final holistic assessment, sometimes
INTEGRATED ASSESSMENT OF CLIMATE POLICY 235
Copyright # 2002 John Wiley & Sons, Ltd. J. Multi-Crit. Decis. Anal. 10: 229–256 (2001)

significantly so. Additive value functions withrevised weights and linear single attribute valuefunctions performed best, with swing weighting/AHP and goal programming (exponent=2) beingclose behind. However, no method’s ranks arehighly correlated with holistic assessment’s ranks(highest value=0.58), consistent with previousresearch (Edwards, 1977; Hobbs, 1986; Hobbset al., 1992), von Winterfeldt and Edwards, 1986).Possible explanations are that the methods over-simplify sophisticated subjective decision processesor, alternatively, that methods result in moresystematic, balanced assessments; of course, Fig-ure 2 cannot distinguish between these hypotheses.Meanwhile, predictive correlations for the linearvalue function with tradeoff weights are signifi-cantly lower than for the linear value functionswith point allocation weights, swing weighting/AHP weights, or revised weights (p50.0013).Surprisingly, the predictive validities for the twonon-linear single attribute value function methods(mid-value splitting and hand-drawn value func-
tions) are statistically less than linear singleattribute value functions (all with revised weights)(p50.006).
For uncertainty methods, however, all methodshave approximately equal predictive validity(Figure 2). The correlation for all uncertaintymethods is 0.52–0.53, and none are statisticallydifferent. Thus, our hypothesis, that MCDMmethods have different predictive validity, holdsfor the deterministic methods but not for theuncertainty methods. Assumptions of risk prefer-ence differ for each uncertainty method. Min maxregret avoids extreme negative outcomes andthereby assumes risk aversion, maximize expectedutility assumes risk neutrality when a linear utilityfunction is used, and first-order stochastic dom-inance makes no risk preference assumptions.Figure 2 indicates that no one representation ofrisk attitudes did a better job of predicting holisticevaluations than another, and that choice ofweighting method affects predictive validity morethan choice of risk attitude. However, risk
Intermethod Correlation with Final Holistic Assessment
0.0 0.1 0.2 0.3 0.4 0.5 0.6 0.7 0.8 0.9 1.0
Min Max Regret
Non-Linear U(X)
Linear U(X)
Fuzzy Sets
Goal Programming (p = )
Goal Programming (p = 2)
Non-Linear V(X) (hand-drawn)
Non-Linear V(X) (mid-value splitting)
Linear V(X) - Revised Weights
Linear V(X) - Swing Weighting / AHP
Linear V(X) - Tradeoff Weighting (cost)
Linear V(X) - Point Allocation Weights
Deterministic Ranking Methods
Uncertainty Ranking Methods
∞
Figure 2. Predictive validity analysis: correlations of method results with final holistic assessment (Note:Deterministic and uncertainty methods were correlated with the deterministic and uncertainty final holisticassessments, respectively. Revised weights used except where specified.).
M. L. BELL ET AL.236
Copyright # 2002 John Wiley & Sons, Ltd. J. Multi-Crit. Decis. Anal. 10: 229–256 (2001)

attitudes should increase in importance if thedegree of uncertainty is increased.
The predictive validity of the ELECTRE andstochastic dominance methods cannot be com-pared in the above manner because they do notyield a full ranking of alternatives. However, weexamined their predictive validity by comparingtheir incomplete rankings to those of holisticassessment. ELECTRE I provides informationabout whether one alternative ‘‘outranks’’ an-other. We compared the ‘‘kernel’’ (set of non-outranked alternatives out of the original 7policies) to the final holistic assessment rankings.The average kernel size for ELECTRE was 3.3.The final holistic assessment’s highest rank (1) wasin the ELECTRE kernel for only 50% of theparticipants, and 50% of the ELECTRE kernelscontained the holistic assessment’s lowest rankedalternative (7). This unpromising result could haveoccurred by chance. One-third of the kernelscontained both the highest and lowest rankedalternatives.
Meanwhile, stochastic dominance also doesnot provide a ranking of alternatives, butshows whether an alternative dominates another.Figure 3 depicts the cumulative distributions forone participant’s utility functions for each policy.In this case, stochastic dominance is evident. Forinstance, the policy of relaxed SO2 standards isfirst-order stochastically dominated by the bio-mass promotion policy. For this participant, fivealternatives are first-order stochastically domi-nated, therefore the kernel size is two (the $150and $300/ton CO2 tax policies). The average kernelsize for all participants was 3.2 for first-orderstochastic dominance and 1.7 for second-orderstochastic dominance. Results from this methoddiffered from those of the final holistic assessment.The final holistic assessment’s top ranked alter-native was non-dominated for only 28% of theparticipants, which could have occurred bychance. Meanwhile, the nuclear alternative hadan average holistic assessment rank of 5.2 (out of7), but was non-dominated in 72% of thestochastic dominance results. The results of thelast two paragraphs demonstrate that ELECTREand stochastic dominance produce results that aredistinctly different from holistic assessment (i.e.,neither has high predictive validity).
In sum, none of the MCDM methods had highpredictive validity. It may appear that the methodsare not useful if they do not match the user’s finalholistic preferences. Nevertheless, insights gained
from using MCDM methods were evidenced bydifferences between holistic rankings completedbefore and after applying the MCDM methodsand reviewing the results. Initial and final deter-ministic holistic assessment differed for 94% ofparticipants and were not highly correlated (aver-age correlation of 0.55 between each person’s pairof rank sets), with 53% of participants choosing adifferent top-ranked alternative. However, thesedifferences between participants’ initial and finalholistic assessments also could have occurred bychance (i.e., holistic assessments made one dayapart without intervening MCDM assessmentsmight differ just as much); our experiment was notdesigned to control for this alternative explana-tion. Meanwhile, holistic rankings of uncertainalternatives taken before and after uncertaintyMCDM methods differed for 68% of participants.Yet most differences between participant’s two setsof uncertain holistic evaluations were small (meancorrelation of 0.81), so we cannot claim that muchlearning took part as a result of the uncertaintyMCDM exercises.
As we noted previously, the numerical analysesof method results must be viewed in terms of theexperiment’s limitations. However, the use of
0.0
0.2
0.4
0.6
0.8
1.0
0 0.2 0.4 0.6 0.8 1
Utility
Cum
ulat
ive
Dis
trib
utio
n
Base Case $75/ton CO2 Tax
$150/ton CO2 Tax $300/ton CO2 Tax
Nuclear Promotion Biomass Promotion
Relaxed SO2 Standards
Figure 3. Example cumulative distribution functions forutility function (used for stochastic dominance method).
INTEGRATED ASSESSMENT OF CLIMATE POLICY 237
Copyright # 2002 John Wiley & Sons, Ltd. J. Multi-Crit. Decis. Anal. 10: 229–256 (2001)

several methods can help people focus on theirobjectives and provides an opportunity to thinkabout the problem in different ways (Hobbs andHorn, 1997). This implication for MCDM use isapplicable regardless of whether inconsistenciesbetween methods arise from order effects orinherent differences in the methods. In this sense,the use of several MCDM approaches can aiddecision-making more than a single approach(Corner and Buchanan, 1997; Simpson, 1996).
Hypothesis 3.Methods will differ in the convergence of differentpeoples’ results.
We hypothesize that some methods will producemore similar results across all persons than otherapproaches. Such methods might be interpreted aspromoting consensus, or alternatively, as obscur-ing genuine differences of opinions. In order to testthis hypothesis and identify such methods, inter-person correlations were compared for differentmethods. We define ‘‘interperson correlation’’ tobe the correlation between policy rankings for agiven method for a pair of users, averaged acrossall pairs of users:
1
W
2
!XWa¼1
XWb>a
covðrsa; rsbÞsrsasrsb
where rsa and rsb are the vectors of policy ranksfrom method s for participants a and b, respec-tively. Interperson correlations can be calculatedfor weight sets as well.
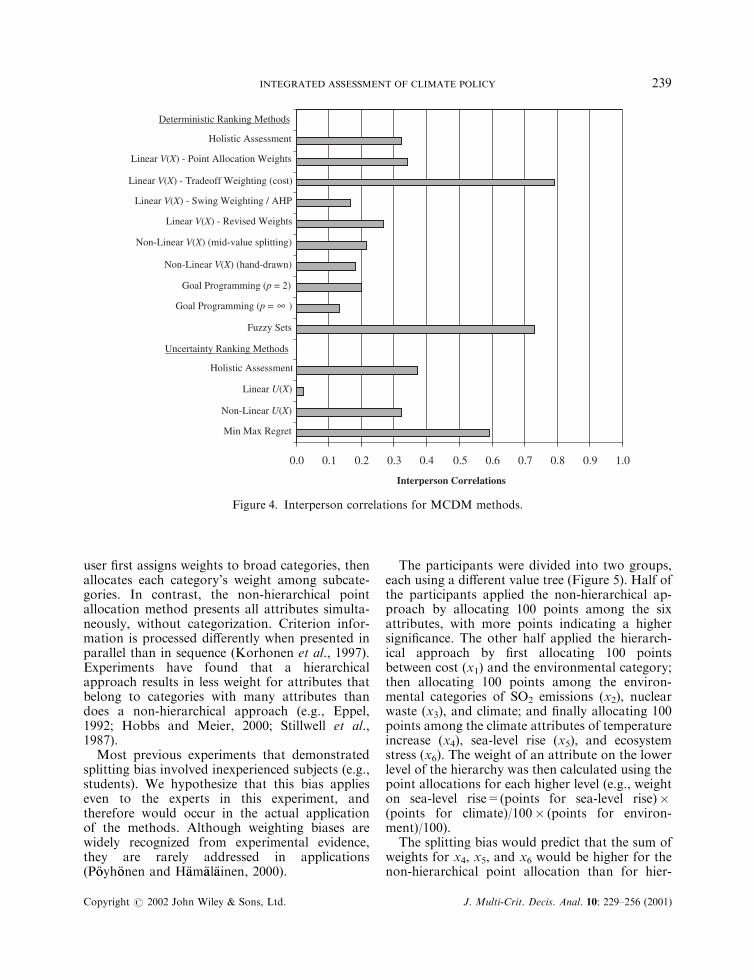
Formal MCDM methods generally have higherconvergence of different persons’ results than doholistic evaluations (Edwards, 1977; Hobbs andMeier, 2000; von Winterfeldt and Edwards, 1986),perhaps because participants simplify the problemin holistic assessments by focusing on a fewcriteria. Surprisingly, this was not the case withour experiment, as holistic assessment had a higherinterperson correlation than most other methods.Interperson correlations ranged from 0.02 (linearutility function) to 0.79 (linear value function withtradeoff weighting) (Figure 4). The correlation oftradeoff weighting results was high because mostparticipants had similar weights for this method,with most placing a high weight on cost (averageweight on cost 53%). This correlation is signifi-cantly higher than those of other deterministicmethods except fuzzy sets (p50.001). In contrast,
interperson correlations for the goal programmingmethods (exponent p=2 and N) are statisticallylower than correlations for holistic assessment andthe linear value function with point allocationweights, tradeoff weights, or revised weights(p50.03).
The fuzzy set method chooses the policy that hasthe highest degree of membership in the set ‘‘gooddecision,’’ as measured by a multivariate fuzzy setmembership function. Because of its ‘‘min max’’operator (see Appendix A), this method tends tochoose alternatives that perform moderately wellon all alternatives; consequently, the interpersoncorrelation (0.73) was the highest of all methodsexcept the linear value function with tradeoffweights. For all persons, the fuzzy set methodshowed that the $75/ton CO2 tax, $150/ton CO2
tax, and nuclear power promotion policies (noneof which had the worst attribute value for anyattribute) performed better than the base case,$300/ton CO2 tax, and biomass promotion options(each of which had the worst possible value forsome attribute).
For uncertainty methods, the linear utilityfunction and min max regret methods’ interpersoncorrelations are statistically different from theother methods’ interperson correlations(p50.001), with the linear U(X) resulting in theleast consensus and min max regret achieving themost. Such differences in interperson correlationshave implications for decision-making, as differ-ences of opinion among users present opportu-nities for discussion and learning.
Hypothesis 4.Climate change experts are subject to classicweighting biases.
The specific bias addressed in this section(‘‘splitting bias’’) has been previously identifiedas a problem for directly assessed weights, such aspoint allocation (von Winterfeldt and Edwards,1986). (Another bias associated with tradeoffweighting is mentioned under Hypothesis 5.) Thesplitting bias occurs when more aggregate weightis given to an attribute when it is ‘‘split’’ intoseveral attributes (e.g., dividing ‘‘environment’’into SO2 emissions, nuclear waste, and climate)than when it is categorized as a single attribute(e.g., a single weight is assessed for‘‘environment’’). This bias can be tested if weightsare chosen by both hierarchical and non-hierarch-ical methods. In hierarchical point allocation, the
M. L. BELL ET AL.238
Copyright # 2002 John Wiley & Sons, Ltd. J. Multi-Crit. Decis. Anal. 10: 229–256 (2001)
user first assigns weights to broad categories, thenallocates each category’s weight among subcate-gories. In contrast, the non-hierarchical pointallocation method presents all attributes simulta-neously, without categorization. Criterion infor-mation is processed differently when presented inparallel than in sequence (Korhonen et al., 1997).Experiments have found that a hierarchicalapproach results in less weight for attributes thatbelong to categories with many attributes thandoes a non-hierarchical approach (e.g., Eppel,1992; Hobbs and Meier, 2000; Stillwell et al.,1987).
Most previous experiments that demonstratedsplitting bias involved inexperienced subjects (e.g.,students). We hypothesize that this bias applieseven to the experts in this experiment, andtherefore would occur in the actual applicationof the methods. Although weighting biases arewidely recognized from experimental evidence,they are rarely addressed in applications(P .ooyh .oonen and H.aam.aal.aainen, 2000).
The participants were divided into two groups,each using a different value tree (Figure 5). Half ofthe participants applied the non-hierarchical ap-proach by allocating 100 points among the sixattributes, with more points indicating a highersignificance. The other half applied the hierarch-ical approach by first allocating 100 pointsbetween cost (x1) and the environmental category;then allocating 100 points among the environ-mental categories of SO2 emissions (x2), nuclearwaste (x3), and climate; and finally allocating 100points among the climate attributes of temperatureincrease (x4), sea-level rise (x5), and ecosystemstress (x6). The weight of an attribute on the lowerlevel of the hierarchy was then calculated using thepoint allocations for each higher level (e.g., weighton sea-level rise=(points for sea-level rise)�(points for climate)/100� (points for environ-ment)/100).
The splitting bias would predict that the sum ofweights for x4, x5, and x6 would be higher for thenon-hierarchical point allocation than for hier-
0.0 0.1 0.2 0.3 0.4 0.5 0.6 0.7 0.8 0.9 1.0
Min Max Regret
Non-Linear U(X)
Linear U(X)
Holistic Assessment
Fuzzy Sets
Goal Programming (p = )
Goal Programming (p = 2)
Non-Linear V(X) (hand-drawn)
Non-Linear V(X) (mid-value splitting)
Linear V(X) - Revised Weights
Linear V(X) - Swing Weighting / AHP
Linear V(X) - Tradeoff Weighting (cost)
Linear V(X) - Point Allocation Weights
Holistic Assessment
Interperson Correlations
Deterministic Ranking Methods
Uncertainty Ranking Methods
∞
Figure 4. Interperson correlations for MCDM methods.
INTEGRATED ASSESSMENT OF CLIMATE POLICY 239
Copyright # 2002 John Wiley & Sons, Ltd. J. Multi-Crit. Decis. Anal. 10: 229–256 (2001)

archical approach. Indeed, the average totalweight for attributes x4, x5, and x6 for the non-hierarchical method (42%) is significantly higherthan that for hierarchical approach (21%) (Mann–Whitney test p-value 50.008). Thus, we haveconfirmed that climate change experts are subjectto the classic ‘‘splitting bias.’’
Hypothesis 5.Weights chosen by different methods differ sig-nificantly.
Previous experiments have compared variousweighting methods (e.g., Belton, 1986; Hobbs et al.,1992; P .ooyh .oonen and H.aam.aal.aainen, 2001). Wehypothesize that how weights are chosen (themethod used) can be as important as who choosesthe weights, because different methods use differ-ent operational meanings of attribute importance.If this is true, the choice of methods is important,as is the issue of validity. If, on the other hand,intermethod correlations are higher than interper-son correlations, who performs the assessmentmatters more than which method is used.
Intermethod correlations between weight setsfrom various weighting methods show that differ-ent approaches did in fact yield different results(Table II). The tradeoff weighting method almostuniformly produced a higher weight for cost(average weight on cost 53%). Earlier experimentshave shown that in tradeoff questions, theattribute users are asked to adjust tends to receivehigher weight (the scale compatability bias; e.g.,Borcherding et al., 1991), and our result isconsistent with that conclusion. The high weighton cost causes tradeoff weights to have lowcorrelations with other methods and also to havethe highest interperson correlation (0.46 amongweight sets chosen by different people, statisticallyhigher than other interperson correlations, Wil-coxon signed-rank test p-values50.001). In con-trast, interperson correlations for weights fromother weighting methods were essentially zero.Point allocation, swing weighting/AHP, and thefinal choice of weights (revised weights) yieldsimilar weights: intermethod correlations betweeneach pair of these three methods (0.78, 0.88, 0.89)are statistically higher than intermethod correla-
nuclearwaste
SO2
emissions
overall value
ecosystemstress
annualizedcost
temperature increase
sea-level rise
SO2
emissionsnuclearwaste
climate
overall value
environment annualizedcost
temperature increase
sea-level rise ecosystemstress
Non-hierarchical:
Hierarchical:
Figure 5. Alternative value trees for splitting bias analysis of point allocation weights.
M. L. BELL ET AL.240
Copyright # 2002 John Wiley & Sons, Ltd. J. Multi-Crit. Decis. Anal. 10: 229–256 (2001)
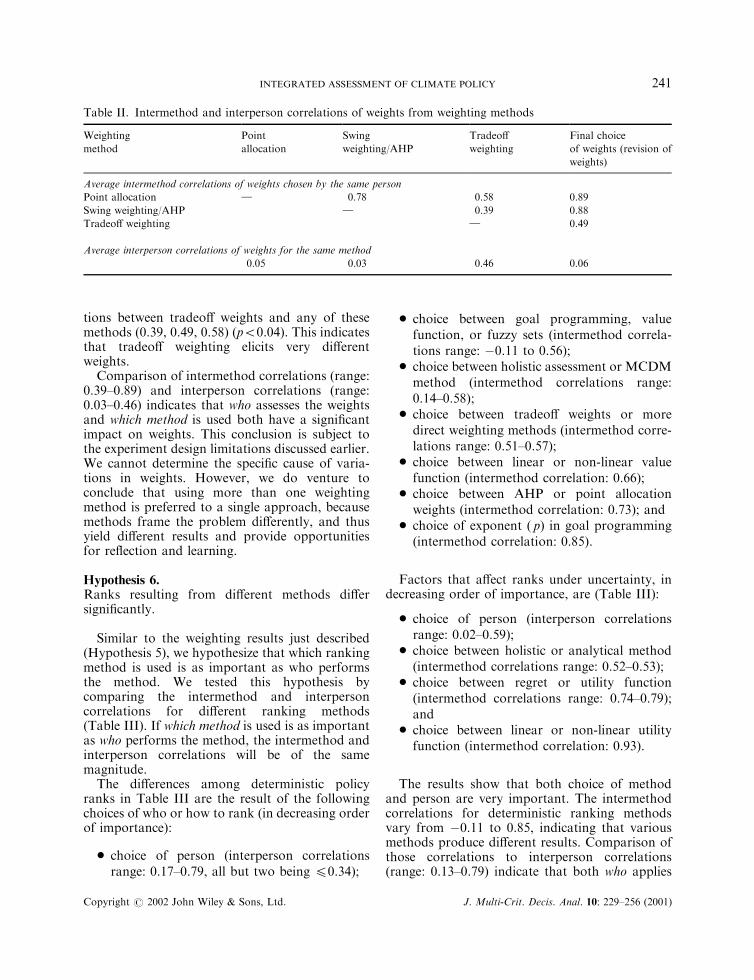
tions between tradeoff weights and any of thesemethods (0.39, 0.49, 0.58) (p50.04). This indicatesthat tradeoff weighting elicits very differentweights.
Comparison of intermethod correlations (range:0.39–0.89) and interperson correlations (range:0.03–0.46) indicates that who assesses the weightsand which method is used both have a significantimpact on weights. This conclusion is subject tothe experiment design limitations discussed earlier.We cannot determine the specific cause of varia-tions in weights. However, we do venture toconclude that using more than one weightingmethod is preferred to a single approach, becausemethods frame the problem differently, and thusyield different results and provide opportunitiesfor reflection and learning.
Hypothesis 6.Ranks resulting from different methods differsignificantly.
Similar to the weighting results just described(Hypothesis 5), we hypothesize that which rankingmethod is used is as important as who performsthe method. We tested this hypothesis bycomparing the intermethod and interpersoncorrelations for different ranking methods(Table III). If which method is used is as importantas who performs the method, the intermethod andinterperson correlations will be of the samemagnitude.
The differences among deterministic policyranks in Table III are the result of the followingchoices of who or how to rank (in decreasing orderof importance):
* choice of person (interperson correlationsrange: 0.17–0.79, all but two being 40.34);
* choice between goal programming, valuefunction, or fuzzy sets (intermethod correla-tions range: �0.11 to 0.56);
* choice between holistic assessment or MCDMmethod (intermethod correlations range:0.14–0.58);
* choice between tradeoff weights or moredirect weighting methods (intermethod corre-lations range: 0.51–0.57);
* choice between linear or non-linear valuefunction (intermethod correlation: 0.66);
* choice between AHP or point allocationweights (intermethod correlation: 0.73); and
* choice of exponent ( p) in goal programming(intermethod correlation: 0.85).
Factors that affect ranks under uncertainty, indecreasing order of importance, are (Table III):
* choice of person (interperson correlationsrange: 0.02–0.59);
* choice between holistic or analytical method(intermethod correlations range: 0.52–0.53);
* choice between regret or utility function(intermethod correlations range: 0.74–0.79);and
* choice between linear or non-linear utilityfunction (intermethod correlation: 0.93).
The results show that both choice of methodand person are very important. The intermethodcorrelations for deterministic ranking methodsvary from �0.11 to 0.85, indicating that variousmethods produce different results. Comparison ofthose correlations to interperson correlations(range: 0.13–0.79) indicate that both who applies
Table II. Intermethod and interperson correlations of weights from weighting methods
Weighting
method
Point
allocation
Swing
weighting/AHP
Tradeoff
weighting
Final choice
of weights (revision of
weights)
Average intermethod correlations of weights chosen by the same person
Point allocation } 0.78 0.58 0.89
Swing weighting/AHP } 0.39 0.88
Tradeoff weighting } 0.49
Average interperson correlations of weights for the same method
0.05 0.03 0.46 0.06
INTEGRATED ASSESSMENT OF CLIMATE POLICY 241
Copyright # 2002 John Wiley & Sons, Ltd. J. Multi-Crit. Decis. Anal. 10: 229–256 (2001)

Table III.
Intermethod and interperson correlations of policy ranks for deterministic methodsa
Deterministic
ranking
method:
Final
holistic
assessment
Linear V(X) Non-linear
V(X)
Goal
programming
Fuzzy
sets
Weighting Method Mid-
value
splitting
Hand-
drawn
p ¼ 2 p ¼ N
Point
allocation
Tradeoff Swing/
AHP
Revised
Average intermethod correlations of ranks chosen by the same person
Holistic
assessment
} 0.50 0.14 0.57 0.58 0.37 0.25 0.56 0.45 0.42
Linear V(X):
point allocation
weights
} 0.57 0.73 0.80 } } } } }
Linear V(X):
tradeoff weights
} 0.51 0.54 } } } } }
Linear V(X):
swing
weighting/AHP
} 0.85 } } } } }
Linear V(X):
revised weights
} 0.66 0.63 0.45 0.48 0.21
Non-linear
V(X): mid-value
splitting
} 0.72 0.17 0.17 �0.11
Non-linear
V(X): hand-
drawn
} 0.27 0.24 0.00
Goal programming:
p ¼ 2
} 0.85 0.56
Goal programming:
p ¼ N
} 0.53
Average interperson correlations of ranks for the same method
0.32 0.34 0.79 0.17 0.27 0.21 0.18 0.20 0.13 0.73
Intermethod and interperson correlations for uncertainty methods
Uncertainty
ranking
method:
Holistic
assessment
Linear
utility
function
Non-linear
utility
function
Min Max
regret
Average intermethod correlations of ranks chosen by the same person
Holistic assessment } 0.53 0.52 0.53
Linear U(X) } 0.93 0.79
Non-linear U(X) } 0.74
Average interperson correlation of ranks for the same method
0.37 0.02 0.32 0.59
aNote: All methods used revised weights except where noted
M. L. BELL ET AL.242
Copyright # 2002 John Wiley & Sons, Ltd. J. Multi-Crit. Decis. Anal. 10: 229–256 (2001)
the method and which method is used both canstrongly impact results. Similarly, for uncertaintyranking methods, the intermethod correlations(range: 0.52–0.93) and interperson correlations(range: 0.02–0.59) imply that both the user andthe choice of method can significantly influenceresults, with higher variability among people thanamong methods.
Fuzzy sets, goal programming, and value func-tions differ greatly in philosophy and assumptions;as a result, the ranks they select diverge stronglyfrom each other (Table III). Which method ismore appropriate depends on which set ofassumptions seems most valid for a given situationand person. In general, we believe that multiplemethods result in better representations of valuesbecause they allow people to compare results andresolve differences.
To further explore some method differences,consider the two methods for eliciting non-linearsingle attribute value functions. These methodsalso had different results, although their predictivevalidities are not statistically different. For themid-value splitting method, the user specifies anattribute value ðxi0:5Þ. that is halfway in desirabilitybetween the best and worst values ðx��i and x�i Þ foreach of four criteria. A linear or exponential valuefunction was then fit to the three points. The othermethod asks the user to directly draw a valuefunction on a graph for each of the criteria. Sevenpercent of the hand-drawn graphs were shapes thatwere neither linear nor exponential (e.g., S-shaped)which implies that assumptions of linear orexponential value functions may not be valid. Anadditional 36% of the graphs were linear orexponential but diverged from the value functionsimplied by the mid-value splitting method, in thatthe mid-value points ðxi0:5Þ of the hand drawn andmid-value splitting graphs differed by more than10% of the potential range. For example, onevalue function might be concave and the otherconvex, or one value function slightly concave andthe other very concave. The average intermethodcorrelation between the ranking results of the mid-value splitting method and direct hand-drawnmethod is 0.72. Seventy-one percent of theseintermethod correlations were above 0.8. Consid-ering just the participants whose correlations fellbelow 0.8, one-fifth of those users’ hand-drawnvalue functions did not fit the assumption of linearor exponential value functions. Thus, differentresults arise both from the assumption of linear orexponential value functions used in the mid-value
splitting method and from inconsistent participantresponses.
Hypothesis 7.Visualization methods differ in their ability to aidthe decision-making process.
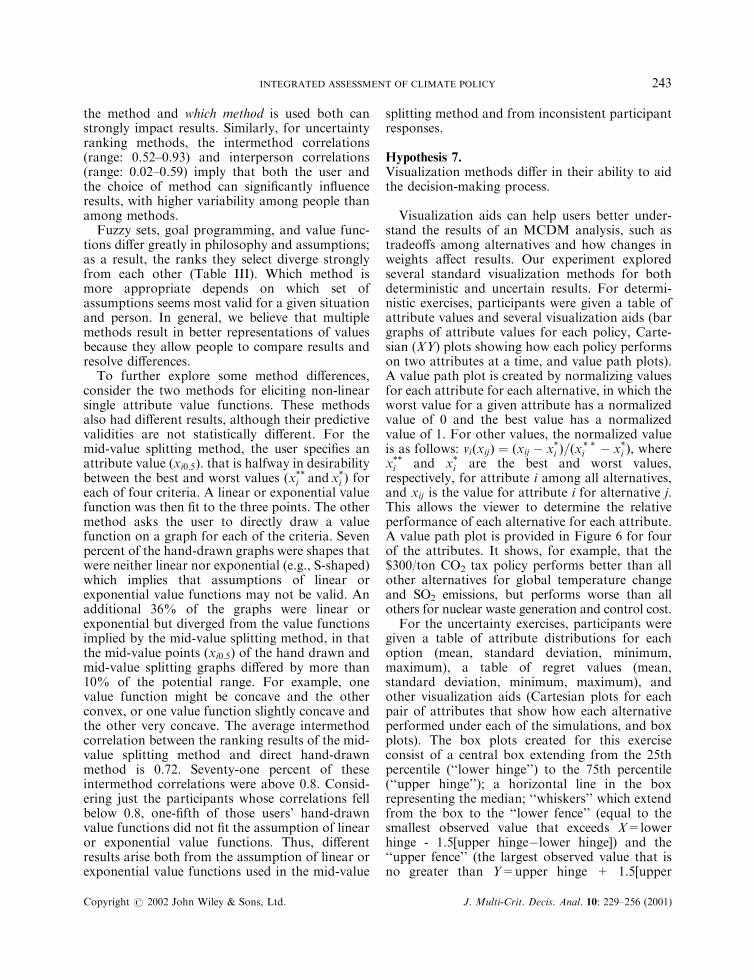
Visualization aids can help users better under-stand the results of an MCDM analysis, such astradeoffs among alternatives and how changes inweights affect results. Our experiment exploredseveral standard visualization methods for bothdeterministic and uncertain results. For determi-nistic exercises, participants were given a table ofattribute values and several visualization aids (bargraphs of attribute values for each policy, Carte-sian (XY) plots showing how each policy performson two attributes at a time, and value path plots).A value path plot is created by normalizing valuesfor each attribute for each alternative, in which theworst value for a given attribute has a normalizedvalue of 0 and the best value has a normalizedvalue of 1. For other values, the normalized valueis as follows: viðxijÞ ¼ ðxij � x�i Þ=ðx
* *i � x�i Þ, where
x��i and x�i are the best and worst values,respectively, for attribute i among all alternatives,and xij is the value for attribute i for alternative j.This allows the viewer to determine the relativeperformance of each alternative for each attribute.A value path plot is provided in Figure 6 for fourof the attributes. It shows, for example, that the$300/ton CO2 tax policy performs better than allother alternatives for global temperature changeand SO2 emissions, but performs worse than allothers for nuclear waste generation and control cost.
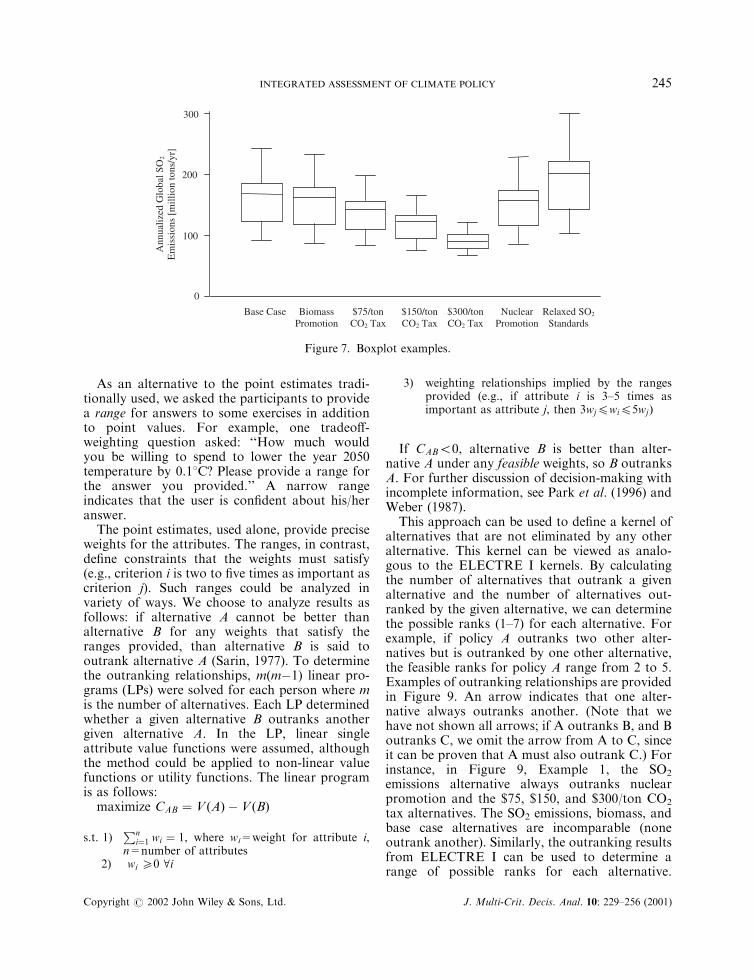
For the uncertainty exercises, participants weregiven a table of attribute distributions for eachoption (mean, standard deviation, minimum,maximum), a table of regret values (mean,standard deviation, minimum, maximum), andother visualization aids (Cartesian plots for eachpair of attributes that show how each alternativeperformed under each of the simulations, and boxplots). The box plots created for this exerciseconsist of a central box extending from the 25thpercentile (‘‘lower hinge’’) to the 75th percentile(‘‘upper hinge’’); a horizontal line in the boxrepresenting the median; ‘‘whiskers’’ which extendfrom the box to the ‘‘lower fence’’ (equal to thesmallest observed value that exceeds X=lowerhinge - 1.5[upper hinge�lower hinge]) and the‘‘upper fence’’ (the largest observed value that isno greater than Y=upper hinge + 1.5[upper
INTEGRATED ASSESSMENT OF CLIMATE POLICY 243
Copyright # 2002 John Wiley & Sons, Ltd. J. Multi-Crit. Decis. Anal. 10: 229–256 (2001)
hinge�lower hinge]); and circles representing out-liers (values>upper fence, or 5lower fence).Example boxplots are shown in Figure 7.
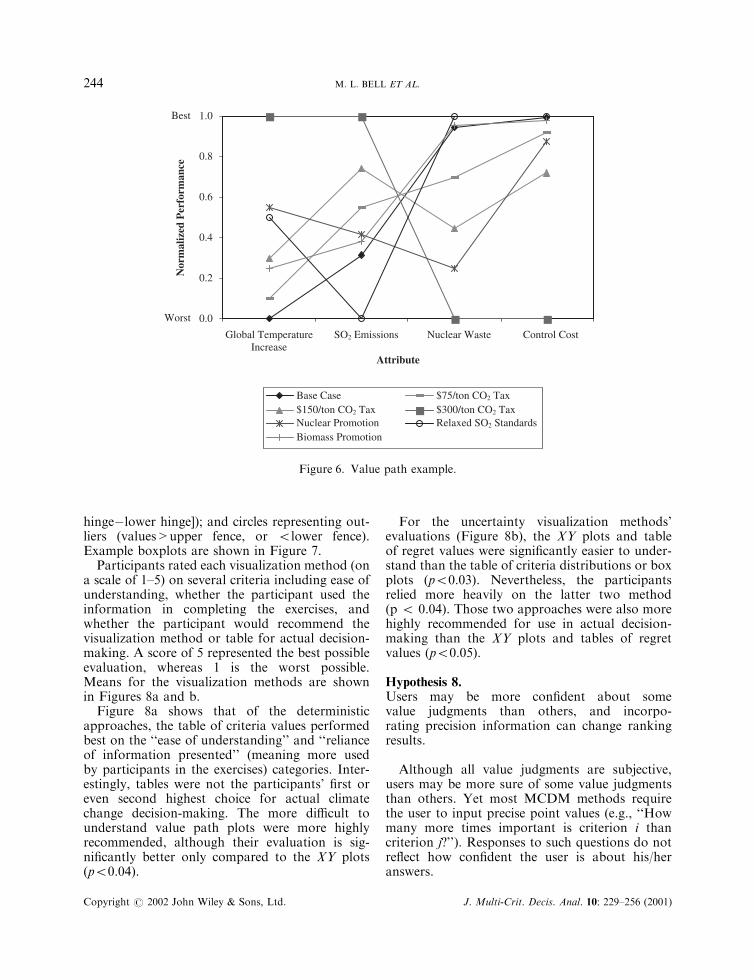
Participants rated each visualization method (ona scale of 1–5) on several criteria including ease ofunderstanding, whether the participant used theinformation in completing the exercises, andwhether the participant would recommend thevisualization method or table for actual decision-making. A score of 5 represented the best possibleevaluation, whereas 1 is the worst possible.Means for the visualization methods are shownin Figures 8a and b.
Figure 8a shows that of the deterministicapproaches, the table of criteria values performedbest on the ‘‘ease of understanding’’ and ‘‘relianceof information presented’’ (meaning more usedby participants in the exercises) categories. Inter-estingly, tables were not the participants’ first oreven second highest choice for actual climatechange decision-making. The more difficult tounderstand value path plots were more highlyrecommended, although their evaluation is sig-nificantly better only compared to the XY plots(p50.04).
For the uncertainty visualization methods’evaluations (Figure 8b), the XY plots and tableof regret values were significantly easier to under-stand than the table of criteria distributions or boxplots (p50.03). Nevertheless, the participantsrelied more heavily on the latter two method(p 5 0.04). Those two approaches were also morehighly recommended for use in actual decision-making than the XY plots and tables of regretvalues (p50.05).
Hypothesis 8.Users may be more confident about somevalue judgments than others, and incorpo-rating precision information can change rankingresults.
Although all value judgments are subjective,users may be more sure of some value judgmentsthan others. Yet most MCDM methods requirethe user to input precise point values (e.g., ‘‘Howmany more times important is criterion i thancriterion j?’’). Responses to such questions do notreflect how confident the user is about his/heranswers.
0.0
0.2
0.4
0.6
0.8
1.0
Global Temperature Increase
SO2 Emissions Nuclear Waste Control Cost
Attribute
Nor
mal
ized
Per
form
ance
Base Case $75/ton CO2 Tax$150/ton CO2 Tax $300/ton CO2 TaxNuclear Promotion Relaxed SO2 StandardsBiomass Promotion
Best
Worst
Figure 6. Value path example.
M. L. BELL ET AL.244
Copyright # 2002 John Wiley & Sons, Ltd. J. Multi-Crit. Decis. Anal. 10: 229–256 (2001)
As an alternative to the point estimates tradi-tionally used, we asked the participants to providea range for answers to some exercises in additionto point values. For example, one tradeoff-weighting question asked: ‘‘How much wouldyou be willing to spend to lower the year 2050temperature by 0.18C? Please provide a range forthe answer you provided.’’ A narrow rangeindicates that the user is confident about his/heranswer.
The point estimates, used alone, provide preciseweights for the attributes. The ranges, in contrast,define constraints that the weights must satisfy(e.g., criterion i is two to five times as important ascriterion j). Such ranges could be analyzed invariety of ways. We choose to analyze results asfollows: if alternative A cannot be better thanalternative B for any weights that satisfy theranges provided, than alternative B is said tooutrank alternative A (Sarin, 1977). To determinethe outranking relationships, m(m�1) linear pro-grams (LPs) were solved for each person where mis the number of alternatives. Each LP determinedwhether a given alternative B outranks anothergiven alternative A. In the LP, linear singleattribute value functions were assumed, althoughthe method could be applied to non-linear valuefunctions or utility functions. The linear programis as follows:
maximize CAB ¼ VðAÞ � VðBÞ
s.t. 1)Pn
i¼1 wi ¼ 1, where wi=weight for attribute i,n=number of attributes
2) wi 50 8i
3) weighting relationships implied by the rangesprovided (e.g., if attribute i is 3–5 times asimportant as attribute j, then 3wj4wi45wjÞ
If CAB50, alternative B is better than alter-native A under any feasible weights, so B outranksA. For further discussion of decision-making withincomplete information, see Park et al. (1996) andWeber (1987).
This approach can be used to define a kernel ofalternatives that are not eliminated by any otheralternative. This kernel can be viewed as analo-gous to the ELECTRE I kernels. By calculatingthe number of alternatives that outrank a givenalternative and the number of alternatives out-ranked by the given alternative, we can determinethe possible ranks (1–7) for each alternative. Forexample, if policy A outranks two other alter-natives but is outranked by one other alternative,the feasible ranks for policy A range from 2 to 5.Examples of outranking relationships are providedin Figure 9. An arrow indicates that one alter-native always outranks another. (Note that wehave not shown all arrows; if A outranks B, and Boutranks C, we omit the arrow from A to C, sinceit can be proven that A must also outrank C.) Forinstance, in Figure 9, Example 1, the SO2
emissions alternative always outranks nuclearpromotion and the $75, $150, and $300/ton CO2
tax alternatives. The SO2 emissions, biomass, andbase case alternatives are incomparable (noneoutrank another). Similarly, the outranking resultsfrom ELECTRE I can be used to determine arange of possible ranks for each alternative.
Base Case Biomass $75/ton $150/ton $300/ton Nuclear Relaxed SO2
Promotion CO2 Tax CO2 Tax CO2 Tax Promotion Standards
300
200
100
0
Ann
ualiz
ed G
loba
l SO
2
Em
issi
ons
[mill
ion
tons
/yr]
Figure 7. Boxplot examples.
INTEGRATED ASSESSMENT OF CLIMATE POLICY 245
Copyright # 2002 John Wiley & Sons, Ltd. J. Multi-Crit. Decis. Anal. 10: 229–256 (2001)

Kernel sizes and ranges of ranks from ELECTREI and tradeoff questions with ranges are comparedin Table IV.
The average kernel sizes from the tradeoffweighting method with ranges and the ELECTREmethod are not statistically different. The tradeoffmethod with ranges reduced the set of non-dominated alternatives by more than half, whileallowing the decision-maker to express their im-precision as well as point estimates. This outcomeimplies that results from point estimates of weights
(yielding a complete ranking of alternatives) mayinspire a false sense of precision in the rankings. Inother words, our participants were not certainenough of their answers (did not have sufficientlynarrow weighting relationships) to yield completerankings of alternatives in all cases, although use ofa point estimate forces this complete ranking.Advantages of explicit consideration of imprecisioninclude: (1) a more accurate reflection of the state ofmind of users, and (2) a screening out of asignificant number of alternatives.
1
2
3
4
5 A
vera
ge E
valu
atio
n
Ease ofUnderstanding
Reliance on Information Presented
Recommend for ActualClimate Change
Decision-Making
Table of Criteria Values
Bar Charts
Value Path Plots
XY Plots
Best
Worst
Worst
Best
1
2
3
4
5
Ease ofUnderstanding
Reliance on Information Presented
Recommend for ActualClimate Change
Decision-Making
Table of Criteria Averages(distributions)Table of Regret Averages(distributions)
XY Plots (distributions)
Box Plots (distributions)
Ave
rage
Eva
luat
ion
(a)
(b)
Figure 8. (a) Participant evaluation of deterministic visualization methods; (b) participant evaluation of uncertaintyvisualization methods.
M. L. BELL ET AL.246
Copyright # 2002 John Wiley & Sons, Ltd. J. Multi-Crit. Decis. Anal. 10: 229–256 (2001)

4. INSIGHTS INTO THE APPLICATION OFMCDM TO CLIMATE CHANGE AND
INTEGRATED ASSESSMENT
The workshop provided an opportunity forclimate change experts to state how MCDMmethods could be applied to climate change policyand IA, and what the obstacles to such applica-tions might be. Many of their comments areapplicable to a wide range of decisions beyondclimate change policy. The following conclusionswere synthesized from comments written onquestionnaires and offered during the formal
discussions. The first conclusion focuses on theformidable task of addressing expert disagreementwith respect to climate change impacts, andsuggests how MCDM could be used to helpidentify where such disagreement affects policychoice. The second highlights the challenges facingclimate change experts who want to use methodsthat require decomposition of the problem (i.e.,methods that require the user to think ofinterrelated attributes as independent).
4.1. To apply MCDM methods, decision-makersmust have confidence in attribute values, which canbe especially challenging in the uncertain realm ofclimate changeThe attribute values we provided were for thepurpose of workshop exercises and were notintended to be definitive. However, whether suchestimates were to be believed was crucial for someparticipants, even though several workshop ex-ercises explicitly incorporated uncertainty. Forexample, one participant was skeptical of modelresults because climate change models oversimpli-fy the complex reality, while another personstressed disbelief about estimates beyond theimmediate future, such as predictions of conse-quences in the year 2100. The consequences of
Example 1 Example 2
Biomass Promotion
feasible rank 1 to 4
SO2
Emissions
rank 1 to 3
$75 CO2 Tax
rank 3 to 5
$150 CO2 Tax
rank 4 to 6
$300CO2 Tax
rank 7
Base Case
rank 1 to 6 NuclearPromotion
rank 2 to 6
SO2
Emissions
rank 1 to 3
Base Case
rank 1 to 3
$75 CO2 Tax
rank 4
$150CO2 Tax
rank 5
$300CO2 Tax
rank 7
Biomass Promotion
rank 1 to 3
NuclearPromotion
rank 6
Figure 9. Example outranking relationships resulting from LP analysis of tradeoff questions with ranges.
Table IV. Results from linear value function usingtradeoff weighting methods with ranges andELECTRE I
Analysis of 7 alternatives: Tradeoff
Weighting
(linear value
function)
ELECTRE I
Kernel size: average
(standard deviation)
2.8 (1.7) 3.3 (2.0)
Number of possible ranks
for a given alternative:
average (standard deviation)
3.2 (2.1) 4.6 (2.0)
INTEGRATED ASSESSMENT OF CLIMATE POLICY 247
Copyright # 2002 John Wiley & Sons, Ltd. J. Multi-Crit. Decis. Anal. 10: 229–256 (2001)
particular policies are uncertain, as can be seenfrom present debates on climate change science.Uncertainty results in disagreement among modelsand experts with respect to the nature, distribu-tion, and timeframe of impacts (Morgan andKeith, 1995). This can be problematic for the useof MCDM with integrated assessment, as themethods require some measure of how eachalternative will perform on selected attributes.
Although decision-makers may not agree on theoutcomes of alternative scenarios, each person ordecision-making entity must have some assump-tions concerning what will or might happen if acertain action is taken in order to comparealternatives. Otherwise, the comparison of alter-natives becomes difficult or impossible. Incorpor-ating uncertainty can help address this issue, butstill experts may disagree on the uncertain impact(e.g., probability distribution for an impact) for agiven policy. In other words, including uncertaintyin the manner we used (i.e., defining a singleprobability distribution for each attribute for eachpolicy) is not enough to address expert disagree-ment in climate change policy.
MCDM could be used to explore how expertdisagreement affects the choice of alternative inseveral ways. Users’ value judgments could beapplied multiple times, once to each set ofattribute values or distributions derived fromvarious IA models or expert opinions, representinga range of possibilities. A comparison of theresulting rankings would identify where model orexpert disagreements affect choice of policy.Another approach is to allow users to specifyattribute values and distributions according totheir own beliefs, and then apply the MCDMmethods. Although this may introduce bias, itwould do so in a documentable way, and wouldhelp reveal how different expert opinions affect therankings. For example, each user may havedifferent value paths (Figure 6) because theydisagree on the impacts, yet their policy ranksmay or may not differ.
4.2. MCDM methods that involve decomposition ofthe problem require the user to separate valuejudgments from how the system functions, and maybe difficult for some usersClimate change decisions are complicated byuncertainties, multiple decision-makers, and socialimplications, which can be problematic forconventional decision analysis tools that decom-pose the decision problem into a simpler frame-
work (Jaeger et al., 1998). For instance, MCDMmethods often require the user to decompose theproblem by valuing a change in one or twoattributes while holding other attributes constant(e.g., as in tradeoff weighting). For climate changeexperts who are highly familiar with feedbacksamong attributes, such decomposition proved tobe a difficult cognitive task. Some participants feltthat the decomposition employed by such analy-tical MCDM approaches is a serious weaknessbecause it treats problems in isolation, not in thebroader context of feedbacks and other decisions.This difficulty may in part explain some of ourparticipants’ poor evaluations of the tradeoffweighting method, and their preference for holisticevaluation (Figure 1). One participant said, forexample, that he ‘‘couldn’t buy pair-wise [compar-isons] with all else being equal because of [his]preconceptions about how the world works.’’ Thissuggests that such methods require more time thanothers to allow the user to feel comfortable with aprocess that separates value judgments of theattributes from how the system functions.
However, users may gain some understandingbecause decomposition would encourage them tothink about the problem differently, consideringthe possibility of value independence (e.g., pre-ference independence) where there may still bephysical dependence (the performance of attri-butes are correlated). However, this requires awillingness and ability on the part of the user tothink of the system in ways that may not bepossible in reality (e.g., increase in temperaturewith no change in sea-level rise). Ironically, themore knowledgeable a user is about the system,the more challenging this will be. For somedecision-makers, methods that do not requiredecomposition may be more appropriate.
5. RECOMMENDATIONS FOR MCDMEXPERIMENTS
In retrospect, we can identify several ways inwhich the workshop design can be improved. Wehope that future experiments involving MCDMmethods can learn from our experience.
5.1. Attributes and general objectives must beclearly defined and encompass the decision-makers’valuesTo allow greater flexibility, we did not specify thegeneral objectives of climate policy (e.g., to
M. L. BELL ET AL.248
Copyright # 2002 John Wiley & Sons, Ltd. J. Multi-Crit. Decis. Anal. 10: 229–256 (2001)

minimize the net global costs associated withgreenhouse gas emissions, to minimize just U.S.costs, or to appease constituents); rather, we leteach participant choose weights consistent withtheir view of the appropriate objectives. However,some participants found the exercises hard tocomplete without explicit statements about who isthe decision-maker (e.g., governmental agency)and their objectives (e.g., individual versus societalgoals). In addition, the data presented to theparticipants omitted information some workshopparticipants considered valuable or necessary (e.g.,distribution of costs, nuclear waste disposalmethods, fate of tax revenue). Naturally, theseparticipants found the MCDM exercises difficult.This may explain why holistic rankings differed somuch from those of other methods (Figure 2); theformer may include unstated objectives, while thelater were based only on our IA model results.
In an actual policy-making, much effort wouldgo into determining what criteria are important toeach decision-maker. This was beyond the scope ofour experiment, therefore we were unable tocompletely address concerns about attribute com-pleteness and specificity. Participant feedbackstressed the importance of explicit and compre-hensive sets of attributes. While this observationmay seem obvious, it demonstrates the need forclearly determining early on what decision-makersdeem important. This may be especially challen-ging in the realm of climate change, as decision-makers’ goals are often divergent or unspecific,and who the decision-makers themselves are mightnot be obvious. In retrospect, participants mighthave felt more comfortable with the process hadwe spent time prior to the workshop identifyingwhat objectives were important to participantsrather than choosing what we believed to berepresentative ones. Even though the workshopinvolved a hypothetical decision and was focusedon MCDM methodology rather than the policydecision, some participants found the applicationof methods to be difficult because they did notparticipate in the selection of attributes.
5.2. Anchoring, although a potential source of bias,may be necessary or helpful for making decisionsPeople often provide numerical estimates bymodifying numbers that others have provided orsuggested, which is also known as the ‘‘anchor andadjust’’ heuristic (Kahneman and Tversky, 1973).For example, a survey which asks, ‘‘How much areyou willing to pay to eliminate 1 ton of CO2
emissions: less than $25, $25 to $50, or more than$50?’’ will generally elicit lower numbers than aquestion which uses ‘‘less than $100, $100 to $200,or more than $200?’’ To prevent such bias, wedeliberately did not provide anchors (e.g., U.S.gross national product as an anchor for annualizedcost). However, several workshop participantscommented that the exercises were difficult with-out such reference points. For example, one said itwas ‘‘hard to relate to the numbers.’’ Therefore,even though anchors are a known source of bias, itmay be necessary to provide them in order to helpparticipants understand the attributes of thealternatives. If this is true with the knowledgeableexperts participating in our workshop, it will beeven more applicable if diverse stakeholders or thepublic at large are involved. Offering a diverserange of possible anchors may lessen the possiblebias. If sample sizes permit, offering differentgroups different anchors could allow for controlof and testing for an anchoring effect.
5.3. The experiment’s schedule should be designedso that it does not overburden participantsThe two-day workshop included presentations ofmethods, over a dozen MCDM exercises, groupdiscussions, completion of evaluation forms, andbreaks and meals. Although this ambitious sche-dule allowed comparison and evaluation of manymethods, it had the drawback of fatiguing theparticipants. In retrospect, the workshop mighthave benefited from a less demanding schedule,resulting either from a longer workshop or theapplication of fewer methods. While this wouldhave resulted in less data or required more time, itwould help ensure that participants understoodthe methods and had adequate time to completeMCDM exercises and review results in a morerelaxed atmosphere.
6. SUMMARY AND DISCUSSION
A workshop with 20 climate change experts, IApractitioners, and policy-makers explored theapplication of MCDM methods to climate changepolicy and IA. Participants applied variousMCDM methods (weighting, deterministic rank-ing, and uncertainty ranking) to a hypotheticalclimate policy decision. MCDM methods werecompared and evaluated through analysis ofmethod results, opinion questionnaires, and nom-inal group discussions. A variety of conclusions
INTEGRATED ASSESSMENT OF CLIMATE POLICY 249
Copyright # 2002 John Wiley & Sons, Ltd. J. Multi-Crit. Decis. Anal. 10: 229–256 (2001)
can be drawn from the workshop results concern-ing eight hypotheses about method validity,appropriateness, and differences in choices. Insummary, our analysis shows that the methodsvaried in their predictive validity and convergenceof different persons’ results. The weighting andranking methods were found to often yielddivergent results for attribute weights and policyrankings, respectively. In particular, goal pro-gramming, additive value functions, and fuzzyset analysis often yielded very dissimilar policyranks, and tradeoff weights gave distinctly differ-ent results than other weighting methods.Although tradeoff weighting, in theory, shouldbe most valid (as it directly measures marginalrates of substitution, as required by value andutility theory methods), its weights had the lowestpredictive validity while the users preferred weightsets chosen directly or via a hybrid swing weight-ing/AHP procedure.
Another hypothesis considered whether climateexperts are subject to the classic splitting bias whendirectly selecting weights. This hypothesis wasconfirmed. Several techniques for visualizingtradeoffs and uncertainties also were compared inthe workshop. For use in actual climate changedecision-making, participants recommended vi-sualization methods that they also found wereharder to understand, suggesting that participantsbelieve the extra effort needed to comprehendmore complex visualizations is worthwhile. Thefinal hypothesis concerned the usefulness ofinformation on precision of weights. Participantsprovided information about how confident theywere of their responses to tradeoff questions.Linear programming-based methods used thisinformation to eliminate some alternatives butgenerally did not provide a complete ranking ofpolicies. We conclude that this approach providesa more realistic representation of the precision ofpeople’s preferences, and their implications forpolicy ranks.
A recurring theme in these results is the benefitof using multiple MCDM approaches. Lowpredictive validities and intermethod correlationsindicated that no single method can be used toidentify the best alternative. The outcomes of thevarious methods often conflicted because eachmethod frames the problem differently. Further,the participants disagreed about which method ispreferred for policy making}every method (ex-cept for stochastic dominance) had its advocate,and no one method was favored by all.
In their evaluation of methods, many of theparticipants advocated using several methods inconcert. By asking the participants to resolveconflicts among multiple methods, they wereforced to reflect on the problem further and toreconsider their judgments and the effects theyhave on policy choices. Participants recommendedusing revised weights (reconciliation of weightsfrom different techniques) more than any singleweighting method in actual climate change deci-sion-making. Similarly, for deterministic rankingmethods, participants recommended reconciliationof multiple methods (where the user reviews resultsfrom several methods and selects a final set ofpolicy ranks) over any individual MCDM method.Finally, reconciliation of multiple methods andlinear utility functions with revised weights weretied for the most highly recommended uncertaintyranking method.
Yet holistic assessment was, on average, morehighly recommended for actual policy makingthan any MCDM method, including reconcilia-tion, for the both the deterministic and uncertaincases. In other words, participants slightly pre-ferred that decision-makers examine attributevalues and decide policy rankings subjectivelyinstead of applying a formal MCDM method.Several participants discussed the danger of usinga ‘‘black box’’ approach, and others were un-comfortable with the process (e.g., ‘‘This frame-work doesn’t tell me anything, because I don’tview the world that way.’’). Participants stressedthe need for adequate time to understand andincorporate all relevant alternatives and decision-maker’s values, to complete MCDM exercises, andto explore and discuss results. Approaches thatdecompose the problem and evaluate attributes orpairs of attributes independently were especiallyproblematic because the climate change expertshad difficulty separating value independence fromphysical independence. In addition, participantshad other problems with the MCDM exercisesincluding missing attributes and lack of confidencein the values of the attributes that were included.
Perhaps the biggest obstacle to use of formalMCDMmethods in IA is expert disagreement withrespect to the performance of attributes for thealternatives. Experts dispute the distribution,nature, and magnitude of impacts and how muchuncertainty exists. Some participants disliked ourparticular IA model and others argued that nomodel could meaningfully estimate impacts in thedistant future, even if uncertainty is considered.
M. L. BELL ET AL.250
Copyright # 2002 John Wiley & Sons, Ltd. J. Multi-Crit. Decis. Anal. 10: 229–256 (2001)
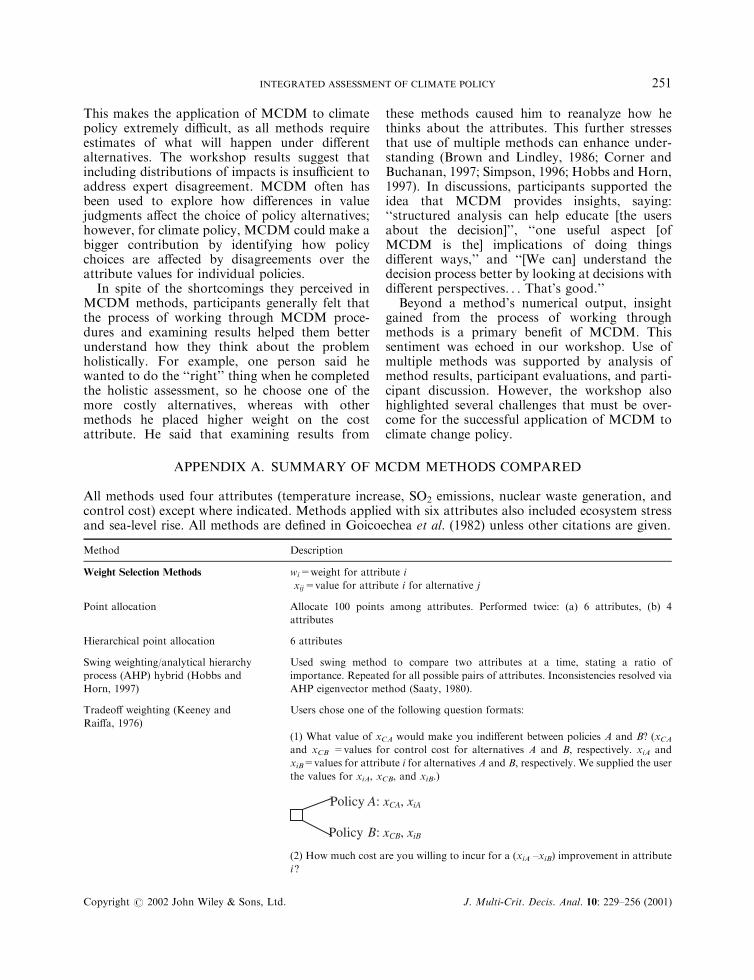
This makes the application of MCDM to climatepolicy extremely difficult, as all methods requireestimates of what will happen under differentalternatives. The workshop results suggest thatincluding distributions of impacts is insufficient toaddress expert disagreement. MCDM often hasbeen used to explore how differences in valuejudgments affect the choice of policy alternatives;however, for climate policy, MCDM could make abigger contribution by identifying how policychoices are affected by disagreements over theattribute values for individual policies.
In spite of the shortcomings they perceived inMCDM methods, participants generally felt thatthe process of working through MCDM proce-dures and examining results helped them betterunderstand how they think about the problemholistically. For example, one person said hewanted to do the ‘‘right’’ thing when he completedthe holistic assessment, so he choose one of themore costly alternatives, whereas with othermethods he placed higher weight on the costattribute. He said that examining results from
these methods caused him to reanalyze how hethinks about the attributes. This further stressesthat use of multiple methods can enhance under-standing (Brown and Lindley, 1986; Corner andBuchanan, 1997; Simpson, 1996; Hobbs and Horn,1997). In discussions, participants supported theidea that MCDM provides insights, saying:‘‘structured analysis can help educate [the usersabout the decision]’’, ‘‘one useful aspect [ofMCDM is the] implications of doing thingsdifferent ways,’’ and ‘‘[We can] understand thedecision process better by looking at decisions withdifferent perspectives. . . That’s good.’’
Beyond a method’s numerical output, insightgained from the process of working throughmethods is a primary benefit of MCDM. Thissentiment was echoed in our workshop. Use ofmultiple methods was supported by analysis ofmethod results, participant evaluations, and parti-cipant discussion. However, the workshop alsohighlighted several challenges that must be over-come for the successful application of MCDM toclimate change policy.
APPENDIX A. SUMMARY OF MCDM METHODS COMPARED
All methods used four attributes (temperature increase, SO2 emissions, nuclear waste generation, andcontrol cost) except where indicated. Methods applied with six attributes also included ecosystem stressand sea-level rise. All methods are defined in Goicoechea et al. (1982) unless other citations are given.
Method Description
Weight Selection Methods wi=weight for attribute i
xij=value for attribute i for alternative j
Point allocation Allocate 100 points among attributes. Performed twice: (a) 6 attributes, (b) 4
attributes
Hierarchical point allocation 6 attributes
Swing weighting/analytical hierarchy
process (AHP) hybrid (Hobbs and
Horn, 1997)
Used swing method to compare two attributes at a time, stating a ratio of
importance. Repeated for all possible pairs of attributes. Inconsistencies resolved via
AHP eigenvector method (Saaty, 1980).
Tradeoff weighting (Keeney and
Raiffa, 1976)
Users chose one of the following question formats:
(1) What value of xCA would make you indifferent between policies A and B? (xCAand xCB =values for control cost for alternatives A and B, respectively. xiA and
xiB=values for attribute i for alternatives A and B, respectively. We supplied the user
the values for xiA, xCB, and xiB.)
Policy A: xCA, xiA
Policy B: xCB, xiB
(2) How much cost are you willing to incur for a (xiA –xiB) improvement in attribute
i ?
INTEGRATED ASSESSMENT OF CLIMATE POLICY 251
Copyright # 2002 John Wiley & Sons, Ltd. J. Multi-Crit. Decis. Anal. 10: 229–256 (2001)

Each question was asked three times to compare the cost attribute to the other three
attributes. Weights were calculated as follows:
wi
wC¼
½xcA � xcB�=½x**C � x�C�
½xiB � xiA�=½x**i � x�i �
xi** and xi
*=best and worst values, respectively, for attribute i, among all
alternatives. xC** and xC
*=best and worst values, respectively, for cost among all
alternatives.
Revised weights (final revision
of weights)
Participants were given weights resulting from each of the above methods and asked
to provide a final set of weights.
Deterministic Ranking Methods n=number of attributes. Revised weights used except where specified.
Initial holistic assessment Alternatives ranked from most desirable (1) to least desirable (7), and then rated
from most desirable (100) to least desirable (0), using the information provided in
Table I. Performed twice: (a) 6 attributes, (b) 4 attributes
Additive linear value function MAXj
VðXjÞ ¼Xni¼1
wiviðxijÞ
V(Xj)=overall value of policy j
vi(xij)=single criterion value function that converts the criterion into a measure of
value of worth, vi(xi**)=1, vi(xi
*)=0, with:
viðxijÞ ¼ðxij � x�i Þðx��i � x�i Þ
Additive value function applied using results of each weighting method.
Additive non-linear value function Two methods were used to generate viðxijÞ, which may be non-linear, for use in
additive value function:
(1) Mid-value splitting: xi0:5=user-specified value for attribute i that is halfway in
desirability between x��i and x�i ; viðxi0:5Þ ¼ 0:5. Linear value function used if
appropriate; otherwise, ai, bi, and ci found such that viðxiÞ ¼ ai þ bi expðci � xiÞ.(2) Users drew a value function representing viðxiÞ. E.g.,
1vi(xi)
0xi
** xi*
xi
Goal programminga (a) p=2, (b) p=N. gi=user-specified maximum acceptable value for attribute i.
MINj
Xni¼1
wi MAXð0; viðgiÞ � viðxijÞÞ� �p
Thus, only undesirable deviations from goals are penalized.
ELECTRE Ia Alternative A is superior to B (A ‘‘outranks’’ B) if both of the following
(1) Concordance: C(A,B)>P
APPENDIX A. (Continued)
Method Description
M. L. BELL ET AL.252
Copyright # 2002 John Wiley & Sons, Ltd. J. Multi-Crit. Decis. Anal. 10: 229–256 (2001)
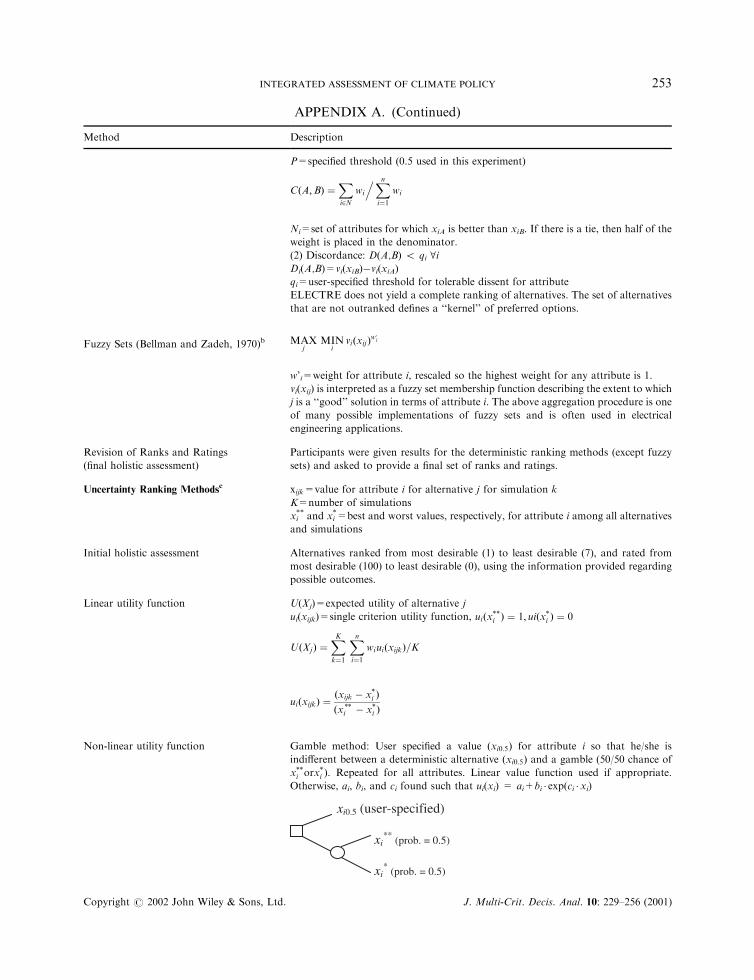
P=specified threshold (0.5 used in this experiment)
CðA;BÞ ¼Xi2N
wi
.Xni¼1
wi
Ni=set of attributes for which xiA is better than xiB. If there is a tie, then half of the
weight is placed in the denominator.
(2) Discordance: D(A,B) 5 qi 8iDi(A,B)=vi(xiB)�vi(xiA)
qi=user-specified threshold for tolerable dissent for attribute
ELECTRE does not yield a complete ranking of alternatives. The set of alternatives
that are not outranked defines a ‘‘kernel’’ of preferred options.
Fuzzy Sets (Bellman and Zadeh, 1970)b MAXj
MINi
viðxijÞw;i
w’i=weight for attribute i, rescaled so the highest weight for any attribute is 1.
vi(xij) is interpreted as a fuzzy set membership function describing the extent to which
j is a ‘‘good’’ solution in terms of attribute i. The above aggregation procedure is one
of many possible implementations of fuzzy sets and is often used in electrical
engineering applications.
Revision of Ranks and Ratings
(final holistic assessment)
Participants were given results for the deterministic ranking methods (except fuzzy
sets) and asked to provide a final set of ranks and ratings.
Uncertainty Ranking Methodsc xijk=value for attribute i for alternative j for simulation k
K=number of simulations
xi** and xi
*=best and worst values, respectively, for attribute i among all alternatives
and simulations
Initial holistic assessment Alternatives ranked from most desirable (1) to least desirable (7), and rated from
most desirable (100) to least desirable (0), using the information provided regarding
possible outcomes.
Linear utility function U(Xj)=expected utility of alternative j
ui(xijk)=single criterion utility function, uiðx��i Þ ¼ 1; uiðx�i Þ ¼ 0
UðXjÞ ¼XKk¼1
Xni¼1
wiuiðxijkÞ=K
uiðxijkÞ ¼ðxijk � x�i Þðx**
i � x�i Þ
Non-linear utility function Gamble method: User specified a value ðxi0:5Þ for attribute i so that he/she is
indifferent between a deterministic alternative ðxi0:5Þ and a gamble (50/50 chance of
x��i orx�i ). Repeated for all attributes. Linear value function used if appropriate.
Otherwise, ai, bi, and ci found such that ui(xi) = ai+bi � exp(ci �xi)
xi0.5 (user-specified)
xi**
(prob. = 0.5)
xi*
(prob. = 0.5)
APPENDIX A. (Continued)
Method Description
INTEGRATED ASSESSMENT OF CLIMATE POLICY 253
Copyright # 2002 John Wiley & Sons, Ltd. J. Multi-Crit. Decis. Anal. 10: 229–256 (2001)
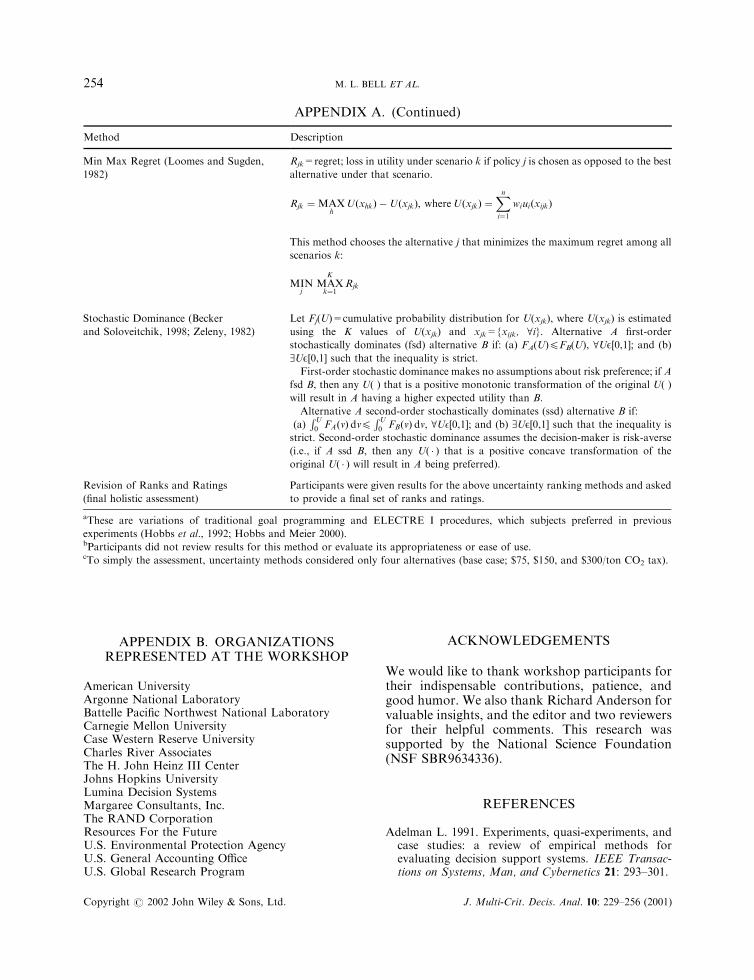
APPENDIX B. ORGANIZATIONSREPRESENTED AT THE WORKSHOP
American UniversityArgonne National LaboratoryBattelle Pacific Northwest National LaboratoryCarnegie Mellon UniversityCase Western Reserve UniversityCharles River AssociatesThe H. John Heinz III CenterJohns Hopkins UniversityLumina Decision SystemsMargaree Consultants, Inc.The RAND CorporationResources For the FutureU.S. Environmental Protection AgencyU.S. General Accounting OfficeU.S. Global Research Program
ACKNOWLEDGEMENTS
We would like to thank workshop participants fortheir indispensable contributions, patience, andgood humor. We also thank Richard Anderson forvaluable insights, and the editor and two reviewersfor their helpful comments. This research wassupported by the National Science Foundation(NSF SBR9634336).
REFERENCES
Adelman L. 1991. Experiments, quasi-experiments, andcase studies: a review of empirical methods forevaluating decision support systems. IEEE Transac-tions on Systems, Man, and Cybernetics 21: 293–301.
Min Max Regret (Loomes and Sugden,
1982)
Rjk=regret; loss in utility under scenario k if policy j is chosen as opposed to the best
alternative under that scenario.
Rjk ¼ MAXh
UðxhkÞ �UðxjkÞ; whereUðxjkÞ ¼Xni¼1
wiuiðxijkÞ
This method chooses the alternative j that minimizes the maximum regret among all
scenarios k:
MINj
MAXK
k¼1Rjk
Stochastic Dominance (Becker
and Soloveitchik, 1998; Zeleny, 1982)
Let Fj(U)=cumulative probability distribution for U(xjk), where U(xjk) is estimated
using the K values of U(xjk) and xjk={xijk, 8i}. Alternative A first-order
stochastically dominates (fsd) alternative B if: (a) FA(U)4FB(U), 8UE[0,1]; and (b)
9UE[0,1] such that the inequality is strict.
First-order stochastic dominance makes no assumptions about risk preference; if A
fsd B, then any U( ) that is a positive monotonic transformation of the original U( )
will result in A having a higher expected utility than B.
Alternative A second-order stochastically dominates (ssd) alternative B if:
(a)RU0 FAðvÞ dv4
RU0 FBðvÞ dv, 8UE[0,1]; and (b) 9UE[0,1] such that the inequality is
strict. Second-order stochastic dominance assumes the decision-maker is risk-averse
(i.e., if A ssd B, then any U( � ) that is a positive concave transformation of the
original U( � ) will result in A being preferred).
Revision of Ranks and Ratings
(final holistic assessment)
Participants were given results for the above uncertainty ranking methods and asked
to provide a final set of ranks and ratings.
aThese are variations of traditional goal programming and ELECTRE I procedures, which subjects preferred in previous
experiments (Hobbs et al., 1992; Hobbs and Meier 2000).bParticipants did not review results for this method or evaluate its appropriateness or ease of use.cTo simply the assessment, uncertainty methods considered only four alternatives (base case; $75, $150, and $300/ton CO2 tax).
APPENDIX A. (Continued)
Method Description
M. L. BELL ET AL.254
Copyright # 2002 John Wiley & Sons, Ltd. J. Multi-Crit. Decis. Anal. 10: 229–256 (2001)
Arrow KJ, Parikh J, Pillet G, Grubb M, Haites E,Hourcade JC, Parikh K, Yamin F. 1996a. Decision-making framework for addressing climate change. InClimate Change 1995: Economic and Social Dimen-sions of Climate Change, Intergovernmental Panel onClimate Change (IPCC), Bruce J, Lee H, Haites E(eds). Cambridge University Press: New York.
Arrow KJ, Cline WR, Maler K-G, Munasinghe M,Squitieri R, Stiglitz JE. 1996b. Intertemporal equity,discounting, and economic efficiency. In ClimateChange 1995: Economic and Social Dimensions ofClimate Change, IPCC, Bruce J, Lee H, Haites E(eds). Cambridge University Press: New York.
Becker N, Soloveitchik D. 1998. Dynamic multiple-objective optimization of environmental regulationpolicies. Journal of Multi-Criteria Decision Analysis 7:13–19.
Bellman RE, Zadeh LA. 1970. Decision-making in afuzzy environment. Management Science 17: 141–164.
Belton V. 1986. A comparison of the analytic hierarchyprocess and a simple multi-attribute value function.European Journal of Operational Research 26: 7–21.
Bernabo JC, Eglinton PD. 1992. Joint Climate Project toAddress Decision Makers’ Uncertainties. Science andPolicy Assoc., Inc.: Washington, DC.
Borcherding K, Eppel T, von Winterfeldt D. 1991.Comparison of weighting judgments in multiattributeutility measurement. Management Science 37: 1603–1619.
Brown RV, Lindley DV. 1986. Plural analysis: multipleapproaches to quantitative research. Theory andDecision 20: 133–154.
Corner JJ, Buchanan JT. 1997. Capturing decisionmaker preference: experimental comparison of deci-sion analysis and MCDM techniques. EuropeanJournal of Operational Research 98: 85–97.
Delbecq AL, Van de Ven AH, Gustafson DH. 1975.Group Techniques for Program Planning}A Guide toNominal Group and Delphi Processes. Scott Foresmanand Company: Glenview.
Dowlatabadi H, Morgan MG. 1993. Integrated assess-ment of climate change. Science 259: 1813–1814.
Edwards W. 1977. How to use multiattribute utilitymeasurement for social decision-making. IEEE Trans-actions on Systems, Man, and Cybernetics SMC-7:326–340.
Elmes DG, Kantowitz BH, Roediger III HC. 1995.Research Methods in Psychology, 5th Edition. WestPublishing Co.: St. Paul, MN.
Eppel T. 1992. Description and Procedure Invariance inMultiattribute Utility Measurement. Purdue Univer-sity School of Management: West Lafayette, IN.
Evans GE, Riha JR. 1989. Assessing DSS effectivenessusing evaluation research methods. Information andManagement 16: 197–206.
Gardiner PC, Ford A. 1980. Which policy run is best,and who says so? TIMS Studies in ManagementStudies 14: 241–257.
Goicoechea A, Hansen D, Duckstein L. 1982. Multi-objective Decision Analysis with Engineering andBusiness Applications. Wiley: New York.
Gunderson DE, Davis DL, David DF. 1995. Can DSStechnology improve group decision performance forend users? An experimental study, Journal of End UserComputing 7: 3–10.
Hadley CF, Schoner B, Wedley WC. 1997. A fieldexperiment comparing anchored and unanchoredcriteria weights in the analytic hierarchy process.Journal of Multi-Criteria Analysis 6: 140–149.
Hammitt JK, Lempert RJ, Schlesinger ME. 1992. Asequential-decision strategy for abating climatechange. Nature 357: 315–318.
Hobbs BF. 1986. What can we learn from ex-periments in multiobjective decision analysis? IEEETransactions on Systems, Man, and Cybernetics SMC-16: 384–394.
Hobbs BF, Chankong V, Hamadeh W, Stakhiv EZ.1992. Does choice of multicriteria method matter? Anexperiment in water resources planning. WaterResources Research 28: 1767–1780.
Hobbs BF, Horn GTF. 1997. Building public confidencein energy planning: A multimethod MCDM approachto demand-side planning at BC gas. Energy Policy 25:357–375.
Hobbs BF, Meier PM. 2000. Energy Decisions and theEnvironment: A Guide to the Use of Multi-CriteriaMethods. Kluwer Academic Publishers: Boston.
Holmes KJ, Ellis JH. 1996. Potential environmentalimpacts of future halocarbon emissions. Environmen-tal Science and Technology 30: 348–355.
Holmes KJ, Ellis JH. 1997. Simulation of halocarbonproduction and emissions and effects on ozonedepletion. Environmental Management 21: 669–685.
Huber GP. 1974. Multiattribute utility models: A reviewof field and field-like studies. Management Science 10:1393–1402.
Intergovernmental Panel on Climate Change (IPCC),Working Group I. 1995. Climate Change 1995: TheScience of Climate Change. Houghton JJ, Meiro FilhoLG, Callander BA, Harris N, Kattenberg A, MaskellK (eds.). Cambridge University Press: New York.
Jaeger CC, Renn O, Rosa EA, Webler T. 1998. Decisionanalysis and rational action. In Human Choice andClimate Change, Rayner S, Malone E (eds.). BattellePress: Columbus, Ohio.
John R, Edwards W. 1978. Importance weight assess-ment for additive riskless preference functions: Areview. Research Report 78-5. Social Sciences Re-search Institute, University of Southern California:Los Angeles, CA.
Kahneman K, Tversky A. 1973. On the psychology ofprediction. Psychological Review 80: 237–251.
Keeney R, Raiffa H. 1976. Decisions with MultipleObjectives. Wiley: Cambridge, Massachusetts.
Korhonen P, Larichev O, Mechitov A, Moshkovich H,Wallenius J. 1997. Choice behavior in a
INTEGRATED ASSESSMENT OF CLIMATE POLICY 255
Copyright # 2002 John Wiley & Sons, Ltd. J. Multi-Crit. Decis. Anal. 10: 229–256 (2001)
computer-aided multiattribute decision task. Journalof Multi-Criteria Decision Analysis: 233–246.
Lai S, Hopkins L. 1995. Can decisionmakers expressmulti-attribute preferences using AHP and MUT? Anexperiment. Environmental Planning B 22: 21–34.
Larichev OI. 1992. Cognitive validity in design ofdecision-aiding techniques. Journal of Multi-CriteriaDecision Analysis 1: 127–138.
Le !oon OG. 1997. On the death of SMART and the birthof GRAPA. Organizational Behavior and HumanDecision Processes 71: 249–262.
Leung P. 1978. Sensitivity analysis of effect of variationsin form and parameters of a multiattribute model: Asurvey. Behavioral Science 23: 478–485.
Loomes G, Sugden R. 1982. Regret theory: Analternative theory of rational choice under uncer-tainty. The Economic Journal 92: 805–824.
Manne AS, Richels RG. 1992. Buying GreenhouseInsurance: The Economic Costs of Carbon DioxideEmission Limits. MIT Press: Cambridge, Massachusetts.
Meo M. 1991. Policy-oriented climate impact assess-ment. Global Environmental Change 1: 124–138.
Morgan MG, Keith DW. 1995. Subjective judgments byclimate experts. Environmental Science & Technology29: 468A–476A.
National Acid Precipitation Assessment Program (NA-PAP) 1991. The Experience and Legacy of NAPAP,Report to the Joint Chairs Council of the InteragencyTask Force on Acidic Deposition. NAPAP OversightReview Board: Washington, DC.
Parson WA, Fisher-Vanden K. 1995. Searching forIntegrated Assessment: A Preliminary Investigation ofMethods, Models, and Projects in the IntegratedAssessment of Global Climate Change. Consortiumfor International Earth Science Information Network:University Center, MI.
Park KS, Kim SH, Yoon WC. 1996. An extended modelfor establishing dominance in multiattribute decision-making. Journal of Operational Research 47: 1415–1420.
Peck SC, Teisberg TJ. 1996. Uncertainty and the valueof information with stochastic losses from globalwarming. Risk Analysis 16: 227–235.
P .ooyh .oonen M, H.aam.aal.aainen RP. 2000. There is hope inattribute weighting. INFOR 38:272–282.
P .ooyh .oonen M, H.aam.aal.aainen RP. 2001. On the conver-gence of multiattribute weighting methods. EuropeanJournal of Operational Research 129: 569–585.
Raiffa H. 1982. The Art and Science of Negotiation.Belnap Press: Cambridge.
Ridgley M. 1996. Fair sharing of greenhouse gasburdens. Energy Policy 24: 517–529.
Rotmans J, Dowlatabadi H. 1998. Integrated assessmentmodeling. In Human Choice and Climate Change,Rayner S, Malone E (eds.). Battelle Press: Columbus,OH.
Saaty TL. 1980. The Analytical Hierarchy Process.McGraw-Hill: New York.
Sarin RK. 1977. Screening of multiattribute alternatives.The International Journal of Management Science 5:481–489.
Schoemaker PJH. 1981. Behavioral issues in multi-attribute utility modeling and decision analysis. InOrganizations: Multiple Agents with Multiple Criteria,Morse JN (Ed.). Springer-Verlag: New York.
Schubert R. 1994. Climate change and discount rates. InSteps Towards a Decision Making Framework toAddress Climate Change: Report from the MontreuzIPCC WG III Writing Team II Meeting, March 3-6,1994, Pillet G, Gassmann F (eds). Paul ScherrerInstitut: Switzerland.
Shlyakhter A, Valverde Jr. ALJ, Wilson R. 1995.Integrated risk analysis of global climate change.Chemosphere 30: 1585–1618.
Simpson L. 1996. Do decision makers know what theyprefer? MAVT and ELECTRE II. Journal of theOperational Research Society 47: 919–929.
Stewart TJ. 1992. A critical survey on the status ofmultiple criteria decision making theory and practice.OMEGA 20: 569–586.
Stewart TJ. 2000. Policy decisions in the public sector:can MCDA make a difference? In Research andPractice in Multiple Criteria Decision Making, HaimesYY, Steuer R (eds.). Springer: Berlin.
Stillwell WG, von Winterfeldt D, John RS. 1987.Comparing hierarchical and nonhierarchical weight-ing methods for eliciting multiattribute value models.Management Science 33: 442–450.
Valverde Jr. ALJ, Jacoby HD, Kaufman GM. 1999.Sequential climate decisions under uncertainty: Anintegrated framework. The Journal of EnvironmentalModeling and Assessment 4: 87–101.
von Winterfeldt D, Edwards W. 1986. Decision Analysisand Behavioral Research. Cambridge University Press.
Weber M. 1987. Decision making with incompleteinformation. European Journal of Operational Re-search 28: 44–57.
Zapatero EG, Smith CH, Weistroffer HR. 1997.Evaluating multiple-attribute decision support sys-tems. Journal of Multi-Criteria Decision Analysis 6:201–214.
Zeleny M. 1982. Multiple Criteria Decision Making.McGraw-Hill: New York.
M. L. BELL ET AL.256
Copyright # 2002 John Wiley & Sons, Ltd. J. Multi-Crit. Decis. Anal. 10: 229–256 (2001)