An Evaluation of Input Devices for Timbre Space … Evaluation of Input Devices for Timbre Space...
65
An Evaluation of Input Devices for Timbre Space Navigation ROEL VERTEGAAL MPhil Dissertation Department of Computing University of Bradford 1994
Transcript of An Evaluation of Input Devices for Timbre Space … Evaluation of Input Devices for Timbre Space...

An Evaluation of Input Devices forTimbre Space Navigation
ROEL VERTEGAAL
MPhil Dissertation
Department of Computing
University of Bradford
1994

An Evaluation of Input Devices forTimbre Space Navigation
An experimental evaluation of the impact of input devices on humanperformance in a four-dimensional timbre space navigation task.
Roeland Petrus Hubertus VERTEGAAL
This dissertation is submittedin part fulfilment of the
requirements for theDegree of Master by Advanced Study
in Computer Science.
Department of Computing
University of Bradford
1994

Abstract
This thesis presents experimental research into the impact of input devices on human
performance in a four-dimensional timbre space navigation task using ISEE, a high-
level synthesizer-independent user interface. Subjects carried out two tasks: in the
first task four different input device types (mouse, relative joystick, absolute joystick
and dataglove) were used to reach target positions in a perceptual space using
audio-visual feedback; in the second task only the glove was used in audio-visual
and auditory-only feedback conditions. Data was analysed for speed, accuracy and
control integration (the amount of cross-dimensional motion) of the devices. Results
indicate a highly significant effect of the choice of input device on the efficacy of
timbre manipulation. The mouse was the fastest and most accurate device, then
come the absolute joystick, relative joystick and glove. The glove scored significantly
better in control integration with 3 out of 4 dimensions, which might indicate a closer
correspondence of the perceptual structure of the timbre space with that of the glove.
The visual 2 x 2-D representation had no significant effect on control integration and
visual feedback did improve accuracy significantly, but not speed. These results
have significant implications for the design of intuitive interfaces for direct control of
sounds in composition and performance activities.
Keywords: Human-Computer Interaction, User Interface, Input Devices, ComputerMusic Synthesis, Timbre Space.

MPhil Computer Science Dissertation
Roel VertegaalSound Information Technology Research GroupDepartment of ComputingUniversity of BradfordBradford, BD7 1DP, United [email protected]
An Evaluation ofInput Devices forTimbre SpaceNavigation
An experimental evaluation of the impact of input devices on humanperformance in a four-dimensional timbre space navigation task.
Keywords: Human-Computer Interaction, User Interface, Input Devices, ComputerMusic Synthesis, Timbre Space.
Abstract
This thesis presents experimental research into the impact of input devices on human
performance in a four-dimensional timbre space navigation task using ISEE, a high-
level synthesizer-independent user interface. Subjects carried out two tasks: in the
first task four different input device types (mouse, relative joystick, absolute joystick
and dataglove) were used to reach target positions in a perceptual space using
audio-visual feedback; in the second task only the glove was used in audio-visual
and auditory-only feedback conditions. Data was analysed for speed, accuracy and
control integration (the amount of cross-dimensional motion) of the devices. Results
indicate a highly significant effect of the choice of input device on the efficacy of
timbre manipulation. The mouse was the fastest and most accurate device, then
come the absolute joystick, relative joystick and glove. The glove scored significantly
better in control integration with 3 out of 4 dimensions, which might indicate a closer
correspondence of the perceptual structure of the timbre space with that of the glove.
The visual 2 x 2-D representation had no significant effect on control integration and
visual feedback did improve accuracy significantly, but not speed. These results
have significant implications for the design of intuitive interfaces for direct control of
sounds in composition and performance activities.
This dissertation is submitted in part fulfilment of the requirements for the Degree of Master byAdvanced Study in Computer Science.

Table of Contents
Chapter 1. Introduction................................................................................................................................................................... 11.1 Overview.............................................................................................................................................................................. 11.2 Aim and Strategy................................................................................................................................................................ 31.3 Analysis Results and Conclusions .............................................................................................................................. 71.4 Structure of the Thesis ..................................................................................................................................................... 8
Chapter 2. Issues in Human-Synthesizer Interaction............................................................................................................ 92.1 Human-Computer Interaction........................................................................................................................................ 9
2.1.1 Direct Manipulation............................................................................................................................................ 92.1.2 Motor Control Theory..................................................................................................................................... 11
2.2 The Control Problem...................................................................................................................................................... 122.2.1 Traditional Research........................................................................................................................................ 122.2.2 Timbre Space........................................................................................................................................................ 152.2.3 ISEE: Converting Timbre Space into a Generic Synthesis Model...................................................... 16
2.3 Generic Input Device Experimentation................................................................................................................... 172.3.1 Overview.............................................................................................................................................................. 172.3.2 Two-Dimensional Input Device Experimentation.................................................................................. 182.3.3 Fitts’ Law............................................................................................................................................................. 192.3.4 Multidimensional Input Device Experimentation................................................................................... 202.3.5 Perceptual Structure.......................................................................................................................................... 22
2.4 Summary............................................................................................................................................................................. 24Chapter 3. Materials and Methods .......................................................................................................................................... 25
3.1 Materials........................................................................................................................................................................... 253.1.1 Input Devices ....................................................................................................................................................... 253.1.2 Computing and Synthesis Apparatus .......................................................................................................... 293.1.3 Software Configuration................................................................................................................................... 293.1.4 Subjects and Environment ............................................................................................................................... 33
3.2 Methods............................................................................................................................................................................. 343.2.1 Input Device Experiment.................................................................................................................................. 343.2.2 Screen Experiment.............................................................................................................................................. 363.2.3 Questionnaires.................................................................................................................................................... 373.2.4 Analysis Methods.............................................................................................................................................. 37
Chapter 4. Results........................................................................................................................................................................... 404.1 Input Device Experiment .............................................................................................................................................. 40
4.1.1 Movement Times ................................................................................................................................................. 404.1.2 Best Accuracy...................................................................................................................................................... 404.1.3 Control Integration............................................................................................................................................ 41
4.2 Screen Experiment .......................................................................................................................................................... 434.2.1 Movement Times ................................................................................................................................................. 434.2.2 Best Accuracy...................................................................................................................................................... 434.2.3 Control Integration............................................................................................................................................ 43
4.3 Qualitative Data............................................................................................................................................................. 44Chapter 5. Discussion................................................................................................................................................................... 47
5.1 Input Device Experiment .............................................................................................................................................. 475.1.1 Movement Time and Accuracy....................................................................................................................... 475.1.2 Control Integration............................................................................................................................................ 48
5.2 Screen Experiment .......................................................................................................................................................... 495.2.1 Movement Time and Accuracy....................................................................................................................... 495.2.2 Control Integration............................................................................................................................................ 49
5.3 Qualitative Data............................................................................................................................................................. 51Chapter 6. Conclusions................................................................................................................................................................. 52
6.1 Findings.............................................................................................................................................................................. 526.2 Future Directions............................................................................................................................................................ 53
References.......................................................................................................................................................................................... 55Appendix A. Questionnaires ...................................................................................................................................................... 57
A 1. Input Device Experiment Questionnaire............................................................................................................... 57A 2. Screen Experiment Questionnaire........................................................................................................................... 58A 3. ISEE Questionnaire ..................................................................................................................................................... 59

Acknowledgements
I would like to thank Dr. Barry Eaglestone for being such an excellent coach, S. Joy
Mountford of the Apple Computer, Inc. Human Interface Group for initiating this
project and entrusting me with a selection of their input devices, Kurt Schmucker of
Apple Computer, Inc. for his crucial support, Dr. Michael Clarke and the students of
the Huddersfield University Music Department for providing me with facilities and
subjects, Tom Wesley for providing me with a computer, Debby Twigger for the
unrewarding task of being the first guinea pig, Carole Stainton for her advice on
statistics, Rob Jacob of the Naval Research Lab for sending me a pre-press copy of
his excellent paper on perceptual structure, Iain Millns for letting me use his printer
all the time and being such a great sport, Geoff Davies for his advice on
experimentation, Ernst Bonis without whom ISEE would not have existed, Tamas
Ungvary for giving me lots of incentives to continue this work, Leonard Newnham
for making me go on wheels, Miriam Netten for standing by me, my parents for their
valuable support, the people from the ‘Admiral Nelson’, particularly Joyce and
Frank Clarke, for making us feel at home in England and last, but certainly not least,
the VSB Bank, The Netherlands for their VSB Grant without which this research
could never have taken place.

1
Chapter 1. Introduction
1.1 Overview
The advent of low-cost high-performance computer technology now makes possible
wide-spread integration of digitally synthesised sound within computer systems.
However, full exploitation of this facility has been impeded by the lack of simple
intuitive computer interfaces with which to design and manipulate the sounds. This
research addresses this problem through a study of one specific area of audio-
related applications: computer music composition and performance.
Musicians and composers in many genre of music have for many years made
extensive and sophisticated use of digital sound synthesis. However, whereas in the
past complicated low-level user interfaces used to be no more than a discomfort for
the insider, they now present a real barrier to the many instrumentalists who want to
make use of the full potential of digital sound synthesis systems. New ways of
interfacing human and computer are therefore required which facilitate the
interaction between composer or performer and the sound synthesis process.
Developments in the area of Human-Computer Interaction (HCI) have already
brought about significant changes in the ways in which people work with computers.
Computer Music, the discipline that studies the synthesis of music using computers,
has only partially benefitted from these new developments, as will be demonstrated
in the next chapter. We have therefore chosen to seek new paradigms for human-
synthesizer interaction through the application of HCI knowledge and technology to
the interfacing problems that exist in Computer Music. This thesis will focus on the
process of interaction between composer or performer and the computer music
synthesis process.
Musician-synthesizer interaction is problematic since user interfaces must resolve
two conflicting requirements: the simple, direct and intuitive real-time control of
sounds by the musician and the constructive control of the inherently complex
synthesis technology. Some aspects of the real-time control of synthesized sound
were successfully handled early on by introducing existing musical instrument user
interfaces. A good example is the use of the piano keyboard, an input device with a
history of hundreds of years of refinement, as a general controller for pitch and
loudness. By the same token, one could imitate the timbre1 control capabilities of
traditional instruments. After all, musicians have always been able to manipulate the
timbre their instrument produces very effectively. For example, simply changing the
position where the bow hits the strings produces a significant change in timbre of a
1 The quality of sound that enables one to discriminate two steady-state complex tones with equal pitchand loudness.

2
violin, and is only one example of the quick and accurate timbre modifications
musical instruments are capable of. However, traditional timbre controllers are too
limited and idiosyncratic to cover the enormous potential of timbral control in
current sound synthesizers. This is because the timbral potential of the synthesizer
lies hidden amongst the many highly idiosyncratic parameters. The only way to
modify timbre in a constructive way, is through manipulation of the parameters of
sound synthesis algorithms such as Waveshaping, Frequency Modulation and
Additive Synthesis.
In order to develop a more direct manipulation of timbre the following strategy was
devised:
• Generalize timbre parameters according to human perception and cognition;
• Generalize the timbre controller in order to operate these parameters.
However, the development of intuitive generic user interfaces for the modification of
timbre is hindered by gaps in the knowledge of human timbre perception and
cognition. As will be demonstrated in § 2.2, questions as to how many parameters
humans use to categorize timbre, and what these parameters are, have only been
answered partially. Trying to answer these questions is an essential step in the
development of a more intuitive user interface for timbre manipulation. It will be
shown that the Intuitive Sound Editing Environment (ISEE) attempts to address
these issues by introducing a generalized timbre control scheme based on expert
perception and cognition (Vertegaal and Bonis 1994). ISEE provides us with
demonstrator software on which further research into a generic hardware timbre
controller can be predicated.
This thesis will concentrate on that research. It studies one specific aspect of human-
computer interfaces for sound synthesis systems: the use of generic input devices for
the direct manipulation of timbre. In particular, a range of low- and
multidimensional input devices have been evaluated experimentally for navigational
tasks within a four-dimensional space of timbres.

3
1.2 Aim and Strategy
The general aim of this project was to compare the performance of a number of
state-of-the-art input devices in a multidimensional positioning2 task with auditory
feedback, taking into account current HCI issues concerning the applications of
multidimensional input devices and the use of audio in user interfaces. The
comparison was made through experiments using current input devices in a timbre
manipulation task. The project was set up to allow generalization of the
experimental evidence in order to provide a genuine contribution to the body of
Human-Computer Interaction research. Initial literature study therefore had to
examine the following four aspects of human-computer interfaces for synthesizers:
• Backgrounds of Human-Computer Interaction;
• Research into computer music controllers;
• Research into timbre control structures;
• Input device technology and evaluation.
These issues will be reviewed in the next chapter. The objective of this initial study
was to select a small number of characteristic input devices and outline appropriate
experiments for their evaluation. The initial study confirmed the originality of the
proposed research, since none of the work described in the literature share the
project aims. It also clarified the nature of the problem and the appropriate research
methods. This resulted in the following strategy:
1) Identify the hypotheses on which the experiments are based.
The first hypothesis followed our research objectives. A control experiment was
however deemed necessary to establish the impact of the restricted 2 x 2-D on-
screen feedback on the way the multidimensional input device would be moved
through space (i.e., its control integration), resulting in a second hypothesis. The
following hypotheses were identified as a basis for the experiments:
Ê The choice of input device in a 4 degrees of freedom (DOF) sound manipulation taskwith 2 x 2-D visual positioning feedback will affect performance and controlintegration significantly.
À Removing the 2 x 2-D on-screen positioning feedback will affect performance andcontrol integration significantly.
2 Usually when one speaks of positioning, movement on the x, y or z axis of 3-D space is implied. Whenmore dimensions are involved, movement often becomes manipulation: rolling, tilting and swivelingobjects in space. However, for reasons of clarity, a 4-D ISEE timbre control task is considered here to bea positioning task.

4
Since the demonstrator system used in this study pertains to music synthesis,
experiments were to be carried out using musicians. Because musicians can be
expected to have a better than average response to auditory feedback, conclusions
as to the appropriateness of the auditory-only feedback condition in the control
experiment were to be regarded as exploratory from the start.
2) Identify the experimental procedures and design the experiments forhypothesis testing, taking statistical analysis requirements into account.
Further literature study focused on the following two aspects of experimental
psychology:
• Quantitative and qualitative experiment design;
• Statistical analysis.
A repeated measures (related) experimental design, where every subject performs all
conditions, proved the most convenient method given the low number of subjects.
Complex counterbalancing and randomization of stimuli were introduced to prevent
order effects. Significance testing was to be performed using t-tests. To obtain
qualitative information questionnaires were designed based on summated ratings.
3) Identify qualitative and quantitative parameters for testing of the efficacy ofinput devices.
As will be demonstrated in the next chapter, the time taken to reach a target position
is an important measure when assessing the efficacy of an input device. However, as
with any positioning task, the only way to get a meaningful measure is by taking the
accuracy with which the device is positioned into account. Thus, the movement time
needed to reach a certain accuracy became the main indicator of efficacy. The mean
best accuracy reached throughout the trials with each device was used as a
complementary measure. For multidimensional devices, measuring the amount of
cross-dimensional motion during the experiments is important. This says something
about the efficiency of movement a device is capable of, independent of speed
constraints. Based on the literature, it was decided to perform all measurements
retroactively, in order to prevent mistakes during the trials. All movement during the
tests was therefore to be recorded.
4) Identify a selection of state-of-the-art low- and multidimensional input devicesand acquire them.
Three input devices were selected given the available funding and other pragmatic
constraints such as availability of appropriate software drivers. The literature
indicated that a specific area of interest would be the comparison between the

5
performance of multidimensional and low-dimensional devices in a multidimensional
task. The Nintendo Power Glove, a dataglove with 8 DOF, was selected because of
its history as a multidimensional timbre controller (Lee, Freed et al. 1991), its low
cost and hardware compatibility. Literature also indicated that it would be
interesting to compare the performance of a relative device (i.e., a device that
controls the speed and direction of the parameter change) with that of an absolute
device (i.e., a device the position of which is directly related to the parameter
setting). The Gravis Advanced Mousestick II joystick, which can be switched from
absolute to relative operation, permitted a study of this aspect without side effects.
The Apple Standard Mouse was added to the selection because of its general
acceptance and availability, yielding a total of four input device types to study.
Figure 1 shows the selection of input devices used.
5) Select a random group of musicians with some experience in sound synthesis.
We depended on an opportunity sample of music students of the Huddersfield
University Music Department, where the experiments were to take place in a studio.
15 students volunteered, providing a large enough sample group if, according to the
literature, a related experiment design was used.
6) Develop a new version of ISEE with improved visual feedback.
Since work on ISEE had not yet been finished, the software needed to be made ready
for the experiments. This involved a new user interface design and a significant
amount of C++ Macintosh programming. However, that work is beyond the scope of
this thesis and is treated elsewhere (Vertegaal 1992).
7) Set up ISEE to work with the alternative input devices and design anappropriate timbre space for experimentation.
Max, a musical data-flow oriented configuration tool, was used in conjunction with
driver software to filter and redirect Power Glove positioning data via MIDI3 to the
ISEE system. Simultaneously, Max could record all experimental data. Joystick and
mouse controls were implemented in C++. Auditory feedback was mapped to the
positioning space according to a design by Ernst Bonis, which was selected because
of its clear timbral diversity.
3 Musical Instrument Digital Interface, a hard– and software protocol which constitutes a musical LAN.

6
figure 1. Input devices

7
8) Establish the relative quality of the alternative input devices, throughexperiments involving the sample user population.
The first hypothesis was tested empirically by letting the subjects operate four
timbre parameters, represented by two dots on a screen, in order to reach a target
position. Each parameter produced a corresponding change in timbre, thus providing
auditory feedback. Each subject performed several sessions, during each of which all
devices were aimed at the same target position. The second hypothesis was tested
similarly, but only the glove was used. In those sessions, the subjects reached for a
target position under two feedback conditions: audio-visual and auditory-only.
1.3 Analysis Results and Conclusions
During analysis, the mean movement time needed to reach a certain accuracy (i.e., a
distance to target in Euclidian space) was compared between all device pairs. T-
tests indicated a highly significant difference in speed and accuracy between the four
device types. The mouse was the fastest and most accurate device, then came the
absolute joystick, relative joystick and Power Glove. More than anything, the ease
with which the low-dimensional input devices outperformed the multidimensional
Power Glove demonstrates the impact of cost-cutting measures on multidimensional
device performance. The speed and accuracy deficiencies of the Power Glove are
mainly due to the low-cost construction of its ultrasonic positioning system. Its
erratic behaviour necessitates filtering and causes lag. The low resolution of its roll
information eliminates its use in refined tasks with more than 3 degrees of freedom.
Of the tested devices, the cheapest low-dimensional device, the mouse, remains
the best option, even in this multidimensional task. However, when the control
integration (i.e., angle of movement) was examined for all axis pairs, the Power
Glove demonstrated its future potential by effectively integrating the axes in 3-D
space. Also, the glove provided higher integration of the axes in 2-D space than the
low-dimensional devices. Control integration did not differ significantly between the
audio-visual and auditory-only conditions of the second experiment. The visual
representation thus proved satisfactory, since its separation of 4-D space into two
2-D projections had no significant impact on multidimensional device utilization and
corresponded nicely with the perceptual structure of the low-dimensional devices.
Loss of visual feedback reduced the accuracy significantly, but not the speed when
the accuracy criterion was met. A majority of the subjects appreciated the ISEE
timbre manipulation scheme. They thought it made sound synthesis easier and
liberated them from technicalities, without restricting them artistically.

8
The ISEE Overtones and Brightness timbre parameters were considered useful
auditory navigational aids. The encouraging results with auditory-only feedback
stimulates further research into its use.
1.4 Structure of the Thesis
The next chapter will present the literature review, where we will discuss the
backgrounds of Human-Computer Interaction, research into computer music
controllers, research into timbre control structures and input device experimentation.
The third chapter will focus on the materials and methods used during the
experiments and the analysis phase: what was used, why and how. The fourth
chapter will present the results of the analysis of experimental data. In the fifth
chapter we will try to find explanations for the results found. The conclusions and a
future programme of research will be presented in the sixth and final chapter.

9
Chapter 2. Issues in Human-Synthesizer Interaction
One would expect most of the research into hardware music controllers to find its
origins in experimental Human-Computer Interaction. When looking at the literature,
however, it becomes clear that this is not the case. New methods of controlling
computer music are hardly ever empirically evaluated. Most hardware is custom
built and designed to be controlled by the inventor. It is all too easily disregarded
that when establishing a new timbre control paradigm, HCI design principles should
be taken into account. We must of course look at the history of research into timbre
controllers in order to understand the issues involved, but an understanding of
traditional user interface research can aid the development of generic user-friendly
interfaces for musicians and composers alike. The initial research therefore focused
on these two areas. This chapter summarizes this first phase of the project, in which
the modern principles of HCI and problems concerning musical timbre control were
reviewed through the literature. In summary, the conclusion is that generic utilization
has hardly been an issue in the design of computer music controllers. Paradigms for
translating movement into sound have not been generalized to provide new user
interfaces for intuitive timbre control. Traditional evaluation techniques for computer
input devices can provide a solid basis for the evaluation of computer music
controllers.
In this chapter, current knowledge in the field of Human-Computer Interaction
concerning direct manipulation in graphic user interfaces and movement theory will
be discussed and related to timbre control. An overview will be presented of
Computer Music research into the development of input devices for real-time control
of digital sound. This will be followed by a review of timbre control structures,
featuring the timbre space and Intuitive Sound Editing Environment paradigms for
mapping low-dimensional controller data to high-dimensional synthesis parameters.
Finally, the literature pertaining computer input device evaluation will be discussed,
featuring a theoretical basis for the evaluation of low- as well as multidimensional
input devices.
2.1 Human-Computer Interaction
2.1.1 Direct Manipulation
With the advent of graphical user interfaces in sound synthesis computer software
as well as sound synthesizers, one would expect the notion of direct manipulation of
timbre to have gained ground. This section will demonstrate that current
implementations of graphical user interfaces for synthesizers do not adhere to the

10
fundamental principals of direct manipulation. Therefore, we will look at the
available literature for the principles and benefits of a direct manipulation approach.
According to Nelson (1980), direct manipulation is a user interface technique
where objects and actions are represented by a model of reality. Physical action is
used to manipulate the objects of interest, which in turn give feedback about the
effect of the manipulation. A good example in the real world is driving a car. To turn
left, the driver rotates the steering wheel to the left, resulting in an immediate change
of scenery, which provides essential visual feedback. This approach is essentially
different from a command oriented approach, which would consist of issuing a
directional command such as GO RIGHT, and then issuing a command to show the
heading of the car. A good example in the Computer Music domain is transposing
notes using a notation editor, in which case the metaphor is the note symbol, the
action is moving the note vertically on the staff and feedback consists of note and
hand position and the resulting audible change in pitch.
Rutkowski (1982) noted that an important aspect of direct manipulation is the
principle of transparency, where attention shifts from issuing commands to
observing results conveyed by feedback: “The user is able to apply intellect directly
to the task; the tool itself seems to disappear.” In order for that to work, feedback
should be consistent with the user’s expectations of the task’s results.
Shneiderman (1987) argues that with direct manipulation systems, there may be
substantial task-related semantic knowledge (e.g., the composer’s knowledge about
score writing), but users need to acquire only a modest amount of computer-related
semantic knowledge and syntactic knowledge (e.g., the composer need not know that
a score is not just put in a drawer, but in fact is saved as a MIDI file on a disk, nor
that transposing that score consists of applying a change-key-number function
to all note-on and note-off events in the score). Task-related semantics should
dominate the users’ concerns, reducing the distraction of dealing with the computer
semantics and the syntax. To achieve maximum effect, computer-related semantics
would need to be replaced by task-related semantics. This brings us to the question
what the semantics of timbre control could be. Though this will be further discussed
in § 2.2, brightness will be used in the next example to indicate where current
synthesis user interfaces fail to implement the principals of direct manipulation
correctly.
Most synthesis parameters can nowadays be controlled in real-time by external
controllers using typical ad hoc configurations. Usually, each degree of freedom
(DOF) directly controls one synthesis model parameter, which need not necessarily
behave in a perceptually linear or consistent fashion. For example, to change the
brightness of a tone generated by Frequency Modulation (Chowning 1973), one could
change the output level of a modulator. Though most of the time this seems to affect

11
the brightness of the sound, in fact, one controls the width of the spectrum, which
might result in noise due to aliasing if, for instance, operator feedback is active,
resulting in a loss of correspondence between the task-related semantics and
synthesizer-related semantics. A more direct mapping between task-related
semantics (I want to make a sound brighter) and synthesizer-related semantics (then
I need to change the output level of the modulator or the feedback level or both)
could easily be achieved if control would operate at a higher level of abstraction.
Then every synthesizer could have a brightness parameter that would produce
similar effects.
Achieving true direct manipulation of timbre is a step to be taken before we can
test generic input devices, since it helps operating those devices in a more meaningful
way, possibly improving their performance. Accomplishing direct manipulation
includes the identification of the semantics of timbre manipulation and the
implementation of those semantics in a consistent fashion.
2.1.2 Motor Control Theory
Another traditional aspect of HCI that points towards a high-level control mapping
based on a task-related semantics is that of motor control theory. When musicians
want to express a timbre during a performance on stage, one would expect them to
be able to do so in a controlled and meaningful manner. However, with electronic
timbre expression this proves problematic. When musicians start practising a piece,
they need to adjust errors using auditory, visual, tactile and muscular receptor
feedback. As they progress, priority shifts from high-level visual and auditory
feedback to lower-level tactile and muscular receptor feedback, resulting in the
ability to perform without visual or auditory feedback (Keele 1973). Keele (1968)
attributes this behaviour to the compilation of movements into ready-for-use motor
programs. The linkage of motor programs during the final autonomous phase of skill
learning reduces the amount of cognitive control necessary, clearing the mind for
other tasks such as musical expression (Fitts and Posner 1967). However, for each
type of sound and for each type of synthesis model, the same timbral expression
means different hardware controls must be manipulated in different ways, making it
virtually impossible to reach the autonomous learning phase for the generic
application of perceptually meaningful (i.e., not synthesis model based) timbre
modifications.
This results in the use by jazz musicians of dedicated input devices aimed at
modifying a single synthesis parameter which does behave in a musically consistent
and meaningful way (e.g., breath control of the modulator envelope bias to
implement brightness on an FM synthesizer). These dedicated input devices are often

12
limited to one degree of freedom, since they are used to control a single parameter of
the sound synthesis model. Since the number of limbs that can be used to operate
these devices is limited, this approach reduces the power of the synthesis model in
generating a wealth of different timbres considerably.
A suitable control mapping will need to restrict the number of parameters, yet
provide more diversity than single parameter controllers. Lee and Wessel (1992)
support this low- to high-dimensional approach.
2.2 The Control Problem
Before we attempt to test input devices in a generic timbre manipulation task we
need to look at the literature in order to select a suitable timbre manipulation model.
This model should adhere to the constraints mentioned in earlier paragraphs,
providing a consistent task-related, low- to high-dimensional mapping between
control information and synthesis information. In the past, such perceptually based
timbre control structures have been devised, featuring a reduced number of
parameters. However, since it is difficult to generalize such parameters for all
possible timbres, most studies into timbre controllers have focused on performance
instead of generic sound synthesis.
2.2.1 Traditional Research
The literature of computer music controller development reveals a significant
difference in approach with standard HCI input device research. To illustrate this, a
number of typical articles on real-time control of digital sound synthesis from recent
years are treated here.
Cadoz, Luciani et al. (1984) and Cadoz, Luciani et al. (1993) describe a musical
virtual reality system called Cordis that is based on two forms of instrumental
models for digital sound synthesis:
• Input devices that capture physical gestures and react to these gestures withprogrammable feedback;
• Sound synthesis techniques based on the simulation of physical soundproducing mechanisms.
At the time this was a revolutionary idea, integrating the development of physical
modelling as a synthesis model with the idea of reactive input devices. However, the
input devices that were developed for this system were designed to physically
emulate traditional musical instrument behaviour. Traditional instruments typically
provide enormous control potential at a considerable cost of training time. With their

13
performance, the idiosyncrasy of traditional input devices is modelled as well. This
means different input devices are needed to play different virtual instruments.
Though it is claimed that this approach is viable for use in real-time sound synthesis
control, it is typically designed for skilled performance, rather than generic user
interface utilization.
The VideoHarp, presented by Rubine and McAvinney (1988), is a multipurpose
musical input device more than anything designed to please an audience with its
spectacular visual appeal. It features different regions modelling traditional
instrument behaviour. A keyboard region, bowing region, conductor region and
modifier region can be mapped using MIDI channel messages, basic control
commands for MIDI devices. My key criticism on this research is that it lacks even a
heuristic specification of the low- to high-dimensional mapping of region data to
synthesis data. Also, it does not present any kind of empirical evaluation of the
device by musicians.
Gibet & Florens (1988) and Gibet & Marteau (1990) base their gestural control
system on motor system theory. Like Cadoz, Luciani et al. (1984), their approach
follows the physical modelling paradigm. With this approach, they intend to achieve
direct manipulation of sound by restoring the causal link as the natural law for
sound synthesis. This relies on the theory that the objects of the perception emerge
out of the representation of gestures that produce the sound. Though it is clear that a
direct correlation between gesture and sound reduces cognitive processing load and
enhances performance (Keele 1973), the expectations of a performer are related to
real world objects. This impairs utilization of the system as a generic sound
synthesis control paradigm, since a generalized mapping between gesture and timbre
is not provided.
In (Mathews 1989; Mathews 1991) the Radio Baton is described. It is a 3 DOF
controller which uses low-frequency radio waves to determine position on the x, y
and z axes. In these papers, the instrument is presented as a MIDI sequence
conductor. A difference is made between expressive and predetermined components
of western classical music. It is claimed that predetermined components can be left
to the computer, allowing the performer to concentrate all his attention on the
expressive aspects of music. The system would relieve the performer of data
processing and motor control tasks involved in (prima vista) score reading. The
instrument can be set up to act like a drum, where beats on an imaginary plane can
act as triggers for note sequences and tempo controls. When the baton is close to the
plane, it can be used to control pitch bend and vibrato of the notes played. Though
pitch is indeed an important means of expression, timbre control should not be
marginalized. Unfortunately, by basing his system on the rigid western classical
music tradition, Mathews reduces timbre to a predetermined and therefore

14
automatically handled component. To my knowledge, the baton has never been
empirically evaluated as a generic instrument.
Another real-time performance controller is presented in (Bauer and Foss 1992), a
paper resembling a reference manual. This system uses ultrasonic sound to determine
the position of up to four wands in 3-space4. The system, called GAMS, requires the
definition of a substantial amount of relations between on-stage positions and MIDI
channel messages. Via MIDI, not just music is controlled, but also lighting and
imaging. A formalism for a meaningful mapping of control information to the various
media is not discussed. Not surprisingly, the audience could not understand what
was happening during trial performances. Consequently, the idiosyncrasies of the
system, rather than the contents of the performance, became the point of discussion.
All these systems, from the The Hands (Waisvisz 1985) to Oculus Ranae (Collinge and
Parkinson 1988), have the following in common:
• They are intended to be idiosyncratic for artistic reasons;
• They focus on performance;
• They are hardly ever empirically evaluated.
The above survey indicates that problems of human-synthesizer interfacing in the
field of Computer Music have been tackled primarily through the development of
innovative hardware controllers. However, the use of these as generic controllers is
limited, because researchers have failed to developed accompanying formalisms for
the low- to high-dimensional control mapping. This omission may have been caused
by the considerable influence technicians have traditionally had on Computer Music
research. Fortunately, some research into generic control formalisms has been done,
and can form the basis for further evaluation and development of synthesizer control
mechanisms and techniques. Not surprisingly, this research is typically conducted by
psychologists and HCI experts working in the Computer Music domain.
In (Buxton, Patel et al. 1982), the Objed system is described as a part of the
SSSP, a computer composition environment that was one of the first to introduce
direct manipulation principals in digital sound synthesis. Subsequent graphical MIDI
editors were all based on the same principle: that of manipulating sliders to control
on-screen synthesis model parameters. However, early on the authors recognized
that approach to be no more than a substitute, and that timbre should ideally be
controlled according to perceptual rather than acoustical attributes. They also
emphasized the importance of minimizing non-musical problems of the sound
4 Short for three-dimensional space.

15
synthesis task and permitting the composer to understand the perceptual
consequences of their actions.
Eaglestone (1988) states that computer instrument development is an iterative
process of design, prototyping and empirical evaluation. He relates the control
problem to that of achieving data independence in a database environment, and
hence achieving an abstract, user oriented interface. The paper sets out the right
path, but remains rather abstract.
Lee, Freed et al. (1991) and Lee & Wessel (1992) demonstrate how a Mattel
Power Glove was used in combination with a neural network to produce real-time
control of timbre during performances. As a control mapping a timbre space was
used in which a limited number of sounds were organised in a geometrical model
according to perceived timbre differences. This approach elegantly features all
constraints set out earlier in this thesis, including a well-based formalism for the real-
time mapping of low-dimensional perceptual parameters to high-dimensional
synthesis model parameters. This approach will be elaborated upon in the next
paragraph.
2.2.2 Timbre Space
Wessel (1974), Grey (1975) and Plomp (1976) proved it possible to explain
differences in timbre with far fewer degrees of freedom than are needed by most
synthesis algorithms. In (Wessel 1985), the timbre control problem is addressed by
using a perceptual mapping produced with multidimensional scaling techniques
(Shepard 1974). In this approach, a timbre space is derived from a matrix of timbre
dissimilarity judgements made by humans comparing all pairs of a set of timbres. In
such a space timbres that are close sound similar, and timbres that are far apart
sound different.
To use a timbre space as a synthesis control structure one specifies a coordinate
in the space using an input device. Synthesis parameters are then generated for that
particular point in space. This involves interpolation between the different originally
judged timbres. A crude approach to implementing a timbre space for synthesis
control would be to create a lookup table where for every coordinate a corresponding
synthesis parameter set is defined which only needs to be looked up, providing a
very efficient translation scheme. However, this approach claims considerable
storage space, imposes problems on automated interpolation and therefore makes
the definition task too laborious. Fortunately, more graceful methods have been
found. Lee and Wessel (1992) report that they have successfully trained a neural
network to generate parameters for several synthesis models with timbre space
coordinates as input, automatically providing timbral interpolation. This approach

16
does however involve substantial computational power in order to train the neural
network.
Plomp (1976) indicates that when using multidimensional scaling to define timbre
spaces the number of timbre space dimensions increases with the variance in the
assessed timbres. This makes it difficult to derive a generalized synthesis model
from this strategy. When trying to reduce the number of dimensions artificially by
using several less varied timbre spaces, the dimensions of the different timbre spaces
might not correlate, which could cause usability problems if used as synthesis
parameters. Generic use of timbre space is also inhibited by the need to use existing
sound examples judged by a human panel. How could a musician construct his own
timbre spaces? What if he wants to generate totally new sounds?
Feiten and Ungvary (1991) are making progress with the automation of the
laborious timbre organizing task by replacing the human panel with a specially
trained neural network. However, the input sounds still need to be quite similar in
order for this to work. With the number of sounds the complexity of the network
increases disproportionally. In their study, the automated categorization successfully
matches their manual classification. However, where the matching of 54 sounds
takes no more than 100 neurons, as many as 400 neurons are needed to match 82
sounds. This clearly demonstrates the limitations of the system with respect to
memory and computational power.
Grey (1975) theorizes about the nature of the dimensions of the 3-D timbre space
he derived from an experiment in which 16 closely related re-synthesized instrument
stimuli with similar envelope behaviour (varying from wind instruments to strings)
were compared on similarity. He indicates that one dimension could express
instrument family partitioning, another dimension could relate to spectral energy
distribution, and a third dimension could relate to the temporal pattern of
(inharmonic) transient phenomena. Though these conclusions cannot simply be
generalized, they do give us an indication of the nature of appropriate parameters to
be used when generalizing timbre space as a synthesis model.
2.2.3 ISEE: Converting Timbre Space into a Generic Synthesis Model
The Intuitive Sound Editing Environment (Vertegaal and Bonis 1994) attempts to
generalize the timbre space paradigm for generic user interface purposes by
concentrating on the defining dimensions of timbre space. Assuming these
parameters are orthogonal, every point in space can be defined by combining
synthesis data associated with the projections of its coordinates. In order to reduce
the number of parameters needed, instruments are abstracted into perceptual
categories. This way, four high-level timbre parameters—Overtones, Brightness,

17
Articulation and Envelope—are applied to instrument categories with different scales
of refinement. One such four-dimensional definition of an instrument category is
called an instrument space. The abstract timbre parameters can operate several
synthesis model parameters at once, with the intention to increase the perceptual
consistency of timbre modification and reduce the amount of parameters that need
be controlled, without losing power. The system hides the used synthesizer(s) or
synthesis model(s) for the naive user, constituting the transparency principle of
Rutkowski (1982). ISEE, described in more detail in chapter 3, is a computer based
user interface shell which uses MIDI to control the synthesis process on both external
and internal sound synthesis platforms.
One of the main disadvantages of ISEE is the laborious instrument space
definition task. Every axis of every instrument space needs to be constructed for
every synthesizer by recording minimum and maximum synthesizer parameter
values. However, this approach does reduce the amount of memory and
computational power needed substantially, making real-time performance possible
using low-cost PCs and relatively cheap MIDI equipment. The high level of
abstraction of the ISEE timbre parameters combined with its classification scheme
make it possible to model a far greater variety of instruments than possible with
traditional timbre space. Non-existing instrument families can easily be defined as
long as design heuristics are followed or extrapolated. ISEE readily allows a
usability study of generic input devices in a timbral direct manipulation environment.
2.3 Generic Input Device Experimentation
2.3.1 Overview
Many studies have tested and compared the usability of input devices in the
manipulation of on-screen graphic objects. The available literature was used to
determine which input devices to test in our multidimensional timbre navigation
task. Also, an appropriate experimentational strategy emerged from the literature.
Chen, Mountford et al. (1988) defended the utilization of 2-D input devices in
multidimensional control manipulation tasks: there is evidence that users are not
able to successfully perform fully integrated 3-D control manipulations—rolling,
tilting and swiveling—using all possible combinations of axes provided by
multidimensional input devices. Also, 2-D input devices were the cheapest and most
dominant devices in the late eighties, something still true at present. It is therefore
rewarding to compare performance of multidimensional devices with that of low-
dimensional devices.

18
2.3.2 Two-Dimensional Input Device Experimentation
Two-dimensional input devices are capable of movement in two directions (2 DOF),
usually described by the x and y axes. They include many types of joysticks,
trackballs, mice and graphic tablets. For an overview and taxonomy, see (Mackinlay,
Card et al. 1990). This group of input devices has become the most prevalent besides
the keyboard. Much research into the performance of 2-D input devices was invoked
by the emergence of the graphical user interface (GUI) in the late seventies. The
choice of the mouse as the standard GUI input device was based on this research.
Though many of these studies would seem to be outdated, they give a good insight
into the research practice of input device evaluation.
In (Card, English et al. 1978), five subjects used a mouse, isometric joystick (which
uses force control) and keys to position a cursor to select target words on a screen.
The experiments show that the mouse is the fastest and most accurate positioning
device. It is shown that the positioning time of the mouse is near-optimal. This paper
gives many clues as to appropriate experimentation and analysis methods, which
include analysis of variance to check the significance of contributing factors and t-
tests to check for significance of differences between mean movement times (MT).
Movement time is the determinant in positioning tasks and therefore the most
commonly used dependent variable in such experimentation (Keele 1973). Movement
time is measured from the beginning until the end of the actual movement. It excludes
reaction time (RT), which is measured from the onset of the stimulus to the onset of
the movement. As will be demonstrated in § 2.3.3, MT depends on the distance and
precision of the movement. It gives us a good measure of the efficacy of an input
device in a given task where a target position is aimed for from a certain distance
with a certain precision. The harder it is to accomplish the task, the longer it will
take. However, some tasks are too difficult to complete, rendering MT infinite. An
additional measure for the accuracy of a given input device in a particular task is
therefore its error rate. The error rate is the percentage of trials where the subjects
were not able to reach the required accuracy.
According to Roberts and Moran (1983), four is the minimum number of subjects
needed to get any reliability of measurement and get some indication of individual
user variation. In most early experiments a small number of subjects performed a
great number of trials. Coolican (1990) presents a comprehensive overview of
experimental methods and statistical analysis procedures in experimental
psychology. It was used as a guide to the experimental methods observed in the
literature and served as a reference for the design and analysis of the experiments at

19
hand. It indicates that it is better to use more subjects, even if that would cause a
smaller number of trials per subject to be performed.
In (Buxton 1986), the nulling problem is presented as a user interface design
constraint. When a single device is used to modify multiple parameters and that
device is absolute (i.e., its position corresponds directly with the parameter position
like a volume fader), problems occur when switching parameters. The position of the
device will still be that of the last modified parameter, and will thus not reflect the
correct setting of the new parameter. According to Buxton, the nulling problem that
will occur in ISEE when changing instrument space while an absolute device is used
might easily be solved by using a relative device (i.e., a device that controls the
direction and speed of the parameter change) instead. However, a relative device
causes control to be less direct and thus increases cognitive processing load (Keele
1968). In order to resolve the nulling problem it is interesting to compare the
performance of a relative device with that of an absolute device. If the relative device
does not affect performance too adversely, it might be the better choice.
An excellent taxonomy of current input devices is given by Mackinlay, Card et al.
(1990). Of the relative devices, the mouse is the most commonly used. Joysticks can
be absolute or relative, which makes them ideal for comparing the usability of an
absolute versus a relative device.
2.3.3 Fitts’ Law
According to MacKenzie and Buxton (1993), the prevalence of direct manipulation
interfaces has resulted in a paradigm shift for modelling user performance. Keystroke
models used in early studies such as (Card, Moran et al. 1980), are of diminished
importance, since performance in direct manipulation���� systems is closer described by
movement models. Fitt’s law is the most important of those models. Originally
described in (Fitts 1954), it is an essentially one-dimensional model of human
movement describing the time (MT) to move to and select a target of width W which
lies at a distance (or amplitude) A:
MT = a + b log2 2A / W( ) (1)
where a and b are constants determined through linear regression of empirical data.
The log term is known as the index of difficulty (ID) of the movement task. Fitts’ law
is commonly applied to target acquisitions on interactive computer systems
(MacKenzie, Sellen et al. 1991; Kabbash, MacKenzie et al. 1993). One of the
strengths in Fitts’ law is that the reciprocal of b (the index of performance (IP) or
bandwidth) can motivate performance comparisons across factors such as device,
limb or task. However, serious doubts as to the applicability of this law to

20
multidimensional movement are raised by MacKenzie and Buxton (1992). It is stated
that the model can break down and yield unrealistic ratings in tasks with more than
one dimension. Though this problem can be partially corrected for two-dimensional
tasks by using modifications of the index of difficulty (e.g., the Shannon formulation
(MacKenzie 1992)), there is not enough evidence to support the use of Fitts’ law for
modelling the outcome of the present four-dimensional timbre space experiments.
2.3.4 Multidimensional Input Device Experimentation
Multidimensional input devices are capable of movement in more than two
directions. Control data provided by these devices is often segregated in positioning
data (i.e., placement in 3-space on the x, y and z axes) and manipulation data (i.e.,
orientation in 3-space: pitch, yaw and roll). They include adaptations of traditional
input devices and more exotic devices such as datagloves and headtrackers. For an
overview and taxonomy, see (Mackinlay, Card et al. 1990). Though the application
of multidimensional devices in military flight simulators has been researched since
the sixties, most of these devices emerged from Computer Graphics research in the
late eighties. They are typically used in 3-D modelling tasks and Virtual Reality
experiments (Pimentel and Teixeira 1993).
In a key paper on multidimensional device experimentation by Jacob and Sibert
(1992), it is stated that performance in a multidimensional task with simultaneous
control of all dimensions depends on the perceptual composition of the task’s
dimensions. The perceptual structure of a task is described by the integration of its
dimensions or parameters. Some parameters of a task are operated simultaneously,
while others are operated separately. Similarly, input devices can be characterized
as integral or separable based on whether it is natural to move diagonally across its
different axes of movement. The processing of perceptual structure will be further
treated in § 2.3.5. In their study, Jacob and Sibert compared the Polhemus 3-Space
Isotrak with a conventional mouse in two three-attribute tasks:
• A task of which the dimensions tend to be perceived as integral. The subjectsmanipulated the x-y position and the size of an object to match a target;
• A task of which the dimensions tend to be perceived as separable. Thesubjects manipulated the x-y position and the colour of an object to match atarget.
The Polhemus senses changes in magnetic field and reports the three spatial
coordinates used in this experiment together with three angular coordinates 60 times
each second. All degrees of freedom of this device can be controlled simultaneously,
making it an integral device. The mouse, a 2-D device, had a mode change button to
allow control over the third attribute, making it a separable device. It was found that

21
neither device was uniformly better, but that the separable device performed better
in the separable task and the integral device performed better in the integral task.
Consequently, the choice of hardware controller should be based on the perceptual
composition of the task at hand. § 2.3.5 will discuss the consequences of this notion
for our timbre space navigation task.
An excellent experimental strategy emerged from this paper: all experiments were
recorded to allow retroactive simulation of experiments at different accuracy criteria.
This greatly reduces the risk of erroneous trial termination caused by inappropriate
criterion settings or inadvertently passing through the criterion.
Pausch (1991) has studied the use of two multidimensional input devices, the
Nintendo Power Glove and the Polhemus 3-Space Isotrak, as low-cost virtual reality
controllers. The possibility to wear the Polhemus on the head is interesting from a
musician’s point of view, since it could give musicians using wind controllers hands-
free control over the timbre of their instrument. However, it has a lag of 150-250
milliseconds which would hinder timbre control. A newer version, the Polhemus
Fastrak reduces this problem. The problem with these trackers, however, is their
expensive and delicate nature, which rendered them unavailable for use in this
experiment.
The Nintendo Power Glove uses ultrasonics to sense three spatial coordinates and
variable resistor material for sensing finger bend. The low resolution of the roll
information (i.e., rotation around the z-axis) of the Power Glove is indicated to be
problematic, as is its unstable behaviour. However, it is one of the few
multidimensional devices affordable to musicians. Moreover, to my knowledge, a
study in which the Power Glove’s performance is compared with that of a selection
of low-dimensional devices has not been performed. It is interesting to note that
Wessel, the founder of timbre space research uses a modified Power Glove for timbre
space navigation in (Lee and Wessel 1992). However, this study gives no clues as to
the relative effectiveness of this device in such a task. It would be very interesting to
put this in the Computer Music domain much hyped Virtual Reality device into
perspective.
A delay between input action and output response is often observed when using
multidimensional input devices. MacKenzie and Ware (1993) studied this so-called
lag with a 2 DOF device that was modelled according to Fitts’ law. It was
demonstrated that lag has a multiplicative effect on Fitts’ index of difficulty (ID),
the log term in equation (1). In their experiments, they showed that a 225 ms lag
caused movement times and error rates to increase by 64% and 214% respectively.

22
The lag of multidimensional input devices is usually caused by an accumulation of
the following factors:
• Filtering overhead due to the erratic nature of the sensing technology used inthese devices (ultrasonic or electromagnetic tracking);
• The amount of computational power needed to process the considerableamount of control information these devices generate;
• The rendering of on-screen feedback, which is slow in typical applications ofthese devices: 3-D manipulation tasks and virtual environment control.
It is important to take the effects of lag on human performance into account when
discussing experimental results.
2.3.5 Perceptual Structure
Overview
An excellent explanation of the processing of perceptual structure is given by Jacob
and Sibert (1992). A multidimensional object is characterized by its attributes. A red
circle has several attributes: size, colour, shape and location. These attributes define
a perceptual space. Garner (1974) observed that relationships between the attributes
of an object can be perceived in two ways that differ in how well the component
attributes remain identifiable. Some attributes are integrally related to one another.
The values of these attributes combine to form a single composite perception in the
observer’s mind causing the object to be seen as a unitary whole. Other attributes are
separably related. The attributes remain distinct and the observer does not integrate
them, identifying the object as a collection of attributes. The horizontal and vertical
position of the red circle in an outline square are seen as integral, while its colour and
shape are perceived separably.
This notion becomes clearer when we extend it to interactive tasks, in which the
attributes of an object are altered. According to Jacob and Sibert (1992), interaction
is simply the movement through the perceptual space constituted by the attributes
that are varied. Integral movement is Euclidean and cuts across all dimensions
defined by the attributes; separable movement is city-block metric and moves
parallel to the axes of the space. Most tasks cannot be classified as purely integral or
separable but are a hybrid of both. The control spaces of input devices can be
viewed in a similar way. Input devices with more than one degree of freedom can be
characterised as integral, separable or hybrid according to whether it is natural to
move diagonally across its different degrees of freedom. With integral devices,
movement is in Euclidean space and cuts across all dimensions of control. A
separable device, however, constrains movement to a stair step pattern; movement

23
occurs along one dimension at a time. The amount of integration of two or more
control dimensions of an input device is known as the control integration of those
dimensions.
Using Control Integration to Determine the Perceptual Structure of a Task
I advance the thesis that the observed control integration of a well-integrated
multidimensional input device which is applied to a task can indicate the perceptual
composition of that task. For example, when manipulating both colour and position
of the above-mentioned circle with a well-integrated multidimensional device,
movement patterns will reveal that position and colour are not modified
simultaneously.
Mountford, Spires et al. (1987) suggest that subjects simply do not use those axes
that are no part of their perception of the task. More conclusive evidence for this
hypothesis was given by Jacob after personal communication. Empirical evidence
supporting my hypothesis is presented in (Jacob, Sibert et al. 1994). In that study,
trajectory analysis revealed that the path of an input device is significantly
influenced by the structure of the perceptual space of the task providing the device
used is not restrictive (i.e., the control axes of the device are well-integrated).
The perceptual integration of the dimensions of instrument spaces (i.e., 4-D ISEE
timbre spaces) is unknown. However, the three spatial axes (x, y, z) of
multidimensional input devices are known to be well-integrated (Jacob and Sibert
1992). According to my hypothesis, it should be possible to predict the perceptual
structure of three out of four dimensions of an instrument space by computing the
control integration of the three spatial dimensions of a multidimensional device such
as the Power Glove during instrument space navigation. As a measure for the
integration of two attributes, I propose control integration (CI): a ratio scale
indicating the amount of diagonal movement between two axes, x and y, in radians
or degrees. Maximum integration in any direction results in a maximum CI of 1/4 π
radians or 45 degrees, minimum integration in any direction results in a minimum CI
of 0 radians or degrees. The control integration of movement on any pair of axes
(x, y) at any given moment in time is a function of the first order differential of that
movement:
CI = −1tandy
dx
− 1
4π − 1
4π
(2)
When investigating the perceptual structure of a three-dimensional task the control
integration needs to be calculated for all four possible axes pairs at every sampling
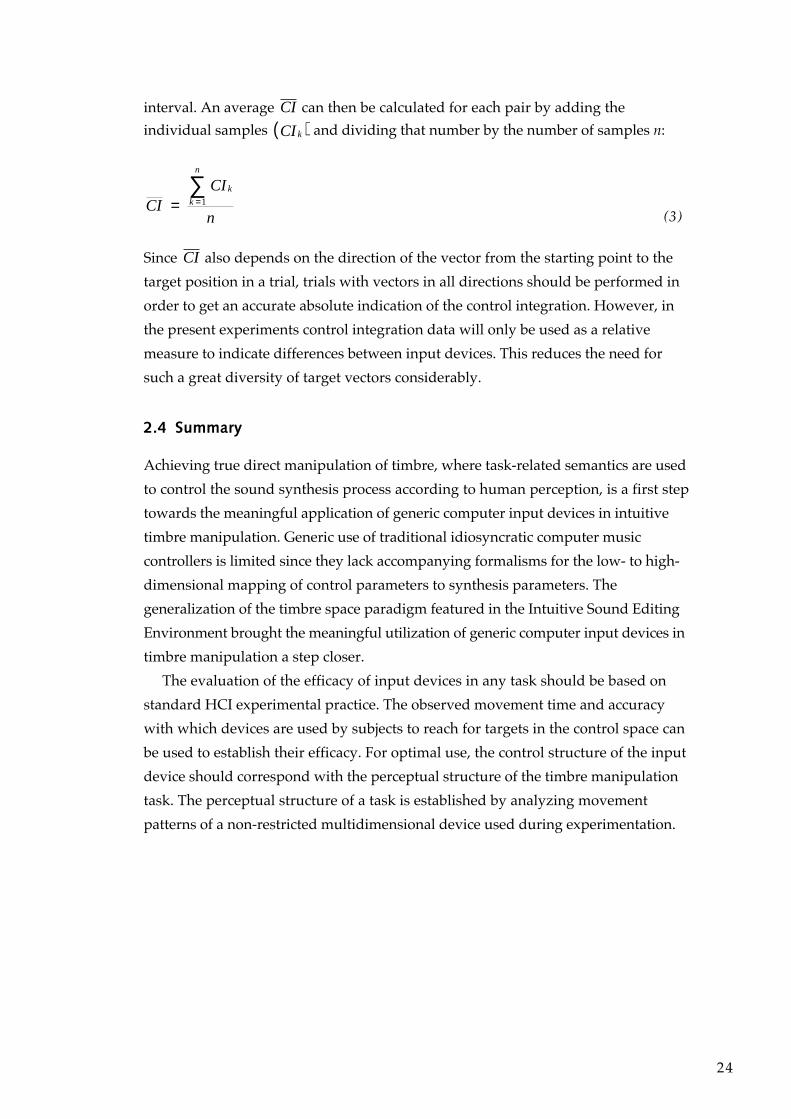
24
interval. An average CI can then be calculated for each pair by adding the
individual samples kCI( ) and dividing that number by the number of samples n:
CI =kCI
k =1
n
∑n (3)
Since CI also depends on the direction of the vector from the starting point to the
target position in a trial, trials with vectors in all directions should be performed in
order to get an accurate absolute indication of the control integration. However, in
the present experiments control integration data will only be used as a relative
measure to indicate differences between input devices. This reduces the need for
such a great diversity of target vectors considerably.
2.4 Summary
Achieving true direct manipulation of timbre, where task-related semantics are used
to control the sound synthesis process according to human perception, is a first step
towards the meaningful application of generic computer input devices in intuitive
timbre manipulation. Generic use of traditional idiosyncratic computer music
controllers is limited since they lack accompanying formalisms for the low- to high-
dimensional mapping of control parameters to synthesis parameters. The
generalization of the timbre space paradigm featured in the Intuitive Sound Editing
Environment brought the meaningful utilization of generic computer input devices in
timbre manipulation a step closer.
The evaluation of the efficacy of input devices in any task should be based on
standard HCI experimental practice. The observed movement time and accuracy
with which devices are used by subjects to reach for targets in the control space can
be used to establish their efficacy. For optimal use, the control structure of the input
device should correspond with the perceptual structure of the timbre manipulation
task. The perceptual structure of a task is established by analyzing movement
patterns of a non-restricted multidimensional device used during experimentation.

25
Chapter 3. Materials and Methods
In this chapter, the materials and methods used in the experimentation are described
in detail. Firstly, the equipment is presented, featuring the input devices that were
evaluated, the computing apparatus and software used and the exact circumstances
under which the experiments took place. In the second part, the experimental
procedures for the testing of both hypotheses are explained in detail. Finally, the
analysis procedures are discussed.
3.1 Materials
3.1.1 Input Devices
Three input devices were tested:
• Nintendo Power Glove (sometimes referred to as the Mattel Power Glove)• Advanced Gravis Mousestick II, in relative and absolute mode• Apple Standard Mouse
The Nintendo Power Glove is a low-cost dataglove with 8 degrees of freedom
(DOF). Two transmitters mounted on the back of the user’s hand send ultrasonic
pulses to three receivers configured in an L-shape. This way, 3-space position and
roll are determined. The glove communicates successfully within 3 to 4 meters
distance from the receivers when it is oriented towards them. The signal of the glove
degrades and is eventually lost as it is turned away from the receivers. The glove
remains usable at up to a 45 degree angle from the receivers. The coordinate
information (x, y, z) of the glove is reported accurate to within 6 millimeters when
the glove is within 2 meters from the receivers (Pausch 1991), but such accuracy is
only possible when the data is heavily filtered. The roll information, where roll is the
angle made by pivoting the hand around the axis of the forearm, is reported in one of
twelve possible positions. In addition, finger bend is determined from the varying
resistance through materials running the length of the fingers. The bending state of the
user’s thumb, index, middle and ring finger are each reported as a two-bit integer.
The gestures conveyed by the four-position finger bend data are ideal indicators of
status and can be used to issue commands, as long as ambiguous gestures are
avoided.
The Power Glove was connected to a GoldBrick hardware interface which
converted the encrypted glove information to the Apple Desktop Bus (ADB) format
used by Apple Macintosh computers. Since the GoldBrick driver software could not
run under Apple System 7, the glove data was processed on the computer system
that was used to remotely control and record the experiments. Max, the musical

26
software package that performed those tasks, was also capable of processing and
relaying the Power Glove information. The Max implementation is further discussed
in § 3.1.3.
Since the subjects faced a computer monitor to get visual feedback throughout the
experiments, the receivers were fitted around that screen. With particularly small
subjects the position of the receivers needed minor adjustments, so that each subject
would be able to reach all parameter extremes. The 3-space coordinates were used to
control the first three ISEE timbre parameters in an absolute fashion as shown in
figure 2. The x and y axes were directly mapped to the Brightness and Overtones
parameters conveyed by the left coordinate system in figure 3, while the z axis was
mapped to the Articulation parameter in the right coordinate system in figure 2. All
controlled parameters had a resolution of 128 positions. The x axis had a range of
approximately 3 meters around the centre of the monitor, while the y axis ranged
from just above the floor to about 2 meters up. When the subjects positioned the
glove at a distance of approximately 10 centimeters from the screen, the Articulation
would obtain its minimum value, while its maximum value was reached with the
glove approximately 3 meters from the screen, providing a control space of
approximately 18 m3. The controller to display (C:D) ratio of the glove thus ranged
from 60:1 for the x and z axes to 40:1 for the y axis. Though this control space
would seem large, any reduction of the C:D ratios would decrease the accuracy of
the glove considerably.
Since the roll of the glove only reports 12 positions, absolute roll control could not
achieve the correct resolution (128 positions) for the Envelope parameter. Roll was
therefore implemented in a relative fashion: when the wrist was rolled to the right,
the Envelope parameter would move towards the right, when the wrist was rolled to
the left, the Envelope parameter would move towards the left. With the wrist in
resting position, the Envelope parameter would not change. In figure 3, the Envelope
parameter is conveyed by the horizontal axis in the right coordinate system.
The glove was engaged by making a fist, with the thumb put between the fingers.
This way, when the glove was put on, the parameters could not be accidentally
moved. Pointing the index finger at a particular point in space would cause ISEE to
zoom in, while wiggling the thumb would cause ISEE to zoom out. These zooming
features, further described in § 3.1.3, were however disabled during the experiments,
allowing the subjects only to move in a single instrument space. At the beginning of
each session, the glove was calibrated to map the centre of the control space to the
centre of the parameter space. The subjects needed to wear the glove on the right
hand, but this did not pose any real problems since most subjects were right-handed.

27
Figure 2: Power Glove setup
Figure 3: Control Monitor

28
The Gravis Advanced Mousestick II joystick is a high-quality optical joystick which
can be switched from absolute to relative operation by turning a wheel at its base.
This elegant feature readily permitted a study of absolute vs. relative usage without
side effects. Each time it was used, the subjects were asked to change the dial setting
to either absolute or relative control. The ISEE software’s input mode was then set
accordingly. On top of the stick are two small buttons, which can be pushed with the
thumb. These buttons engaged the joystick to operate either the left coordinate
system parameters (by pushing the left button) or the right coordinate system
parameters (by pushing the right button) shown in figure 3. If neither button was
pressed, the indicators would not move. It was very easy for subjects to switch
operation between the two coordinate systems by simply shifting the thumb 5
millimeters. When engaged, the arrow pointer on the screen was hidden. The subjects
did not need to click inside the indicators to select and move them like they would
do with a mouse. The subjects used the joystick with the preferred hand.
In absolute mode, the control space of the stick was mapped directly to that of
the coordinate systems. The stick position therefore corresponded directly to the
position of the controlled indicator, and the stick would not jump back when it was
released. Though it was possible to jump to positions by moving the stick without
engaging and then clicking one of the engage buttons, it was checked that the subjects
always engaged before moving. When measured on top of the stick, the absolute
joystick had a C:D ratio of 2:1.
In relative mode, the direction of the stick was used to control the direction the
indicators moved in. The angle of the stick was used to control the speed of the
indicators. With the stick almost upright, the indicators would move 1 parameter
step at a time, while with the stick pushed towards a 60 degree angle the indicators
would move up to 14 parameter steps at a time (1 parameter step corresponded to
one pixel on the screen). In relative mode, the stick jumps back when released. In that
resting position, the indicators would not move at all. The buttons on the base of the
stick could be used to zoom in and out, but were disabled during the experiments.
The Apple Standard Mouse was used to move the indicators in figure 3 simply by
clicking in them with the arrow pointer, and dragging them to the desired position.
The subjects used a mouse pad and their preferred hand. The C:D ratio of the mouse
was equivalent to position 4 in the System 7 Mouse Control Panel, which is not
linear.

29
3.1.2 Computing and Synthesis Apparatus
As shown in figure 4, the computing equipment used during the experiments
consisted of an Apple Macintosh SE and an Apple Macintosh LC. More powerful
equipment was not available due to the limited budget. Since the real-time timbre
modification software (ISEE) required sufficient computing power, System 7 and a
14” 8-bit colour screen it ran on the Mac LC. The Mac SE was used to control and
record the experiments and drive the Power Glove running System 6 and Max
software. All systems were interconnected via MIDI, a special-purpose musical
instrument digital control network. The Power Glove data, supplied to the Mac SE
ADB port via a GoldBrick interface, was parsed and filtered on the SE before being
relayed to the Mac LC as MIDI controller data. On the Mac LC, that controller data
was used by the ISEE software to drive both indicators of the Control Monitor
application shown in figure 3. The joystick and mouse were directly interfaced to the
Mac LC via its ADB port so that the same indicators could be manipulated by a
subject sitting behind the Mac LC screen.
During the experiments, all controller data was sent back to the Mac SE for
recording. In the mean time, the same controller data was translated on the Mac LC
into MIDI System Exclusive commands for timbre control, before being relayed to the
synthesizer via MIDI. The synthesizer used was a YAMAHA SY99, a digital
synthesizer capable of FM synthesis, Waveshaping, Subtractive synthesis, Additive
synthesis and Sampling. The timbre produced by the instrument was modified in
real-time by the incoming MIDI System Exclusive data. The produced sound was fed
back to the subjects via headphones plugged into the synthesizer.
All experiments were remotely controlled from Max running on the Mac SE. Via
MIDI, Max was capable of sending target positions to the Mac LC and playing
stimulus tones on the synthesizer during experimentation. At the same time, all non-
interpreted controller data from the Mac LC was captured by Max on the Mac SE to
be written to hard disk for retroactive analysis.
3.1.3 Software Configuration
ISEE: The Intuitive Sound Editing Environment
As we have seen in § 2.2.3, ISEE is based on 4 abstract perceptual timbre
parameters applied to instrument categories with different scales of refinement. The
first two of the abstract timbre parameters relate to the spectral envelope and the
last two to the temporal envelope: the Overtones parameter controls the basic
harmonic content; the Brightness parameter controls the spectral energy distribution;
the Articulation parameter controls the spectral transient behaviour as well as the

30

31
persistent noise behaviour; and the Envelope parameter controls temporal envelope
speed. The first three parameters are similar to those identified by Grey (1975).
Specific implementations of these abstract timbre parameters relating to
instrument categories are called instrument spaces. A hierarchy of interconnected
instrument spaces was devised to structure fine-tuned application of the abstract
parameters for refined synthesis control. Since instrument spaces are ordered in the
hierarchy according to their refinement, scale can be used as a hierarchy control
structure. When a musician is interested in the sound of a particular instrument
group in an instrument space, he can jump to a more refined instrument space filled
completely by that sole instrument group by indicating the part of the instrument
space of interest and asking ISEE to zoom in. Alternatively, when interested in a
broader perspective of instruments, the musician can jump to a broader instrument
space by indicating his wish to zoom out. The zoom buttons in figure 3 implement
this feature elegantly. More expert users can also make use of a traditional hierarchy
browser, e.g., when constructing new instrument spaces (not shown).
ISEE consists of two applications running simultaneously under Apple System 7:
ISEE Control Monitor (see figure 3) and ISEE Interpreter (not shown). The first is a
‘dumb’ user interface which outputs 5 different MIDI controller messages, one for
each parameter and an additional zoom message. It also displays and relays
incoming external controller data such as that from the Power Glove. Figure 5 shows
how this controller data is piped in real-time to ISEE Interpreter, running on the same
machine. The system software used to pipe MIDI messages is Apple MIDI Manager,
featuring the Patchbay application to interconnect virtual ports of the various
applications. When the controller data enters ISEE Interpreter, the position on each
axis is translated into corresponding System Exclusive synthesis model specific MIDI
data, according to the low- to high-dimensional mapping of the current instrument
space (indicated by the middle icon in figure 3). The System Exclusive data is then
sent off to the output port of the computer, which is connected to the synthesizer
producing the indicated timbre change (see (Vertegaal and Bonis 1994) for further
discussion).
The Sustaining Instrument Space
During experimentation, only one instrument space was used, and all zooming
facilities were disabled. Subjects could only move the indicators to point at positions
within that particular instrument space. The instrument space consisted of
sustaining instruments and was designed by an expert to give a great variety of
timbres in a perceptually well-structured way (Truax 1977). A simple FM-set was
used comprising a carrier and a modulator (Chowning 1973) with a feedback loop

32
around the modulator and some additional low-pass filtering. The Overtones
parameter of the Sustaining instrument space produced a timbre change from
harmonic instruments such as violin and brass to inharmonic instruments such as the
glass harmonica. In-between these extremes were instruments such as the clarinet,
with its hollow square-wave sound. The exact frequency (c:m) ratios used on this
axis were 1:1 (harmonic), 2:1, 3:1, 4:1, 5:1, 1:2 (hollow), 1:4, 1:3, 1:5, 4:5, 6:5, 1:9,
1:11, 1:14, 2:3, 3:4, 2:5, 2:7, 2:9 (inharmonic, see (Truax 1977) for a more detailed
explanation). No cross-fading was performed between the different c:m ratios so
that the subjects were able to clearly distinguish the differences between overtone
distributions.
The Brightness parameter operated the cutoff frequency of the 12 dB/octave low-
pass filter in the synthesizer at a resolution of 64 steps. At its minimum setting most
of the higher harmonics would be cut off, while at its maximum setting all overtones
were heard.
The Articulation parameter controlled the ratio of the higher partials’ attack rate
vs. the lower partials’ attack rate by operating the envelope bias sensitivity of the
carrier and modulator in opposite directions: the carrier AMS from 3 to 7 and the
modulator AMS from 7 to 0. This modelled the difference between the transient
behaviour of a trumpet and a violin: with the trumpet the lowest harmonics sound
first, whereas with the violin the highest harmonics rise first.
The Envelope parameter controlled the duration of the attack: from a carrier
attack rate (R1) of 49 and a modulator attack rate of 50 to a carrier attack rate of 18
and a modulator attack rate of 23. At its minimum position, the timbre would rise
almost instantly to its maximum volume, but at its maximum position it would take
about 1 second to do so.
Instrument spaces also have constant parameter settings which are sent to the
synthesizers once to act as a template to which the timbre parameters can be
applied. The most important constant in the sustaining instrument space was the
output level of the modulator which was set to the optimum value of 100. The
feedback level of the modulator was set to its maximum, allowing enough partials to
be heard without producing noise due to aliasing.
Max Software Implementation
Max (Puckette and Zicarelli 1990) is a MIDI data flow configuration tool based on
visual interactive programming. The program, developed by Miller Puckette at
IRCAM in the late eighties, can handle multiple streams of data simultaneously.
Operators are displayed as graphical objects with input and output ports. Data
flow is visualized by wires between objects, much in the same way as the Patchbay

33
in figure 5. Configurations of operators and the data flow between them are known
as patches. Max is ideal for rapid prototyping purposes and experimental data
manipulation, as long as the handled data is MIDI. Most of the experimental data
was already in the MIDI format, but the Power Glove data entered Max directly
from the GoldBrick driver via the standard Max glove object. The 3-space data
of the glove was supplied in absolute mode and the roll data in relative mode. The
GoldBrick Control Panel setting for the scale of the x, y and z axes and roll was 100.
The roll data had a rise of 5.
The glove object was polled every 100 milliseconds, returning 3-space
position, roll and finger bend information at every poll. The 3-space and roll data of
the glove was filtered using a low-pass filter which averaged the result of 10
consecutive data polls. The data was then sent through a line object which
interpolated between the filtered data samples, with a ramp time (i.e., the time
needed to reach the destination value) of 800 milliseconds and an output rate of 20
milliseconds. Thus a stable output of 50 coordinate values per second per axis was
achieved. Much experimentation was done with different polling rates and other
settings, but this setup produced optimal stability at the highest possible output
rate. Unfortunately, the filtering process did cause a maximum lag of 1 second when
the glove was rapidly moved between the extremes of the control axes. After
filtering, the glove data was sent as controller data to the MIDI interface of the Mac
SE to be sent to the ISEE software on the Mac LC. The same Max patch also
processed finger bend status information. If the subjects did not make a fist while
moving the glove the data flow was automatically interrupted.
The experiments were controlled and coordinated from a different Max patch which
ran simultaneously with the glove processing patch. A trial could be started by
pressing a preset button to select one of several possible random target positions.
This would cause that target position to be sent to the subject’s screen and started
the output of stimulus tones to the synthesizer, the timbre of which could then be
transformed by the glove or other input devices. Recording of controller data
received from the Mac LC would also commence immediately. After a trial was
terminated by the press of a button, this data was written to hard disk as a text file
containing controller data and time intervals at millisecond resolution. The
termination of a trial would cause the stimulus tones to stop.
3.1.4 Subjects and Environment
An opportunity sample of 15 music students, all but one from the Department of
Music at Huddersfield University, acted as subjects during the experiments. The
subjects were mainly traditional instrumentalists but most of them had some

34
experience in using electronic instruments and sound synthesis. Most subjects had
undergone some form of ear training as a part of their conservatory education. The
group consisted of 9 males and 6 females, with a mean age of 25.8 and a mode age of
21. Each subject was paid £ 10 for their 3 hour cooperation. The experiments were
held in a two-week period at the end of June 1993 in the main electronic music studio
at Huddersfield University. During this period, the studio was completely sealed off
from the outside world. No sound or daylight could enter the air-conditioned room,
making it ideal to ensure that conditions were the same throughout the experiments.
Being a studio, it consisted of two parts: a control space where the Mac SE was
operated and a performance space where the subjects could either sit behind the Mac
LC or operate the Power Glove. The control space was separated from the
performance space by a large mixing console. There was no window between the
control space and the performance space. The Mac LC was placed on a 70 cm high
desk with the screen elevated 10 cm from the top of the computer. The screen was
placed 80 cm away from the back of chair. The subjects sat on a standard office chair
without arm rests during mouse and joystick experimentation. The seat of the chair
was 51 cm above floor level. The back was set at a 90 degrees angle from the seat.
During Power Glove experimentation, the chair was easily pushed out of the way.
3.2 Methods
Two experiments were carried out: one for each hypothesis. The first experiment was
to determine whether the choice of input device in a 4 DOF timbre manipulation task
with 2 x 2-D visual feedback would affect performance and movement patterns
significantly. The second experiment was a control experiment which was to
determine whether the 2 x 2-D visual representation restricted movement and
whether the loss of visual feedback would affect performance significantly.
3.2.1 Input Device Experiment
At the beginning of a session, each subject was instructed about the tasks at hand.
They learned the principals of the 4 timbre parameters that were to be manipulated
and learned to know the Sustaining instrument space. They also learned to use each
input device and were allowed to practice for 5 minutes with each one of them,
except for the glove, with which they were allowed to practice for 15 minutes
because of its idiosyncratic behaviour. After that, the subjects performed a proof
trial with each input device. The subjects were told that when using the glove they
were to concentrate on the absolute parameters (Overtones, Brightness and
Articulation) first, before positioning the relative parameter (Envelope). That way, the
extra cognitive processing capacity needed when manipulating the relative parameter

35
could not influence the control integration of the absolute parameters. Subjects were
encouraged to ask questions during practice but not during the experimental trials.
The subjects were instructed that accuracy and speed were of equal importance.
They were also told that auditory and visual feedback were equally important to
successfully accomplish the task and that they were to concentrate on the target
timbre played at the beginning of each trial.
The experimental procedure was rather straightforward. The subject was to
manipulate the indicator dots (each 4 mm2 in size, moving along 4.5 cm long axes)
shown in the left window in figure 6 so that their position would correspond to that
of the dots in the right window. The reason the target was shown in a different
window was to encourage subjects to use auditory feedback during positioning. As
auditory feedback a tone with a duration of 1.5 seconds was repeated at 10
millisecond intervals throughout the trial. This tone was heard by the subjects
through their headphones. The timbre of the tone corresponded to the position of the
indicators in Control Monitor. The note played was a C3 which started with an
aftertouch of 0 and reached a full aftertouch of 127 after a linear rise of 400
milliseconds. This aftertouch was linked to the envelope generator bias of the
synthesis model, producing transient phenomena under control of the Articulation
parameter. The note was played with a mid-range velocity (64) and had a little
vibrato and some reverberation to make the experience more stimulating.
The input device experiment consisted of 10 target blocks of 4 trials. Within a
block, the subjects used each input device once to aim at one particular target. The
order of the blocks and the order of the input devices within each block was random
to prevent order effects. The same 10 targets were thus presented to all subjects in
different order. Each target represented a preset random parameter position. The
subjects were allowed to rest for 1 minute between trials and for 5 minutes after the
first 5 blocks. During those rests, they were encouraged to shake their arms and
shoulders to relax their muscles and prevent strain.
Before the start of a trial, subjects were asked to get the right input device and
put it in starting position. For the mouse, that would mean placing it in the centre of
the mouse mat and the centre of the left coordinate system in the Control Monitor
window (see figure 6), while resting their hands on the device. With the joystick, it
would mean putting the dial in absolute or relative mode and selecting the Control
Monitor input mode accordingly. In absolute mode, the stick was put upright and the
hand was placed on the stick with the thumb on top. In relative mode, the stick
would centre automatically. During the mouse and joystick trials the subjects were
seated in front of the screen. Before a glove trial, however, the subjects would put
their chair aside, get the glove fitted on the right hand, and stand in the centre of its
control space. At the beginning of each trial, the subjects would see the target

36
Figure 6. The visual interaction as it was presented to the subjects during the experiments.The indicators in the Control Monitor window have just centred, giving the subject the cueto start positioning them to match those shown in the Target window, which will remainfixed throughout the trial.
position in both windows for 8 seconds while hearing the target timbre being played
5 times. After that, the left window’s indicators would centre while the right window
would stay the same, as shown in figure 6. The timbre of the stimulus tone would
‘centre’ as well, so that the subject got an audio-visual cue to engage their input
device. The subjects would then manipulate the indicators until they had matched
the target position satisfactorily, after which they would release their input device.
The trial would then be ended by the researcher and the subject was given a 1 minute
rest, after which another trial would be presented. At the conclusion of the input
device experiment, subjects were asked to complete the first of three questionnaires,
which are further discussed in § 3.2.3. Each subject took approximately 75 minutes
to complete this experiment, excluding briefing and practising time.
3.2.2 Screen Experiment
The second experiment was very similar to the first. During this experiment,
however, only the glove was used in two different feedback conditions: audio-visual
and auditory-only. With the first condition, circumstances were exactly the same as
in the first experiment. With the second condition, the computer screen was simply
turned off so that the subjects were required to trust their ears to match the
memorized target timbre. This way, the importance of the visual representation
could be assessed. Subjects were told to memorize the target timbre during its
presentation at the beginning of a trial by analysing it according to the 4 timbre
parameters. The subjects were allowed to practice each feedback condition once.

37
The experiments were carried out in 4 blocks of 2 trials. Within each block, the
subjects aimed at one particular target under both feedback conditions. Subjects
were told to either turn the screen on or off before each trial. When the screen was
turned back on after a trial without visual feedback, the subjects were not allowed to
see the results of that previous trial to prevent them becoming biased. ABBA
complex counterbalancing was used over two blocks to reduce asymmetrical order
effects between the 2 feedback conditions. As with the first experiment, the order of
the target blocks was random. Subjects were allowed to rest 1 minute between trials.
Each subject took approximately 30 minutes to complete this experiment, excluding
briefing and practising time. At the conclusion of the screen experiment, subjects
were asked to complete the second questionnaire. After the experiments had been
completed, the subjects were allowed to work with the whole ISEE system while
playing the keyboard. They could also traverse a sample instrument space hierarchy
using the zooming facility. After this session, they answered the final questionnaire.
3.2.3 Questionnaires
Appendix A shows the three questionnaires used to obtain qualitative data during
the experiments. This qualitative data made it possible to compare the experimental
results with the subjects’ opinions. Open-ended questions as well as attitude scales
were used. The scales were similar to the summated ratings of Likert (1932) but used
a variety of terms rather than agreement-disagreement. Each item in a scale scored
an associated value (e.g., strongly agree (4), agree (3), undecided (2), disagree (1),
strongly disagree (0)). A mean score of all subjects’ answers to a particular question
was calculated and is presented in § 4.3 as a percentage of the maximum score (a
scale from 0 (strongly disagree) to 100 (strongly agree)). Contingency tables were
produced containing the frequencies for each item on each scale. In general, χ2
analysis of these tables was unreliable for significance testing because of the low
number of subjects involved. Fischer’s exact test was no alternative since data could
not be organized in a 2 x 2 matrix. However, most results show clear tendencies
which can be interpreted without too much reservation.
3.2.4 Analysis Methods
Movement Time Analysis
Analysis of the trial recordings was automated. Analysis data was saved to text
files for further statistical processing in Minitab. During analysis, the mean time
needed to reach a certain accuracy (i.e., a distance to target in 4-D Euclidian space)
was to be compared between all device pairs. This way, speed and accuracy would

38
be combined into a single measure and results would not be subject to any personal
criteria of the subjects for terminating trials.
The highest accuracy (i.e., the minimum distance) reached with each device in
each block was therefore measured and used to assess the best accuracy criterion for
mean time analysis. Care was taken to ensure that this criterion was within Q1 of
the frequency distribution of distances from the centre of the control space to the
target positions used in the experiments. If the accuracy criterion would have been
any larger, the measured time would have been more likely to be RT than MT, since
the chance that a subject would reach the criterion instantly at the start of a trial
would increase. At the same time it was ensured that the accuracy criterion was not
below Q3 of the frequency distribution of best accuracies of the least accurate input
device, to ensure that not too many values of that device would be missing (i.e., its
error rate would not be too high). The loss off too many measurements would have
made statistical analysis less reliable. For each of the two experiments the most
appropriate accuracy criterion was used for further analysis of the data.
The movement time (MT) needed to reach the accuracy criterion for the last time
during each trial was measured. This ensured that moments where a subject would
have briefly and inadvertently passed through the accuracy criterion were discarded.
The measured times were then loaded into Minitab. Analysis of variance was used
to check that the variability in the data was in fact mainly due to the differences
between devices. Movement times were then sorted according to the independent
variable used in the experiment (input device in the first experiment and screen state
in the second experiment). For the input device experiment, the difference between
the mean times of each of 6 possible device pairs (mouse vs. relative joystick, mouse
vs. absolute joystick, mouse vs. glove, relative joystick vs. absolute joystick, relative
joystick vs. glove and absolute joystick vs. glove) was then checked for significance
using a related two-tailed t-test, after the distribution of the difference scores had
been checked for normality. For the screen experiment, the difference between the
mean times of the two screen states (on or off) was checked for significance using the
same related two-tailed t-test.
Accuracy Analysis
Though it is usual to present error rate as a measure for the accuracy of a device in a
certain task, our retroactive analysis method allowed a clearer measure: the mean
best accuracy reached during the experiment by each device. For each trial, the
smallest 4-D Euclidean distance to target reached was calculated. These best
accuracy scores were sorted according to the independent variable (device type or
screen state). The difference between the mean best accuracies of each possible

39
combination of the independent variable was then checked for significance in exactly
the same way as with the above-mentioned movement time analysis.
Trajectory Analysis
Similarly, the mean control integration (CI) was calculated for each of the six
possible combinations of axes (x vs. y, z vs. a, z vs. y, z vs. x, a vs. y, a vs. x) in each
trial, according to the mathematical procedure for trajectory analysis presented in
§ 2.3.5. For both experiments this data was written to text files for further
processing in Minitab. The difference between the mean CIs of each possible
combination of the independent variable was then checked for significance as
mentioned above.

40
Chapter 4. Results
In this chapter, the results of the analysis of the experimental data will be presented.
Firstly, the results of the input device experiment will be given, featuring movement
time, accuracy and control integration of the different devices. The results of the
screen experiment will be presented similarly. Finally, the results of the analysis of
the qualitative data are given.
4.1 Input Device Experiment
4.1.1 Movement Times
The accuracy criterion was set to 1.13 cm in 4-D Euclidean distance to target, which
was the 75th percentile of the final accuracies achieved over all trials in this
experiment by the least accurate device, the Power Glove. The choice of the 75th
percentile is not critical; analysis with other criteria gave similar results. Analysis of
variance showed a highly significant effect of the choice of input device on the
variance in the data (F(3,483) = 68.99, p < 0.001). Considerable differences in mean
movement times of the different types of input devices were found (Table 1). These
differences were highly significant.
Device Type: MouseAbsoluteJoyst ick
Relat iveJoyst ick Power Glove
Mean MT: 4,917 7,139 10,308 24,950
Table 1. Mean movement times (in msec) in the input device experiment.
The mouse was 1.5 times faster than the absolute joystick (paired two-tailed t-test;
p < 0.0001), 2.1 times faster than the relative joystick (p < 0.0001) and 5.1 times faster
than the Power Glove (p < 0.0001). The absolute joystick was 1.4 times faster than the
relative joystick (p < 0.0001) and 3.5 times faster than the Power Glove (p < 0.0001).
The relative joystick was 2.4 times faster than the Power Glove (p < 0.0001).
4.1.2 Best Accuracy
The mean best accuracy (i.e., the smallest 4-D Euclidean distance to target) reached
during the experiment by each device is given in Table 2. The differences between the
mean best accuracies of the 2-D device types were not very great.
Device Type: MouseAbsoluteJoyst ick
Relat iveJoyst ick Power Glove
Mean Best Accuracy: 1.35 1.61 2.04 8.97
Table 2. Mean best accuracies (in mm) in the input device experiment.

41
The difference between the mouse and the absolute joystick was not significant
(paired two-tailed t-test; p > 0.15). However, the mouse was 1.5 times more
accurate than the relative joystick (p < 0.005) and 6.7 times more accurate than the
Power Glove (p < 0.0001). The absolute joystick was 1.3 times more accurate than
the relative joystick (p < 0.05) and 5.6 times more accurate than the Power Glove.
The relative joystick was 4.4 times more accurate than the Power Glove.
4.1.3 Control Integration
The average control integration (CI) gives an indication of the amount of integration
of a pair of control axes of an input device (see § 2.3.5). Its unit of measurement is
the degree (º). A minimum integration is indicated by 0º and a maximum integration
by 45º. Table 3 shows the mean CI per input device for each cross-section of 4-D
space, as exemplified by figure 7.
Device Type
Mean CI Mouse AbsoluteJoyst ick
Relat iveJoyst ick Power Glove
X • Y 14 14.1 9.5 21.6
A • Z 12.1 13.7 8.4 3.7
Z • Y 0 0.5 0.8 15.9
Z • X 0 0.5 0.7 16.4
A • Y 0 0.5 0.8 2.7
A • X 0 0.6 0.7 2.9
Table 3. Mean average control integration (in degrees) in the input device experiment(X = Brightness; Y = Overtones; A = Envelope; Z = Articulation).
• The differences in X • Y control integration between input devices were highlysignificant (paired two-tailed t-test; p < 0.0001), except for the differencebetween the mouse and the absolute joystick, which was not significant (p > 0.4).
• The differences in A • Z control integration were highly significant (p < 0.01).
• The differences in Z • Y control integration were highly significant (p < 0.0001).
• The differences in Z • X control integration were highly significant (p < 0.005).
• The differences in A • Y control integration were highly significant (p < 0.0001).
• The differences in A • X control integration were highly significant (p < 0.0001),except for the difference between the absolute joystick and the relative joystick,which was not significant (p > 0.1).
• The differences in control integration between the Power Glove cross-sectionsX•Y and Z•Y and between its X•Y and Z•X cross-sections were highlysignificant (p < 0.0001). The difference between the Z•Y and Z•X cross-sectionsof the Power Glove was not significant (p > 0.1).
• The differences in control integration between the Power Glove cross-sectionsZ•X, Z•Y and the X•Y cross-sections of the absolute joystick and mouse weresignificant (p < 0.01).

42
Figure 7. Input device trajectories
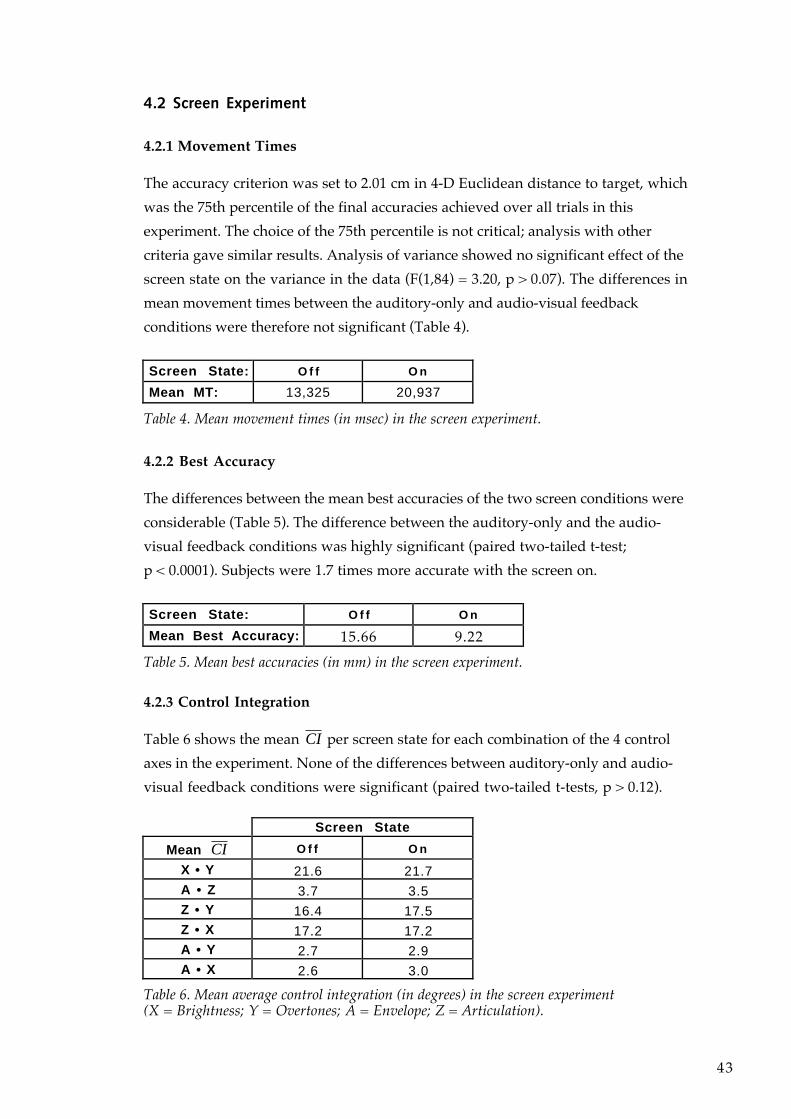
43
4.2 Screen Experiment
4.2.1 Movement Times
The accuracy criterion was set to 2.01 cm in 4-D Euclidean distance to target, which
was the 75th percentile of the final accuracies achieved over all trials in this
experiment. The choice of the 75th percentile is not critical; analysis with other
criteria gave similar results. Analysis of variance showed no significant effect of the
screen state on the variance in the data (F(1,84) = 3.20, p > 0.07). The differences in
mean movement times between the auditory-only and audio-visual feedback
conditions were therefore not significant (Table 4).
Screen State: O f f O n
Mean MT: 13,325 20,937
Table 4. Mean movement times (in msec) in the screen experiment.
4.2.2 Best Accuracy
The differences between the mean best accuracies of the two screen conditions were
considerable (Table 5). The difference between the auditory-only and the audio-
visual feedback conditions was highly significant (paired two-tailed t-test;
p < 0.0001). Subjects were 1.7 times more accurate with the screen on.
Screen State: O f f O n
Mean Best Accuracy: 15.66 9.22
Table 5. Mean best accuracies (in mm) in the screen experiment.
4.2.3 Control Integration
Table 6 shows the mean CI per screen state for each combination of the 4 control
axes in the experiment. None of the differences between auditory-only and audio-
visual feedback conditions were significant (paired two-tailed t-tests, p > 0.12).
Screen State
Mean CI O f f O n
X • Y 21.6 21.7A • Z 3.7 3.5Z • Y 16.4 17.5Z • X 17.2 17.2A • Y 2.7 2.9A • X 2.6 3.0
Table 6. Mean average control integration (in degrees) in the screen experiment(X = Brightness; Y = Overtones; A = Envelope; Z = Articulation).

44
4.3 Qualitative Data
The qualitative data consisted of the subjects’ answers to the various questions in
the questionnaires. Table 7 shows how frequent the subjects used the different input
devices. χ2 analysis with frequency categories combined into two categories (often and
rarely) showed differences to be highly significant (p < 0.0001). 73% of the subjects
used the mouse on a weekly or a daily basis. 67% of the subjects had little
experience with the joystick and 93% had never used a Power Glove before.
Table 8 shows how difficult the subjects considered mastering the different input
device types. Significance testing was unreliable with this data set. 93% found the
mouse easy to master. 87% of the subjects found the absolute joystick not so
difficult-easy to master, while only 67% felt the same about the relative joystick. The
Power Glove was found difficult-very difficult to master by 87% of the subjects.
Table 9 shows how tiring the subjects considered using the different input device
types. Significance testing was unreliable with this data set. All subjects considered
the mouse not tiring at all. The absolute joystick was found not so tiring-not tiring at
all by all subjects, while only 80% felt the same about the relative joystick. The
Power Glove was considered tiring-very tiring by 80% of the subjects.
Table 10 shows how useful the subjects found auditory feedback in indicating
their position in the control space. Significance testing was unreliable with this data
set. All subjects found the Brightness parameter to produce useful-very useful
positioning feedback. The Overtones parameter was considered useful-very useful by
86% of the subjects. The subjects were less clear about the Articulation and Envelope
parameters.
The mouse was considered the most accurate device by 80% of the subjects,
followed by the absolute joystick at 20%. The mouse was considered the quickest
device by 53%, the absolute joystick by 33% and the relative joystick by 13%. The
mouse was most liked by 67%, the absolute joystick by 20% and the Power Glove by
13% of the subjects.
80% of the subjects considered sound useful-very useful as feedback. On a scale
from 0 (not useful) to 100 (very useful) their mean score would have been 64. 62% of
the subjects considered visual feedback unnecessary. 50% of the subjects considered
being able to change all parameters at once to be an advantage, while 36%
considered it a disadvantage. On a scale from 0 (disadvantage) to 100 (advantage)
their mean score would have been 57. 71% of the subjects had had previous
experience with sound synthesis.

45
Input Device
Frequency Mouse Joyst ick Power Glove
daily 7 2 0
weekly 4 0 0
monthly 2 3 0
rarely 2 4 1
never 0 6 14
Mean score (%): 77 30 2
Table 7. Contingency table showing the frequency with which the subjects used the devices.The last row shows their mean score on a scale from 0 (never) to 100 (daily).
Device Type
Difficulty Mouse AbsoluteJoyst ick
Relat iveJoyst ick Power Glove
very difficult 0 0 0 9
difficult 0 2 5 4
not so difficult 1 9 7 2
easy 14 4 3 0
Mean score (%): 2 29 38 82
Table 8. Contingency table showing how difficult the subjects considered mastering thedifferent device types. The last row shows their mean score on a scale from 0 (easy) to 100(very difficult).
Device Type
Fatigue MouseAbsoluteJoyst ick
Relat iveJoyst ick Power Glove
very tiring 0 0 0 5
tiring 0 0 3 7
not so tiring 0 6 3 2
not tiring at all 15 9 9 1
Mean score (%): 0 13 20 69
Table 9. Contingency table showing how tiring the subjects considered using the differentdevice types. The last row shows their mean score on a scale from 0 (not tiring at all) to 100(very tiring).
Parameter
Usefulness Overtones Brightness Articulation Envelope
very useful 5 7 2 4
useful 7 7 4 3
not so useful 2 0 7 5
not useful at all 0 0 1 2
Mean score (%): 74 83 50 55
Table 10. Contingency table showing how useful the subjects considered auditory feedbackduring positioning (1 missing value). The last row shows their mean score on a scale from 0(not useful at all) to 100 (very useful).

46
92% considered ISEE to make sound synthesis easier. 53% disagreed-strongly
disagreed that ISEE restricted their artistic freedom, while only 13% agreed-strongly
agreed. On a scale from 0 (strongly disagree) to 100 (strongly agree) their mean score
would have been 33. 67% agreed-strongly agreed that ISEE liberated them from
technicalities, while only 6% disagreed-strongly disagreed. On a scale from 0
(strongly disagree) to 100 (strongly agree) their mean score would have been 70.
67% of the subjects thought that the 4 ISEE parameters represented timbre
manipulation properly. Neither joystick type was preferred when using ISEE while
playing the synthesizer keyboard.

47
Chapter 5. Discussion
In this chapter, possible explanations for the results presented in the previous
chapter and their theoretical and practical implications are discussed. The findings
of the input device experiment are reflected upon and related to previously
published work, after which the results of the screen experiment and the qualitative
findings are discussed.
5.1 Input Device Experiment
In this experiment, four different device types were used by subjects to reach for
targets in a 4-D timbre manipulation task. The efficacy of each device was
established by analyzing movement time, accuracy and control integration.
5.1.1 Movement Time and Accuracy
The results of this study show considerable differences in movement time and
accuracy between the four device types in this task. The observed differences
between the mouse and joystick are in correspondence with those found in previous
studies (English, Engelbart et al. 1967; Card, English et al. 1978), as are the
differences between the relative and absolute joystick (Shneiderman 1987). The 2-D
devices clearly outperform the Power Glove, but this does not necessarily mean they
are more suited for this task than a dataglove. It is more likely that the inferior
performance of the Power Glove was caused by the severe impact that cost-cutting
measures have had on its positioning signal/noise ratio. Although a low polling rate
and an averaging filter stabilized the output of its ultrasonic positioning system, the
lag caused by that same processing was unacceptably high. I see this lag as the single
most important cause for the observed speed and accuracy deficiencies. The
observed difference in performance between the mouse and the Power Glove seems
consistent with the multiplicative effect of lag on Fitts’ index of difficulty predicted
by MacKenzie and Ware (1993). There is a trade-off between the amount of lag and
the erraticness of positioning data. Both cause performance to degrade, but what is
the optimal balance between these two factors? If low-cost 3-space positioning
technology does not improve dramatically in the near future, it would be interesting
to compare the effect on performance of noise in the positioning data with that of lag
in order to find an optimal filtering balance.
48
5.1.2 Control Integration
The Power Glove features unrestricted 3-space positioning, which is known to be
perceptually well-integrated (Jacob and Sibert 1992; Jacob, Sibert et al. 1994). Since
the observed control integration is affected by the separability of the task’s
parameters, the high amount of integration of the 3-space movement of the Power
Glove in this task suggests that at least three of the four timbre parameters are
perceptually well integrated with one another. With the 2-D device types, the
Envelope and Articulation pair seems to be somewhat less integrated than the
Overtones and Brightness pair. With the glove, the low integration of the Envelope
parameter with the other parameters was mainly caused by the difference in control
mode (absolute vs. relative) between them.
The Power Glove data shows the Overtones and Brightness parameters to be
significantly better integrated with one another than with the Articulation parameter,
which indicates that Overtones and Brightness are perceptually closely related. This is
not surprising, since Overtones and Brightness both affect the spectral envelope of a
sound, whereas the Articulation parameter affects its temporal envelope. Changes to
the spectral envelope were immediately perceived, while changes in the temporal
envelope of the sound were only perceived once a new tone was started. If, however,
it had been the interpolating filter ( the Max line object which was applied to the
positioning data) that determined the observed integration of glove movement, the
higher integration of the Overtones and Brightness parameters cannot be explained.
The relatively good correspondence of the perceptual structure of 3 of the 4
parameters in this task with the 3-space control structure of the glove demonstrates
the potential of high-quality datagloves and trackers as intuitive timbre controllers.
The use of a radio positioning system (Mathews 1989) might render low-cost
datagloves more effective in the near future.
The differences in control integration between the absolute and relative joystick
shows the control structure of the latter to be more separable. It was more difficult to
move the indicator dots diagonally on the screen using relative control. Though one
can speculate this separability to be caused by the perceptual split of relative control
into horizontal and vertical velocity control, the most probable cause for the
observed effect is the combination of forces exerted by the hardware springs in the
base of the joystick. It is physically more difficult to push the stick diagonally than it
is to push it along one of its axes. The interesting phenomena of a non-zero control
integration for those cross-sections of the joystick control space that are physically
unrelated (Z•Y, Z•X, A•Y, A•X) is explained by the ease with which the subjects
were able to switch the joystick back and forth between X•Y positioning and A•Z
positioning. The analysis procedure was sensitive to this effect, producing a marginal

49
rise in control integration for the non-related axis pairs. This also explains why the
control integration of the relative joystick was slightly higher than that of the
absolute joystick for most of these non-related axis pairs: relative control facilitates
switching between different parameter sets (Buxton 1986).
5.2 Screen Experiment
In this experiment, the Power Glove was used by subjects to reach for targets in a 4-D
timbre manipulation task using two types of feedback: audio-visual and auditory-
only. By comparing movement time, accuracy and control integration of the glove in
both circumstances, the impact of visual feedback on performance can be established.
5.2.1 Movement Time and Accuracy
The difference in mean movement time between the audio-visual and auditory-only
feedback conditions in this experiment was not significant. This was mainly due to
the increased variance in movement times with the screen turned off. Though in most
cases the accuracy criterion was reached more quickly without visual feedback, there
were several trials where subjects took a disproportionate amount of time to do so
(Figure 8). During these trials subjects seemed unable to pinpoint the target position,
which caused them to continue searching the control space while inadvertently
moving in and out of the region where the accuracy criterion was met.
There was a tendency to perform less accurate without visual feedback. Though
this might well have been caused by the fact that the auditory feedback had a lower
resolution than the visual feedback, it might also be explained by the fact that the
subjects needed to memorize their target when the screen was off. The subjects could
not reference the exact target and were therefore anxious to forget it, which resulted
in sketchy movements (Figure 9). However, the most probable cause for the observed
accuracy deficiencies is that the subjects were less able to determine their position
using auditory dimensions than they were using visual dimensions.
5.2.2 Control Integration
Results show that the control integration of the glove was not significantly influenced
by the separation of the visual representation of 4-D space into two 2-D coordinate
systems. The observed control integration was thus not determined by the visual
representation but by the control structure of the device and the perceptual structure
of the task. The visual representation presented by Control Monitor was proven to
be satisfactory, since it did not influence multidimensional device behaviour yet
corresponded nicely with the control structure of the 2-D device types.

50
Figure 9. Movement times per trial
Figure 10. Screen trajectories

51
5.3 Qualitative Data
The quantitative results corresponded with the subjects’ experience in using the
different devices. However, this does not mean that movement time and accuracy
results were due to experience, since care was taken to allow subjects to practice
long enough to feel confident with each device. The subjects’ scores for difficulty and
fatigue agree with the current theoretical background on motor and cognitive
processing relating to input device utilization (Keele 1968; Shneiderman 1987;
MacKenzie and Ware 1993). It is clear that the sound parameters used for auditory
feedback were not necessarily the most appropriate ones. However, the spectral
distribution parameters (Overtones and Brightness) seem just as promising as the
traditional pitch and loudness parameters for this type of utilization.
The subjects’ scores for most accurate device, fastest device and most favoured
device corresponded nicely with the quantitative results. The usefulness of auditory
feedback and necessity of visual feedback seem also to comply with the quantitative
results. Some subjects were observed to be particularly comfortable with the screen
off, since they were less aware of their errors. They were also encouraged by the need
to memorize the target sound, since this made trials more stimulating. The same
applies to the glove: one person actually liked this device most since it was more
challenging. Being able to change all 4 timbre parameters at a time was clearly not an
advantage with the Power Glove. This was reflected by the subjects’ opinions. A
Polhemus tracking device might have produced totally different results on this issue.
Since most of the subjects had had some kind of experience with sound synthesis,
they were well able to judge ISEE’s usability by comparing it with the sound
synthesis user interfaces they had previously operated. It was clear that they
enjoyed the high level of abstraction of the ISEE timbre parameters and the use of
task-related semantics in the user interface. They did not feel it restricted their
freedom but considered ISEE an artistically useful tool that liberated them from
technicalities. The issue on whether to prefer the absolute joystick or the relative
joystick when using ISEE with a keyboard was not resolved. The low integration of
the X•Y and A•Z axis pairs indicates that the relative joystick is best used when
wanting to gradually change one parameter at a time. The relatively high control
integration of the non-related axis pairs indicates that the relative joystick is useful
when wanting to frequently switch between the two Control Monitor coordinate
systems or between instrument spaces. The short movement time and high accuracy
of the absolute joystick indicate that it is more useful when speed and accuracy are
important. Its absolute nature increases the performer’s confidence about the
location within an instrument space. The decision which joystick type to use thus
depends on the application and is therefore best left up to the performing artist.

52
Chapter 6. Conclusions
6.1 Findings
Choosing an appropriate input device is an important consideration when designing
user interfaces for any multidimensional task. In this 4 DOF sound manipulation
task with 2 x 2-D visual feedback, the choice of input device significantly affected
the movement time, accuracy and control integration with which the task was
performed (however, in the absence of a more comprehensive experimental
investigation this finding must be treated as inconclusive. For example, it was not
possible within the experiments to take account of the effect of long-term familiarity
with the devices). The low-cost 2-D devices clearly outperformed the low-cost
multidimensional Power Glove because of their superior technical refinement. The
mouse was 1.5 times faster but not significantly more accurate than the absolute
joystick, which was 1.4 times faster and 1.3 times more accurate than the relative
joystick, which was 2.4 times faster and 4.4 times more accurate than the Power
Glove. The inferior performance of the Power Glove was most probably due to the
severe impact cost-cutting measures have had on its positioning signal/noise ratio.
The observed movement time and accuracy deficiencies of the glove are best
explained by the multiplicative effect of lag on the index of difficulty of the task. The
low integration of the glove’s roll with the other degrees of freedom of the glove was
mainly caused by the difference in control mode (relative vs. absolute) between them.
The current low resolution of roll impairs the glove’s usability for any refined
absolute utilization beyond 3 degrees of freedom. The use of a low-cost radio
positioning system might render a next generation of Power Gloves more effective.
The glove’s high amount of integration of the axes in both 2-D and 3-D space
demonstrates the potential of such next-generation low-cost datagloves.
The relatively low control integration of the relative joystick indicates it has a
more separable control structure than its absolute counterpart. This is probably due
to the construction of the self-centering system of the device, which makes it
somewhat strenuous to push the stick diagonally. The higher control integration of
the non-related axis pairs of the relative joystick indicates it was used more often to
switch operation between parameter sets than the absolute joystick, since relatively
applied input devices have no nulling problem.
The separability of the 2 x 2-D visual representation of the 4-D control space did
not affect multidimensional control integration significantly. The visual
representation corresponded nicely with the control structure of the 2-D devices. The
lack of visual guidance did, however, significantly reduce the accuracy with which
the subjects performed the task. The subjects were probably less able to determine

53
their position using the auditory dimensions than they were using the visual
dimensions. Movement time was not proven to be significantly affected by the lack
of visual feedback, but did vary more greatly amongst subjects.
The high amount of control integration of the 3-space movement of the Power
Glove suggests at least 3 of the 4 timbre parameters to be well integrated. 2-D device
integration shows the Overtones and Brightness parameters to be better integrated
than the Envelope and Articulation parameters, which suggests Overtones and
Brightness to be perceptually closer related than any other combination of the 4
timbre parameters. The subjects considered Overtones and Brightness to be the most
useful parameters in providing auditory positioning feedback. This encourages
further investigation of their use, together with the traditional pitch and loudness
parameters, in auditory feedback applications. Subjects considered auditory
feedback to be very useful as a navigational aid.
The high level of abstraction of the ISEE timbre parameters and the utilization of
task-related semantics were appreciated by the subjects. They considered ISEE a
useful tool which liberated them from technicalities and did not restrict their artistic
freedom. When using a keyboard with ISEE, the mouse is not a very useful input
device. It can easily slip or drop during performance and uses too much space.
Which joystick type to use in that circumstance depends on the artistic utilization.
The relative joystick is best suited for gradually changing one parameter at a time
and for rapidly switching between instrument spaces or parameter sets, since
diagonal movement was rare, but switching between parameter sets was frequent.
The absolute joystick is better when speed, accuracy and navigational confidence are
important, because of its short movement time, high accuracy and absolute nature.
6.2 Future Directions
Future research should concentrate on the construction of low-cost datagloves with a
more reliable positioning system than the ultrasonic system featured by the Power
Glove. Such research would include comparing alternatives such as radio positioning
with the current system. If, however, alternatives are not feasible at low cost, the
impact on performance of noise in positioning data should be investigated and
compared with that of lag in order to find an optimal filtering balance for the glove.
The roll information of next-generation gloves should have a higher resolution than
the 12 positions featured by the Power Glove.
It would be interesting to compare different multidimensional devices such as the
Spaceball and Polhemus Fastrak in a multidimensional task (Pimentel and Teixeira
1993). Studying differences in the utilization of such devices may lead to a better
understanding of human behaviour in multidimensional tasks and stimulates the

54
development of a theoretical foundation for multidimensional task-device
optimalization. In particular, extending Fitts’ Law to include multidimensional
movement would be of great value.
The use of timbre parameters for auditory navigation purposes requires further
investigation. The timbre parameters featured in this study pertained to the ISEE
system, but a future study could compare the efficacy of pitch, loudness, Brightness
and Overtones as auditory navigational aids. The implementation of the Overtones
parameter (which controlled the harmonicity of the spectrum in this study) needs
further investigation for optimal performance in auditory feedback applications. The
resolution might be enhanced by cross-fading between different C:M ratios or by
using an alternative synthesis model.

55
References
Bauer, W. and Foss, B. (1992). “GAMS: An Integrated Media Controller System.” Computer Music Journal16(1): 19-24.
Buxton, W. (1986). “There’s More to Interaction than Meets the Eye: Some Issues in Manual Input.” in D. A.Norman and S. W. Draper, ed. User Centered System Design: New Perspectives on HCI. Hillsdale, N.J.,Lawrence Erlbaum Associates: 319-337.
Buxton, W., Patel, S., et al. (1982). “Objed and the Design of Timbral Resources.” Computer Music Journal 6(2).
Cadoz, C., Luciani, A., et al. (1984). “Responsive Input Devices and Sound Synthesis by Simulation ofInstrumental Mechanisms: The Cordis System.” Computer Music Journal 8(3).
Cadoz, C., Luciani, A., et al. (1993). “CORDIS-ANIMA: A Modeling and Simulation System for Sound andImage Synthesis—The General Formalism.” Computer Music Journal 17(1): 19-29.
Card, S. K., English, W. K., et al. (1978). “Evaluation of Mouse, Rate-Controlled Isometric Joystick, StepKeys and Text Keys for Text Selection on a CRT.” Ergonomics 21(8): 601-613.
Card, S. K., Moran, T. P., et al. (1980). “The Keystroke Level Model for User Performance Time withInteractive Systems.” Communications of the ACM 23(7): 396-410.
Chen, M., Mountford, S. J., et al. (1988). “A Study in Interactive 3-D Rotation Using 2-D Control Devices.”Computer Graphics 22(4): 121-129.
Chowning, J. (1973). “The Synthesis of Complex Audio Spectra by Means of Frequency Modulation.”Journal of the Audio Engineering Society 21(7): 526-534.
Collinge, D. J. and Parkinson, S. M. (1988). “The Oculus Ranae.” Proceedings of the 1988 ICMC Conference,Cologne, Germany, International Computer Music Association.
Coolican, H. (1990). Research Methods and Statistics in Psychology. London, Hodder & Stoughton.
Eaglestone, B. (1988). “A Database Environment for Musician-Machine Interaction Experimentation.”Proceedings of the 1988 ICMC, Cologne, Germany, International Computer Music Association.
English, W. K., Engelbart, D. C., et al. (1967). “Display-Selection Techniques for Text Manipulation.” IEEETransactions on Human Factors in Electronics 8(1): 5-15.
Feiten, B. and Ungvary, T. (1991). “Organisation of Sounds with Neural Nets.” Proceedings of the 1991ICMC, Montreal, International Computer Music Association.
Fitts, P. M. (1954). “The Information Capacity of the Human Motor System in Controlling the Amplitude ofMovement.” Journal of Experimental Psychology (47): 381-391.
Fitts, P. M. and Posner, M. I. (1967). Human Performance. London, Prentice-Hall, Inc.
Garner, W. R. (1974). The Processing of Information and Structure. Lawrence Erlbaum, Potomac, Md.
Gibet, S. and Florens, J.-L. (1988). “Instrumental Gesture Modeling by Identification with Time-VaryingMechanical Models.” Proceedings of the 1988 ICMC, Cologne, Germany, International Computer MusicAssociation.
Gibet, S. and Marteau, P.-F. (1990). “Gestural Control of Sound Synthesis.” Proceedings of the 1990 ICMC,Glasgow, International Computer Music Association.
Grey, J. M. (1975). “An Exploration of Musical Timbre.” Ph.D. Dissertation, Dept. of Psychology, StanfordUniversity. CCRMA Report STAN-M-2.
Jacob, R. J. K. and Sibert, L. E. (1992). “The Perceptual Structure of Multidimensional Input DeviceSelection.” Proceedings of ACM CHI ’92 Conference on Human Factors in Computing Systems: 211-218.
Jacob, R. J. K., Sibert, L. E., et al. (1994). “Integrality and Separability of Input Devices.” ACM Transactionson Computer-Human Interaction 1(1).
Kabbash, P., MacKenzie, I. S., et al. (1993). “Human Performance using Computer Input Devices in thePreferred and Non-Preferred Hands.” Proceedings of ACM INTERCHI ’93 Conference on Human Factorsin Computing Systems, Amsterdam, Holland.
Keele, S. W. (1968). “Movement Control in Skilled Motor Performance.” Psychological Bulletin 70: 387-402.
Keele, S. W. (1973). Attention and Human Performance. Pacific Pallisades, Goodyear Publishing Company.
Lee, M., Freed, A., et al. (1991). “Real-Time Neural Network Processing of Gestural and AcousticalSignals.” Proceedings of the 1991 ICMC, Montreal, International Computer Music Association.

56
Lee, M. and Wessel, D. (1992). “Connectionist Models for Real-Time Control of Synthesis and CompositionalAlgorithms.” Proceedings of the 1992 ICMC, San Jose, International Computer Music Association.
Likert, R. A. (1932). “A Technique for the Measurement of Attitudes.” Archives of Psychology 140.
MacKenzie, I. S. (1992). “Fitts’ Law as a Research and Design Tool in Human-Computer Interaction.”Human Computer Interaction (7): 91-139.
MacKenzie, I. S. and Buxton, W. (1992). “Extending Fitts’ Law to Two-Dimensional Tasks.” Proceedings ofACM CHI ’92 Conference on Human Factors in Computing Systems: 219-226.
MacKenzie, I. S. and Buxton, W. (1993). “A Tool for the Rapid Evaluation of Input Devices using Fitts’ LawModels.” SIGCHI Bulletin 25(3): 58-63.
MacKenzie, I. S., Sellen, A., et al. (1991). “A Comparison of Input Devices in Elemental Pointing andDragging Tasks.” Proceedings of ACM CHI ’91 Conference on Human Factors in Computing Systems: 161-166.
MacKenzie, I. S. and Ware, C. (1993). “Lag as a Determinant of Human Performance in Interactive Systems.”Proceedings of ACM INTERCHI ’93 Conference on Human Factors in Computing Systems, Amsterdam,Holland.
Mackinlay, J. D., Card, S. K., et al. (1990). “A Semantic Analysis of the Design Space of Input Devices.”Human-Computer Interaction 5: 145-190.
Mathews, M. V. (1989). “The Conductor Program and Mechanical Baton.” in M. V. Mathews and J. R.Pierce, ed. Current Directions in Computer Music. Cambridge, MA, MIT Press: 263-281.
Mathews, M. V. (1991). “The Radio Baton and Conductor Program, or: Pitch, the Most Important and LeastExpressive Part of Music.” Computer Music Journal 15(4): 37-50.
Mountford, S. J., Spires, S., et al. (1987). “Visage: A Three-Dimensional Graphics Editor - Evaluation andReview.” Microelectronics and Computer Technology Corporation, Austin, Texas.
Nelson, T. (1980). “Interactive Systems and the Design of Virtuality.” Creative Computing 6(11-12).
Pausch, R. (1991). “Virtual Reality on Five Dollars a Day.” Proceedings of ACM CHI ’91 Conference onHuman Factors in Computing Systems: 265-270.
Pimentel, K. and Teixeira, K. (1993). Virtual Reality: Through the New Looking Glass. Windcrest Books.
Plomp, R. (1976). Aspects of Tone Sensation. London, Academic Press.
Puckette, M. and Zicarelli, D. (1990). “MAX-An Interactive Graphic Programming Environment.” OpcodeSystems, Menlo Park, CA.
Roberts, T. L. and Moran, T. P. (1983). “The Evaluation of Computer Text Editors: Methodology andEmpirical Results.” Communications of the ACM 26(4): 265-283.
Rubine, D. and McAvinney, P. (1988). “The VideoHarp.” Proceedings of the 1988 ICMC, Cologne, Germany,International Computer Music Association.
Rutkowski, C. (1982). “An Introduction to the Human Applications Standard Computer Interface, Part 1:Theory and principles.” BYTE 7(11): 291-310.
Shepard, R. (1974). “Representations of Structure in Similar Data: Problems and Prospects.” Psychometrica39: 373-421.
Shneiderman, B. (1987). Designing the User-Interface: Strategies for Effective Human-Computer Interaction.Reading, MA, Addison Wesley.
Truax, B. (1977). “Organizational Techniques for c:m Ratios in Frequency Modulation.” Computer MusicJournal 1(4): 39-45.
Vertegaal, R. (1992). “Music Technology Dissertation.” Utrecht School of the Arts, The Netherlands.
Vertegaal, R. and Bonis, E. (1994). “ISEE: An Intuitive Sound Editing Environment.” Computer MusicJournal (in press).
Waisvisz, M. (1985). “THE HANDS: A Set of Remote MIDI-Controllers.” Proceedings of the 1985 ICMC,Burnaby, Canada, International Computer Music Association.
Wessel, D. (1974). “Report to C.M.E.” University of California, San Diego.
Wessel, D. (1985). “Timbre Space as a Musical Control Structure.” in C. Roads and J. Strawn, ed.Foundations of Computer Music. Cambridge, MA, MIT Press: 640-657.

57
Appendix A. Questionnaires
A 1. Input Device Experiment Questionnaire
Please write in capitals
Please indicate how often you have used the following devices (circle your answer):
Mouse daily weekly monthly rare ly neverJoystick daily weekly monthly rare ly neverPower Glove daily weekly monthly rare ly never
Which input device did you find most accurate?
Which input device did you find quickest?
Which input device did you like most?
How difficult did you find mastering the devices? (circle your answer):
Mouse very difficult di f f icult not so difficult easyJoystick Rel. very difficult di f f icult not so difficult easyJoystick Abs. very difficult di f f icult not so difficult easyPower Glove very difficult di f f icult not so difficult easy
How tiring did you find using these devices? (circle your answer):
Mouse very tiring tiring not so tiring not tiring at allJoystick Rel. very tiring tiring not so tiring not tiring at allJoystick Abs. very tiring tiring not so tiring not tiring at allPower Glove very tiring tiring not so tiring not tiring at all
Did you find sound useful as feedback? (circle your answer):
very useful useful not so useful useless

58
A 2. Screen Experiment Questionnaire
Please indicate for each parameter whether it was useful in indicating your positionin the workspace. Please describe why (briefly).
Overtones: very useful useful not so useful not useful at all
because:.....................................................................................................................
Brightness: very useful useful not so useful not useful at all
because:.....................................................................................................................
Articulation: very useful useful not so useful not useful at all
because:.....................................................................................................................
Envelope: very useful useful not so useful not useful at all
because:.....................................................................................................................
Do you feel that it having the screen on is necessary?
Do you think that being able to change all parameters at a time is
Advantage Doesn’t matter Disadvantage
Why do you think so?

59
A 3. ISEE Questionnaire
Did you have any experience with sound synthesis before?
Do you think that ISEE makes sound synthesis easier or more difficult?
Why do you think so?
Please circle your opinion about the following statements:
ISEE restricts my artistic freedom.
Strongly agree Agree Undecided Disagree Strongly Disagree
ISEE liberates me from technicalities.
Strongly agree Agree Undecided Disagree Strongly Disagree
Do you think that the 4 parameters represent timbre parameters properly?
Why do you think so?
Which joystick did you prefer when using ISEE with a keyboard?
Absolute Relative
Any additional comments (keep it brief please):