An Estimated Model of Informality with Constrained ...econpn/Pierre_Nguimkeu/RESEARCH... · An...
36
An Estimated Model of Informality with Constrained Entrepreneurship * Pierre Nguimkeu † Georgia State University August 2016 Abstract I present and estimate a simple structural model of occupational choice where agents choose between formal entrepreneurship, informal entrepreneurship and non- entrepreneurial work, and I explicitly incorporate the presence of registration costs, imperfect credit markets and taxation with low enforcement. Using data from Cameroon, I show both theoretically and empirically that the decision to formalize is U-shaped in skills with the turning point corresponding to secondary school com- pletion, and that failing to account for registration costs significantly undermines the model performance in terms of selection to the formal sector. Initial wealth and average education are found to be important drivers of informal entrepreneurship while higher education and parent’s entrepreneurial status are the main determi- nants of formal entrepreneurship. Counterfactual policy simulations show that sub- stantial enterprise creation, increased formalization and aggregate income gains can be obtained from registration reforms, reduced taxation and business training. In contrast, a pure enforcement policy against informality has an overall perverse effect on entrepreneurship. Keywords: Entrepreneurship, Informality, Regulation, Maximum likelihood, Coun- terfactual analysis. JEL Classification: O12, O17, H21, C51, C54. * I thank Emmanuelle Auriol, Alex Karaivanov, Andrew Feltenstein, Omari Swinton, and conference participants of the 2014 World Economic Congress, the 2014 Southern Economic Association meeting, the 2015 Canadian Development Economics Study Group, and the 10th IZA/World Bank Conference on Employment and Development for useful comments and feedbacks. I also thank the Cameroon National Institute of Statistics for making the data available to me for this study. Excellent research assistance from Augustine Denteh is gratefully acknowledged. † Department of Economics, Andrew Young School of Policy Studies, Georgia State University, PO Box 3992, Atlanta, GA 30302-3992, USA; Email: [email protected]. 1
-
Upload
duongthien -
Category
Documents
-
view
214 -
download
1
Transcript of An Estimated Model of Informality with Constrained ...econpn/Pierre_Nguimkeu/RESEARCH... · An...

An Estimated Model of Informality with Constrained
Entrepreneurship∗
Pierre Nguimkeu†
Georgia State University
August 2016
Abstract
I present and estimate a simple structural model of occupational choice whereagents choose between formal entrepreneurship, informal entrepreneurship and non-entrepreneurial work, and I explicitly incorporate the presence of registration costs,imperfect credit markets and taxation with low enforcement. Using data fromCameroon, I show both theoretically and empirically that the decision to formalizeis U-shaped in skills with the turning point corresponding to secondary school com-pletion, and that failing to account for registration costs significantly underminesthe model performance in terms of selection to the formal sector. Initial wealth andaverage education are found to be important drivers of informal entrepreneurshipwhile higher education and parent’s entrepreneurial status are the main determi-nants of formal entrepreneurship. Counterfactual policy simulations show that sub-stantial enterprise creation, increased formalization and aggregate income gains canbe obtained from registration reforms, reduced taxation and business training. Incontrast, a pure enforcement policy against informality has an overall perverse effecton entrepreneurship.
Keywords: Entrepreneurship, Informality, Regulation, Maximum likelihood, Coun-terfactual analysis.
JEL Classification: O12, O17, H21, C51, C54.
∗I thank Emmanuelle Auriol, Alex Karaivanov, Andrew Feltenstein, Omari Swinton, and conferenceparticipants of the 2014 World Economic Congress, the 2014 Southern Economic Association meeting,the 2015 Canadian Development Economics Study Group, and the 10th IZA/World Bank Conference onEmployment and Development for useful comments and feedbacks. I also thank the Cameroon NationalInstitute of Statistics for making the data available to me for this study. Excellent research assistancefrom Augustine Denteh is gratefully acknowledged.†Department of Economics, Andrew Young School of Policy Studies, Georgia State University, PO
Box 3992, Atlanta, GA 30302-3992, USA; Email: [email protected].
1

1 Introduction
The importance of entrepreneurship for both developed and developing economies can-not be overemphasized. Entrepreneurship is universally considered a crucial ingredientin promoting and sustaining economic growth because of its potential for creating jobs,delivering innovation and raising productivity. In the context of developing countries,however, the existence of a large informal sector (60-90% of the overall workforce) thatcoexists with the formal sector brings additional challenges to policy-makers’ objectiveto understand and promote entrepreneurship. On the one hand, formal enterprises havehigher growth prospects, higher productivity and income potential (Schneider and Enste2000), and generate tax revenues that can be used by the state to improve the provisionof public goods and services. On the other hand, informal entrepreneurship is generallylow-scale, is largely untaxed and creates important shortfalls in government revenues.At the same time it represents an important avenue for job creation, an incubator forbusiness potential and a stepping stone for accessibility and graduation to the formaleconomy, especially for less-educated workers (ILO 2002, Cano-Urbina 2015).
This paper investigates how individual and institutional characteristics drive en-trepreneurial choice and the formation of formal and informal firms in developing coun-tries. While accounting for traditional factors such as taxation, enforcement and financialconstraints, I emphasize the role of entry registration costs and reexamine the effects ofskills. These elements not only enable a better fit of the model with the data as evidencedby the likelihood analysis that I perform, but also play critical roles in quantitatively as-sessing the relevance of policies and programs aiming to promote entrepreneurial growthand increase output while harnessing informality. The underlying structural model thatI present assumes heterogeneous agents who choose to become non-entrepreneurs, infor-mal entrepreneurs or formal entrepreneurs based on both their personal characteristics(i.e. skills and wealth endowment) and institutional factors (i.e. entry costs, taxation,enforcement and degree of financial frictions). The implications of the model are testedusing reduced form techniques and specification analysis, and structural estimates areprovided using data from Cameroon, an economy where 90% of the labor force operatesin the informal sector, which accounts for 31% of the gross national product. The es-timated model is then used in counterfactual policy simulations to quantify the impactof registration reforms, taxation, enforcement, and business training programs on theCameroon economy.
The existing research on formal/informal occupational choice and the impacts ofpolicy efforts to increase formality comes from only a few countries, concentrated inLatin America and Southeast Asia (see Bruhn and McKenzie 2014 for a recent review).Very little attention about these issues has been given to Sub-Saharan African countries,which differ from these regions by several relevant features. For instance, the size of in-formal employment and the entry costs to the formal sector are substantially higher inAfrica compared to Latin America and Asia, whereas the levels of education and finan-
2

cial development are relatively lower (see Figure 10 and Table 6 in the Appendix). Also,the heterogeneity of the informal sector (e.g., type of firms, performance, proportion ofsubsisters) or other type of regulatory barriers (e.g. titling, licensing, etc.) differ sub-stantially across regions. To that extent, findings from other regions do not necessarilygeneralize to Africa, and this paper endeavours to provide some evidence from a typicalAfrican country, using a structural approach. The model discussed and estimated is anamended version of several models in the literature (e.g. Fortin et al. 1997, Amaraland Quentin 2006, Antunes and Cavalcanti 2007, Dabla-Norris et al. 2008, de Paulaand Scheinkman 2011, Prado 2011, Ordonez 2014). I present an extension that fits thecontext of many African countries as suggested by recent studies (e.g. World Bank 2005,Djankov et al. 2002, Auriol and Walters 2005, McKenzie 2011). Specifically, the modelassumes an institutional environment that accounts for the presence of important regis-tration costs, imperfect credit markets and a tax collection policy with low enforcement.A worker receives a fixed income while an entrepreneur establishes a firm with capitalinvestment and hired labor and realizes profits from a decreasing-returns-to-scale tech-nology. To become formal, an entrepreneur needs to pay a registration cost and onceformal, also pays taxes but enjoys better access to credit. In contrast, informal en-trepreneurs do not pay taxes but are more likely to face borrowing constraints while alsofacing a probability of getting caught and forfeiting their profit. The main implications ofthe model are as follows. Less productive entrepreneurs choose informality whereas themost productive ones choose the formal sector. Formality is costly not only because ofhigh taxation but also because of high registration costs whose affordability is limited tofirms promising sufficiently high returns and prospects to grow. This induces fewer entrydecision from entrepreneurs with low ability, which in turn increases the number of un-productive enterprises in the informal sector, even when the tax rate is reasonably small.
To structurally estimate the model, I build a likelihood function by matching theprobability of each occupation generated by the theoretical model with the correspond-ing occupational status observed in the data. Evidence is provided using data from the2005 Cameroon National Survey on Employment and Informal Sector (EESI), whichgathered a comprehensive set of information on a cross-sectional representative sampleof households.1 The results confirm that observable talent such as education is a keydeterminant of entrepreneurial choice. There is however a non-monotonic, U-shaped,relationship between entrepreneurs’ education and their decision to formalize. In otherwords, less educated entrepreneurs find it more profitable to remain informal as theirlevel of education increases. It is only above a certain educational threshold that for-mality becomes increasingly attractive to informal entrepreneurs with increasing levelsof education. I also found that parents occupations play a key role in entrepreneurialchoice and explain why more than 40% of formal entrepreneurs in the data are childrenof entrepreneurs. This means that informal business training received at home mayhave an effective impact on entrepreneurial success and suggests that business trainingmay be useful to foster entrepreneurship. Finally, I empirically show through statistical
1Available via the Cameroon National Institute of Statistics website at www.statistics-cameroon.org.
3

testing and likelihood analysis that failing to incorporate the critical role of entry regis-tration costs substantially deteriorates the model performance in terms of selection intothe formal sector.
To quantitatively assess the role of institutional factors such as registration costs, taxrates, and law enforcement, I perform a set of counterfactual policy simulations usingthe estimated model. I found that a 50% decrease in registration costs (e.g. throughgovernment subsidies and/or substantial reduction of administrative steps) doubles theproportion of formal enterprises (through both formalization of informal firms and newformal enterprise creation) and increases aggregate income by 15%. Interestingly, totaltax revenues net of the foregone registration fees increase by more than twice. Counter-factual results on tax policy uncover a Laffer curve where the optimal tax rate, estimatedat 24% (i.e. about half of the current tax rate) generates 30% tax revenue gains abovethe current level, twice as much formal enterprises and 20% increase in aggregate in-come. By contrast, while an increase in the enforcement of formality status slightlyincreases the fraction of formal firms and the associated tax revenues, it has a perverseeffect on the economy in terms of enterprise destruction. I also examine the impact ofbusiness training programs as recently reviewed by McKenzie and Woodruff (2014). Theresults indicate that a moderate increase in entrepreneurial skills resulting from businesstraining has a fair impact on entrepreneurship, tax revenues and aggregate income. Puttogether, these results show that important income gains and efficient allocation of skillscan obtain from substantially reducing the cost of registration and optimally choosingthe tax rate while fostering entrepreneurial skills and enterprise creation through busi-ness training and better access to credit. They also show, however, that these policiesalone cannot induce many informal firms to formalize, especially small-scale and lessproductive ones, suggesting that other government measures should be undertaken tomake the formal sector more attractive.
The rest of the paper is organized as follows. Section 2 presents a theoretical modelof occupational choice and derives the main implications. Section 3 presents the data,descriptive statistics and reduced form results. Section 4 presents structural estimates,specification tests and robustness checks. Policy simulations are presented in Section 5and concluding remarks are given in Section 6. The Appendix gathers other technicalmaterial.
2 Model Description
The economy is populated with individuals who differ in their skills θ - distributedaccording to the the CDF G(θ) - and their initial wealth endowment z. They choosetheir occupation at the beginning of the period, based on their expected end-of-periodpayoff. A non-entrepreneurial worker (e.g. wageworker or subsister), receives a fixedearning w at the end of the period. This income is compared to the profits the agentcould receive if they start a firm. Regardless of whether they are formal or informal,
4

an entrepreneur with skill θ uses capital k and hires l units of labor to produce goodsaccording to the technology
y = θkαlβ, (1)
where α, β ∈ (0, 1) are the elasticities of output with respect to capital and labor,respectively. We also have γ = α + β < 1, implying diminishing returns to scale invariable factors at the establishment level (see Lucas 1978).
2.1 Informal Entrepreneurship
Informal entrepreneurship means that the entrepreneur does not pay taxes to the gov-ernment. Tax avoidance comes with a risk of being caught, in which case the informalentrepreneur’s profit is forfeited. Moreover, when operating in the informal sector en-trepreneurs have limited access to credit. In order to get a loan from financial institu-tions, they need to provide collateral as a guarantee. They can therefore only borrowup to a fixed multiple, λ ≥ 1, of their initial wealth, z ≥ 0, that they use as collateral.Denote by p the probability of getting caught. The informal entrepreneur’s optimalinvestment capital and labor then solves the profit maximization problem
maxk,l
{(1− p)
[θkαlβ − wl − rk
]: 0 ≤ k ≤ λz, l ≥ 0
}.
For λ =∞ the credit market is perfect and λ = 1 corresponds to financial autarky, whereall capital is self-financed by the informal entrepreneurs. This specification captures thecommon prediction from models of limited contract enforcement typical of the informaleconomy where the amount of credit is limited by individual wealth.2
The optimization constraint on capital then gives rise to two types of informal en-trepreneurs. Those who are financially unconstrained, i.e., their optimal investmentcapital is an interior solution of the above optimization problem, and those who arefinancially constrained, i.e., their capital constraint is binding. The interior solutions ofthe entrepreneurs maximization problem are
k∗ = θ1
1−γ(αr
) 1−β1−γ
(β
w
) β1−γ
and l∗ = θ1
1−γ(αr
) α1−γ(β
w
) 1−α1−γ
(2)
This solution is feasible only if k∗ is lower than λz, or equivalently
θ ≤ (λz)1−γ( rα
)1−β (wβ
)β≡ θc(z) (3)
2The collateral constraint can be derived from a limited liability problem where at the beginningof the period an individual deposits his wealth z ≥ 0 in the financial intermediary to rent k units ofcapital. If this individual can abscond with this capital with probability 1/λ without any other formof punishment than loosing his collateral z, then in the equilibrium the financial intermediary will rentcapital only to the extent that no individual will renege on the rental contract, implying k ≤ λz.
5

When the constraint is binding the investment capital and optimized labor are given by
k∗∗ = λz and l∗∗ = θ1
1−β
(β
w
) 11−β
(λz)α
1−β .
The optimal informal entrepreneur’s profits can therefore be expressed as follows:
πI(z, θ) =
πIu = (1− p)(1− γ)θ
11−γ
(α
r
) α1−γ(β
w
) β1−γ
if θ ≤ θc(z)
πIc = (1− p)
[(1− β)θ
11−β
(β
w
) β1−β
(λz)α
1−β − λrz
]otherwise.
(4)
The informal entrepreneurs profit takes two possible values according to whether he isunconstrained, that is, θ < θc or he is constrained, that is, θ > θc. The main differencebetween this profit function and the one derived by Nguimkeu (2014) is the inclusionof paid labor in the entrepreneur’s objective. While this might be of relatively lowimportance for informal entrepreneurs of whom very few hire paid labor outside of theirhousehold, hired labor turns out to be a key characteristic of formal firms in the data.
2.2 Formal Entrepreneurship
In order to formalize, entrepreneurs need to pay a registration cost, c(z), that representsboth the license fees and the amount of time and bribes spent to get it. Moreover, atthe end of the period, the government levies a tax τ on the profit of formal enterprises.Their formal status however provides them with a better access to credit from financialinstitutions (see Bruhn 2013, Laporta and Shleifer 2014). I therefore follow the literatureand assume as in de Paula and Scheinkman (2011) (see also Ordonez 2014) that theformal entrepreneurs’ optimal investment capital and labor solves for the optimizationproblem3
maxk≥0,l≥0
{(1− τ)
[θkαlβ − wl − rk
]− rc(z)
}The optimal capital and labor are given by Equations (2) above and yield the followingexpression for the optimal formal entrepreneur’s profit:
πF (z, θ) = (1− τ)(1− γ)θ1
1−γ
(α
r
) α1−γ(β
w
) β1−γ− rc(z). (5)
The cost c(z) is allowed to be decreasing in the wealth z, to reflect the fact that indeveloping countries wealthy people have political influence which they could exercise
3Notice that while the agent pays the one-time entry cost c(z) to formalize his business, his periodicformal profit accounts for an amount of rc(z) instead. This is because c(z) can be seen as the present
value of a sum of periodic payments of rc(z) across the lifetime of the firm, i.e. c(z) =∑∞t=1
rc(z)(1+r)t
,assuming payments begin at the end of the current period.
6

to partially reduce their entry costs to the formal sector (see, e.g., Ayittey 2006 for anextensive discussion and Rossi 2014 for micro-level evidence).
The closest to this model specification is a general equilibrium calibration modelof occupational choice recently presented by Ordonez (2014), but both differ in severaldistinctive ways. First, unlike Ordonez (2014) who assumed away entry registrationcosts into the formal sector, I formally include it in my model consistently with recentevidence showing that these costs are relatively much higher in African countries thanin other regions of the world and are a serious constraint to formal entrepreneurship (seeDjankov et al. 2002, World Bank 2005, Klapper et al. 2006, and the descriptive Table 4below for the Cameroon data). I then empirically show through statistical testing thatfailing to incorporate these costs could seriously undermine the model performance interms of selection into the formal sector of Cameroon. Second, Ordonez (2014) assumedthat there is no financial constraints in the informal sector and that capital is freely op-timized by informal entrepreneurs. These entrepreneurs may however choose to operatewith less than an exogenously fixed amount, but only as a strategy to avoid detection.In contrast, I assume financial constraints in the informal sector and allow for this con-straint to vary across individuals to account for heterogeneity in their initial wealth.This assumption is consistent with empirical works that have examined micro-enterprisefinancing in developing countries (e.g., Paulson et al 2006), and has been empiricallytested by Nguimkeu (2014) with Cameroon data. The model in this paper is also moreflexible than the one discussed by Prado (2011). Unless the probability of detection ishigher than the tax rate, the Prado’s model would deliver a corner solution equilibriumwhere all entrepreneurs prefer the informal sector even with a zero entry cost in theformal sector. This seems inconsistent with data from developing countries where en-forcement is weak and the probability of detection is usually lower than the tax rate, yetboth formal and informal sectors coexist.
The assumption that formal entrepreneurs are not financially constrained in thecredit market is clearly a theoretical simplification. In reality, some degree of financialfrictions exists in the formal sector as well, although at a much lower extent than theinformal sector. However, access to finance is the only true benefit of formalizationwithin the model (and often also in actual economies) and allows for some importanttheoretical results in the paper to concur with the data, in particular the dominance offormal entrepreneurship by sufficiently high entrepreneurial ability.4
2.3 Occupational Choice
Each individual knows his personal attributes θ and z, market characteristics r and wand institutional factors τ , p and c(z), where it is assumed that τ > p, as commonlyobserved in developing countries. Given these factors, the agent chooses the occupation
4Trying to estimate a leverage parameter in the formal sector turned out to be infeasible, given thealready large dimensionality of the problem.
7

that would give him the maximum earning. In other words, the expected profit functionof an agent with characteristics (z, θ) from the three categories of occupations can bewritten as
π(z, θ) = max{w, πI(z, θ), πF (z, θ)
}Figure 1: Earning Functions and Occupations
0 5 10 15 20
!20
0
20
40
60
80
100
120
w
!F(")
""c
"w "
F
!, w
!I(")
InformalEntrepreneurs
Workers
FormalEntrepreneurs
Student Version of MATLAB
Earnings functions and related occupational choice are illustrated in Figure 1. Theagent’s decision is characterized by three thresholds, θW , θF and θc, which summarizethe occupational decisions of the agents and whether the capital choices of informalentrepreneurs are constrained or unconstrained. The threshold θc is the one given inEquation (3). As for θW , notice that entrepreneurs profits are increasing with θ whileworkers’ earnings do not vary with θ. It follows that there exists an ability threshold θWsuch that w = max
{πI(z, θW ), πF (z, θW )
}. Hence, all agents with θ < θW become work-
ers and the rest become entrepreneurs. Finally, note that informal entrepreneurs withinitial wealth z cannot operate with capital above λz. This constraint is more costly forhigher skilled entrepreneurs as they would prefer larger scale firms given their high pro-ductivity. Hence, there exists an ability threshold θF , such that πI(z, θF ) = πF (z, θF ),above which all entrepreneurs prefer the formal sector and the rest the informal sector.These results are summarized as follows.
Proposition 1. Consider an agent with characteristics θ and z. There exist three criticalentrepreneurial ability thresholds θW (z), θc(z) and θF (z), with θW (z), θc(z) < θF (z),such that
(i) If θ < θW (z) the agent chooses to be a wageworker
8

(ii) If θW (z) ≤ θ < θF (z) the agent is an informal entrepreneur. In particular, whenθW (z) ≤ θ < θc(z) he is an unconstrained informal entrepreneur, and when θc(z) ≤θ < θF (z) he is a constrained entrepreneur.
(iii) If θ ≥ θF (z) the agent is a formal entrepreneur.
Proof. See Appendix.
Whether or not an informal entrepreneur is constrained is a key determinant for hisprospects to eventually formalize. Clearly, as long as the tax rate τ is higher than theenforcement p, unconstrained informal entrepreneurs will not formalize, regardless ofthe entry cost c(z). Hence, inducing formality from registration reforms would mainlytarget only constrained entrepreneurs and high skilled workers. In contrast, businesstraining might induce both types of informal entrepreneurs to formalize as well as lowskilled workers. The nature of the selection to the different types of occupations is il-lustrated in Figure 2. This figure depicts a partition of the wealth-ability space that
Figure 2: Charaterization of Occupations
��� ��0
�
FormalEntrepreneurs
Constrained InformalEntrepreneurs
Unconstrained InformalEntrepreneurs
Workers
�
�=�F(z)
�=�c(z)
�=�W(z)
�lW
�uW
forms the basis of the structural estimation discussed in Section 4. Note again how theimplications derived here significantly differ from Ordonez (2014) and other authors. Inparticular, consistent with empirical evidence both constrained and unconstrained in-formal entrepreneurs always coexist in my model (see Figure 2). In contrast, Ordonez(2014) model implies the existence of a corner solution equilibrium where all informalentrepreneurs are constrained.
Total demand for labor from both formal and informal entrepreneurs must equal thesupply of labor from workers to generate the labor market equilibrium that the wage w
9

is required to satisfy:∫ θF
θW
lI(θ, w)dG(θ) +
∫ ∞θF
lF (θ, w)dG(θ) =
∫ θW
0dG(θ), (6)
where lI = l∗1[θ < θc] + l∗∗1[θ > θc] and lF = l∗. The left hand side of Equation (6) isdecreasing in w and the right hand side is increasing in w. Moreover, when w tends to0, the left hand side exceeds the right hand size, and when w tends to ∞, the oppositeholds. The existence and unicity of an equilibrium wage then follows from the continuityof these functions. This equilibrium wage is sensitive to the various policies discussedin Section 5, as these policies indirectly affect the labor supply and labor demand curves.
Finally, the model also provides a ground to examine how earning differences betweenoccupations may be related to skills and wealth. Three comparative payoff functions canbe considered to examine the agent’s decision-making. The earning difference betweennon-entrepreneurial work and informal entrepreneurship is characterized by the compara-tive payoff function V W,I(z, θ) = πI(z, θ)−w; the difference between non-entrepreneursand formal entrepreneurs earnings characterized by V W,F (z, θ) = πF (z, θ) − w; andthe difference between informal entrepreneurs and formal entrepreneurs earnings char-acterized by V I,F (z, θ) = πF (z, θ) − πI(z, θ). Note that since ∂c(z)/∂z ≤ 0 and∂πI(z, θ)/∂z ≥ 0, the sign of ∂V I,F (θ, z)/∂z is ambiguous and is therefore left for em-pirical examination in the next section. The unambiguous properties of the comparativefunctions are illustrated in Figure 3 and summarized in the following proposition.
Proposition 2. Consider agents with characteristics θ and z. Then
(i) The functions V W,I(θ, z) and V W,F (θ, z) are increasing in θ and z.
(ii) The function V I,F (θ, z) is U -shaped in θ. That is, there exists θm > 0 such that
∂V I,F (θ, z)
∂θ< 0 ∀θ ∈ [0, θm), and
∂V I,F (θ, z)
∂θ≥ 0 ∀θ ∈ [θm,∞)
Proof. See Appendix.
This result states that while the decision of a worker to start a firm is increasing intalent, the decision of an informal entrepreneur to formalize is non-monotonic. In fact,this decision function is U-shaped in entrepreneurial skills (see Figure 3). It implies thatlow ability entrepreneurs find it more profitable to remain informal as their level of skillsincreases. This is especially true for unconstrained informal entrepreneurs who have noincentive to formalize. However, above a certain ability threshold formality becomes in-creasingly attractive for increasing levels of skills, because entrepreneurs with such skillswould want to operate at a larger scale but would be constrained in the informal sector.
Consistently with a large strand of the labor market literature (e.g. Magnac 1991,Maloney 1999, Pratap and Quentin 2006), this framework assumes that labor is free to
10
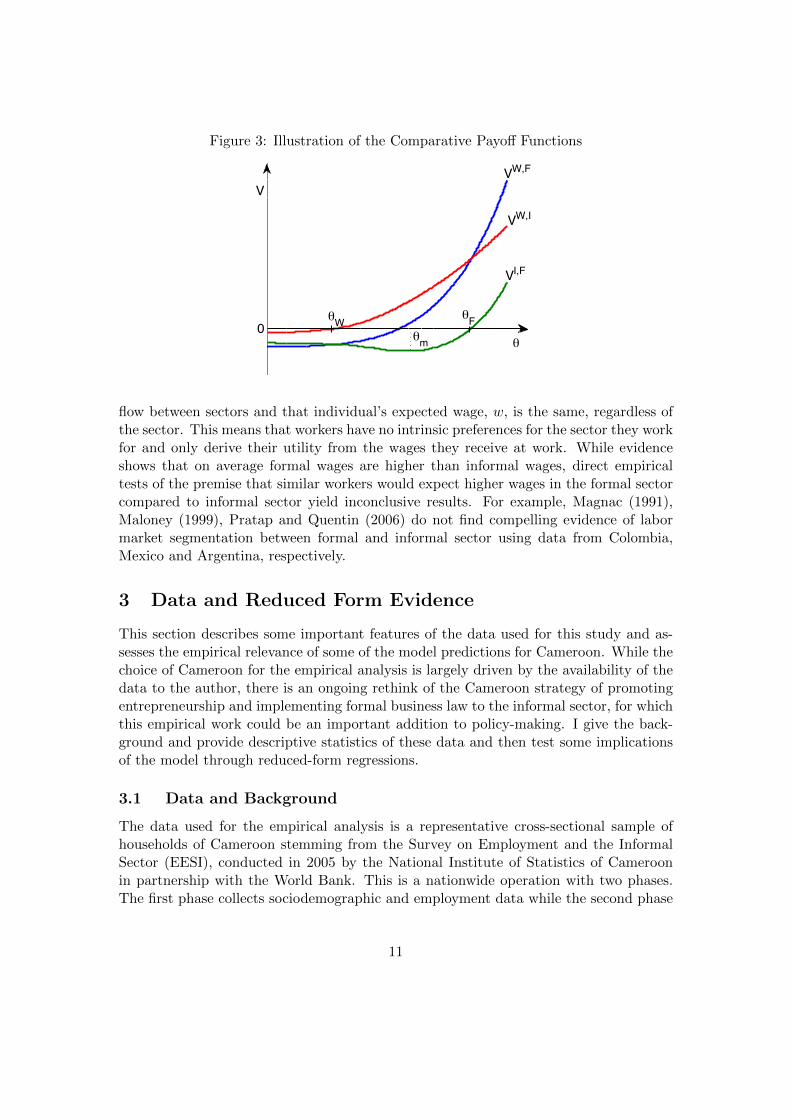
Figure 3: Illustration of the Comparative Payoff Functions
0!W
!m
VW,F
!F
!
VW,I
VI,F
V
Student Version of MATLAB
flow between sectors and that individual’s expected wage, w, is the same, regardless ofthe sector. This means that workers have no intrinsic preferences for the sector they workfor and only derive their utility from the wages they receive at work. While evidenceshows that on average formal wages are higher than informal wages, direct empiricaltests of the premise that similar workers would expect higher wages in the formal sectorcompared to informal sector yield inconclusive results. For example, Magnac (1991),Maloney (1999), Pratap and Quentin (2006) do not find compelling evidence of labormarket segmentation between formal and informal sector using data from Colombia,Mexico and Argentina, respectively.
3 Data and Reduced Form Evidence
This section describes some important features of the data used for this study and as-sesses the empirical relevance of some of the model predictions for Cameroon. While thechoice of Cameroon for the empirical analysis is largely driven by the availability of thedata to the author, there is an ongoing rethink of the Cameroon strategy of promotingentrepreneurship and implementing formal business law to the informal sector, for whichthis empirical work could be an important addition to policy-making. I give the back-ground and provide descriptive statistics of these data and then test some implicationsof the model through reduced-form regressions.
3.1 Data and Background
The data used for the empirical analysis is a representative cross-sectional sample ofhouseholds of Cameroon stemming from the Survey on Employment and the InformalSector (EESI), conducted in 2005 by the National Institute of Statistics of Cameroonin partnership with the World Bank. This is a nationwide operation with two phases.The first phase collects sociodemographic and employment data while the second phase
11

interviews a representative subsample of informal production units identified during thefirst phase. The methodology of the EESI is therefore similar to that of Phases 1 and 2 ofthe well-known “1-2-3 surveys” in West Africa (details can be found at www.afristat.org).For the analysis, I restrict the sample to households whose heads are active and are aged15 and above, representing a total of 6112 observations. The definition of informalityused for the EESI survey is on the basis of administrative records and on whether ornot the business keeps formal accounts. Accordingly, informal enterprises are defined as“production units that do not have written formal accounts and/or are not registeredwith the tax authorities.” Informal sector workers are therefore persons exercising theirmain economic activities in informal establishments. The informal sector accounts forthe vast majority of activities and employs 89.5% of the Cameroon workforce aged 15and above (INS 2005). The sample used in this study consists of 4337 households fromthe Informal sector and 1775 households from the formal sector, based on the abovedefinition.
3.2 Descriptive Statistics
The average age of household heads is 36.2 years, 48.1% of which have a primary ed-ucation, 36.5% a secondary education and 15.4% a tertiary education. The empiricalanalysis requires distinguishing entrepreneurs from non-entrepreneurs according to theiractivity. While this distinction is clearer in the formal sector, it is not so obvious in theinformal sector. For the formal sector, the classic literature of entrepreneurial choice,which I follow, considers self-employment or business ownership as formal entrepreneur-ship (e.g., Evans and Jovanovic, 1989; Holtz-Eakin et al. 1994, Blanchflower and Oswald1998). However, in the informal sector, where the majority of people are self-employed,using the same definition would be seriously misleading in this context. In fact, self-employment in the informal sector includes both the actual informal entrepreneurs aswell as a wide category of subsisters. To distinguish between these activities, I followNguimkeu (2014) and define as informal entrepreneur a household that owns a businessand employs others (see also Mondragon-Velez and Pena 2010, for a similar defini-tion). This definition particularly excludes purely self-employed (i.e. those who workjust by themselves) most of which are subsisters.5 Examples of informal entrepreneursinclude taxi-drivers, grocers, tailors, carpenters, car mechanics who own shops, etc.Non-entrepreneurial workers are all other types of households including wage-earnersemployed by formal firms, informal firms or households as well as all the subsisters.
Table 1 summarizes the main characteristics of households in the sample accord-ing to their occupation (formal entrepreneurs, informal entrepreneurs, workers). The
5Exceptions are some activities that use high capital but are restricted to a single operator, such astaxi-drivers who own their taxi. This definition is obviously still not perfect. On the one hand, it wouldbe inadequate to consider as entrepreneurs some employers who operate at a very low scale. On theother hand, even a purely self-employed with low physical capital could produce innovative products orservices such that considering it as subsistence is misleading. Such cases are however infrequent in thesedata as evidenced by the sensitivity analyses performed in Nguimkeu (2014).
12
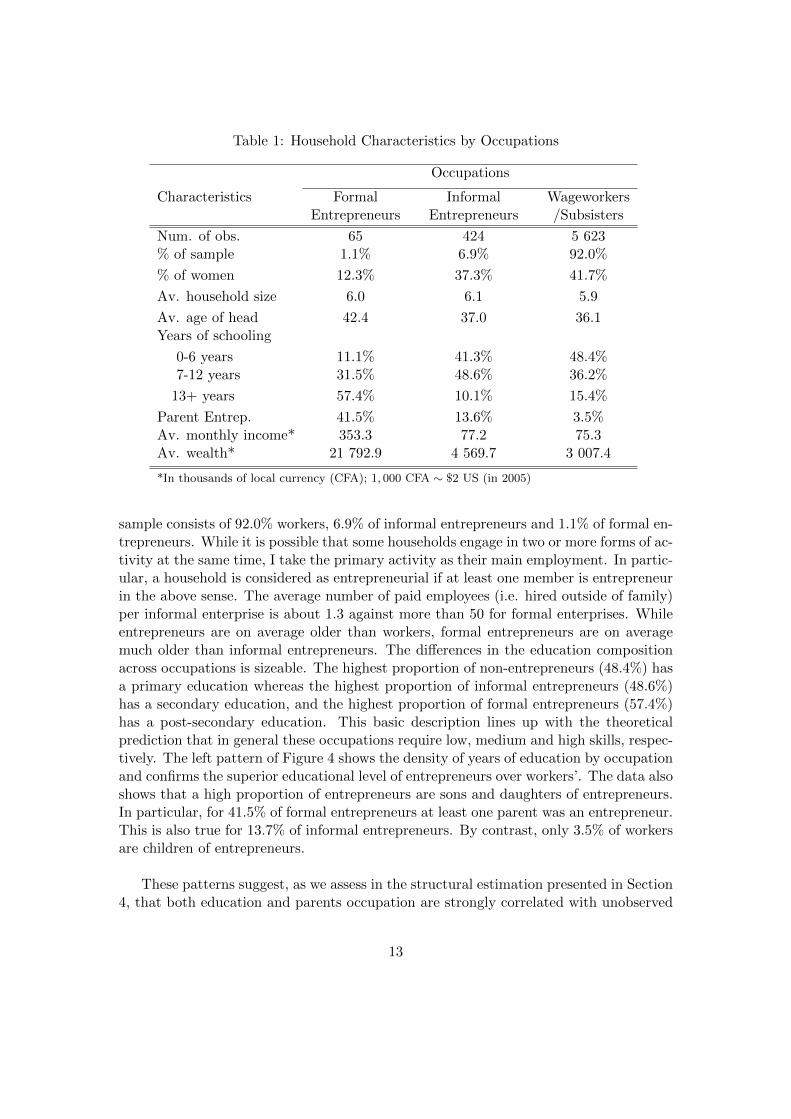
Table 1: Household Characteristics by Occupations
Occupations
Characteristics Formal Informal WageworkersEntrepreneurs Entrepreneurs /Subsisters
Num. of obs. 65 424 5 623% of sample 1.1% 6.9% 92.0%
% of women 12.3% 37.3% 41.7%
Av. household size 6.0 6.1 5.9
Av. age of head 42.4 37.0 36.1Years of schooling
0-6 years 11.1% 41.3% 48.4%7-12 years 31.5% 48.6% 36.2%
13+ years 57.4% 10.1% 15.4%
Parent Entrep. 41.5% 13.6% 3.5%Av. monthly income* 353.3 77.2 75.3Av. wealth* 21 792.9 4 569.7 3 007.4
*In thousands of local currency (CFA); 1, 000 CFA ∼ $2 US (in 2005)
sample consists of 92.0% workers, 6.9% of informal entrepreneurs and 1.1% of formal en-trepreneurs. While it is possible that some households engage in two or more forms of ac-tivity at the same time, I take the primary activity as their main employment. In partic-ular, a household is considered as entrepreneurial if at least one member is entrepreneurin the above sense. The average number of paid employees (i.e. hired outside of family)per informal enterprise is about 1.3 against more than 50 for formal enterprises. Whileentrepreneurs are on average older than workers, formal entrepreneurs are on averagemuch older than informal entrepreneurs. The differences in the education compositionacross occupations is sizeable. The highest proportion of non-entrepreneurs (48.4%) hasa primary education whereas the highest proportion of informal entrepreneurs (48.6%)has a secondary education, and the highest proportion of formal entrepreneurs (57.4%)has a post-secondary education. This basic description lines up with the theoreticalprediction that in general these occupations require low, medium and high skills, respec-tively. The left pattern of Figure 4 shows the density of years of education by occupationand confirms the superior educational level of entrepreneurs over workers’. The data alsoshows that a high proportion of entrepreneurs are sons and daughters of entrepreneurs.In particular, for 41.5% of formal entrepreneurs at least one parent was an entrepreneur.This is also true for 13.7% of informal entrepreneurs. By contrast, only 3.5% of workersare children of entrepreneurs.
These patterns suggest, as we assess in the structural estimation presented in Section4, that both education and parents occupation are strongly correlated with unobserved
13

Figure 4: Distribution of Education and Earnings by Occupation
0 5 10 15 20 250
0.02
0.04
0.06
0.08
0.1
0.12
0.14
Years of Education
Formal Entrepreneurs
Informal Entrepreneurs
Workers
Student Version of MATLAB
0 200 400 600 8000
0.005
0.01
0.015
0.02
Earnings
Formal Entrepreneurs
Informal Entrepreneurs
Workers
Student Version of MATLAB
entrepreneurial ability. On average, entrepreneurs also earn more than workers. Consis-tent with the distribution of years of education the right panel of Figure 4 shows thatwhile the earning distribution of informal entrepreneurs slightly dominates the workersearning distribution, formal entrepreneurs’ earnings are largely above these two.
Figure 5: Distribution of Log Initial Wealth by Occupation
0 5 100
0.05
0.1
0.15
0.2
0.25
0.3
0.35
0.4
0.45
Log Initial Wealth
Formal Entrepreneusr
Informal Entrepreneurs
Workers
Student Version of MATLAB
As explained in the theory, initial wealth plays a key role in determining the amountof capital that a household is able to borrow from financial institutions. While the surveydoes not report households ex-ante total wealth, there are retrospective questions abouthousehold belongings acquired prior to starting their activity. I use this informationto build a measure of household initial wealth by computing the net market value of
14

their total initial belongings.6 This measure of wealth is positively correlated withvarious measures of the quality of habitat, confirming its validity.7 Figure 5 showsthe distribution of log initial wealth by occupation. Clearly, entrepreneurs are initiallywealthier than workers, as the bulk of the distribution is more concentrated on highervalues of the wealth range.
3.3 Regression Analysis
In this section, I use the Cameroon data to test some of the model predictions. I examinehow entrepreneurship and informality is affected by financial constraints and observableentrepreneurial skills. In particular, I consider to what extent the likelihood of starting aformal or an informal business is related to education, parent occupation (both of whichare likely to be correlated with business skills as suggested by the descriptive statis-tics), and household initial wealth. Table 2 summarizes results from probit regressionsof occupational choice. The first panel (Informal Entr. vs. Formal Entr.) presents thechoice between informal entrepreneurship and formal entrepreneurship, the second panel(Workers vs. Formal Entr) between non-entrepreneurial work and formal entrepreneur-ship, and the third panel (Worker vs. Informal Entr) between non-entrepreneurial workand informal entrepreneurship. For each set of regressions, Column (1) presents thebaseline estimation while Column (2) includes a quadratic term for education to assessa possible non-monotonic effect of observable skills as implied by the theory, see Propo-sition 2(ii). Each regression also controls for several other variables such as maritalstatus, urban/rural dummies, physical disability (not reported). Consistent with thetheory, the results confirm that observable skills such as education are critical for formalentrepreneurship. The baseline results show that education is positively and signifi-cantly associated with the probability of formal entrepreneurship. Interestingly, whena quadratic term for education is added in the regressions, the associated coefficient issignificantly positive in the first panel while the initial coefficient becomes negative (seeColumn (2) of the first panel), and this result remains robust even when controlling forvarious other regressors. This confirms that the choice between informal and formalentrepreneurship is non-monotonic and U-shaped in skills as suggested by the theory.However, the quadratic term is insignificant in the remaining panels and its inclusiondeteriorates the fit of the choice probability between wagework and formal entrepreneur-ship (according to the Akaike Information Criterion - AIC). The U-shaped probability offormalizing obtained in Column (2) of the first panel implies a turning-point estimatedat 13.4 years of schooling above which informal entrepreneurs are increasingly likely toformalize. This result is consistent with the descriptive statistics presented in Table 1and the distribution of years of education depicted in Figure 4.
6These belongings are household durable goods including vehicles, TVs, radios, DVD/CD players,fridges, freezers, gas cookers, fans, sewing machines, mobile phones, computers, electric irons, numberof houses owned by the household. A better proxy for initial wealth would have been the amount ofinherited wealth as in Blanchflower and Oswald (1998). But this information is not available.
7In the survey, the quality of the habitat is assessed by reporting the type of housing, the type ofwalls, roof and floor material of the house, and access to clean water.
15

Table 2: Probit Estimates - Choice between Occupations
Variable Informal Entr. Worker vs. Worker vs.vs. Formal Entr . Formal Entr. Informal Entr.
(1) (2) (1) (2) (1) (2)
Intercept -3.853*** -3.129*** -3.555*** -3.571*** -1.529*** 1.789***(0.483) (0.564) (0.249) (0.354) (0.078) (0.094)
Education 0.149*** -0.231* 0.046*** 0.050 -0.006 0.087(0.029) (0.016) (0.015) (0.056) (0.005) (0.079)
Education2/100 - 0.863** - -0.017 - -0.616- (0.426) (0.256) - (0.412)
Parent 1.770*** 1.765*** 0.435*** 0.434*** 0.713* 0.693*(0.271) (0.269) (0.128) (0.128) (0.411) (0.411)
Wealth 0.302*** 0.288*** 0.310*** 0.003*** 0.090*** 0.113***(0.060) (0.061) (0.033) (0.000) (0.026) (0.027)
Wealth2 - 0.288*** - 0.003*** - 0.113***- (0.061) - (0.000) - (0.027)
Experience 0.040*** 0.039*** -0.003 -0.003 0.000 0.002(0.015) (0.015) (0.008) (0.007) (0.003) (0.003)
Female -0.256 -0.213 -0.308* -0.308* -0.153*** -0.169***(0.275) (0.273) (0.169) ( 0.169) (0.053) (0.053)
Number of Obs. 489 489 5688 5688 6047 6047AIC 194.43 192.54 506.37 508.37 3005.3 2974.5
Notes. In the first panel (Informal Entr. vs. Formal Entr.) the dependent variable is 1 if an individual isa formal entrepreneur and 0 if he is an informal entrepreneur; in the second panel (Workers vs. FormalEntr) the dependent variable is 1 if an individual is a formal entrepreneur and 0 if he is a worker; andin the third panel (Worker vs. Informal Entr) the dependent variable is 1 if an individual is an informalentrepreneur and 0 if he is a worker. Standard errors are in parenthesis.
In contrast, the association between education and the choice probability betweennon-entrepreneurial work and informal entrepreneurship is insignificant. This resultmight arise from two conflicting effects due to the coexistence of both extremely loweducated individuals and extremely highly educated individuals among workers, com-pared to a more homogenous average educated group of Informal Entrepreneurs. Theseheterogenous workers may then be driving the regression coefficient in opposite direc-tions, resulting in an insignificant effect. This intuition is confirmed by the results inTable 3 showing the output of the probit regression of the choice between wagework andinformal entrepreneurship performed on two subgroups of workers: those with educationbelow the sampling median of 7 years of schooling (denoted Low Skills) and those witheducation above this sampling median (denoted High Skills). The coefficient on Parentis positive and significant in all regressions, implying that individuals whose parentswere entrepreneurs are more likely to become entrepreneurs compared to others. This
16

Table 3: Probit Estimates - Choice between Wagework and Informal Entrepreneurship
Variable High Skills Low Skills(1) (2) (1) (2)
Intercept 1.301*** 5.402*** -2.503*** -1.757***(0.151) (0.406) (0.111) (0.112)
Education -0.260*** -0.270*** 0.223*** 0.346***(0.013) (0.070) (0.012) (0.039)
Education2/100 - 3.812 - -2.645- (2.981) - (5.221)
Parent 0.739* 0.766* 0.687* 0.656*(0.432) (0.439) (0.405) (0.406)
Initial Wealth 0.011*** 0.014*** 0.018*** 0.018***(0.003) (0.003) (0.004) (0.004)
Experience 0.002 -0.001 0.007** 0.006**(0.005) (0.005) (0.004) (0.003)
Female -0.230*** -0.227*** -0.202*** -0.154**(0.071) (0.076) (0.064) (0.068)
Number of Obs. 3114 3114 3357 3357AIC 659.46 834.85 569.65 848.54
Notes. The dependent variable is 1 if an individual is an informal entrepreneur and 0 if he is a worker.Standard errors are in parenthesis.
suggests that children of entrepreneurs may have received informal business skills fromtheir parents. This evidence has been supported by a number of empirical studies suchas Lentz and Laband (1990) and Parker and Van Praag (2012). Finally, the results showthat the coefficient of initial wealth is significantly positive in all the regressions. Inparticular, the probability of becoming entrepreneur increases with initial wealth. Thisresult suggests that initial wealth determines the amount of capital required to starta business, thus reinforcing the evidence of important financial constraints. However,although the construction of the initial wealth variable includes only assets acquired sev-eral years before the current occupational choice, there may still be some endogeneityin this measure, given that some unobserved factors may have driven both the initialsaving rate and the current occupation. These regression results should therefore beunderstood as suggestive evidence provided by conditional correlations rather than purecausal effects.
4 Structural Estimation
In this section, I estimate the model by maximum likelihood. What is fitted is theprobability of being formal entrepreneur, informal entrepreneur or non-entrepreneurial
17

worker as a function of wealth and ability generated by the model with the actualhousehold occupational status from the data. The goal is to produce structural estimatesthat allow to examine the content of the mechanisms implied by the theoretical modeland to use the estimated model in counterfactual simulations to quantify the impact ofrelevant policies on entrepreneurship and informality.
4.1 Estimation Technique
While the initial wealth, z, is observable, the individual ability, θ, is not observable bythe econometrician. Following previous studies, I make the structural assumption thatability depends on personal characteristics such as education and parent occupation
ln θ = δ0 + δ1s+ δ2P + ε (7)
where s = ln(1 + S) is the log of years of schooling S, P is a dummy indicatingwhether at least one parent was an entrepreneur. In this baseline specification cur-rent entrepreneurial ability is assumed independent from initial wealth. But I relax thisassumption in the robustness checks to allow for entrepreneurial skills to be correlatedwith wealth. I also assume a log linear specification for the registration cost functiondefined by
c(z) = c0 exp(−c1z), (8)
where c0 > 0 is an exogenous fixed cost (determined in Section 4.2) and c1 ≥ 0 is an elas-ticity to be estimated. There are three categories of agents observed in the data: Formalentrepreneurs, (F = 1, I = 0,W = 0), Informal entrepreneurs (F = 0, I = 1,W = 0)and non-entrepreneurial workers (F = 0, I = 0,W = 1). Denote by X = [1 s P z] thevector of observable covariates and by 1[·] an indicator function that takes the value onewhen its argument is true and zero otherwise.
Given the model predictions, the probability of formal entrepreneurship is
Pr[F = 1|X] = Pr[θ > θF (z)] = 1− Φ
{ln θF (z)− δ0 − δ1s− δ2P
σ
}= HF (ψ,X) (9)
where ψ denotes the vector of all structural parameters of the model and θF (z) is givenby Equation (16) in the appendix.8
8Note that unlike in a standard probit model, the standard error σ is identifiable at least because ofthe nonlinearity of the model in the parameters.
18

The probability of non-entrepreneurial activity is given by
Pr[W = 1|X] = Pr [θ ≤ θW (z)] = Pr [θ ≤ θuW (z)]1 [z ≤ z∗∗] + Pr[θ ≤ θlW
]1 [z ≥ z∗]
+ Pr [θ ≤ θmW (z)]1 [z∗∗ ≤ z ≤ z∗]
= Φ
{ln θuW (z)− δ0 − δ1s− δ2P
σ
}dui (z) + Φ
{ln θlW − δ0 − δ1s− δ2P
σ
}dli(z)
+ Φ
{ln θmW (z)− δ0 − δ1s− δ2P
σ
}(1− dui (z)− dli(z)
)= HW (ψ,X)
(10)where dui (z) = 1 [z ≤ z∗∗] and dli(z) = 1 [z ≥ z∗]. The thresholds ability levels θuW (z),θmW (z) and θlW are given by Equation (14) in the appendix, while z∗ and z∗∗ are respec-tively given by Equations (13) and (15) in the appendix.
The probability of informal entrepreneurship is then obtained by
Pr[I = 1|X] = 1−Pr[F = 1|X]−Pr[W = 1|X] = 1−HF (ψ,X)−HW (ψ,X) = HI(ψ,X).(11)
Given a sample of independent observations of size n, {(Fi, Ii,Wi, Xi), i = 1, . . . , n},the log-likelihood function of the econometric model can therefore be written as:
Ln(ψ) =
n∑i=1
[Fi lnHF (ψ,Xi) + Ii lnHI(ψ,Xi) +Wi lnHW ] (12)
where Fi, Ii and Wi are zero-one indicator variables for the observed occupational choiceof household i, and Xi is the vector of their observable characteristics as defined above.Both the interest rate r and the wage rate w are exogenously fixed at their observedaverages. The maximum likelihood estimation is therefore performed over the set ofparameters ψ = [δ0, δ1, δ2, α, β, σ, λ, c1]. These parameters correspond respectively tothe constant term of the ability distribution, δ0; the interaction between education andability, δ1; the interaction between parents occupation and ability, δ2; the productivityof capital in the production technology, α; the productivity of labor in the productiontechnology, β; the standard deviation of the ability distribution, σ; the degree of financialfriction, λ; and the elasticity of entry costs to initial wealth, c1. With the given observa-tions, maximization routines can be used to search for the maximum numerically. Thestandard errors of the estimated parameters can be computed by bootstrap methodsusing draws of the original sample with replacement. Details about the maximizationalgorithm are presented in the Appendix.
4.2 Institutional Parameters
There are three exogenous institutional parameters entering the model: the tax rate τ ,the entry cost c0, and the probability of detection, p. Table 4 provides useful informationthat may help to set the values for some of these parameters. In particular, the total
19

Table 4: Characteristics of the Institutional Environment
Indicator Starting Indicator Payinga Business Taxes
Number of procedures 12 Number of payments/year 44Number of days 37 Number of days 90Registration fees (% GNI/capita) 182.5 Total tax rate (% profit) 48.9Min. capital (% GNI/capita) 232.0
GNI per capita = $640 ≈ CFA 320, 000 Source: Doing Business in 2005
tax rate as a percentage of enterprise profit is readily available and fixed at τ = 48.9%as per the measurements of the World Bank’s Doing Business Survey (2005).
For the fixed entry cost to formality, I take the registration fees estimated by DoingBusiness (2005) which I top up by the foregone income incurred during the days spentin the registration office for the procedures. That is,
c0 = Registration Fees + Number of days×Average daily Earnings
From Table 4 the registration fee can be calculated at CFA 582, 400, the number of daysfor the registration procedure is 37, and the average daily earnings in our data is mea-sured at CFA 3, 200. Hence, the parameter c0 is exogenously fixed at c0 = CFA 700,800≈ $1, 402. Note that this is still an underestimation of the actual fixed cost since it doesnot account for the amount of bribes, which De Soto (1989) has shown to be significant.Nevertheless, it is already quite high as it represents about 75% of the average yearlyprofit of informal entrepreneurs in Cameroon (see Table 1 ).
However, the probability of detection p is not directly available from the data. Inorder to approximate it, I use information on the number of tax inspections and thelevel of corruption in the country. Since inspections are on-site, the probability of beingin trouble with tax authorities can be proxied by the ratio of the total number of taxinspections over the total number of firms. This should however be deflated by the degreeof integrity of tax inspectors. Thus, I calculate the probability p of getting caught andforfeiting the firm’s profit by
p =Total number of tax inspections
Total number of firms×Degree of Integrity of tax inspectors.
The total number of tax inspections is obtained by multiplying the number of tax in-spectors (proxied by the size of the tax department of the Ministry of Finance) by thenumber of per-period inspections (all available in the Cameroon Statistical Yearbook,at www.statistics-cameroon.org). The total number of businesses with fixed locationswas measured during the 2009 General Enterprise Census. Finally, I use the CorruptionPerception Index (CPI) produced by Transparency International as a measure of theintegrity of tax authorities in Cameroon. The CPI is a score that indicates the perceived
20

level of public sector corruption on a scale of 0 (highly corrupt) to 100% (very clean)(see www.transparency.org for details). The ratio of tax inspections to the number offirms is calculated at 0.0356 whereas the CPI for Cameroon is 0.22. These measuresimply a detection probability of p = 0.78%.9
4.3 Structural Results
The results of the maximum likelihood estimation of the baseline model are presentedin Table 5, Column (1). The estimated correlation between entrepreneurial ability andeducation, δ1 is estimated at 0.4, implying that a 10 percent increase in the amount ofschooling increases entrepreneurial ability by 4 percent. This suggests that educationmay be a reasonable indicator of entrepreneurial talent in Cameroon. Having a parentwho was an entrepreneur is also an important factor, since the estimated coefficient thatrelates parent occupation and entrepreneurial ability, δ2, is positive and significant. Inthe second column, the estimated correlation between entrepreneurial ability and assetsis statistically insignificant. Thus we can reject the hypothesis that our measure of initialwealth is a positive proxy for entrepreneurial ability. Moreover, the inclusion of initialwealth in the log talent specification deteriorates the model fit (see the discussion in Sec-tion 4.4 below). An important finding is that there are binding capital constraints. Thedegree of financial friction, λ, is estimated at 11.4 meaning that total initial investmentcan be up to 11.4 times the value of initial wealth. The implication for borrowing con-straints should, however, be understood with caution. It does not necessarily mean thatagents can borrow up to 10.4 times the value of their wealth. In the data, about 90% ofthe total initial business investment of informal entrepreneurs came from personal sav-ings, gifts and transfers from family, relatives and ROSCAs (rotating saving and creditassociations). Loans from commercial banks and other financial institutions representedthe remaining 10%. Thus the above multiplier should be discounted by about 10% toget a better sense of the degree of borrowing constraints.10
The estimates of α and β mean that a 10 percent increase in the capital devoted toa business leads to a 2.2 percent increase in output, while a 10 percent increase in hiredlabor increases output by 4.5 percent, respectively. Since returns to capital are usuallyhigh in the informal sector (e.g. Udry and Anagol 2006, De Mel et al. 2008) it must bethat the estimated value of α obtained here is pinned down by firms of the formal sectorwhere returns to capital turn out to be very low in most studies (e.g., Alby, Auriol andNguimkeu 2014). For the labor returns coefficient β, on the one hand most informal firmsproduce output without hiring labor out of their household (corresponding to β = 0);and on the other hand, formal firms output are more elastic to labor (corresponding toβ attending values as high as 0.85 as in Olley and Pakes 1996). The average thereforereasonably falls within the estimated range of 0.45. The elasticity of entry costs to initial
9While these values of institutional parameters may be imperfect, the simulations performed in Section5 allow to examine the sensitivity of the results for a wide range of possible values.
10The main reasons evoked for this low involvement in borrowing through financial institutions arehigh transaction costs, high interest rates and excessive collateral requirements.
21

Table 5: Structural Maximum Likelihood Estimates of the Model
Estimate
Parameter Name (1) (2) (3)
Log Ability Parameters
Constant δ0 -2.8372 -3.0314 1.755(0.0118) (0.0980) (0.1801)
Education δ1 0.4013 0.4270 0.3207(0.0210) (0.0118) (0.0550)
Parents δ2 0.0241 0.0252 -0.2664(0.0079) (0.0118) (0.3061)
Wealth δ3 . . . 0.0186 0.1706. . . (0.0214) (0.0153)
Stand. Deviation σ 2.4610 2.2692 3.2951(0.0380) (0.0330) (0.0151)
Technology and Constraints
Capital share α 0.2201 0.2252 0.232(0.059) (0.028) (0.031)
Labor share β 0.4502 0.4702 0.4506(0.092) (0.022) (0.049)
Capital constraint λ 11.417 10.624 7.041(3.410) (3.512) (3.620)
Cost parameter c1 0.0007 0.0006 -(0.0004) (0.0005) -
Log-likelihood -1.9602 -1.9692 -2.873
Number of Obs. 6112 6112 6112
Bootstrap standard errors in parenthesis
wealth is significant but very low, estimated at 0.0007.
Before taking the estimated model seriously to a counterfactual policy simulationexercise, it is useful to first examine how well it fits the data. I first check how sensitivethe results are to various specifications of the log entrepreneurial talent and more im-portantly to the omission of registration costs, and also calculate a goodness of fit teststatistic for the empirical model in all these alternative cases.
4.4 Robustness and Goodness-of-fit
A common concern in the entrepreneurship literature is the possible correlation betweeninitial wealth and entrepreneurial ability. For example, to study the relationship between
22

starting a firm and wealth, some authors (e.g., Holtz-Eakin et al. 1994, Blanchflower andOswald 1998) use data on inheritances which are likely exogenous. Lacking such data Imake an effort to control for endogeneity by using assets acquired by households prior tostarting their activity as the initial wealth variable in the model (see also Paulson et al.2006, Nguimkeu 2014). However, the baseline specification given in Equation (7) wherethe unobserved ability distribution is independent of wealth may still be potentiallyproblematic. Here, I discuss the implications of relaxing this assumption by allowinginteraction between ability θ and initial wealth z, that is, ln θ = δ0 + δ1s+ δ2P + δ3z+ ε.The results from re-estimating the model using this specification are given in Column(2) of Table 5. The parameter δ3 is estimated at 0.0186 with a standard error of 0.0214.This indicates a positive but insignificant correlation between ability and the measureof initial wealth. Moreover, with this new specification, the other coefficients do notsignificantly change while the overall likelihood slightly deteriorates. This confirms thatwealth is not acting as a proxy for entrepreneurial talent. Alternative specifications thatexclude the schooling or parent covariates yielded worse likelihoods.
Another concern is to assess how well the model fits the data. First, a comparisonbetween the actual sizes of each occupation with their fitted counterparts shows a closeproximity. While the data features 1.1% of formal entrepreneurs, 6.9% of informalentrepreneurs and 92.0% of workers, the estimated model delivers fitted probabilities of1.3%, 6.8% and 91.3, respectively. Second, a more formal standard statistical maneuverfor performing a specification test is to compare observed and expected values, sincelarge departures between them would seemingly indicate lack of fit. I apply a simplePearson test statistic based on the standardized residuals within each occupation. Thetest is defined by
T =∑J
(nJ − n ¯HJ)2
n¯HJ
=∑J
(∑ni=1
[1(Ji = 1)−HJ(ψ,Xi)
])2∑n
i=1HJ(ψ,Xi), J ∈ {F, I,W},
and has a limiting chi-squared distribution with 2 degrees of freedom under the null ofcorrect model specification. Large values of the statistic would imply that the model isinappropriate. This statistic is computed at 1.906 for the estimated model, that is, ap-value of 0.3856, suggesting that the empirical model is not at odds with the data.
Finally, I assess how the model would perform should the entry registration costs beomitted as in previous studies. Column (3) of Table 5 presents the structural estimatesof the model where the registration costs channel is entirely shut down. The results showthat the estimated coefficients are substantially different from those previously obtainedin Columns (1) and (2), and the likelihood statistic is substantially lower, indicating animportant deterioration of fit. More importantly, the estimated probabilities obtainedin this scenario predict a proportion of 9% for formal entrepreneurs, 3% for informalentrepreneurs and 88% for workers which are far from the actual sizes. The test statisticfor this alternative specification is computed at 57.340, thus rejected by the data at the5% significance level.
23

5 Counterfactual Policy Analysis
In this section, I perform a set of counterfactual experiments to evaluate the impactof several policies on entrepreneurship and informality with the Cameroon data. Theestimated model is considered at the current equilibrium and departures from this ini-tial state are assessed by evaluating discrepancies that may occur from changes in policyparameters due to various possible reforms. In particular, for each policy change, an equi-librium wage rate is computed assuming the same distribution of wealth and the sameexogenously fixed interest rate, and agents make their choices based on these factors.Since the theory suggests that entry costs, taxation, enforcement and entrepreneurialskills are the main drivers of entrepreneurship and formality, the focus of the exercise ison each of these attributes.11
5.1 Registration Reforms
One policy that is becoming very popular in developing countries is the firm registrationreform. The policy consists in substantially reducing the cost of registration and thenumber of procedures required to start a firm (see Bruhn 2013 for details on the Mexicocase). Since the fixed entry cost to formal entrepreneurship is captured by the institu-tional parameter, c0, in the model, the counterfactual experiment consists in examininghow the equilibrium would change should there be a reduction of c0 from the currentlevel to a smaller amount. The policy is thus implemented as
c′0 = c0 − b, 0 ≤ b < c0,
where b represents the decrement in the entry cost implied by the reform.The impact of this registration reform with the Cameroon data within the context
of the model is depicted in Figure 6. The effect is quantified for a range of relativecost decrements, b/c0, starting from 0, the current state as produced by the structuralestimates, to 1, the idealistic state where the entry cost is zero. The left panel of Figure6 shows the variation in the fraction of formal entreprises, informal entreprises and newenterprise creation. As b/c0 increases, the fractions of formal entrepreneurs and new en-terprises increase while the fraction of informal entrepreneurs decreases. In particular,a 50% decrease in registration costs (i.e b/c0 goes from 0 to 0.5) doubles the proportionof formal enterprises, through both formalization of informal firms and new formal en-terprise creation. The right panel of Figure 6 depicts the variation in aggregate incomegains, computed as the total income gain from all sectors and the tax revenue gains, com-puted as the total tax revenues net from the foregone registration fees due to the reform(right vertical axis). Results show that both aggregates increase with decreasing entrycosts. In particular, a 50% decrease in registration costs increases aggregate income by15% and total net tax revenues by more than twice the current amount. These findings
11As found in Nguimkeu (2014) the main impact of Microfinance would be a rise of informal en-trepreneurship. So I do not examine this policy further and refer the reader to this work. A recentreview of microfinance and other financial alternatives in seeding entrepreneurship can be found inBruton, Khavul, Siegel and Wright (2015).
24

Figure 6: Impact of a Registration Reform/Subsidy
b/c00 0.2 0.4 0.6 0.8 1
Prop
ortio
n
0
0.01
0.02
0.03
0.04
0.05
0.06
0.07
0.08
0.09
Formal EntrepInformal Entrep.Enterprise creation
b/c00 0.2 0.4 0.6 0.8 1
Prop
ortio
n
0
0.2
0.4
0.6
0.8
0 0.2 0.4 0.6 0.8 10
2
4
6
8
Aggregate Income gains
Tax Revenue gains
are consistent with empirical results obtained by Bruhn (2013) and Kaplan et al. (2011)about the effect of the “System of Fast Opening of Firms” (SARE) on entrepreneurshipin Mexico. The effects found here are however significantly higher than those generallyfound in Latin America (Bruhn and McKenzie 2014) presumably because, as explainedearlier, entry costs are much higher and the initial size of the formal sector is muchsmaller in African countries.
5.2 Tax Reforms
Given the impressive size of the informal sector, a natural question to ask is whetherthe government is choosing the tax rate in the best possible way. While high taxationmay increase tax revenues and provide the state with the resources necessary to buildlaw enforcement capacity and the capacity to offer some of the benefits of being formal,too much taxation may as well push economic activity out of the formal economy. Here,I investigate the impact of tax reforms on entrepreneurship and informality. Formally, Iassume reductions in tax rates of magnitude d, such that
τ ′ = τ − d, 0 ≤ d < τ.
Figure 7 depicts the effects of variations in tax rates on the economy. The relativereduction in tax rate, d/τ , ranges from 0, the current state, to about 0.8, representingan 80% tax reduction. As one would expect, a decrease in taxes increases the fractionof formal entrepreneurs, both in terms of formalization of informal firms as well as newenterprise creation (see left panel of Figure 7). However, only constrained entrepreneursare affected by this policy whereas unconstrained entrepreneurs remained insensitive totax changes. The more interesting pattern, however, is the evidence of the sub-optimalityof the current tax rate in the Cameroon data as depicted in the right panel of Figure7. The counterfactual results show that taxation rates have the well-known Laffer’sinverted-U impact on government revenues; there exists an optimal tax rate, estimated
25

Figure 7: Impact of a Tax Reduction Policy
d/�0 0.2 0.4 0.6 0.8
Prop
ortio
n
0
0.01
0.02
0.03
0.04
0.05
0.06
0.07
0.08
Formal Entrep.Informal Entrep.Enterprise Creation
d/�0 0.1 0.2 0.3 0.4 0.5 0.6 0.7 0.8
Prop
ortio
n
0
0.5
1
0 0.1 0.2 0.3 0.4 0.5 0.6 0.7 0.80
0.5
Aggregate Income gainsTax Revenue gains
at 24% (i.e. about half of the current tax rate) that generates a maximum tax revenuegains at 30% above the current revenues. At the same time this optimal tax rate inducestwice as much formal enterprises and a 20% increase in aggregate income. These resultsare consistent with those instilled by the SIMPLES tax reduction program implementedin Brazil in 1996 (see Monteiro and Assuncao 2012, Fajnzylber et al. 2011).
5.3 Law Enforcement
While the theoretical literature emphasizes the role of low enforcement as a possiblecause of large informal sector (e.g. Dabla-Norris et al. 2008, de Paula and Scheinkman2011, Ordonez 2014), there is little empirical evidence on the impacts of enforcement onentrepreneurship and firm informality. In this study, I use the structural framework toquantify the effect of increased enforcement in Cameroon as follows.
p′ = p+ e, 0 ≤ e < 1− p,
where e represents increases in the probability of detection. Unlike in the preceding ex-periments, I am unable to compute the costs incurred by enforcing the formality statusin this framework. The enforcement probability increments, e, range from 0, the currentstate, to 0.41 corresponding to the state where the probability of detection is equal tothe tax rate, i.e. 49%. The left panel of Figure 8 shows that contrary to the previ-ous policies, increased enforcement has a net negative impact on enterprises creation.While some informal firms are formalizing, new formal enterprises are not being cre-ated and many informal firms are shutting down. The results show that with increasedenforcement, high productivity informal enterprises formalize while informal firms withlow productivity close down. These results are consistent with experimental evidenceby Andrade et al. (2014) who found that increased inspections can provide up to a 27percentage point increase in the likelihood of formalizing in Belo Horizonte, Brazil.
26

Figure 8: Impact of Law Enforcement
e0 0.1 0.2 0.3 0.4
Prop
ortio
n
-0.01
0
0.01
0.02
0.03
0.04
0.05
0.06
0.07
Formal Entrep.Informal Entrep.Enterprise creation
e0 0.1 0.2 0.3 0.4
-0.1
-0.05
0
0.05
0.1
0.15
0 0.05 0.1 0.15 0.2 0.25 0.3 0.35 0.40
0.02
0.04
Aggregate Income gains
Tax Revenue gains
The counterfactual analysis performed here can also serve as a robustness check forthe calibrated probability of detection p. In fact, approximating the detection probabilityusing the size of the tax department (as a proxy for the number of tax inspectors) isquite optimistic. It could be that the number of inspectors is actually much lower thanthe assumed quantity. Figure 8 shows that for a wide range of reasonable values of p,i.e. between 0 and 0.1, the aggregate outcomes do not change much. This suggests thatthe results should not change much relative to the benchmark calibration in case theestimates for p turned out to be different from the assumed value of 0.78%.
5.4 Business Training
Several studies have found a positive effect of business training on business startups (seeMcKenzie and Woodruff 2014 for a recent review). However, how does such a policyaffect informality? Moreover, what would be the size of the impact of a business trainingprogram on entrepreneurship in the present context? The impact of this policy in themodel can be quantified by allowing individuals’ talent to shift as a result of a businesstraining, that is,
θ′ = θ + η, 0 ≤ η <∞,
where η is the increase in ability inculcated by the training.12 There are several ways tosupport such policy. One could take the form of a government support program like theSmall Business Innovative Research (SBIR) program (Audretsch, Link and Scott 2002),or a program supported by international organizations such as the Start and ImproveYour Business (SIYB) program sponsored by the International Labor Organization. Theimpact is quantified for a range of increments η in ability starting from 0, the currentstate of no business training program then progressively increases in terms of fractionsof the initial average ability level η/θ. The results presented in Figure 9 indicate that
12In this setting, neither can I account for the costs incurred by financing and operating trainingprograms, nor for imperfect take-up.
27

Figure 9: Impact of Business Training Programs
�/�0 0.005 0.01 0.015
Prop
ortio
n
0
0.02
0.04
0.06
0.08
0.1
0.12
0.14
0.16
0.18
Formal Entrep.Informal Entrep.Enterprise creation
�/�0 0.005 0.01 0.015
0
0.1
0.2
0 0.005 0.01 0.0150
0.005
0.01
0.015
Aggegate Income gainsTax Revenue gains
a small increase (from 0 to 1.5% of average talent) in entrepreneurial skills has someimpact on entrepreneurship - mostly through informal enterprise creation - and generatea rather small amount of tax revenues and aggregate income. This result is consistentwith the experimental findings of Klinger and Schundeln (2011) in Central America (ElSalvador, Guatemala, and Nicaragua).
It is not obvious how the above policies compare in terms of relative efficiency. Thefirst two exercises (registration reforms and tax reforms) account for both benefits andcosts, whereas the last two (enforcement and training) merely assume improvement in theexisting institutional setup. The former may therefore give a better sense of the plausiblenet gains from these policies compared to the latter where the associated costs are notcaptured. In comparison to the other exercises, a policy of business training appears tobe quite insignificant in terms of formalization of informal firms and with weaker resultsin terms of aggregate income, for reasonable talent shifts. Also, regardless of the type offormalization policy considered (registration, taxation, or enforcement), none of them,taken individually, is able to induce, for rasonable values of the underlying policy, morethan 30 percent of informal firms to formalize. Even when the net income tax is set to anunlikely rate of 10% or the entry cost is unrealistically set to zero, there are still about20-30 percent of informal firms that would not formalize. These are typically small-scaleand less productive firms that seem to view no net benefits from formalizing. As thesimulations in Figure 8 show, these small enterprises are also the ones most likely to closedown if the law is strongly enforced. In the absence of wagework opportunities for theseindividuals, the government may prefer to leave them operate rather than have themclose down, given the possible high social costs if they end up unemployed otherwise. Inany case, none of these policies are enough on their own and combining them togethershould produce better effects, especially if they are accompagnied by other governmentmeasures that would make the formal sector more attractive.
28

6 Conclusion
The overwhelming importance of informality in African countries poses considerablepolicy challenges in understanding and promoting entrepreneurship. I present a simplestructural model of occupational choice to analyze the role of skills and entry registra-tion costs to the formal entrepreneurial sector, while accounting for other factors suchas financial frictions, taxation and enforcement. The main implications of the modelare first assessed using reduced form estimates of occupational choice between non-entrepreneurial work, informal and formal entrepreneurship with data from Cameroon,an economy where 90% of the labor force operates in the informal sector. The resultsshow that while initial wealth and average education are important factors associatedwith the probability of becoming an informal entrepreneur, higher education and parent’sentrepreneurial status are the main determinants of formal entrepreneurship. Moreover,it is shown, both theoretically and empirically, that the probability of formalizing is U-shaped in skills, with the turning point corresponding to secondary school completion.
To evaluate the contribution of institutional characteristics on the observed occupa-tional patterns, I structurally estimate the theoretical model using maximum likelihoodand check its validity using specification tests and likelihood analysis. I empirically showthat ignoring the critical role of registration costs substantially undermines the modelperformance in terms of selection between formal and informal entrepreneurship. Coun-terfactual simulations are then performed to quantify the impact of various policies. Inparticular, I found that if the state reduces the registration costs by half, it can inducetwice as much formal enterprises and levy more than twice the amount of tax revenuesthat is currently collected. Similarly, the optimal tax rate that would generate twiceas much formal enterprises and produce four-thirds of the current tax revenues is foundto be half of the current rate. In contrast, a law enforcement policy whose objective isto increase the probability of detection would have an overall perverse effect in termsof firms shut downs. These counterfactual results are consistent with empirical findingsrecently obtained in both developed and developing countries.
While existing research on informality and the impacts of related policies has mostlyfocused on countries in Latin America and Southeast Asia, this is, to the best of myknowledge the first work to provide a structural test of the effect of skills, registrationcosts and other institutional attributes on the formal/informal entrepreneurial choicein the context of a Sub-Saharan African country. While the use of a static model is anobvious limitation of the study, the choice to resort to it was imposed by data availability.For the same reasons, the role of risk aversion could not be explicitly incorporated inthe model. Future work to address these limitations would require that more data becollected in Africa, particularly individual/household/firm level panel data, with detailedinformation about wealth, socioeconomic activities and program participation.13
13According to Mckenzie (2011) there is not a single african country for which such data is currentlyreadily available.
29

7 Appendix
7.1 Proof of Proposition 1
Proof. (i) The critical threshold θW (z) is solution to the equation w = max{πI(θ, z), πF (θ, z)}.Denote by θuW and θIW the unique solutions of the equations w = πF (θ, z) and w =πI(θ, z) respectively. Then solving for these equations using the expressions given in (4)
and (5) yields θuW (z) =
(w + rc(z)
(1− γ)(1− τ)
)1−γ ( rα
)α(wβ
)βand
θIW (z) =
(
w
(1− β)(1− p)+
λrz
1− β
)1−β(λz)−α
(w
β
)βif z ≤ z∗(
w
(1− γ)(1− p)
)1−γ ( rα
)α(wβ
)βotherwise
wherez∗ =
αw
(1− γ)(1− p)λr(13)
The desired solution is then defined by θW (z) = min{θuW (z), θIW (z)}, that is,
θW (z) =
θuW =
(w + rc(z)
(1− γ)(1− τ)
)1−γ ( rα
)α(wβ
)βif z ≤ z∗∗
θmW =
(w
(1− β)(1− p)+
λrz
1− β
)1−β(λz)−α
(w
β
)βz∗∗ < z ≤ z∗
θlW =
(w
(1− γ)(1− p)
)1−γ ( rα
)α(wβ
)βotherwise,
(14)
where the cut-off z∗∗ is given by(w
(1− β)(1− p)+λrz∗∗
1− β
)1−β (λrz∗∗α
)−α=
(w + rc(z∗∗)
(1− γ)(1− τ)
)1−γ(15)
(ii) Consider the function V I,F (z, θ) = πF (z, θ)−πI(z, θ). For θ ≤ θc(z), we clearly have
V I,F (z, θ) < 0. Suppose θ > θc(z); then, since τ > p and1
1− γ>
1
1− β, V I,F (z, θ)
is strictly increasing in θ, and moreover, limθ→∞ VI,F (z, θ) = +∞ for any given z. It
follows by the intermediate value theorem that there exists a unique threshold θF =θF (z) ∈ (θc(z), ∞) such that V I,F (z, θF ) = 0, that is,
πF (z, θF ) = πI(z, θF ) (16)
I provide in Section 7.3 an algorithm that numerically solves for this equation and showhow it is simultaneously used for the maximum likelihood estimation.
30

7.2 Proof of Proposition 2
Proof. (i) Since w is independent of θ and z and both πI(θ, z) and πF (θ, z) are increasingin θ and z, then V W,I(θ, z) and V W,F (θ, z) are clearly also increasing in θ and z.
(ii) For θ ≤ θc(z),
∂V I,F (z, θ)
∂θ= −(τ − p)θ
γ1−γ
(α
r
) α1−γ(β
w
) β1−γ
< 0.
For θ > θc(z),
∂V I,F (z, θ)
∂θ= (1− τ)θ
γ1−γ(αr
) α1−γ(β
w
) β1−γ− (1− p)θ
β1−β
(β
w
) β1−β
(λz)α
1−β
= (1− τ)θβ
1−β(αr
) α1−γ(β
w
) β1−γ[θ
α(1−γ)(1−β) − θ
α(1−γ)(1−β)m
],
where
θm = θm(z) =
(1− p1− τ
) (1−γ)(1−β)α ( r
α
)1−β (wβ
)β(λz)1−γ .
Hence, when θ < θm,∂V I,F (z, θ)
∂θ< 0, and when θ ≥ θm,
∂V I,F (z, θ)
∂θ≥ 0
7.3 Algorithm for the maximum likelihood estimation of the model
The following algorithm is used for the likelihood maximization.
1. Define a grid for parameters α and β within [0.0001, 0.9999], say α(i) = i10000 ,
and β(j) = j10000 , i, j = 1, 2, . . . , N , where N = 9999. Define a grid for λ within
[1, 100], say λ(k) = 1 + k−1100 , k = 1, 2, . . . , N , and a grid for c1 within [0, 1], say
c1(l) = (l − 1)/10000, l = 1, . . . N .
2. For each pair (i, j) such that α(i) + β(j) < 1, k and l,
(a) Solve for the equation πF (z, θF )− πI(z, θF ) = 0. This yields a value
θijklF = θF (α(i), β(j), λ(k), c1(l), z), for each z.
(b) Solve the maximization problem
max{δ0,δ1,δ2,σ}
Ln(δ0, δ1, δ2, α(i), β(j), σ, λ(k), c1(l))
This yields:Lijkln = Ln(δ0(i, j, k, l), δ1(i, j, k, l), δ2(i, j, k, l), α(i), β(j), σ(i, j, k, l), λ(k), c1(l))
3. The maximum likelihood is then given by Li∗,j∗,k∗,l∗n = max1≤i,j,k,l≤N L
i,j,k,ln , and
the optimal parameter values are δ0(i∗, j∗, k∗, l∗), δ1(i
∗, j∗, k∗, l∗), δ2(i∗, j∗, k∗, l∗),
α(i∗), β(j∗), σ(i∗, j∗, k∗, l∗), λ(k∗)), c1(l∗), where i∗, j∗, k∗, l∗ are the optimal grids
indices.
31

To implement the algorithm I used Matlab routines starting from a wide variety ofpredetermined guesses. The standard errors of the estimated parameters are computedby bootstrap method using 100 draws of the original sample with replacement.
7.4 Additional tables and figures
Figure 10: Importance of the Informal Sector in Developing Countries
Informal employment as % of non-agricultural employment in selected regions and countries,various years (1995-2000)
!
!
!
!
Region Number of
Procedures
Duration
(Days)
Cost as
Percentage of
GNI/capita
OECD 6 25 8
South Asia 9 46 45.4
East Asia and the Pacific 8 51 47.1
Middle East and North Africa 10 39 51.2
Latin America and the Caribbean 11 70 60.4
Subsahara Africa 11 63 225.2
!
"#!
$%! $&!
"#! "&!'(!
)%!")!
(*! (*!'&!
((! (+!
&!
#&!
+&!
'&!
)&!
*&&!
,-./-0123-!
Source: UN-Habitat (2006)
Table 6: Cost of registration, Education Attainment and Financial Development
Region Requirement to Start a Formal Business Avg. Years Private Credit
# of Steps # of Days Fees (% GNIPC) of Schooling to GDP (%)
OECD 6 25 8.0 10.6 124.0South Asia 9 46 45.4 4.22 35.3East Asia & the Pacific 8 51 47.1 6.82 46.8Middle East & North Africa 10 39 51.2 5.90 34.5Latin America & the Caribbean 11 70 60.4 7.13 41.5Subsahara Africa 11 63 225.2 4.62 20.1
Source: Various sources. Cost of registration (UN-Habitat 2006), Schooling (Barro and Lee 2001),Private Credit to GDP ratio (Beck et al. 2010)
32

References
[1] Alby, P., Auriol, E., and Nguimkeu, P. (2014) “Does Social Pressure Hinder En-trepreneurship in Africa? The Forced Mutual Help Hypothesis”, Working Paper.
[2] Amaral, P. and E. Quentin (2006) “A Competitive Model Of The Informal Sector”,Journal of Monetary Economics, 53, 1541-1553.
[3] Andrade, G. H., Bruhn, M., McKenzie, D. (2014), “A helping hand or the long armof the law? Experimental evidence on what governments can do to formalize firms”,World Bank Economic Review , 1-31.
[4] Antunes, A.R., Cavalcanti, T.V.d.V. (2007), “Start up costs, limited enforcement,and the hidden economy”, European Economic Review 51, 203-224.
[5] Audretsch, D. B., A. N. Link, and J.T. Scott (2002) “Public/Private TechnologyPartnerships: Evaluating SBIR-Supported Research”, Research Policy, 31:145-58.
[6] Auriol, E. and Walters. M. (2005) “Taxation base in developing countries”, Journalof Public Economics 89, 625-646
[7] Ayittey, George (2006), Indigenous African Institutions, 2nd edition, TransnationalPublishers.
[8] Barro, R., Lee, J.W., (2001), “International data on educational attainment: up-dates and implications”, Oxford Economic Papers 53 (3).
[9] Beck, Thorsten, Asli Demirguc-Kunt, and Ross Levine (2010), “Financial Institu-tions and Markets across Countries and over Time”, World Bank Economic Review24(1), pp. 77-92.
[10] Blanchflower, D. and Oswald, A. (1998) “What makes an Entrepreneur?” Journalof Labor Economics 16(1): 26-60.
[11] Bruhn, M., (2013) “A tale of two species: Revisiting the effect of registration reformon informal business owners in Mexico”, Journal of Development Economics, 103,275-283.
[12] Bruhn, M. and D. McKenzie (2014) “Entry regulation and the formalization ofmicroenterprises in developing countries”, The World Bank Research Observer 29(2), 186-201.
[13] Bruton, G., S. Khavul, D. S. Siegel, and M. Wright (2015) “New Financial Alterna-tives in Seeding Entrepreneurship: Microfinance, Crowdfunding, and Peer-to-PeerInnovations”, Entrepreneurship Theory and Practice, 39 (1), 9-26.
[14] Cano-Urbina, J. (2015) “The role of the informal sector in the early careers ofless-educated workers”, Journal of Development Economics 112, 33-55.
33

[15] Dabla-Norris, E., M. Gradstein, and G. Inchauste (2008) “What Causes Firms toHide Output? The Determinants of Informality”, Journal of Development Eco-nomics, 85, 1-27, 2008.
[16] De Mel, S., McKenzie, D., and , C. (2008) “Returns to Capital in Microenterprises:Evidence from a Field Experiment”, Quarterly Journal of Economics, 123(4), 1329-1372.
[17] de Paula, A. and J. Scheinkman (2011)“The Informal Sector: An Equilibrium Modeland Some Empirical Evidence from Brazil”, Review of Income and Wealth, Series57, Special Issue, May 2011.
[18] De Soto, H. (1989). The Other Path: The Invisible Revolution in the Third World,I B Tauris & Co Ltd.
[19] Djankov, S., R. LaPorta, F. Lopez-De Silanes, and A. Shleifer (2002) “The Regu-lation of Entry”, Quarterly Journal of Economics, 117, 1-37.
[20] Evans, David S. and Boyan Jovanovic (1989) “An Estimated Model of En-trepreneurial Choice under Liquidity Constraints.” Journal of Political Economy97, 808- 827.
[21] Fajnzylber, P., W.F. Maloney, and G.V. Montes-Rojas (2011) “Does formality im-prove micro-firm performance? Evidence from the Brazilian SIMPLES program”,Journal of Development Economics, 94(2), 262-276.
[22] Fortin, B., N. Marceau, and L. Savard (1997) “Taxation, Wage Controls and theInformal Sector”, Journal of Public Economics, 66, 293-312.
[23] Holtz-Eakin D., D. Joulfaian and H. Rosen (1994) “Sticking It Out: EntrepreneurialSurvival and Liquidity Constraints”, Journal of Political Economy, 102(1), 53-75.
[24] International Labour Organisation (2002) “Decent Work and the Informal Econ-omy”, International Labor Conference, Geneva.
[25] Institut National de la Statistique (2005) Enquete sur lemploi et le secteur informelau Cameroun en 2005, Rapport principal, Yaounde, Cameroon.
[26] Kaplan, D., Piedra, E., Seira, E., (2011) “Entry regulation and business start-ups:evidence from Mexico”, Journal of Public Economics 95 1501-1515
[27] Klapper, L., Laeven, L., Rajan, R. (2006) “Entry regulation as a barrier to en-trepreneurship”, Journal of Financial Economics 82 (3),591-629.
[28] Klinger, B. and M. Schundeln (2011) “Can Entrepreneurial Activity be Taught?Quasi-Experimental Evidence from Central America”, World Development, 39(9),1592-1610.
34

[29] Laporta, R. and A. Schleifer (2014)“Informality and Development”, Journal of Eco-nomic Perspectives, 28(3), 109-126.
[30] Lentz, B. F., and Laband, D.N. (1990) “Entrepreneurial Success and OccupationalInheritance among Proprietors”, Canadian Journal of Economics, 23(3) 563-579
[31] Lucas Jr., R.E. (1978) “On the size distribution of business firms.” Bell Journal ofEconomics 9, 508-523.
[32] Magnac, T. (1991) “Segmented or competitive labor markets”, Econometrica 59,165-187.
[33] Maloney, W.F. (1999) “Does informality imply segmentation in urban labor mar-kets? Evidence from sectoral transitions in Mexico”, World Bank Economic Review13, 275-302.
[34] McKenzie, D. (2011), “How can we learn whether firm policies are working in Africa?Challenges (and solutions?) for experiments and structural models”, Journal ofAfrican Economics, 20(4): 600-25.
[35] McKenzie, D. and C. Woodruff (2014) “What are we Learning from Business Train-ing and Entrepreneurship Evaluations around the Developing World?”, World BankResearch Observer, 29(1), 48-82.
[36] Mondragon-Velez, C., Pena, X. (2010) “Business ownership and self-employmentin developing economies: the Colombian case”, In Lerner, J. and A. Schoar (Eds.),International Differences in Entrepreneurship. University of Chicago Press, 89-127.
[37] Monteiro, J.C.M. and J.J. Assuncao (2012) “Coming out of the Shadows? Estimat-ing the Impact of Bureaucracy Simplification and Tax cut on Formality in BrazilianMicroenterprises”, Journal of Development Economics, 99(1), 105-115.
[38] Nguimkeu, P. (2014) “A structural econometric analysis of the informal sector het-erogeneity”, Journal of Development Economics 107, 175-191.
[39] Olley, G.S. and A. Pakes (1996) “The dynamics of productivity in the telecommu-nications equipment industry”, Econometrica, 64(6), 1263-1297.
[40] Ordonez, J.C., (2014) “Tax collection, the informal sector, and productivity”, Re-view of Economic Dynamics 17 (2), 262-286.
[41] Parker S. and Van Praag, M. (2010) “The Entrepreneur’s Mode of Entry: BusinessTakeover or New Venture Start”, Journal of Business Venturing, 23-82
[42] Paulson, A., R. Townsend and A. Karaivanov (2006) “Distinguishing Limited Com-mitment from Moral Hazard in a Model of Entrepreneurship”, Journal of PoliticalEconomy, 144(1), 100-144.
35

[43] Pratap, S. and E. Quentin (2006) “Are labor markets segmented in developingcountries? A semiparametric approach”, European Economic Review 50, 1817-41.
[44] Rossi, M.A. (2014), “The impact of individual wealth on posterior political power”,Journal of Economic Behavior & Organization, 106, 469-480.
[45] Prado, M., (2011) “Government policy in the formal and informal sectors”, Euro-pean Economic Review 55 (8), 1120-1136.
[46] Schneider, F., Enste, D.H. (2000) “Shadow economies: size, causes and conse-quences”, Journal of Economic Literature 38, 77-114.
[47] Udry, C. and Anagol S. (2006) “The return to capital in Ghana” American EconomicReview 96 (2) 388-393.
[48] World Bank (2005) Doing Business in 2005: Removing Obstacles to Growth, Wash-ington, DC.
36