An enterprise technology readiness model for artificial ...
294
An enterprise technology readiness model for artificial intelligence By Morné Andries Nortje Thesis presented in fulfilment of the requirements for the degree of Master of Engineering in Engineering Management in the Faculty of Engineering at Stellenbosch University Supervisor: Prof Sara Susanna Grobbelaar March 2020
Transcript of An enterprise technology readiness model for artificial ...

An enterprise technology readiness model for artificial
intelligence
By
Morné Andries Nortje
Thesis presented in fulfilment of the requirements for the degree of Master of Engineering in
Engineering Management in the Faculty of Engineering at Stellenbosch University
Supervisor: Prof Sara Susanna Grobbelaar
March 2020

Declaration
By submitting this thesis electronically, I declare that the entirety of the work contained therein is my
own, original work, that I am the sole author thereof (save to the extent explicitly otherwise stated), that
reproduction and publication thereof by Stellenbosch University will not infringe any third party rights
and that I have not previously in its entirety or in part submitted it for obtaining any qualification.
March 2020
Copyright © 2020 Stellenbosch University
All rights reserved
Stellenbosch University https://scholar.sun.ac.za

ii | P a g e
Abstract
In the continuously changing and developing landscape of business, rapid growth in technology forms
a vital part in leveraging competitive advantage and generating new types of value. One of these
emerging technologies is artificial intelligence. Businesses wishing to capitalize on the opportunities
that this technology could provide, have unique challenges. One of these challenges is the strategic and
organizational implementation and integration of artificial intelligence into the business. The need thus
exists for a framework/model to assist businesses in determining their readiness for artificial
intelligence to assist in solving these challenges. The aim/goal of the study is to develop a conceptual
technology readiness model aimed at artificial intelligence. This model aims to provide two main
outputs. These outputs encompass the numerical calculation of the business’ readiness. The second
output focuses on providing the business with the ability to categorize and prioritize readiness
dimension and elements from an overall, strategic, operational and tactical perspective. The readiness
model foundation is developed through the incorporations of academically rooted methodologies and
systematized literature reviews. This foundational and core readiness dimensions and elements
encompass 7 readiness dimensions and 42 elements, these are further validated through the use of a
developed validation process, which incorporates validation steps in various sections that form part of
the completion of this study. Through the application of developed requirements, the appropriate,
applicable and viable subject matter experts and case study were identified for the study. The readiness
model developed was aimed towards use in large enterprises. After the readiness model was developed,
improved and validated, it was applied to a large real-world insurance corporation. The readiness model
identified that the business’s best performing dimension was the organizational governance and
leadership with a score of 5.85 and the lowest dimension was Employee and culture with a score of
3.87. The use of the Importance-performance analysis prioritized the dimension that requires the most
attention and resources in the short to-medium term, as the knowledge and information management
dimension. The three elements within this dimension with the largest difference in performance and
importance is identified as, Management information system and data processing, Enterprise resource
planning in terms of databases and software and Technology knowledge management. Their respective
readiness scores are 3.44, 4.375 and 3.875. The overall deduction is that the business requires more
time, resources and effort as indicated in the results to consider artificial intelligence implementation.
Through the conducted literature reviews, it was evident that there is a lack of academic papers, which
assist businesses in the implementation and integration of AI into their business, as well as determining
a business’ readiness. The process of developing the model is systematically developed, followed and
presented. This allows for ease of developments and improvements to the model in the future to assist
businesses with the implementation of this continuous changing and evolving technology.
Stellenbosch University https://scholar.sun.ac.za

iii | P a g e
Opsomming In ʼn voortdurende veranderende en ontwikkelende landskap van die besigheidswêreld, is die vinnige
groei van tegnologie ʼn noodsaaklike faktor om mededingend te wees, asook om deel te vorm van
waardeskepping. Een van hierdie ontwikkelende tegnologieë, is kunsmatige intelligensie. Besighede
wat op hierdie tegnologie se geleenthede wil kapitaliseer, het unieke uitdagings. Een van hierdie
uitdagings is die strategiese en organisatoriese implementering en integrasie van kunsmatige
intelligensie in besighede. Die behoefte bestaan dus vir ‘n raamwerk/model om besighede te help om
hulle gereedheid vir kunsmatige intelligensie te bepaal. Die doel van die studie is om ʼn tegnologiese
gereedheidsmodel wat gemik is op kunsmatige intelligensie te ontwikkel. Die model poog om twee
uitsette te lewer. Die een uitset behels ‘n numeriese berekening van die besigheid se gereedheid. Die
tweede uitset verskaf die besigheid met die vermoë om gereedheidsdimensies en elemente van ʼn
oorhoofse, strategiese, operasionele en taktiese perspektief te kategoriseer en prioritiseer. Die
gereedheidsmodel se fondament is ontwikkel deur die insluiting van akademiese metodologieë en
sistematiese literatuur resensies. Die fundamentele gereedheidsdimensies en elemente sluit in 7
dimensies en 42 elemente. Hierdie word verder geëvalueer deur die gebruik van ʼn valideringsproses,
oor verskeie afdelings wat deel vorm van die voltooiing van hierdie studie. Deur die toepassing van die
vereistes, is toepaslike en lewensvatbare vakkundiges en gevallestudies geïdentifiseer. Die
gereedheidsmodel wat ontwikkel was, is op groot ondernemings gemik. Na die gereedheidsmodel
ontwikkel, verbeter en gevalideer was, was dit by ʼn internasionale versekeringsmaatskappy toegepas.
Die gereedsheidsmodel het bewys dat die beste presterende dimensie organisatoriese bestuur en
leierskap was, met ʼn telling van 5.85. Die laagste dimensie was werknemer en kultuur met ʼn telling van
3.87. Die prestasie analise het die dimensie wat die meeste aandag en hulpbronne in die kort- na
mediumtermyn benodig, geïdentifiseer as kennis en inligtingsbestuur. Die drie elemente in hierdie
dimensie met die grootste verskil in prestasie en belangrikheid is bestuursinligtingstelsels en data
verwerking, hulpbronbeplanning in terme van databasisse en sagteware asook bestuur van tegnologiese-
kennis. Die onderskeie gereedheidstellings is 3.44, 4.38 en 3.88. Die algehele gevolgtrekking is dat die
besigheid meer tyd, hulpbronne en moeite moet aanwend, om kunsmatige intelligensie te implementeer.
Deur die literatuur oorsig is dit duidelik dat daar ʼn tekort van akademiesebronne is wat besighede met
implementering en integrasie van kunsmatige intelligensie ondersteun. Die gereedheidsmodel se
sistematiese ontwikkelings stappe maak dit eenvoudig en maklik vir toekomstige ontwikkeling en
verbeterings. Die voortdurende verbeterings en ontwikkeling aan die gereedheidsmodel kan besighede
ondersteun met die implementering van hierdie veranderende tegnologie in die toekoms.
Stellenbosch University https://scholar.sun.ac.za

iv | P a g e
Acknowledgements
I would like to deeply thank my study leader Prof. Sara Grobbelaar, who always showed great
enthusiasm, guidance and patience even during difficult times. I could have not completed this thesis
without her support. I would also like to express a deep appreciation to both my parents. For their
patience, expert and wise guidance and many years of support. Also, I express my appreciation to
friends and family for their unconditional support. Finally, I want to thank my Creator, for being with
me through this research study and blessed me with knowledge and skills to be able to complete it.
Stellenbosch University https://scholar.sun.ac.za

v | P a g e
Table of contents
Declaration ............................................................................................................................................... i
Abstract ................................................................................................................................................... ii
Opsomming ............................................................................................................................................ iii
Acknowledgements ................................................................................................................................ iv
List of Figures ........................................................................................................................................ vii
List of Tables ........................................................................................................................................... x
List of acronyms and abbreviations ...................................................................................................... xii
Chapter 1: Introduction ........................................................................................................................... 1
1.1 Background of study ............................................................................................................... 1
1.2 Research problem Statement ................................................................................................... 8
1.3 Project Objectives, scope and limitations ............................................................................... 9
1.4 Expected Contributions ......................................................................................................... 10
1.5 Ethical implications of the research ...................................................................................... 11
1.6 Proposed research content breakdown .................................................................................. 11
Chapter 2: Methodology ....................................................................................................................... 14
2.1 Main research approaches ........................................................................................................... 14
2.1.1 Qualitative and Quantitative research ........................................................................... 14
2.1.2 Grounded theory methodology ..................................................................................... 16
2.2 Systematized literature review .............................................................................................. 17
2.3 Narrative literature review .................................................................................................... 19
2.4 Framework focused methodologies ...................................................................................... 19
2.4.1 Rational model .............................................................................................................. 20
2.4.2 Multi-criteria decision analysis ..................................................................................... 20
2.4.3 Conceptual framework analysis .................................................................................... 22
2.4.4 Advantages and disadvantages of proposed methodologies ......................................... 23
2.4.5 Proposed Methodology ................................................................................................. 24
Chapter 3: Narrative Literature Review ............................................................................................... 26
3.1 Initial literature research ....................................................................................................... 27
3.2 Generic decision-making methods ........................................................................................ 29
3.3 Maturity models .................................................................................................................... 31
3.4 Artificial Intelligence and industry 4.0 Readiness ................................................................ 34
Chapter 4 Systematized literature review ............................................................................................. 36
4.1 Review protocol .................................................................................................................... 36
4.2 Maturity implementation model for artificial intelligence .................................................... 37
4.3 Combination of industry 4.0 and AI readiness...................................................................... 49
4.4 AI readiness model systematized literature review ............................................................... 51
4.5 Readiness model dimensions ................................................................................................ 60
Chapter 5: Development of the readiness model components .............................................................. 70
5.1 Infrastructure Dimension of readiness model ....................................................................... 72
5.2 Employee and culture dimension of readiness model ........................................................... 75
5.3 Technology management ...................................................................................................... 77
Stellenbosch University https://scholar.sun.ac.za

vi | P a g e
5.4 Organizational governance and leadership ........................................................................... 85
5.5 Security ................................................................................................................................. 88
5.6 Strategy ................................................................................................................................. 89
5.7 Knowledge and information management ............................................................................ 93
5.8 Integration of concepts into an index .......................................................................................... 96
Chapter 6: Constructing the readiness model ..................................................................................... 102
6.1 Validation of readiness model, dimensions and elements................................................... 103
6.2 Calculation of the weightings ............................................................................................. 105
6.2.1 Weighting methods for readiness dimensions/indicators ............................................ 106
6.2.2 Subject matter expert surveys ..................................................................................... 112
6.2.3 Result from the surveys ............................................................................................... 112
6.2.4 Weighting Conclusion ................................................................................................. 149
6.3 Development of the importance-performance analysis ....................................................... 150
6.4 Development of the readiness evaluation ........................................................................... 152
6.5 Construction of readiness model conclusion ...................................................................... 155
Chapter 7: Case study ......................................................................................................................... 156
7.1 Case study requirements, selection and background ........................................................... 159
7.2 Conducting the case study................................................................................................... 160
7.3 Importance performance analysis (IPA) ............................................................................. 170
7.4 Business readiness index ..................................................................................................... 192
7.5 Case Study Conclusion ........................................................................................................ 201
Chapter 8: Conclusion ......................................................................................................................... 204
8.1 Summary and conclusions of study phases ......................................................................... 204
8.2 Achieving research objectives ............................................................................................ 208
8.3 Contributions and implications of this research .................................................................. 211
8.4 Critical reflection ................................................................................................................ 212
8.5 Study limitations ................................................................................................................. 212
8.6 Recommendations and future work .................................................................................... 213
References ........................................................................................................................................... 215
Appendix A ......................................................................................................................................... 223
Appendix B ......................................................................................................................................... 225
Appendix C ......................................................................................................................................... 226
............................................................................................................................................................ 227
Appendix D ......................................................................................................................................... 228
Appendix E ......................................................................................................................................... 235
Appendix F.......................................................................................................................................... 240
Appendix G ......................................................................................................................................... 244
Appendix H ......................................................................................................................................... 247
Appendix I .......................................................................................................................................... 261
Appendix J .......................................................................................................................................... 267
Appendix K ......................................................................................................................................... 275
Appendix L ......................................................................................................................................... 276
Appendix M ........................................................................................................................................ 281
Stellenbosch University https://scholar.sun.ac.za

vii | P a g e
List of Figures
Figure 1. Adoption maturity for different sectors (Rao and Verweij, 2017) .......................................... 5
Figure 2. Organizational challenges towards AI (Davenport, Loucks and and Schatsky, 2018) ............ 6
Figure 3. Gartner hype cycle of emerging technology 2018 (Gartner., 2018) ........................................ 8
Figure 4. GTM process steps (Allan, 2003) ......................................................................................... 16
Figure 5. Initial proposed study methodology ...................................................................................... 17
Figure 6. Systematized literature review process phases and steps (Keele, 2007). .............................. 18
Figure 7. Systematized literature review strategy ................................................................................. 19
Figure 8. Rational decision making model (Uzonwanne, 2016) ........................................................... 20
Figure 9. MCDA process steps (De Graaf, Postmus and Buskens, 2015) ............................................ 21
Figure 10. CFA process steps (Jabareen, 2009) .................................................................................... 22
Figure 11. Study Methodology .............................................................................................................. 25
Figure 12. Study methodology process step ......................................................................................... 26
Figure 13. Narrative literature review concepts/sections ...................................................................... 27
Figure 14. General literature review steps (Cronin, Ryan and Coughlan, 2008) .................................. 27
Figure 15. Capability maturity model levels (Kumta and Shah, 2002)................................................. 33
Figure 16. Different types of AI readiness (Intel, no date a) ................................................................ 35
Figure 17. Study methodology steps ..................................................................................................... 36
Figure 18. Review protocol strategy (Keele, 2007), (Okoli and Schabram, 2012) ............................... 37
Figure 19. Number of citations ............................................................................................................. 40
Figure 20. Themes and categories within Digitization Canvas (Heberle et al., 2017) ......................... 42
Figure 21. Themes and categories within Research on Quality Measuring of CMMI Cyclic
Implementation in software (Zhou and Li, 2012) ................................................................................. 43
Figure 22. Themes and categories within Neural networks: An overview of early research, current
frameworks and new challenges (Prieto et al., 2016) ........................................................................... 44
Figure 23. Themes and categories within: A Model to Assess Open Government Data in Public
Agencies (Solar, Meijueiro and Daniels, 2017). ................................................................................... 45
Figure 24. Themes and categories within: Determination of Rule Patterns in Complex Event Processing
Using Machine Learning Techniques (Mehdiyev et al., 2015) ............................................................ 45
Figure 25. Themes and categories within: Computer-Aided Warehouse Engineering (CAWE):
Leveraging MDA and ADM for the Development of Data Warehouses (Kurze and Gluchowski, 2010)
.............................................................................................................................................................. 46
Figure 26. Themes and categories within: An enterprise risk management knowledge-based decision
support system for construction firms (Zhao, Hwang and Low, 2016) ................................................ 47
Figure 27. Themes and categories within: Managing quality in outsourcing of high-end services: a
conceptual model (Srivastava, Sharfuddin and Datta, 2012) ................................................................ 48
Figure 28. Themes and categories within: A Development Process of KMS based on Systems
Engineering Methodology .................................................................................................................... 49
Figure 29. Characteristics of studies ..................................................................................................... 53
Figure 30. Themes and categories within: Employee Readiness for Acceptance of Decision Support
Systems as a New Technology in E-Business Environments; A Proposed Research Agenda ............. 54
Figure 31. Themes and categories within: Cloud Readiness Assessment Framework and .................. 56
Figure 32. Technology readiness model (Oztemel and Polat, 2006) .................................................... 58
Stellenbosch University https://scholar.sun.ac.za

viii | P a g e
Figure 33. Themes and categories within: Technology Readiness Model for Enterprises ................... 59
Figure 34. Themes and categories within: A Fuzzy Logic Based Green Information Technology
Readiness Model ................................................................................................................................... 59
Figure 35. Themes and categories within: The ML Test Score: A Rubric for ML Production Readiness
and Technical Debt Reduction .............................................................................................................. 60
Figure 36. Illustration of model integration .......................................................................................... 61
Figure 37. Current Study Methodology Process Step ........................................................................... 70
Figure 38. Readiness model dimensions ............................................................................................... 71
Figure 39. Core structure of the readiness model ................................................................................. 71
Figure 40. Infrastructure readiness dimension identification ................................................................ 72
Figure 41. Infrastructure readiness elements ........................................................................................ 72
Figure 42. Schematic of a systems approach to technology sustainability assessment (Musango and
Brent, 2011) .......................................................................................................................................... 75
Figure 43. Employee and culture readiness dimension identification .................................................. 76
Figure 44. Employee and culture readiness elements ........................................................................... 77
Figure 45. Technology management readiness dimension identification ............................................. 78
Figure 46. Technology management elements...................................................................................... 78
Figure 47. Impact vs Probability Risk matrix ....................................................................................... 83
Figure 48. Technology management readiness dimension identification ............................................. 86
Figure 49. Organisational governance and leadership elements ........................................................... 86
Figure 50. Organisational governance and leadership readiness dimension identification .................. 88
Figure 51. Cyber security management framework (Tisdale, 2015) .................................................... 89
Figure 52. Strategy readiness dimension identification ........................................................................ 90
Figure 53. Strategy readiness elements ................................................................................................. 90
Figure 54. Agile delivery process ......................................................................................................... 92
Figure 55. Agile delivery software development process (Kulkarni and Padmanabham, 2017) .......... 92
Figure 56. Knowledge and information management readiness dimension identification ................. 93
Figure 57. Knowledge and information management elements ............................................................ 94
Figure 58. Study methodology process step ....................................................................................... 102
Figure 59. Basic process of operations with regards to the readiness model ...................................... 103
Figure 60. Validation process ............................................................................................................. 104
Figure 61. Illustration of weighting development .............................................................................. 105
Figure 62. Exponential growth in pair wise comparisons ................................................................... 110
Figure 63. Readiness Element Relevant Count ................................................................................... 118
Figure 64. Weighting average vs respondent weightings ................................................................... 123
Figure 65. Average absolute percentage difference vs Individual absolute percentage differences ... 125
Figure 66. Weighting average vs respondent weightings for readiness elements from I= 1 to 23 ..... 135
Figure 67. Weighting average vs respondent weightings for readiness elements from I= 24 to 42 ... 136
Figure 68. Average absolute percentage difference vs individual absolute percentage differences for
readiness elements .............................................................................................................................. 143
Figure 69. Average absolute percentage difference vs individual absolute percentage differences for
readiness elements .............................................................................................................................. 144
Figure 70. importance-performance analysis original axis ................................................................. 150
Stellenbosch University https://scholar.sun.ac.za

ix | P a g e
Figure 71. Re-illustration of the IPA graph (Abalo, Varela and Rial, 2006) ...................................... 152
Figure 72. Business dimensions readiness example ........................................................................... 154
Figure 73. Example of employee and culture readiness ..................................................................... 154
Figure 74. Study methodology steps ................................................................................................... 156
Figure 75. Readiness model illustration of case study inclusion and output ...................................... 157
Figure 76. IPA Approaches ................................................................................................................. 158
Figure 77. Main business offerings ..................................................................................................... 160
Figure 78. Case study data collection ................................................................................................. 161
Figure 79. Case study respondents’ average absolute difference from mean ..................................... 170
Figure 80. Skewed Overall IPA graph ................................................................................................ 172
Figure 81. Overall IPA graph .............................................................................................................. 173
Figure 82. Strategy IPA graph ............................................................................................................ 174
Figure 83. Operational IPA graph ....................................................................................................... 175
Figure 84. Tactical IPA graph ............................................................................................................. 176
Figure 85. Overall business dimensional readiness ........................................................................... 194
Figure 86. Business readiness within employee and culture dimension ............................................. 195
Figure 87. Business readiness within technology management dimension ....................................... 196
Figure 88. Business readiness within organisational governance and leadership dimension ............. 197
Figure 89. Business readiness within strategy dimension .................................................................. 198
Figure 90. Business readiness within infrastructure dimension ......................................................... 199
Figure 91. Business readiness within knowledge and information management dimension .............. 200
Figure 92. Research methodology process step .................................................................................. 204
Stellenbosch University https://scholar.sun.ac.za

x | P a g e
List of Tables
Table 1. AI and cognitive Technologies (Davenport, Loucks and and Schatsky, 2018). ....................... 2
Table 2. Subsectors of main adoption sectors (Rao and Verweij, 2017). .............................................. 3
Table 3. Research problem questions. .................................................................................................... 9
Table 4. Proposed research content breakdown .................................................................................... 11
Table 5. Differences between qualitative and quantitative research (Celano, 2014) ............................ 15
Table 6. Differences between qualitative and quantitative research (Bryman et al., 2014), (Creswell,
2009), (Zikmund, 2003). ....................................................................................................................... 15
Table 7. Advantages and disadvantages of different methodologies .................................................... 23
Table 8. Viability of different methodologies ....................................................................................... 24
Table 9. Advantages and disadvantages of decision-making methods ................................................. 30
Table 10. Maturity model descriptions (Caralli, Knight and Montgomery, 2012). .............................. 32
Table 11. Maturity model level descriptions (Kumta and Shah, 2002) ................................................ 33
Table 12. Organization grouping with respective scenarios (Intel, no date a) ...................................... 34
Table 13. Database search results ......................................................................................................... 37
Table 14. Selection criteria ................................................................................................................... 38
Table 15. Quality Assessment criteria .................................................................................................. 39
Table 16. Publications year of studies .................................................................................................. 41
Table 17. Identification of readiness dimensions .................................................................................. 50
Table 18. Combination of academic and business readiness dimensions and elements ....................... 50
Table 19. Database search results ......................................................................................................... 51
Table 20. Publication years of chosen readiness studies ....................................................................... 53
Table 21. Employee readiness dimensions (Ahmed, Qin and Aduamoah, 2018) ................................. 55
Table 22. Technology organization environment frameworks’ main contexts (Alemeye and Getahun,
2015) ..................................................................................................................................................... 56
Table 23. First systematized literature review studies’ references ....................................................... 61
Table 24. Second systematized literature review studies’ references ................................................... 62
Table 25. Identification of readiness elements and dimensions from systematized literature reviews . 63
Table 26. Cloud computing models ...................................................................................................... 81
Table 27. Cloud deployment models .................................................................................................... 82
Table 28. Initial developed readiness index .......................................................................................... 96
Table 29. Likert importance scale ....................................................................................................... 106
Table 30. Likert scale for readiness elements ..................................................................................... 108
Table 31. The scale of absolute numbers (Saaty, 2008) ..................................................................... 110
Table 32. Values of RI corresponding to m number of criteria .......................................................... 112
Table 33. SME information ................................................................................................................ 113
Table 34. SME information with regards to AI readiness frameworks .............................................. 114
Table 35. Relevant vs irrelevant readiness elements .......................................................................... 115
Table 36. Readiness dimension colour index for relevant count figure .............................................. 117
Table 37. Dimension change requests ................................................................................................. 119
Table 38. Strategy weightings of readiness dimensions ..................................................................... 120
Table 39. Operational weightings of readiness dimensions ................................................................ 121
Table 40. Tactical weightings of readiness dimensions ...................................................................... 121
Stellenbosch University https://scholar.sun.ac.za

xi | P a g e
Table 41. Overall readiness dimension weightings............................................................................. 122
Table 42. Dimensional absolute percentage difference from mean .................................................... 124
Table 43. Weightings calculated from AHP method .......................................................................... 126
Table 44. Values of RI corresponding to m number of criteria. ......................................................... 129
Table 45. Consistency index from respondent 1 and 2 ....................................................................... 129
Table 46. Likert scale for readiness elements ..................................................................................... 130
Table 47. Readiness element weightings ............................................................................................ 131
Table 48. Element absolute percentage difference from mean ........................................................... 138
Table 49. Weightings index for readiness model ................................................................................ 145
Table 50. Business performance evaluation results ............................................................................ 162
Table 51. Percentage absolute difference from the mean for respondents 1 to 5 ............................... 169
Table 52. Percentage absolute difference from the mean for respondents 6 to 9 ............................... 169
Table 53. Overall IPA results .............................................................................................................. 177
Table 54. Overall IPA well balanced readiness elements ................................................................... 180
Table 55. Summary of overall IPA results from original mean axis method ...................................... 182
Table 56. Three highest priority elements in “low priority” readiness dimensions ............................ 185
Table 57. Three highest priority elements in “keep up the good work” readiness dimensions .......... 185
Table 58. Three highest priority elements in “Concentrate here” readiness dimension ..................... 185
Table 59. Strategic, operational and tactical IPA diagonal method results ......................................... 186
Table 60. Strategic, operational and tactical IPA original axis method results .................................. 189
Table 61. Overall business dimension readiness for artificial intelligence ......................................... 192
Table 62. Research study summary and salient point identification ................................................... 204
Table 63. Evaluation of study on achieving objectives ....................................................................... 208
Stellenbosch University https://scholar.sun.ac.za

xii | P a g e
List of acronyms and abbreviations
AI – Artificial intelligence
BPM – Business process management
CFA – Conceptual framework analysis
GTM – Grounded theory methodology
IPA – Importance performance analysis
CMM – Capability maturity model
CMMI – Capability maturity model integration
Stellenbosch University https://scholar.sun.ac.za

1 | P a g e
Chapter 1: Introduction
Chapter 1 focuses on the basic aim and necessity of this study. It does this through identifying the
background to this study and the research problem and develops the project objectives. The scope of
the study and its ethical implications are determined and a broad description of the project, outlining
chapters and their contents, is provided. This first chapter thus forms the initial basis of this study, which
the following chapters further develop and complete.
Chapter 1 Objectives Provide introduction and background on project
Conduct a theory and literature analysis
Develop problem statement
Develop project objectives
Describe expected project contribution
Describe expected ethical implications of the study
Outline proposed content breakdown
1.1 Background of study
Artificial intelligence (AI) is defined as the ability of computer systems to display intelligence. AI is
being used to improve the efficiency and quality of operations and systems in various sectors ranging
from energy, education, transport to health. Artificial intelligence is a primary driver of the 4th industrial
revolution, which is the development of technologies that combine the biological, digital and physical
worlds (Skilton, 2017).
The field of AI is generally seen to have started at conference at Dartmouth College in July 1956, where
the phrase of artificial intelligence was first used (Brunette, Flemmer and Flemmer, 2009). Many
leaders in the field of AI attended the conference and some of these later opened up centres for AI
research, such as at MIT, Stanford, Carnegie Mellon University and Edinburgh (Brunette, Flemmer and
Flemmer, 2009). By the 1980s, a general understanding had arisen that AI was more complicated than
first thought (Brunette, Flemmer and Flemmer, 2009). Recently, due to improvements in the
technologies associated with robots and computing, there have been broad attempts to build embodied
intelligence (Brunette, Flemmer and Flemmer, 2009). The improvement of technologies associated with
robotics and computing has enabled the growth in AI methods, such as machine learning, natural
language processing, image recognition and deep neural networks. Systems that incorporate Artificial
intelligence have the potential to either surpass or match human level performance in an ever-increasing
number of domains and are driving rapid advances in other technologies (Brynjolfsson, Rock and
Syverson, 2017). Artificial intelligence is evolving and whether AI is used to imitate complex or human
level tasks, work will be driven by the quality of models of computation (Skilton, 2017).
Stellenbosch University https://scholar.sun.ac.za

2 | P a g e
AI is poised to have a transformational impact on businesses. Globally many companies are using AI,
but the greatest opportunities are still to be capitalized on. The effects of AI will be clearer as sectors
such as, finance, health care, law, advertising, insurance, entertainment, education, transportation and
manufacturing transform their business models and core processes (Brynjolfsson and Mcafee, 2017).
A major improvement in AI applications are cognition and problem solving (Brynjolfsson and Mcafee,
2017). Some examples of cognitive or AI technologies are machine learning, natural language
processing, rule engines, robotic process automation and deep learning neural networks (Davenport,
Loucks and and Schatsky, 2018). These AI technologies are further described in the table below:
Table 1. AI and cognitive Technologies (Davenport, Loucks and and Schatsky, 2018).
AI Technology Description
Machine Learning These statistical models develop capabilities and
improve over a period of time without the need to
follow direct programmed instructions
(Davenport, Loucks and and Schatsky, 2018).
Natural Language processing Extracts/generates intent and meaning from text
in a grammatical and readable way (Davenport,
Loucks and and Schatsky, 2018).
Rule Engines It is the automation of processes by using
databases of knowledge and rules (Davenport,
Loucks and and Schatsky, 2018).
Robotic Process automation This technology is software that automates rule-
based and repetitive processes (Davenport,
Loucks and and Schatsky, 2018).
Deep Learning Neural Networks This technology is a complex form of machine
learning with neural networks and many layers of
abstract variables. These models work well for
image recognition (Davenport, Loucks and and
Schatsky, 2018).
The AI solutions are beginning to approach and surpass human-level capabilities with regards to
specific real-world tasks. The developing and maturing AI technologies are powering existing
industries, such as high-speed trading, web searches and commerce. These technologies assist in the
development of new industries around augmented reality, biotechnology, autonomous vehicle and IoT
(internet of things) (Stoica et al., 2017). An example of AI technology is Google’s DeepMind. By using
machine learning systems, the Deep Mind team improved the cooling efficiencies at data centres by
Stellenbosch University https://scholar.sun.ac.za

3 | P a g e
more than 15%, even after experts had optimized the systems. Intelligent agents are being used by Deep
Instinct cyber security companies to detect malware and by PayPal to prevent money laundering.
Machine learning systems are not only replacing older algorithms in applications but are superior in
tasks that were previously done best by humans (Brynjolfsson and Mcafee, 2017).
Analysis in a study conducted by PwC, Fraunhofer and Forbes indicated a 14% increase in global GDP
by 2030 as a result of increasing development and adoption of AI. This is estimated to amount to $15.7
trillion. The economic impact of AI will be driven by productivity growth as businesses increasingly
automate their processes and integrate their existing work force with AI technologies. This will lead to
an increase in consumer demand due to the availability of personalised and higher quality AI services
and products (Rao and Verweij, 2017).
Based on PwC’s AI impact index evaluation, the figure below indicates the estimated adoption maturity
percentage over short, mid and long term for different sectors (Rao and Verweij, 2017). The main
adoption sectors are healthcare, automotive, financial services, transport and logistics, energy, retail,
manufacturing and technology, communication and entertainment. The subsectors within each of these
main sectors are identified in the table below.
Table 2. Subsectors of main adoption sectors (Rao and Verweij, 2017).
Sector Subsectors
Healthcare • Health services
• Life sciences
• Consumer Health
• Insurance
Automotive • OEM
• Financing
• Component Suppliers
• Aftermarket & Repair
Financial Services • Insurance
• Capital and Banking
• Asset Wealth Management
Transport and Logistics • Logistics
• Transport
Technology,
Communication and
entertainment
• Technology
• Media and communication
Stellenbosch University https://scholar.sun.ac.za

4 | P a g e
Energy • Utilities and Power
• Gas and oil
Retail • Retail
• Consumer Products
Manufacturing • Industrial products and raw materials
• Industrial manufacturing
The adoption maturity percentages of the different sectors are presented in Figure 1 below. The basis
of analysis with regards to this index evaluations is divided into two section. These sections are AI
impact index and economic analysis. For the impact index, sector specialists, market participants and
partnerships with Fraunhofer together identified and evaluated use cases through the incorporation of
five criterions. These criterions are (Rao and Verweij, 2017):
• Potential to enhance quality
• Potential to enhance consistency
• Potential to enhance personalisation
• Potential to save time for consumers
• Availability of data to enable gains
The derivation of scoring parameters for each criterion was completed. This was followed by the
evaluation of technological feasibility. The results together were used to determine the possible time to
adoption, possible barriers and how to overcome these barriers. The different maturity adoption terms
are divided into short term (0-3 years), mid-term (3-7 years) and long term (7+ years). This provides
some insights into possible areas of focus for AI in different business sectors, for different time frames.
The different sectors and their adoption maturity percentages with regards to short, mid and long term
can be seen in the figure below. can be seen in Figure 1.
Stellenbosch University https://scholar.sun.ac.za

5 | P a g e
Figure 1. Adoption maturity for different sectors (Rao and Verweij, 2017)
Figure 1 indicates that there are large percentages of AI adoption currently happening and in the near
future (short term), such as retail, energy, technology, communication and entertainment, transport and
logistics and financial services. This indicates that the adoption of AI into businesses in different sectors
will continue to grow. The recent success of AI can be contributed to three main features, these being
integration of massive amounts of data, scalable computer and software systems and the broad
accessibility of these technologies allowed core AI architecture and algorithms such as deep learning,
reinforcement learning and Bayesian inference to developed and explored within various problem
domains (Stoica et al., 2017).
Although businesses will face many challenges when adopting AI into their business structure, effective
implementation and integration of Artificial Intelligence could be invaluable in terms of costs and time
to production. 250 Executives that are familiar with the concepts and applications of AI technologies
(cognitive aware) were surveyed on what the top challenges are with regards to cognitive technology
in (Davenport, Loucks and and Schatsky, 2018). The results can be seen in Figure 2.
0% 10% 20% 30% 40% 50% 60% 70% 80% 90%
Healthcare
Automotive
Financial Services
Transport and Logistics
Technology, Communication and entertainment
Energy
Retail
Manufacturing
Adoption maturity for different sectors
%adoption maturity – Long term (7+ years) %adoption maturity – Mid-term (3-7 years)
%adoption maturity – Near term (0-3 years)
Stellenbosch University https://scholar.sun.ac.za

6 | P a g e
Figure 2. Organizational challenges towards AI (Davenport, Loucks and and Schatsky, 2018)
From the data in the figure above, it is clear that the implementation or integration of AI technologies
is seen as the greatest challenge towards adopting AI processes (Davenport, Loucks and and Schatsky,
2018). From the Gartner’s 2019 CIO agenda survey, three main adoption barriers were identified for
AI, these adoption barriers are enterprise maturity, fear of the unknown and finding a starting point
(Goasduff, 2019). The study (Sun and Medaglia, 2019) further identified definitive challenges with
regards to the adoption of AI in the public sectors and there have been few studies that adopted a
theoretical lens to capture the perceptions of challenges with regards to AI (Sun and Medaglia, 2019).
The study also identified challenges with regards to issues on a strategic level with regards to AI (Sun
and Medaglia, 2019). These concerned a business’ digitization with regards to digital technologies, such
as robotic process automation and AI (Lamberton, Brigo and Hoy, 2017). It is evident that the general
perception is that the strategic planning, initiation and implementation of AI poses challenges. The
implementation and integration of AI in business is a complex problem, as only a part of it involves
business maturity and readiness to implement Artificial Intelligence.
An important aspect towards implementing a new technology is managing the expectations around this
technology. Failure to do so could lead to severe delays in productive implementation and operation of
this technology. The Gartner Hype Cycle demonstrates how expectations revolve around Artificial
intelligence. The Gartner hype cycle provides a cross-industry perspective and identification of trends
on technologies, which business strategists, entrepreneurs, global market developers, emerging-
technology teams, chief innovation officers and R&D leaders should consider when developing their
0% 5% 10% 15% 20% 25% 30% 35% 40% 45% 50%
Difficulty to integrate cognitive projects with existingprocesses and systems
Technologies and expertise are too expensive
Managers don’t understand cognitive technologies and how they work
Cant get enough people with expertise in the technology
Technologies are immature
Technologies have been oversold in the marketplace
None of these
Top challenges with regards to cognitive technology adoption
Stellenbosch University https://scholar.sun.ac.za

7 | P a g e
emerging-technology portfolios (Gartner., 2018). The hype cycle focuses on technologies that show
promise in terms of delivering a high magnitude of competitive advantage between five to ten years
(Gartner., 2018) and it graphically depicts the adoption and maturity of technologies and applications.
These include the technologies’ potential relativity towards solving and exploiting real business
problems and opportunities (Gartner, no date).
Each Hype Cycle is divided into five key phases: innovation trigger; peak of inflated expectations;
trough of disillusionment; slope of enlightenment; and plateau of productivity. These are illustrated in
Figure 3 below. The innovation trigger phase is characterized by early ‘proof of concept’ stories, as
well as media interest which triggers compelling publicity. These technologies are usually unproven in
terms of commercial viability and useable products (Gartner, no date). The peak of the inflated
expectations phase is characterised by publicity, which produces some success stories as well as many
failures (Gartner, no date). The trough of disillusionment phase is characterised by loss of interest due
to the failure of experiments and products. Investments nevertheless continue, on the condition that
providers improve the products to the satisfaction of the early adopters (Gartner, no date). The slope of
enlightenment is characterised by an increase in companies that fund pilots because more instances
which demonstrate how technology can benefit business lead to greater understanding (Gartner, no
date). The plateau of productivity is characterised by the increase in mainstream adoption and provider
viability criteria is more clearly defined.
Advantages of using the Gartner Hype Cycle include helping to separate technological hype from
commercial hype. This reduces the decision risk for technology investment and makes it possible to
compare personal views on a technology’s business value with the perspectives of IT analysts (Gartner,
no date). All this is illustrated in the figure below which displays AI types such as deep neural networks
(deep learning), AI Paas, Edge AI, general Artificial Intelligence and deep neural network ASICs. It is
evident that according to Gartner hype cycle methodology view that these types of emerging technology
are still within the innovation trigger and peak of inflated expectations phases. This is particularly true
of deep neural networks, a technology which has the highest expectations within the peak of inflated
expectations. This suggests that there is still progress to made in terms of understanding and developing
AI in order to produce an effective and efficient environment in which to implement and operate this
technology.
Stellenbosch University https://scholar.sun.ac.za

8 | P a g e
Figure 3. Gartner hype cycle of emerging technology 2018 (Gartner., 2018)
One of the five emerging trends identified is democratised AI (Gartner., 2018). This trend is described
as the availability of AI to the masses. The movement of cloud computing, “maker” communities and
open sourcing is driving for widely available (democratised) AI (Gartner., 2018). This supports the idea
that a model or framework is needed to identify the groundwork foundations and requirements that are
initially needed to implement this technology. This will contribute to the body of literature thus
increasing general knowledge of the field of Artificial Intelligence in business.
From this background analysis on Artificial Intelligence, it is evident that this technology is integral to
the 4th industrial revolution and will have a considerable impact on business across many sectors from
short to long term. This further emphasises the importance of the successful implementation and
integration of this technology. However, inflated expectations and misconceptions remain, thus a study
targeting at overcoming this barrier will be of great value for the future.
1.2 Research problem Statement
Businesses aiming at implementing AI in their business structure or providing AI services face a range
of challenges, particularly the difficulty of implementation. Even as businesses change and transform
their business models and processes to capitalise on the advantages of machine learning, business
Stellenbosch University https://scholar.sun.ac.za

9 | P a g e
imagination, management and, most importantly, implementation of AI create bottlenecks to progress
(Brynjolfsson and Mcafee, 2017). In order for a business to initiate the complex process towards
effective integration and implementation of AI, the focus needs to shift to the starting phases of such an
undertaking: the maturity or readiness of a business for AI. Some important aspects to think about are
how a business determines its level of maturity or readiness towards implementing AI into their business
structure and what the current level of maturity or readiness is.
Table 3. Research problem questions.
Research Problem Questions
How to determine a business’ readiness for AI?
What are the different dimensions or components of AI readiness?
What are the different views of readiness for a business with the focus on AI?
What are the characteristics and items of each AI readiness dimension?
1.3 Project Objectives, scope and limitations
The aim of this project is to develop a generic Artificial Intelligence readiness model for businesses by
determining business readiness. This model should consider different dimensions as well as rank
different business areas in order of importance. The readiness model provides crucial initial steps
towards an Artificial Intelligence integration method and procedure. The previous section suggested
that businesses wishing to implement Artificial Intelligence technologies find initiation of the process
a significant challenge. This creates a major adoption barrier for many companies. The readiness model
provides insights into how and where a business measures its readiness for Artificial Intelligence
implementation, thus identifying the areas that will require the most attention in order to increase
readiness. To meet the main objective of this study, the following objectives need to be addressed:
• Identify literature with the focus on AI readiness in business
• Develop systematized literature review.
• Developing a conceptual readiness model
• Validate conceptual readiness model
• Identify applicable, real-world case study.
• Apply validated readiness model to viable and applicable cases study
The main scope of the project is to develop a readiness model comprising dimensions and elements
retrieved from various literature sources in order to form a generic technology readiness model. The
model focuses on Artificial Intelligence implementation by accumulating applicable readiness
dimensions and elements and draws on a systematised literature review in combination with the most
Stellenbosch University https://scholar.sun.ac.za

10 | P a g e
appropriate methodology. The model’s scope encompasses ways to develop a generic, robust,
technology-readiness model aimed at Artificial Intelligence, as well as generic business dimensions that
are required to implement the new technologies. The AI readiness model validation consists of the use
of a case study that incorporates views and expertise across business and industry, as well as SME
interviews to ensure the accuracy, effectiveness and robustness of the model developed.
The main aim of this research study is to develop a conceptual technology readiness model that is
focused on Artificial Intelligence implementation in business. The study limitations with regards to this
study are:
• Within this management tool, the “performance” evaluation dimension derived from this study,
which is used to determine the business’ readiness in the case study is based on the satisfaction
of individuals, thus it is not specifically performance based.
• The readiness model was applied to one large insurance corporation.
• The determination of the case study business’ readiness for artificial intelligence was developed
from feedback received from 9 individuals regarded as experts in their fields, however they
were all employed within one large corporation. Future studies ay thus expand and test the
usability and completeness of the framework in other contexts.
• Seven subject matter experts with regards to AI and robotic process automation implementation
was included in this study.
• The developed readiness model is conceptual in nature, thus further research, evaluation and
development from experts would be required to develop a generic business readiness model for
more specific types of AI, across different businesses.
1.4 Expected Contributions
The outcome of this study is to create a robust and generic Conceptual Readiness model. This will help
businesses determine their level of readiness for the integration of Artificial Intelligence into their
business structure, as well as identify shortcomings. The readiness model contributes towards the
complex challenge of integrating and implementing Artificial Intelligence into a business. The initial
literature analysis identified a gap in research in the field of frameworks that support the implementation
and integration of AI at an enterprise and organisational level. Beneficiaries from this study are
organisations and businesses wishing to incorporate, or provide services which incorporate, Artificial
Intelligence. Researchers and individuals employed in the field of AI, technology management,
enterprise engineering, emerging technologies, industrial management and general engineering could
also benefit.
Stellenbosch University https://scholar.sun.ac.za

11 | P a g e
1.5 Ethical implications of the research
Ethical clearance for this research was required because it involved interviews and surveys with subject
matter experts and the individuals who are part of the case study. The researcher was required to adhere
to all ethical requirements as set out by Stellenbosch University. Although the information gathered
falls within the low risk category, it is handled anonymously and confidentially. Ethical clearance and
institutional permission to conduct and complete the study were obtained. The following stipulations
were addressed to ensure anonymity, confidentiality and protection of individuals and the data gathered:
• The information that was gathered from individuals, were labelled and remained completely
anonymous throughout the study
• The participation in this study was completely voluntarily and the participant was free to
withdraw from the study without any negative consequences
• If the participant wished to withdraw from the study, the data gathered from the specific
participant through the interview/survey would be permanently deleted/destroyed
• The participants were also free to refuse to answer questions they do not feel comfortable with
• All physical documents and information regarding the interview and physical survey was
securely stored in the faculty of the university
• The information obtained from the interviews and surveys was considered as opinion/insight
rather than fact
• The business that was approached for the case study, remained anonymous as well, to protect
individuals
1.6 Proposed research content breakdown
The table below describes the high-level study approach taken towards the completion of the project.
The expected outcomes and skills of each section are indicated below, thus providing a simple guide to
the proposed study.
Table 4. Proposed research content breakdown
Chapter 1
Introduction
Project background description
Problem statement description and project objectives
Conduct literature and theory analysis
Project scope description and expected contributions
Identify project timeline
Apply business plan development skills
Apply researching skills
Chapter 2
Methodology
Identify appropriate tools and methods to develop an AI readiness model in
the context of the project
Stellenbosch University https://scholar.sun.ac.za

12 | P a g e
Identify the most viable methodology method for the study
Chapter 3&4
Literature reviews
Identify viable decision support tools
Research the implementation of AI into business
Research different AI technology maturity levels and activities
Research on developing maturity and readiness models
Apply decision making skills
Conduct systematized literature reviews
Conduct narrative literature reviews
Chapter 5
Development of
readiness components
Organize and illustrate readiness components in terms of dimensions and
elements
Develop the readiness elements
Identify readiness variables within the elements
Chapter 6
Development of the
readiness model
Identify the readiness model process/operation steps
Identify validation processes and mechanisms
Develop the readiness model weightings
Develop calculations to determine business readiness for AI
Chapter 7 Conduct
case study
Develop requirements regarding case study
Identification of viable case study
Provide background information on case study
Conduct case study
Analyse the case study results
Chapter 8 Conclusion Provide a conclusion of the case study results
Provide insights into the applicability of the model
Provide insights into the advantages and disadvantages of the model
Provide possible future developments and improvements of the model
The background study of the project provided the principal information about the increased growth and
adoption of Artificial Intelligence technology. Successful implementation of AI technology provides
businesses and companies with competitive advantages and increased production and productivity. The
increase in adoption maturity percentages shows increasing interest from businesses. However, those
businesses wishing to capitalise on this technology face a number of challenges. Of these, the
implementation and integration of the Artificial Intelligence technology is one of the greatest. The
development of an AI-readiness model enabled the initialisation of a process that will assist in solving
the complex challenges which businesses face. The model aimed to assist in the successful integration
and implementation of AI technology by identifying readiness dimensions and elements, as well as
Stellenbosch University https://scholar.sun.ac.za

13 | P a g e
indicating shortcomings in the business. The outcome of this project should help businesses and
researchers involved in the field of Artificial Intelligence grow their understanding as we move towards
the 4th industrial revolution.
Stellenbosch University https://scholar.sun.ac.za

14 | P a g e
Chapter 2: Methodology
The methodology chapter explains the rationale behind using specific procedures and techniques, which
were used for the identification, selection, processing and analysis of information related to
understanding the research problem (USC, 2017). Chapter 2 presents the exploration and selection of
various methodologies. Advantages and disadvantages of the methodologies are weighed up to gain
clarity on their viability.
Chapter 2 Objectives Identify applicable methodologies
Describe each identified methodology
Provide advantages and disadvantages of each methodology
Select the most appropriate and viable methodology
Discuss literature review methodologies
2.1 Main research approaches
Conducting research, usually involves two main research approaches namely, quantitative and
qualitative. These approaches can be combined to form a mixed methods approach (Diriwächter and
Valsiner, 2006). Inductive and deductive reasoning formed an important part of better understanding
the research strategy appropriate for this project. The basis of grounded theory methodology comprises
the conjunction of deductive and inductive reasoning (Datt, 2016). These concepts will be explored in
the following sections.
2.1.1 Qualitative and Quantitative research
There are different definitions for qualitative research. One is that it is “Empirical research where data
is not in the form of numbers” (Punch, 1998). Another definition is that, qualitative research is multi-
methodological in method, which incorporates a naturalistic and interpretive approach to its subject
matter (Crozier, Denzin and Lincoln, 1994). This indicates that qualitative researchers study
phenomena’s, which are given meaning by people in their natural settings, through attempts of
interpretation (Crozier, Denzin and Lincoln, 1994). This research approach is exploratory in nature
(Corbin and Strauss, 1990). Among the data collection methods used are document analysis, multi-case
studies and semi-structured interviews with groups and individuals (Denzin, 1994). Interview
respondents are carefully chosen according to their field of expertise, to enrich chosen studies.
Quantitative research can be defined as research that gathers numerical data, which can be put into rank
orders, categories or be measured in units of measurement (Punch, 1998). Another definition is that
quantitative research is a systematic empirical investigation of observable phenomena through the use
of mathematical, computational or statistical techniques (Given, 2012). The objective of this method is
Stellenbosch University https://scholar.sun.ac.za

15 | P a g e
the collection of numerical data and application of mathematically based models, methods, hypotheses
and theories to explain a phenomenon (Aliaga and Gunderson, 2000),(Bhawna and Gobind, 2015). Data
that is not in a numerical format, such as opinions and behaviours need to be quantified through the use
of data collection methods like surveys and interviews. Researchers who use quantitative analysis draw
conclusions from evidence, logic and argument (Trochim, 2006). The key differences between
quantitative and qualitative research can be seen in the table below.
Table 5. Differences between qualitative and quantitative research (Celano, 2014)
Qualitative research Quantitative research
Type of knowledge Subjective Objective
Aim Explanatory and observational Generalisable and testing
Characteristics Flexible Fixed and controlled
Contextual portrayal Independent and dependent
variables
Dynamic, continuous view of
change
Pre- and post- measurement of
change
Sampling Purposeful Random
Data collection Semi-structured or
unstructured
Structured
Nature of data Narratives, quotations and
descriptions
Numbers and statistics
Value uniqueness, particularity Replication
Analysis thematic Statistical
Qualitative and quantitative research differ in purpose, data collection, approach and independence of
the researchers (Bryman et al., 2014). (Creswell, 2009). (Zikmund, 2003). The differences can be seen
in the table below.
Table 6. Differences between qualitative and quantitative research (Bryman et al., 2014), (Creswell,
2009), (Zikmund, 2003).
Component Qualitative research Quantitative research
Purpose Focus on discovery and
understanding of
ideas/phenomenon
Test research questions or
hypothesis
Approach Observation and interpretation Measurement and testing
Data Collection Unstructured and rich data Structured and hard data
Stellenbosch University https://scholar.sun.ac.za

16 | P a g e
Researcher independence Researcher intimately involved Objective results and
researcher uninvolved
Most often used in Exploratory research designs Descriptive and casual research
designs
General approach Descriptions and words Measurements and numbers
The insights gained into these research approaches provides the researcher with a better understanding,
in determining/developing a more applicable and accurate research methodology for the study. Mixed
methods combine qualitative and quantitative research methods (Diriwächter and Valsiner, 2006). The
motivation for adopting this research approach is due to the additional insights that could be obtained
through the combination of these methods (Creswell, 2009).
2.1.2 Grounded theory methodology
GTM (grounded theory methodology) has systematic and flexible guidelines towards the identification
and integration of ‘categories of meaning’ from systematically gathered data points (Strauss and Corbin,
1994), (Charmaz, 2006), (Glaser, 2013). Category integration and identification can be seen as the
‘method’ of the methodology and the end product or ‘theory’ of the methodology can be seen as the
developed framework, to assist in understanding the phenomena being investigated (Glaser, 2013).
Reviewing the data enables the categorization and identification of themes and concepts, which could
form the basis for a novel theory (Allan, 2003). The GTM strategy incorporates both inductive and
deductive reasoning (Glaser and Strauss, 1967). The process of GTM can be seen in the figure below.
Figure 4. GTM process steps (Allan, 2003)
GTM is widely recognised as the foundation for developing a conceptual framework (Jabareen, 2009),
(Astalin, 2013). Studies, which incorporate the use of the grounded theory methodology require the
collection of qualitative data to initiate the process (Allan, 2003), (Saunders, Lewis and Thornhill,
2016). The methodology of the study can be seen in the figure below.
Data Codes Concepts Categories Theory
Stellenbosch University https://scholar.sun.ac.za

17 | P a g e
Figure 5. Initial proposed study methodology
From the figure above it is clear that GTM (grounded theory analysis) forms the basis/foundation on
which the study is built. The systematized and narrative literature reviews provide the data required to
further progress in the GTM methodology in order to develop and complete the framework-focused
methodology in the study. In parallel with the conducting of the systematized literature reviews,
concepts which were identified are used as the focus for the narrative literature reviews, which together
feed into the framework focused methodology. The elaboration and evaluation of some research
methodologies can be seen in the following sections. The chosen methodology will form part of the
research design for this project. The systematized and narrative literature review methodologies are
further explained in the following sections.
2.2 Systematized literature review
The systematized literature review is a means towards identifying, evaluating and interpreting all the
available research, which is focused around a particular research question, phenomenon of interest or a
certain topic area (Keele, 2007). Studies that contribute are identified as primary studies and the
systematic review forms a secondary study. The aim of using a systematic literature review is to
summarise existing evidence around a specific phenomenon of interest, identification of any gaps in the
research, to suggest areas for further investigation and to provide frameworks to position new research
activities (Keele, 2007),(Okoli and Schabram, 2012). Systematic literature reviews also serve as a
method to examine the extent to which the empirical evidence contradicts or supports a theoretical
hypothesis (Keele, 2007).
The advantages and disadvantages of the systematic literature review are that it’s a well-defined
methodology, which means its less likely that the results of the literature is very biased. The systematic
literature review can provide information on the phenomenon’s effects from a wide range of settings
Stellenbosch University https://scholar.sun.ac.za

18 | P a g e
and empirical methods. In the case of quantitative studies, this method provides the possibility to
combine data using meta-analytic data (Keele, 2007). The major disadvantage of the systematic
literature review has to do with the amount of effort it requires in comparison to other, more traditional
literature reviews (Keele, 2007). The features and characteristics of the systematic literature reviews
are:
• The review starts by defining a review protocol, which specifies the methods that will be used
and specifies the research (Keele, 2007), (Okoli and Schabram, 2012).
• The review methods employ a defined search strategy for the identification of literature (Keele,
2007), (Okoli and Schabram, 2012).
• The search strategy is documented; thus, the reader can review the study robustness (Keele,
2007), (Okoli and Schabram, 2012).
• The systematic literature review specifies inclusion and exclusion criteria; these determine the
primary studies that will be included (Keele, 2007), (Okoli and Schabram, 2012).
• The review process indicates the information that will acquired from the primary studies, as
well as the inclusion of quality criteria for the evaluation of the primary studies (Keele, 2007),
(Okoli and Schabram, 2012).
The systematic literature review process has three main phases: planning the review, conducting the
review and reporting the review (Keele, 2007). The elements within these phases can be seen in the
figure below.
Figure 6. Systematized literature review process phases and steps (Keele, 2007).
This framework is evaluated to develop the systematized literature review methodology that was used
in this study. This systematized literature review procedure can be seen in the figure below. This
strategy incorporates all the significant steps of a systematic literature review.
Systematized literature review
- Identification of need
for a review
- Commissioning a
review
- Specify the research
question
- Develop review
protocol
- Evaluate review
protocol
- Identification of
research
- Selection of primary
studies
- Study quality
assessment
- Data extraction and
monitoring
- Data synthesis
- Specify dissemination
mechanism
- Formatting the main
report
- Evaluating the report
Planning Conducting Reporting
Stellenbosch University https://scholar.sun.ac.za

19 | P a g e
Figure 7. Systematized literature review strategy
2.3 Narrative literature review
The narrative literature review serves as a vital scientific function. Narrative literature reviews form
part of many theses, articles, books, grant proposals and reviews that are focused on reviewing literature
on specific topics (Baumeister and Leary, 1997). This review method summarizes a body of
knowledge/literature and develop conclusions about the researched topic (Cronin, Ryan and Coughlan,
2008). The narrative literature review typically selects the material, even though the selection criteria
is not always apparent to the reader (Cronin, Ryan and Coughlan, 2008). This type of literature review
gathers a volume of literature in specific subject area, summarises it and synthesizes the literature
(Cronin, Ryan and Coughlan, 2008).
The primary focus of this study is to provide a comprehensive background to present knowledge of the
study/research area and highlight the importance of new research. This approach can develop new
research questions and hypotheses by identifying possible gaps or inconsistencies within a body of
knowledge (Cronin, Ryan and Coughlan, 2008). This method can assist in refining or focusing a broad
research question. In this study, the research methodology incorporates both the systematized and
narrative literature reviews. The decision was been made, therefore, that the systematized literature
reviews will form the core of literature used in the development of the readiness model and the narrative
literature review will focus on the refinement of the study.
2.4 Framework focused methodologies
The overall study methodology used is the Grounded Theory Methodology (illustrated in Figure 5
below). There are two important sub-components of this research methodology. These are the literature
Review protocol strategy
Determine data sources and search terms
Determine selection criterion (Inclusion and exclusion criteria)
Determine application of selection criterion
Develop study quality assessment procedures
Develop the data extraction strategy
Develop dissemenation strategy.
Stellenbosch University https://scholar.sun.ac.za

20 | P a g e
reviews and the framework focused methodology that will be used to determine the overall
methodology used for this study. These framework focused-methodologies are incorporated to develop
a more applicable methodology for this particular study rather than an overall generic methodology.
The focus of this study and its model development is qualitative research and data. To some extent this
affects the outcome or applicability of methodologies. Three different framework focused
methodologies are described below. The advantages and disadvantages of these models are identified
and a set of criteria is developed to assess the methodologies to determine the most applicable one.
2.4.1 Rational model
The rational model of decision making encompasses individuals that use information and facts, analysis
and clearly defined procedures to make a decision. The rational decision making model incorporates
several different processes (Uzonwanne, 2016). Regardless of the variety or number of steps within
each process, the processes have similarities that usually result in effective solutions. The rational
decision making model steps can be seen in the figure below.
Figure 8. Rational decision making model (Uzonwanne, 2016)
2.4.2 Multi-criteria decision analysis
One characteristic of multi-criteria problems is that the information is complex. A Principle of the multi-
criteria decision analysis is to assist decision makers to synthesize and organise information so that they
are comfortable in decision making (Belton and Stewart, 2002). The MCDA has three main phases: the
problem structuring phase, scoring phase and the preference modelling phase. Each of these phases is
divided between goal and method sections, which respectively describe the goal and the methods within
each phase. Two types of information flow between the problem structuring phase and the scoring
phase. One set of information flowing from problem structuring phase to the scoring phase contains the
hierarchical structure with decision criteria, as well as the set of decision alternatives. The second flow
of information contains new information that was obtained in the scoring phase and which could
possibly require the restructuring of the decision problem. The final phase is focused on formalising the
Define the problem Identify the solution
scenario
Select best options Analyse option outcomes
Conduct a gap analysis
Gather facts, option and
alternatives
Implement decision and
evaluate final outcome
Stellenbosch University https://scholar.sun.ac.za

21 | P a g e
decision- maker’s preference structure. This identifies the best alternatives and can rank them from best
to worse. However, this phase is only initiated when a dominating alternative in the decision gate
process step cannot be identified or a ranking of alternatives is required. The phases of multi-criteria
decision analysis can be seen in the figure below.
Figure 9. MCDA process steps (De Graaf, Postmus and Buskens, 2015)
MCDA is a collection of approaches that take multi-criteria into account in order to assist the user group
to explore decisions which would have an impact on the situation (Saarikoski et al., 2015). Scholar and
academics have also recommended MCDA method for addressing intangible values (Saarikoski et al.,
2015).
Decision maker confronted with
problem
Problem structuring phase
Goal: Formulation of objectives
and identification aspect
relevant to problem
Methods: Structured
discussions followed by
structuring of the problem
Scoring phase
Goal: identify and incorporate
all data and knowledge on the
problem
Methods: Structured
discussions followed by
structuring of the problem
Intermediate outcome: Table with
all alternatives scored on each criterion
Decision gate: Has a dominant
alternative been identified or is
further analysis required
Outcome: Decision based
on information in scoring
table
Preference modelling phase
Goal: Formalize decision maker
preference structure to rank
and identify best alternatives
Methods: Problem is decomposed
into smaller problems, which
preference information is obtained
for. Mathematical function compiles
preference for full problem Outcome: Decision based
on preference model
Intermediate outcome:
Hierarchical structure of
problem with decision
criteria and set of
alternatives
New information
obtained from scoring
phase, could cause
restructuring of
problem
Stellenbosch University https://scholar.sun.ac.za

22 | P a g e
2.4.3 Conceptual framework analysis
Conceptual framework analysis (CFA) is a theory technique, which aims to create, identify and track
major concepts and events, which combined, constitutes the theoretical framework. The basis of the
methodology consists of interaction among concepts induced from data, derivation and deduction aimed
at hypothesizing the relationship between concepts (Jabareen, 2009). The main feature of the conceptual
framework analysis is that it is not a collection of concepts, but a construct where each concept plays
an important role. The method focuses on providing an interpretive approach to social reality. It
provides understanding rather than a theoretical explanation, such as quantitative models. It provides a
soft interpretation of intentions, rather than the knowledge of the hard facts. Conceptual frameworks
are indeterminist in nature; thus, it does enable the prediction of an outcome. The conceptual
frameworks can be constructed and developed through qualitative analysis. The sources of data from a
range of discipline-orientated theories, which becomes empirical data within the conceptual framework
analysis. The CFA consists of eight phases that follow sequentially. The phases of the CFA can be seen
in the figure below.
Figure 10. CFA process steps (Jabareen, 2009)
Stellenbosch University https://scholar.sun.ac.za

23 | P a g e
The data of the CFA should represent relevant political, environmental, social and cultural phenomena.
This includes multi-disciplinary literature that encompasses the phenomenon being studied (Jabareen,
2009). The CFA process is comparative and iterative, which requires a shift between data and concepts,
as well as comparing different types of evidence (Jabareen, 2009).
2.4.4 Advantages and disadvantages of proposed methodologies
To assist in the selection of the appropriate methodology, the advantages and disadvantages of the
methodologies have been identified. The advantages and disadvantages can be seen in the table below.
Table 7. Advantages and disadvantages of different methodologies
Methodology Advantage Disadvantage
The rational
(decision-making)
model
• Decision process is
predictable (Chaffee,
1983).
• Provides relatively
predictable responses
(Chaffee, 1983).
• When used in isolation, results
are inaccurate (Chaffee, 1983).
• Results are inaccurate when
insufficient range of solutions
are generated (Chaffee, 1983).
Multi-criteria
decision analysis
(MCDA)
• Incorporates multiple
stakeholder
perspectives (Hongoh et
al., 2011).
• Incorporates uncertain,
subjective and
qualitative information
(Kujawski, 2003).
• Makes use of a single score to
effectively characterize a
complex problem/situation
(Kujawski, 2003).
Conceptual
framework analysis
• Flexibility (Jabareen,
2009).
• Capacity for
modification (Jabareen,
2009).
• Assists in
understanding a
phenomenon (Jabareen,
2009).
• This methodology is not
sufficient for generating
theorization (Jabareen, 2009)
Stellenbosch University https://scholar.sun.ac.za

24 | P a g e
2.4.5 Proposed Methodology
Certain criterion had to be met in relation to the methodology towards the development and completion
of this study. The table below assesses each methodology with regards to the selection criteria. This
was used in combination with information from the previous section to determine the most viable
methodology for this study.
Table 8. Viability of different methodologies
Criteria Rational Model Multi-criteria decision
analysis
Conceptual framework
analysis
Accommodates
qualitative research
Methodology is
flexible and has
capacity for
modification
×
The methodology can
be tailored for a
specific problem.
×
Drawing on the information of the table above and the previous section, one can conclude that the
conceptual framework analysis process is the most applicable and appropriate methodology for this
study. A more detailed conceptual framework analysis model with regards to the study and problem
statement is presented in Appendix B. The figure in Appendix B indicates the conceptual framework
analysis model phases and corresponding chapters of the thesis, with short description of what the focus
of each phase is. The selected research design for this study is the combination of GTM and CFA. These
approaches provide a solid foundation towards the development of this study. The figure below provides
an illustrative representation of the chosen research design.
Stellenbosch University https://scholar.sun.ac.za

25 | P a g e
Figure 11. Study Methodology
Following the development of the research methodology that will be used in this study. The initial
process steps with regards to this methodology starts with the systematic and narrative literature
reviews. The following two chapters will focus on the two chosen literature reviews for this study as
identified in section 2.2 and section 2.3.
GTM
Systematic literature review
Narrative literature review
Conceptual framework analysis
Deconstruction
and
categorization
of concepts
Integrating
concepts
Synthesis and
resynthesize
Validation
of
conceptual framework
Rethinking
of
conceptual
framework
Stellenbosch University https://scholar.sun.ac.za

26 | P a g e
Chapter 3: Narrative Literature Review
Chapter 3 focuses on the narrative literature review method. The two literature review methods used in
this study are conducted in parallel. Thus, themes identified in the systematized literature reviews can
be further researched in the narrative literature review section, it is important to note that the narrative
literature review is more focused towards supplementing ideas and categories found in the systematized
literature reviews, thus the literature in this section could seem non-sequential and high level. Narrative
literature reviews form an important part of most empirical articles, theses and grant proposals
(Baumeister and Leary, 1997). The general description of literature reviews is identified, followed by
an initial literature search with regards to this topic followed by the main narrative literature review for
this study. The figure below indicates that this section encompasses the narrative literature review
process step with regards to the study methodology.
Figure 12. Study methodology process step
Chapter 3 Objectives Conduct Initial literature research
Present narrative literature reviews
Identify literature to assist in the development of the readiness model
Identify artificial intelligence specific elements and dimension with regards
to readiness
Identify maturity model literature
Weighting methods for readiness model
Decision support methods
The following sections serves as an initial literature scan to identify if there are existing academic
literature that is similar or the same to the aim of this study. The overview of research concepts that was
identified in the systematized literature review in combination with the initial literature search was
completed and researched on a high level. This is illustrated in the figure below.
GTM
Systematic literature review
Narrative literature review
Conceptual framework analysis
Deconstruction
and
categorization
of concepts
Integrating
concepts
Synthesis
and
resynthesize
Validation
of
conceptual framework
Rethinking
of
conceptual
framework
Stellenbosch University https://scholar.sun.ac.za

27 | P a g e
Figure 13. Narrative literature review concepts/sections
3.1 Initial literature research
The overview of relevant literature provides initial insight into what theories and information are
applicable for the study. The different areas in the literature can be seen in the following sections.
Relevant topics and papers are searched using certain key words. The focus of this section is gaining
insights on the topic, as well as verifying that identical literature has not been developed or published.
A literature review is a detailed summary and critical analysis of literature and research that is available
and relevant towards the proposed study (Cronin, Ryan and Coughlan, 2008). The type of literature
review utilised is the traditional or narrative literature review. The criteria for the selection of the
literature is not always apparent to the reader. This method is used, because it is useful in capturing and
synthesizing the relevant literature with the aim to provide a broad background of the current literature
and understanding of the topic, as well as identification of gaps in the literature (Cronin, Ryan and
Coughlan, 2008). The literature review process follows the sequence seen below.
Figure 14. General literature review steps (Cronin, Ryan and Coughlan, 2008)
The first step in the literature review process has been completed in the previous chapter. The problem
statement questions shown in chapter 1 provides the initial point of interest with regards to search terms
are used in the search of literature.
1. Select review topic
2. Search the literature
3. Gather, read and
analyze the literature
4. write the review
5. Referencing
Narrative literature review
Initial literature
screening
Generic decision-
making methods
Maturity model:
Capability maturity
model
Artificial intelligence
and industry 4.0
high level screening
Stellenbosch University https://scholar.sun.ac.za

28 | P a g e
Artificial intelligence integration research
Keywords such as artificial, intelligence, integration, readiness and model were searched in google
scholar and Scopus to obtain relevant literature and studies that were done in this field. The literature
provided insights into the integration of different Artificial intelligence approaches and models aimed
at the creation of hybrid AI systems. The study (Corchado, 1998), summarized that research in the
domain of AI is aimed to develop methods and techniques to make expert systems more efficient and
provide more reasoning power. Resilient intelligent frameworks can be developed by the combination
of AI techniques (Corchado, 1998). Another study of Artificial intelligence techniques and methods,
which are adequate for the implementation of a computerized intelligent autonomous manufacturing
environment was identified (Rotty, 1996). Overall, however, the literature stated that there is a shortage
of integrated, developmental approaches for AI methods in the computer integrated manufacturing
industry (Rotty, 1996).
A maturity model for assessing readiness for industry 4.0 was retrieved (Schumacher, Erol and Sihn,
2016). This document provided some insight into combining maturity models and readiness. As well as
identifying important business dimensions that form part of determining the readiness of
implementation of digital technologies. This model however provides only insight into industry 4.0 and
not specifically artificial intelligence.
From the initial literature analysis, it was clear that there is a shortage of academic, structured, generic
frameworks and models that assist businesses and companies implement and integrate artificial
intelligence into their current business structures.
Maturity models, business process management and readiness models
As seen in the previous section there is a shortage of literature focused on the integration and
implementation of AI, which is a large and important challenge and barrier towards adopting AI systems
into businesses. The benefits of including AI into businesses are critical for businesses to compete on
the local and global markets. Initial literature analysis of maturity models indicated that, in its simplest
form, it is a set of patterns, indicators and characteristics that depict the achievement and advances in a
particular discipline (Energy, 2012). In summary, the primary outputs of a maturity model are that it
provides a starting point, a framework for prioritizing activities and provides a method to define what
maturity and improvement represents for an organization (Energy, 2012).
Because a maturity models provides a possible starting point towards solving the challenges of
integration and implementing artificial intelligence in businesses, the choice was made to further
research this topic. Established practice has shown that a process capability profile based on a maturity
Stellenbosch University https://scholar.sun.ac.za

29 | P a g e
model can help software-centred organisations improve and assess software processes (Von
Wangenheim et al., 2010).
The conclusion drawn from a systematic literature review study on software process maturity models,
is that there are 29 different domains in which the development of maturity models is made for (Von
Wangenheim et al., 2010). Three of these models are aligned towards a generic domain of systems
engineering and software, which includes acquisition, services and development (Von Wangenheim et
al., 2010). These three models provide important input towards developing a robust maturity model, as
well as tailoring the generic attributes of maturity models, with applicable literature, to create a model
which is more focused on AI implementation.
Business process management merges tools, frameworks, methodologies and objectives. These are
included in a number of approaches such as business process modelling, business process automation
and business process reengineering. Business process management is focused on managing processes
on a continuous basis. It relies on solid systems, structural change and cultural change. Business process
management is thus a holistic organizational management practice. It is interconnected with process
architecture, which indicates the interrelationships between primary business processes, as well as the
enabling of support processes and focusing the alignment with the goals and policies of the organisation
(Rosemann and De Bruin, 2005). This could provide important insight into better understanding the
effect and importance of activities within the maturity levels and their impact on other sectors of the
organisation.
The initial literature searches revealed a definitive shortage with regards to readiness models and
maturity models that address the implementation of artificial intelligence in businesses. The following
sections focus on decision-making methods, maturity models and AI readiness models.
3.2 Generic decision-making methods
Decision-making involves making the logical and applicable choice from a list of available options.
The ability to forecast the outcome of each option is an important aspect for effective decision-making
(Businessdictionary, 2017). A variety of decision-making methods exist, each with its own
distinguished characteristics, disadvantages and advantage. In this section, advantages, disadvantages
and a description of a few decision-making methods are identified. They are presented in the table
below.
Stellenbosch University https://scholar.sun.ac.za

30 | P a g e
Table 9. Advantages and disadvantages of decision-making methods
Decision-making
method
Description Advantage Disadvantage
Analytical hierarchical
process
Makes use of pair-wise
comparisons. These
are used to compare
different alternatives
with respect to selected
criteria, as well as to
estimate weightings of
criteria (Velasquez and
Hester, 2013)
This method is
scalable, easy to use,
not data intensive and
easily adjustable to fit
various sized problems
(Velasquez and Hester,
2013)
This method has
Independence of
alternatives and criteria
could possibly cause
inconsistencies
between ranking
criteria and judgement
(Velasquez and Hester,
2013)
Decision matrix The matrix is used to
evaluate all options
with regards to a
decision. The steps
towards conducting
this method are list all
options in the first
column, list all factors
that affect decision in
the first row; users
score each option and
weigh which factors
are more important and
determine final score
of each row is
determined to indicate
the best option (Tools,
2017)
This method allows for
the inclusion of
weightings to factors
and assists in removing
subjectivity (It, 2017)
T-Chart This evaluates
different options by
weighing up minuses
and plusses of each
option (Tools, 2017)
It takes into account all
negatives and positives
(Decisions, 2017)
The weight of each
factors is not taken into
account (Decisions,
2017)
Stellenbosch University https://scholar.sun.ac.za
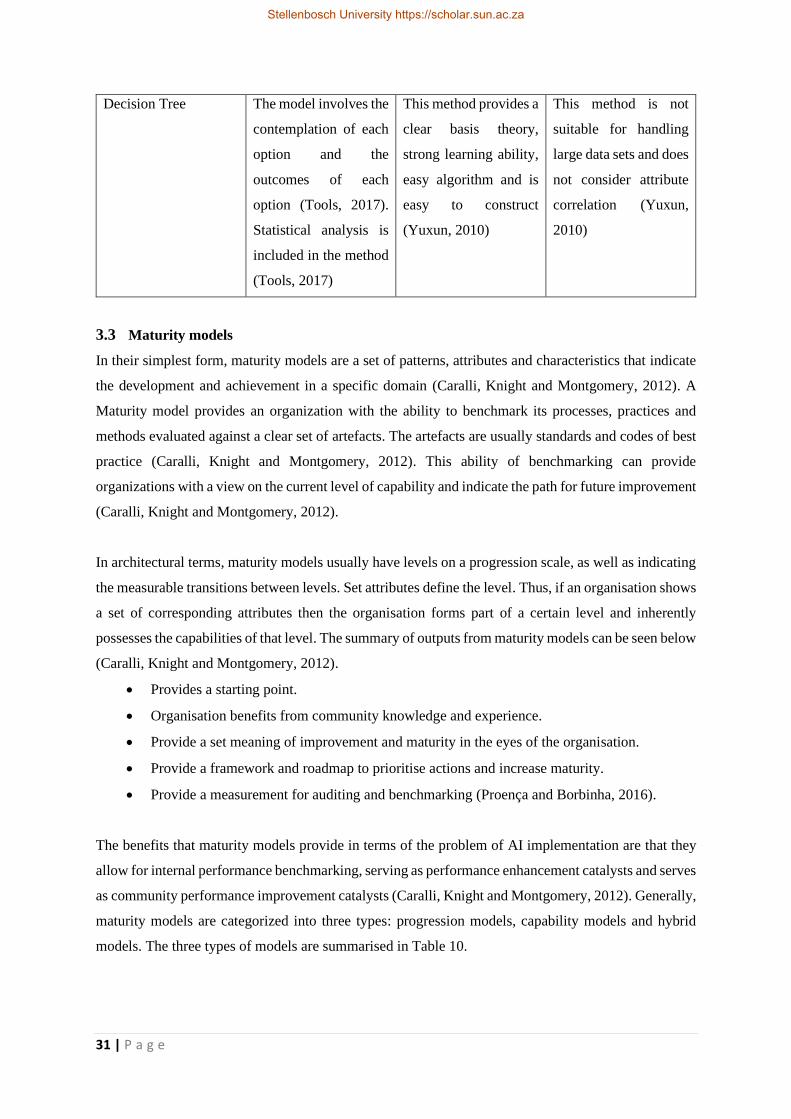
31 | P a g e
Decision Tree The model involves the
contemplation of each
option and the
outcomes of each
option (Tools, 2017).
Statistical analysis is
included in the method
(Tools, 2017)
This method provides a
clear basis theory,
strong learning ability,
easy algorithm and is
easy to construct
(Yuxun, 2010)
This method is not
suitable for handling
large data sets and does
not consider attribute
correlation (Yuxun,
2010)
3.3 Maturity models
In their simplest form, maturity models are a set of patterns, attributes and characteristics that indicate
the development and achievement in a specific domain (Caralli, Knight and Montgomery, 2012). A
Maturity model provides an organization with the ability to benchmark its processes, practices and
methods evaluated against a clear set of artefacts. The artefacts are usually standards and codes of best
practice (Caralli, Knight and Montgomery, 2012). This ability of benchmarking can provide
organizations with a view on the current level of capability and indicate the path for future improvement
(Caralli, Knight and Montgomery, 2012).
In architectural terms, maturity models usually have levels on a progression scale, as well as indicating
the measurable transitions between levels. Set attributes define the level. Thus, if an organisation shows
a set of corresponding attributes then the organisation forms part of a certain level and inherently
possesses the capabilities of that level. The summary of outputs from maturity models can be seen below
(Caralli, Knight and Montgomery, 2012).
• Provides a starting point.
• Organisation benefits from community knowledge and experience.
• Provide a set meaning of improvement and maturity in the eyes of the organisation.
• Provide a framework and roadmap to prioritise actions and increase maturity.
• Provide a measurement for auditing and benchmarking (Proença and Borbinha, 2016).
The benefits that maturity models provide in terms of the problem of AI implementation are that they
allow for internal performance benchmarking, serving as performance enhancement catalysts and serves
as community performance improvement catalysts (Caralli, Knight and Montgomery, 2012). Generally,
maturity models are categorized into three types: progression models, capability models and hybrid
models. The three types of models are summarised in Table 10.
Stellenbosch University https://scholar.sun.ac.za

32 | P a g e
Table 10. Maturity model descriptions (Caralli, Knight and Montgomery, 2012).
Type of
maturity
model
Description
Progression
model
Progression models represent progression of an attribute where the development up
the maturity levels indicate progress in the attribute maturity (Caralli, Knight and
Montgomery, 2012). These models are measured independently and focus on model
attributes instead of attributes that define maturity (Caralli, Knight and Montgomery,
2012).
Capability
model
The measured dimension represents the organizations’ capability with regards to
certain attributes, characteristics and patterns (Caralli, Knight and Montgomery,
2012). This model focuses on the broader organisational capability rather than the
ability of performing a simple task (Caralli, Knight and Montgomery, 2012).
Hybrid
model
Hybrid models form with the integration of progression model and capability model
characteristics. This transitions between levels are similar to the capability model and
use the attributes in an architectural progression model way (Caralli, Knight and
Montgomery, 2012).
While there are different types of maturity models, but these models mostly conform to certain basic
structures (Caralli, Knight and Montgomery, 2012). The importance of this structure is due to the
connection it provides between best practices, assessments and objectives. The relationship between
current capabilities and improvement roadmaps is facilitated through linking it to business goals,
objectives and standards (Caralli, Knight and Montgomery, 2012). The structures/components are
(Caralli, Knight and Montgomery, 2012):
• Levels: Representation of transitional states.
• Model domains: For the subject matter of the model. It groups similar attributes into an area of
importance.
• Attributes: These are expressed as characteristics, practices, qualities and indicators that are
based of observed standards, practices and expert knowledge.
• Appraisal and scoring methods: The scoring methods are algorithms used to ensure that the
appraisals are consistent and follow a standard of measurement.
• Improvement roadmaps: Maturity models can be used as guides for improvement efforts.
Capability maturity model
The capability maturity model describes an evolving improvement process ranging from an initial,
immature process to a well-defined, mature process. In terms of software development Capability
Stellenbosch University https://scholar.sun.ac.za

33 | P a g e
maturity models cover practices for engineering, management of software development and
maintenance and planning. The ability of organizations to meet objectives in terms of product quality,
cost, scheduling and functionality are improved by these key factors (Kumta and Shah, 2002). The
capability maturity model framework can be seen in the figure below.
Capability Maturity Model
Figure 15. Capability maturity model levels (Kumta and Shah, 2002)
In the table below, the levels of the capability maturity model are further elaborated on with an added
focus on software development.
Table 11. Maturity model level descriptions (Kumta and Shah, 2002)
Maturity
model level
Description
Initial level This level indicates that the level of performance of the organization is driven by
the competence and skill of the employees (Kumta and Shah, 2002).
Repeatable
level
This level focuses primarily on projects. The need in this level is to establish an
effective software project management (Kumta and Shah, 2002). These
management processes are documented and followed. Top management is only
partially involved.
Defined level This level has an organizational focus, through attaining the best practices across
the organization. The establishment of common processes (organization standard
software processes) for software management, engineering, measurements and
training in this level supports the completion of projects (Kumta and Shah, 2002).
The process capability is determined through an organization wide understanding
of the roles, responsibilities and activities (Kumta and Shah, 2002).
Managed level On this level, organisations set quantitative measurable objectives for software
processes and products, determining decisions from the data collected and
1. Initial Level
2. Repeatable
Level
3. Defined Level
4. Managed Level
5. Optimizing Level
Stellenbosch University https://scholar.sun.ac.za

34 | P a g e
quantitatively controlling process performance and project progress (Kumta and
Shah, 2002).
Optimizing
level
During this level, the main focus is on continuous process improvement. This
consists of controlled change and a measurable enhancement in process capabilities
(Kumta and Shah, 2002). Examples are reducing the possibility of defects and
supporting innovations.
3.4 Artificial Intelligence and industry 4.0 Readiness
Organisations that wish to implement artificial intelligence into their business could possibly be on
different readiness/maturity levels when compared to one another. Intel released a White Paper which
showed that, through past business experiences, businesses that are acquiring information or
implementation on AI can be divided into three groups. These are: organisations that are new to the
concept of AI; organizations that are ready to scale up AI; and organizations that are widely
implementing AI (Intel, no date a). These scenarios and organizations are further described in the table
below.
Table 12. Organization grouping with respective scenarios (Intel, no date a)
Organization group Common scenarios
Organizations that are new to the concept of AI Organizations with large existing pools of data.
Organizations that are executing a workload in a
traditional environment.
Some organizations have been researching AI,
but mapping the value-added benefits in
advance before implementation is a challenge.
Organizations that are ready to scale up AI.
These can be organizations that have developed
a proof of concept for a workstation or device.
Organizations that have developed their own
solution and is looking to implement industry
standard software.
Organizations that are widely implementing AI. Organizations that aiming to expand, due to
successfully using AI in a specific stream of
business.
Organizations are successfully learning and
interpreting data through AI, but are looking for
Stellenbosch University https://scholar.sun.ac.za

35 | P a g e
AI solutions that can conduct inference-based
activities.
Businesses can be present in various stages of their AI goals and objectives. Continuous success and
development to the next stages of their particular AI objectives is dependent on having the correct
components established in areas, such as: models and processes; technology and infrastructure; and
resources and skills (Intel, no date a). AI readiness is thus divided into three categories: foundational
readiness; operational readiness and transformational readiness. Important components of each type of
readiness is identified and can be seen in the figure below.
Figure 16. Different types of AI readiness (Intel, no date a)
As AI forms a part of the development and growth of industry 4.0. The study identifies company
dimensions used to group maturity items. These, in turn, are used to determine business readiness for
industry 4.0 (Schumacher, Erol and Sihn, 2016). This process can be useful when starting to understand
what company elements are involved in determining a business’ readiness for artificial intelligence. The
important generic company dimensions are strategy, leadership, customers, products, operations,
culture, people, governance and technology. It can be concluded that the supplemental reviews provided
some important insights and data with regards to developing the readiness models. This was the
examination of the capability maturity model, generic decision-making methods, AI and industry 4.0
readiness. This is used in combination with the data gathered from the systematized literature review to
develop the core of the readiness model. These components will be further identified and categorized
at the end of Chapter 4.
Foundational
Operational
Transformational
Types of AI readiness
Cloud resources
Infrastructure platforms
Data Sources
Software packages
Skills and expertise
Agile delivery
Cybersecurity
Governance, compliance and risk
Operational management
Business acceptance
Business clarity
Business opportunity
Strategic leadership
Stellenbosch University https://scholar.sun.ac.za

36 | P a g e
Chapter 4 Systematized literature review
Chapter 4 presents the systematized literature reviews conducted for the thesis. The systematized
reviews conducted focus on AI readiness, implementation and maturity through the identification of
relevant readiness dimensions and elements that are required to determine a business’ readiness for AI.
A systematic literature review is an important tool used to support evidence-based paradigms from
different domains (Budgen and Brereton, 2006). These reviews use carefully developed/defined
protocols, which assist in determining which studies are included/excluded, as well as analysing the
studies’ contributions (Budgen and Brereton, 2006).
Figure 17. Study methodology steps
Chapter 4 Objectives Find effective protocols/methodology for conducting a systematized literature
review
Conduct a systematized literature review, which encompasses AI readiness,
implementation and maturity
Synthesize and elaborate on important concepts found regarding artificial
intelligence
4.1 Review protocol
In order to conduct the systematized literature reviews, the focus should first shift towards the development of a
literature review protocol strategy. This will form the basis and framework for completing the systematized
literature reviews. The review protocol designed for this study includes six sequential steps. These steps are:
identification of data sources and search terms, development of selection criteria, application of selection criteria,
development of study quality assessment procedures, development of extraction strategy and development of
dissemination strategy (Keele, 2007), (Okoli and Schabram, 2012). The steps can be seen in Figure 18.
GTM
Systematic literature review
Narrative literature review
Conceptual framework analysis
Deconstruction
and
categorization
of concepts
Integrating
concepts
Synthesis
and
resynthesize
Validation
of
conceptual framework
Rethinking
of
conceptual
framework
Stellenbosch University https://scholar.sun.ac.za

37 | P a g e
Figure 18. Review protocol strategy (Keele, 2007), (Okoli and Schabram, 2012)
4.2 Maturity implementation model for artificial intelligence
The first systematized literature review focuses on artificial intelligence in combination with
maturity/implementation models. The objective was to search through the literature for models,
frameworks, as well as business dimensions and elements which assists in determining a business’
readiness for the facilitation, integration or planning of AI into the business. The strategy for this
systematized literature search followed the protocol developed in Figure 18.
Search terms
The data base, Scopus was used for the literature search. Scopus is large citation and abstract database
consisting of peer-reviewed literature, which consists of conference papers, books and journals (Scopus,
2018). The Scopus database was searched using the search terms shown Table 13. The primary studies
were iterated by adding additional terms in the database search. The search was filtered to search for
abstracts, titles and keywords. The results can be seen below.
Table 13. Database search results
Scopus database search (conducted on 05/06/2018)
Search terms Number of studies found
Artificial 1 010 882
Artificial AND Intelligence 288 409
Artificial AND Intelligence AND
Maturity
351
Review protocol strategy
Determine data sources and search terms
Determine selection criterion (Inclusion and exclusion criteria)
Determine application of selection criterion
Develop study quality assessment procedures
Develop the data extraction strategy
Develop analyses strategy
Stellenbosch University https://scholar.sun.ac.za

38 | P a g e
Artificial AND Intelligence AND
Maturity AND Implementation
55
Artificial AND Intelligence AND
Maturity AND Implementation AND
Model
35
As Table 13 illustrates, the search term iteration reduced the number of primary studies to 35 studies.
The author names, paper title, publication year, affiliations, abstract and methodology were retrieved
from these primary documents. These documents were then assessed against the developed selection
criteria to assist in improving the quality of the outcomes, as well as reducing any bias or repetition.
The CAT1 and CAT2 selection criteria, as seen in Table 14, were applied while the documents’ data
was being obtained due to the application of these criterion is simple in nature.
Application of selection criteria
The selection criteria that had been developed focused on availability, language, types of literature,
applicability of literature and academic robustness of the literature. Descriptions of the criteria can be
seen in Table 14 below. The papers that the search term iterations found were scrutinised and important
information was extracted from them. The information consists of author names, abstracts, paper titles,
publication years, affiliations and types of documents. The information gathered was then exported to
excel where it is assessed in terms of the selection criteria in the sequence of validation, which is CAT1,
CAT2, CAT3, CAT4 AND CAT5. This can be seen in Appendix L.
Table 14. Selection criteria
Reference of criteria Criteria Description of criteria
CAT1 Availability The full document must be
freely available online.
CAT2 Language English literature only.
CAT3 Types of literature Conference reviews, lecture
notes and lecture presentations
are excluded.
CAT4 Applicability of literature Ensure that the literature has
relevant input towards the
proposed study from evaluating
the abstract.
CAT5 Academic robustness of the
paper
The literature is evaluated in
terms of validity of the
Stellenbosch University https://scholar.sun.ac.za

39 | P a g e
methodology used, number of
citations, use cases, interviews
and length of the paper.
To be included, a study had to pass all the selection criteria. After the primary studies had been
validated against the selection criteria, ten studies remained. Their studies’ titles are:
• Digitalization Canvas – Towards identifying digitalization use cases and projects
• Neural networks: An overview of early research, current frameworks and new challenges
• An enterprise risk management knowledge-based decision support system for construction
firms
• Determination of Rule Patterns in Complex Event Processing Using Machine Learning
Techniques
• A guide to implement open data in public agencies
• Research on quality measuring of CMMI cyclic implementation in software process
• Managing quality in outsourcing of high-end services: A conceptual model
• A model to assess open government data in public agencies
• Computer-aided warehouse engineering (CAWE): Leveraging MDA and ADM for the
development of data warehouses
• A development process of KMS based on systems engineering methodology
These studies are further examined in the quality assessment section following to ensure that they are
viable, robust and provide insightful information with regards to the proposed study.
Quality Assessment
The quality criterion developed consists of methodology, aim/goals and completeness of document.
The descriptions of these criterion can be seen in the table below.
Table 15. Quality Assessment criteria
Quality assessment
categories
Description
Completeness of document Sufficient sections are included in the study, such as abstract,
methodology and validation of research.
Methodology Robust/satisfactory methodology which should be appropriate for
the stated research question.
Aim/Goals Clear and thorough statement of the research.
Stellenbosch University https://scholar.sun.ac.za

40 | P a g e
The quality of the ten studies was assessed against the criteria. All the studies passed the selection
criteria, as seen in Appendix M. During this quality assessment phase, it became apparent that two
studies with different titles have the exact same content, the two studies are entitled “A model to assess
open government data in public agencies” and “a guide to implement open data in public agencies”.
One of these studies was removed.
Extraction and analyses of the data
The following sections will provide some information on the literature that was found and that passed
the selection process. The purpose is to better understand the data which was gathered and its context.
The data extraction strategy was designed to collect all the information required to address the research
review questions and quality criteria (Keele, 2007), (Okoli and Schabram, 2012). The papers are
individually read and the information with regards to the research questions and quality criteria
extracted.
Initially a descriptive analysis was done on the studies that passed the inclusion criteria, as well as the
quality assessment. The number of citations for each of the papers obtained is shown in the figure
below. From a researchers’ stand point, this analysis is valuable in terms of determining, which were
highly cited papers and from there determine the relevant authors. The knowledge of these authors
could provide researchers in the future with a more immediate way to identify relevant topics from
highly regarded authors and researchers
Figure 19. Number of citations
0 2 4 6 8 10 12 14 16 18
[20]
[21]
[22]
[23]
[24]
[25]
[26]
[27]
[28]
Number of citations
Stu
dy
refe
ren
ces
Approved study citations
Stellenbosch University https://scholar.sun.ac.za

41 | P a g e
The publication years of the selected studies can be seen in the table below. This provides some insights
into how recent these chosen studies are. Because they are recent, the studies could still provide
applicable literature with regards to the study.
Table 16. Publications year of studies
Approved Studies Publication
Date
Digitalization Canvas – Towards identifying digitalization use cases and projects
(Heberle et al., 2017)
2017
Neural networks: An overview of early research, current frameworks and new
challenges (Prieto et al., 2016)
2016
An enterprise risk management knowledge-based decision support system for
construction firms (Zhao, Hwang and Low, 2016)
2016
Determination of Rule Patterns in Complex Event Processing Using Machine
Learning Techniques (Mehdiyev et al., 2015)
2015
Research on quality measuring of CMMI cyclic implementation in software
process (Zhou and Li, 2012)
2012
Managing quality in outsourcing of high-end services: A conceptual model
(Srivastava, Sharfuddin and Datta, 2012)
2012
A model to assess open government data in public agencies (Solar, Meijueiro and
Daniels, 2017)
2012
Computer-aided warehouse engineering (CAWE): Leveraging MDA and ADM for
the development of data warehouses (Kurze and Gluchowski, 2010)
2010
A development process of KMS based on systems engineering methodology (Xu,
2009)
2009
Stellenbosch University https://scholar.sun.ac.za

42 | P a g e
Analysis of chosen studies
The analysis of the chosen studies, encompasses defining categories or themes with regards to maturity,
model development and AI implementation from the chosen studies.
Approved Study 1
Digitization is the process of transitioning from analogue to digital forms. Digitalization involves
using digital technologies to improve value-adding opportunities and business models (Heberle et al.,
2017). Digitization is a prerequisite for successful digitalization towards implementing software
business processes (Heberle et al., 2017). AI technologies and digitalization projects require drivers
such as data collection and data usage in the business, as well as resources, budgets and support from
management (Heberle et al., 2017). There are two approaches towards digitalization: top down and
bottom up (Heberle et al., 2017). These approaches raise the following questions:
• Top down (Heberle et al., 2017): How does digitalization change the business model? What are the
benefits of digitalization for the business?
• Bottom up (Heberle et al., 2017): How can digitalization optimize current business processes? Which
data sources are available? Which data analytics are required?
Figure 20. Themes and categories within Digitization Canvas (Heberle et al., 2017)
From the information gathered, it is evident that AI forms part of business’ digital
transition/transformation: i.e. digitization and digitalization. The main information that is extracted, is
possible business elements that are vital to facilitate digitization/digitalization, that can be applied to AI
as well. These elements are data collection, data usage, digitalization resources, budgets and executive
support.
Develop Use case
and requirements
Digitalization &
Digitization Digitalization &
Digitization
Importance of Data
with regards to
Digitalization Enablers of
digitalization
Digitalization Canvas
Stellenbosch University https://scholar.sun.ac.za

43 | P a g e
Approved Study 2
In summary, the main points derived from the literature are: defining the advantages and outputs of
capability maturity models, high level description of capability maturity levels and operations.
Capability maturity model integration describes discrete levels of process improvement which can be
applied towards processes and organizations (Zhou and Li, 2012). The capability maturity model
integration presented in the systematized literature review has five maturity levels and twenty-two key
process areas. The five maturity levels are initial, managed, defined, quantitatively managed and
optimizing (Zhou and Li, 2012). The maturity levels advance in ascending order. For example, if a
business wants to achieve a level 3 CMMI, then all the key processes in level 2, as well level 3 must be
satisfied (Zhou and Li, 2012). This study provides a maturity model (capability maturity model
integration) that focuses on quality improvements. There must thus be further studies conducted on the
different application of maturity models, with the aim of integrating the literature into an effective
maturity model, which assists in AI implementation.
Figure 21. Themes and categories within Research on Quality Measuring of CMMI Cyclic
Implementation in software (Zhou and Li, 2012)
The following studies (approved studies 3-9) passed the selection criteria and quality assessment.
However, these studies did not produce relevant data with regards to this study or to the development
of the readiness models. The themes and categorisation of these papers are shown in the Figures below.
Approved Study 3
In this study (Prieto et al., 2016), the neural networks study provided in-depth insights into neural
networks – a method of AI and the application thereof. The theme of data was also highlighted in the
study; however, the study was not high level enough in terms of business requirements, operations or
management thereof. The themes can be seen in the figure below.
Research on Quality
Measuring of CMMI Cyclic
Implementation in software
process
Maturity model
levels
Maturity model
key process areas
Capability maturity
model integration
Software development
and designing
Stellenbosch University https://scholar.sun.ac.za
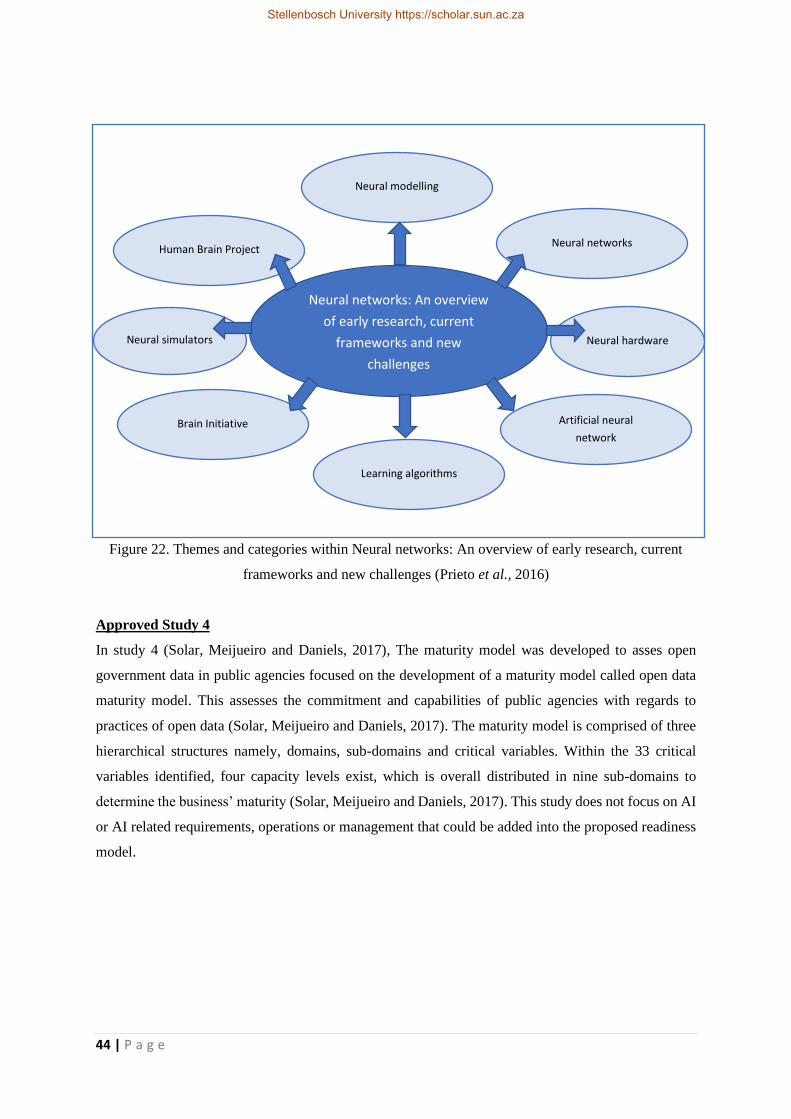
44 | P a g e
Figure 22. Themes and categories within Neural networks: An overview of early research, current
frameworks and new challenges (Prieto et al., 2016)
Approved Study 4
In study 4 (Solar, Meijueiro and Daniels, 2017), The maturity model was developed to asses open
government data in public agencies focused on the development of a maturity model called open data
maturity model. This assesses the commitment and capabilities of public agencies with regards to
practices of open data (Solar, Meijueiro and Daniels, 2017). The maturity model is comprised of three
hierarchical structures namely, domains, sub-domains and critical variables. Within the 33 critical
variables identified, four capacity levels exist, which is overall distributed in nine sub-domains to
determine the business’ maturity (Solar, Meijueiro and Daniels, 2017). This study does not focus on AI
or AI related requirements, operations or management that could be added into the proposed readiness
model.
Neural networks: An overview
of early research, current
frameworks and new
challenges
Brain Initiative
Learning algorithms
Artificial neural
network
Neural modelling
Neural networks Human Brain Project
Neural simulators Neural hardware
Stellenbosch University https://scholar.sun.ac.za

45 | P a g e
Figure 23. Themes and categories within: A Model to Assess Open Government Data in Public
Agencies (Solar, Meijueiro and Daniels, 2017).
Approved Study 5
The fifth study (Mehdiyev et al., 2015) was concerned with the determination of rule patterns in
complex event processing that use machine learning techniques. The study focused more towards the
integration of rule-based machine learning approaches to complex event processing systems, due to that
possibly no prior research has adopted rule-based classifiers to automate the derivation of rule patterns
(Mehdiyev et al., 2015). The themes can be seen in the figure below. For the purposes of this study,
Study 5 was not at a high enough level in terms of business requirements, operations or management of
AI in business.
Figure 24. Themes and categories within: Determination of Rule Patterns in Complex Event
Processing Using Machine Learning Techniques (Mehdiyev et al., 2015)
A Model to Assess Open
Government Data in Public
Agencies
Maturity model
levels
Maturity model
key process areas
Open data in public
agencies
Application of OD-
MM
Determination of Rule
Patterns in Complex Event
Processing Using Machine
Learning Techniques
Complex event
processing
Machine learning Rule based
classifications
Event patterns
Stellenbosch University https://scholar.sun.ac.za

46 | P a g e
Approved Study 6
Study 6 (Kurze and Gluchowski, 2010) covered: the Computer-Aided Warehouse Engineering
(CAWE): Leveraging Model Driven Architecture (MDA) and Architecture Driven Modernization
(ADM) for the Development of Data Warehouses. The study showcased both previously established
and future research directions regarding concepts of model-driven architecture and architecture driven
modernization from software engineering disciplines to data warehousing disciplines (Kurze and
Gluchowski, 2010). For the purposes of this study, study 6 did not focus at all with regards to high level
business requirements, operations or management of AI or AI-related themes in the business. The study
was also solely focused on the warehousing aspect, thus there was no generic themes to be used in this
study. The themes can be seen in the figure below.
Figure 25. Themes and categories within: Computer-Aided Warehouse Engineering (CAWE):
Leveraging MDA and ADM for the Development of Data Warehouses (Kurze and Gluchowski, 2010)
Approved Study 7
Study 7 (Zhao, Hwang and Low, 2016), focused on developing a knowledge-based decision support
system for enterprise risk management to facilitate the ERM implementation for Chinese construction
firms. This system has four objectives: assess the ERM maturity in a Chinese construction firms,
visualize the ERM maturity assessment results, provide plans of action for improvement of ERM
implementation according to the maturity continuum and finally develop a printable ERM maturity
assessment report (Zhao, Hwang and Low, 2016). For the purposes of this study, study 7 did not focus
on high level business requirements, operations or management of AI or AI-related themes in the
business. The study is also focused towards Chinese construction firms, thus in terms of generic
elements the study’s contents could not be used. The themes can be seen in the figure below.
Computer-Aided Warehouse
Engineering (CAWE): Leveraging
MDA and ADM for the
Development of Data Warehouses
Data warehouse
Model driven
Architecture Business Intelligence
Architecture
driven
modernization
Stellenbosch University https://scholar.sun.ac.za

47 | P a g e
Figure 26. Themes and categories within: An enterprise risk management knowledge-based decision
support system for construction firms (Zhao, Hwang and Low, 2016)
Approved Study 8
Study 8 (Srivastava, Sharfuddin and Datta, 2012), focused on presenting a unique combination of the
SERVQUAL model and e-sourcing capability maturity framework, which explores the antecedents of
service gaps (Srivastava, Sharfuddin and Datta, 2012). The study is comprised of a qualitative study,
which incorporates data collected from senior managers from various Indian service providers through
semi-structured questionnaires and interviews (Srivastava, Sharfuddin and Datta, 2012). It further
addresses the issues of continuous improvement by utilising knowledge inherent in non-numeric data
generated by service delivery. For the purposes of this study, the selected study was not focused on high
level business requirements, operations or management of AI or AI-related themes in the business. The
themes can be seen in the figure below.
An enterprise risk management
knowledge-based decision
support system for
construction firms
Decision support
system
Construction firms Fuzzy set theory
Knowledge
Maturity
Enterprise risk
management
Stellenbosch University https://scholar.sun.ac.za

48 | P a g e
Figure 27. Themes and categories within: Managing quality in outsourcing of high-end services: a
conceptual model (Srivastava, Sharfuddin and Datta, 2012)
Approved Study 9
Study (Xu, 2009), focused on analysing a methodological framework on knowledge systems
engineering to guide the implementation of knowledge management project, as well as the
establishment of a developmental process of knowledge management system. This includes eight key
steps based on a methodological framework, as well as a detailed analysis for each key step (Xu, 2009).
For the purposes of this study, the selected study did not focus on high level business requirements,
operations or management of AI or AI-related themes in the business. The themes can be seen in the
figure below.
Managing quality in
outsourcing of high-end
services: a conceptual model
High-end Services
Knowledge
Management Service Quality
Outsourcing
Artificial
Intelligence
Stellenbosch University https://scholar.sun.ac.za

49 | P a g e
Figure 28. Themes and categories within: A Development Process of KMS based on Systems
Engineering Methodology
In concluding the systematized literature review, it is evident that there is a lack of academic material
regarding frameworks or models that focus on implementation, integration, operation and management
of AI in businesses of all sizes. The work identified that could potential form part of the aimed readiness
model, is derivative of data gathered through AI-related literature. After these studies have been
thoroughly read, it was concluded that two studies had content that would assist in the development of
a readiness or maturity model regarding AI. It was decided that a secondary systematized literature
review had to be conducted, focusing more on artificial intelligence readiness in the business. This is
discussed in the following sections. The mapping of relevant content will be highlighted at the end of
this chapter.
4.3 Combination of industry 4.0 and AI readiness
In this section, the literature focuses on industry 4.0 readiness, identified in the first systematic literature
review, as well as AI readiness. As Artificial intelligence forms part of the digital transformation of
businesses within industry 4.0, a combination of the two themes, (AI readiness and industry 4.0
readiness) has been integrated. The aim is to identify and compare the readiness dimensions and
elements found in academic sources and business sources. The readiness dimensions for determining
maturity and readiness have been identified, as have the readiness elements found within some readiness
dimensions. This information was obtained through a combination of academic and business literature.
The results can be seen in the tables below.
Development Process of KMS
based on Systems Engineering
Methodology
Knowledge
management
system
Systems
Engineering
Development
process
Methodology
Stellenbosch University https://scholar.sun.ac.za

50 | P a g e
Table 17. Identification of readiness dimensions
Readiness dimensions from
academic sources (Schumacher, Erol
and Sihn, 2016), (Heberle et al., 2017)
Readiness dimensions from
business sources
(Faktion, 2019), (Intel, no date b)
Strategy Strategy
Leadership Operations
Customers People
Products Governance
Operations Operations
Culture Data
People Resources
Governance Security
Technology Legal
Data
Resources
Table 18. Combination of academic and business readiness dimensions and elements
Combined dimensions Readiness elements (Sharma, Kaulgud
and Duraisamy, 2016), (Heberle et al., 2017),
(Faktion, 2019), (Intel, no date b)
Strategy Business case clarity
Leadership Strategic leadership
Business opportunity
Customers /
Products /
Operations Operational mangement
Agile delivery
Culture Business acceptance
People Skills and expertise
Governance /
Technology Infrastructure platform
Data Data sources
Resources Cloud resources
Stellenbosch University https://scholar.sun.ac.za

51 | P a g e
Security Cyber security
Legal /
4.4 AI readiness model systematized literature review
The focus of this systematized literature review is to identify readiness models related to Artificial
Intelligence and new technology readiness. These form an important part of the literature used in this
study and provide a foundation with regards to development of a readiness model by identifying
readiness dimensions and possible elements. The systematized literature review protocol developed in
Figure 18 was be used in this review.
Search terms
The search terms in the table below was used in the Scopus database. The primary studies were iterated
by adding additional terms in the database search. The data base search was filtered to search for
abstracts, titles and keywords. The results can be seen below.
Table 19. Database search results
Scopus database search (conducted on 18/12/2018)
Search terms Number of studies found
Artificial AND Intelligence AND
Readiness AND model
50
The author names, paper title, publication year, affiliations, abstract and methodology were retrieved
from these primary documents. These documents were assessed against the developed selection
cirteria to assist in improving the quality of the outcomes, as well as reducing any bias or repetitive
work. The CAT1 and CAT2 selection criteria as seen in Table 14 was applied while the documents’
data was being obtained due to the application of these criterion was simple in nature.
Application of selection criteria
The selection crietria developed focused on availability, language, types of literature, applicability of
literature and academic robustness of the literature. Descriptions of the criteria can be seen in Table 14.
The papers that the iterative searches produced were carefully read and important information was
extracted from these studies. The information consisted of author names, abstracts, paper titles,
publication years, affiliations and types of documents. The information gathered was exported to excel
to be assessed in terms of the selection criteria in the sequence of validation;i.e. CAT1, CAT2, CAT3,
CAT4 AND CAT5. This can be seen in Appendix J.
Stellenbosch University https://scholar.sun.ac.za

52 | P a g e
After the primary studies were validated against the selection criteria, 5 studies remained. These
studies were validated according to the developed quality assessment. The list of approved studies
were:
• Employee readiness for acceptance of decision support systems as a new technology in E-
business environments; A proposed research agenda
• The ML test score: A rubric for ML production readiness and technical debt reduction
• Cloud readiness assessment framework and recommendation system
• A fuzzy logic based green information technology readiness model
• Technology Readiness Model for Enterprises
These studies were examined in the quality assessment section. This was to ensure that the studies
identified were viable, robust and provide insightful information with regards to the proposed study.
Quality Assessment
The quality assessment criteria can be seen in Table 15. The quality references can be seen as
methodology, goals and completeness of document. The quality of the five studies was assessed
against these selection criteria and all the studies passed. The results can be seen in Appendix K.
Analysis and categorization of the data
The following discussion identifies the characteristics, categories, readiness dimensions and readiness
elements with regards to AI or technology related literature. Thirteen high level characteristics were
found to characterize the results of this systematized literature review. These characteristics are
technological readiness dimensions, enterprise focus, environmental focus, multi-criteria analysis,
fuzzy logic, Green IT, cloud computing/services, machine learning effectiveness focus, rubric
assessments, machine learning, hybrid models, employee focused and readiness models. This
information is illustrated in Figure 29.
Stellenbosch University https://scholar.sun.ac.za

53 | P a g e
Figure 29. Characteristics of studies
The publication years of the chosen studies can be seen in the figure below. This provides some insights
into how recent these chosen studies are.
Table 20. Publication years of chosen readiness studies
Approved Studies Publication Date
Employee readiness for acceptance of decision support systems as a new technology in E-
business environments; A proposed research agenda (Ahmed, Qin and Aduamoah, 2018)
2018
The ML test score: A rubric for ML production readiness and technical debt reduction
(Breck et al., 2018)
2018
Cloud readiness assessment framework and recommendation system (Alemeye and
Getahun, 2015)
2015
A fuzzy logic based green information technology readiness model (Deng, Molla and
Corbitt, 2009)
2009
Technology Readiness Model for Enterprises (Oztemel and Polat, 2006)
2006
0 0.5 1 1.5 2 2.5 3 3.5 4 4.5 5
Readiness model
Employee focused
Hybrid model
Machine learning
Checklist/rubric assessment
Machine learning effectiveness focus
Cloud computing/services
Green IT
Fuzzy logic
Multi-criteria analysis
Environmental focus
Enterprise focus
Technological readiness dimensions
Number of studies in relation to characteristics
Stellenbosch University https://scholar.sun.ac.za

54 | P a g e
Analysis of chosen studies
The next step in the analysis of the studies was defining/developing categories or themes for the data
found in each of these studies. The studies will be discussed below and the characteristics of the study
will be graphically depicted.
Approved Study 1
Entitled “Employee Readiness for Acceptance of Decision Support Systems as a New Technology in
E-Business Environments; A Proposed Research Agenda”, this study (Ahmed, Qin and Aduamoah,
2018) focuses on the development of a methodology for the application of a conceptual model. The
aim is to investigate the effects of employee readiness on technology acceptance with regards to new
technologies and E-businesses (Ahmed, Qin and Aduamoah, 2018). The proposed model combines
the employee readiness for E-business (EREB) model and the technology acceptance model (TAM).
Employee readiness with regards to new technology could prove very useful in the development of
the aimed readiness model, due to that it provides another perspective on a business’ readiness: the
employees and culture. The readiness elements could be incorporated into the developed readiness
model. Theses readiness elements are security, benefits, certainty, collaboration, perceived ease of use
and perceived usefulness. The themes can be seen in the figure below.
Figure 30. Themes and categories within: Employee Readiness for Acceptance of Decision Support
Systems as a New Technology in E-Business Environments; A Proposed Research Agenda
The construction of measuring employee readiness for E-business, through the employee readiness for
E-businesses (EREB) model is divided into 4 dimensions: security, benefits, collaboration and
Employee Readiness for Acceptance
of Decision Support Systems as a
New Technology in E-Business
Environments; A Proposed Research
Agenda
Decision support
system
Technology acceptance
model Perceived usefulness
Employee readiness
Change
management
Stellenbosch University https://scholar.sun.ac.za

55 | P a g e
certainty (Ahmed, Qin and Aduamoah, 2018). The descriptions of these dimensions/elements can be
seen in the table below.
Table 21. Employee readiness dimensions (Ahmed, Qin and Aduamoah, 2018)
Dimension Description
Security This focuses the job security of the employee, as well as state of mind with
regards to the possibility of job changes, job losses and power/influence shifts
(Ahmed, Qin and Aduamoah, 2018).
Benefits This refers to the perceived belief of the employee with regards to the
improvements they will receive in terms of productivity and efficiency increases
(Ahmed, Qin and Aduamoah, 2018).
Collaboration This refers to the willingness of employees to interact, cooperate and share
information with each other through digital technologies (Ahmed, Qin and
Aduamoah, 2018).
Certainty Refers to the employees’ clear understanding, cooperation and believe in the
functions and application of e-business (Ahmed, Qin and Aduamoah, 2018).
With regards to the employee readiness, the technology acceptance model (TAM) provides two
readiness elements namely, perceived usefulness and ease of use. TAM is shown to be one the most
vigorous and capable models for the prediction of user acceptance (Alemeye and Getahun, 2015).
Perceived usefulness – This is characterized by the subjective probability that an individuals’ use of a
specific application framework will develop their capacity towards occupational productivity (Ahmed,
Qin and Aduamoah, 2018), (Alemeye and Getahun, 2015). Perceived ease of use – This is characterized
by the anticipation of effort involved in the new technology framework (Ahmed, Qin and Aduamoah,
2018), (Alemeye and Getahun, 2015).
Approved Study 2
Study 2 (Alemeye and Getahun, 2015), “Cloud Readiness Assessment Framework and
Recommendation System”, focuses on developing a cloud readiness assessment framework and an
expert system to assess cloud readiness. The study also recommends cloud deployment and services
models to adopt. This research study is grounded with innovation adoption theories such as technology
organization environment framework (TOE), diffusion of innovation (DOI) and technology acceptance
model (TAM). These provided many generic readiness elements and dimension that are of value with
regards to developing the AI readiness model. The TAM model was already described above and the
readiness elements have also already been extracted. The DOI theory identifies five dimensions or
elements that determine the adoption of new technologies. These are: relative advantage, compatibility
Stellenbosch University https://scholar.sun.ac.za

56 | P a g e
with existing values and practices, ease of use, trial-ability and observable results (Alemeye and
Getahun, 2015). The technology organization environment framework (TOE) identified three contexts,
each with their own elements. The three contexts are organisational context, technological context and
environmental context (Alemeye and Getahun, 2015). The elements that are incorporated in each of the
main contexts can be seen below.
Table 22. Technology organization environment frameworks’ main contexts (Alemeye and Getahun,
2015)
The characteristics and themes that have been identified in this document are illustrated in the figure
below.
Figure 31. Themes and categories within: Cloud Readiness Assessment Framework and
Recommendation System
Main contexts Elements
Organisational context Executive support
budget
business cases
Technological context Technological readiness
Network connectivity
Environmental context Competitive pressure
Cloud Readiness Assessment
Framework and Recommendation
System
Cloud readiness
assessment
Cloud assessment
framework Predictive modelling in
cloud computing
Cloud computing
recommendation system
Cloud computing
adoption
Stellenbosch University https://scholar.sun.ac.za

57 | P a g e
Approved Study 3
In study 3 (Oztemel and Polat, 2006), “Technology readiness model for enterprises”, the study focuses
on presenting an innovative technology management model specifically for enterprises. This model
provides an overview of existing technology assessment models and introduces the developed
technology readiness model. Consequently, the readiness elements and components are generic and all
are considered for integration within the proposed AI readiness model. The focus of the technology
readiness model is towards an enterprise perspective. The paper identified models such as capability
maturity model and the business process maturity model, but highlighted some deficiencies in these
models. This was because the technology assessment of the models was mainly based on information-
focused analysis (Oztemel and Polat, 2006). Among the important and applicable issues not explicitly
addressed in these models are technology forecasting, technology requirements handling, technology
change rates, technology portfolio. The technology readiness model for enterprises was developed to
address these issues (Oztemel and Polat, 2006).
The proposed technology readiness model forms part of the strategic enterprise resource management
methodology (Oztemel and Polat, 2006). This model focuses on three different levels of technological
readiness. These are strategic, tactical and operational levels. The technological elements at each level
have different weightings in an overall scale (Oztemel and Polat, 2006). In order to measure these levels,
certain technology components need to be introduced. These are shown in the figure below. Four
technological elements are measured with respect towards these dimensions.
Stellenbosch University https://scholar.sun.ac.za

58 | P a g e
Figure 32. Technology readiness model (Oztemel and Polat, 2006)
Besides the individual elements and elements components, the model offers different views with regards
to tactics, operations and strategy. Consideration is thus given to adding these to the proposed readiness
model. The characteristics of this model can be seen in the figure below.
Technologic sustainability and
position map
Automation
Communication networks
Information networks
Services
Machine park
Technology
Infrasturcture
Technology
Management
Baseline
Technology
elements
Technology element
components Tactical Strategic Operational
Technology
Knowledge and
information
Management
Management information system
and data processing
Agent based applications
Return on investment
Enterprise resource planning in
terms of databases and software
Technology knowledge
management
Technology identification and
selection
Technology
strategy Baseline
Strategy development
Technology portfolio
Technology prospect/forecasting
Technology transfer and adoption
Technology change rates
Technology innovation
Technology scenarios and
roadmaps
Technology creation
Disruptive technologies
Technological categorization and
planning
Technology risk management
Human resource planning
Technology requirement handling
Technological investment and
capital management
Cost management
Quality management
Technological competitors analysis
Calculate component assessment with regards to the
three level weightings
Stellenbosch University https://scholar.sun.ac.za

59 | P a g e
Figure 33. Themes and categories within: Technology Readiness Model for Enterprises
Approved Study 4
Study 4 (Deng, Molla and Corbitt, 2009), “A Fuzzy Logic Based Green Information Technology
Readiness Model”, focused on presenting a fuzzy logic-based decision model to evaluate an
organization, readiness for green IT (Deng, Molla and Corbitt, 2009). This decision model considers
the multi-dimensional nature of the identified evaluation problem. The theme considers green
information technology as a strategic consideration for businesses that are developing their sustainable
practices by balancing both the environmental and economic performance of the organization (Deng,
Molla and Corbitt, 2009). For the purposes of this research, the identified study did not focus sufficiently
on high level business requirements, operations or management of AI or AI-related themes in the
business. The themes can be seen in the figure below.
Figure 34. Themes and categories within: A Fuzzy Logic Based Green Information Technology
Readiness Model
Technology Readiness Model for
Enterprises
Technology
readiness
Multi-aspect
evaluations Management model
Readiness
evaluations
A Fuzzy Logic Based Green
Information Technology Readiness
Model
Information
technology
Multi-criteria
analysis Fuzzy Logic
Decision analysis
Stellenbosch University https://scholar.sun.ac.za

60 | P a g e
Approved Study 5
Study 5 (Breck et al., 2018), “The ML Test Score: A Rubric for ML Production Readiness and
Technical Debt Reduction”, presents 28 monitoring needs and tests that have been developed through
experience with a wide range of production machine learning. This helps in quantifying the related
issues, as well as presenting a road-map to improve production readiness and pay down machine
learning technical debt (Breck et al., 2018). For the purposes of this research, the study did not relate
sufficiently in terms of business requirements, operations or management of AI in the business. The
identified themes can be seen in the figure below.
Figure 35. Themes and categories within: The ML Test Score: A Rubric for ML Production Readiness
and Technical Debt Reduction
4.5 Readiness model dimensions
The purpose of this section is to identify the different models included in the readiness assessment, as
well as identify overlapping/shared components and dimensions. The combination of models and
literature used to develop the model stems from the systematized and narrative literature reviews. The
development of the initial readiness model derives from the integration of readiness models previously
identified, coupled with separate research. The illustration of this statement can be seen in Figure 36.
The ML Test Score: A Rubric for
ML Production Readiness and
Technical Debt Reduction
Technical debt
Best practices Monitoring
Machine learning
Testing
Reliability
Stellenbosch University https://scholar.sun.ac.za

61 | P a g e
Figure 36. Illustration of model integration
The readiness model dimensions from the previous sections were identified and filtered into recurring
readiness dimensions. The readiness elements were also filtered in terms of applicability and generic
attributes. The results of the filtering process through the systematized literature reviews and narrative
literature reviews can be seen in Appendix A. Table 25 below is generated and identifies where each
readiness dimension and readiness element was derived from in terms of its study from the systematized
literature reviews. Two further tables indicate the references of the studies within the evaluation table
specific to systematized literature reviews. The next chapter will further discuss each of the readiness
elements.
Table 23. First systematized literature review studies’ references
Academic studies titles Reference
Digitalization Canvas – Towards identifying digitalization use cases and
projects
(Heberle et al.,
2017)
Neural networks: An overview of early research, current frameworks and new
challenges
(Prieto et al.,
2016)
An enterprise risk management knowledge-based decision support system for
construction firms
(Zhao, Hwang
and Low, 2016)
Determination of Rule Patterns in Complex Event Processing Using Machine
Learning Techniques
(Mehdiyev et al.,
2015)
Employee readiness
model
Technology readiness
model (TRM)
Technology organization
environment framework
Diffusion of
innovation (DOI)
Technology Acceptance
Model (TAM)
Combination of industry 4.0 and
AI readiness
Filtered readiness dimensions
Filtered readiness elements
Proposed model
Stellenbosch University https://scholar.sun.ac.za

62 | P a g e
Research on quality measuring of CMMI cyclic implementation in software
process
(Zhou and Li,
2012)
Managing quality in outsourcing of high-end services: A conceptual model
(Srivastava,
Sharfuddin and
Datta, 2012)
A model to assess open government data in public agencies
(Solar, Meijueiro
and Daniels,
2017)
Computer-aided warehouse engineering (CAWE): Leveraging MDA and ADM
for the development of data warehouses
(Kurze and
Gluchowski,
2010)
A development process of KMS based on systems engineering methodology (Xu, 2009)
Table 24. Second systematized literature review studies’ references
Academic studies titles Reference
Employee readiness for acceptance of decision support systems as a new
technology in E-business environments; A proposed research agenda
(Ahmed, Qin and
Aduamoah,
2018)
The ML test score: A rubric for ML production readiness and technical debt
reduction
(Breck et al.,
2018)
Cloud readiness assessment framework and recommendation system
(Alemeye and
Getahun, 2015)
A fuzzy logic based green information technology readiness model
(Deng, Molla
and Corbitt,
2009)
Technology Readiness Model for Enterprises
(Oztemel and
Polat, 2006)
The identification table generated below identifies where certain dimensions and readiness elements
were found in the accepted studies, this is indicated with a green block.
Stellenbosch University https://scholar.sun.ac.za

63 | P a g e
Table 25. Identification of readiness elements and dimensions from systematized literature reviews
Literature review studies
First systematized literature review (AI maturity) Second systematized literature review (AI
readiness)
Study 1:
(Heberle
et al.,
2017)
Study
2:
(Zhou
and Li,
2012)
Study
3:
(Prieto
et al.,
2016)
Study 4:
(Zhao,
Hwang
and Low,
2016)
Study 5:
(Mehdiye
v et al.,
2015)
Study 6:
(Srivastava,
Sharfuddin
and Datta,
2012)
Study 7:
(Solar,
Meijueiro
and
Daniels,
2017)
Study 8:
(Kurze and
Gluchowski
, 2010)
Study 9:
(Xu,
2009)
Study
10:
(Ahmed,
Qin and
Aduamoa
h, 2018)
Study
11:
(Breck
et al.,
2018)
Study 12:
(Alemeye
and
Getahun,
2015)
Study 13:
(Deng,
Molla and
Corbitt,
2009)
Study 14:
(Oztemel
and Polat,
2006)
Dimension Employee and
culture
Technology
management
Organisational
governance and
leadership
Strategy
Infrastructure
Knowledge and
information
management
Security
Readiness
elements
Job Security
Stellenbosch University https://scholar.sun.ac.za

64 | P a g e
Perceived
usefulness
Perceived ease of
use
Compatibility
with existing
values and
practices
Benefits
Business
Acceptance
Skills and
expertise
Collaboration
Certainty
Technological
categorization and
planning
Stellenbosch University https://scholar.sun.ac.za

65 | P a g e
Technology
requirement
handling
Technological
investment and
capital
management
Cost management
Technological
competitors’
analysis
Cloud resources
Network
Connectivity
Technology Risk
Management
Quality
Management
Human resource
planning
Stellenbosch University https://scholar.sun.ac.za

66 | P a g e
Executive support
Budget
Business
opportunity
Strategic
leadership
Business cases
Trial-ability
Business clarity
Observable results
Technology
roadmaps and
scenarios
Technology
prospect/forecasti
ng
Stellenbosch University https://scholar.sun.ac.za

67 | P a g e
Agile delivery
Technologic
sustainability and
position map
Communication
networks
Information
networks
Services
Infrastructure
platform
Management
information
system and data
processing
Agent based
applications
Return on
investment
Stellenbosch University https://scholar.sun.ac.za

68 | P a g e
Enterprise
resource planning
in terms of
databases and
software
Technology
knowledge
management
Technology
identification and
selection
Cyber security
Stellenbosch University https://scholar.sun.ac.za

69 | P a g e
The table above indicated the studies from the systematized literature reviews that contributed to
development of the readiness dimensions and elements. The other dimensions and elements were
identified through the narrative literature review. The readiness dimensions and elements identified
from the systematized literature review were combined specifically with the narrative literature review
method from sections 3.4 and 4.3 to form the core dimensions and elements of the study. The elements
and dimensions were chosen either because of their applicability to artificial intelligence at a high
business level or because each dimension/element had generic relevance to the technology readiness in
the business. Combined, these factors contribute to a greater understanding of what would determine a
business’s readiness for new technology, such as AI. The overall readiness dimensions and readiness
elements used can be seen in Appendix A. The next section will focus on developing each of these
readiness elements in order to use them more effectively in evaluating a business’ readiness.
Stellenbosch University https://scholar.sun.ac.za

70 | P a g e
Chapter 5: Development of the readiness model components
The aim of this section is developing the readiness elements within the determined readiness
dimensions. The readiness elements are further discussed on a high level with use of narrative literature
review methods. The high-level dissemination was chosen because the complexity of many of the
elements almost constitutes a study in their own entity. The aimed outcome of this section is the
development of the initial readiness elements and their respective variables. These readiness elements
are the elements that have been identified and categorized within the readiness dimensions in the
previous chapters.
Figure 37. Current Study Methodology Process Step
The two main aims of this section are development of the readiness elements by identifying the
readiness variables, as well as to develop the readiness model index. The readiness model index focuses
on illustrating the developed readiness dimension, its readiness elements and the readiness variables
within these elements. In the future, surveys of the readiness variables will be incorporated into the
readiness model to determine a business’ readiness performance with regards to AI implementation.
The discussion of these readiness elements further enriches the readiness model and provides deeper
understanding of each readiness dimension and its inherent elements. The readiness dimensions can be
seen in the figure below.
GTM
Systematic literature review
Narrative literature review
Conceptual framework analysis
Deconstruction
and
categorization
of concepts
Integrating
concepts
Synthesis
and
resynthesize
Validation
of
conceptual framework
Rethinking
of
conceptual
framework
Stellenbosch University https://scholar.sun.ac.za

71 | P a g e
Figure 38. Readiness model dimensions
Each readiness dimension section begins with two figures, which illustratively identify the readiness
dimension being addressed and list the order in which the readiness elements within that dimension will
be addressed and discussed. This will produce the perspectives and variables to be included in the
readiness model for evaluation. The core structure of the readiness model can be seen in Figure 39
below. The arrows indicate the direction that the data gathered about the dimensions, elements and
variables was filtered.
Figure 39. Core structure of the readiness model
Readiness Model Dimensions
Technology
Management
Organisational
governance and
leadership
Infrastructure
strategy
Employee and
culture
Knowledge and
information
management
Security AI readiness
model
Dimension
Element
Variable
Stellenbosch University https://scholar.sun.ac.za

72 | P a g e
5.1 Infrastructure Dimension of readiness model
Infrastructure dimension obtained from (Oztemel and Polat, 2006). forms part of a crucial aspect with
regards to this readiness model. Due to that general perspective of infrastructure being the acquisition
or owning of essential facilities, services, structures and services to enable effective work (Cambridge,
2019c). From Figure 41, It can be seen that the identified and categorized elements which forms part of
this dimension consists of Infrastructure platform, services, Information networks, communication
networks and technological sustainability and position map. These elements will be further discussed
on a high level using some narrative literature review methods.
Figure 40. Infrastructure readiness dimension identification
Figure 41. Infrastructure readiness elements
Readiness Model Dimensions
Technology
Management
Organisational
governance and
leadership
Infrastructure
Strategy Employee and
culture
Knowledge and
information
management
Security
AI readiness
model
Infrastructure elements
Infrastructure platform
Services
Information networks
communication networks
technological sustainability and position map
Stellenbosch University https://scholar.sun.ac.za

73 | P a g e
Infrastructure platform
The infrastructure platform is identified in (Intel, no date a). Some insights into infrastructure and
architecture related items with regards to artificial intelligence implementation was identified. These
infrastructure related items consist of the identification server infrastructure with regards to GPU
performance and capability, the identification of storage with regards to data and software,
identification of relevant/required data sources, centralization of computing and storage resources (Lui
and Karmiol, 2018). An important aspect identified was the identification of the importance of data
sources (Lui and Karmiol, 2018). Data sources are an important factor when implementing types of AI,
such as machine learning, natural language processing, deep learning (neural networks) or support
vector machines. There should be a large focus on the data that is being used with regards to these
models, being it to train/learn the models or to use it to gather information or generate value from the
inputted data. Ultimately the selection of these identified infrastructure items, is determined through the
business’ strategic decision on whether the business wishes to incorporate SaaS (software as a service),
Paas (platform as a service), Iaas (Infrastructure as a service) or whether to manage all the infrastructure
related items/elements on-premises of the business. The focus for this readiness element will be whether
the business has identified the strategic route it will take, with regards to Paas, Iaas and Saas and has
initiated the process of requirement identification.
Services
With regards to this study, the services readiness element identified in (Oztemel and Polat, 2006),
mainly focuses on the services that has been identified in the business, which will be potentially affected
and targeted by the implementation and operation of AI in the business. The identification of these
services also encourages process mapping, which could serve as an important tool to more effectively
and efficiently implement AI in the business processes. The other important perceived aspect would be
the development of use cases for this technology within the business. The main focus of this element
whether the business has identified and mapped services that will be targeted or influenced by the
implementation or operation of AI.
Information networks
With regards to this study, the Information network readiness element is identified in (Oztemel and
Polat, 2006). Data, informal objects, groups, individual agents and components are interconnected and
interact with one another. The leads to the creation and formation of large, sophisticated and
interconnected networks. These interconnected networks are referred to as information networks (Sun
and Han, 2013). Some examples are: social networks, world wide web, research publication networks,
highway networks and biological networks. Therefore, information networks from an integral part of
information infrastructure. It is thus important to identify which parts of the information system will be
affected/used in the implementation and operation of artificial intelligence. Depending on the type of
Stellenbosch University https://scholar.sun.ac.za

74 | P a g e
AI and the aim/outcome of the AI, the information system and network could be accessed, altered and
affected from various points within the system. The main focus of this element is thus the identification
of information networks that is potentially involved/affected by the implementation, operation and
management of AI.
Communication networks
With regards to this study, the Communication network readiness element is identified in (Oztemel and
Polat, 2006). Communication networks provide the required infrastructure, which enables a utility to
manage devices from a central location in a smart grid environment. When managing heterogenous
communication technologies and architecture in enterprises, communication networks should meet the
requirements of latency, bandwidth, security and reliability (Kuzlu, Pipattanasomporn and Rahman,
2014). It is thus important to identify which parts of the communication network will be affected/used
in the implementation and operation of artificial intelligence.
Technological sustainability and position map
With regards to this study, the Information network readiness element is identified in (Oztemel and
Polat, 2006). In its basic form, the position map and more specifically, the price-benefit positioning
map indicates the relationship between the prices of all products in a specific market and the primary
benefit that the product delivers to the customers (D’Aveni, 2007). The maps are developed using three
phases. These phases are: defining the market; choosing a price and determine the primary benefit;
plotting positions and drawing up the expected-price line.
Defining the market phase, begins with identifying customer needs, which you wish to better
understand. Analysis of current products that satisfy those needs should be broad in order to reduce risk
of being outperformed in the future by new entrants and technologies. The next is identifying the region
in which to conduct the study in. The final part is making the decision on whether to track a segment of
the market or the market in its entirety for a product (D’Aveni, 2007).
In order to determine a price and determine the primary benefit, specifying the scope of analysis of
prices needs to be done. This includes determining the pricing parameters. This is accompanied with
the identification of the primary benefits, thus the benefit that results in the greatest variance in prices.
List of benefits that other products offer and customers perceptions on these benefits should be
identified. One method is using regression analysis on the collected data, to identify which benefit
causes the most variance in prices (D’Aveni, 2007).
Plot positions and draw expected-price line phase, encompasses the development of position map by
plotting the positions of each company’s product with relation to its price and the level of its primary
Stellenbosch University https://scholar.sun.ac.za
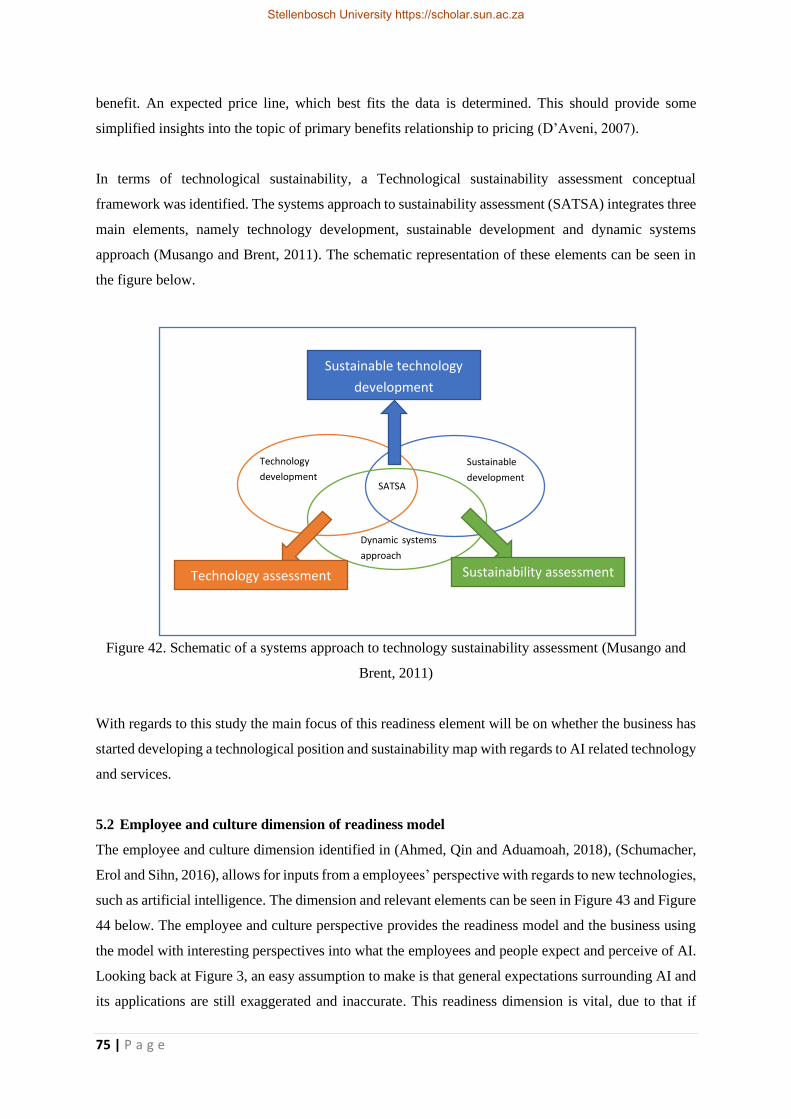
75 | P a g e
benefit. An expected price line, which best fits the data is determined. This should provide some
simplified insights into the topic of primary benefits relationship to pricing (D’Aveni, 2007).
In terms of technological sustainability, a Technological sustainability assessment conceptual
framework was identified. The systems approach to sustainability assessment (SATSA) integrates three
main elements, namely technology development, sustainable development and dynamic systems
approach (Musango and Brent, 2011). The schematic representation of these elements can be seen in
the figure below.
Figure 42. Schematic of a systems approach to technology sustainability assessment (Musango and
Brent, 2011)
With regards to this study the main focus of this readiness element will be on whether the business has
started developing a technological position and sustainability map with regards to AI related technology
and services.
5.2 Employee and culture dimension of readiness model
The employee and culture dimension identified in (Ahmed, Qin and Aduamoah, 2018), (Schumacher,
Erol and Sihn, 2016), allows for inputs from a employees’ perspective with regards to new technologies,
such as artificial intelligence. The dimension and relevant elements can be seen in Figure 43 and Figure
44 below. The employee and culture perspective provides the readiness model and the business using
the model with interesting perspectives into what the employees and people expect and perceive of AI.
Looking back at Figure 3, an easy assumption to make is that general expectations surrounding AI and
its applications are still exaggerated and inaccurate. This readiness dimension is vital, due to that if
Sustainable technology
development
Sustainability assessment Technology assessment
SATSA
Dynamic systems
approach
Sustainable
development
Technology
development
Stellenbosch University https://scholar.sun.ac.za

76 | P a g e
employees have negative views/perspectives with regards to a new technology. Those employees won’t
be as motivated to assist in the implementation, operation and management of AI. The result could
cause large delays in project timelines. Assuming these are the same individuals/employees that form
part of processes in which AI will be present, individuals could potentially see AI as a risk rather than
an asset, which further shows the importance of managing people’s expectations with regards to AI.
The main focus of this section is to measure various different perspectives from employees with regards
to AI.
Figure 43. Employee and culture readiness dimension identification
Readiness Model Dimensions
Technology
Management
Organisational
governance and
leadership
Infrastructure
Strategy Employee and
culture
Knowledge and
information
management
Security
AI readiness
model
Stellenbosch University https://scholar.sun.ac.za

77 | P a g e
Figure 44. Employee and culture readiness elements
The job security element focuses on the employees’ perceptions on job security with regards to artificial
intelligence (Ahmed, Qin and Aduamoah, 2018). Perceived usefulness encompasses employees’
perceptions on the usefulness of AI [29,30]. Perceived ease of use encompasses the employees’
perceptions on how easy it is to use artificial intelligence [29,30]. The compatibility with existing values
and practices focuses on the compatibility of AI (digitized culture) with a business’s current practices
and values (Alemeye and Getahun, 2015). The benefits element comprises of the perceived benefits AI
provides for employees, when incorporating this technology (Ahmed, Qin and Aduamoah, 2018). The
business acceptance element focuses on the perceived acceptance of the business with regards to AI
(Ahmed, Qin and Aduamoah, 2018). The skills and expertise section focus on the perceived current
skills and expertise capability of the business with regards to implement and manage AI (Intel, no date
a). The certainty element comprises of the perceived trust/certainty that the management and employees
have in AI (Ahmed, Qin and Aduamoah, 2018). The collaboration element encompasses the willingness
of employee collaboration with regards to implementation and management of AI (Ahmed, Qin and
Aduamoah, 2018).
5.3 Technology management
The management of technology as a dimension is identified in (Alemeye and Getahun, 2015), (Oztemel
and Polat, 2006), (Schumacher, Erol and Sihn, 2016). This dimension requires integrating a multitude
Employee and culture elements
Job Security
Perceived usefulness
Perceived ease of use
Compatibility with
existing values and
Benefits
Business acceptance
Skills and expertise
Certainty
Collaboration
Stellenbosch University https://scholar.sun.ac.za

78 | P a g e
of activities across different sectors of the organisation. Due to increasingly high-velocity environments,
many corporations struggle with this task. As example, research and development groups often have
strained relationships with the other divisions/areas in the business (Levin and Barnard, 2008). Thus,
technology management is an important dimension in effectively determining a business’s readiness.
The readiness elements previously identified and categorized can be seen in Figure 46.
Figure 45. Technology management readiness dimension identification
Figure 46. Technology management elements
Technology management elements
Technological categorization and planning
Technology requirement handling
Technological investment and capital management
Cost management
Technological competitors analysis
Cloud resources
Network connectivity
Technology risk management
Quality management
Human resource planning
Readiness Model Dimensions
Technology
Management
Organisational
governance and
leadership
Infrastructure
Strategy Employee and
culture
Knowledge and
information
management
Security
AI readiness
model
Stellenbosch University https://scholar.sun.ac.za

79 | P a g e
Technological categorization and planning
With regards to this study, the Technological categorization and planning readiness element is identified
in (Oztemel and Polat, 2006). The technological categorization and planning of AI will assist in
providing guidelines/roadmap for implementation of this technology. The decision to select a
technology is a construct at the centre of information system field (Ellis et al., 2016). The study (Ellis
et al., 2016), developed a framework of technological categories based on work originating from the
technology acceptance model. Multi-dimensional scaling and cluster analysis were utilized, which
aggregates the selection of individual sorters. This develops statistically constructed hierarchical
clusters (Ellis et al., 2016). The categories identified are:
• Communication
• Healthcare
• Academic support
• Mobile
• DSS, Expert and ERP
• Education and training
• General internet and web
• Social networking and virtual communication
• Security and government
• Online auctions and trading
• End-user computing and adoption of new technologies in the workplace
• Business operations
• E-commerce and online shopping
• Self-service systems
• Banking and financial services
• Voice enabled web applications
• Mobile banking and payment
• General computer usage
• Productivity software
• Development tools and methodologies
• Data management
• Enterprise software
• Internet services
• Entertainment
• Business support services
Stellenbosch University https://scholar.sun.ac.za

80 | P a g e
The technological categorization and planning of AI will assist in providing guidelines/roadmaps for
implementation of this technology. The main focus of this readiness element with regards to the study
is the progress, the business has made with regards to categorization and planning of the aimed AI
technologies.
Technology requirement handling
Requirement management is needed to effectively handle the requirements of technology and how these
are related to parts of it (Svensson and Malmqvist, 2001). This forms especially part of planning with
regards to AI implementation. The main focus thus being on whether the business has identified or
constructed requirement management structures, such as the identification of prospective
individuals/managers, as well as initiation of requirement determination on different levels within the
business with regards to AI (Oztemel and Polat, 2006).
Technology investment and capital management
A key element in the technology management dimension, is technology investment and capital
management (Oztemel and Polat, 2006). For this study in terms of readiness for artificial intelligence.
The aspect that will be included is, the fact of whether the business has allocated resources towards
technological investment and capital management for artificial intelligence in the business.
Cost management
Costs need to managed intelligently and aggressively in a non-sustainable competitive advantage
environment (Oztemel and Polat, 2006). Effective cost management (cost accounting systems and
information) should provide a multi-dimensional focus on multiple cost objects such as, processes,
customers, products, activities, services and functions (Kulmala, Paranko and Uusi-Rauva, 2002). There
should also be more focus on cost control and planning rather than monitoring. The cost management
structure should provide support for key business decisions, such as pricing, investment justification,
efficiency, sourcing, product elimination, new product introduction and productivity measures. The
main focus of this readiness element with regards to the study is on whether the business has identified
cost management structures with regards to the AI project.
Technological competitors’ analysis
Most managers acknowledge the importance of understanding their competitors and industry. There
are various competitive analysis techniques can formulate and implement strategy (Sohel, Rahman
and Uddin, 2014); the following are some examples strategy (Sohel, Rahman and Uddin, 2014):
• SWOT analysis
• Boston Consulting Group Approach
Stellenbosch University https://scholar.sun.ac.za

81 | P a g e
• Porters five forces & value chain analysis
• SPACE matrix
• Mckinsey’s Industry strength matrix
• General electric stoplight strategy
• External factor evaluation matrix
• Internal factor evaluation matrix
• PESTEL analysis
• Competitive profile matrix
This forms an important aspect with regards to determining potential opportunities and threats with
regards to leveraging artificial intelligence to generate business value (Oztemel and Polat, 2006). The
main focus of this readiness element is how far the business has progressed in conducting a thorough
technological competitor analysis.
Cloud resources
According to the literature discussed earlier, Cloud resources are seen as important enablers for a
business seeking to fully exploit the potential and ease of use of its AI. Cloud computing assists IT
departments and developers in focusing on value adding tasks, thus avoiding work, such as
procurement, maintenance and capacity planning (AWS, 2019). There are three main types of cloud
computing models and deployment models. The models are: Infrastructure as a service (IAAS),
Software as a service (SAAS) and platform as a service (PAAS) (AWS, 2019), (Noor et al., 2014). The
cloud computing deployment models are: cloud (complete), hybrid and on-premises models (AWS,
2019). The computing and deployment models can be seen in Table 26 and Table 27 below.
Table 26. Cloud computing models
Type of cloud
computing model
Description
IAAS This model contains basic building blocks for cloud IT. Usually access is
provided to data storage spaces, computers (hardware and virtual) and
networking features (AWS, 2019), (Hwang and Li, 2010),(Bamiah and
Brohi, 2011). Similar to existing IT resources of today.
PAAS Removes the need to manage infrastructure, such as hardware and operating
systems. Focus can be shift towards management and deployment of
applications (AWS, 2019), (Hwang and Li, 2010), (Bamiah and Brohi,
2011).
Stellenbosch University https://scholar.sun.ac.za

82 | P a g e
SAAS Provides a completed product or browser-initiated application software
which is managed by the service provider. Another description is that the
provider facilitates the clients with applications, which runs on cloud
infrastructure through a thin client interface (AWS, 2019), (Hwang and Li,
2010), (Bamiah and Brohi, 2011).
Table 27. Cloud deployment models
Type of cloud
computing
deployment model
Description
Cloud The application id fully deployed and run in the cloud. These were either
created in the cloud or migrated from an existing infrastructure (AWS,
2019).
Hybrid Hybrid deployment model is the connection of applications and
infrastructures between on-premises or off premises private cloud
infrastructure and the public cloud (AWS, 2019), (Bamiah and Brohi, 2011).
On-premises On premises deployment, through the use of virtualization and resource
management tools. This however does not provide many of the benefits of
using cloud computing (AWS, 2019).
The main focus of this readiness element with regards to the study, is divided into four parts these being
the identification and selection of a cloud computing model, such as Paas, Iaas and Saas, as well as the
requirements for implementing either of these computing models. The other two parts being the
identification and selection of the cloud deployment models, such as cloud, hybrid and on-premises, as
well as the requirements with regards to facilitating either of these deployment models.
Network connectivity
The implementation and operation of AI could require new network connections, thus the identification
of the required network connectivity within the business to assist or enable AI in the business is essential
towards successfully determining the business’ readiness for artificial intelligence. This element was
identified in (Alemeye and Getahun, 2015). The main focus of this readiness model, is whether the
business has identified the required network connectivity changes in the business.
Stellenbosch University https://scholar.sun.ac.za

83 | P a g e
Technology Risk management
The technology risk management element is identified in (Oztemel and Polat, 2006). The technology
risk management guidelines (MAS - TRMG) framework is important to be established to assist in
manging technology risks in a systematic manner (Singapore, 2013). The following are important
attributes should be included within this management structure (Singapore, 2013):
• Responsibilities and roles for managing technology risks
• Prioritisation and identification of information system assets
• Implementation of practices and controls to mitigate risks
• The identification and assessment of the probability, as well as the impact of current and
emerging threats, vulnerabilities and risks
• Periodic improvement/update and monitoring of risk assessment to include changes in systems,
operating/environmental conditions that could affect the risk analysis
To achieve data confidentiality, system security, reliability, recoverability and resiliency, effective risk
management practices and internal controls need to be instituted (Singapore, 2013). An important
component in technology risk management is risk assessment. Risk identification is an important part
of the risk assessment. There are various methods/tools to identify the risks associated with a project,
two of these methods are brainstorming and risk identification through the use of process flowcharts.
The risk consequence and matrix method are used for the risk assessments. A risk matrix is a structured
perspective that provides a methodology to assess impacts of risks and determine which risks are critical
to the project (Garvey and Lansdowne, 1998). An example of a risk matrix is shown in the figure below.
Figure 47. Impact vs Probability Risk matrix
The impact criterion’s 1 to 5 values range from negligible, minor, moderate, significant and severe
respectively. The probability criterion’s 1 to 5 values indicate very unlikely, unlikely, possible, likely
Imp
act
5 5 10 15 20 25
4 4 8 12 16 20
3 3 6 9 12 15
2 2 4 6 8 10
1 1 2 3 4 5
0 1 2 3 4 5
Probability
Stellenbosch University https://scholar.sun.ac.za

84 | P a g e
and very likely. The list of identified risks is given an estimated impact and probability rating of 1 to 5.
The risk consequence is determined by the formula below.
Risk consequence = likelihood x Impact
This provides a simple, quick and effective way for business to identify and prioritize risks, this
prioritization of the risks can assist business in resource planning with regards to risk management.
Quality management
To ensure that all activities and processes with regards to artificial intelligence in terms of
implementation, operation and management, the appropriate quality management structures need to be
identified and put into place to ensure a continuous level of excellence throughout the project’s duration
and future developments (Oztemel and Polat, 2006). To better understand quality and quality
management, the first part is understanding what is quality. From a survey conducted, which included
managers of 86 firms, several dozen definitions were provided to describe quality. Some of the
responses were (Evans and Lindsay, 2017):
• Consistency
• Perfection
• Speed of delivery
• Eliminating waste
• Doing it right, the first time
• Pleasing customers
• Providing good/usable products
The next aspect with regards to quality and quality management, it is important to identify from which
perspective, one views quality. Quality can be defined from six different perspectives (Evans and
Lindsay, 2017):
• Product
• Transcendent
• Value
• User
• Manufacturing
• Customer
Stellenbosch University https://scholar.sun.ac.za

85 | P a g e
Lastly some quality management principles have been identified to better assist and align one’s goal
towards an effective and efficient quality management structures. These quality management principles
are (Evans and Lindsay, 2017):
• Principle 1: Customer focus
• Principle 2: Leadership
• Principle 3: Involvement of people
• Principle 4: Process approach
• Principle 5: System approach to management
• Principle 6: Continual improvement
• Principle 7: Factual approach to decision making
• Principle 8: Mutually beneficial supplier relationships
The field of quality management with regards to technology, implementation, operation and
management is very broad and complex. It is thus decided that the main focus of this readiness element
with regards to the study, is whether the business has identified and selected quality management
structures with regards to AI implementation, operation and management.
Human Resource Planning
Human resource planning was identified in (Oztemel and Polat, 2006). Human resource planning forms
part of the primary practice of human resource management. Human resource planning forms part of
an important role in forecasting future demands of a business, as well as environmental factors. It also
assists in managing human resource demands (Aslam et al., 2014). It is stated that objectives of an
organization are achieved through proper planning, thus data collection about goals and objectives is
conducted before arranging resources, people and other competencies required to complete the
objectives (Aslam et al., 2014). The two main focuses of this readiness element with regards to this
study is, whether the business has documented data regarding the short to long term goals of the AI
project, due to this being a pre-condition for arranging people and resources, as well as the identification
of the required resources, people and competencies to implement and operate the technology and
project.
5.4 Organizational governance and leadership
The organizational governance and leadership dimension was identified in (Heberle et al., 2017),
(Alemeye and Getahun, 2015), (Schumacher, Erol and Sihn, 2016). This forms an important part with
regards to determining and facilitating the long-term strategy and goals of the business. When
considering the implementation of artificial intelligence into the business, one can conclude it forms
part of the digitization goals of the business. These individuals are thus vital to facilitate the successful
Stellenbosch University https://scholar.sun.ac.za

86 | P a g e
implementation and operation of AI on different levels of the business. In terms of organizational
governance and leadership, the identified readiness elements within the dimension can be seen in Figure
49.
Figure 48. Technology management readiness dimension identification
Figure 49. Organisational governance and leadership elements
Executive support
Executive support as a readiness element is identified in (Heberle et al., 2017), (Alemeye and Getahun,
2015) In terms of this study the executive support comprises of the level of support individuals in
management and governance position provide with regards to the implementation, operation and
management of AI in terms of strategic assistance, funding, cooperation and becoming a main driver in
business with regards to this topic. There are executive support systems are a reporting software tool,
which uses the organization’s data into useful summarized reports. These reports are usually used by
executive level managers (Chichernea, no date). The main focus of this study with regards to this study
Organizational governance and leadership
elements
Executive support
Budget
Business opportunity
Strategic leadership
Business cases
Readiness Model Dimensions
Technology
Management
Organisational
governance and
leadership
Infrastructure
Strategy Employee and
culture
Knowledge and
information
management
Security
AI readiness
model
Stellenbosch University https://scholar.sun.ac.za

87 | P a g e
is level of executive support is provided towards driving the completion of the implementation,
operation and management of AI.
Budget
Budget as a readiness element was identified in (Heberle et al., 2017), (Alemeye and Getahun, 2015).
A basic definition of budget is: A plan to show how much money an organization or person will earn
and how much they will need or be able to spend (Cambridge, 2019a). A basic requirement for
implementing an artificial intelligence project into business, is the allocation of a budget for the project
to cover all expenses associated with the implementation, operation and management of this technology.
Business opportunity
Business opportunity as a readiness element was identified in (Intel, no date a). Business opportunity
can be defined as an opportunity/chance to meet a market need/demand through the use of creative
combinations of resources to deliver superior value (Bolt, 2014). This should be an important aspect
with regards to early strategic positioning of the business with regards to AI. It is important to identify
the need/demand you want to more effectively/efficiently meet, as this could focus the where in the
business opportunity for AI could be identified in the business. The main focus of this readiness
element, is thus whether the business has identified business opportunities for AI.
Strategic leadership
Strategic leadership as readiness element was identified in (Intel, no date a). Strategic leadership forms
an integral part for the implementation of new technologies within the business, both from a strategic
and support point of view. With regards to strategy, important activities that should be addressed by
strategic leadership, are direction setting, translation of strategy into action, aligning the organization
and the people with the developed strategy, development of strategic capabilities and determining the
effective intervention points (Davies and Davies, 2004). The aimed characteristics that a strategic leader
should have are, restless with the present, prioritize their strategic thinking and learning, develops
mental models to frame their own practice and understanding and has powerful/influential professional
and personal networks (Davies and Davies, 2004). The main focus of this readiness element is, whether
the business has identified the required strategic leadership, which complies with the activities and
characteristics of a strategic leader.
Business cases
The definition of a business case: a set of reasons describing how a business decision will improve a
product or business, as well as how it will affect costs and profits and attracting investments
(Cambridge, 2019b). This readiness element forms an integral part of identifying AI’s viability and
potential value that it can generate for the business to stakeholders /managers and governing bodies.
Stellenbosch University https://scholar.sun.ac.za

88 | P a g e
The main focus of this readiness element is, whether the business being evaluated has identified
business cases for AI.
5.5 Security
Cyber security as a readiness element was identified in (Intel, no date a). Cyber security has evolved
from a specific technical discipline into a strategic concept (Geers, 2011). Even at the tactical level,
cyber security is still a highly technical discipline (Geers, 2011). Problems regarding cybersecurity are
approached typically from the technical, information technology perspective (Tisdale, 2015).
Figure 50. Organisational governance and leadership readiness dimension identification
Recent research shifts the focus towards comprehensive approaches, which considers business
objectives, risk management, organizational psychology and governance (Tisdale, 2015). Cyber
security forms particularly part of knowledge management problems, given the amount of data,
perishability of data, technology turnover and multitude of information involved (Tisdale, 2015). Here
is a cyber security management framework developed from study in (Tisdale, 2015). Which helps
identify important sections and elements with regards to this topic.
Readiness Model Dimensions
Technology
Management
Organisational
governance and
leadership
Infrastructure
Strategy Employee and
culture
Knowledge and
information
management
Security
AI readiness
model
Stellenbosch University https://scholar.sun.ac.za

89 | P a g e
Figure 51. Cyber security management framework (Tisdale, 2015)
The main focus of this readiness model with regards to the study, is whether the business being
evaluated has identified and developed management structures for cyber security with regards to AI
being implemented into the business.
5.6 Strategy
The strategy dimension is identified in (Oztemel and Polat, 2006), (Intel, no date a), (Schumacher, Erol
and Sihn, 2016). This dimension focuses on readiness elements that are vital towards planning and
directing short to long term goals of business with regards to the implementation, operation and
management of AI. In terms of Artificial intelligence readiness elements related to strategy, the list of
these elements can be seen in Figure 53, as well as the current readiness dimension with relation to the
other dimensions can be seen in Figure 52.
Stellenbosch University https://scholar.sun.ac.za

90 | P a g e
Figure 52. Strategy readiness dimension identification
Figure 53. Strategy readiness elements
Trial-ability
Identified in (Alemeye and Getahun, 2015), Trialability can be seen as the degree to which innovations
can be experimented on within a limited basis by potential adopters or the degree to which an innovation
can be experimented with, before potential adoption (Mohamad Hsbollah and Kamil, 2009), (Etsebeth,
no date). In terms of the strategy the trial-ability readiness element is important to potentially facilitate
to a certain degree, a proof of concept, as well as to test, deploy and improve the implementation of AI
into business processes.
Strategy elements
Trial-ability
Business clarity
Observable results
Technology roadmaps
and scenarios
Technology forecasting
Agile delivery
Readiness Model Dimensions
Technology
Management
Organisational
governance and
leadership
Infrastructure
Strategy Employee and
culture
Knowledge and
information
management
Security
AI readiness
model
Stellenbosch University https://scholar.sun.ac.za

91 | P a g e
Business clarity
Identified in (Intel, no date a), Business clarity element will be described as the perceived clarity, the
business has with regards to artificial intelligence, in terms of expectations of this technology,
requirements, goals and capability of the technology within the business.
Observable results
Identified in (Alemeye and Getahun, 2015), The observable results element will be viewed as whether
the business has identified methods to show observable results when this technology (artificial
intelligence) is being tested/implemented, as well as the identification of valuable observable criterion
such as reduction in process time or increased efficiency. This readiness element could potentially assist
facilitation to a certain degree, a proof of concept, as well as forms part of the testing, deployment and
improvement of the implementation of AI into business processes.
Technology roadmaps and scenarios
Technology roadmaps and scenarios is identified as a readiness element in (Oztemel and Polat, 2006).
The technology roadmaps and scenarios element encompasses all systematic attempts to understand
and anticipate the potential rate, characteristics, direction and effects of technology change (Firat, Woon
and Madnick, 2008). This readiness element focuses on innovation, invention, use and adoption (Firat,
Woon and Madnick, 2008). The main focus of this readiness element with regards to the study will be
on whether the business has identified a technology roadmap and scenario method for AI in the business.
Technology forecasting
Technology forecasting as readiness element is identified in (Oztemel and Polat, 2006). The methods
used for technology forecasting are broadly classified into two categories namely, normative forecasting
and exploratory forecasting (Cheng, Chen and Chen, 2008). The exploratory forecasting encompasses
the forecasting of future based on past and present data, which includes growth curves, case study
method and Delphi method (Cheng, Chen and Chen, 2008). The normative forecasting encompasses
predicting the technological performance, which is dependent on future needs. It thus forecasts
available capabilities on the assumption that needs will be met (Cheng, Chen and Chen, 2008). Some
types of methods associated with normative forecasting are relevance trees and scenario writing method
(Cheng, Chen and Chen, 2008). The focus of this readiness element will be on whether the business
being evaluated has identified technology forecasting methods for AI with regards to the business.
Agile delivery
The agile methodology includes an adaptive and capable team that responds to changes in requirement,
welcomes changing requirements even late in the development stage, working software/products is
Stellenbosch University https://scholar.sun.ac.za

92 | P a g e
delivered frequently and focuses on the principle of customer satisfaction through providing continuous
and rapid delivery of small and useful software (Balaji and Murugaiyan, 2012). Two characteristics
keywords of an agile approach are interactive and incremental (Kendall and Kendall, no date). Adoption
of agile methods in a distributed delivery environment poses a large challenge (Sharma, Kaulgud and
Duraisamy, 2016). The five stages of the agile modelling development process can be seen in the figure
below.
Figure 54. Agile delivery process
Here is an example of an agile delivery software development process, which integrates AI activities.
With regards to an agile delivery there are some criteria that has been identified for determining if a
team is agile with the focus on software development are, Active stakeholder participation, regression
testing, self-organization and disciplined, continuous improvement and regular delivery of working
software (Ambler, 2010).
Figure 55. Agile delivery software development process (Kulkarni and Padmanabham, 2017)
Exploration
Planning Iterations to the
first release
Productionizing
Maintenance
Agile Integration
1. Communication
• User studies
• Ideation
• PP
• Usability evaluation
• Optimal policies
2. Release
• Soft increment
• Computing project
velocity
• Predictive initialization
3. Planning
• User stories
• Poker game planning
• Optimal planning
• Acceptance test criteria
• Interactive planning
• Relative prediction
4. Design
• Simple design
• Spike solution
• CRC cards
• Intelligent design
5. Coding
• Simple design
• Spike solution
• CRC cards
• Intelligent design
6. Test
• Automatic testing
• Unit test
• Online acceptance testing
• Statistical testing and
analysis
Stellenbosch University https://scholar.sun.ac.za

93 | P a g e
Some advantages with regards to the agile method are, the ability to respond to changing requirements
of the project, as well as the continuous inputs and communication from the client, which removes the
risk of guesswork between the customer and the development teams. A disadvantage of the agile method
is that it is difficult to judge the efforts and time required for the project with regards to software
development life cycle (Balaji and Murugaiyan, 2012). With regards to this readiness element, the main
focus is that the business needs to develop an agile strategy with regards to AI development,
implementation and operation.
5.7 Knowledge and information management
Knowledge and information management has been identified as one of the readiness dimensions in the
previous sections as an important aspect with regards to determinisation of a business’ readiness for
new technologies, such as AI. To better understand this dimension and elements. One first needs to look
at the key activities associated knowledge management. These activities are knowledge generation,
which entails the creation of new ideas and patterns, knowledge codification and knowledge transfer,
which ensures the exchanging of knowledge between individuals and departments (Bouthillier and
Shearer, 2002). Information management focuses primarily on performing plans and activities that are
required to control an organization’s records and information (Bouthillier and Shearer, 2002).
Figure 56. Knowledge and information management readiness dimension identification
Readiness Model Dimensions
Technology
Management
Organisational
governance and
leadership
Infrastructure
Strategy Employee and
culture
Knowledge and
information
management
Security
AI readiness
model
Stellenbosch University https://scholar.sun.ac.za

94 | P a g e
Figure 57. Knowledge and information management elements
Management information system and data processing
Management information system and data processing as a readiness element is identified in (Oztemel
and Polat, 2006). Authors in the field of system analysis, data management and software evaluation,
indicate that information system knowledge is vital in terms of developing successful and competitive
firms, adding business value, providing applicable products and service to customers and managing
global corporations (Laudon and Laudon, 1968). Management information systems is defined as, “the
study of [computer based] information systems in business and management” (Laudon and Laudon,
1968). Information systems literacy is vital for managers which are confronted with major challenges
in the business, these challenges are:
• Information system investments
• Strategic business
• Globalization
• Information infrastructure
• Ethics and security
With regards to this study the focus of this readiness model will be that the business being evaluated
should have initiated the development of management structures for information systems and data
processing.
Agent based applications
Agent based modelling as a readiness element was identified in (Oztemel and Polat, 2006). Agent based
modelling or simulation is a largely used application, it is a computational and modelling framework
that simulates processes that are dynamic in nature and involves autonomous agents (Macal and North,
Knowledge and information
management elements
Management information system and
data processing
Agent based applications
Return on investment
Enterprise resource planning in terms of
databases and software
Technology knowledge management
Technology identification and selection
Stellenbosch University https://scholar.sun.ac.za

95 | P a g e
2015). Agent-based simulation is mostly used to model in individual decision-making, social and
organizational behaviours (Macal and North, 2015). This readiness element could potentially facilitate
to a certain degree, an early proof of concept, with regards to the implementation of AI into business
processes. The focus of this readiness element will be to identify the level of agent-based modelling
that has been conducted with the aim of identifying the impacts of AI in business processes.
Return on investment
Return on investment as a readiness element was identified in (Oztemel and Polat, 2006). Return on
investment is a used performance measurement and evaluation metric (Botchkarev and Andru, 2011).
It is a powerful tool for providing decision support on software acquisitions and other projects
(Botchkarev and Andru, 2011). The initial estimations identify the value that this technology could
generate with respect to its investment, form an important part leveraging support and resources towards
the implementation, integration and management of AI.
Enterprise resource planning in terms of databases and software
Enterprise resource planning in terms of databases and software as a readiness element was identified
in (Oztemel and Polat, 2006). ERP is comprised of integrated sets of software, which can be used to
manage and integrate all the business functions within an organisation (Shehab et al., 2004). These
packages have the ability to facilitate the flow of information between processes in the supply chain
(Shehab et al., 2004). ERP provides companies with the ability to integrate various departmental
information (Shehab et al., 2004). The main focus of this readiness model is the initiation of enterprise
resource planning of databases and software for AI.
Technology knowledge management
Technology knowledge management as a readiness element was identified in (Oztemel and Polat,
2006). Interest in knowledge management comes from the transition into knowledge economy, where
knowledge is seen as a principle source of sustainable competitive advantage and value creation (Alavi
and Leidner, 2001). An adequate knowledge management strategy should contain an articulated
business strategy, description of knowledge-based business issues, inventory of available knowledge
resources. Knowledge management strategy includes the analysis of recommended knowledge leverage
points, describing the uses of the obtained knowledge above, as well as identifying knowledge
management projects with the focus on maximizing ROI and business value (Dalkir, 2013). With
regards to the information above the main focus of this readiness element is initiation of technology
management knowledge strategies for the implementation of AI.
Stellenbosch University https://scholar.sun.ac.za

96 | P a g e
Technology identification and selection
Technology identification and selection as a readiness element was identified in (Oztemel and Polat,
2006). In terms of technology identification and selection, the three main aspects that were identified
are technology compatibility, system impact of the technology and the maturity/readiness of the
technology (Kirby, 2001). Technology compatibility consists of identifying the appropriate
technologies needed, which are physically compatible and established in a technology compatibility
matrix. The impact of a technology is probabilistic in nature, due to various contributing factors. This
is largely influenced if the technology is not fully maturity (Kirby, 2001). With regards to the
information above the main focus of this readiness element is the level of analysis the business has
conducted with regards to the compatibility of the technology, its impact on the system and the maturity
of the AI that the business is targeting/aiming to implement.
5.8 Integration of concepts into an index
This section serves as the conclusion of this chapter by providing an illustrative table of the developed
readiness dimensions, elements and variables, which can be seen below. Through the high-level
development of the readiness dimensions the following index was developed to provide an overall view
of the readiness elements and variables within the following readiness dimensions:
• Employee and culture
• Technology management
• Organizational governance and leadership
• Strategy
• Infrastructure
• Knowledge and information
• Security.
Table 28. Initial developed readiness index
d
Readiness
dimension
i Readiness element
n Readiness variables
𝑋𝑑,𝑖,𝑛
1 Employee and
culture
1 Job security 1 Employees' perception on
job security with regards
to AI
𝑋1,1,1
2 Perceived usefulness 2 Employees' perception on
the usefulness of AI
𝑋1,2,2
3 Perceived ease of use 3 Employees' perception
with regards to ease of use
of AI
𝑋1,3,3
Stellenbosch University https://scholar.sun.ac.za

97 | P a g e
4 Compatibility with existing
values and practices
4 Compatibility of AI with
business values and
practices
𝑋1,4,4
5 Benefits 5 Employees' perception on
the benefits regarding AI
𝑋1,5,5
6 Business acceptance 6 Perceived business
acceptance of AI
𝑋1,6,6
7 Skills and expertise 7 Perceived current skills
and expertise capability to
implement and manage AI
𝑋1,7,7
8 Collaboration 8 Willingness of employee
collaboration with regards
to AI
𝑋1,8,8
9 Certainty 9 Willingness of employee
collaboration with regards
to AI
𝑋1,9,9
2 Technology
management
10 Technological
categorization and
planning
10 Technological
categorization and
planning progress for AI
𝑋2,10,10
11 Technology requirement
handling
11 Identification of
technology requirement
management structures
𝑋2,11,11
12 Technological investment
and capital management
12 Allocation of Investment
and capital management
for AI
𝑋2,12,12
13 Cost management 13 Identification of cost
management structures for
AI
𝑋2,13,13
14 Technological competitors’
analysis
14 Identification of cost
management structures for
AI
𝑋2,14,14
15
Cloud resources
15 Identification and
selection of cloud
computing models, such
as infrastructure as a
service, Platform as a
service or software as a
service
𝑋2,15,15
16 Identification and
satisfaction of
requirements regarding
Cloud computing models
𝑋2,15,16
17 Identification and
selection of cloud
𝑋2,15,17
Stellenbosch University https://scholar.sun.ac.za

98 | P a g e
computing deployment
models, such as cloud,
hybrid and on-premises
models
18 Identification and
satisfaction of
requirements regarding
cloud computing
deployment models
𝑋2,15,18
16 Network connectivity 19 Identification of required
network connectivity
within business for AI
𝑋2,16,19
17
Technology risk
management
20 Assign responsibilities and
roles for managing risks
involving AI
𝑋2,17,20
21 Prioritisation and
identification of
information system assets
𝑋2,17,21
22 Implementation of
practices and controls to
mitigate risks
𝑋2,17,22
23 The identification and
assessment of the
probability, as well as the
impact of current and
emerging threats,
vulnerabilities and risks
𝑋2,17,23
24 Implementation of
periodic
improvement/update and
monitoring of risk
assessment to include
changes in systems, as
well as
operating/environmental
conditions that could
affect the risk analysis
𝑋2,17,24
18 Quality management 25 Identification and
selection of quality
management structures for
AI
𝑋2,18,25
19 Human resource planning 26 Documentation of data
regarding the short to long
𝑋2,19,26
Stellenbosch University https://scholar.sun.ac.za

99 | P a g e
term goals of the AI
project
27 Effort regarding the
identification of the types
of resources, people and
competencies that will be
required
𝑋2,19,27
3 Organisational
governance and
leadership
20 Executive support 28 Executive support
regarding AI
𝑋3,20,28
21 Budget 29 Allocation of a budget for
AI
𝑋3,21,29
22 Business opportunity 30 Identification of
applicable business
opportunities for AI
𝑋3,22,30
23 Strategic leadership 31 Identification of strategic
leadership, which comply
with the activities and
characteristics of a
strategic leader
𝑋3,23,31
24 Business cases 32 Identification of business
cases for AI
𝑋3,24,32
4 Strategy 25 Trial-ability 33 Capability to conduct a
certain amount of testing
(test data)
𝑋4,25,33
26 Business clarity 34 Perceived business clarity
with regards to AI
𝑋4,26,34
27 Observable results 35 Identification of methods
and criteria involved with
generating observable
results during
testing/implementation of
AI
𝑋4,27,35
28 Technology roadmaps and
scenarios
36 Identification of
technology roadmaps and
scenarios regarding AI
𝑋4,28,36
29 Technology
prospect/forecasting
37 Identification of
technology forecasting
methods for AI
𝑋4,29,37
30 Agile delivery 38 Development of the agile
strategy with regards to AI
𝑋4,30,38
5 Infrastructure 31 Technologic sustainability
and position map
39 Development of the
technology sustainability
and position map for AI
𝑋5,31,39
Stellenbosch University https://scholar.sun.ac.za

100 | P a g e
32 Communication networks 40 Identification of
communication networks
involved with operation of
AI
𝑋5,32,40
33 Information networks 41 Identification of
information networks
involved with
implementation, operation
and management of AI
𝑋5,33,41
34 Services 42 Identification and
mapping of services that
will incorporate AI
𝑋5,34,42
35 Infrastructure platform 43 Identification of required
infrastructure in terms of
cloud resources, as well
required additional
infrastructure sections
𝑋5,35,43
6 Knowledge and
information
management
36 Management information
system and data processing
44 Initiation of the
development of
management structures for
information systems and
data processing
𝑋6,36,44
37 Agent based applications 45 Conducting agent-based
simulations or modelling
to indicate possible
impacts of AI on business
processes
𝑋6,37,45
38 Return on investment 46 Calculations of the return
on investment for AI
𝑋6,38,46
39 Enterprise resource
planning in terms of
databases and software
47 Identification of enterprise
resource planning
(databases and software)
for AI
𝑋6,39,47
40 Technology knowledge
management
48 Initiation of technology
knowledge management
strategies for AI
𝑋6,40,48
41 Technology identification
and selection
49 Analysis of technology
compatibility, system
impact of AI and the
maturity of the AI
𝑋6,41,49
7 Security 42 Cyber Security 50 Identification and
development of
management of cyber
𝑋7,42,50
Stellenbosch University https://scholar.sun.ac.za

101 | P a g e
security with regards to
Artificial intelligence
Stellenbosch University https://scholar.sun.ac.za

102 | P a g e
Chapter 6: Constructing the readiness model
The aim of this section is to develop the fundamental workings/operations of AI readiness model. This
will substantiate the development and deployment of the AI readiness model. The main focus of this
model is the development of the weighting’s methods, as well as the weightings for the readiness model,
as well as the development of the validation process. This will complete the requirements for readiness
model to be able to conduct a case study. The current methodology steps can be seen in the figure below,
followed by the chapter objectives.
Figure 58. Study methodology process step
Chapter 6 Objectives Identify the process of operations of the AI readiness model
Develop the weighting methods for readiness model
Develop validation process for the study
Determine the weightings for the readiness model
This section is focused on developing and indicating the operations of the developed AI readiness
model. As the sections focuses on operations and readying the readiness model, the methodology for
operations in the model is included, such as the weighting, IPA and readiness evaluation methods. The
process followed towards setting up and using the AI readiness model can be seen in the figure below.
The process is divided into two main parts namely the pre-requisites and operations. The pre-requisite
section focuses on the model being continuously improved and updated to ensure the model provides
the more applicable and accurate results through incorporated validation steps that can be seen in the
following section.
GTM
Systematic literature review
Narrative literature review
Conceptual framework analysis
Deconstruction
and
categorization
of concepts
Integrating
concepts
Synthesis
and
resynthesize
Validation
of
conceptual framework
Rethinking
of
conceptual
framework
Stellenbosch University https://scholar.sun.ac.za

103 | P a g e
Figure 59. Basic process of operations with regards to the readiness model
6.1 Validation of readiness model, dimensions and elements
The readiness dimensions and elements are validated through the use of surveys with subject matter
experts with regards to technology management, technology enterprise readiness and AI/robotic process
automation. The validation process is divided into three phases namely the pre-requisite, validation
focused area and the operation of the readiness model phases. The pre-requisite phase includes the
completion of the systematized and narrative literature reviews, as well as the development of the
readiness dimensions, elements and variables. The validation focused area highlights where in the
process of development to operation of the readiness model, validation steps are incorporated. The first
validation step uses SME inputs to validate the incorporation of readiness elements in the model, the
second large validation step is the determination of the perceived validity, applicability and effectivity
of the readiness model from SME’s, as well as the Case study interviewees. The validation process can
be seen in the figure below.
Pre-requisite operations
Update Readiness dimensions/elements
Validate entries with SMEs
Determine Readiness dimension
weightings through Likert scale
evaluation (𝑤𝑑,𝑠𝑡𝑟𝑎𝑡𝑒𝑔𝑦 )
Determine readiness elements’
weightings through the use of the Likert
scale method (wi)
Conduct surveys with regards to Likert
weightings
Conduct survey analysis to determine
readiness element performance by
subject matter experts
Determine final values from the
performance survey analysis
Feed performance and normalized
importance/weightings values into
readiness models’ importance
performance analysis section
Feed performance and
importance/weightings values into
readiness models’ maturity readiness
evaluation model
Disseminate results and provide analysis
on the these results on a descriptive and
graphical level .
Stellenbosch University https://scholar.sun.ac.za

104 | P a g e
Figure 60. Validation process
Validation Process
Develop readiness
dimensions and elements
Conduct narrative
literature reviews
Pre-requisite steps
Conduct systematized
literature reviews
• Identification of
inapplicable elements
• Validate readiness
elements and
dimensions
• Categorize elements
Semi-structured
interview/survey
• Determine readiness
dimension ratings
through a survey
• Determine readiness
elements’ ratings
through the use of the
surveys
Semi-structured
interview/survey
Determine Readiness dimension
and element weightings Readiness model is
developed and ready
Conduct readiness
evaluation with case
study
• Determine user
satisfaction with the
developed readiness
model
• Identify possible
improvements for the
model
Semi-structured interviews Revised and improved
readiness model
Validation focused area Operations
Stellenbosch University https://scholar.sun.ac.za

105 | P a g e
6.2 Calculation of the weightings
The calculation of the weightings will be done through the use of the AHP and the Likert scale methods.
The inclusion/development of the readiness models’ weightings can be seen the figure below. The
Likert scale will be used to determine the weightings for the readiness models’ dimensions, whereas
the AHP method will be used to develop the readiness elements’ weightings. Interviews and surveys
are conducted with subject matter experts to determine the weightings of each. The subject matter
experts are chosen following the criteria below:
• Have basic to expert knowledge and experience in the field of robotic process automation/
artificial intelligence
• Have experience in dealing with the implementation/integration of new technologies into
business
• Have experience in the management of digital project and technologies such as artificial
intelligence or robotic process automation.
Figure 61. Illustration of weighting development
Dimension
Element
Variable
Stellenbosch University https://scholar.sun.ac.za

106 | P a g e
6.2.1 Weighting methods for readiness dimensions/indicators
This section explains the methods for developing the weightings used for the readiness model in terms
of operations, as well as determining SME satisfaction with regards to the model. The different
weighting methods are further discussed in the following sections.
Likert scale
The original Likert scale encompasses a set of indicators/items which describes/influences a
hypothetical or real situation in the study. The participants are given statements /indicators/items, which
they have to indicate their level of agreement ranging from strong disagreement to strong agreement
(Joshi et al., 2015). The differentiation between symmetric vs asymmetric Likert scales are that
symmetrical Likert scale can be identified when the position of neutrality is exactly in between two
extremes of the level of agreement (Joshi et al., 2015). An asymmetrical Likert scale provides less
options on one side of the neutrality (average), in comparison to the other side (Joshi et al., 2015). Some
advantages of the Likert scale are (Nemoto and Beglar, 2014):
• Gathering information from large groups of respondents is relatively fast.
• Provides reliable person ability estimates.
• Data can be compared, combined and contrasted with the use of qualitative methods, such as
interviews or participant observation.
• Validity of interpretations made from the data can be established.
Challenges associated with the Likert scale are that the seven-point Likert items suffer from style bias,
the Likert items are less stable in comparison to binary answer formats and the seven-point Likert items
take longer to complete in comparison to binary answer formats (Joshi et al., 2015). The Likert scale
will be used to determine the weightings of the readiness model dimensions with respect to AI
implementation and integration. The importance scale for the Likert scale can be seen in the table below.
Table 29. Likert importance scale
Rating Description
1 Not important
2 somewhat important
3 Moderately important
4 Quite important
5 Very important
The ratings (𝑟) of every readiness dimension with regards to TRM (technology readiness model)
dimensions namely, strategy, operations and tactical was rated, for every respondent (s – number of
respondent), where (𝑑) denotes the readiness dimensions. The formulas are seen below.
Stellenbosch University https://scholar.sun.ac.za

107 | P a g e
𝑟𝑑,𝑠,𝑠𝑡𝑟𝑎𝑡𝑒𝑔𝑦 = 𝑙𝑖𝑘𝑒𝑟𝑡 𝑠𝑐𝑎𝑙𝑒 𝑟𝑎𝑡𝑖𝑛𝑔 𝑟𝑎𝑛𝑔𝑖𝑛𝑔 𝑓𝑟𝑜𝑚 1 𝑡𝑜 5
𝑟𝑑,𝑠,𝑜𝑝𝑒𝑟𝑎𝑡𝑖𝑜𝑛𝑠 = 𝑙𝑖𝑘𝑒𝑟𝑡 𝑠𝑐𝑎𝑙𝑒 𝑟𝑎𝑡𝑖𝑛𝑔 𝑟𝑎𝑛𝑔𝑖𝑛𝑔 𝑓𝑟𝑜𝑚 1 𝑡𝑜 5
𝑟𝑑,𝑠,𝑡𝑎𝑐𝑡𝑖𝑐𝑎𝑙 = 𝑙𝑖𝑘𝑒𝑟𝑡 𝑠𝑐𝑎𝑙𝑒 𝑟𝑎𝑡𝑖𝑛𝑔 𝑟𝑎𝑛𝑔𝑖𝑛𝑔 𝑓𝑟𝑜𝑚 1 𝑡𝑜 5
To develop the weightings (w) of the readiness dimensions with regards to the TRM dimensions, the
individual ratings are divided by the sum of the ratings in that specific readiness dimension with regards
to the TRM dimensions. The formulas to complete this can be seen below.
𝑟𝑑,𝑠,𝑡𝑜𝑡𝑎𝑙 = 𝑟𝑑,𝑠,𝑠𝑡𝑟𝑎𝑡𝑒𝑔𝑦 + 𝑟𝑑,𝑠,𝑜𝑝𝑒𝑟𝑎𝑡𝑖𝑜𝑛𝑠 + 𝑟𝑑,𝑠,𝑡𝑎𝑐𝑡𝑖𝑐𝑎𝑙
𝑤𝑑,𝑠𝑡𝑟𝑎𝑡𝑒𝑔𝑦 = (∑(𝑟𝑑,𝑠,𝑠𝑡𝑟𝑎𝑡𝑒𝑔𝑦/𝑟𝑑,𝑠,𝑡𝑜𝑡𝑎𝑙))/𝑠
𝑠
1
𝑤𝑑,𝑜𝑝𝑒𝑟𝑎𝑡𝑖𝑜𝑛𝑠 = (∑(𝑟𝑑,𝑠,𝑜𝑝𝑒𝑟𝑎𝑡𝑖𝑜𝑛𝑠/𝑟𝑑,𝑠,𝑡𝑜𝑡𝑎𝑙))/𝑠
𝑠
1
𝑤𝑑,𝑡𝑎𝑐𝑡𝑖𝑐𝑎𝑙 = (∑(𝑟𝑑,𝑠,𝑡𝑎𝑐𝑡𝑖𝑐𝑎𝑙/𝑟𝑑,𝑠,𝑡𝑜𝑡𝑎𝑙))/𝑠
𝑠
1
The overall weightings of the readiness dimensions with regards to the readiness model is determined
through dividing the total rating score (𝑟𝑑,𝑠,𝑡𝑜𝑡𝑎𝑙) by the sum total rating scores across every readiness
dimension. Thereafter the average across the number of respondent (𝑠) is calculated. The formula can
be seen below.
𝑤𝑑 = (∑(𝑟𝑑,𝑠,𝑡𝑜𝑡𝑎𝑙
∑ 𝑟𝑑,𝑠,𝑡𝑜𝑡𝑎𝑙)𝑑1(
))/𝑠
𝑠
1
The use of the Likert scale to determine the weightings of readiness elements, within each readiness
dimension will make use of a larger rating scale, so as to provide wider selection of ratings for subject
matter experts, as well as providing a more in-depth understanding of the gathered data. The scale can
be seen in the table below. The readiness elements will be weighed against each other for that specific
dimension.
Stellenbosch University https://scholar.sun.ac.za

108 | P a g e
Table 30. Likert scale for readiness elements
Intensity of
importance (𝑃𝑖𝑗)
Definition
1 Very low importance
2 Low importance
3 Low - moderate importance
4 Moderate importance
5 Moderate - high importance
6 High importance
7 Very high importance
The ratings can be shown below as:
𝑟𝑑,𝑖,𝑠 = 𝑙𝑖𝑘𝑒𝑟𝑡 𝑠𝑐𝑎𝑙𝑒 𝑟𝑎𝑡𝑖𝑛𝑔 𝑟𝑎𝑛𝑔𝑖𝑛𝑔 𝑓𝑟𝑜𝑚 1 𝑡𝑜 7
The formula for determining the weighting of the readiness element is determined as:
𝑟𝑑,𝑖,𝑠,𝑡𝑜𝑡𝑎𝑙 = ∑ (𝑟𝑑,𝑖,𝑠)𝑖1
𝑤𝑑,𝑖 = (∑(𝑟𝑑,𝑖,𝑠/𝑟𝑑,𝑖,𝑠,𝑡𝑜𝑡𝑎𝑙))/𝑠
𝑠
1
AHP (Analytical hierarchy process) method
The Analytic hierarchy process (AHP) was developed by Saaty (Saaty, 1980), and provides a
framework for solving a range of multi-criterion decision problems based on the relative
importance/priorities assigned to each criteria’s role towards obtaining the objective (Handfield et al.,
2002).
The main advantage of the AHP method is the ability to work with intangibles present in the process of
decision making (Javanbarg et al., 2012). Some advantages are: 1) it’s the only MCDM model that can
measure the consistency in the decision maker’s judgement 2) it’s easy to understand and handles
qualitative and quantitative data 4) can assist decision makers in organizing critical aspects in a
hierarchical structure (Javanbarg et al., 2012). An important disadvantages/limitation of the method is
that decision makers could find it extremely difficult to express strength of preference and to provide
exact pairwise comparison judgements (Javanbarg et al., 2012).
Stellenbosch University https://scholar.sun.ac.za
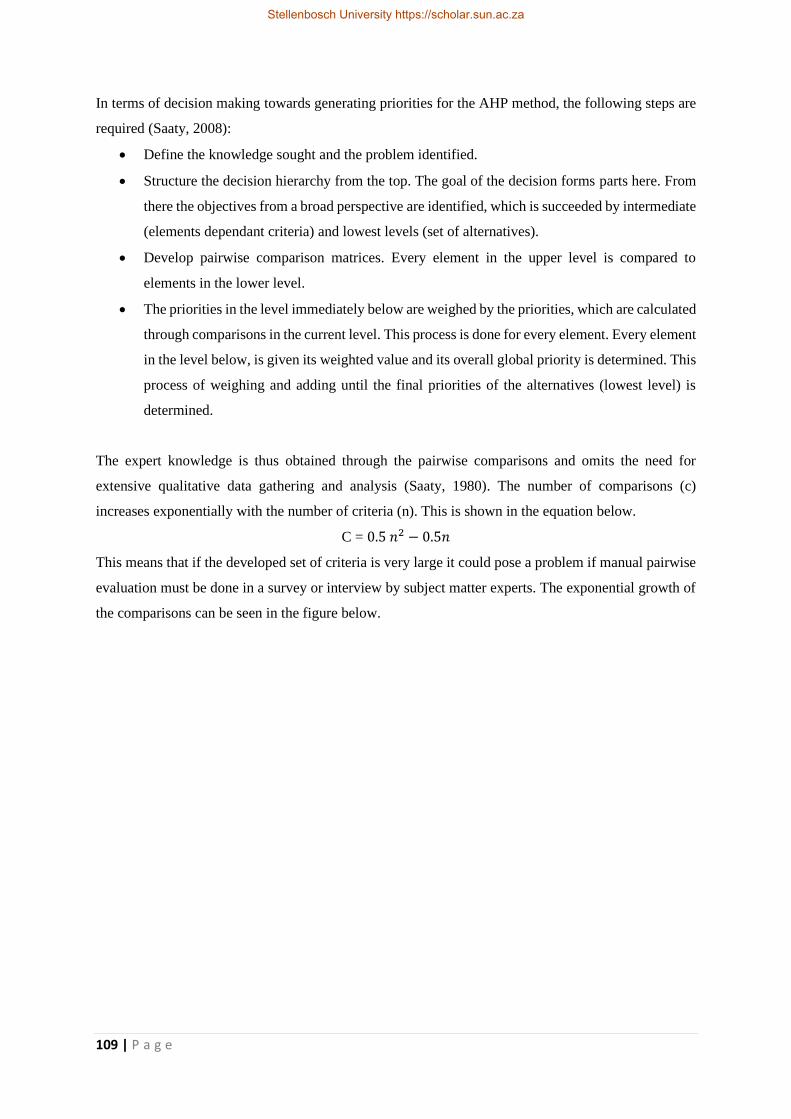
109 | P a g e
In terms of decision making towards generating priorities for the AHP method, the following steps are
required (Saaty, 2008):
• Define the knowledge sought and the problem identified.
• Structure the decision hierarchy from the top. The goal of the decision forms parts here. From
there the objectives from a broad perspective are identified, which is succeeded by intermediate
(elements dependant criteria) and lowest levels (set of alternatives).
• Develop pairwise comparison matrices. Every element in the upper level is compared to
elements in the lower level.
• The priorities in the level immediately below are weighed by the priorities, which are calculated
through comparisons in the current level. This process is done for every element. Every element
in the level below, is given its weighted value and its overall global priority is determined. This
process of weighing and adding until the final priorities of the alternatives (lowest level) is
determined.
The expert knowledge is thus obtained through the pairwise comparisons and omits the need for
extensive qualitative data gathering and analysis (Saaty, 1980). The number of comparisons (c)
increases exponentially with the number of criteria (n). This is shown in the equation below.
C = 0.5 𝑛2 − 0.5𝑛
This means that if the developed set of criteria is very large it could pose a problem if manual pairwise
evaluation must be done in a survey or interview by subject matter experts. The exponential growth of
the comparisons can be seen in the figure below.
Stellenbosch University https://scholar.sun.ac.za

110 | P a g e
Figure 62. Exponential growth in pair wise comparisons
The pairwise comparisons form an 𝑛 𝑥 𝑛 matrix (𝑃). The entries are denoted 𝑃𝑖𝑗, The entries encompass
the importance of 𝑖𝑡ℎ element with respect to the 𝑗𝑡ℎ element. When 𝑃𝑖𝑗 > 1, the 𝑖𝑡ℎ element/criterion
has a higher importance than the 𝑗𝑡ℎ element/criterion. The opposite holds true when 𝑃𝑖𝑗 < 1. When 𝑃𝑖𝑗
= 1, then the elements are equally important. Once the whole number is given to the appropriate
position, the reciprocal is entered in the transpose position. It is important to note that:
𝑃𝑖𝑗 . 𝑃𝑗𝑖 = 1
The scale of importance or absolute numbers can be seen in the table below. The table shows the
number, definition and explanation of each intensity of importance.
Table 31. The scale of absolute numbers (Saaty, 2008)
Intensity of
importance (𝑃𝑖𝑗)
Definition Explanation
1 Equal importance The two criterion/elements are equally
important.
2 Slight importance Through experience and judgement, one
criterion is viewed as slightly more important. 3 Moderate importance
c = 0.5n2 - 0.5n
-50
0
50
100
150
200
1 2 3 4 5 6 7 8 9 10 11 12 13 14 15 16 17 18 19 20
Co
mp
aris
on
s
Number of readiness dimensions
Exponential growth of comparisons
Stellenbosch University https://scholar.sun.ac.za

111 | P a g e
4 Moderate plus
importance
Through experience and judgement, one
criterion is viewed as largely more important.
5 Strong importance
6 Strong plus importance The element is very strongly favoured over the
other through demonstration in practice. 7 Very strong importance
8 Very strong plus
importance
The element/criterion most favoured over the
other criterion.
9 Extreme importance
After the pairwise matrix (𝑃) is built, the matrix will be normalized the to form 𝑃𝑛𝑜𝑟𝑚. This is done
by making the sum of entries in each column equal to 1. Each entry of the matrix 𝑃𝑛𝑜𝑟𝑚 will be
calculated as, with (𝑚) being the number of rows:
𝑃𝑖𝑗 = 𝑃𝑖𝑗
∑ 𝑃𝑙𝑗𝑚𝑙=1
The weighting criteria vector (𝑤) (this an m-dimensional column vector), is developed by the
determining the average of the entries in each row of 𝑃𝑛𝑜𝑟𝑚. The formula can be seen as where (𝑑)
denotes the dimension:
wd,i = ∑ 𝑃𝑖𝑙
𝑚𝑙=1
𝑚
Checking consistency
The process of pairwise comparisons, has the possibility to produce inconsistencies. The AHP has an
effective method for checking the consistency of the evaluations conducted by the decision maker, in
terms of building the matrices. To determine the consistency index (CI) of the matrices, one requires
the λ𝑚𝑎𝑥 of the matrices. The process steps that will be followed are shown here.
1. The sum of each column in (𝑃) is determined, this provides entries (s1, s2, s3…….) for the (𝑆)
vector.
s𝑖 = ∑ 𝑃𝑖𝑙
𝑚
𝑙=1
2. The λ𝑚𝑎𝑥 determined using the formula (dot product) below.
Stellenbosch University https://scholar.sun.ac.za

112 | P a g e
𝜆𝑚𝑎𝑥 = 𝑆. 𝑊
3. The consistency index can be determined with the use of the calculated λ𝑚𝑎𝑥. If the experts’
entries are perfectly consistent then the calculated CI will be equal to zero. Small
inconsistencies which result in the CR to be smaller than 0.1 can be tolerated and is considered
reliable.
CR = CI/RI < 0.1
RI is the random index. These values are generated when the consistency index is completely
random. The values of RI for small problems (m ≤ 10) are shown in the table below.
Table 32. Values of RI corresponding to m number of criteria
m 2 3 4 5 6 7 8 9 10
RI 0 0.58 0.90 1.12 1.24 1.32 1.41 1.45 1.51
These steps were implemented in the interviews with experts to ensure that their entries are consistent
and reliable, thus providing more accurate weightings for the readiness model.
6.2.2 Subject matter expert surveys
The surveys were conducted through physical administration or using online survey tools. The surveys
section related towards calculation of the weightings are done through a Likert scale assessment and
pair-wise matrix comparisons for the AHP method. The format/examples of the surveys can be seen in
Appendix H. The next section presents the results from the survey.
6.2.3 Result from the surveys
Some basic information on the SME’s is shown to further support the validation of the framework. The
criteria involved in the selection of individuals was mainly focused around individuals that were
currently in industry with connections to cognitive/automation (artificial intelligence or robotics)
projects. These individuals were required to have knowledge regarding AI projects and training, as well
as have experience with the implementation of cognitive/digital or robotic process automation projects.
Short descriptions of the SME profiles are shown in Table 33.
Stellenbosch University https://scholar.sun.ac.za

113 | P a g e
Table 33. SME information
SME data Description
Respondent 1 Profession Research and development of cognitive automation/AI
Expertise in terms of
AI/robotics and technology
integration
Technical management and infrastructure
Respondent 2 Profession Head of cognitive automation
Expertise in terms of
AI/robotics and technology
integration
Robotic process automation and simple AI tools
capability integration
Respondent 3 Profession Technical operations manager – cognitive automation
Expertise in terms of
AI/robotics and technology
integration
Technical operations manager in robotics
Respondent 4 Profession Intelligent automation analyst
Expertise in terms of
AI/robotics and technology
integration
Research and development in cognitive automation
Respondent 5 Profession Head of governance & COE, with regards to robotic
process automation
Expertise in terms of
AI/robotics and technology
integration
Technical experience, deploy software and solutions to
business problems
Respondent 6 Profession Head of cognitive automation
Expertise in terms of
AI/robotics and technology
integration
New to the field, current focus and interests are various
application of AI in business
Respondent 7 Profession Analyst programmer
Expertise in terms of
AI/robotics and technology
integration
Data analysis and reporting
The individuals where asked what type of frameworks or methods they were using to determine the
business; readiness or maturity within their fields with regards to artificial intelligence
implementation/integration. It was provided that the responses can be summarized/short. These are
the results:
Stellenbosch University https://scholar.sun.ac.za

114 | P a g e
Table 34. SME information with regards to AI readiness frameworks
Respondent
number
Feedback
Respondent 1 No current framework is used. Progress is largely influenced through enterprise
agreements with strategic vendors (co-creation, leveraging their technology offerings and
roadmaps)
Respondent 2 Within a limited capacity:
• Delivery of business benefits vs plan
• Use of technologies
• Basic due diligence against competitors’ products
• Construction of research and developmental areas
Respondent 3 No current measure of readiness, however business processes are selected on a very
specific set of criteria.
Respondent 4 /
Respondent 5 No formal framework is being used; strategy is developed.
Respondent 6 Develop willingness/evidence of AI tools to apply to the aspects of financial services. For
example, measurement could be positive, where the technology has been purchased to
unlock AI’s potential, but the business has not adopted the technology in a meaningful way
would be negating that. Determine demand into AI unit vs needing to hunt for work.
Respondent 7 Interviews are conducted with SME’s and key stakeholders, as well as comparisons with
other business areas and/or competitors.
As can be seen – no integrated formal readiness tool seems to be used by the SMEs at present. The table
above further indicates the value technology readiness frameworks with a focus on AI could bring for
businesses at the start of their AI journeys. This further adds to solving the large problem of integrating
AI projects into existing business structures and processes.
The validity of the identified readiness dimensions and elements are further discussed, through the
identification of whether each readiness element is relevant or irrelevant with regards to the topic. The
results can be seen in the table below, with symbols = relevant, × = irrelevant.
Stellenbosch University https://scholar.sun.ac.za

115 | P a g e
Table 35. Relevant vs irrelevant readiness elements
Readiness dimension and element Respondent
1
Respondent
2
Respondent
3
Respondent
4
Respondent
5
Respondent
6
Respondent
7
Technology
management
Human resource
planning
Quality
Management
×
Technology Risk
Management
Network
Connectivity
Cloud resources × ×
Technological
competitors’
analysis
Cost management
Technological
investment and
capital management
Technology
requirement
handling
Technological
categorization and
planning
× ×
Employee and
culture
Job Security × × × ×
Perceived
usefulness
×
Perceived ease of
use
Compatibility with
existing values and
practices
×
Benefits
Business
Acceptance
Skills and expertise ×
Collaboration × ×
Certainty × ×
Organizational
governance
Executive support
Budget
Stellenbosch University https://scholar.sun.ac.za

116 | P a g e
and leadership
dimension
Business
opportunity
Strategic leadership
Business cases × ×
Strategy
Trial-ability × ×
Business clarity × ×
Observable results
Technology
roadmaps and
scenarios
×
Technology
prospect/forecasting
×
Agile delivery ×
Infrastructure
Technologic
sustainability and
position map
×
Communication
networks
×
Information
networks
Services
Infrastructure
platform
Knowledge
and
information
management
Management
information system
and data processing
Agent based
applications
×
Return on
investment
× ×
Enterprise resource
planning in terms of
databases and
software
Technology
knowledge
management
Technology
identification and
selection
Stellenbosch University https://scholar.sun.ac.za

117 | P a g e
The decision on the inclusion/exclusion of an element was based on the unanimous decisions of the
chosen SMEs. The results of the table can be seen in the figure below. It was decided that all the
identified readiness elements would be included in the study. The figure below provides some insight
in terms of what elements were seen as relevant by all the SMEs.
Table 36. Readiness dimension colour index for relevant count figure
Readiness Dimension Legend colour
Employee and Culture
Technology Management
Organisational governance and leadership
strategy
Infrastructure
Knowledge and information management
Security
Stellenbosch University https://scholar.sun.ac.za

118 | P a g e
Figure 63. Readiness Element Relevant Count
The SMEs were furthermore asked to identify whether the readiness elements, which were identified
are positioned in the correct dimension. In order for the element to change dimensions the majority of
SMEs need to agree. The results can be seen in the table below.
0 2 4 6 8
Perceived ease of use
Business Acceptance
Compatibility with existing values…
Collaboration
Job Security
Technological investment and…
Technological competitors analysis
Technology Risk Management
Quality Management
Cloud resources
budget
Strategic leadership
Observable results
Technology prospect/forecasting
Trial-ability
Information networks
Infrastrucutre platform
Communication networks
Enterprise resource planning in…
Technology identification and…
Return on investment
Readiness Elements Relevant Count
Stellenbosch University https://scholar.sun.ac.za

119 | P a g e
Table 37. Dimension change requests
Readiness dimension and element Number of dimension change
requests (change ≥ 4)
Technology management
Human resource planning 3
Quality Management 0
Technology Risk Management 0
Network Connectivity 1
Cloud resources 0
Technological competitors’
analysis
0
Cost management 0
Technological investment and
capital management
1
Technology requirement handling 0
Technological categorization and
planning
1
Employee and culture
Job Security 0
Perceived usefulness 0
Perceived ease of use 0
Compatibility with existing values
and practices
0
Benefits 0
Business Acceptance 0
Skills and expertise 0
Collaboration 0
Certainty 0
Organizational governance and
leadership dimension
Executive support 0
Budget 0
Business opportunity 0
Strategic leadership 0
Business cases 0
Strategy
Trial-ability 0
Business clarity 0
Observable results 0
Technology roadmaps and
scenarios
0
Technology prospect/forecasting 0
Agile delivery 0
Infrastructure
Technologic sustainability and
position map
0
Communication networks 0
Information networks 0
Stellenbosch University https://scholar.sun.ac.za

120 | P a g e
Services 0
Infrastructure platform 0
Knowledge and information management
Management information system
and data processing
0
Agent based applications 0
Return on investment 0
Enterprise resource planning in
terms of databases and software
0
Technology knowledge
management
0
Technology identification and
selection
0
From the results above it is determined no dimensional changes of the readiness elements had to be
made. Thus, the readiness model index developed was retained as first developed. The development of
the weightings of dimensions was the next step in this section. The focus is to develop the weightings
for the overall dimensions (Wd) and thereafter the readiness elements (Wd,i), which reside within each
readiness dimension.
The weightings of the readiness dimensions are determined through the use of the Likert scale (1 to 5
ratings). The dimensions are weighted with regards to strategy, operations and tactics. From this the
overall weightings are determined. The results of the readiness dimension weightings can be seen in the
tables below.
Table 38. Strategy weightings of readiness dimensions
Readiness
dimension(
d)
Respondent
1
Respondent
2
Respondent
3
Respondent
4
Respondent
5
Respondent
6
Respondent
7
Wd
Average
Std.Dev
Weighting Weighting Weighting Weighting Weighting Weighting Weighting
Employee and
Culture
0.3333 0.3333 0.4 0.3076 0.3846 0.375 0.3636 0.3568 0.0305
Technology
Management
0.4166 0.3333 0.3571 0.2727 0.4166 0.4166 0.4 0.3733 0.0511
Organisational
governance
and leadership
0.4166 0.3333 0.4545 0.3333 0.4166 0.4545 0.3076 0.3881 0.0572
Strategy 0.5555 0.3846 0.3571 0.3333 0.4076 0.0872
Infrastructure 0.4166 0.3571 0.3636 0.2307 0.4444 0.3076 0.4444 0.3664 0.0723
Knowledge
and
information
management
0.4166 0.3333 0.4444 0.2307 0.36363 0.3846 0.4166 0.3700 0.0664
Security 0.4166 0.3333 0.2857 0.3333 0.3846 0.2727 0.4166 0.3490 0.0544
Stellenbosch University https://scholar.sun.ac.za

121 | P a g e
Table 39. Operational weightings of readiness dimensions
Readiness
dimension(
d)
Respondent
1
Respondent
2
Respondent
3
Respondent
4
Respondent
5
Respondent
6
Respondent
7
Wd
Average
Std.Dev
Weighting Weighting Weighting Weighting Weighting Weighting Weighting
Employee and
Culture
0.4166 0.3333 0.4 0.3846 0.3076 0.375 0.2727 0.3557 0.0486
Technology
Management
0.25 0.3333 0.3571 0.4545 0.25 0.0.25 0.3 0.3135 0.0701
Organisational
governance
and leadership
0.3333 0.3333 0.3636 0.3333 0.25 0.1818 0.3076 0.3004 0.0584
Strategy 0.3333 0.2307 0.2857 0.3333 0.2957 0.0422
Infrastructure 0.25 0.2857 0.3636 0.3846 0.2222 0.3846 0.2222 0.3018 0.0688
Knowledge
and
information
management
0.3333 0.3333 0.3333 0.3846 0.2727 0.3076 0.25 0.3164 0.0412
Security 0.3333 0.3333 0.3571 0.3333 0.3076 0.3636 0.3333 0.337 0.017
Table 40. Tactical weightings of readiness dimensions
Readiness
dimension(
d)
Respondent
1
Respondent
2
Respondent
3
Respondent
4
Respondent
5
Respondent
6
Respondent
7
Wd
Average
Std.Dev
Weighting Weighting Weighting Weighting Weighting Weighting Weighting
Employee and
Culture
0.25 0.3333 0.2 0.3076 0.3076 0.25 0.3636 0.2874 0.0523
Technology
Management
0.3333 0.3333 0.2857 0.2727 0.3333 0.3333 0.3 0.3131 0.0244
Organisational
governance
and leadership
0.25 0.3333 0.1818 0.3333 0.3333 0.3636 0.3846 0.3114 0.0655
Strategy 0.1111 0.3846 0.3571 0.3333 0.2965 0.1085
Infrastructure 0.3333 0.3571 0.2727 0.3846 0.3333 0.3076 0.3333 0.3317 0.0327
Knowledge
and
information
management
0.25 0.3333 0.2222 0.3846 0.3636 0.3076 0.3333 0.3135 0.0544
Security 0.25 0.3333 0.3571 0.3333 0.3076 0.3636 0.25 0.3135 0.0435
From these readiness dimension weightings’ tables, the overall readiness dimensional weighting is
determined. This can be seen in the formulas below.
𝑟𝑑,𝑠,𝑡𝑜𝑡𝑎𝑙 = 𝑟𝑑,𝑠,𝑠𝑡𝑟𝑎𝑡𝑒𝑔𝑦 + 𝑟𝑑,𝑠,𝑜𝑝𝑒𝑟𝑎𝑡𝑖𝑜𝑛𝑠 + 𝑟𝑑,𝑠,𝑡𝑎𝑐𝑡𝑖𝑐𝑎𝑙
Stellenbosch University https://scholar.sun.ac.za

122 | P a g e
𝑤𝑑,𝑠𝑡𝑟𝑎𝑡𝑒𝑔𝑦 = (∑(𝑟𝑑,𝑠,𝑠𝑡𝑟𝑎𝑡𝑒𝑔𝑦/𝑟𝑑,𝑠,𝑡𝑜𝑡𝑎𝑙))/𝑠
𝑠
1
𝑤𝑑,𝑜𝑝𝑒𝑟𝑎𝑡𝑖𝑜𝑛𝑠 = (∑(𝑟𝑑,𝑠,𝑜𝑝𝑒𝑟𝑎𝑡𝑖𝑜𝑛𝑠/𝑟𝑑,𝑠,𝑡𝑜𝑡𝑎𝑙))/𝑠
𝑠
1
𝑤𝑑,𝑡𝑎𝑐𝑡𝑖𝑐𝑎𝑙 = (∑(𝑟𝑑,𝑠,𝑡𝑎𝑐𝑡𝑖𝑐𝑎𝑙/𝑟𝑑,𝑠,𝑡𝑜𝑡𝑎𝑙))/𝑠
𝑠
1
The overall weightings of the readiness dimensions with regards to the readiness model is determined
through dividing the total rating score (𝑟𝑑,𝑠,𝑡𝑜𝑡𝑎𝑙) by the sum total rating scores across every readiness
dimension. Thereafter the average across the number of respondent (𝑠) is calculated. The formula can
be seen below.
𝑤𝑑 = (∑(𝑟𝑑,𝑠,𝑡𝑜𝑡𝑎𝑙
∑ 𝑟𝑑,𝑠,𝑡𝑜𝑡𝑎𝑙)𝑑1(
))/𝑠
𝑠
1
Table 41. Overall readiness dimension weightings
Readiness
dimension(d)
Respondent
1
Respondent
2
Respondent
3
Respondent
4
Respondent
5
Respondent
6
Respondent
7
Wd
Average
Std.Dev
Weighting Weighting Weighting Weighting Weighting Weighting Weighting
Employee and
Culture
0.1481 0.147 0.1204 0.1511 0.1566 0.0930 0.1279 0.1349 0.0209
Technology
Management
0.1481 0.147 0.1686 0.1279 0.1445 0.1395 0.1162 0.1417 0.0153
Organisational
governance and
leadership
0.1481 0.147 0.1325 0.1395 0.1445 0.1279 0.1511 0.1415 0.0079
Strategy 0.1111 0.1274 0.1686 0.1744 0.1454 0.0268
Infrastructure 0.1481 0.1372 0.1325 0.1511 0.1084 0.1511 0.1046 0.1333 0.0181
Knowledge and
information
management
0.1481 0.147 0.1084 0.1511 0.1325 0.1511 0.1395 0.1397 0.0142
Security 0.14815 0.14706 0.16868 0.10465 0.15663 0.12701 0.13953 0.1418 0.01923
A graphical illustration of the results can be seen in the figure below, which shows the average
weighting vs the weightings provided by the SMEs. It is important to note that respondents 5, 6 and 7
provided no ratings and thus no weightings with regards to strategy. The strategic dimension with
regards to respondents 5, 6 and 7 was omitted from the calculations.
Stellenbosch University https://scholar.sun.ac.za

123 | P a g e
Figure 64. Weighting average vs respondent weightings
With regards to possible outliers in the data, occurrence of outliers was included in the study to include
possible new insights into the importance of these weightings, as these were based on the insights of
SMEs with different positions, professions, insights and experience. To identify possible outliers the
following equation is used.
Absolute percentage difference from mean = (│𝑊𝑑,𝑎𝑣𝑒𝑟𝑎𝑔𝑒 - 𝑊𝑑,𝑠│/ 𝑊𝑑,𝑎𝑣𝑒𝑟𝑎𝑔𝑒) x 100%
The formula above will identify the percentage difference of each weighting with regards to the mean
weighting values. This provided a quick and easy way to identify outliers, as well as trends with regards
to these outliers, such as if it was caused by a specific SME respondent.
0
0.02
0.04
0.06
0.08
0.1
0.12
0.14
0.16
0.18
0.2
Employee andculture
TechnologyManagement
Organisationalgovernance
and leadership
Strategy Infrastructure Knowledge andinformation
management
Security
Weighting average vs survey evaluations
Respondent 1 Weighting Respondent 2 Weighting Respondent 3 Weighting
Respondent 4 Weighting Respondent 5 Weighting Respondent 6 Weighting
Respondent 7 Weighting Avg
Stellenbosch University https://scholar.sun.ac.za

124 | P a g e
Table 42. Dimensional absolute percentage difference from mean
Readiness
dimensions
Respondent
1 Weighting
Respondent 2
Weighting
Respondent 3
Weighting
Respondent 4
Weighting
Respondent 5
Weighting
Respondent 6
Weighting
Respondent 7
Weighting
Employee and
culture
9.81% 9.00% 10.70% 12.04% 16.09% 31.05% 5.19%
Technology
Management
4.52% 3.75% 19.00% 9.76% 2.00% 1.56% 17.96%
Organisational
governance
and leadership
4.65% 3.88% 6.38% 1.43% 2.13% 9.64% 6.78%
Strategy
23.59% 12.35% 16.00% 19.95%
Infrastructure
11.11% 2.94% 0.60% 13.37% 18.68% 13.37% 21.51%
Knowledge
and
information
management
6.03% 5.25% 22.39% 8.19% 5.15% 8.19% 0.13%
Security
4.48% 3.71% 18.95% 26.20% 10.46% 9.80% 1.60%
SMEs average
difference
across
readiness
dimensions
9.17%
5.84%
13.43%
12.99%
9.08%
12.27%
8.86%
A graphical illustration of the results can be seen in the figure below, which identified the average
absolute percentage difference vs individual absolute percentage differences provided by the SMEs.
Stellenbosch University https://scholar.sun.ac.za

125 | P a g e
Figure 65. Average absolute percentage difference vs Individual absolute percentage differences
The next part of the weighting’s evaluation contributes to determining the readiness elements’
weightings with regards to each readiness dimension. The two identified methods for determining these
weightings are the Likert Scale and the AHP methods. The AHP method was chosen to determine the
readiness element weightings. Due to exponential growth of the pair-wise comparisons and duration of
evaluations, it is decided to determine the pair wise comparisons within each of the readiness
dimensions. The examples of the AHP surveys can be seen in Appendix H.
After the pairwise matrix (𝑃) is built, the matrix will be normalized the to form 𝑃𝑛𝑜𝑟𝑚. This is done
by making the sum of entries in each column equal to 1. Each entry of the matrix 𝑃𝑛𝑜𝑟𝑚 will be
calculated as, with (𝑚) being the number of rows:
𝑃𝑖𝑗 = 𝑃𝑖𝑗
∑ 𝑃𝑙𝑗𝑚𝑙=1
The weighting criteria vector (𝑤) (this an m-dimensional column vector), is developed by the
determining the average of the entries in each row of 𝑃𝑛𝑜𝑟𝑚. The formula can be seen as where (𝑑)
denotes the dimension:
0.00
5.00
10.00
15.00
20.00
25.00
30.00
35.00
Respondent 1Weighting
Respondent 2Weighting
Respondent 3Weighting
Respondent 4Weighting
Respondent 5Weighting
Respondent 6Weighting
Respondent 7Weighting
Average absolute percentage difference vs Individual absolute percentage differences
Employee and culture
Technology Management
Organisational governance and leadership
Strategy
Infrastructure
Knowledge and information management
Security
SME’s average difference across readiness dimensions
Stellenbosch University https://scholar.sun.ac.za

126 | P a g e
wd,i = ∑ 𝑃𝑖𝑙
𝑚𝑙=1
𝑚
The initial two SME’s inputs were analysed and calculated. The results can be seen in the table below.
Table 43. Weightings calculated from AHP method
I
Readiness element Respondent 1
Weightings
(Wd,i)
Respondent 2
Weightings (Wd,i)
1 Job security 0.3132
0.2738
2 Perceived usefulness 0.2128
0.1939
3 Perceived ease of use 0.1451
0.1540
4 Compatibility with existing values and practices 0.1490 0.0924
5 Benefits 0.1027
0.1109
6 Business Acceptance 0.0737
0.0650
7 Skills and expertise 0.0517
0.0386
8 Collaboration 0.0288
0.0510
9 Certainty 0.0192
0.0199
10 Technological categorization and planning 0.0159
0.0158
11 Technology requirement handling 0.0352
0.0367
12 Technological investment and capital management 0.0398
0.038
13 Cost management 0.0572
0.0470
14 Technological competitors’ analysis 0.1048
0.0795
15
Cloud Resources
0.0944
0.1089
16 Network Connectivity 0.1081
0.1108
Stellenbosch University https://scholar.sun.ac.za

127 | P a g e
17
Technology Risk Management
0.1381
0.1532
18 Quality Management 0.1806
0.1761
19 Human resource planning 0.2755 0.2333
20 Executive support 0.4948
0.4948
21 Budget 0.2191
0.2191
22 Business opportunity 0.126
0.1342
23 Strategic leadership 0.0830
0.1018
24 Business cases 0.0502
0.0498
25 Trial-ability 0.3749
0.4409
26 Business clarity 0.2377
0.2233
27 Observable results 0.1405 0.1407
28 Technology roadmaps and scenarios 0.1021
0.110
29 Technology prospect/forecasting 0.0514
0.0602
30 Agile delivery 0.0252
0.0237
31 Technologic sustainability and position map 0.5015
0.5015
32 Communication networks 0.2505
0.2445
33 Information networks 0.1481
0.1421
34 Services 0.0754
0.0815
35 Infrastructure platform 0.0298
0.0303
36 Management information system and data
processing
0.387
0.4313
37 Agent based applications 0.2056 0.2056
Stellenbosch University https://scholar.sun.ac.za

128 | P a g e
38 Return on investment 0.1600
0.1719
39 Enterprise resource planning in terms of databases
and software
0.1071 0.1025
40 Technology knowledge management 0.0704
0.0602
41 Technology identification and selection 0.028
0.0282
The process of pairwise comparisons, has the possibility to produce inconsistencies. The AHP has an
effective method for checking the consistency of the evaluations conducted by the decision maker, in
terms of building the matrices.
To determine the consistency index (𝐶𝐼) of the matrices, one requires the λ𝑚𝑎𝑥 of the matrices. The
process steps that will be followed are shown here. Samples of the matrices were retrieved and the
maximum eigenvalues were also determined using built in MATLAB functions. To ensure the correct
outcomes.
1. The sum of each column in 𝑃 is determined, this provides entries (s1, s2, s3…….) for the 𝑆
vector.
s𝑖 = ∑ 𝑃𝑖𝑙
𝑚
𝑙=1
2. The λ𝑚𝑎𝑥 determined using the formula (dot product) below.
λ𝑚𝑎𝑥 = 𝑆 . 𝑊
3. The consistency index can be determined with the use of the calculated λ𝑚𝑎𝑥.
𝐶𝐼 = (λ𝑚𝑎𝑥-m)/(m-1)
4. If the experts’ entries are perfectly consistent then the calculated 𝐶𝐼 will be equal to zero. Small
inconsistencies which result in the 𝐶𝑅 to be smaller than 0.1 can be tolerated and is considered
reliable.
Stellenbosch University https://scholar.sun.ac.za

129 | P a g e
𝐶𝑅 = 𝐶𝐼/𝑅𝐼 < 0.1
𝑅𝐼 is the random index. These values are generated when the consistency index is completely
random. The values of RI for small problems (m ≤ 10) are shown in the table below.
Table 44. Values of RI corresponding to m number of criteria.
m 2 3 4 5 6 7 8 9 10
RI 0 0.58 0.90 1.12 1.24 1.32 1.41 1.45 1.51
The results of the consistency index can be seen in the table below. The table indicates the calculated
CI, as well as the CR.
Table 45. Consistency index from respondent 1 and 2
Readiness
dimensions
Respondent 1 Respondent 2
CI CR (< 0.1) CI CR (< 0.1)
Employee and
culture
0.8059
0.5558
0.647
0.59
Technology
Management
1.0009
0.663
0.89
0.4464
Organisational
governance and
leadership
0.69
0.617 0.883
0.7892
strategy
0.505
0.407
0.745
0.6004
Infrastructure
0.754
0.673
0.755
0.6743
Knowledge and
information
management
0.648
0.522 0.778
0.6276
Two other methods were used to determine the 𝛌𝒎𝒂𝒙, to ensure the consistency index is calculated
correctly. Besides some minor differences all of the methods pointed to a CR > 0.1 for every dimension
for both respondents. This weaknesses of the AHP with regards to these studies were identified in
section 2.2. Due to time limitations, as well as SME cooperation in terms of duration of assessments,
as well as the time it took to change ratings to have a CR < 0.1, it was decided to use the Likert Scale
to determine the readiness element weightings.
Stellenbosch University https://scholar.sun.ac.za

130 | P a g e
The use of the Likert scale to determine the weightings of readiness elements, within each readiness
dimension will make use of a larger rating scale, so as to provide wider selection of ratings for subject
matter experts, as well as providing a more in depth understanding of the gathered data. The scale can
be seen in the table below. The readiness elements will be weighed against each other for that specific
dimension.
Table 46. Likert scale for readiness elements
Intensity of
importance (𝑃𝑖𝑗)
Definition
1 Very Low importance
2 low importance
3 Low - moderate importance
4 Moderate importance
5 Moderate - strong importance
6 Strong importance
7 Very strong importance
The ratings can be shown below as:
𝑟𝑑,𝑖,𝑠 = 𝑙𝑖𝑘𝑒𝑟𝑡 𝑠𝑐𝑎𝑙𝑒 𝑟𝑎𝑡𝑖𝑛𝑔 𝑟𝑎𝑛𝑔𝑖𝑛𝑔 𝑓𝑟𝑜𝑚 1 𝑡𝑜 7
𝑟𝑑,𝑖,𝑠 = 𝑙𝑖𝑘𝑒𝑟𝑡 𝑠𝑐𝑎𝑙𝑒 𝑟𝑎𝑡𝑖𝑛𝑔 𝑟𝑎𝑛𝑔𝑖𝑛𝑔 𝑓𝑟𝑜𝑚 1 𝑡𝑜 7
𝑟𝑑,𝑖,𝑠 = 𝑙𝑖𝑘𝑒𝑟𝑡 𝑠𝑐𝑎𝑙𝑒 𝑟𝑎𝑡𝑖𝑛𝑔 𝑟𝑎𝑛𝑔𝑖𝑛𝑔 𝑓𝑟𝑜𝑚 1 𝑡𝑜 7
The formula for determining the weighting of the readiness element is determined as:
𝑟𝑑,𝑖,𝑠,𝑡𝑜𝑡𝑎𝑙 = ∑ (𝑟𝑑,𝑖,𝑠)𝑖1
𝑤𝑑,𝑖 = (∑(𝑟𝑑,𝑖,𝑠/𝑟𝑑,𝑖,𝑠,𝑡𝑜𝑡𝑎𝑙))/𝑠
𝑠
1
An example of the survey used to evaluate these elements can be seen Appendix H. The surveys were
physically administered and questions regarding the readiness elements were satisfied to assist in
providing the most accurate data. The results can be seen in the table below.
Stellenbosch University https://scholar.sun.ac.za

131 | P a g e
Table 47. Readiness element weightings
Weightings Combined analysis
i
Readiness elements
(i)
Respondent
1
Respondent
2
Respondent
3
Respondent
4
Respondent
5
Respondent
6
Respondent
7 Average Wd,i
Standard
deviation
1 Job Security 0.1153 0.0277 0.1206 0.0925 0.0517 0.0185 0.074 0.0715 0.0376
2 Perceived usefulness 0.1153 0.0555 0.1034 0.1296 0.0862 0.0370 0.1111 0.0911 0.0312
3
Perceived ease of
use 0.1346 0.0833 0.1034 0.1111 0.0689 0.0740 0.0925 0.0954 0.0212
4
Compatibility with
existing values and
practices
0.1153 0.1388 0.1206 0.1111 0.0862 0.0185 0.1111 0.1002 0.0363
5 Benefits 0.0769 0.1944 0.1206 0.1111 0.0862 0.074 0.1111 0.1106 0.0381
6 Business Acceptance 0.0961 0.1111 0.1206 0.1111 0.0689 0.074 0.074 0.0937 0.0197
7 Skills and expertise 0.1346 0.1666 0.1034 0.1111 0.0689 0.0925 0.074 0.1073 0.0318
8 Collaboration 0.1346 0.1944 0.1206 0.1296 0.0689 0.037 0.074 0.1084 0.0485
9 Certainty 0.0769 0.0277 0.0862 0.09259 0.0517 0.0555 0.037 0.0611 0.0229
10
Technological
categorization and
planning
0.0754 0.125 0.0892 0.0862 0.0714 0.0517 0.0689 0.0811 0.0212
Stellenbosch University https://scholar.sun.ac.za

132 | P a g e
11
Technology
requirement
handling
0.1132 0.1041 0.1071 0.1034 0.1071 0.1034 0.0862 0.1035 0.0077
12
Technological
investment and
capital management
0.0943 0.1458 0.125 0.1034 0.0892 0.1034 0.0862 0.1067 0.01986
13 Cost management 0.0754 0.1041 0.1071 0.0862 0.1071 0.0689 0.1034 0.0932 0.0149
14
Technological
competitors analysis 0.0566 0.0625 0.0535 0.0689 0.0535 0.0862 0.0517 0.0618 0.0114
15 Cloud resources 0.1320 0.0625 0.0892 0.1034 0.125 0.0517 0.0689 0.0904 0.0288
16
Network
Connectivity 0.1132 0.125 0.125 0.1206 0.0714 0.0862 0.1206 0.1088 0.0197
17
Technology Risk
Management 0.1132 0.0833 0.125 0.0862 0.0714 0.1034 0.0862 0.0955 0.0175
18 Quality Management 0.1320 0.0833 0.0714 0.1206 0.0357 0.0862 0.0862 0.0879 0.0293
19
Human resource
planning 0.0943 0.1041 0.1071 0.1206 0.0535 0.0862 0.1034 0.0956 0.0198
20 Executive support 0.2592 0.2413 0.2142 0.2258 0.2142 0.2258 0.1612 0.2203 0.0282
21 Budget 0.2592 0.2068 0.25 0.2258 0.1785 0.2258 0.1935 0.2199 0.0269
22 Business opportunity 0.2222 0.2068 0.1785 0.1935 0.1785 0.1935 0.1612 0.1906 0.0186
23 Strategic leadership 0.1851 0.2068 0.25 0.1935 0.2142 0.2258 0.1612 0.2052 0.0266
24 Business cases 0.074 0.1379 0.1071 0.1612 0.1785 0.1935 0.1935 0.1494 0.0422
Stellenbosch University https://scholar.sun.ac.za

133 | P a g e
25 Trial-ability 0.21875 0.1304 0.1333 0.1935 0.1666 0.2258 0.0967 0.1664 0.0451
26 Business clarity 0.15625 0.2173 0.1666 0.1612 0.1333 0.0645 0.1612 0.1515 0.0425
27
Observable results 0.1875 0.1739 0.2 0.1612 0.1666 0.2258 0.1935 0.1869 0.0205
28
Technology
roadmaps and
scenarios
0.125 0.1739 0.1333 0.1612 0.1666 0.1935 0.1290 0.1546 0.0240
29
Technology
prospect/forecasting 0.1562 0.1304 0.2 0.1612 0.1333 0.1935 0.1290 0.1576 0.0273
30 Agile delivery 0.1562 0.1739 0.1666 0.1612 0.2 0.2258 0.0967 0.1686 0.0371
31
Technologic
sustainability and
position map
0.1818 0.2631 0.1481 0.15625 0.222222222 0.15625 0.15625 0.1834 0.0402
32
Communication
networks 0.1818 0.15789 0.1481 0.21875 0.1851 0.15625 0.1875 0.1765 0.0225
33
Information
networks 0.2121 0.2105 0.2222 0.21875 0.1481 0.0625 0.1875 0.1802 0.0536
34 Services 0.2121 0.1578 0.2222 0.1875 0.1481 0.1875 0.15625 0.1816 0.0266
35
Infrastructure
platform 0.2121 0.2105 0.2592 0.21875 0.1851 0.1875 0.1875 0.2086 0.0242
36
Management
information system
and data processing
0.2121 0.2 0.2 0.1666 0.2 0.1944 0.1666 0.1914 0.0164
Stellenbosch University https://scholar.sun.ac.za

134 | P a g e
37
Agent based
applications 0.1515 0.1333 0.1333 0.1818 0.1333 0.1818 0.0909 0.1437 0.0294
38
Return on
investment 0.1212 0.2 0.1333 0.1818 0.1666 0.1818 0.1818 0.1666 0.0266
39
Enterprise resource
planning in terms of
databases and
software
0.2121 0.1666 0.2 0.1818 0.1666 0.2121 0.1515 0.1844 0.0223
40
Technology
knowledge
management
0.2121 0.1333 0.2 0.1818 0.1666 0.1515 0.1515 0.1709 0.0263
41
Technology
identification and
selection
0.0909 0.1666 0.1333 0.1818 0.2 0.1818 0.1515 0.1580 0.0340
42 Cyber security 1 1 1 1 1 1 1 1 0
A graphical illustration of the results can be seen in the figure below, which identifies the average weighting vs the weightings provided by the SMEs.
Stellenbosch University https://scholar.sun.ac.za

135 | P a g e
Figure 66. Weighting average vs respondent weightings for readiness elements from I= 1 to 23
0
0.05
0.1
0.15
0.2
0.25
0.3
1 2 3 4 5 6 7 8 9 10 11 12 13 14 15 16 17 18 19 20 21 22 23
Wd
,i
Readiness elements (i = 1 to 23)
Respondent weightings for each readiness element from i =1 to 23
Respondent 1 Weighting Respondent 2 Weighting Respondent 3 Weighting Respondent 4 Weighting
Respondent 5 Weighting Respondent 6 Weighting Respondent 7 Weighting Average Wd,i
Stellenbosch University https://scholar.sun.ac.za
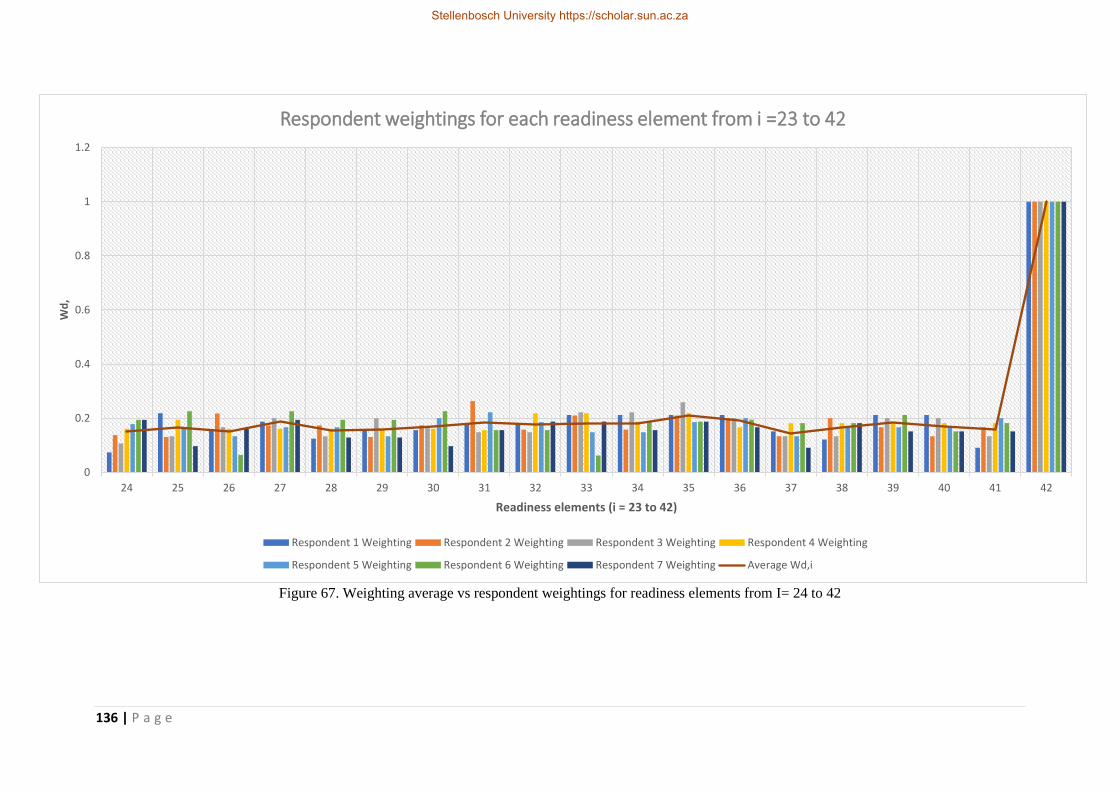
136 | P a g e
Figure 67. Weighting average vs respondent weightings for readiness elements from I= 24 to 42
0
0.2
0.4
0.6
0.8
1
1.2
24 25 26 27 28 29 30 31 32 33 34 35 36 37 38 39 40 41 42
Wd
,
Readiness elements (i = 23 to 42)
Respondent weightings for each readiness element from i =23 to 42
Respondent 1 Weighting Respondent 2 Weighting Respondent 3 Weighting Respondent 4 Weighting
Respondent 5 Weighting Respondent 6 Weighting Respondent 7 Weighting Average Wd,i
Stellenbosch University https://scholar.sun.ac.za

137 | P a g e
Some outliers visually identified from the graph consists of respondent 2 and 6. As seen in the graph
these respondents’ weightings have regularly the most discrepancies with regards to the mean in
comparison to the other respondents. The calculation of each SMEs average absolute percentage
difference from the mean across all elements should provide more insight into the correlation of the
mean of weightings and individual SMEs inputs. With regards to possible outliers in the data,
occurrence of outliers is included in the study so as to include possible new insights into the importance
of these weightings, as these are based on the insights of SMEs with different professions, insights and
experience. To identify possible outliers the following equation is used.
Percentage difference from mean = (│𝑊𝑑,𝑎𝑣𝑒𝑟𝑎𝑔𝑒 - 𝑊𝑑,𝑠│/ 𝑊𝑑,𝑎𝑣𝑒𝑟𝑎𝑔𝑒 ) x 100%
This identifies the percentage difference of each weighting with regards to the mean weighting values.
This should provide a quick and easy way to identify outliers, as well as trends with regards to these
outliers, such as if it is caused by a specific SME respondent.
Stellenbosch University https://scholar.sun.ac.za

138 | P a g e
Table 48. Element absolute percentage difference from mean
i
Readiness
elements (i)
Respondent 1
Weighting
Respondent
2 Weighting
Respondent 3
Weighting
Respondent 4
Weighting
Respondent 5
Weighting
Respondent 6
Weighting
Respondent 7
Weighting
1 Job Security 61.29% 61.17% 68.71% 29.43% 27.70% 74.11% 3.55%
2
Perceived
usefulness 26.52% 39.08% 13.43% 42.14% 5.47% 59.39% 21.84%
3
Perceived ease of
use 41.03% 12.69% 8.38% 16.41% 27.75% 22.39% 2.99%
4
Compatibility with
existing values and
practices 15.07% 38.51% 20.36% 10.81% 14.03% 81.53% 10.81%
5 Benefits 30.48% 75.73% 9.07% 0.42% 22.09% 33.06% 0.42%
6
Business
Acceptance 2.58% 18.53% 28.75% 18.53% 26.43% 20.98% 20.98%
7 Skills and expertise 25.39% 55.25% 3.64% 3.50% 35.76% 13.75% 31.00%
8 Collaboration 24.08% 79.22% 11.24% 19.48% 36.43% 65.86% 31.72%
9 Certainty 25.86% 54.55% 41.05% 51.50% 15.37% 9.10% 39.40%
10
Technological
categorization and
planning 7.00% 54.03% 10.02% 6.23% 11.98% 36.26% 15.02%
11
Technology
requirement
handling 9.34% 0.61% 3.48% 0.09% 3.48% 0.09% 16.74%
Stellenbosch University https://scholar.sun.ac.za

139 | P a g e
12
Technological
investment and
capital management 11.66% 36.55% 17.05% 3.13% 16.39% 3.13% 19.28%
13 Cost management 19.04% 11.74% 14.93% 7.52% 14.93% 26.02% 10.97%
14
Technological
competitors’
analysis 8.52% 1.01% 13.42% 11.45% 13.42% 39.32% 16.41%
15 Cloud resources 46.06% 30.88% 1.26% 14.40% 38.23% 42.80% 23.73%
16
Network
Connectivity 3.97% 14.80% 14.80% 10.84% 34.40% 20.83% 10.84%
17
Technology Risk
Management 18.48% 12.78% 30.83% 9.78% 25.24% 8.27% 9.78%
18
Quality
Management 50.17% 5.25% 18.79% 37.22% 59.39% 1.98% 1.98%
19
Human resource
planning 1.37% 8.90% 12.01% 26.18% 43.99% 9.87% 8.15%
20 Executive support 17.68% 9.57% 2.73% 2.50% 2.73% 2.50% 26.79%
21 Budget 17.85% 5.95% 13.64% 2.65% 18.83% 2.65% 12.02%
22
Business
opportunity 16.55% 8.51% 6.34% 1.51% 6.34% 1.51% 15.41%
23 Strategic leadership 9.79% 0.78% 21.78% 5.72% 4.38% 10.00% 21.43%
24 Business cases 50.43% 7.70% 28.31% 7.93% 19.49% 29.51% 29.51%
25 Trial-ability 31.40% 21.65% 19.91% 16.26% 0.12% 35.64% 41.87%
26 Business clarity 3.11% 43.46% 9.99% 6.44% 12.01% 57.42% 6.44%
Stellenbosch University https://scholar.sun.ac.za

140 | P a g e
27
Observable results
0.29% 6.98% 6.97% 13.73% 10.85% 20.78% 3.52%
28
Technology
roadmaps and
scenarios 19.19% 12.43% 13.80% 4.27% 7.75% 25.13% 16.58%
29
Technology
prospect/forecasting 0.92% 17.29% 26.82% 2.28% 15.45% 22.73% 18.18%
30 Agile delivery 7.36% 3.11% 1.19% 4.38% 18.57% 33.87% 42.63%
31
Technologic
sustainability and
position map 0.89% 43.46% 19.24% 14.82% 21.14% 14.82% 14.82%
32
Communication
networks 3.01% 10.54% 16.07% 23.93% 4.92% 11.48% 6.23%
33
Information
networks
17.68% 16.80% 23.28% 21.36% 17.81% 65.33% 4.02%
34 Services 16.77% 13.08% 22.33% 3.21% 18.45% 3.21% 13.99%
35
Infrastructure
platform 1.64% 0.88% 24.23% 4.82% 11.26% 10.15% 10.15%
36
Management
information system
and data processing 10.82% 4.49% 4.49% 12.93% 4.49% 1.58% 12.93%
37
Agent based
applications 5.42% 7.23% 7.23% 26.51% 7.23% 26.51% 36.75%
38
Return on
investment 27.27% 20.00% 20.00% 9.09% 0.00% 9.09% 9.09%
Stellenbosch University https://scholar.sun.ac.za

141 | P a g e
39
Enterprise resource
planning in terms of
databases and
software 15.02% 9.62% 8.45% 1.41% 9.62% 15.02% 17.84%
40
Technology
knowledge
management 24.05% 22.03% 16.96% 6.33% 2.53% 11.39% 11.39%
41
Technology
identification and
selection 42.47% 5.48% 15.62% 15.07% 26.58% 15.07% 4.11%
42 Cyber security
0.00% 0.00% 0.00% 0.00% 0.00% 0.00% 0.00%
SMEs average
difference across
readiness elements 18.72% 22.01% 16.36% 12.83% 17.39% 24.25% 16.37%
Stellenbosch University https://scholar.sun.ac.za

142 | P a g e
A graphical illustration of the results can be seen in the figure below, which identifies the average
absolute percentage difference vs individual absolute percentage differences provided by the SMEs.
Respondents 2 and 6, were identified visually in the previous figure as possible outliers with regards to
their weightings in comparison to the average among SMEs weightings. From the calculated average
in the table above, respondents 2 and 6 has on average the highest percentage differences with regards
to the means across all the readiness elements. It has been explained that possible outlier data will be
included, due to that it could provide possible insights into new trends with regards to the topic. The
figure below should correspond to the findings with regards to the SMEs possible outlier data. From
the data gathered above a weighting index is developed to indicate the separate readiness dimension
and element weightings.
Stellenbosch University https://scholar.sun.ac.za

143 | P a g e
Figure 68. Average absolute percentage difference vs individual absolute percentage differences for readiness elements
0.00%
10.00%
20.00%
30.00%
40.00%
50.00%
60.00%
70.00%
80.00%
90.00%
1 2 3 4 5 6 7 8 9 10 11 12 13 14 15 16 17 18 19 20 21
Ab
solu
te p
erc
en
tage
dif
fere
nce
s fr
om
me
an
Readiness element (i = 1 to 21)s
Average absolute percentage difference vs individual absolute percentage differences
Respondent 1 Weighting Respondent 2 Weighting Respondent 3 Weighting Respondent 4 Weighting
Respondent 5 Weighting Respondent 6 Weighting Respondent 7 Weighting
Stellenbosch University https://scholar.sun.ac.za

144 | P a g e
Figure 69. Average absolute percentage difference vs individual absolute percentage differences for readiness elements
0.00%
10.00%
20.00%
30.00%
40.00%
50.00%
60.00%
70.00%
22 23 24 25 26 27 28 29 30 31 32 33 34 35 36 37 38 39 40 41 42
Ab
solu
te p
erc
en
tage
dif
fere
nce
s fr
om
me
an
Readiness element (i = 22 to 42)s
Average absolute percentage difference vs individual absolute percentage differences
Respondent 1 Weighting Respondent 2 Weighting Respondent 3 Weighting Respondent 4 Weighting
Respondent 5 Weighting Respondent 6 Weighting Respondent 7 Weighting
Stellenbosch University https://scholar.sun.ac.za

145 | P a g e
Due to the low occurrence, overall importance of multiple readiness variables within each of the
readiness elements. The equally weighted average method will be used with regards to these variables,
thus assigning equal importance to these variables within each of the readiness elements. From the data
gathered above a weighting index is developed to indicate the separate readiness dimensions, element
and variable weightings. This weighting index can be seen in the table below.
Table 49. Weightings index for readiness model
d
Wd Readiness
dimension
i
Wd,i Readiness element
n
Readiness variables
𝑊𝑑,𝑖,𝑛
1
0.13492
Employee and
Culture
1 0.071537339 Job security 1
Employees' perception
on job security with
regards to AI
1
2 0.09119616 Perceived usefulness 2 Employees' perception
on the usefulness of AI 1
3 0.095448613 Perceived ease of use 3
Employees' perception
with regards to ease of
use of AI
1
4 0.100272971
Compatibility with
existing values and
practices
4
Compatibility of AI with
business values and
practices
1
5 0.110651481 Benefits 5
Employees' perception
on the benefits regarding
AI
1
6 0.093739913 Business Acceptance 6 Perceived business
acceptance of AI 1
7 0.107353375 Skills and expertise 7
Perceived current skills
and expertise capability
to implement and
manage AI
1
8 0.108493677 Collaboration 8
Willingness of employee
collaboration with
regards to AI
1
9 0.061116725 Certainty 9
Willingness of employee
collaboration with
regards to AI
1
10 0.081154648
Technological
categorization and
planning
10
Technological
categorization and
planning progress for AI
1
11 0.103537625 Technology
requirement handling 11
Identification of
technology requirement
management structures
1
Stellenbosch University https://scholar.sun.ac.za

146 | P a g e
2
0.14174
Technology
Management
12 0.106794588
Technological
investment and
capital management
12
Allocation of Investment
and capital management
for AI
1
13 0.093220681 Cost management 13
Identification of cost
management structures
for AI
1
14 0.061877597 Technological
competitors’ analysis 14
Identification of cost
management structures
for AI
1
15
0.090428445
Cloud Resources
15
Identification and
selection of cloud
computing models, such
as infrastructure as a
service, Platform as a
service or software as a
service
0.25
16
Identification and
satisfaction of
requirements regarding
Cloud computing models
0.25
17
Identification and
selection of cloud
computing deployment
models, such as cloud,
hybrid and on-premises
models
0.25
18
Identification and
satisfaction of
requirements regarding
cloud computing
deployment models
0.25
16 0.108888904
Network
Connectivity 19
Identification of required
network connectivity
within business for AI
1
17
0.09554736
Technology Risk
Management
20
Assign responsibilities
and roles for managing
risks involving AI
0.2
21
Prioritisation and
identification of
information system
assets
0.2
22
Implementation of
practices and controls to
mitigate risks
0.2
Stellenbosch University https://scholar.sun.ac.za

147 | P a g e
23
The identification and
assessment of the like
hood, as well as the
impact of current and
emerging threats,
vulnerabilities and risks
0.2
24
Implementation of
periodic
improvement/update and
monitoring of risk
assessment to include
changes in systems, as
well as
operating/environmental
conditions that could
affect the risk analysis
0.2
18 0.08795073 Quality Management 25
Identification and
selection of quality
management structures
for AI
1
19 0.0956522 Human resource
planning
26
Documentation of data
regarding the short to
long term goals of the AI
project
0.5
27
Effort regarding the
identification of the
types of resources,
people and competencies
that will be required
0.5
3
0.14156
Organisationa
l governance
and leadership
20 0.220301889 Executive support 28 Executive support
regarding AI 1
21 0.219984076 Budget 29 Allocation of a budget
for AI 1
22 0.190664104 Business opportunity 30
Identification of
applicable business
opportunities for AI
1
23 0.205287516 Strategic leadership 31
Identification of strategic
leadership, which
comply with the
activities and
characteristics of a
strategic leader
1
24 0.149443784 Business cases 32 Identification of business
cases for AI 1
Stellenbosch University https://scholar.sun.ac.za

148 | P a g e
4
0.14541 Strategy
25 0.166473402 Trial-ability 33
Capability to conduct a
certain amount of testing
(test data)
1
26 0.151534011 Business clarity 34 Perceived business
clarity with regards to AI 1
27 0.186960696 Observable results 35
Identification of methods
and criteria involved
with generating
observable results during
testing/implementation
of AI
1
28 0.15468343
Technology
roadmaps and
scenarios
36
Identification of
technology roadmaps
and scenarios regarding
AI
1
29 0.157698441 Technology
prospect/forecasting 37
Identification of
technology forecasting
methods for AI
1
30 0.168671525 Agile delivery 38
Development of the agile
strategy with regards to
AI
1
5
0.13334
Infrastructure
31 0.18344235
Technologic
sustainability and
position map
39
Development of the
technology sustainability
and position map for AI
1
32 0.176506607 Communication
networks 40
Identification of
communication networks
involved with operation
of AI
1
33 0.180252557 Information networks 41
Identification of
information networks
involved with
implementation,
operation and
management of AI
1
34 0.181662331 Services 42
Identification and
mapping of services that
will incorporate AI
1
35 0.20869171 Infrastructure
platform 43
Identification of required
infrastructure in terms of
cloud resources, as well
required additional
infrastructure sections
1
Stellenbosch University https://scholar.sun.ac.za

149 | P a g e
6 0.13972
Knowledge
and
information
management
36 0.191414141
Management
information system
and data processing
44
Initiation of the
development of
management structures
for information systems
and data processing
1
37 0.143722944 Agent based
applications 45
Conducting agent-based
simulations or modelling
to indicate possible
impacts of AI on
business processes
1
38 0.166666667 Return on investment 46 Calculations of the return
on investment for AI 1
39 0.184415584
Enterprise resource
planning in terms of
databases and
software
47
Identification of
enterprise resource
planning (databases and
software) for AI
1
40 0.170995671
Technology
knowledge
management
48
Initiation of technology
knowledge management
strategies for AI
1
41 0.158008658
Technology
identification and
selection
49
Analysis of technology
compatibility, system
impact of AI and the
maturity of the AI
1
7 0.1418 Security 42 1 Cyber Security 50
Identification and
development of
management of cyber
security with regards to
Artificial intelligence
1
6.2.4 Weighting Conclusion
The conclusion of the weighting factors focuses on discussing the insights that have been gained in
completion of this section. The focus of the development of weighting factors was to determine the
readiness dimension and elements weightings through the administration of surveys to SMEs. The
initial weightings methods discussed was the Likert scale and the AHP method. The Likert scale would
be used to determine the readiness dimensions and the readiness element weightings would be
determined by using the AHP weighting method. Two SMEs were approached and they completed the
administered weighting surveys. The Likert scale weightings for the readiness dimensions were
developed, the focus then shifted towards the evaluations of the completed pair-wise comparison
matrices, towards the development of the readiness element weightings using the AHP method. During
the consistency tests, which determines the usability of the weightings in the study, it was found that
the experts had inconsistent evaluations across the pair-wise matrices. A disadvantage with regards to
Stellenbosch University https://scholar.sun.ac.za

150 | P a g e
this method was identified in section 6.2.1 with regards to inconsistencies, which was reflected in the
study. Due to time and SME cooperation limitations, it was decided to incorporate the Likert scale
method to determine the readiness element weightings. As the SME focus with regards to these
readiness elements could still incorporate a comparative basis, the decision was made to weight each
readiness element within their perspective dimensions (similar to the AHP method), rather than the total
list of readiness elements. There were some interesting findings with regards to the weightings
developed from the SMEs insights. The three highest weighted readiness dimensions are strategy,
technology management and security. It was interesting to find that none of the readiness dimensions
were excessively more or less important to the others. The readiness dimensions were very closely
weighted in importance. This suggest that all the readiness dimensions proposed can be considered
important when looking at it comparatively. There were no apparent outliers with regards to the
readiness elements.
6.3 Development of the importance-performance analysis
The IPA has been used in tourism research for many years since the work of Martilla and James
(Martilla and James, 1977). Factors that contribute to the wide acceptance of this model are: ease of
application and the presentation of both data and strategic suggestions (Oh, 2001). The IPA is a
combination of measures between two attributes namely importance and performance on a two-
dimensional grid (Oh, 2001). This provides ease of data interpretation, as well as the derivation of
practical suggestions (Oh, 2001). The IPA generates four different suggestions based on the importance-
performance measures (Oh, 2001). The suggestions form quadrants which can be seen in the figure
below.
Figure 70. importance-performance analysis original axis
Importance
Performance
Quadrant 1:
Keep up the good work
Quadrant 4:
Concentrate here
Quadrant 3:
Low priority
Quadrant 2:
Possible Overkill
Stellenbosch University https://scholar.sun.ac.za

151 | P a g e
In terms of the readiness model the quadrants will be described as followed. The first quadrant indicates
attributes that are deemed important and the company/business/case study experts perceive it as
performing well. The second quadrant indicates attributes that are relatively less important, but the
company performs well in these areas. The third quadrant indicates attributes that are low on importance
and perceived performance. These attributes likely receive low priority in terms of resource allocation
(Oh, 2001). The fourth quadrant indicates attributes that the SMEs perceive as a high priority, but the
business’ perceived performance is not sufficient. The IPA provides a combined view to easily show
how well the business is performing with regards to important attributes, as well as indicating where
future resource allocation to improve the business (Oh, 2001).
The IPA has been subjected to some controversy since its beginning. These are due to the position of
the axis, which determines quadrants and interpretations, as well as the measurement of importance and
performance of elements, which indicate the service being assessed (Rial et al., 2008). The IPA graph
suffered from low discriminative power and low utility with regards to management (Rial et al., 2008).
The revised approach for this method is the combination of crossing the axis at the empirical mean, as
well as the incorporation of the concept of discrepancies. The empirical means method will be used to
categorize the case study business’ readiness elements and dimension in terms of short-term strategy,
due to the origin shift of from the empirical means incorporations. The incorporations of discrepancies
are done by computing the difference between performance and importance, through the incorporation
of a diagonal line on the graph and distance of each point from the line is considered (discrepancies)
(Rial et al., 2008). The line connects all points where there are no discrepancies (importance matches
performance), this thus forms a 45-degree line when both axes of the graph are identical in terms of
increments. The points above the diagonal line indicate negative discrepancies
(importance>performance), whereas points below the diagonal line indicates a positive discrepancy
(importance<performance) (Rial et al., 2008). The diagonal line method will be used for long term
strategy in terms of readiness element categorization. This is due to the diagonal line that is set in terms
of the importance and performance irrelevant of the average of the performance or performance of the
readiness elements. The approach is further improved by the re-interpretation of the graph as seen in
the figure below (Abalo, Varela and Rial, 2006).
Stellenbosch University https://scholar.sun.ac.za

152 | P a g e
Figure 71. Re-illustration of the IPA graph (Abalo, Varela and Rial, 2006)
The focus for this study would be determine the importance/weighting of each readiness element
through the use of weighting methods, such as the Likert scale and AHP method and surveys. The
performance will be measured by surveys conducted with case study subject matter experts; this thus
indicates that the performance evaluation is qualitative in nature due to it being opinion based. In terms
of graphical representation of the importance performance analysis, this study will combine the use of
the diagonal line method (45-degree angle), with identical axis increments and an original axis, which
crosses at the empirical means of the data. There will be combined and separate views regarding the re-
illustrated diagonal line interpretation and the original IPA axis interpretation.
The original axis’ origin is determined by calculating the empirical means of the data regarding
importance/weightings and performance/satisfaction. The 𝑾𝒊 seen below is determined through the
multiplication of two weightings that were determined (𝑾𝒊 = 𝑾𝒅 . 𝑾𝒅, 𝒊). These being the weighting
of the readiness dimension (𝑾𝒅) determined through the Likert scale and the readiness element
weightings (𝑾𝒅, 𝒊) determined through the use of the AHP method or Likert scale. This can be seen in
the formula below.
Origin Coordinates = (Mean (𝑾𝒊); Mean (𝑷𝒊))
6.4 Development of the readiness evaluation
For this section the framework used for developing the maturity model developed by Schumacher, Erol
and Sihn (Schumacher, Erol and Sihn, 2016), will be adjusted using the AI readiness dimensions
Stellenbosch University https://scholar.sun.ac.za

153 | P a g e
identified in the previous sections. The model is comprised of defining overall readiness dimensions,
and elements within each of the dimensions. These can be seen in Table 28. The surveys in the model
are used to determine the weightings and maturity of an item.
The readiness level of each dimension (𝑹𝒅) is determined by calculating the weighted average of all
readiness elements’ performance (𝑷𝒅,𝒊,𝒏) within its dimension. This is done by using the calculations as
seen below.
𝑅𝑑= ∑ 𝑅𝑑,𝑙. 𝑤𝑑,𝑙𝑖𝑙=1
Where 𝑅𝑑,𝑖 : performance of Readiness element
and 𝑤𝑑,𝑖: Weighting of readiness element
𝑅𝑑,𝑖 = ∑ 𝑃𝑑,𝑖,𝑛. 𝑤𝑑,𝑖,𝑛𝑛𝑙=1
Where 𝑃𝑑,𝑖,𝑛 : Average of performance/satisfaction rating of readiness variable across all respondents
and 𝑤𝑑,𝑖,𝑛: Readiness variable weight
𝑃𝑑,𝑖,𝑛= (∑ 𝑃 𝑙,𝑑,𝑖,𝑛)𝑆𝑙=1 /s
Where 𝑃𝑑,𝑖,𝑙 : Performance/satisfaction rating of readiness variable
and S : Number of respondents
These results of these calculations will be graphically displayed to provide the user with a simpler view
of the findings and indicate which dimensions, elements and variables are mature and those that require
more attention in the future to further develop their readiness. Graphical illustration will indicate the
business’ readiness through a comparative lens, in terms of Business dimension readiness and between
readiness element within each of these dimensions. Examples can be seen in the figures below.
Stellenbosch University https://scholar.sun.ac.za

154 | P a g e
Figure 72. Business dimensions readiness example
Figure 73. Example of employee and culture readiness
0
0.1
0.2
0.3
0.4
0.5
0.6
0.7
0.8Employee and culture
Technology Management
Organisational governanceand leadership
StrategyInfrastructure
Knowledge and informationmanagement
Security
Business Dimension Readiness
00.10.20.30.40.50.60.70.80.9
1Job Security
Perceived usefulness
Perceived ease of use
Compatibility with existingvalues and practices
BenefitsBusiness Acceptance
Skills and expertise
Collaboration
Certainty
Employee and culture Readiness
Stellenbosch University https://scholar.sun.ac.za

155 | P a g e
These are examples of the type of graphs that will be generated, to provide insights into the business’
readiness through the comparative lens between dimensions and readiness elements within each of these
dimensions. This provides the business with a numerical evaluation of its readiness with regards to
artificial intelligence implementation. This can be used in collaboration with the IPA to generate a way
for the business to evaluate, categorize and prioritize readiness dimensions and elements.
6.5 Construction of readiness model conclusion
In conclusion, this chapter has completed all the pre-requisites for the developed readiness model to be
applied to a case study. This was initiated by the development and application of the validation process
with regards to this study. This followed be the development of the methods used to determine/calculate
the weightings of the readiness model, as well as calculation of the readiness model calculations. The
calculations of the weightings made use of the Likert scale for both the dimensions and elements, due
to that the AHP method results were too inconsistent to be used, as well as the time and cooperation
limitations within the timeframe of this project. The surveys that were administered not only focused
on determining weightings, but also to further validate the developed model in terms of identifying if
the readiness dimensions and elements that were developed were applicable to this study and the aimed
outcome. The development of the readiness model weightings is completed and some insights are
discussed around it, such as the absolute distance from mean. This resulted in the final development of
the weighting index, which is used to conduct the case study in the following section. An interesting
finding with regards to the readiness dimensions weightings, is the fact that the weightings have no
large outliers, thus showing the readiness dimensions to be quite balanced. As all the preparations are
completed, the readiness model will be applied to a case study in the following chapter.
Stellenbosch University https://scholar.sun.ac.za

156 | P a g e
Chapter 7: Case study
In previous chapters, the readiness model has been developed and the readiness dimension and elements
re-synthesized through interviews and surveys conducted with SMEs. The focus of this section is to
apply the developed model to an applicable case study. The application of this model could determine
strengths, weaknesses, possible improvements and future possibilities for the developed readiness
model.
Figure 74. Study methodology steps
Chapter 7 Objectives Develop requirements regarding case study
Identification of viable case study
Provide background information on case study
Conduct case study
Analyse the results
The main process illustration of the study can be seen in the figure below. The development of the
readiness model dimensions, and elements have been completed and can be seen as the top layer. The
next layer is the development of the readiness model weightings through SME inputs. The current
chapter focuses on obtaining case study evaluations from employees and developing the IPA and
evaluating the business’ readiness for artificial intelligence.
GTM
Systematic literature review
Narrative literature review
Conceptual framework analysis
Deconstruction
and
categorization
of concepts
Integrating
concepts
Synthesis
and
resynthesize
Validation
of
conceptual framework
Rethinking
of
conceptual
framework
Stellenbosch University https://scholar.sun.ac.za

157 | P a g e
Figure 75. Readiness model illustration of case study inclusion and output
Dimension
Element
Variable
Stellenbosch University https://scholar.sun.ac.za

158 | P a g e
There are two main outputs with regards to this chapter. These two outputs are the graphical results
provided by the importance-performance analysis and the business readiness calculation results. The
importance-performance analysis outputs are summarized as:
• Overall (combination of strategy, operations and tactics) importance-performance analysis
results including three weightings factors (readiness dimension, element and variable
weightings)
• Importance-performance analysis of strategy including three weightings factors (readiness
dimension, element and variable weightings)
• Importance-performance analysis of operations including three weightings factors (readiness
dimension, element and variable weightings)
• Importance-performance analysis of tactics including three weightings factors (readiness
dimension, element and variable weightings)
These analyses provide the reader with different perspectives on importance and performance with
regards to this study. The Basic, two weighted IPA, provides a simple and quick analysis of the data.
The other types of IPA’s incorporate three weighting factors and provide results focused specifically
on strategy, operations and tactics, as well as overall IPA, which includes the combined weightings of
the strategy, operations and tactics sections. It is important to note that the 3 weighted IPA’s are
illustrated as relative importance vs performance, due to the method that was used to determine the
weightings does not allow for it to be directly scaled for use in the IPA. The IPA sections can be seen
in the Figure 76.
Figure 76. IPA Approaches
Overall IPA, which includes
the combined weightings of
the strategy, operations
and tactics sections
Overall IPA
IPA’s incorporate three
weighting factors and
provide results focused
specifically on operations
Operations IPA
IPA approaches
Tactics IPA
IPA’s incorporate three weighting factors and provide
results focused specifically on Tactics
Strategy IPA
IPA’s incorporate three
weighting factors and
provide results focused
specifically on strategy
Stellenbosch University https://scholar.sun.ac.za

159 | P a g e
The business’ readiness is determined through weighted average calculations. This section is divided
into two main parts. The first phase is identifying the business’ overall readiness for artificial
intelligence through the presentation of the business’ dimensional readiness. The second phase indicates
the business’ dimensional readiness through the presentation of the various readiness elements
performance within that specific dimension. The following sections provide a description of the case
study background, as well as the proceedings and results of the case study with regards to the model
developed.
7.1 Case study requirements, selection and background
When revisiting the problem statements and project objectives. The main focus of this study is the
development of a technology readiness model aimed towards assessing artificial intelligence readiness
of a business, as well as testing its applicability on a case study. With regards to selecting the applicable
case study, some requirements are set in place to identify a viable and valuable case study with regards
to this study.
The first requirement that was identified with regards to the study is that the business/enterprise has to
be at the initial phase of AI implementation, thus some level of executive support is given towards
possible AI research and design. This requirement potentially indicates that the company has to a certain
degree some digital/cognitive knowledge, experience and foundations, as well as a digitized culture.
This is seen as a positive input into the case study in terms of evaluation accuracy and productivity.
A second requirement involves individuals who will partake in the evaluation study. These respondents
are required to be aware of and need some knowledge or experience with regards to cognitive projects,
such as digitalization, robotic process automation and artificial intelligence. To produce a more
balanced result from the evaluations, the respondents partaking in the evaluation surveys also need to
originate from different divisions and at different levels of management within the business.
Through interviews and research, a large insurance company (from now on referred to as Company X)
has been identified, which pass the following requirements:
• The business is in the starting phases of AI implementation/research/design for the business.
• Individuals in the business have basic, as well as more experienced knowledge with regards to AI
from a technical, business and management perspective.
• Individuals with the required knowledge are present in different levels and divisions within the
business.
• The organization and individuals have agreed to partake in the study and the required
documentation has been completed.
Stellenbosch University https://scholar.sun.ac.za

160 | P a g e
Company X, which forms part of the case study provides financial solutions to a variety of client types
such as individuals, small-medium sized businesses and large corporations across Africa and Asia. The
main business offerings can be seen in Figure 77 .The company employs roughly around 30 000 people
and is involved in markets, such as insurance, investments, lending and banking. In terms of insurance
the business provides life assurance-based products and short-term insurance solutions. The investment
sections encompass direct asset management or services such as the use of multi-mangers to invest in a
selection of funds. The company provides personal and debt consolidation loans. The business provides
a range of innovative banking services and products. Long term goals of the business with relevance to
the study topic, is the aim of becoming a digital platform business, this encompasses the simplification
and digitization of journeys for employees, intermediaries and customers. In terms of the business, the
focus of digitalization is to develop deeper insights into specific customer needs through accelerated
use of analytics and real-time data. The business has successfully launched and integrated robotic
process automation into its business structures and is exploring possible avenues to leverage artificial
intelligence to generate value for the business.
Figure 77. Main business offerings
7.2 Conducting the case study
The study was initialized through scheduled meetings, interviews and finally the administration of
surveys. The data collection towards the completion of the case study is divided into three phases
namely, interview objectives, survey administration objectives and post survey interview objectives.
The interview objectives are conducting a presentation on the develop readiness model, gather
information on individuals that fulfil requirements and provide information and assistance to
interviewees with regards to the model, assist in the accuracy of evaluations. The survey administration
objectives are administering the surveys and providing continuous assistance, by answering any
questions involved in this study. The post survey and interview objectives are to gather information of
interviewees with regards to the perceived usefulness of the developed model and identify more possible
Main business
Offerings
Insurance
Investments Banking
Lending
Stellenbosch University https://scholar.sun.ac.za

161 | P a g e
needs from the model. The process followed for collection of data from the SMEs within the business
can be seen in the figure below.
Figure 78. Case study data collection
The data collection with regards to case study follows the process steps in the figure above. The initial
semi-structured interviews were conducted with certain identified individuals, which have satisfied the
requirements previously stated and have agreed to partake in the study. An example of this survey can
be seen in Appendix I. It is important to note that the interviews and administration of the surveys were
conducted in person to best try avoid any misunderstandings and to easily answer any questions with
regards to the study, as well as the data provided by the employees are completely anonymous so as to
potentially improve data accuracy. Presentations were given to these individuals to explain the core
parts of the framework, as well as their roles with regards to the study. The surveys were administered
and explained in detail, as well as with the objective to improve efficiency with regards to the reduction
of misunderstandings and duration until feedback. After the surveys have been completed, another short
interview was conducted with these individuals regarding their perceived usefulness and applicability
of the model with regards to their business and AI implementation. The overall consensus from all the
individuals that participated in the study, was that the developed model, together with its elements are
definitely useful and applicable towards the business and possible future challenges. This served as a
further validation that the model developed, could mainly serve its proposed purpose and be useful in
the realm of technological readiness of businesses wishing to implement and leverage AI in their
business.
Data collection process
Interview Objectives Survey Administration
objectives
Post survey interview
objectives
Conduct presentation on
the developed readiness
model
Gather information on
individuals that fulfil
requirements
Provide information with
regards to the developed
model with the objective
of assisting interviewee’s
towards providing more
accurate inputs
Administer developed
surveys
Provide continuous
assistance with regards to
questions to assist in
cultivating more accurate
answers
Gather information from
interviewees with
regards to general
perceived usefulness of
the developed model
Identify some possible
needs from a model, such
as the one developed
Stellenbosch University https://scholar.sun.ac.za

162 | P a g e
The participant was required to complete a Likert scale method evaluation survey, whereby they rate
the current perceived performance of the business and employees with respect to the developed
readiness element and variables. The individual inputs are identified as performance, but should be
noted that the individuals are providing their personal ratings/insights with regards to these various
components of the business, thus the performance mentioned more closely resembles satisfaction of the
individuals as the data acquired by these individuals are qualitative in nature. The transformation
towards the incorporation of performance and quantitative data, is further discussed in the following
chapter. As stated, before the exact titles and professions of the individuals that participated are withheld
to ensure anonymity internally and externally across the business. It is important to note that the
individuals all pass the requirements set out and range from the management of cognitive projects,
research and design to Management of business with connection to artificial intelligence.
The performance/satisfaction ratings are enumerated between 1 being the lowest possible
performance/non-existent and 10 as the highest possible performance/ready for AI. The reason for
choosing a 10-point Likert scale, is due to the fact that the importance-performance analysis’ graphical
outputs’ axis ranges from 1 to 10. This range thus provides more options for the individuals to provide
their insights, as well as removes the necessity to scale up the retrieved data for the importance-
performance analysis. The results pertaining the performance/satisfaction ratings can be seen in the
Table 50. The data that will be used in the performance-satisfaction analysis and the overall readiness
evaluation is the average rating for every element across all respondents.
Table 50. Business performance evaluation results
Stellenbosch University https://scholar.sun.ac.za

163 | P a g e
i
Readiness
elements (i) n Variable description
Respondent
Performance
1
Respondent
Performance
2
Respondent
Performance
3
Respondent
Performance
4
Respondent
Performance
5
Respondent
Performance
6
Respondent
Performance
7
Respondent
Performance
8
Respondent
Performance
9
Average
Pi
Standard
deviation
1 Job Security 1
Employees' perception
on job security with
regards to AI 7 1 6 2 2 2 2 3 2 3.000 1.944
2
Perceived
usefulness 2
Employees' perception
on the usefulness of AI 8 5 6 5 5 4 3 6 4 5.111 1.370
3
Perceived ease
of use 3
Employees' perception
with regards to ease of
use of AI 2 5 8 8 4 4 2 2 7 4.667 2.357
4
Compatibility
with existing
values and
practices
4
Compatibility of AI with
business values and
practices 8 2 5 5 3 5 1 4 7 4.444 2.114
5 Benefits
5
Employees' perception
on the benefits regarding
AI 5 1 8 6 7 5 6 6 9 5.889 2.131
6
Business
Acceptance 6
Perceived business
acceptance of AI 5 6 7 8 7 4 3 6 10 6.222 1.988
7
Skills and
expertise
7
Perceived current skills
and expertise capability
to implement and
manage AI 1 1 4 3 3 5 4 5 5 3.444 1.499
8 Collaboration
8
Willingness of employee
collaboration with
regards to AI 4 3 7 5 2 4 3 6 7 4.556 1.707
9 Certainty 9
Employees' perceived
trust/certainty in AI 4 1 5 4 4 3 1 5 2 3.222 1.474
10
Technological
categorization
and planning
10
Technological
categorization and
planning progress for AI 7 3 2 4 3 4 6 4.143 1.641
11
Technology
requirement
handling
11
Identification of
technology requirement
management structures 7 5 2 2 5 4 4 7 4.500 1.803
Stellenbosch University https://scholar.sun.ac.za

164 | P a g e
12
Technological
investment and
capital
management
12
Allocation of Investment
and capital management
for AI 3 7 4 4 1 6 2 3 9 4.333 2.404
13
Cost
management 13
Identification of cost
management structures
for AI 1 8 6 7 2 6 3 2 9 4.889 2.767
14
Technological
competitors’
analysis
14
Technological
competitors’ analysis for
AI 6 3 3 7 5 2 9 5.000 2.330
Cloud
resources
15
Identification and
selection of cloud
computing models, such
as infrastructure as a
service, Platform as a
service or software as a
service 5 7 4 1 6 6 5 6 5.000 1.732
16
Identification and
satisfaction of
requirements regarding
Cloud computing
models 2 7 1 1 6 5 5 5 4.000 2.179
15
17
Identification and
selection of cloud
computing deployment
models, such as cloud,
hybrid and on-premises
models 2 7 3 1 7 7 4 5 4.500 2.236
18
Identification and
satisfaction of
requirements regarding
cloud computing
deployment models 2 5 1 1 7 3 4 5 3.500 2.000
16
Network
Connectivity
19
Identification of
required network
connectivity within
business for AI 6 7 3 3 5 4 6 7 5.125 1.536
Stellenbosch University https://scholar.sun.ac.za

165 | P a g e
20
Assign responsibilities
and roles for managing
risks involving AI 1 5 6 4 1 3 2 3 4 3.222 1.618
21
Prioritization and
identification of
information system
assets 3 2 8 0 2 5 4 4 6 3.778 2.250
17
Technology
Risk
Management
22
Implementation of
practices and controls to
mitigate risks 1 4 8 6 5 6 6 4 4 4.889 1.853
23
The identification and
assessment of the like
hood, as well as the
impact of current and
emerging threats,
vulnerabilities and risks 1 4 5 3 3 7 5 3 4 3.889 1.595
24
Implementation of
periodic
improvement/update and
monitoring of risk
assessment to include
changes in systems, as
well as
operating/environmental
conditions that could
affect the risk analysis 1 6 5 6 6 7 5 5 4 5.000 1.633
18
Quality
Management
25
Identification and
selection of quality
management structures
for AI 2 1 7 3 2 5 2 2 2 2.889 1.792
19
Human
resource
planning
26
Documentation of data
regarding the short to
long term goals of the
AI project 1 2 7 6 1 4 4 5 2 3.556 2.061
Stellenbosch University https://scholar.sun.ac.za

166 | P a g e
27
Effort regarding the
identification of the
types of resources,
people and
competencies that will
be required 3 7 7 7 2 6 3 4 2 4.556 2.061
20
Executive
support 28
Executive support
regarding AI 9 10 7 8 4 6 6 7 10 7.444 1.892
21 Budget 29
Allocation of a budget
for AI 3 5 5 4 1 7 1 4 10 4.444 2.671
22
Business
opportunity
30
Identification of
applicable business
opportunities for AI 4 8 6 6 5 7 5 4 10 6.111 1.853
23
Strategic
leadership
31
Identification of
strategic leadership,
which comply with the
activities and
characteristics of a
strategic leader 10 4 7 4 2 8 4 5 10 6.000 2.708
24 Business cases 32
Identification of
business cases for AI 3 5 8 5 5 6 4 4 10 5.556 2.061
25
Trial-ability 33
Capability to conduct a
certain amount of testing
(test data) 7 6 9 1 1 5 3 3 10 5.000 3.091
26
Business
clarity 34
Perceived business
clarity with regards to
AI 3 2 6 2 2 6 3 4 6 3.778 1.685
27
Observable
results
35
Identification of
methods and criteria
involved with generating
observable results
during
testing/implementation
of AI 1 7 6 2 6 3 3 9 4.625 2.595
Stellenbosch University https://scholar.sun.ac.za

167 | P a g e
28
Technology
roadmaps and
scenarios
36
Identification of
technology roadmaps
and scenarios regarding
AI 6 6 3 7 3 5 7 5.286 1.578
29
Technology
prospect/foreca
sting
37
Identification of
technology forecasting
methods for AI 6 2 2 6 4 3 6 4.143 1.726
30 Agile delivery
38
Development of the
agile strategy with
regards to AI 6 3 5 5 2 6 4 3 10 4.889 2.233
31
Technologic
sustainability
and position
map
39 Development of the
technology sustainability
and position map for AI 7 1 2 7 3 4 10 4.857 2.997
32
Communicatio
n networks 40
Identification of
communication
networks involved with
operation of AI 7 2 1 5 4 5 10 4.857 2.799
33
Information
networks 41
Identification of
information networks
involved with
implementation,
operation and
management of AI 7 1 1 5 4 4 10 4.571 2.969
34
Services 42
Identification and
mapping of services that
will incorporate AI 3 6 3 1 5 4 4 10 4.500 2.500
35
Infrastructure
platform 43
Identification of required
infrastructure in terms of
cloud resources, as well
required additional
infrastructure sections 6 1 2 7 4 4 10 4.857 2.850
36
Management
information
system and
data
processing
44
Initiation of the
development of
management structures
for information systems
and data processing 2 1 6 1 2 6 3 3 7 3.444 2.166
Stellenbosch University https://scholar.sun.ac.za

168 | P a g e
37
Agent based
applications 45
Conducting agent-based
simulations or modelling
to indicate possible
impacts of AI on
business processes 1 7 1 2 6 2 2 7 3.500 2.500
38
Return on
investment 46
Calculations of the
return on investment for
AI 5 1 6 5 4 7 2 2 10 4.667 2.667
39
Enterprise
resource
planning in
terms of
databases and
software
47
Initiation of enterprise
resource planning
(databases and software)
for AI
2 7 3 2 8 3 4 6 4.375 2.176
40
Technology
knowledge
management
48
Initiation of technology
knowledge management
strategies for AI 1 5 1 2 8 4 4 6 3.875 2.315
41
Technology
identification
and selection
49
Analysis of technology
compatibility, system
impact of AI and the
maturity of the AI 1 6 6 1 2 7 3 4 6 4.000 2.211
42
Cyber security 50
Identification and
development of
management of cyber
security with regards to
Artificial intelligence 4 1 4 8 7 7 4 5.000 2.268
Stellenbosch University https://scholar.sun.ac.za

169 | P a g e
The calculation of each individuals’ average percentage difference from the mean across all elements
should provide more insight into the correlation of the mean of performance and individual’s inputs.
With regards to possible outliers in the data, occurrence of outliers is included in the study so as to
include possible new and different views on the company’s performance. Seeing as the evaluations
range from values 1-10 (n=10), each increment is seen as 10%, thus the percentage difference is
calculated as:
Percentage difference from mean = (│𝑃𝑑,𝑖,𝑎𝑣𝑒𝑟𝑎𝑔𝑒 − 𝑃𝑑,𝑖│/ n ) x 100%
The results of the average difference from the mean can be seen in the two tables below. This provides
some insights with regards to potential outliers and possible groupings of the respondents. The table
with detailed results can be seen in Appendix D.
Table 51. Percentage absolute difference from the mean for respondents 1 to 5
Respondent number Respondent 1 Respondent 2 Respondent 3 Respondent 4 Respondent 5
Average % difference of
evaluations across all
variables 21.43% 18.94% 18.53% 17.06% 20.93%
Table 52. Percentage absolute difference from the mean for respondents 6 to 9
Respondent number Respondent 6 Respondent 7 Respondent 8 Respondent 9
Average % difference of
evaluations across all
variables 15.42% 13.29% 9.54% 27.67%
It is important to note as previously stated that individuals whose data is seen as an outlier, will be
incorporated as this could influence the data in a new and important way. The results of the average
difference from mean across all elements is graphically illustrated in the figure below.
Stellenbosch University https://scholar.sun.ac.za

170 | P a g e
Figure 79. Case study respondents’ average absolute difference from mean
7.3 Importance performance analysis (IPA)
The IPA is a combination of measures between two attributes namely importance and performance on
a two-dimensional grid (Oh, 2001). This provides ease of data interpretation, as well as the derivation
of practical suggestions (Oh, 2001). The following section encompasses the IPA methods developed
for this section, as seen in Section 6.3. This section is dived into two major parts. These parts are the
basic IPA and the overall, strategic, operation and tactical IPA sections. The basic IPA section focuses
on the results from a quick and simple, two weighted IPA. The other section forms the detailed three
weighted IPA. The results and interpretations can be seen in the section below. The next part of the
importance-performance analysis section focuses on the calculation and illustration of the following
parts:
• Overall (combination of strategy, operations and tactics) importance-performance analysis
results including three weightings factors (readiness dimension, element and variable
weightings)
• Importance-performance analysis of strategy including three weightings factors (readiness
dimension, element and variable weightings)
• Importance-performance analysis of operations including three weightings factors (readiness
dimension, element and variable weightings)
• Importance-performance analysis of tactics including three weightings factors (readiness
dimension, element and variable weightings)
For the calculation and development of this IPA section, the 𝑊𝑖 seen below is determined through the
multiplication of two weightings that were determined (𝑊𝑖 = 𝑊𝑑 . 𝑊𝑑 , 𝑖). These being the weighting
0.00%
5.00%
10.00%
15.00%
20.00%
25.00%
30.00%
Ave
rage
ab
solt
ue
dif
fere
nce
fro
m m
ean
Respondents
Average % difference of evaluations across all variables
Stellenbosch University https://scholar.sun.ac.za

171 | P a g e
of the readiness dimension (𝑊𝑑) determined through the Likert scale and the readiness element
weightings (𝑊𝑑 , 𝑖) determined using the Likert scale method as well. Seeing as the performance is
determined through a scale of 1-10. The overall weighting 𝑊𝑖 is determined as stated above, thereafter
the weighting is normalized by determining the relative weighting of every element with regards to the
highest weighted identified element.
𝑊𝑖,𝑟𝑒𝑙𝑎𝑡𝑖𝑣𝑒 = 𝑊𝑖
𝑊𝑖,𝑚𝑎𝑥𝑖𝑚𝑢𝑚
The developed relative weightings are the scaled up according to the IPA axis scale, which is shown
the formula below.
𝑊𝑖,𝑟𝑒𝑙𝑎𝑡𝑖𝑣𝑒 = 𝑊𝑖,𝑟𝑒𝑙𝑎𝑡𝑖𝑣𝑒 ∗ 𝑘, where k = scale range of performance evaluation
The origin coordinates for determining the axis of the original IPA can be seen in the formula below.
The results table from the analysis can be seen in the Appendix E.
Origin Coordinates =[(Mean of (𝑊𝑖,𝑟𝑒𝑙𝑎𝑡𝑖𝑣𝑒) ; Mean (𝑃𝑖)]
It was evident that that the cyber security dimension and element (i =42) was an extreme outlier due to
the fact that the security dimension was seen overall as a very important aspect and the dimension only
contained one element. This caused to the element to be an extreme outlier in the mapping of the data.
This can be seen in the figure below. The figure below is only used to indicate the outlier effect; thus,
it has less detail than the other figures that follow. The cyber security elements’ importance relative to
the other elements, which share a dimension with others was so large that it completely skewed the
data. It is therefore decided that the cyber security element is removed with regards to the business’
overall IPA. It is important to note that the security and cyber security have extremely high weightings
with regards to importance within the model and is evaluated in combination with the business readiness
evaluation at the end of the chapter. Thus, the business should always invest the appropriate effort and
resources towards this readiness dimension and element. The recalculated results table can be seen in
Appendix F and the illustrative results are indicated in Figure 81. This is followed by the illustrative
results of the IPA (3 weightings) from a strategy, operational and tactical perspective. These
perspectives incorporate only the dimensional weightings for operations, tactics and strategy, the overall
IPA analysis includes an overall weighting which is determined by including the strategy, tactical and
operational weightings.
Stellenbosch University https://scholar.sun.ac.za

172 | P a g e
Figure 80. Skewed Overall IPA graph
Concentrate here
Low priority
Keep the good work
Possible waste of resources
Stellenbosch University https://scholar.sun.ac.za

173 | P a g e
Figure 81. Overall IPA graph
123
4
56
7
8
910
1112
13
1415
1617
1819
2021
22
23
24
25
26
27
28
2930
31
32
33
34
3536
3738
39
40
41
0
1
2
3
4
5
6
7
8
9
10
0 1 2 3 4 5 6 7 8 9 10
Rel
ativ
e Im
po
rtan
ce (𝑾𝒊,
𝒓𝒆𝒍𝒂𝒕𝒊𝒗𝒆)
Performance (Pd,i)
Overall performance-importance analysis
Concentrate here
Low priority
Keep the good work
Possible waste of resources
Stellenbosch University https://scholar.sun.ac.za

174 | P a g e
Figure 82. Strategy IPA graph
123
45
6
7
8
9
10
1112
13
1415
16
1718
19
2021
22
23
24
25
26
27
2829
30
31
32
33
34
35
36
37
38
39
40
41
0
1
2
3
4
5
6
7
8
9
10
0 1 2 3 4 5 6 7 8 9 10
Rel
ativ
e Im
po
rtan
ce (𝑾𝒊,
𝒓𝒆𝒍𝒂𝒕𝒊𝒗𝒆
)
Performance (Pd,i)
Strategy performance-importance analysis
Concentrate here
Low priority
Keep the good work
Possible waste of resources
Stellenbosch University https://scholar.sun.ac.za

175 | P a g e
Figure 83. Operational IPA graph
1
2
3
45
6
7 8
9
1011
12
13
1415
16
17
1819
2021
22
23
242526
27
2829
30
31
32
33
34
3536
37
38
39
40
41
0
1
2
3
4
5
6
7
8
9
10
0 1 2 3 4 5 6 7 8 9 10
Rel
ativ
e Im
po
rtan
ce (𝑾𝒊,
𝒓𝒆𝒍𝒂𝒕𝒊𝒗𝒆)
Performance (Pd,i)
Operational performance-importance analysis
Concentrate here
Low priority
Keep the good work
Possible waste of resources
Stellenbosch University https://scholar.sun.ac.za

176 | P a g e
Figure 84. Tactical IPA graph
1
2
34
5
6
7
8
9
10
1112
13
1415
1617
18
19
2021
22
23
24
25
26
27
28
29 30
3132
3334
35
36
37
38
39
40
41
0
1
2
3
4
5
6
7
8
9
10
0 1 2 3 4 5 6 7 8 9 10
Rel
ativ
e Im
po
rtan
ce (𝑾𝒊,
𝒓𝒆𝒍𝒂𝒕𝒊𝒗𝒆)
Performance (Pd,i)
Tactical performance-importance analysis
Concentrate here
Low priority
Keep the good work
Possible waste of resources
Stellenbosch University https://scholar.sun.ac.za

177 | P a g e
Overall IPA Results
The first IPA lens that will be focused on is the overall IPA result, which incorporates three weighting
levels, as well as the result of incorporating the strategic, operational and tactical weightings to form
the overall dimensional weighting. Again, we utilise two interpretation methods, namely the diagonal
line method and the empirical mean method, the first focus will be the diagonal line method, followed
by the original mean axis method.
The diagonal line method perspective classifies the readiness elements into four areas. These areas are
low priority, possible waste of resources, keep up the good work and areas to improve, as well as
identifies the elements that are well-balanced through their discrepancy distance from the diagonal line.
Looking at the discrepancies with regards to business dimensions in Figure 81, it can be concluded that
the employee and culture, as well as the technology management dimensions are better balanced than
the other dimensions, seeing as their groupings are more closely following the diagonal line. From this
it can be concluded that these dimensions do not require immediate attention from the business, but
should be maintained as is until total readiness. The other dimensions all have pretty large discrepancies,
thus more attention and resources should be allocated to each of the readiness dimensions. This provides
the business with the ability to prioritize their future efforts. The results can be seen in the table below.
Table 53. Overall IPA results
i Readiness elements
IPA Diagonal line method
classification
IPA Original mean axis
method classification
Employee and
culture
1 Job Security Improve here Low priority
2 Perceived usefulness
Waste of resources Waste of resources
3 Perceived ease of use Low priority Waste of resources
4
Compatibility with
existing values and
practices Low priority Lower priority
5 Benefits Waste of resources Waste of resources
6 Business Acceptance Waste of resources Waste of resources
7 Skills and expertise Improve here Lower priority
8 Collaboration Improve here Lower priority
9 Certainty Low priority Lower priority
Stellenbosch University https://scholar.sun.ac.za

178 | P a g e
Technology
Management
10
Technological
categorization and
planning Low priority Lower priority
11
Technology
requirement handling Improve here Lower priority
12
Technological
investment and capital
management Improve here Lower priority
13 Cost management Low priority Waste of resources
14
Technological
competitors’ analysis Low priority Waste of resources
15 Cloud resources Low priority Lower priority
16 Network Connectivity Waste of resources Waste of resources
17
Technology Risk
Management Improve here Lower priority
18 Quality Management Improve here Lower priority
19
Human resource
planning Improve here Lower priority
Organizational
governance and
leadership
20 Executive support Improve here Keep up the good work
21 Budget Improve here Concentrate here
22 Business opportunity Improve here Keep up the good work
23 Strategic leadership Improve here Keep up the good work
24 Business cases Improve here Keep up the good work
Strategy
25 Trial-ability Improve here Keep up the good work
26 Business clarity Improve here Concentrate here
27 Observable results
Improve here Keep up the good work
28
Technology roadmaps
and scenarios Improve here Keep up the good work
29
Technology
prospect/forecasting Improve here Concentrate here
30 Agile delivery Improve here Keep up the good work
Stellenbosch University https://scholar.sun.ac.za

179 | P a g e
Infrastructure
31
Technologic
sustainability and
position map Improve here Keep up the good work
32
Communication
networks Improve here Concentrate here
33 Information networks Improve here Concentrate here
34 Services Improve here Concentrate here
35 Infrastructure platform Improve here Keep up the good work
Knowledge and
information
management
36
Management
information system
and data processing Improve here Concentrate here
37
Agent based
applications Improve here Concentrate here
38 Return on investment Improve here Keep up the good work
39
Enterprise resource
planning in terms of
databases and software Improve here Concentrate here
40
Technology
knowledge
management Improve here Concentrate here
41
Technology
identification and
selection Improve here Concentrate here
From Table 53. The business should shift their immediate focus towards the “concentrate here”
readiness elements, while maintaining resources and efforts towards the “keep up the good work”
readiness elements. The business should start further investigating whether the readiness elements in
the “waste of resources” require the current resources that are being used for it.
From the diagonal line method perspective one can conclude that the readiness elements with the lowest
discrepancies are well balanced elements with regards to close to equal performance with regards to
importance. From the overall IPA graph, we can identify the low discrepancy elements, as elements
that are close to the 45-degree angle line in the graph. The list of elements identified as balanced
elements with regards to the developed relative weightings. These identified elements are:
Stellenbosch University https://scholar.sun.ac.za

180 | P a g e
Table 54. Overall IPA well balanced readiness elements
i Readiness elements (i) IPA classification
1 Job Security Well balanced
19 Human resource planning
Well balanced
15 Cloud resources Well balanced
17 Technology Risk Management
Well balanced
4
Compatibility with existing values and
practices
Well balanced
8 Collaboration Well balanced
11 Technology requirement handling
Well balanced
16 Network Connectivity Well balanced
Looking at Table 53, using a long term strategic perspective, with regards to the diagonal line method,
it can be concluded that the overall readiness for artificial intelligence is low, due to that 4 readiness
dimensions’ elements are all categorized as “improve here”, thus the performance is lower than the
importance across the four dimensions. The technology management and employee and governance
dimension have a balance of “low priority”, “waste of resources” and “improve here” categorized
elements., thus these are categorized as lower priority with regards to the long-term focus. The overall
consensus shows that the long-term strategy with regards to readiness, is that the business needs to focus
towards improving most of these readiness dimensions and elements.
With this in mind we shift towards the short to medium strategic focus and prioritization. For this focus,
the original axis method, which implements the empirical means to determine the axis’ origin, one could
prioritize the sections of readiness elements into 4 four sections, as well as illustratively identifying
readiness dimensions interpretations. These 4 four sections are “concentrate here”, “keep up the good
work”, “low priority” and “possible waste of resources”. With regards to the readiness dimensions, the
organisational governance and leadership, strategy and infrastructure dimensions are performing well,
as most of the elements reside in the “keep up the good work” section. There is a strong grouping of
knowledge and information management elements in the “concentrate here” section, thus the
organization should shift their attention and resources towards the development and improvement of
these dimension. Currently the technology management dimension and employee and culture are
overall seen as a lower priority dimensions, due to its grouping elements in the “low priority” and “waste
Stellenbosch University https://scholar.sun.ac.za

181 | P a g e
of resources” sections. Seeing as we have categorized and prioritized the overall readiness dimensions,
the next focus is grouping the elements according to their quadrants. In Table 55 the readiness
dimensions are categorized as a result of their overall element categorization, thus the employee and
culture and technology management dimensions are “low priority” and indicated with a blue colour.
The organizational governance and leadership and strategy dimension are overall categorized as “keep
up the good work” and is indicated with the colour green. The infrastructure and knowledge and
information management dimensions are overall categorized as “concentrate here” and is indicated with
a red colour. Seeing as the dimensions have been categorized and prioritized, the next steps is
prioritizing the readiness elements within each dimension. This is done by prioritizing the highest to
lowest difference in the performance vs the goal/importance for each element. The results can be seen
in the table below.
Stellenbosch University https://scholar.sun.ac.za

182 | P a g e
Table 55. Summary of overall IPA results from original mean axis method
Readiness Dimension i Readiness element Wd,i
Relative
Wi Pd,i Goal
Performance
-goal
difference Quadrant
Employee and Culture 7 Skills and expertise 0.10735 4.6442 3.4444 4.64 -1.1956 Lower priority
8 Collaboration 0.10849 4.6936 4.5555 4.69 -0.1345 Lower priority
1 Job Security 0.0715 3.0948 3 3.09 -0.09 Low priority
4 Compatibility with existing
values and practices 0.10027 4.3379 4.4444 4.34 0.1044 Lower priority
3 Perceived ease of use 0.09544 4.129 4.6666 4.13 0.5366 Waste of resources
9 Certainty 0.06111 2.644 3.2222 2.64 0.5822 Lower priority
5 Benefits 0.11065 4.7869 5.8888 4.79 1.0988 Waste of resources
2 Perceived usefulness 0.0911 3.945 5.1111 3.95 1.1611 Waste of resources
6 Business Acceptance 0.09373 4.0553 6.2222 4.06 2.1622 Waste of resources
Technology Management 18 Quality Management 0.08795 3.997 2.8888 4 -1.1112 Lower priority
12 Technological investment and
capital management 0.10679 4.8538 4.3333 4.85 -0.5167 Lower priority
19 Human resource planning 0.09565 4.3473 4.0555 4.35 -0.2945 Lower priority
11 Technology requirement
handling 0.10353 4.7057 4.5 4.71 -0.21 Lower priority
17 Technology Risk Management 0.09554 4.3426 4.25 4.34 -0.09 Lower priority
15 Cloud resources 0.09042 4.1099 4.25 4.11 0.14 Lower priority
16 Network Connectivity 0.10888 4.949 5.125 4.95 0.175 Waste of resources
10 Technological categorization
and planning 0.08115 3.6884 4.1428 3.69 0.4528 Lower priority
13 Cost management 0.09322 4.2368 4.8888 4.24 0.6488 Waste of resources
Stellenbosch University https://scholar.sun.ac.za

183 | P a g e
14 Technological competitors’
analysis 0.06187 2.8123 5 2.81 2.19 Waste of resources
Organizational governance and
leadership
21 Budget 0.21998 9.9855 4.4444 9.99 -5.5456 Concentrate here
23 Strategic leadership 0.20528 9.3184 6 9.32 -3.32 Keep up the good
work
20 Executive support 0.2203 10 7.4444 10 -2.5556 Keep up the good
work
22 Business opportunity 0.19066 8.6546 6.1111 8.65 -2.5389 Keep up the good
work
24 Business cases 0.14944 6.7835 5.5555 6.78 -1.2245 Keep up the good
work
Strategy 27 Observable results 0.18696 8.7176 4.625 8.72 -4.095
Keep up the good
work
26 Business clarity 0.1515 7.06573 3.7777 7.07 -3.2923 Concentrate here
29 Technology
prospect/forecasting 0.15769 7.3531 4.1428 7.35 -3.2072 Concentrate here
30 Agile delivery 0.16867 7.8648 4.8888 7.86 -2.9712 Keep up the good
work
25 Trial-ability 0.16647 7.7623 5 7.76 -2.76 Keep up the good
work
28 Technology roadmaps and
scenarios 0.15468 7.2125 5.2857 7.21 -1.9243
Keep up the good
work
Infrastructure 35 Infrastructure platform 0.20869 8.9225 4.8571 8.92 -4.0629
Keep up the good
work
33 Information networks 0.18025 7.70665 4.5714 7.71 -3.1386 Concentrate here
Stellenbosch University https://scholar.sun.ac.za

184 | P a g e
31 Technologic sustainability and
position map 0.18344 7.843 4.8571 7.84 -2.9829
Keep up the good
work
32 Communication networks 0.1765 7.5465 4.8571 7.55 -2.6929 Keep up the good
work
34 Services 0.18166 7.76693 4.5 7.77 -3.27 Concentrate here
Knowledge and information
management 36
Management information
system and data processing 0.1914 8.5757 3.4444 8.58 -5.1356 Concentrate here
39
Enterprise resource planning in
terms of databases and
software
0.18442 8.2621 4.375 8.26 -3.885 Concentrate here
40 Technology knowledge
management 0.1701 7.66092 3.875 7.66 -3.785 Concentrate here
41 Technology identification and
selection 0.158 7.07907 4 7.08 -3.08 Concentrate here
37 Agent based applications 0.14372 6.439 3.5 6.44 -2.94 Concentrate here
38 Return on investment 0.16666 7.4669 4.6666 7.47 -2.8034 Keep up the good
work
42 Cyber security 1 / 5 / /
Stellenbosch University https://scholar.sun.ac.za

185 | P a g e
When looking at the table above we have categorized employee and culture and technology
management as lower priority dimensions, within each of these dimensions the highest priority elements
are identified in the table below
Table 56. Three highest priority elements in “low priority” readiness dimensions
Employee and culture Technology Management
Skills and expertise Quality Management
Collaboration Technological investment and capital
management
Job security Human resource planning
The Infrastructure, Strategy and Organizational governance and leadership dimensions have been
identified as well performing dimensions, but keeping in mind the long-term strategy improvement
need. These readiness dimensions still require improvements, thus the three highest priority elements
within these readiness dimensions are shown in the table below.
Table 57. Three highest priority elements in “keep up the good work” readiness dimensions
Strategy Organizational governance and
leadership
Infrastructure
Observable results Budget Infrastructure platform
Business clarity Strategic leadership Information networks
Technology prospect/forecasting Executive support Technologic sustainability
and position map
The infrastructure and knowledge and information management dimensions have been identified as
dimensions that require the most attention and highest prioritization. The three highest priority elements
within these readiness dimensions are shown in the table below.
Table 58. Three highest priority elements in “Concentrate here” readiness dimension
Knowledge and information management
Management information system and data processing
Enterprise resource planning in terms of databases and software
Technology knowledge management
Stellenbosch University https://scholar.sun.ac.za

186 | P a g e
In conclusion with regards to the overall IPA analysis, incorporation of three weighting factors and two
interpretation methods, it can be deduced that the long term aim of the business should be the
improvement of the strategy, infrastructure, knowledge and information management, organizational
management dimensions, whereas the technology management and employee and culture dimensions
require attention, but are seen as relatively lower priority dimensions. With this in mind the short to
medium term aim with regards to these readiness dimensions are divided into overall three categories.
This can be seen in Table 56, Table 57 and Table 58. The most important focus is the knowledge and
information management dimension, as these dimensions are underperforming and has been identified
as important dimensions. This focus is further refined by identifying the readiness elements within each
of these dimensions that have the highest difference between performance and importance. The
improvement of these elements could provide large increases in readiness, due to their importance.
These elements can be seen in Table 58. The next section is calculated/developed to assist the business
in providing the categorization and prioritization of readiness dimensions and elements from three
perspectives. These perspectives are strategic, operational and tactical.
Strategy, operational and tactical IPA
The second IPA lens that will be focused on is the results obtained from the IPA using dimensional
weightings of strategy, operations and tactics. There are two interpretation methods, namely the
diagonal line method and the empirical mean method, the first focus will be the diagonal line method,
followed by the original mean axis method. The diagonal line method interpretation results will be
shown in comparison to the different dimensional weightings. The diagonal line method categorizes the
readiness element into four categories as seen in Figure 71. The results can be seen in the table below.
Table 59. Strategic, operational and tactical IPA diagonal method results
Readiness
Dimension i business cases
Strategic IPA
classification
Operational IPA
classification
Tactical IPA
classification
Employee and
Culture
1 Job Security Improve here Improve here Low priority
2 Perceived usefulness Waste of
resources
Waste of
resources
Waste of
resources
3 Perceived ease of use Low priority Improve here Low priority
4
Compatibility with
existing values and
practices
Low priority Improve here Low priority
5 Benefits Waste of
resources Improve here
Waste of
resources
Stellenbosch University https://scholar.sun.ac.za

187 | P a g e
6 Business acceptance Waste of
resources
Keep up the good
work
Waste of
resources
7 Skills and expertise Improve here Improve here Improve here
8 Collaboration Low priority Improve here Low priority
9 Certainty Low priority Improve here Low priority
Technology
Management
10
Technological
categorization and
planning
Low priority Low priority Low priority
11 Technology
requirement handling Improve here Improve here Improve here
12
Technological
investment and capital
management
Improve here Improve here Improve here
13 Cost management Low priority Low priority Low priority
14 Technological
competitors’ analysis Low priority Low priority Low priority
15 Cloud resources Low priority Improve here Low priority
16 Network Connectivity Waste of
resources Improve here
Waste of
resources
17 Technology Risk
Management Low priority Improve here Improve here
18 Quality Management Improve here Improve here Improve here
19 Human resource
planning Improve here Improve here Improve here
Organizational
Governance and
Leadership
20 Executive support Improve here Improve here Improve here
21 Budget Improve here Improve here Improve here
22 Business opportunity Improve here Improve here Improve here
23 Strategic leadership Improve here Improve here Improve here
24 Business cases Improve here Improve here Improve here
Strategy
25 Trial-ability Improve here Improve here Improve here
26 Business clarity Improve here Improve here Improve here
Stellenbosch University https://scholar.sun.ac.za

188 | P a g e
27 Observable results Improve here Improve here Improve here
28 Technology roadmaps
and scenarios Improve here Improve here Improve here
29 Technology
prospect/forecasting Improve here Improve here Improve here
30 Agile delivery Improve here Improve here Improve here
Infrastructure
31
Technologic
sustainability and
position map
Improve here Improve here Improve here
32 Communication
networks Improve here Improve here Improve here
33 Information networks Improve here Improve here Improve here
34 Services Improve here Improve here Improve here
35 Infrastructure platform Improve here Improve here Improve here
Knowledge and
information
management
36
Management
information system
and data processing
Improve here Improve here Improve here
37 Agent based
applications Improve here Improve here Improve here
38 Return on investment Improve here Improve here Improve here
39
Enterprise resource
planning in terms of
databases and software
Improve here Improve here Improve here
40
Technology
knowledge
management
Improve here Improve here Improve here
41
Technology
identification and
selection
Improve here Improve here Improve here
From the results above. The business should shift their immediate focus towards the “Improve here”
readiness elements, while maintaining resources and efforts towards the “keep up the good work”
readiness elements. The business should start further investigating whether the readiness elements in
the “waste of resources” require the current resources that are being used for it. The table provides a
unique view in terms of indicating the categorized elements, as well as the results when focusing on
strategy, operations or tactics, thus if the business wants a strategic focus with regards to these readiness
Stellenbosch University https://scholar.sun.ac.za

189 | P a g e
elements, it can view above. The next IPA focus is applying the original axis method, to these data
points. The results can be seen in the table below.
Table 60. Strategic, operational and tactical IPA original axis method results
Readiness
Dimension i Readiness elements (i) IPA Strategy IPA Operational IPA Tactical
Employee and
Culture
1 Job Security Low Priority Low Priority Low Priority
2 Perceived usefulness
Possible waste of
resources
Possible waste of
resources
Possible waste
of resources
3 Perceived ease of use
Possible waste of
resources
Possible waste of
resources
Possible waste
of resources
4
Compatibility with
existing values and
practices Low Priority Low Priority Low Priority
5 Benefits
Possible waste of
resources
Possible waste of
resources
Possible waste
of resources
6 Business acceptance
Possible waste of
resources
Possible waste of
resources
Possible waste
of resources
7 Skills and expertise Low Priority Low Priority Low Priority
8 Collaboration Low Priority Low Priority Low Priority
9 Certainty Low Priority Low Priority Low Priority
Technology
Management
10
Technological
categorization and
planning Low Priority Low Priority Low Priority
11
Technology
requirement handling Low Priority Low Priority Low Priority
12
Technological
investment and capital
management Low Priority Low Priority Low Priority
13 Cost management
Possible waste of
resources
Possible waste of
resources
Possible waste
of resources
14
Technological
competitors’ analysis
Possible waste of
resources
Possible waste of
resources
Possible waste
of resources
15 Cloud resources Low Priority Low Priority Low Priority
Stellenbosch University https://scholar.sun.ac.za

190 | P a g e
16 Network connectivity
Possible waste of
resources
Possible waste of
resources
Possible waste
of resources
17
Technology risk
management Low Priority Low Priority Low Priority
18 Quality management Low Priority Low Priority Low Priority
19
Human resource
planning Low Priority Low Priority Low Priority
Organizational
Governance and
Leadership
20 Executive support
Keep up the good
work
Keep up the
good work
Keep up the
good work
21 Budget
Concentrate here Concentrate here
Concentrate
here
22 Business opportunity
Keep up the good
work
Keep up the
good work
Keep up the
good work
23 Strategic leadership
Keep up the good
work
Keep up the
good work
Keep up the
good work
24 Business cases
Keep up the good
work
Keep up the
good work
Keep up the
good work
Strategy
25 Trial-ability
Keep up the good
work
Keep up the
good work
Keep up the
good work
26 Business clarity
Concentrate here Concentrate here
Concentrate
here
27
Observable results
Keep up the good
work
Concentrate
here/Keep up the
good work
Concentrate
here/Keep up
the good work
28
Technology roadmaps
and scenarios
Keep up the good
work
Keep up the
good work
Keep up the
good work
29
Technology
prospect/forecasting Concentrate here Concentrate here
Concentrate
here
30 Agile delivery
Keep up the good
work
Keep up the
good work
Keep up the
good work
Infrastructure
31
Technologic
sustainability and
position map
Keep up the good
work
Keep up the
good work
Keep up the
good work
32
Communication
networks
Keep up the good
work
Keep up the
good work
Keep up the
good work
33 Information networks
Concentrate here Concentrate here
Concentrate
here
34 Services
Concentrate here Concentrate here
Concentrate
here
Stellenbosch University https://scholar.sun.ac.za

191 | P a g e
35 Infrastructure platform
Keep up the good
work
Keep up the
good work
Keep up the
good work
Knowledge and
information
management
36
Management
information system and
data processing Concentrate here Concentrate here
Concentrate
here
37
Agent based
applications Concentrate here Concentrate here
Concentrate
here
38 Return on investment
Keep up the good
work
Keep up the
good work
Keep up the
good work
39
Enterprise resource
planning in terms of
databases and software Concentrate here Concentrate here
Concentrate
here
40
Technology knowledge
management Concentrate here Concentrate here
Concentrate
here
41
Technology
identification and
selection Concentrate here Concentrate here
Concentrate
here
42 Cyber security - - -
These graphs provide some useful insights into the business with regards to where the business is doing
well, possibly wasting resources, identification of lower priority elements, as well as where the business
needs to focus future prioritization, assets and effort to greatly improve the business’ overall readiness
for the implementation of artificial intelligence. The strategic, operational and tactical views provide
different perspectives on what elements are important, require attention and where resources are
possibly wasted. These can be identified through 4 different generated perspectives in terms of models
the model weightings seen in the list below:
• Overall (combination of strategy, operations and tactics) importance-performance analysis
results including three weightings factors (readiness dimension, element and variable
weightings)
• Importance-performance analysis of strategy including three weightings factors (readiness
dimension, element and variable weightings)
• Importance-performance analysis of operations including three weightings factors (readiness
dimension, element and variable weightings)
• Importance-performance analysis of tactics including three weightings factors (readiness
dimension, element and variable weightings)
Stellenbosch University https://scholar.sun.ac.za

192 | P a g e
Each of the views have two interpretation methods have integrated into each graph. These being the
original means IPA axis and the diagonal line method. These should provide the user with multiple
views and interpretation of the data gathered. This also encompasses the categorization and
prioritization of readiness dimensions and elements. The next phase is identifying the business’
readiness evaluation results. To identify high and low performing readiness dimensions and elements.
7.4 Business readiness index
The previous section assists the business in the categorization and prioritizing of readiness dimensions
and elements. The readiness index section will indicate the business’ readiness numerically. The
surveys in the model are used to determine the weightings and maturity of an item. The readiness level
of each dimension (𝑹𝒅) is determined by calculating the weighted average of all the readiness elements’
performance (𝑷𝒅,𝒊,𝒏) within each dimension. This is done by using the calculations as seen below.
𝑅𝑑= ∑ 𝑅𝑑,𝑙. 𝑤𝑑,𝑙𝑖𝑙=1
Where 𝑅𝑑,𝑖 : Performance/readiness of Readiness element
And 𝑤𝑑,𝑖: Weighting of readiness element
𝑅𝑑,𝑖 = ∑ 𝑃𝑑,𝑖,𝑛. 𝑤𝑑,𝑖,𝑛𝑛𝑙=1
Where 𝑃𝑑,𝑖,𝑛 : Average of performance/satisfaction rating of readiness variable across all
respondents
And 𝑤𝑑,𝑖,𝑛: Readiness variable weight
𝑃𝑑,𝑖,𝑛= (∑ 𝑃 𝑙,𝑑,𝑖,𝑛)𝑆𝑙=1 /s
Where 𝑃𝑑,𝑖,𝑙 : Performance/satisfaction rating of readiness variable
And S : Number of respondents
The readiness index table developed to determine these readiness evaluations can be seen in
Appendix G. The results of the calculation as seen above with regards to the table in Appendix G,
can be seen in the figures below. The results regarding the business’ overall readiness for AI can
be seen in table below and Figure 85. For this business to completely ready, these evaluations’
numeric value should be 10.
Table 61. Overall business dimension readiness for artificial intelligence
Readiness dimensions Rd (Readiness)
Employee and culture 3.87
Technology Management 4.02
Organizational governance and leadership 5.84
Stellenbosch University https://scholar.sun.ac.za

193 | P a g e
Strategy 4.57
Infrastructure 4.4
Knowledge and information management 4.04
Security 5
From the table above, it can be concluded that the top three readiness dimensions are, organizational
governance and leadership, security and strategy dimensions, which has the highest performing
dimensions with regards to readiness for AI implementation. These results in combination with the
previous section will be interpreted in the conclusion of this chapter.
Stellenbosch University https://scholar.sun.ac.za

194 | P a g e
Figure 85. Overall business dimensional readiness
4.02
5.84
4.574.40
4.04
5.00
0.00
1.00
2.00
3.00
4.00
5.00
6.00
7.00
8.00
9.00
10.00
Employee and culture
Technology Management
Organisational governance andleadership
StrategyInfrastructure
Knowledge and informationmanagement
Security
Overall business dimensional readiness
Stellenbosch University https://scholar.sun.ac.za

195 | P a g e
Figure 86. Business readiness within employee and culture dimension
Job Security , 3.00
Perceived usefulness, 5.11
Perceived ease of use, 4.67
Compatibility with existing values and practices, 4.44
Benefits, 5.89Business Acceptance, 6.22
Skills and expertise, 3.44
Collaboration, 4.56
Certainty, 3.22
0.00
1.00
2.00
3.00
4.00
5.00
6.00
7.00
8.00
9.00
10.00
Job Security
Perceived usefulness
Perceived ease of use
Compatibility with existing values andpractices
BenefitsBusiness Acceptance
Skills and expertise
Collaboration
Certainty
Employee and Culture
Stellenbosch University https://scholar.sun.ac.za

196 | P a g e
Figure 87. Business readiness within technology management dimension
Technological categorization and planning, 4.14
Technology requirement handling, 4.50
Technological investment and capital management, 4.33
Cost management, 4.89
Technological competitors analysis, 5.00
Cloud resources, 4.25
Network Connectivity, 5.13
Technology Risk Management, 4.25
Quality Management, 2.89
Human resource planning, 4.06
0.00
1.00
2.00
3.00
4.00
5.00
6.00
7.00
8.00
9.00
10.00
Technological categorization and planning
Technology requirement handling
Technological investment and capitalmanagement
Cost management
Technological competitors analysis
Cloud resources
Network Connectivity
Technology Risk Management
Quality Management
Human resource planning
Technology management
Stellenbosch University https://scholar.sun.ac.za

197 | P a g e
Figure 88. Business readiness within organisational governance and leadership dimension
Executive support, 7.44
Budget, 4.44
Business opportunity, 6.11Strategic leadership, 6.00
Business cases, 5.56
0.00
1.00
2.00
3.00
4.00
5.00
6.00
7.00
8.00
9.00
10.00
Executive support
Budget
Business opportunityStrategic leadership
Business cases
Organisational governance and leadership
Stellenbosch University https://scholar.sun.ac.za

198 | P a g e
Figure 89. Business readiness within strategy dimension
Trial-ability, 5.00
Business clarity, 3.78
Observable results, 4.63
Technology roadmaps and scenarios, 5.29
Technology prospect/forecasting, 4.14
Agile delivery, 4.89
0.00
1.00
2.00
3.00
4.00
5.00
6.00
7.00
8.00
9.00
10.00
Trial-ability
Business clarity
Observable results
Technology roadmaps and scenarios
Technology prospect/forecasting
Agile delivery
Strategy
Stellenbosch University https://scholar.sun.ac.za

199 | P a g e
Figure 90. Business readiness within infrastructure dimension
Technologic sustainability and position map, 4.86
Communication networks, 4.86
Information networks, 4.57Services, 4.50
Infrastrucutre platform, 4.86
0.00
1.00
2.00
3.00
4.00
5.00
6.00
7.00
8.00
9.00
10.00
Technologic sustainability and positionmap
Communication networks
Information networksServices
Infrastrucutre platform
Infrastructure
Stellenbosch University https://scholar.sun.ac.za

200 | P a g e
Figure 91. Business readiness within knowledge and information management dimension
Management information system and data processing, 3.44
Agent based applications, 3.50
Return on investment, 4.67
Enterprise resource planning in terms of databases and software,
4.38
Technology knowledge management, 3.88
Technology identification and selection, 4.00
0.00
1.00
2.00
3.00
4.00
5.00
6.00
7.00
8.00
9.00
10.00
Management information system and dataprocessing
Agent based applications
Return on investment
Enterprise resource planning in terms ofdatabases and software
Technology knowledge management
Technology identification and selection
Knowledge and information management
Stellenbosch University https://scholar.sun.ac.za

201 | P a g e
The overall consensus with the business performance/maturity with regards to readiness for artificial
intelligence, is that the business is not completely ready for the implementation of artificial intelligence.
As the highest performing readiness dimension is the organization governance and leadership with a
sore of 5.85/10. This supports the long-term strategic view of improvement identified in section 7.3
Overall IPA results.
When viewing these readiness evaluations as seen above from the overall business dimension readiness,
the bottom three dimension are Employee and culture (score: 3.87), Technology Management (score:
4.02) and Knowledge and information management (score: 4.04) as seen in Figure 85. In terms of
developing a balanced readiness view within each of these dimensions, the employee and culture
dimensions’ three lowest elements performing elements are skills and expertise (score: 3.44), Certainty
(score: 3.22) and job security (score: 3) as seen in Figure 86. Within the technology management
dimension, the three lowest elements that require attention are quality management (score: 2.89), human
resource planning (score:4.06) and technological categorization and planning (score: 4.14). Within the
knowledge and information management dimension, the three lowest performing elements are
management information system and data processing (score: 3.45), technology knowledge management
(score: 3.88), and agent-based applications (score: 3.5).
From the results indicated above it is clear that the business has still many opportunities to increase its
overall readiness for artificial intelligence implementation. The readiness calculations provide insights
into the performance of various readiness dimensions and readiness elements from a management point
of view, but the importance performance analysis section provides insights into which readiness
dimensions and elements need to be addressed first with regards to the project, to facilitate large
increases in readiness in the short to medium term of the business.
7.5 Case Study Conclusion
The conclusion starts with focusing on the readiness index and the overall IPA results. Looking at
section 7.3, the readiness dimensions: “Infrastructure”, “organisational governance and leadership” and
“Strategy” dimensions are performing well, as most of the elements reside in the “keep up the good
work” section. This reflects as some of the business’ strong points, as it is the best performing
dimensions with regards to readiness for artificial intelligence as seen in Figure 85 is organisational
governance and leadership and it is seen as a very important dimensions in combination with the
security dimension, thus the business must continue current efforts and resource allocation with regards
to these dimensional improvements. The security dimension is one of the best performing readiness
dimensions, this in combination with its relevant importance, it is deduced that the business should
Stellenbosch University https://scholar.sun.ac.za
202 | P a g e
continue their current focus and resource allocation towards the improvement of this dimension. The
most highly prioritized readiness elements within these dimensions can be seen in Table 53.
There is a strong grouping of knowledge and information management dimension elements in the
“concentrate here” quadrant in section 7.3, thus the organization should shift their attention and
resources towards the development and improvement of this dimension. Figure 85 indicates that the
readiness score of this dimension is 4.04. It is thus evident that this readiness dimension is
underperforming with regards to the long-term aim of improvement. To further narrow the business’
focus, the highest prioritized elements within this dimension is shown in Table 58. This should be the
businesses immediate focus and highest priority as this readiness dimension is identified as a very
important dimension, but is under performing. All readiness elements within this dimension, require
focus and resources to improve the performance. Currently the technology management and Employee
and culture dimensions are overall seen as an lower priority dimensions in the short to medium term,
due to its grouping elements in the “low priority” section as seen in Figure 81. In terms of business
readiness, the technology management and Employee and culture dimension are one of the lowest
performing dimensions, with readiness scores of 4.02 and 3.87 respectively. Due to its placement in the
IPA overall results, this dimension requires improvement in the long-term.
Looking at the combination of the readiness evaluation and the multiple perspective IPA analysis. The
long-term business focus, through the use diagonal line method, across all perspectives still point
towards overall improvement of most dimensions, but there are some differences with regards to the
different perspectives of the Employee and culture and technology management dimensions. With
regards to these two dimensions the strategy perspective categorized the Technology management
dimension as a “low priority”, as well as the Employee and culture dimension. The operational
perspective shifts the ”low priority” categorization of both dimensions, to “improve here”. The tactical
perspectives categorizes the Technology management dimension as “Improve here” and Employee and
culture dimension as “Low priority”. The short to medium term aim of the business, using the original
mean axis method, is identical for all perspectives. Similar conclusions can be reached for these
perspectives in comparison to the overall IPA.
Once again, it is deduced that the business requires definitive effort and resources to improve its
readiness for AI implementation. Through the use of the IPA, the readiness dimensions and elements
within each dimension has been prioritized for business, to increase their readiness in the short to
medium term. These results conclude this chapter. This model has provided the business with the ability
to evaluate their readiness for new technologies, such as artificial intelligence, through the inputs from
experienced and knowledgeable individuals in the business. This is accompanied by the ability to
prioritize dimensions and elements within the business that will generating the most growth in readiness
Stellenbosch University https://scholar.sun.ac.za

203 | P a g e
for AI, this is further diversified by tailoring these prioritizing elements and dimensions according to
three focuses. These focuses are a strategic, operational and tactical. These outputs satisfy the proposed
research objectives. The following conclusion chapter will focus on summarization and interpretation
of the study as a whole.
Stellenbosch University https://scholar.sun.ac.za

204 | P a g e
Chapter 8: Conclusion
This chapter begins with a summary of the study followed by discussion of the conclusions drawn from
the objectives and processes with which this study engaged. The contributions that this study provides
in practice are assessed and the final sections focuses on personal reflections, limitations and
recommendations for future research with regards to this study area.
Chapter 8 Objectives Summarise the study into integral phases/process steps
Develop conclusions from processes and objectives of the study
Describe the contributions of this study for business’
Provide personal reflections with regards to the study
Describe limitations of the study
Describe recommendations for future developments
Figure 92. Research methodology process step
8.1 Summary and conclusions of study phases
This section focuses on the development and summarisation of the different study phases in the study.
Important points within each research phase are identified and a chapter break down of these salient
points can be seen in the table below.
Table 62. Research study summary and salient point identification
Study phase Summary and identification of salient points
Chapter 1:
Introduction
This section shaped the initial focus of the study by providing insights into the
back ground of AI in the past and present. From the literature it can be concluded
that AI is a large emerging technology that shows a lot of potential and growth to
shape the business world. Businesses wishing to capitalise on this opportunity are
faced with a range of challenges, one of these being the difficulty to integrate or
GTM
Systematic literature review
Narrative literature review
Conceptual framework analysis
Deconstruction
and
categorization
of concepts
Integrating
concepts
Synthesis
and
resynthesize
Validation
of
conceptual framework
Rethinking
of
conceptual
framework
Stellenbosch University https://scholar.sun.ac.za

205 | P a g e
initiate the process of AI implementation, thus this became the main focus of the
study. It was also identified that there are general inflated expectations with
regards to AI. Thus, the development of the readiness model is aimed to assist in
solving the problem/challenge stated, as well as adding to the process of improving
individuals’ expectations and knowledge on AI.
Chapter 2:
Methodology
Chapter 2 focused on developing the appropriate research methodology for this
study. After the foundational grounded theory methodology was identified, it was
decided to incorporate a more specific methodology, which focuses on the
development of the framework or model. After multiple methodologies were
evaluated, the conceptual framework analysis was chosen as the most applicable
methodology. The integration of these two methods formed the research
methodology process steps that would be followed throughout the study. As
literature reviews form an integral part of research, the systematic literature review
and narrative literature review were discussed and the systematized protocol was
developed, to guide the researcher during the literature reviews.
Chapter 3:
Narrative
literature
review
The initial focus of the narrative literature review was to identify academic
literature on readiness and maturity models for artificial intelligence
implementation in businesses. The initial review found no literature that focused
exactly on this adoption barrier for AI. This provided some insights into the value
that a readiness or maturity model focused on AI could have for businesses wishing
to capitalise on this technology. The initial literature focused on the integration of
different AI approaches to form hybrid AI systems and processes, AI methods to
assist the implementation of a computerised intelligent autonomous manufacturing
environment and a maturity model that assesses the readiness of a business with
regards to industry 4.0. The narrative literature review provided a supplementation
literature review to the systematized literature reviews. From the identification of
concepts in the systematized literature reviews, the focus of the narrative literature
review was primarily on the development of maturity models, decision making
methods and AI readiness concepts. During the parallel completion of the different
views, the lack of academic application of maturity models towards AI and generic
AI maturity levels, the study’s focus shifted towards readiness and readiness
models as these would form the foundational structures that is required to assist
businesses in implementing AI.
Chapter 4:
Systematized
The initial focus of the systematized literature review was to develop and identify
the most important steps of a systematic literature review, to derive a systematized
literature review from that. After the protocol had been developed, the next step
Stellenbosch University https://scholar.sun.ac.za

206 | P a g e
literature
review
was to conduct a review of certain topics, as identified in the previous sections. At
this stage of the study the focus was either maturity or readiness with regards to
the implementation of artificial intelligence. The first literature review focused on
the maturity aspect. Very few academic papers were found that assist businesses
implement AI into their structures through models or frameworks. A small
comparative review was conducted with the results of this systematized literature
review, to find common themes between academic and business sources. Due to
the lack of academic material to serve as a foundation, the study’s focus was
shifted towards readiness. The main focus was determining a business’ readiness
for implementing artificial intelligence in its business structures. The second
systematized literature review focused on business readiness for artificial
intelligence. It was evident from the results that there is also a shortage on
academic papers regarding readiness of businesses for artificial intelligence. The
literature that was found was synthesized and categorized to provide the
foundational requirements that in combination with the narrative literature review
formed the readiness model. Through this the readiness dimension and their
elements were identified.
Chapter 5:
Development
of the readiness
model
components
The objective of this chapter was to further investigate the readiness elements that
were identified in the previous chapters and possibly derive variables from these
elements. It was found that a few of these elements were very complex and related
to large-scale business components, the focus thus was to investigate and
synthesise on a high level each of these elements. It is important to identify the
exact view/aspect the readiness model is presenting each of these readiness
elements. After the completion of this chapter, the readiness model had the core
dimension, elements and variables indexed and ready for validation and
evaluation.
Chapter 6:
Constructing
the readiness
model
This chapter focused on identifying the operations of the readiness model. This
encompasses the pre-requisites and process steps of operating the model. This
section also developed the validation process for this study, incorporating the
insights from SMEs, as well as business experts. The first validation steps were
completed through the interviews with and surveys administered to SMEs. The
validation results were very positive, with regards to the readiness dimensions,
elements and variables. The results showed that these individuals do not use any
structured frameworks or models that specifically target business readiness for
artificial intelligence. This further validated the requirement for a model, such as
the one developed. The next stage was the development of weighting calculation
Stellenbosch University https://scholar.sun.ac.za

207 | P a g e
methods. There were two method identified, namely the Likert scale method and
the AHP weighting method. The initial aim was to use the Likert scale to determine
the readiness dimension weightings for strategy, operations, tactical and overall
(integration of the previous three). The AHP method was used to determine the
weightings of the readiness elements. The data from two SMEs was collected and
calculated using the AHP method. Large inconsistencies within the SMEs results
were found. The literature identified some weaknesses with regards to this method,
which affected these results. Due to constraints on cooperation and time, the Likert
scale method was used to determine the readiness element weightings. From these
calculation methods, the weighting index was developed. The final section was
focused on developing the calculations and analysis methods, which would be used
to analyse the data, as well as satisfy the objectives set out for this study. The two
outputs from the readiness model are the business readiness evaluation and the
IPA graphical categorization and prioritization of the readiness dimensions and
elements. The readiness evaluation provides the evaluations across all the
dimensions as well as elements. The IPA provides an interesting perspective, as
the IPA has four different focus points with which the business can approach the
categorization and prioritization of dimensions and elements. These focus points
are overall, strategic, operational and tactical.
Chapter 7: Case
study
The first focus of this chapter was to identify what requirements are necessary for
a case study for it to be viable within the context of this study. The appropriate
case study was identified and all organisational permission requirements met. A
brief background was given on the business as well as their current situation with
regards to AI. Interviews and surveys were conducted with chosen individuals at
different levels and sections within the business to determine the business
readiness for artificial intelligence. The IPA section was divided into four outputs:
overall IPA, strategic IPA, operational IPA and tactical IPA. All these outputs
provide the business with different perspectives on the categorization and
prioritization of readiness elements. The overall IPA was used in combination with
the readiness evaluation results to provide insights and interpretations on the
current situation of the business. The business dimension readiness results are:
Employee and culture = 3.87, Technology management = 4.02, Organisational
governance and leadership = 5.84, Strategy = 4.57, Infrastructure = 4.4,
Knowledge and information management = 4.04 and security = 5. In collaboration
with the IPA, these results identified that the governance and leadership is the best
performing dimension when taking into account both the readiness level and its
Stellenbosch University https://scholar.sun.ac.za

208 | P a g e
importance. The dimension that requires the most attention in the short term is the
knowledge and information management dimension. This has one of lowest
readiness results and has an extremely high importance. The technology
management dimension has a low readiness results, but was categorized as a lower
priority, it can thus become a medium to long term focus of the business.
8.2 Achieving research objectives
The main objective of this study was to develop a readiness model for businesses to assess their
readiness for artificial intelligence. This was combined with the ability to categorize and prioritize these
components so as to tailor business readiness. As seen in Chapter 1, section 1.3, the objectives of this
study are:
i. Developing and identify literature and understanding of AI readiness in business
ii. Develop systematized literature review.
iii. Developing a readiness model
iv. Validate the readiness model
v. Attain applicable, real-world case study.
vi. Apply validated readiness model to viable and applicable cases study
The table below describes the objectives, evaluations and references with regards to the completion of
these objectives.
Table 63. Evaluation of study on achieving objectives
Objective
number
Chapter
reference Evaluations
i Chapter: 1, 3, 4 The research that substantiated the background analysis and initial
literature review provided insights into different types of AI being
developed, researched and used today. Practical examples of AI
being used by corporations, the origin of AI, insights into the
future growth and adoption of AI, as well as the challenges
associated with it were discussed.
The literature review chapters provided the foundation of
requirements for developing a readiness model aimed at AI
implementation. This literature was used to develop, refine and
finalize the core of the readiness model. This understanding
encompasses:
Stellenbosch University https://scholar.sun.ac.za

209 | P a g e
• Uses of AI
• Application of AI in the real world
• Types of AI methods
• Requirements with regards to smaller elements, as well as
dimensions
• Future growth of AI
• Identify a possible gap in literature
• Origin of AI
• Challenges associated with AI
• Similar digitalized technology fundamentals
ii Chapter 4 The systematized literature review was developed through
derivation of a systematic literature review, which formed the key
processes:
• Determine key research questions and key words
• Determine data sources and search terms
• Determine application of selection criterion
• Develop study quality assessment procedures
• Develop the data extraction strategy
• Develop analysis strategy
The development of the systematized literature review was
important to build the foundation of the readiness model. The
objective was met through the development and application of
two systematized literature reviews. These literature reviews
identified:
• Different business dimensions that influence readiness
• Different perspectives regarding AI
• Requirements with regards to smaller elements
iii Chapter 5, 6 After the readiness dimension, elements and variables had been
identified through literature reviews, Chapter 5 further developed
the foundational dimensions and elements, as well as deriving
variables from the elements. Chapter 6 focused on developing the
operations process of the readiness model through the
identification of pre-requisite process steps, as well as the
Stellenbosch University https://scholar.sun.ac.za

210 | P a g e
operational steps. The readiness model components developed in
chapter 5, were validated and weighting calculations methods
were developed. To complete the pre-requisite process steps for
the model, SMEs were interviewed and surveys were
administered to develop the weightings for the model. After the
completion of chapter 6, the model was developed and ready to
be applied to a real-world case study.
iv Chapter 6.1,
6.2.3, 7.2
The validation process was first developed to provide some
guidelines towards validating this study. The first validation with
regards to the components was done in chapter 6.2.2, when semi-
structured interviews and surveys were administered to SMEs.
Overall the SMEs identified that all the readiness elements that
were incorporated in the readiness model were seen as relevant to
the study. The goal of the study was validated by identifying that
although there were no concrete readiness models or frameworks
used by the SMEs to determine business readiness for AI, there
was a need. After the business individuals were interviewed and
had completed the surveys, they confirmed that the developed
model and its outputs are valuable towards its intended aim.
v Chapter 7.1 To achieve this objective the following requirements were set in
place to ensure that the case study was a real-world applicable
case study. These requirements were:
• The business is in the starting phase of AI implementation,
research and design for the business.
• Individuals in the business have basic, as well as more
detailed knowledge with regards to AI from a technical,
business and management perspective.
• Individuals with the required knowledge are present in
different levels and divisions within the business.
• The organization and individuals have agreed to partake in
the study and the required documentation has been
completed.
These factors were taken into account, as well as the fact that the
business needed to be a functioning and listed company.
Stellenbosch University https://scholar.sun.ac.za

211 | P a g e
vi Chapter 7 Case study requirements as seen above were met and all the
required processes were completed to start the evaluation. This is
followed by the semi-structured interviews and administered
surveys to attain the business’ performance on various variables.
This is used to calculate the readiness of the business as well as,
to conduct the various types of IPA. This provided the business
with the ability to determine their readiness for AI, as well as
different perspectives with regards to the categorization and
prioritization of their readiness dimensions and elements.
8.3 Contributions and implications of this research
This section focuses on elaborating the contributions and implications this research by completing the
following questions:
i. How does this study contribute to the body of knowledge?
This research addresses a identified gap in the literature with regards to business readiness and maturity
for AI through the use of models/frameworks. It combines literature studies to focus on AI
implementation in business, through narrative and systematized literature reviews. It provided
foundational aspects and features to develop the readiness model. The research study provides literature
identification, study analysis, concept deconstruction, concept categorization and concept synthesis to
define the foundational dimensions and elements to develop the readiness model for AI evaluations.
The research presents multiple validation process steps through surveys and semi-structured interviews
aimed at model component validation and research aim validation. This indicates the viability,
applicability, usefulness and need for a enterprise technology readiness model aimed at artificial
intelligence.
ii. For whom is the framework designed and who can utilise the tool?
The readiness model was originally intended for use by all sizes of business. However, as the model
developed, the readiness model dimension, elements and variables became more applicable to large
companies and corporations. The model is specifically designed for corporations that are at the start of
their AI journey or project to assist them in the complex challenge of implementing AI into existing
business structures. The model outputs provide businesses with the ability to measure their readiness
for AI, as well as providing a range of focus points regarding the prioritization and categorization of
the readiness elements and dimensions. All these will assist a business in future resource and strategic
planning.
Stellenbosch University https://scholar.sun.ac.za

212 | P a g e
iii. What are the short- and long-term implications of this research?
The short-term implications of this research should impact individuals, managers, stakeholders and
corporations considering AI implementation. The outputs of this model provide knowledge, opportunity
and strategic guidance through better understanding of the technology, identification of opportunities,
prioritization of elements and newly generated perspectives. The research could possibly generate more
attention to the area of AI to further improve and continuously adapt to this changing technology. The
development, change and evolution of AI is extremely rapid, thus the applicability of this model is
unlikely to remain without alteration in the future as trends change. The focus on business readiness for
new types AI, however, could be continuously researched and developed to provide businesses with
on-going academic support.
8.4 Critical reflection
The developed readiness model was first aimed towards assessing business maturity for AI
implementation. Due to lack of foundational academic literature required to construct the model, the
focus shifted towards readiness. One of the focuses of the semi-structured interviews and surveys were
to obtain the ‘performance’ of the business with regards to readiness for AI implementation. It is
important to note that this performance is based on informed individuals perceived satisfaction. Thus,
some variability is expected in the data. It must also be noted that some readiness dimensions have
fewer elements than others, which influences the weight distribution of those elements. The Overall
IPA graph was initially skewed, because the security dimension had one element and the security
dimension was weighted high. Thus, caused it to be an extreme outlier. One explanation is that the
incorporation of dimensional weighting accounts for this when the overall readiness evaluations are
calculated.
An interesting finding was that, within the employee and culture dimension, the job security element
was ranked very low in terms of importance in comparison to the other elements. When dealing with a
technology that could potentially replace certain jobs at a company, it is likely that employees would
see the technology more as a threat than an asset, thus reducing the overall collaboration and possibly
causing delays in the project completion. With these insights, this element could have been expected to
have had a relatively high weighting.
8.5 Study limitations
The researcher has reflected critically on the literature review material, processes, development
processes, evaluation and validation processes, the completed model and the semi structured interviews
and surveys. These are the identified limitations with regards to this study:
Stellenbosch University https://scholar.sun.ac.za

213 | P a g e
i. One academic database was used to conduct systematized literature review, however it is a
large academic literature data base and during the study the literature was combined from other
databases.
ii. The screenings and application of quality assessments were done by one researcher, with the
guidance of the systematized literature review protocol.
iii. Seven SMEs were used to develop the weightings of the model, but the SMEs incorporated a
range of different experience, education and focus to enrich this study. For the purposes of
developing a model it was sufficient, but future development of the model should incorporate
more SMEs.
iv. Due to time and cooperation limitations the AHP method was discarded for determining
readiness element weightings and replaced by the Likert scale method. Future use or
development of this model should incorporate the AHP method for weighting development
v. The readiness model was developed to be generic and usable for all sizes of business, but
through development and iterations, it is more aimed towards large businesses and corporations.
vi. The model is comprised of many different readiness elements, which have only been
investigated on a high level, thus future research will require more in-depth analysis of each
element and variable
vii. The long-term unaltered applicability of this model is unfavourable, thus continuous research
and development will be required.
viii. The management tool did not incorporate a continuous improvement process (iterations) with
regards to inputs from multiple case studies. The readiness model is only applied to one large,
viable and applicable insurance corporation.
ix. Some readiness dimensions have fewer elements than others, which influences the weight
distribution of those elements.
8.6 Recommendations and future work
Appraisal of the model developed and applied in chapters 6 and 7, and considering the limitations
mentioned in section 8.5, provides a guideline for recommendations and future work for the model. The
first recommendation focuses around the development of the readiness element weightings. The AHP
weighting method should be used to derive more accurate data from the SMEs. More systematized
literature reviews should be conducted on different databases and use more researchers to conduct
screening and data extraction. Further in-depth research on each readiness element and variable needed,
as well as continuously update the dimensions and elements with most relevant aspects. More SMEs
should be consulted to develop the weightings of the model and apply the model to a range of case
studies, with a continuous improvement approach after every case study completion.
Stellenbosch University https://scholar.sun.ac.za

214 | P a g e
The future work related to this model focuses on developing more detailed readiness dimensions and
elements that are AI specific. Thus, the model can easily alter depending on the type of AI the business
is looking to implement. The next adjustment to future models would be to identify quantitative data
gathering methods for every readiness element. In this way, the business ‘performance’ with regards to
readiness can be quantitatively supported and this would provide a more accurate image of the readiness
of the business for AI. Because the model largely comprises generic technological readiness elements,
with the appropriate research the model could be altered to develop a readiness model aligned to a range
of new digital technologies.
Stellenbosch University https://scholar.sun.ac.za

215 | P a g e
References
Abalo, J., Varela, J. and Rial, A. (2006) ‘El Ana´lisis de Importancia-Valoracio´n aplicado a la gestio´n
de servicios, Psicothema’.
Ahmed, F., Qin, Y. and Aduamoah, M. (2018) ‘Employee readiness for acceptance of decision support
systems as a new technology in E-business environments; A proposed research agenda’, 2018 7th
International Conference on Industrial Technology and Management, ICITM 2018, 2018-
Janua(March), pp. 209–212. doi: 10.1109/ICITM.2018.8333948.
Alavi, M. and Leidner, D. E. (2001) ‘Review: Knowledge management and knowledge management
systems: Conceptual foundations and research issues’, MIS Quarterly: Management Information
Systems. doi: 10.2307/3250961.
Alemeye, F. and Getahun, F. (2015) ‘Cloud readiness assessment framework and recommendation
system’, IEEE AFRICON Conference, 2015-Novem. doi: 10.1109/AFRCON.2015.7331995.
Aliaga, M. and Gunderson, B. (2000) ‘Interactive Statistics’. doi: doi: 10.2307/40074316.
Allan, G. (2003) ‘A critique of using grounded theory as a research method’, Electronic Journal of
Business Research Methods.
Ambler, S. (2010) ‘Scaling Agile: An Executive Guide’, IBM.
Aslam, H. D. et al. (2014) ‘Human Resource Planning Practice in Managing Human Resource: A
Literature Review’, International Journal of Human Resource Studies. doi: 10.5296/ijhrs.v3i1.6253.
Astalin, P. K. (2013) ‘Qualitative Research Designs: a Conceptual Framework’, International Journal
of Social Science & Interdisciplinary Research.
AWS (2019) Types of cloud computing, Amazon Web Services. Available at:
https://aws.amazon.com/types-of-cloud-computing/.
Balaji, S. and Murugaiyan, S. (2012) ‘WATEERFALLVs V-MODEL Vs AGILE : A COMPARATIVE
STUDY ON SDLC’, International Journal of Information Technology and Business Management.
Bamiah, M. A. and Brohi, S. N. (2011) ‘Exploring the Cloud Deployment and Service Delivery
Models’, International Journal of Research and Reviews in Information Sciences (IJRRIS).
Baumeister, R. F. and Leary, M. R. (1997) ‘Writing narrative literature reviews’, Review of General
Psychology. doi: 10.1037/1089-2680.1.3.311.
Belton, V. and Stewart, T. (2002) ‘Multiple criteria decision analysis: An integrated approach’,
Boston/Dordrecht/London: Kluwer Academic Publishers, p. pp 1-3.
Bhawna and Gobind (2015) ‘Research Methodology and Approaches’, IOSR Journal of Research &
Method in Education, 5(3). doi: 10.9790/7388-05344851.
Bolt, R. (2014) Business Opportunity Evaluation Design of a model for opportunity evaluation.
University of Twente School of Management and Governance.
Botchkarev, A. and Andru, P. (2011) ‘A return on investment as a metric for evaluating information
Stellenbosch University https://scholar.sun.ac.za

216 | P a g e
systems: Taxonomy and application’, Interdisciplinary Journal of Information, Knowledge, and
Management. doi: 10.28945/1535.
Bouthillier, F. and Shearer, K. (2002) ‘Understanding knowledge management and information
management: The need for an empirical perspective’, Information Research.
Breck, E. et al. (2018) ‘The ML test score: A rubric for ML production readiness and technical debt
reduction’, in Proceedings - 2017 IEEE International Conference on Big Data, Big Data 2017. doi:
10.1109/BigData.2017.8258038.
Brunette, E. S., Flemmer, R. C. and Flemmer, C. L. (2009) ‘A review of artificial intelligence’, in
ICARA 2009 - Proceedings of the 4th International Conference on Autonomous Robots and Agents. doi:
10.1109/ICARA.2000.4804025.
Bryman, A. et al. (2014) Research Methodology: Business and Management Contexts, Oxford
University Press. doi: 10.1016/S0048-7333(02)00072-0.
Brynjolfsson, E. and Mcafee, A. (2017) ‘The business of artificial intelligence’, Harvard Business
Review.
Brynjolfsson, E., Rock, D. and Syverson, C. (2017) Artificial Intelligence and the Modern Productivity
Paradox: A Clash of Expectations and Statistics, National Bureau of Economic Research. doi:
10.7208/chicago/9780226613475.003.0001.
Budgen, D. and Brereton, P. (2006) ‘Performing systematic literature reviews in software engineering’,
in Proceedings - International Conference on Software Engineering. doi: 10.1145/1134285.1134500.
Businessdictionary (2017) Decision making, BusinessDictionary.com. Available at:
http://www.businessdictionary.com/definition/decision-making.html (Accessed: 24 September 2017).
Cambridge (2019a) BUDGET | meaning in the Cambridge English Dictionary,
Dictionary.cambridge.org.
Cambridge (2019b) BUSINESS CASE | meaning in the Cambridge English Dictionary,
Dictionary.cambridge.org. Available at: https://dictionary.cambridge.org/dictionary/english/business-
case?q=business+cases.
Cambridge (2019c) INFRASTRUCTURE | meaning in the Cambridge English Dictionary,
Dictionary.cambridge.org. Available at:
https://dictionary.cambridge.org/dictionary/english/infrastructure.
Caralli, R., Knight, M. and Montgomery, A. (2012) ‘Maturity Models 101: A Primer for Applying
Maturity Models to Smart Grid Security, Resilience, and Interoperability’.
Celano, L. (2014) ‘6 Methods of data collection and analysis’’, Monitoring, Evaluation, Accountability
and Learning.
Chaffee, E. (1983) ‘Rational decisionmaking in higher education’, Boulder, Colo.: National Center for
Higher Education Management Systems.
Charmaz, K. (2006) ‘Constructing grounded theory: A practical guide through qualitative research’,
SagePublications Ltd, London.
Stellenbosch University https://scholar.sun.ac.za

217 | P a g e
Cheng, A. C., Chen, C. J. and Chen, C. Y. (2008) ‘A fuzzy multiple criteria comparison of technology
forecasting methods for predicting the new materials development’, Technological Forecasting and
Social Change. doi: 10.1016/j.techfore.2006.08.002.
Chichernea, V. (no date) ‘THE EXECUTIVE SUPPORT SYSTEMS AS INNOVATIVE TOOLS FOR
THE EVALUATION OF FINANCIAL PROJECTS’.
Corbin, J. and Strauss, A. (1990) Grounded Theory Research: Procedures, Canon and Evaluative
Criteria. Qualitativ. doi: 10.1007/BF00988593.
Corchado, J. (1998) ‘Models for integrating artificial intelligence approaches’, in DOCTORAL
CONSORTIUM ON KNOWLEDGE DISCOVERY AND DATA MINING. Paisley.
Creswell, J. W. (2009) Research Design: Qualitative, Quantitative and Mixed Approaches (3rd
Edition), Research Design: Qualitative, Quantitative, and Mixed Methods Approaches. doi:
10.2307/1523157.
Cronin, P., Ryan, F. and Coughlan, M. (2008) ‘Undertaking a literature review: a step-by-step
approach.’, British journal of nursing (Mark Allen Publishing). doi: 10.12968/bjon.2008.17.1.28059.
Crozier, G., Denzin, N. and Lincoln, Y. (1994) ‘Handbook of Qualitative Research’, British Journal of
Educational Studies. doi: 10.2307/3121684.
D’Aveni, R. a. (2007) ‘Mapping Competitive Position’, Harvard Business Review.
Dalkir, K. (2013) ‘No TitleKnowledge Management in Theory and Practice’.
Datt, S. (2016) ‘Defining research strategy in a research paper on business studies’.
Davenport, T., Loucks, J. and and Schatsky, D. (2018) Cognitive technology survey: Early adoption
insight | Deloitte US. Available at: https://www2.deloitte.com/us/en/pages/deloitte-
analytics/articles/cognitive-technology-adoption-survey.html (Accessed: 9 May 2018).
Davies, B. and Davies, B. (2004) Strategic Leadership. School Leadership & Management.
Decisions, T. (2017) Techniques and Tools to Help You Make Business Decisions, Business News Daily.
Available at: http://www.businessnewsdaily.com/6162- decision-making.html (Accessed: 12
September 2017).
Deng, H., Molla, A. and Corbitt, B. (2009) ‘A fuzzy logic based green information technology readiness
model’, in 2009 International Conference on Artificial Intelligence and Computational Intelligence,
AICI 2009. doi: 10.1109/AICI.2009.247.
Denzin, N. K. (1994) Handbook of qualitative research. Handbook o.
Diriwächter, R. and Valsiner, J. (2006) ‘Qualitative developmental research methods in their historical
and epistemological contexts’, Forum Qualitative Sozialforschung. doi: 10.17169/fqs-7.1.72.
Ellis, M. E. et al. (2016) ‘Categorization of technologies: insights from the technology acceptance
literature’, Journal of Applied Business and Economics.
Energy, U. S. D. of (2012) ‘Maturity Models 101: A Primer for Applying Maturity Models to Smart
Grid Security, Resilience, and Interoperability’, United States Department of Energy under Contract
with Carnegie Mellon University.
Stellenbosch University https://scholar.sun.ac.za

218 | P a g e
Etsebeth, E. (no date) Trialability, perceived risk and complexity of understanding as determinants of
cloud computing services adoption. University of Pretoria.
Evans, J. R. and Lindsay, W. M. (2017) Managing for Quality and Performance Excellence,
International Handbook of Production and Operations Management.
Faktion (2019) AI Maturity and Readiness Assessment, Faktion.com. Available at:
https://www.faktion.com/service/ai-maturity-and-readiness-assessment/ (Accessed: 9 December
2018).
Firat, A. K., Woon, W. L. and Madnick, S. (2008) ‘Technological Forecasting – A Review’, Working
Paper CISL. doi: 10.1007/s12103-013-9223-5.
Gartner. (2018) Gartner Identifies Five Emerging Technology Trends That Will Blur the Lines Between
Human and Machine. Available at: https://www.gartner.com/en/newsroom/press-releases/2018-08-20-
gartner-identifies-five-emerging-technology-trends-that-will-blur-the-lines-between-human-and-
machine (Accessed: 1 October 2019).
Gartner (no date) Hype Cycle Research Methodology. Available at:
https://www.gartner.com/en/research/methodologies/gartner-hype-cycle (Accessed: 1 October 2019).
Garvey, P. R. and Lansdowne, Z. F. (1998) ‘Risk Matrix: An Approach for Identifying, Assessing, and
Ranking Program Risks’, Air Force journal of logistics.
Geers, K. (2011) ‘Strategic cyber security’, Estonia: NATO Cooperative Cyber Defence Cenre of
Excellence.
Given, L. (2012) The SAGE Encyclopedia of Qualitative Research Methods, The SAGE Encyclopedia
of Qualitative Research Methods. doi: 10.4135/9781412963909.
Glaser, B. (2013) ‘Grounded theory methodology’, Introducing Qualitative Research in Psychology.
doi: 10.1191/1478088706qp063oa.
Glaser, B. G. and Strauss, A. L. (1967) ‘The Discovery of Grounded Strategies for Qualitative
Research’, Aldine.
Goasduff, L. (2019) 3 Barriers to AI Adoption. Available at:
https://www.gartner.com/smarterwithgartner/3-barriers-to-ai-adoption/.
De Graaf, G., Postmus, D. and Buskens, E. (2015) ‘Using Multicriteria Decision Analysis to Support
Research Priority Setting in Biomedical Translational Research Projects’, BioMed Research
International. doi: 10.1155/2015/191809.
Handfield, R. et al. (2002) ‘Applying environmental criteria to supplier assessment: A study in the
application of the Analytical Hierarchy Process’, European Journal of Operational Research. doi:
10.1016/S0377-2217(01)00261-2.
Heberle, A. et al. (2017) ‘Digitalization Canvas – Towards identifying digitalization use cases and
projects’, Journal of Universal Computer Science.
Hongoh, V. et al. (2011) ‘Spatially explicit multi-criteria decision analysis for managing vector-borne
diseases’, International Journal of Health Geographics. doi: 10.1186/1476-072X-10-70.
Stellenbosch University https://scholar.sun.ac.za

219 | P a g e
Hwang, K. and Li, D. (2010) ‘Trusted cloud computing with secure resources and data coloring’, IEEE
Internet Computing. doi: 10.1109/MIC.2010.86.
Intel (no date a) The AI readiness model. Available at:
https://www.intel.com/content/dam/www/public/us/en/documents/white-papers/ai-readiness-model-
whitepaper.pdf (Accessed: 29 October 2018).
Intel (no date b) ‘The AI Readiness Model’, White Paper Data Center. Available at:
https://www.intel.com/content/dam/www/public/us/en/documents/white-papers/ai-readiness-model-
whitepaper.pdf.
It, D. (2017) Decision Matrix: What It Is and How to Use It, Business News Daily. Available at:
http://www.businessnewsdaily.com/6146-decision-matrix.html (Accessed: 12 September 2017).
Jabareen, Y. (2009) ‘Building a Conceptual Framework: Philosophy, Definitions, and Procedure’,
International Journal of Qualitative Methods. doi: 10.1177/160940690900800406.
Javanbarg, M. B. et al. (2012) ‘Fuzzy AHP-based multicriteria decision making systems using particle
swarm optimization’, Expert Systems with Applications. doi: 10.1016/j.eswa.2011.07.095.
Joshi, A. et al. (2015) ‘Likert Scale: Explored and Explained.’, British Journal of Applied Science &
Technology.
Keele, S. (2007) ‘Guidelines for performing systematic literature reviews in software engineering’, in
Technical report, Ver. 2.3 EBSE Technical Report. EBSE.
Kendall, K. and Kendall, J. (no date) Systems analysis and design. 9th edn.
Kirby, M. R. (2001) A Methodology for Technology Identification, Evaluation, and Selection in
Conceptual and Preliminary Aircraft Design, School of Aerospace Engineering.
Kujawski, E. (2003) ‘4.7.3 Multi-Criteria Decision Analysis: Limitations, Pitfalls, and Practical
Difficulties’, INCOSE International Symposium. doi: 10.1002/j.2334-5837.2003.tb02692.x.
Kulkarni, R. H. and Padmanabham, P. (2017) ‘Integration of artificial intelligence activities in software
development processes and measuring effectiveness of integration’, IET Software. doi: 10.1049/iet-
sen.2016.0095.
Kulmala, H. I., Paranko, J. and Uusi-Rauva, E. (2002) ‘The role of cost management in network
relationships’, International Journal of Production Economics. doi: 10.1016/S0925-5273(00)00061-X.
Kumta, G. A. and Shah, M. D. (2002) ‘Capability maturity model - a human perspective’, Delhi
Business Review.
Kurze, C. and Gluchowski, P. (2010) ‘Computer-aided warehouse engineering (CAWE): Leveraging
MDA and ADM for the development of data warehouses’, 16th Americas Conference on Information
Systems 2010, AMCIS 2010, 4, p. 2736.
Kuzlu, M., Pipattanasomporn, M. and Rahman, S. (2014) ‘Communication network requirements for
major smart grid applications in HAN, NAN and WAN’, Computer Networks. doi:
10.1016/j.comnet.2014.03.029.
Lamberton, C., Brigo, D. and Hoy, D. (2017) ‘Impact of Robotics, RPA and AI on the insurance
Stellenbosch University https://scholar.sun.ac.za

220 | P a g e
industry: challenges and opportunities’, The Journal of Financial Perspectives .
Laudon, K. C. and Laudon, J. P. (1968) Management Information Systems Managing the Digital Firm,
Management Decision. doi: 10.1108/eb000831.
Levin, D. Z. and Barnard, H. (2008) ‘Technology management routines that matter to technology
managers’, International Journal of Technology Management. doi: 10.1504/IJTM.2008.015982.
Lui, K. and Karmiol, J. (2018) AI Infrastructure Reference Architecture. Available at:
https://www.ibm.com/downloads/cas/W1JQBNJV.
Macal, C. and North, M. (2015) ‘Introductory tutorial: Agent-based modeling and simulation’, in
Proceedings - Winter Simulation Conference. doi: 10.1109/WSC.2014.7019874.
Martilla, J. A. and James, J. C. (1977) ‘Importance-Performance Analysis’, Journal of Marketing. doi:
10.2307/1250495.
Mehdiyev, N. et al. (2015) ‘Determination of Rule Patterns in Complex Event Processing Using
Machine Learning Techniques’, Procedia Computer Science. Elsevier Masson SAS, 61, pp. 395–401.
doi: 10.1016/j.procs.2015.09.168.
Mohamad Hsbollah, H. and Kamil (2009) ‘E‐learning adoption: the role of relative advantages,
trialability and academic specialisation’, Campus-Wide Information Systems.
Musango, J. K. and Brent, A. C. (2011) ‘A conceptual framework for energy technology sustainability
assessment’, Energy for Sustainable Development. doi: 10.1016/j.esd.2010.10.005.
Nemoto, T. and Beglar, D. (2014) ‘Developing Likert-Scale Questionnaires’, JALT2013 Conference
Proceedings.
Noor, T. H. et al. (2014) ‘Analysis of web-scale cloud services’, IEEE Internet Computing. doi:
10.1109/MIC.2014.64.
Oh, H. (2001) ‘Revisiting importance–performance analysis’, Tourism Management. doi:
10.1016/s0261-5177(01)00036-x.
Okoli, C. and Schabram, K. (2012) ‘A Guide to Conducting a Systematic Literature Review of
Information Systems Research’, SSRN Electronic Journal. doi: 10.2139/ssrn.1954824.
Oztemel, E. and Polat, T. K. (2006) ‘Technology Readiness Model for Enterprises’, Intelligent
Production Machines and Systems - 2nd I*PROMS Virtual International Conference 3-14 July 2006,
(May), pp. 362–367. doi: 10.1016/B978-008045157-2/50066-3.
Prieto, A. et al. (2016) ‘Neural networks: An overview of early research, current frameworks and new
challenges’, Neurocomputing. Elsevier, 214, pp. 242–268. doi: 10.1016/j.neucom.2016.06.014.
Proença, D. and Borbinha, J. (2016) ‘Maturity Models for Information Systems - A State of the Art’, in
Procedia Computer Science. doi: 10.1016/j.procs.2016.09.279.
Punch, K. F. (1998) Introduction to Social Research : Quantitative and Qualitative Approaches, The
Statistician. doi: 10.2307/2348599.
Rao, A. and Verweij, G. (2017) Sizing the prize What’s the real value of AI for your business and how
can you capitalise? Available at: https://www.pwc.com/gx/en/issues/analytics/assets/pwc-ai-analysis-
Stellenbosch University https://scholar.sun.ac.za
221 | P a g e
sizing-the-prize-report.pdf (Accessed: 9 May 2018).
Rial, A. et al. (2008) ‘An application of importance-performance analysis (IPA) to the management of
sport centres’, Managing Leisure. doi: 10.1080/13606710802200878.
Rosemann, M. and De Bruin, T. (2005) ‘Towards a business process mangement maturity model’, in
Proceedings of the 13th European Conference on Information Systems, Information Systems in a
Rapidly Changing Economy, ECIS 2005.
Rotty, K. (1996) A framework for the implementation of artificial intelligence in computer integrated
manufacturing. M.Sc. University of Johannesburg.
Saarikoski, H. et al. (2015) ‘Multi-criteria decision analysis (MCDA) in ecosystem service valuation’,
OpenNESS Ecosystem Service Reference Book.
Saaty, T. L. (1980) The Analytic Hierarchy Process, Decision Analysis. doi: 10.3414/ME10-01-0028.
Saaty, T. L. (2008) ‘Decision making with the analytic hierarchy process’, Int. J. Services Sciences.
Saunders, M. L., Lewis, P. and Thornhill, A. (2016) Research Methods for Business Students. Pearson
Education Limited.
Schumacher, A., Erol, S. and Sihn, W. (2016) ‘A Maturity Model for Assessing Industry 4.0 Readiness
and Maturity of Manufacturing Enterprises’, in Procedia CIRP. doi: 10.1016/j.procir.2016.07.040.
Scopus (2018) Scopus | The largest database of peer-reviewed literature | Elsevier. Available at:
https://www.elsevier.com/solutions/scopus (Accessed: 3 June 2018).
Sharma, V. S., Kaulgud, V. and Duraisamy, P. (2016) ‘A Gamification approach for Distributed Agile
Delivery’, in Proceedings - International Conference on Software Engineering. doi:
10.1145/2896958.2896966.
Shehab, E. M. et al. (2004) ‘Enterprise resource planning: An integrative review’, Business Process
Management Journal. doi: 10.1108/14637150410548056.
Singapore, M. A. of (2013) ‘TECHNOLOGY RISK MANAGEMENT GUIDELINES’, Monetary
Authority of Singapore.
Skilton, M. (2017) THE IMPACT OF ARTIFICIAL INTELLIGENCE ON BUSINESS. Available at:
https://warwick.ac.uk/fac/soc/impact/policybriefings/impact_of_ai_on_business_policybrief_final.pdf
(Accessed: 2 May 2018).
Sohel, S. M., Rahman, A. M. A. and Uddin, M. A. (2014) ‘Competitive profile matrix (CPM) as a
competitors’ analysis tool: A theoretical perspective’, International Journal of Human Potential
Development.
Solar, M., Meijueiro, L. and Daniels, F. (2017) ‘A Guide to Implement Open Data in Public Agencies
To cite this version : HAL Id : hal-01490938’.
Srivastava, V., Sharfuddin, A. and Datta, S. (2012) ‘Managing quality in outsourcing of high-end
services: A conceptual model’, Total Quality Management and Business Excellence, 23(11–12), pp.
1315–1327. doi: 10.1080/14783363.2012.733267.
Stoica, I. et al. (2017) ‘A Berkeley View of Systems Challenges for AI’.
Stellenbosch University https://scholar.sun.ac.za

222 | P a g e
Strauss, A. and Corbin, J. (1994) ‘Grounded theory methodology, an overview’, in Handbook of
qualitative research.
Sun, T. Q. and Medaglia, R. (2019) ‘Mapping the challenges of Artificial Intelligence in the public
sector: Evidence from public healthcare’, Government Information Quarterly. doi:
10.1016/j.giq.2018.09.008.
Sun, Y. and Han, J. (2013) ‘Mining heterogeneous information networks’, ACM SIGKDD Explorations
Newsletter. doi: 10.1145/2481244.2481248.
Svensson, D. and Malmqvist, J. (2001) ‘Integration of Requirements Management and Product Data
Management Systems’.
Tisdale, S. M. (2015) ‘Cybersecurity: Challenges from a systems, complexity, knowledge management
and business intelligence perspective’, Issues in Information Systems.
Tools, D. (2017) Decision-Making Techniques and Tools, Business News Daily. Available at:
http://www.businessnewsdaily.com/6162-decision-making.html (Accessed: 9 June 2017).
Trochim, W. M. K. (2006) ‘The Research Methods Knowledge Base, 2nd Edition’, Atomic Dog
Publishing, Cincinnati, OH. doi: 10.2471/BLT.05.029181.
USC (2017) Research Guides: Organizing Your Social Sciences Research Paper: 6. The Methodology,
Libguides.usc.edu. Available at: http://libguides.usc.edu/writingguide/methodology (Accessed: 15
October 2017).
Uzonwanne, F. C. (2016) ‘Rational Model of Decision Making’, in Global Encyclopedia of Public
Administration, Public Policy, and Governance. doi: 10.1007/978-3-319-31816-5_2474-1.
Velasquez, M. and Hester, P. (2013) ‘An analysis of multi-criteria decision making methods’,
International Journal of Operations Research.
Von Wangenheim, C. G. V. et al. (2010) ‘Systematic literature review of software process
capability/maturity models’, in 10th International SPICE Conference on Software Process
Improvement and Capability Determination, SPICE 2010.
Xu, H. (2009) ‘A development process of KMS based on systems engineering methodology’,
Proceedings - 2009 International Conference on Computational Intelligence and Software
Engineering, CiSE 2009, pp. 0–3. doi: 10.1109/CISE.2009.5363301.
Yuxun, L. (2010) Review of Decision Trees. Zhengzhou: Henan University of Technology. Available
at: http://www.meeting.edu.cn/meeting/UploadPapers/1281600436359.pdf.
Zhao, X., Hwang, B. G. and Low, S. P. (2016) ‘An enterprise risk management knowledge-based
decision support system for construction firms’, Engineering, Construction and Architectural
Management, 23(3), pp. 369–384. doi: 10.1108/ECAM-03-2015-0042.
Zhou, W. and Li, Y. (2012) ‘Research on quality measuring of CMMI cyclic implementation in software
process’, Journal of Software, 7(8), pp. 1911–1918. doi: 10.4304/jsw.7.8.1911-1918.
Zikmund, W. G. (2003) Business Research Methods. 7th edn.
Stellenbosch University https://scholar.sun.ac.za

223 | P a g e
Appendix A
Readiness dimension (d) Readiness elements (i) i
Employee and culture
Job Security 1
Perceived usefulness 2
Perceived ease of use 3
Compatibility with existing values and practices 4
Benefits 5
Business Acceptance 6
Skills and expertise 7
Collaboration 8
Certainty 9
Technology Management
Technological categorization and planning 10
Technology requirement handling 11
Technological investment and capital management 12
Cost management 13
Technological competitors analysis 14
Cloud resources 15
Network Connectivity 16
Technology Risk Management 17
Quality Management 18
Human resource planning 19
Organizational governance and leadership
Executive support 20
Budget 21
Business opportunity 22
Strategic leadership 23
Business cases 24
Strategy
Trial-ability 25
Business clarity 26
Observable results 27
Technology roadmaps and scenarios 28
Technology prospect/forecasting 29
Agile delivery 30
Infrastructure
Technologic sustainability and position map 31
Communication networks 32
Information networks 33
Stellenbosch University https://scholar.sun.ac.za

224 | P a g e
Services 34
Infrastructure platform 35
Knowledge and information management
Management information system and data processing 36
Agent based applications 37
Return on investment 38
Enterprise resource planning in terms of databases and
software 39
Technology knowledge management 40
Technology identification and selection 41
Security Cyber security 42
Stellenbosch University https://scholar.sun.ac.za

225 | P a g e
Appendix B
Conceptual framework Analysis
Phase 1: Mapping data sources
Phase 2: Extensive reading and
categorization of data
Phase 3: Identification and naming
of concepts
Phase 4: Deconstruction and
categorization of concepts
Phase 5: Integrating concepts
Phase 6: Synthesis and resynthesize
Phase 7: Validation of conceptual
framework
Phase 8: Rethinking of conceptual
framework
• Chapter 1 & 3: Identifying databases to conduct
literature reviews.
• Chapter 3 & 4: Conducting narrative and
systematic literature reviews.
• Chapter 7: The readiness model is subjected to
real, applicable case studies, whereby it will be
evaluated and validated.
• Chapter 8: The conclusion of this project
includes insights and thoughts on future
developments and improvements of the model.
• Chapter 5: The readiness model is developed
through the integration of the concepts and
models found from the literature reviews.
• Chapter 5 & 6: The AI readiness model is
developed and synthesized through the project,
as well as resynthesized with the use of subject
matter experts.
• Chapter 3 & 4: Important concepts and
dimension related to AI is identified.
• Chapter 5: The concepts and dimensions are
further disseminated and categorized.
Stellenbosch University https://scholar.sun.ac.za

226 | P a g e
Appendix C
Stellenbosch University https://scholar.sun.ac.za

227 | P a g e
Stellenbosch University https://scholar.sun.ac.za

228 | P a g e
Appendix D
Table . Percentage absolute difference from the mean
n Variable description
Respondent
1 difference
Respondent
2 difference
Respondent
3 difference
Respondent
4 difference
Respondent
5 difference
Respondent
6 difference
Respondent
7 difference
Respondent
8 difference
Respondent 9
difference
1
Employees' perception on job
security with regards to AI 40.00% 20.00% 30.00% 10.00% 10.00% 10.00% 10.00% 0.00% 10.00%
2 Employees' perception on the
usefulness of AI 28.89% 1.11% 8.89% 1.11% 1.11% 11.11% 21.11% 8.89% 11.11%
3 Employees' perception with
regards to ease of use of AI 26.67% 3.33% 33.33% 33.33% 6.67% 6.67% 26.67% 26.67% 23.33%
4 Compatibility of AI with
business values and practices 35.56% 24.44% 5.56% 5.56% 14.44% 5.56% 34.44% 4.44% 25.56%
5 Employees' perception on the
benefits regarding AI 8.89% 48.89% 21.11% 1.11% 11.11% 8.89% 1.11% 1.11% 31.11%
6 Perceived business
acceptance of AI 12.22% 2.22% 7.78% 17.78% 7.78% 22.22% 32.22% 2.22% 37.78%
7
Perceived current skills and
expertise capability to
implement and manage AI 24.44% 24.44% 5.56% 4.44% 4.44% 15.56% 5.56% 15.56% 15.56%
8
Willingness of employee
collaboration with regards to
AI 5.56% 15.56% 24.44% 4.44% 25.56% 5.56% 15.56% 14.44% 24.44%
9 Employees' perceived
trust/certainty in AI 7.78% 22.22% 17.78% 7.78% 7.78% 2.22% 22.22% 17.78% 12.22%
Stellenbosch University https://scholar.sun.ac.za

229 | P a g e
10 Technological categorization
and planning progress for AI 28.57% 11.43% 21.43% 1.43% 11.43% 1.43% 18.57%
11
Identification of technology
requirement management
structures 25.00% 5.00% 25.00% 25.00% 5.00% 5.00% 5.00% 25.00%
12 Allocation of Investment and
capital management for AI 13.33% 26.67% 3.33% 3.33% 33.33% 16.67% 23.33% 13.33% 46.67%
13
Identification of cost
management structures for
AI 38.89% 31.11% 11.11% 21.11% 28.89% 11.11% 18.89% 28.89% 41.11%
14 Technological competitors
analysis for AI 50.00% 10.00% 20.00% 20.00% 20.00% 0.00% 30.00% 40.00%
15
Identification and selection
of cloud computing models,
such as infrastructure as a
service, Platform as a service
or software as a service 0.00% 20.00% 10.00% 40.00% 10.00% 10.00% 0.00% 10.00%
16
Identification and
satisfaction of requirements
regarding Cloud computing
models 20.00% 30.00% 30.00% 30.00% 20.00% 10.00% 10.00% 10.00%
17
Identification and selection
of cloud computing
deployment models, such as 25.00% 25.00% 15.00% 35.00% 25.00% 25.00% 5.00% 5.00%
Stellenbosch University https://scholar.sun.ac.za

230 | P a g e
cloud, hybrid and on-
premises models
18
Identification and
satisfaction of requirements
regarding cloud computing
deployment models 15.00% 15.00% 25.00% 25.00% 35.00% 5.00% 5.00% 15.00%
19
Identification of required
network connectivity within
business for AI 8.75% 18.75% 21.25% 21.25% 1.25% 11.25% 8.75% 18.75%
20
Assign responsibilities and
roles for managing risks
involving AI 22.22% 17.78% 27.78% 7.78% 22.22% 2.22% 12.22% 2.22% 7.78%
21
Prioritization and
identification of information
system assets 7.78% 17.78% 42.22% 37.78% 17.78% 12.22% 2.22% 2.22% 22.22%
22 Implementation of practices
and controls to mitigate risks 38.89% 8.89% 31.11% 11.11% 1.11% 11.11% 11.11% 8.89% 8.89%
23
The identification and
assessment of the likehood,
as well as the impact of
current and emerging
threats, vulnerabilities and
risks 28.89% 1.11% 11.11% 8.89% 8.89% 31.11% 11.11% 8.89% 1.11%
Stellenbosch University https://scholar.sun.ac.za

231 | P a g e
24
Implementation of periodic
improvement/update and
monitoring of risk
assessment to include
changes in systems, as well
as operating/environmental
conditions that could affect
the risk analysis 40.00% 10.00% 0.00% 10.00% 10.00% 20.00% 0.00% 0.00% 10.00%
25
Identification and selection
of quality management
structures for AI 8.89% 18.89% 41.11% 1.11% 8.89% 21.11% 8.89% 8.89% 8.89%
26
Documentation of data
regarding the short to long
term goals of the AI project 25.56% 15.56% 34.44% 24.44% 25.56% 4.44% 4.44% 14.44% 15.56%
27
Effort regarding the
identification of the types of
resources, people and
competencies that will be
required 15.56% 24.44% 24.44% 24.44% 25.56% 14.44% 15.56% 5.56% 25.56%
28 Executive support regarding
AI 15.56% 25.56% 4.44% 5.56% 34.44% 14.44% 14.44% 4.44% 25.56%
29 Allocation of a budget for AI 14.44% 5.56% 5.56% 4.44% 34.44% 25.56% 34.44% 4.44% 55.56%
30 Identification of applicable
business opportunities for AI 21.11% 18.89% 1.11% 1.11% 11.11% 8.89% 11.11% 21.11% 38.89%
Stellenbosch University https://scholar.sun.ac.za

232 | P a g e
31
Identification of strategic
leadership, which comply
with the activities and
characteristics of a strategic
leader 40.00% 20.00% 10.00% 20.00% 40.00% 20.00% 20.00% 10.00% 40.00%
32 Identification of business
cases for AI 25.56% 5.56% 24.44% 5.56% 5.56% 4.44% 15.56% 15.56% 44.44%
33
Capability to conduct a
certain amount of testing
(test data) 20.00% 10.00% 40.00% 40.00% 40.00% 0.00% 20.00% 20.00% 50.00%
34 Perceived business clarity
with regards to AI 7.78% 17.78% 22.22% 17.78% 17.78% 22.22% 7.78% 2.22% 22.22%
35
Identification of methods
and criteria involved with
generating observable results
during
testing/implementation of AI 36.25% 23.75% 13.75% 26.25% 13.75% 16.25% 16.25% 43.75%
36
Identification of technology
roadmaps and scenarios
regarding AI 7.14% 7.14% 22.86% 17.14% 22.86% 2.86% 17.14%
37 Identification of technology
forecasting methods for AI 18.57% 21.43% 21.43% 18.57% 1.43% 11.43% 18.57%
38 Development of the agile
strategy with regards to AI 11.11% 18.89% 1.11% 1.11% 28.89% 11.11% 8.89% 18.89% 51.11%
Stellenbosch University https://scholar.sun.ac.za

233 | P a g e
39
Development of the
technology sustainability
and position map for AI 21.43% 38.57% 28.57% 21.43% 18.57% 8.57% 51.43%
40
Identification of
communication networks
involved with operation of
AI 21.43% 28.57% 38.57% 1.43% 8.57% 1.43% 51.43%
41
Identification of information
networks involved with
implementation, operation
and management of AI 24.29% 35.71% 35.71% 4.29% 5.71% 5.71% 54.29%
42
Identification and mapping
of services that will
incorporate AI 15.00% 15.00% 15.00% 35.00% 5.00% 5.00% 5.00% 55.00%
43
Identification of required
infrastructure in terms of
cloud resources, as well
required additional
infrastructure sections 11.43% 38.57% 28.57% 21.43% 8.57% 8.57% 51.43%
44
Initiation of the development
of management structures
for information systems and
data processing 14.44% 24.44% 25.56% 24.44% 14.44% 25.56% 4.44% 4.44% 35.56%
Stellenbosch University https://scholar.sun.ac.za

234 | P a g e
45
Conducting agent based
simulations or modelling to
indicate possible impacts of
AI on business processes 25.00% 35.00% 25.00% 15.00% 25.00% 15.00% 15.00% 35.00%
46 Calculations of the return on
investment for AI 3.33% 36.67% 13.33% 3.33% 6.67% 23.33% 26.67% 26.67% 53.33%
47
Initiation of enterprise
resource planning (databases
and software) for AI 23.75% 26.25% 13.75% 23.75% 36.25% 13.75% 3.75% 16.25%
48
Initiation of technology
knowledge management
strategies for AI 28.75% 11.25% 28.75% 18.75% 41.25% 1.25% 1.25% 21.25%
49
Analysis of technology
compatibility, system impact
of AI and the maturity of the
AI 30.00% 20.00% 20.00% 30.00% 20.00% 30.00% 10.00% 0.00% 20.00%
50
Identification and
development of management
of cyber security with
regards to Artificial
intelligence 10.00% 40.00% 10.00% 30.00% 20.00% 20.00% 10.00%
Average % difference of
evaluations across all
variables 21.43% 18.94% 18.53% 17.06% 20.93% 15.42% 13.29% 9.54% 27.67%
Stellenbosch University https://scholar.sun.ac.za
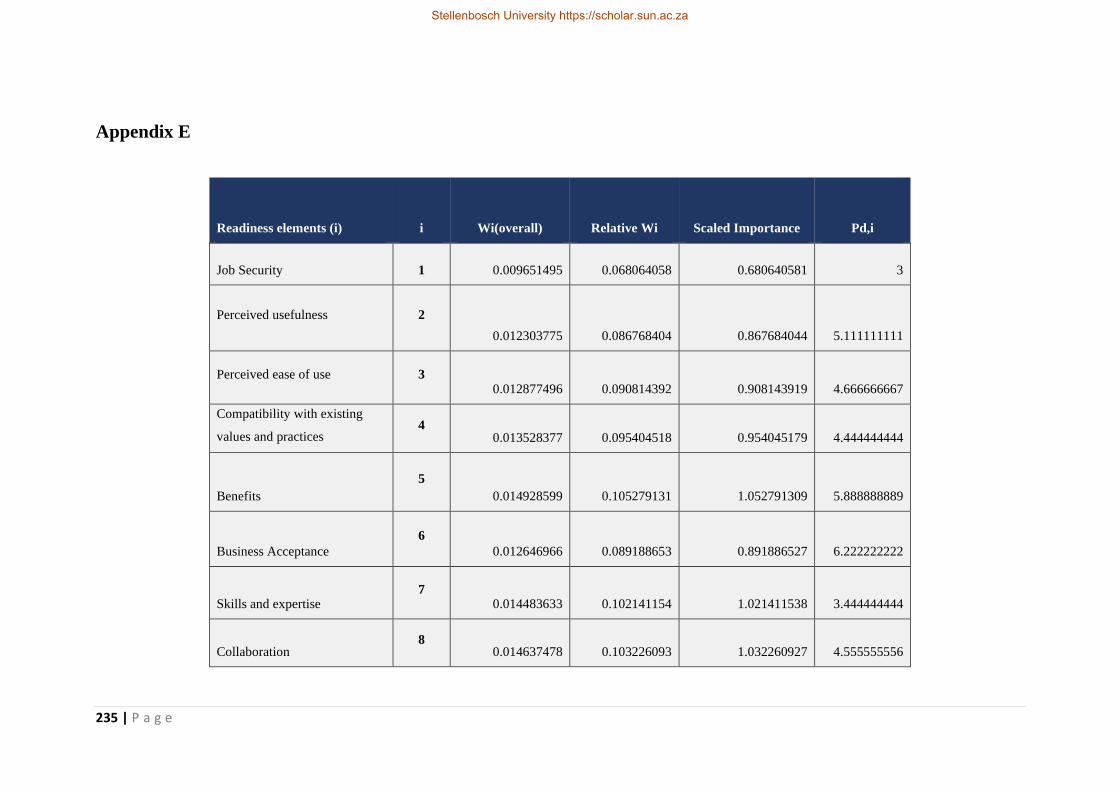
235 | P a g e
Appendix E
Readiness elements (i) i Wi(overall) Relative Wi Scaled Importance Pd,i
Job Security 1 0.009651495 0.068064058 0.680640581 3
Perceived usefulness 2
0.012303775 0.086768404 0.867684044 5.111111111
Perceived ease of use 3 0.012877496 0.090814392 0.908143919 4.666666667
Compatibility with existing
values and practices 4
0.013528377 0.095404518 0.954045179 4.444444444
Benefits
5
0.014928599 0.105279131 1.052791309 5.888888889
Business Acceptance
6
0.012646966 0.089188653 0.891886527 6.222222222
Skills and expertise 7
0.014483633 0.102141154 1.021411538 3.444444444
Collaboration 8
0.014637478 0.103226093 1.032260927 4.555555556
Stellenbosch University https://scholar.sun.ac.za

236 | P a g e
Certainty
9
0.008245593 0.058149386 0.581493858 3.222222222
Technological categorization
and planning 10
0.01150287 0.081120286 0.811202855 4.142857143
Technology requirement
handling 11
0.014675437 0.103493785 1.034937854 4.5
Technological investment and
capital management 12
0.015137079 0.10674937 1.067493695 4.333333333
Cost management 13
0.013213112 0.09318121 0.931812099 4.888888889
Technological competitors
analysis 14
0.008770539 0.061851397 0.618513974 5
Cloud resources
15
0.01281734 0.090390156 0.903901562 4.25
Stellenbosch University https://scholar.sun.ac.za

237 | P a g e
Network Connectivity
16
0.015433927 0.108842798 1.088427981 5.125
Technology Risk Management
17
0.013542895 0.095506904 0.955069036 4.25
Quality Management
18
0.012466148 0.08791349 0.879134901 2.888888889
Human resource planning
19
0.013557755 0.095611699 0.956116995 4.055555556
Executive support 20
0.031185937 0.219928769 2.199287695 7.444444444
Budget 21
0.031140948 0.219611494 2.196114943 4.444444444
Business opportunity
22
0.026990412 0.190341181 1.903411811 6.111111111
Strategic leadership
23
0.029060502 0.204939826 2.049398259 6
Business cases 24
0.021155263 0.149190675 1.491906753 5.555555556
Stellenbosch University https://scholar.sun.ac.za

238 | P a g e
Trial-ability 25
0.024207538 0.170715859 1.707158593 5
Business clarity 26 0.022035144 0.155395749 1.553957486 3.777777778
Observable results
27
0.027186674 0.191725257 1.917252574 4.625
Technology roadmaps and
scenarios 28
0.022493113 0.158625428 1.586254283 5.285714286
Technology
prospect/forecasting 29
0.022931537 0.161717274 1.61717274 4.142857143
Agile delivery 30 0.024527176 0.17297 1.729700003 4.888888889
Technologic sustainability and
position map 31
0.02445925 0.172490978 1.724909783 4.857142857
Communication networks 32 0.023534474 0.165969295 1.659692948 4.857142857
Information networks 33 0.02403394 0.169491614 1.694916139 4.571428571
Services 34 0.024221912 0.170817226 1.708172259 4.5
Infrastructure platform 35 0.027825869 0.196232971 1.962329711 4.857142857
Stellenbosch University https://scholar.sun.ac.za

239 | P a g e
Management information
system and data processing 36
0.026744146 0.188604467 1.886044669 3.444444444
Agent based applications 37
0.020080791 0.141613305 1.416133049 3.5
Return on investment 38
0.023286459 0.164220248 1.642202482 4.666666667
Enterprise resource planning in
terms of databases and
software
39
0.025766316 0.181708638 1.817086382 4.375
Technology knowledge
management 40
0.023891302 0.168485709 1.684857092 3.875
Technology identification and
selection 41
0.022076773 0.155689326 1.556893262 4
Cyber security 42 0.141800171 1 10 5
Stellenbosch University https://scholar.sun.ac.za

240 | P a g e
Appendix F
Readiness
elements (i) i Wi(strat) Wi(op) Wi(tact)
Scaled
Importance
(strat)
Scaled
Importance
(op)
Scaled
Importance
(Tact) Wi(overall)
Relative
Wi
Scaled
Importance Pd,i
Job Security 1 0.025524632 0.02545 0.020565496 2.985274858 3.844593309 2.970547885 0.009651495 0.309482285 3.094822848 3
Perceived usefulness 2 0.03253893 0.03244 0.026216998 3.805643441 4.901106934 3.786869421 0.012303775 0.394529577 3.945295771 5.111
Perceived ease of use 3 0.034056211 0.03395 0.02743949 3.983099575 5.129644238 3.963450128 0.012877496 0.412926386 4.129263856 4.667
Compatibility with
existing values and
practices
4
0.03577755 0.03567 0.028826392 4.18442151 5.38891717 4.1637789 0.013528377 0.433797352 4.337973524 4.444
Benefits 5 0.039480618 0.03936 0.031809998 4.617519898 5.946683956 4.594740725 0.014928599 0.478696494 4.78696494 5.889
Business Acceptance 6
0.033446544 0.03335 0.026948274 3.911795006 5.03781448 3.892497319 0.012646966 0.405534269 4.055342686 6.222
Skills and expertise 7
0.038303848 0.03819 0.030861861 4.479888903 5.769435552 4.457788691 0.014483633 0.464428342 4.644283422 3.444
Collaboration 8 0.03871071 0.03859 0.031189674 4.527474087 5.830718245 4.505139128 0.014637478 0.46936148 4.693614798 4.556
Certainty 9 0.021806541 0.02174 0.017569786 2.550419479 3.284563777 2.537837736 0.008245593 0.264400997 2.644009966 3.222
Technological
categorization and
planning
10
0.03029623 0.02545 0.025410389 3.543344807 3.844717065 3.670360092 0.01150287 0.368847994 3.688479945 4.143
Stellenbosch University https://scholar.sun.ac.za

241 | P a g e
Technology
requirement handling 11
0.038652126 0.03247 0.032418738 4.520622243 4.905114921 4.682669166 0.014675437 0.470578659 4.705786591 4.5
Technological
investment and capital
management
12
0.039867998 0.03349 0.033438528 4.662826588 5.059414177 4.829970989 0.015137079 0.485381561 4.853815615 4.333
Cost management 13 0.034800658 0.02923 0.029188393 4.070167578 4.416347715 4.216067433 0.013213112 0.423688134 4.236881336 4.889
Technological
competitors analysis 14
0.023099822 0.0194 0.019374538 2.701677222 2.93146309 2.79852196 0.008770539 0.281233772 2.812337718 5
Cloud resources 15 0.033758275 0.02836 0.028314114 3.948253984 4.284064999 4.089783706 0.01281734 0.410997417 4.109974171 4.25
Network Connectivity 16
0.040649837 0.03414 0.034094281 4.754267822 5.158632767 4.92469004 0.015433927 0.494900228 4.949002275 5.125
Technology Risk
Management 17
0.035669242 0.02996 0.029916901 4.171754187 4.526574575 4.321295532 0.013542895 0.434262893 4.342628926 4.25
Quality Management 18
0.032833307 0.02758 0.027538315 3.84007288 4.166682764 3.977724726 0.012466148 0.399736198 3.997361978 2.889
Human resource
planning 19
0.03570838 0.02999 0.029949727 4.176331684 4.531541402 4.326037114 0.013557755 0.434739392 4.347393917 4.056
Executive support 20 0.085501782 0.06619 0.068610503 10 10 9.910326772 0.031185937 1 10 7.444
Budget 21 0.085378435 0.06609 0.068511524 9.98557373 9.98557373 9.896029867 0.031140948 0.998557373 9.98557373 4.444
Stellenbosch University https://scholar.sun.ac.za

242 | P a g e
Business opportunity 22
0.073999005 0.05728 0.059380154 8.654674035 8.654674035 8.577064779 0.026990412 0.865467404 8.654674035 6.111
Strategic leadership 23
0.079674525 0.06168 0.063934449 9.318463717 9.318463717 9.234902044 0.029060502 0.931846372 9.318463717 6
Business cases 24 0.058000909 0.0449 0.046542557 6.783590691 6.783590691 6.722760043 0.021155263 0.678359069 6.783590691 5.556
Trial-ability 25 0.067864844 0.04924 0.049367799 7.937243198 7.439349446 7.130847283 0.024207538 0.776232504 7.762325036 5
Business clarity 26 0.061774625 0.04482 0.044937513 7.224951761 6.771739197 6.490922144 0.022035144 0.706573083 7.065730826 3.778
Observable results 27
0.076216731 0.0553 0.05544332 8.914051692 8.354883914 8.00841548 0.027186674 0.871760697 8.71760697 4.625
Technology roadmaps
and scenarios 28
0.063058523 0.04575 0.045871475 7.37511211 6.912480167 6.625826731 0.022493113 0.721258199 7.212581994 5.286
Technology
prospect/forecasting 29
0.064287627 0.04665 0.046765578 7.518864025 7.047214697 6.754973959 0.022931537 0.735316596 7.353165956 4.143
Agile delivery 30
0.068760935 0.04989 0.050019654 8.042046962 7.537578995 7.225003354 0.024527176 0.786481917 7.864819171 4.889
Technologic
sustainability and
position map
31
0.06721318 0.05537 0.060855108 7.861026825 8.365975668 8.790111944 0.02445925 0.78430384 7.843038396 4.857
Communication
networks 32
0.064671928 0.05328 0.058554247 7.563810533 8.049667847 8.457768023 0.023534474 0.754650223 7.546502225 4.857
Information networks 33 0.066044442 0.05441 0.059796927 7.72433513 8.220503656 8.637264825 0.02403394 0.770665949 7.706659493 4.571
Stellenbosch University https://scholar.sun.ac.za

243 | P a g e
Services 34 0.066560983 0.05484 0.060264605 7.784747977 8.28479709 8.704817793 0.024221912 0.77669341 7.766934098 4.5
Infrastructure platform 35 0.076464533 0.063 0.069231323 8.943033803 9.517484785 10 0.027825869 0.892256941 8.922569412 4.857
Management
information system and
data processing
36
0.070826844 0.06057 0.060017438 8.283668776 9.150962716 8.66911609 0.026744146 0.857570691 8.575706912 3.444
Agent based
applications 37
0.053180201 0.04548 0.045063979 6.219776933 6.870982937 6.509189315 0.020080791 0.643905321 6.439053211 3.5
Return on investment 38 0.061669812 0.05274 0.052257927 7.21269313 7.967856719 7.548306886 0.023286459 0.746697436 7.466974356 4.667
Enterprise resource
planning in terms of
databases and software
39
0.068237246 0.05836 0.057823057 7.980798113 8.81638172 8.352152554 0.025766316 0.826215864 8.262158638 4.375
Technology knowledge
management 40
0.063271625 0.05411 0.053615276 7.400035809 8.174814036 7.744366805 0.023891302 0.766092174 7.660921742 3.875
Technology
identification and
selection
41
0.058466185 0.05 0.04954323 6.838007772 7.553942084 7.156187048 0.022076773 0.707907958 7.079079584 4
Cyber security 42 5
Stellenbosch University https://scholar.sun.ac.za

244 | P a g e
Appendix G
Readiness elements (i) i Wd,i Rd,i Wd,i*Rd,i
Job Security 1 0.071537339 3 0.214612016
Perceived usefulness 2 0.09119616 5.111111111 0.466113707
Perceived ease of use 3 0.095448613 4.666666667 0.445426859
Compatibility with
existing values and
practices
4
0.100272971 4.444444444 0.445657649
Benefits 5 0.110651481 5.888888889 0.651614279
Business Acceptance 6
0.093739913 6.222222222 0.583270568
Skills and expertise 7
0.107353375 3.444444444 0.369772735
Collaboration 8 0.108493677 4.555555556 0.494248975
Certainty 9 0.061116725 3.222222222 0.196931669
Technological
categorization and
planning
10
0.081154648 4.142857143 0.336212113
Technology requirement
handling 11
0.103537625 4.5 0.465919313
Technological
investment and capital
management
12
0.106794588 4.333333333 0.46277655
Cost management 13 0.093220681 4.888888889 0.455745553
Technological
competitors analysis 14
0.061877597 5 0.309387987
Cloud resources 15 0.090428445 4.25 0.384320892
Stellenbosch University https://scholar.sun.ac.za

245 | P a g e
Network Connectivity 16
0.108888904 5.125 0.558055631
Technology Risk
Management 17
0.09554736 4.25 0.406076281
Quality Management 18
0.08795073 2.888888889 0.254079887
Human resource
planning 19
0.0956522 4.055555556 0.387922813
Executive support 20 0.220301889 7.444444444 1.640025175
Budget 21 0.219984076 4.444444444 0.977707003
Business opportunity 22
0.190664104 6.111111111 1.165169524
Strategic leadership 23
0.205287516 6 1.231725096
Business cases 24 0.149443784 5.555555556 0.830243247
Trial-ability 25 0.166473402 5 0.832367011
Business clarity 26 0.151534011 3.777777778 0.57246182
Observable results 27
0.186960696 4.625 0.864693219
Technology roadmaps
and scenarios 28
0.15468343 5.285714286 0.817612417
Technology
prospect/forecasting 29
0.157698441 4.142857143 0.653322111
Agile delivery 30
0.168671525 4.888888889 0.824616346
Technologic
sustainability and
position map
31
0.18344235 4.857142857 0.891005698
Communication
networks 32
0.176506607 4.857142857 0.857317808
Information networks 33 0.180252557 4.571428571 0.824011689
Stellenbosch University https://scholar.sun.ac.za

246 | P a g e
Services 34 0.181662331 4.5 0.817480491
Infrastructure platform 35 0.20869171 4.857142857 1.01364545
Management information
system and data
processing
36
0.191414141 3.444444444 0.659315376
Agent based applications 37 0.143722944 3.5 0.503030303
Return on investment 38 0.166666667 4.666666667 0.777777778
Enterprise resource
planning in terms of
databases and software
39
0.184415584 4.375 0.806818182
Technology knowledge
management 40
0.170995671 3.875 0.662608225
Technology
identification and
selection
41
0.158008658 4 0.632034632
Cyber security 42 1 5 5
Stellenbosch University https://scholar.sun.ac.za

247 | P a g e
Appendix H
Survey Protocol
*Note: This survey will be done via an online platform and this document only indicates the format and nature of
some questions that will be asked. It is also subject to minor changes. Elaboration of each element is not provided due
to it being administered to subject matter experts.
Dear participant
Thank you for your participation as part of the research involved in completing my Master’s degree in Engineering
Management. The title of the study is,” Development of an AI readiness model to assist in the implementation of
artificial intelligence in business”.
The aim of the survey is to provide the interviewer with some practical insights on the importance/weighting of the
readiness models’ dimensions and elements. This model was developed to assist in the implementation of artificial
intelligence into the business. The survey is administered to different SMEs (subject matter experts that specialize on
different dimensions in business and technology) and management. This aims to create a more balanced and complete
result.
The signed institutional permission form for conducting interviews is attached. The participation in this study is
completely voluntarily and the participant is free to withdraw from the study without any negative consequences. If
the participant wishes to withdraw from the study, the data gathered from the specific participant through the
interview/survey will be permanently deleted/destroyed. The participants are also free to refuse to answer questions
they do not feel comfortable with. Data generated/obtained from this survey is anonymous. Any personal information
disclosed within the survey answers will be used anonymously.
Principal investigator: M. Nortje (MEng Engineering Management candidate) – [email protected]
Supervisor: Prof S. Grobbelaar – [email protected]
The purpose of this survey is better understand the readiness dimensions and their elements. Specifically their
weightings/importance to subject matter experts and managers involved with implementing/integrating artificial
intelligence into business. The survey covers eight large business readiness dimensions/themes, each with a set of
elements/components. The readiness model was developed through a combination of models namely, technology
readiness model, technology organization environment framework, diffusion of innovation, technology acceptance
model, employee readiness and more literature. This artificial intelligence readiness model is generic in nature, thus
applicable to and for a range of case studies and subject matter experts.
Section 1:
This section encompasses collection of data on the interviewee. This provides a better understanding of the subject
matter experts’ field of expertise and knowledge. The question are:
1.1 What is your profession ?
Stellenbosch University https://scholar.sun.ac.za

248 | P a g e
1.2 What is your area of expertise in terms of AI/robotics or technology integration ?
1.3 Within your field, with regards to AI technology, how do you measure your business’ readiness or maturity with
regards to AI integration and implementation ?
Section 2:
This section focuses on validating the artificial intelligence readiness model elements used in the model. Could you
please state whether the elements are relevant or irrelevant in terms of determining a business’ readiness for
introducing new technologies, such as artificial intelligence. The last column is provided to identify which dimension
the element should move to, if the element is not in the appropriate category.
Readiness dimension and element Relevant Irrelevant Dimension change
Technology management
Human resource planning
Quality Management
Technology Risk Management
Network Connectivity
Cloud resources
Technological competitors analysis
Cost management
Technological investment and
capital management
Technology requirement handling
Technological categorization and
planning
Employee and culture
Job Security
Perceived usefulness
Perceived ease of use
Compatibility with existing values and
practices
Benefits
Business Acceptance
Skills and expertise
Stellenbosch University https://scholar.sun.ac.za

249 | P a g e
Collaboration
Certainty
Organizational
governance and
leadership dimension
Executive support
Budget
Business opportunity
Strategic leadership
Business cases
Strategy
Trial-ability
Business clarity
Observable results
Technology roadmaps and scenarios
Technology prospect/forecasting
Agile delivery
Infrastructure
Technologic sustainability and position
map
Communication networks
Information networks
Services
Infrastructure platform
Knowledge and
information management
Management information system and
data processing
Agent based applications
Return on investment
Enterprise resource planning in terms
of databases and software
Technology knowledge management
Technology identification and
selection
Section 3:
These questions are aimed to identify the weighting/importance of each dimension in relation to strategy, operations
and tactics. This section incorporates the TRM (technology readiness model) evaluation method.
It is important to note that the importance of the technology elements should be evaluated with the focus on the
implementation of artificial intelligence into the business.
Identify the weighting/importance of each dimension with respect to strategy, operations and tactics. Please mark the
importance on a scale of 1 to 5. 1 (not important at all) - 5 (very important). Mark an “x” in the cell you wish to
answer. An example is given to assist in answering the survey.
Stellenbosch University https://scholar.sun.ac.za

250 | P a g e
Example:
Readiness
dimension
Strategy Operational Tactical
1 2 3 4 5 1 2 3 4 5 1 2 3 4 5
Employee
and culture
X X X
Survey:
Readiness
dimension
Strategy Operational Tactical
1 2 3 4 5 1 2 3 4 5 1 2 3 4 5
Employee and
culture
Technology
Management
Organizational
governance
and leadership
Strategy
Infrastructure
Knowledge
and
information
management
Security
Environmental
context
Section 4:
This section involves the elements of the readiness dimensions. It is important to note that the importance of the
technology elements should be evaluated with the focus on the implementation of artificial intelligence into the
business.
The pairwise comparisons form an n x n matrix (P). The entries are denoted 𝑃𝑖𝑗, The entries encompass
the importance of 𝑖𝑡ℎ element with respect to the 𝑗𝑡ℎ element. When 𝑃𝑖𝑗 > 1, the 𝑖𝑡ℎ element/criterion has a
higher importance than the 𝑗𝑡ℎ element/criterion. The opposite holds true when 𝑃𝑖𝑗 < 1. When 𝑃𝑖𝑗 = 1, then
the elements are equally important. Once the whole number is given to the appropriate position, the
reciprocal is entered in the transpose position. It is important to note that:
Stellenbosch University https://scholar.sun.ac.za

251 | P a g e
𝑃𝑖𝑗 . 𝑃𝑗𝑖 = 1
The scale of importance or absolute numbers can be seen in the table below. The table shows the number,
definition and explanation of each intensity of importance.
Table The scale of absolute numbers.
Intensity of
importance (𝑃𝑖𝑗)
Definition Explanation
1 Equal importance The two criterion/elements are equally important.
2 Slight importance Through experience and judgement, one criterion
is viewed as slightly more important. 3 Moderate importance
4 Moderate plus
importance
Through experience and judgement, one criterion
is viewed as largely more important.
5 Strong importance
6 Strong plus importance The element is very strongly favoured over the
other through demonstration in practice. 7 Very strong importance
8 Very strong plus
importance
The element/criterion most favoured over the
other criterion.
9 Extreme importance
Please evaluate the readiness elements within each readiness dimension. This will be used to develop the
pair wise comparisons used in the AHP method. The reciprocal values will be added during the analysis of
the survey. Due to the nature of these tables, when the 𝑖𝑡ℎ element is less important then the 𝑗𝑡ℎ element, a
fractional value can be added. These fractional values represent the opposites of the table above. Thus the
values can be entered as: 1/n, where n ∈ [1,2 … … 9].
Stellenbosch University https://scholar.sun.ac.za

252 | P a g e
Technology management dimension
𝑗𝑡ℎ
Technological
categorization
and planning
Technology
requirement
handling
Technological
investment and
capital
management
Cost
management
Technological
competitors
analysis
Cloud
resources
Network
Connectivity
Technology
Risk
Management
Quality
Management
Human
resource
planning
𝑖𝑡ℎ
Human resource
planning
1
Quality
Management
1
Technology Risk
Management
1
Network
Connectivity
1
Cloud resources 1
Technological
competitors
analysis
1
Cost management 1
Technological
investment and
capital management
1
Technology
requirement
handling
1
Technological
categorization and
planning
1
Stellenbosch University https://scholar.sun.ac.za

253 | P a g e
Employee and culture dimension
Certainty Collaboration Skills
and
expertise
Business
Acceptance
Benefits Compatibility
with existing
values and
practices
Perceived
ease of
use
Perceived
usefulness
Job
Security
Job Security 1
Perceived
usefulness
1
Perceived
ease of use
1
Compatibility
with existing
values and
practices
1
Benefits 1
Business
Acceptance
1
Skills and
expertise
1
Collaboration 1
Certainty 1
Stellenbosch University https://scholar.sun.ac.za

254 | P a g e
Organizational governance and leadership dimension
Business
cases
Strategic
leadership
Business
opportunity
Budget Executive
support
Executive
support
1
Budget 1
Business
opportunity
1
Strategic
leadership
1
Business cases 1
Stellenbosch University https://scholar.sun.ac.za

255 | P a g e
Strategy dimension
Agile
delivery
Technology
prospect/forecasting
Technology
roadmaps and
scenarios
Observable
results
Business
clarity
Trial-
ability
Trial-ability 1
Business clarity 1
Observable results 1
Technology roadmaps
and scenarios
1
Technology
prospect/forecasting
1
Agile delivery 1
Stellenbosch University https://scholar.sun.ac.za

256 | P a g e
Infrastructure Dimension
Infrastructure
platform
Services Information
networks
Communication
networks
Technologic
sustainability and
position map
Technologic
sustainability and
position map
1
Communication
networks
1
Information
networks
1
Services 1
Infrastructure
platform
1
Stellenbosch University https://scholar.sun.ac.za

257 | P a g e
Knowledge and information management dimension
This section involves the elements of the readiness dimensions. It is important to note that the importance of the technology elements should be evaluated with the
focus on the implementation of artificial intelligence into the business.
Identify the weighting/importance of each element in the readiness dimension according to the Likert scale. Please enter the importance rating on a scale of 1 to 7.
The descriptions can be seen in the table below.
Technology
identification
and selection
Technology
knowledge
management
Enterprise
resource
planning
in terms
of
databases
and
software
Return on
investment
Agent
based
applications
Management
information
system and
data
processing
Management information system and data
processing
1
Agent based applications 1
Return on investment 1
Enterprise resource planning in terms of
databases and software
1
Technology knowledge management 1
Technology identification and selection 1
Stellenbosch University https://scholar.sun.ac.za

258 | P a g e
Intensity of
importance
Definition
1 Very Low importance
2 low importance
3 Low - moderate importance
4 Moderate importance
5 Moderate - strong importance
6 Strong importance
7 Very strong importance
Readiness dimension and element Importance
Rating (1-7)
Technology
management
Human resource planning
Quality Management
Technology Risk Management
Network Connectivity
Cloud resources
Technological competitors analysis
Cost management
Technological investment and capital
management
Technology requirement handling
Technological categorization and planning
Stellenbosch University https://scholar.sun.ac.za

259 | P a g e
Employee and
culture
Job Security
Perceived usefulness
Perceived ease of use
Compatibility with existing values and
practices
Benefits
Business Acceptance
Skills and expertise
Collaboration
Certainty
Organizational
governance and
leadership dimension
Executive support
Budget
Business opportunity
Strategic leadership
Business cases
Strategy
Trial-ability
Business clarity
Observable results
Technology roadmaps and scenarios
Technology prospect/forecasting
Agile delivery
Infrastructure
Technologic sustainability and position map
Communication networks
Information networks
Services
Infrastructure platform
Stellenbosch University https://scholar.sun.ac.za

260 | P a g e
Knowledge and
information
management
Management information system and data
processing
Agent based applications
Return on investment
Enterprise resource planning in terms of
databases and software
Technology knowledge management
Technology identification and selection
Thank you for your time!
Stellenbosch University https://scholar.sun.ac.za

261 | P a g e
Appendix I
*Note: This survey will be done via an online platform or physical administration and this document only indicates the format and nature of some questions that
will be asked. It is also subject to minor changes. Elaboration of each element is not provided due to it being administered to subject matter experts.
Dear participant
Thank you for your participation as part of the research involved in completing my Master’s degree in Engineering Management. The title of the study is,”
Development of an AI readiness model to assist in the implementation of artificial intelligence in business”.
The aim of the survey is to provide the interviewer with performance evaluations with regards to the case study. This model was developed to assist in the
implementation of artificial intelligence into the business. The survey is administered to different SMEs (subject matter experts that specialize on different
dimensions in business and technology) and management. This aims to create a more balanced and complete result.
The signed institutional permission form for conducting interviews is attached. The participation in this study is completely voluntarily and the participant is free
to withdraw from the study without any negative consequences. If the participant wishes to withdraw from the study, the data gathered from the specific participant
through the interview/survey will be permanently deleted/destroyed. The participants are also free to refuse to answer questions they do not feel comfortable with.
Data generated/obtained from this survey is anonymous. Any personal information disclosed within the survey answers will be used anonymously.
Principal investigator: M. Nortje (MEng Engineering Management candidate) – [email protected]
Supervisor: Prof S. Grobbelaar – [email protected]
The purpose of this survey is to gather performance evaluations with regards to the case study. The survey covers seven large business readiness dimensions/themes,
each with a set of elements/components. The readiness model was developed through a combination of models namely, technology readiness model, technology
organization environment framework, diffusion of innovation, technology acceptance model, employee readiness and more literature. This artificial intelligence
readiness model is generic in nature, thus applicable to and for a range of case studies and subject matter experts.
Section 1:
For this section, the interviewee needs to rate the performance of each readiness element to best of their ability with regards to their institution and with a focus on
artificial intelligence implementation in the organization. Please rate a score from 1 to 10. 1 being extremely low/unimportant and 10 is extremely high/important.
Stellenbosch University https://scholar.sun.ac.za
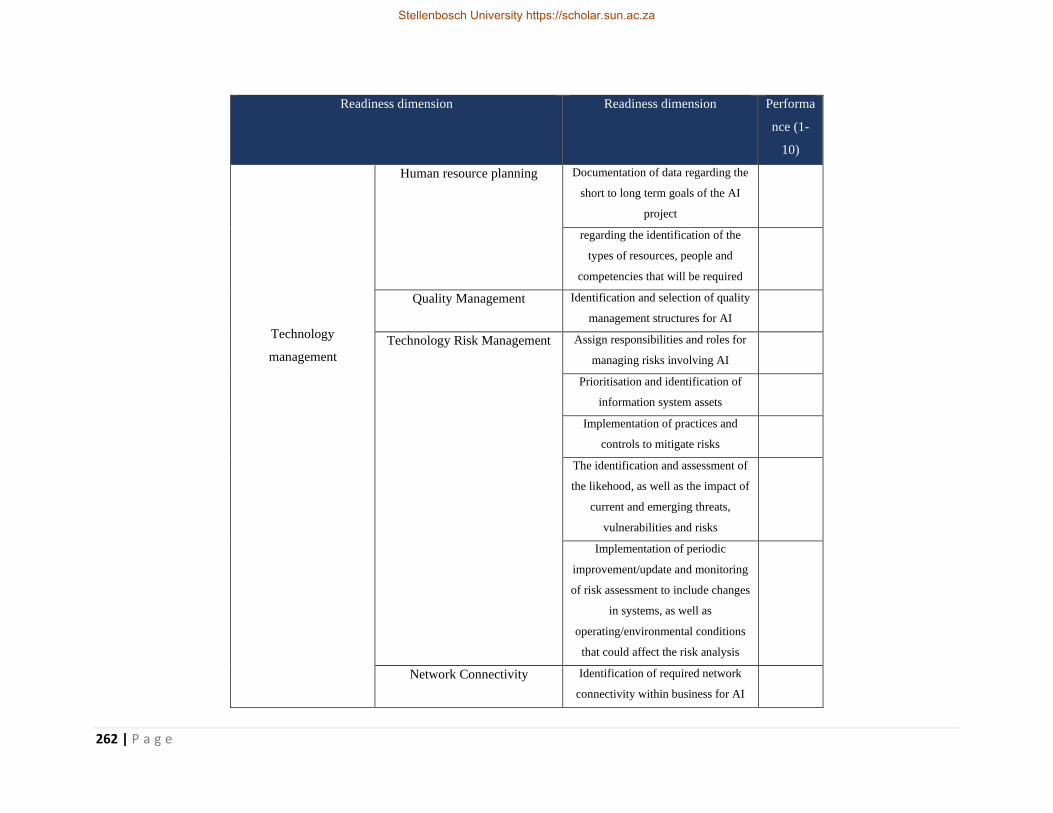
262 | P a g e
Readiness dimension Readiness dimension Performa
nce (1-
10)
Technology
management
Human resource planning Documentation of data regarding the
short to long term goals of the AI
project
regarding the identification of the
types of resources, people and
competencies that will be required
Quality Management Identification and selection of quality
management structures for AI
Technology Risk Management Assign responsibilities and roles for
managing risks involving AI
Prioritisation and identification of
information system assets
Implementation of practices and
controls to mitigate risks
The identification and assessment of
the likehood, as well as the impact of
current and emerging threats,
vulnerabilities and risks
Implementation of periodic
improvement/update and monitoring
of risk assessment to include changes
in systems, as well as
operating/environmental conditions
that could affect the risk analysis
Network Connectivity Identification of required network
connectivity within business for AI
Stellenbosch University https://scholar.sun.ac.za

263 | P a g e
Cloud resources Identification and selection of cloud
computing models, such as
infrastructure as a service, Platform
as a service or software as a service
Identification and satisfaction of
requirements regarding Cloud
computing models
Identification and selection of cloud
computing deployment models, such
as cloud, hybrid and on-premises
models
Identification and satisfaction of
requirements regarding cloud
computing deployment models
Technological competitors
analysis
Technological competitors analysis
for AI
Cost management Identification of cost management
structures for AI
Technological investment and
capital management
Allocation of Investment and capital
management for AI
Technology requirement
handling
Identification of technology
requirement management structures
Technological categorization
and planning
Technological categorization and
planning progress for AI
Job Security Employees' perception on job
security with regards to AI
Perceived usefulness Employees' perception on the
usefulness of AI
Stellenbosch University https://scholar.sun.ac.za

264 | P a g e
Employee and culture
Perceived ease of use Employees' perception with regards
to ease of use of AI
Compatibility with existing values
and practices
Compatibility of AI with business
values and practices
Benefits Employees' perception on the
benefits regarding AI
Business Acceptance Perceived business acceptance of AI
Skills and expertise Perceived current skills and expertise
capability to implement and manage
AI
Collaboration Willingness of employee
collaboration with regards to AI
Certainty Employees' perceived trust/certainty
in AI
Organizational
governance and
leadership dimension
Executive support Executive support regarding AI
Budget Allocation of a budget for AI
Business opportunity Identification of applicable business
opportunities for AI
Strategic leadership Identification of strategic leadership,
which comply with the activities and
characteristics of a strategic leader
Business cases Identification of business cases for
AI
Strategy
Trial-ability Capability to conduct a certain
amount of testing (test data)
Business clarity Perceived business clarity with
regards to AI
Observable results Identification of methods and criteria
involved with generating observable
Stellenbosch University https://scholar.sun.ac.za

265 | P a g e
results during testing/implementation
of AI
Technology roadmaps and
scenarios
Identification of technology
roadmaps and scenarios regarding AI
Technology prospect/forecasting Identification of technology
forecasting methods for AI
Agile delivery
Development of the agile strategy
with regards to AI
Infrastructure
Technologic sustainability and
position map
Development of the technology
sustainability and position map for
AI
Communication networks
Identification of communication
networks involved with operation of
AI
Information networks
Identification of information
networks involved with
implementation, operation and
management of AI
Services Identification and mapping of
services that will incorporate AI
Infrastructure platform
Identification of required
infrastructure in terms of cloud
resources, as well required additional
infrastructure sections
Management information system
and data processing
Initiation of the development of
management structures for
information systems and data
processing
Stellenbosch University https://scholar.sun.ac.za

266 | P a g e
Knowledge and
information
management
Agent based applications
Conducting agent based simulations
or modelling to indicate possible
impacts of AI on business processes
Return on investment Calculations of the return on
investment for AI
Enterprise resource planning in
terms of databases and software
Initiation of enterprise resource
planning (databases and software) for
AI
Technology knowledge
management
Initiation of technology knowledge
management strategies for AI
Technology identification and
selection
Analysis of technology compatibility,
system impact of AI and the maturity
of the AI
Security
Cyber security
Identification and development of
management of cyber security with
regards to Artificial intelligence
Stellenbosch University https://scholar.sun.ac.za

267 | P a g e
Appendix J
Legend Description
CAT1 The full document must freely available to researcher
CAT2 Only include english written literature
CAT3 Applicability of study towards the focus of this project
CAT4 Academic robustness of paper
CAT5 Academic conference reviews, lecture notes, presentation are excluded.
Pass criterion
× Fail criterion
Study Title Selection criteria
CAT1 CAT2 CAT3 CAT4 CAT5
A science mapping approach-based review of construction
safety research
× - - - -
Inner parameters' optimization in the artificial neural
network for the traffic data classification in radiofrequency
applications: Classification of nonstationary data using the
machine learning algorithm "random forest"
× - - - -
Stellenbosch University https://scholar.sun.ac.za

268 | P a g e
Employee readiness for acceptance of decision support
systems as a new technology in E-business environments;
A proposed research agenda
Assessing industry 4.0 readiness of enterprises
× - - - -
Challenges arising from prerequisite testing in
cybersecurity games
× - -
Predicting extubating readiness in extreme preterm infants
based on patterns of breathing
× - - - -
The challenge of advanced model-based FDIR for real-
world flight-critical applications
× - -
The ML test score: A rubric for ML production readiness
and technical debt reduction
Autonomous cars - Pipe dream or reality for India
customers
× - - - -
Cybersecurity Policies and Their Impact on Dynamic Data
Driven Application Systems
× - - - -
Stellenbosch University https://scholar.sun.ac.za

269 | P a g e
Application driven inverse type constraint satisfaction
problems
× -
Combat aircraft effectiveness assessment using hybrid
multi-criteria decision-making methodology
× - - - -
Big data analytics by automated generation of fuzzy rules
for Network Forensics Readiness
× -
Cloud based patient prioritization as service in public
health care
× - - - -
RAAF - M1: UNSW Canberra - Royal Australian air force
space situational awareness and ISR pathfinder mission
× - - - -
The semantic web as a platform against risk and
uncertainty in agriculture
× - - - -
Cyber-healthcare for public healthcare in the developing
world
× -
Stellenbosch University https://scholar.sun.ac.za

270 | P a g e
Work in progress - New education model based on
competencies of higher education and iMIS with
architectures
× - - - -
Research on Technical Readiness Evaluation Method in
Model Development
× - - - -
An Extensible Framework for Predictive Analytics on Cost
and Performance in the Cloud
× - - - -
Bringing ecosystem services indicators into spatial
planning practice: Lessons from collaborative
development of a web-based visualization platform
× -
Readiness model for industry 4.0 - The path to digital
transformation [Article@Reifegradmodell industrie 4.0 –
Der weg zur digitalen transformation]
× - - - -
Onset of global synchrony by application of a size-
dependent feedback
× - - - -
Cloud readiness assessment framework and
recommendation system
Microsourcing Job Provider Maturity Model × -
Stellenbosch University https://scholar.sun.ac.za

271 | P a g e
Towards a web based modelling and simulation tool for
research, engineering and education in the field of
hydrogen and fuel cell technology
× - - - -
To be a proper non-representational theory of perception,
the sensorimotor approach must be a fully non-
representational theory of behaviour
× - - - -
Integrated water management for municipalities in South
Africa
× -
Heart failure risk models and their readiness for clinical
practice
× - - - -
Machine learning based diagnosis support for shipboard
power systems controls
× - - - -
Emotion as morphofunctionality
× -
Fuzzy cognitive maps as decision support tools for
investigating critical agile adoption factors
× - - - -
Stellenbosch University https://scholar.sun.ac.za

272 | P a g e
System life prediction algorithm design and data analysis
of inertial navigation
× - - - -
Information behavior in stages of exercise behavior change
× - - - -
Complex decision making experimental platform
(CODEM): A counter-insurgency scenario
× - - - -
Improvement of business processes performances through
establishment of the analogy: Quality management system
-human organism
× - - - -
A demonstration of the transition from ready-to-hand to
unready-to-hand
× -
A fuzzy logic based green information technology
readiness model
Agents, availability awareness, and decision making
× -
Technology Readiness Model for Enterprises
Optimum maintenance scheduling for complex systems
using mixed integer linear programming
× - - - -
Stellenbosch University https://scholar.sun.ac.za

273 | P a g e
An ongoing study of group treatment for men involved in
problematic internet-enabled sexual behavior
× - - - -
Selecting and developing suppliers for mass
merchandisers
× - - - -
Hybrid natural language generation in a spoken language
dialog system
× - - - -
Proceedings: IEEE Systems Readiness Technology
Conference
× - - - -
Model-based health tracking
× - - - -
Bringing knowing-when and knowing-what together:
periodically tuned categorization and category-based
timing modeled with the Recurrent Oscillatory Self-
Organizing Map (ROSOM)
× -
Establishing a data-mining environment for wartime event
prediction with an object-oriented command and control
database
× -
Stellenbosch University https://scholar.sun.ac.za

274 | P a g e
Artificial intelligence for turboprop engine maintenance
× - - - -
Intelligent telemetry simulator for space applications
× - - - -
Stellenbosch University https://scholar.sun.ac.za

275 | P a g e
Appendix K
Study Title Quality criteria
Completeness of document Methodology Aim/Goals
Digitalization Canvas – Towards identifying digitalization use cases and
projects
Neural networks: An overview of early research, current frameworks and
new challenges
An enterprise risk management knowledge-based decision support system
for construction firms
Determination of Rule Patterns in Complex Event Processing Using
Machine Learning Techniques
Research on quality measuring of CMMI cyclic implementation in software
process
Managing quality in outsourcing of high-end services: A conceptual model
A model to assess open government data in public agencies
Computer-aided warehouse engineering (CAWE): Leveraging MDA and
ADM for the development of data warehouses
A development process of KMS based on systems engineering methodology
Stellenbosch University https://scholar.sun.ac.za

276 | P a g e
Appendix L
Legend Description
CAT1 The full document must freely available to researcher
CAT2 Only include english written literature
CAT3 Applicability of study towards the focus of this project
CAT4 Academic robustness of paper
CAT5 Academic conference reviews, lecture notes, presentation are excluded.
Pass criterion
× Fail criterion
Study Title Selection criteria
CAT1 CAT2 CAT3 CAT4 CAT5
Tracking the evolution of OGD portals: A maturity model
× - - - -
Embedding augmented reality applications into learning
management systems
× - - - -
Digitalization Canvas – Towards identifying digitalization use
cases and projects
Neural networks: An overview of early research, current
frameworks and new challenges
An enterprise risk management knowledge-based decision
support system for construction firms
Stellenbosch University https://scholar.sun.ac.za

277 | P a g e
A Systems Analysis of the Introduction of Unmanned Aircraft
into Aircraft Carrier Operations
× - - - -
On the role of the new pattern of communication of intelligent
algorithm in modern exhibition marketing
× - - - -
Assessment of maturity levels in dealing with low probability
high impact events
× - - - -
Knowledge elicitation and mapping in the design of a decision
support system for the evaluation of suppliers’ competencies
× -
Determination of Rule Patterns in Complex Event Processing
Using Machine Learning Techniques
Micro sourcing Job Provider Maturity Model
× - - - -
Test process improvement with documentation driven
integration testing
× - - - -
HLA as an experimental backbone for autonomous system
integration into operational field
× - - - -
Experiences and practices in the implementation of IT
Governance in Mexican electric utility
× - - - -
Stellenbosch University https://scholar.sun.ac.za

278 | P a g e
Approaching ETL conceptual modelling and validation using
BPMN and BPEL
× - - - -
A guide to implement open data in public agencies
DSS-CMM: A capability maturity model for DSS
development processes
× - - - -
Collective intelligence model for knowledge management in
technology-based clusters
× - - - -
Research on quality measuring of CMMI cyclic
implementation in software process
Managing quality in outsourcing of high-end services: A
conceptual model
A model to assess open government data in public agencies
Developing a knowledge process quality model evaluation
system using commonkads
× - - - -
Methodology to evaluate the performance of simulation
models for alternative compiler and operating system
configurations
× -
Stellenbosch University https://scholar.sun.ac.za

279 | P a g e
The role of four-hour blocks in promoting active learning
strategies: The impressions of students and teachers
× - - - -
32nd International Conference on Information System 2011,
ICIS 2011, Volume 3
× - - - -
32nd International Conference on Information System 2011,
ICIS 2011, Volume 4
× - - - -
32nd International Conference on Information System 2011,
ICIS 2011, Volume 1
× - - - -
Hybrid OCR techniques for cursive script languages - A
review and applications
× -
Computer-aided warehouse engineering (CAWE): Leveraging
MDA and ADM for the development of data warehouses
Apply fuzzy ontology to CMMI-based ASAP assessment
system
× - - - -
ETL process model for a manufacture cells production line
integration
× - - - -
A development process of KMS based on systems engineering
methodology
Stellenbosch University https://scholar.sun.ac.za

280 | P a g e
Computational aspects of cognition and consciousness in
intelligent devices
× -
A stage model for NPD process maturity and IKMS
implementation
× - - - -
Optimisation by clonal selection principles
× - - - -
Stellenbosch University https://scholar.sun.ac.za

281 | P a g e
Appendix M
Study Title
Quality criteria
Completeness
of document
Methodology Aim/Goals
Digitalization Canvas – Towards identifying digitalization use cases and projects
Neural networks: An overview of early research, current frameworks and new challenges
An enterprise risk management knowledge-based decision support system for construction firms
Determination of Rule Patterns in Complex Event Processing Using Machine Learning Techniques
Research on quality measuring of CMMI cyclic implementation in software process
Managing quality in outsourcing of high-end services: A conceptual model
A model to assess open government data in public agencies
Computer-aided warehouse engineering (CAWE): Leveraging MDA and ADM for the development of data
warehouses
A development process of KMS based on systems engineering methodology
Stellenbosch University https://scholar.sun.ac.za