AN ENHANCED SPECTRAL ANALYSIS TOOL (SAT) FOR RADIO FREQUENCY
9
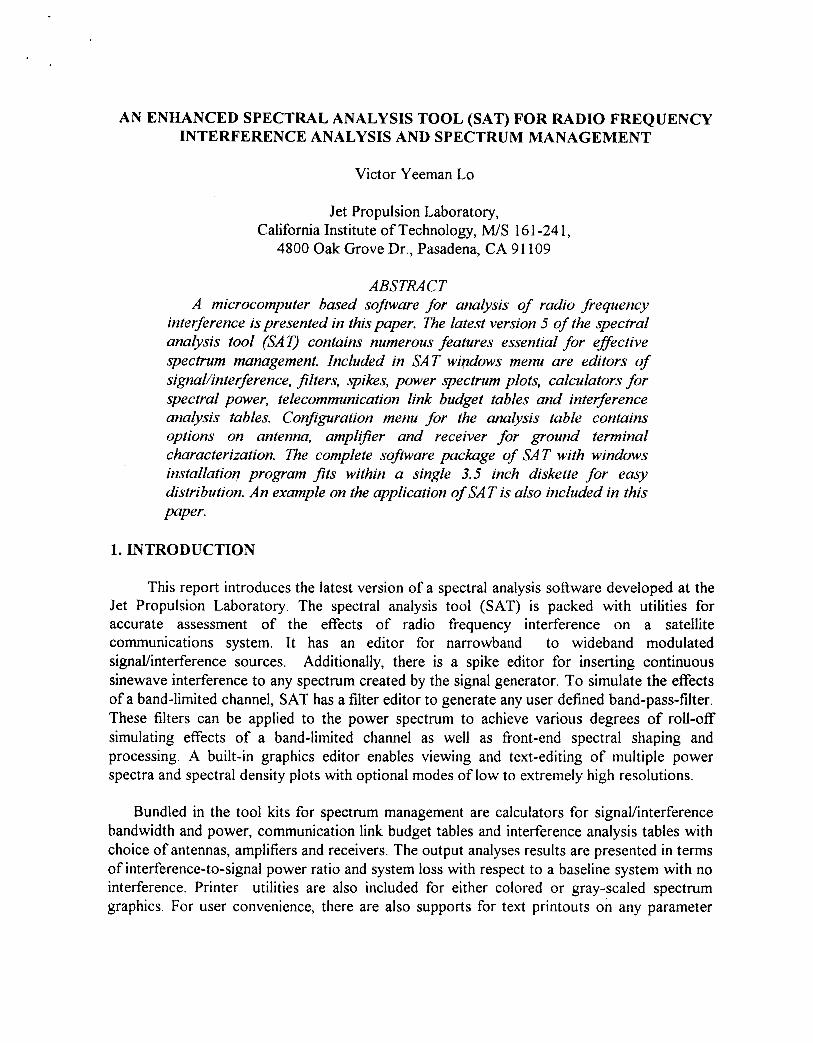
AN ENHANCED SPECTRAL ANALYSIS TOOL (SAT) FOR RADIO FREQUENCY INTERFERENCE ANALYSIS AND SPECTRUM MANAGEMENT Victor Yeeman Lo Jet Propulsion Laboratory, California Institute of Technology, MIS 16 1-24 1 , 4800 Oak GroveDr., Pasadena, CA 91 109 ABSTRACT A microcomputerbasedsoftware for analysis of radio frequency interference is presented in this paper. The latest version 5 of the spectral analysis tool (SAT) contains numerous features essential for effective spectrummanagement.Included in SATwindowsmenuare editors of signalhnterference, filters, spikes, power spectrum plots, calculators for spectral power, telecommunication link budget tables and interference analysis tables. Configuration menu for the analysis table contains options on antenna, amplifier and receiver for ground terminal characterization. The complete sofhYare package of SAT with windows installation program Jits within a single 3.5 inch diskette for eaJy distribution. An example on the application of SAT is also included in this paper. 1. INTRODUCTION This report introduces the latest version of a spectral analysis software developed at the Jet Propulsion Laboratory. The spectral analysis tool (SAT) is packed with utilities for accurate assessment of the effects of radio frequency interference on a satellite communications system. It has an editor for narrowband to wideband modulated signavinterference sources. Additionally, there is a spike editor for inserting continuous sinewave interferenceto any spectrum created by the signal generator. To simulate the effects of a band-limited channel, SAT has a filter editor to generate any user defined band-pass-filter. Thesefilterscan beapplied to the powerspectrum to achievevarious degrees of roll-off simulating effects of a band-limited channel as well as front-end spectral shaping and processing. A built-in graphics editor enables viewing and text-editing of multiple power spectra and spectral density plots with optional modes of low to extremely high resolutions. Bundled in the tool kits for spectrum management are calculators for signalhnterference bandwidth and power, communication link budget tables and interference analysis tables with choice of antennas, amplifiers and receivers. The output analyses results are presented in terms of interference-to-signal power ratioand system loss with respect to a baseline system with no interference. Printer utilities are also included for either colored or gray-scaled spectrum graphics. For user convenience, there are also supports for text printouts on any parameter
Transcript of AN ENHANCED SPECTRAL ANALYSIS TOOL (SAT) FOR RADIO FREQUENCY
AN ENHANCED SPECTRAL ANALYSIS TOOL (SAT) FOR RADIO FREQUENCY INTERFERENCE ANALYSIS AND SPECTRUM MANAGEMENT
Victor Yeeman Lo
Jet Propulsion Laboratory, California Institute of Technology, M I S 16 1-24 1 ,
4800 Oak Grove Dr., Pasadena, CA 91 109
ABSTRACT A microcomputer based software for analysis of radio frequency
interference is presented in this paper. The latest version 5 of the spectral analysis tool (SAT) contains numerous features essential for effective spectrum management. Included in SAT windows menu are editors of signalhnterference, filters, spikes, power spectrum plots, calculators for spectral power, telecommunication link budget tables and interference analysis tables. Configuration menu for the analysis table contains options on antenna, amplifier and receiver for ground terminal characterization. The complete sofhYare package of SAT with windows installation program Jits within a single 3.5 inch diskette for eaJy distribution. An example on the application of SAT is also included in this paper.
1. INTRODUCTION
This report introduces the latest version of a spectral analysis software developed at the Jet Propulsion Laboratory. The spectral analysis tool (SAT) is packed with utilities for accurate assessment of the effects of radio frequency interference on a satellite communications system. It has an editor for narrowband to wideband modulated signavinterference sources. Additionally, there is a spike editor for inserting continuous sinewave interference to any spectrum created by the signal generator. To simulate the effects of a band-limited channel, SAT has a filter editor to generate any user defined band-pass-filter. These filters can be applied to the power spectrum to achieve various degrees of roll-off simulating effects of a band-limited channel as well as front-end spectral shaping and processing. A built-in graphics editor enables viewing and text-editing of multiple power spectra and spectral density plots with optional modes of low to extremely high resolutions.
Bundled in the tool kits for spectrum management are calculators for signalhnterference bandwidth and power, communication link budget tables and interference analysis tables with choice of antennas, amplifiers and receivers. The output analyses results are presented in terms of interference-to-signal power ratio and system loss with respect to a baseline system with no interference. Printer utilities are also included for either colored or gray-scaled spectrum graphics. For user convenience, there are also supports for text printouts on any parameter
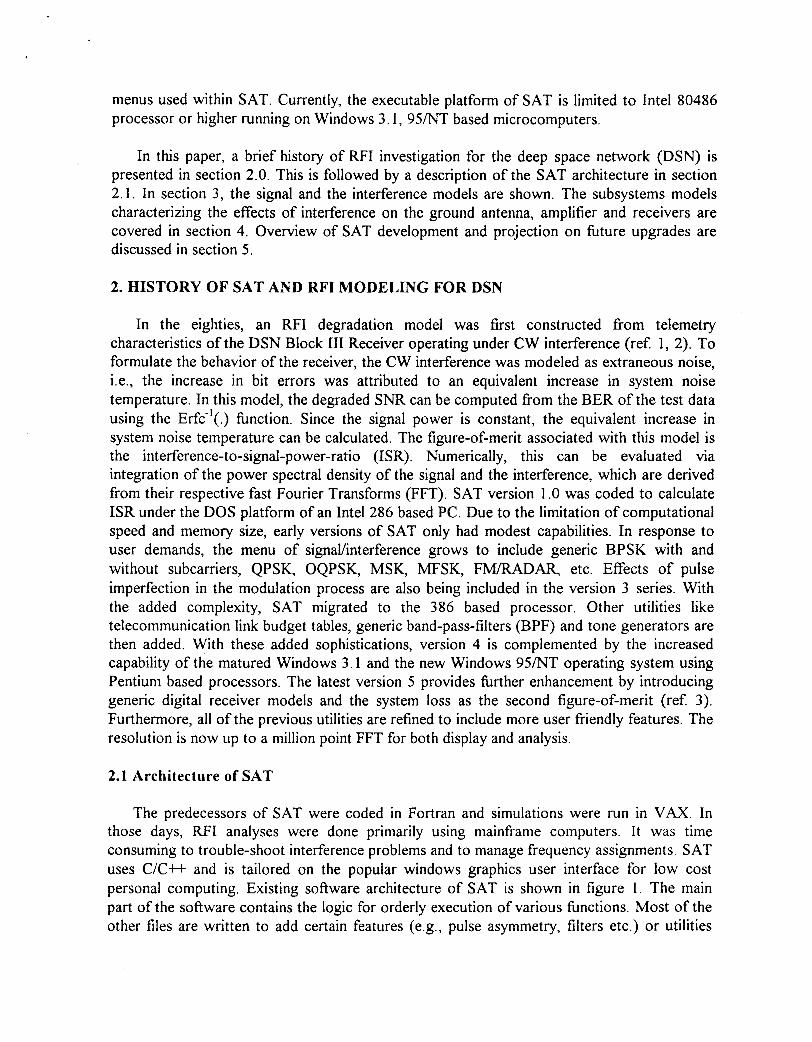
menus used within SAT. Currently, the executable platform of SAT is limited to Intel 80486 processor or higher running on Windows 3.1, 95/NT based microcomputers.
In this paper, a brief history of RFI investigation for the deep space network (DSN) is presented in section 2.0. This is followed by a description of the SAT architecture in section 2.1. In section 3, the signal and the interference models are shown. The subsystems models characterizing the effects of interference on the ground antenna, amplifier and receivers are covered in section 4. Overview of SAT development and projection on fbture upgrades are discussed in section 5 .
2. HISTORY OF SAT AND RFI MODELING FOR DSN
In the eighties, an RFI degradation model was first constructed from telemetry characteristics of the DSN Block I11 Receiver operating under CW interference (ref. 1, 2). To formulate the behavior of the receiver, the CW interference was modeled as extraneous noise, i.e., the increase in bit errors was attributed to an equivalent increase in system noise temperature. In this model, the degraded SNR can be computed from the BER of the test data using the Erfc"(.) fbnction. Since the signal power is constant, the equivalent increase in system noise temperature can be calculated. The figure-of-merit associated with this model is the interference-to-signal-power-ratio (ISR). Numerically, this can be evaluated via integration of the power spectral density of the signal and the interference, which are derived from their respective fast Fourier Transforms (FFT). SAT version 1.0 was coded to calculate ISR under the DOS platform of an Intel 286 based PC. Due to the limitation of computational speed and memory size, early versions of SAT only had modest capabilities. In response to user demands, the menu of signayinterference grows to include generic BPSK with and without subcarriers, QPSK, OQPSK, MSK, MFSK, FM/RADAR, etc. Effects of pulse imperfection in the modulation process are also being included in the version 3 series. With the added complexity, SAT migrated to the 386 based processor. Other utilities like telecommunication link budget tables, generic band-pass-filters (BPF) and tone generators are then added. With these added sophistications, version 4 is complemented by the increased capability of the matured Windows 3.1 and the new Windows 95/NT operating system using Pentium based processors. The latest version 5 provides hrther enhancement by introducing generic digital receiver models and the system loss as the second figure-of-merit (ref. 3). Furthermore, all of the previous utilities are refined to include more user friendly features. The resolution is now up to a million point FFT for both display and analysis.
2.1 Architecture of SAT
The predecessors of SAT were coded in Fortran and simulations were run in VAX. In those days, RFI analyses were done primarily using mainframe computers. It was time consuming to trouble-shoot interference problems and to manage frequency assignments. SAT uses C/C++ and is tailored on the popular windows graphics user interface for low cost personal computing. Existing software architecture of SAT is shown in figure 1. The main part of the software contains the logic for orderly execution of various fbnctions. Most of the other files are written to add certain features (e.g., pulse asymmetry, filters etc.) or utilities

(e.g., power calculators, link budget tables). The remaining files support files I/O as well as memory management. Since the software was originally written in C for 16-bit windows 3.1 platform, it requires optimization in both heap and stuck memory allocations for efficient computations. The optimization was carried under the constraint to support various SAT utilities. Over the years, this software has been gradually tuned to operate at near f u l l capacity of 16-bit windows application software. SAT is currently under migration from 16-bit into 32- bit applications so as to take full advantage of the built-in optimization inherited in the latest C++ compiler and windows multi-tasking capability.
3. EXISTING SIGNAL AND INTERFERENCE MODEL IN SAT
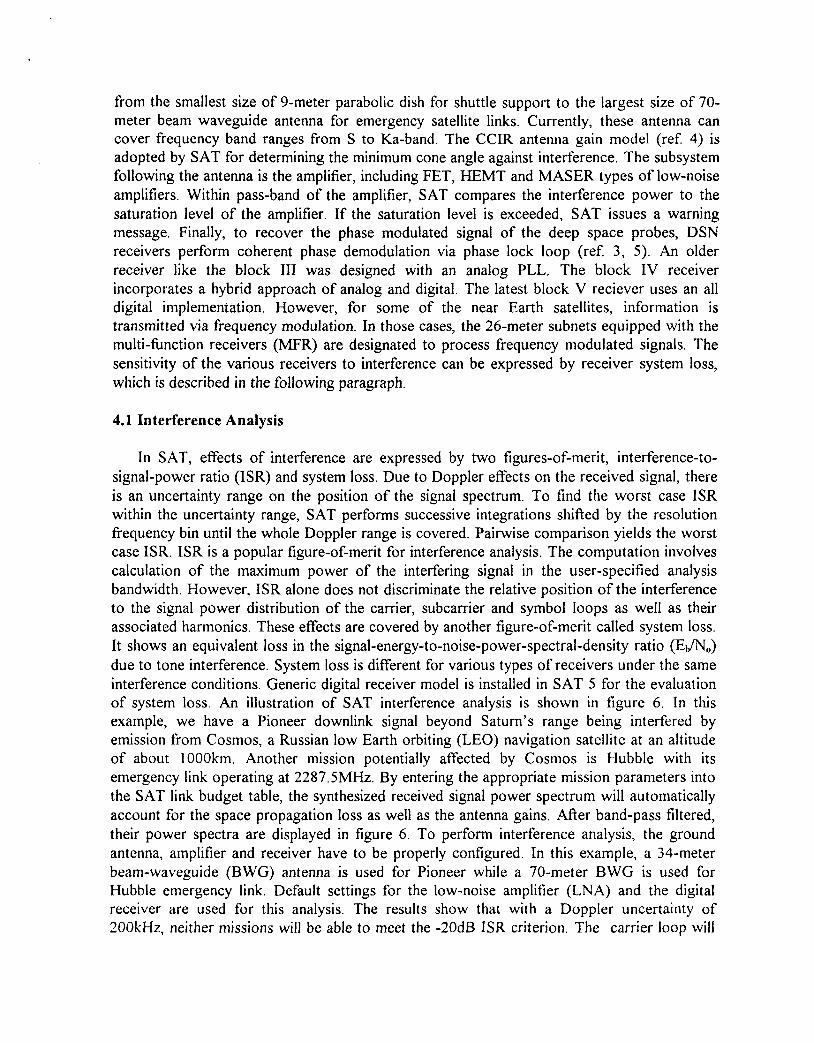
The SAT signalhnterference library can be roughly divided into two categories. They are the phase modulated and frequency modulated signals. When a user first creates a signal, he starts with the default parameters or he can input his own parameter values. Upon acceptance of the signal parameters, SAT performs Fourier transform and provides temporary storage of the spectra until a save or discard decision is made by the user. These signal power spectrums can be viewed or printed under the display menu. If the spectrum does not meet the expectation of the user, he can go back to modi@ the signal again. Spectral plots of some sample signals are shown in figures 2 and 3 .
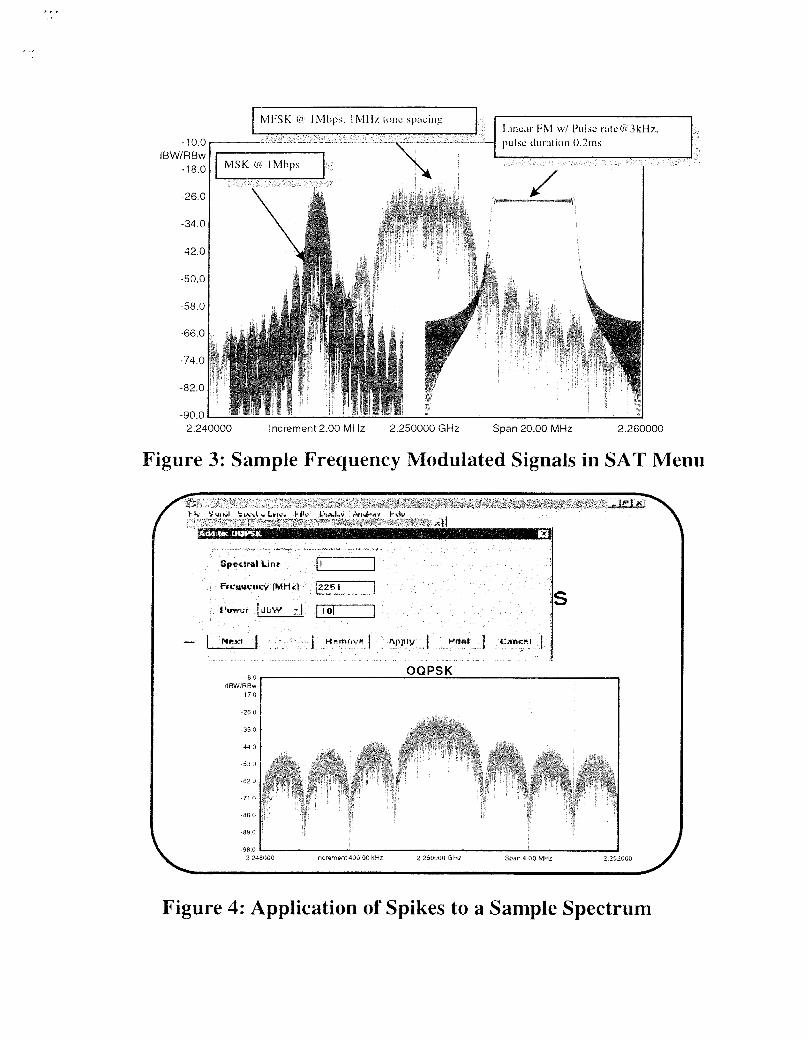
As part of the SAT utilities, a user can synthesize a composite real life signal by appending an arbitrary set of discrete frequency spikes (sinewaves) to another signal from the library menu (figure 4). Next, the spectrum can be shaped to simulate the effects of a transmitter filter, a receiver filter, and/or a bandlimited channel. The filter operation is achieved by choosing the proper class of filter from the filter library including the popular Buttenvorth, Chebychev and Gaussian filters. The user can then specify the order and the desired roll-off characteristics. An example in applying various types of filters on a default BPSK spectrum is shown in figure 5 .
3.1 Communication Link Budget Table and Other Supporting Utilities
A simple link budget table is incorporated in the signal menu. This feature enables the signal power entry to be fed by the estimated signal power based on link budget calculation. It can also be used as a stand-alone utility for designing a communication link to meet a prescribed bit error rate criterion. In order to run the link budget table, the user has to input the amount of gain or loss for each subsystem entry in the table. Another useful utility is the bandwidth occupancy calculator. It will calculate the bandwidth for rejecting the radiated power of a particular signal. The complementary function is the power calculator which will evaluate the signalhnterference power within any specified bandwidths. These utilities are very useful in assisting a spectrum manager to perform the task of frequency assignment.
4. GROUND TERMINAL MODEL
Most ground stations each contains an antenna, a low-noise-amplifier, a receiver and a decoder. Inside DSN tracking complexes, there are different classes of antennas, starting
from the smallest size of 9-meter parabolic dish for shuttle support to the largest size of 70- meter beam waveguide antenna for emergency satellite links. Currently, these antenna can cover frequency band ranges from S to Ka-band. The CCIR antenna gain model (ref. 4) is adopted by SAT for determining the minimum cone angle against interference. The subsystem following the antenna is the amplifier, including FET, HEMT and MASER types of low-noise amplifiers. Within pass-band of the amplifier, SAT compares the interference power to the saturation level of the amplifier. If the saturation level is exceeded, SAT issues a warning message. Finally, to recover the phase modulated signal of the deep space probes, DSN receivers perform coherent phase demodulation via phase lock loop (ref. 3, 5 ) . An older receiver like the block 111 was designed with an analog PLL. The block IV receiver incorporates a hybrid approach of analog and digital. The latest block V reciever uses an all digital implementation. However, for some of the near Earth satellites, information is transmitted via frequency modulation. In those cases, the 26-meter subnets equipped with the multi-fbnction receivers (MFR) are designated to process frequency modulated signals. The sensitivity of the various receivers to interference can be expressed by receiver system loss, which is described in the following paragraph.
4.1 Interference Analysis
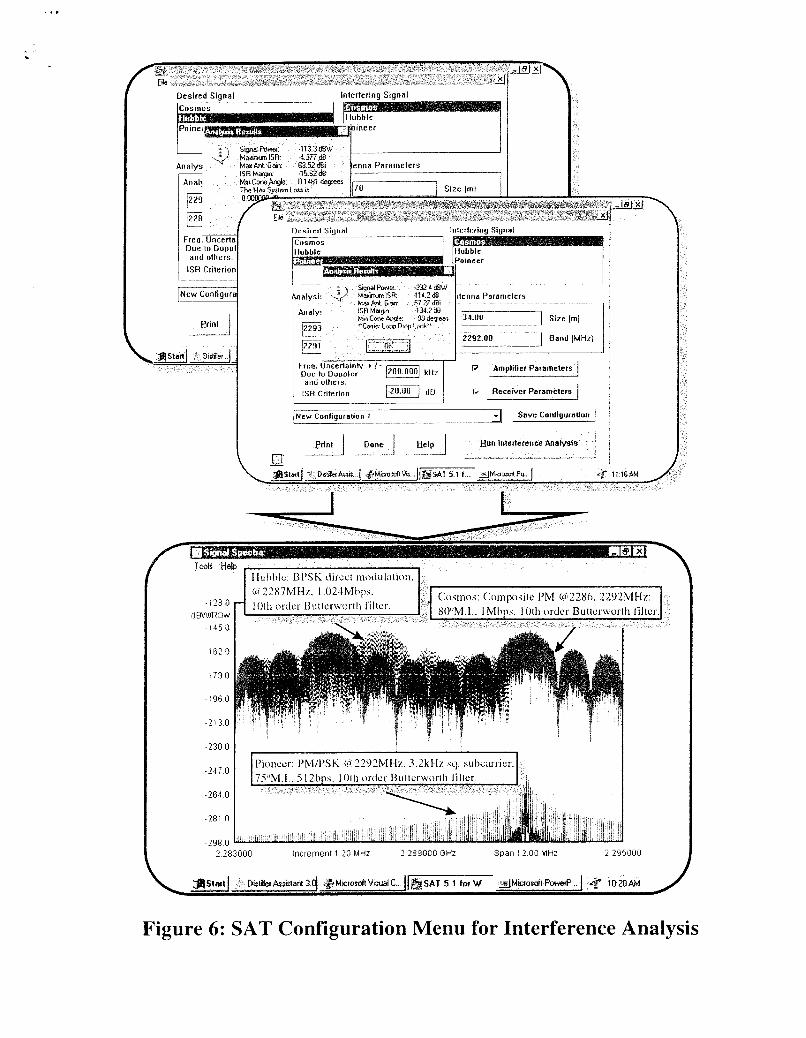
In SAT, effects of interference are expressed by two figures-of-merit, interference-to- signal-power ratio (ISR) and system loss. Due to Doppler effects on the received signal, there is an uncertainty range on the position of the signal spectrum. To find the worst case ISR within the uncertainty range, SAT performs successive integrations shifted by the resolution frequency bin until the whole Doppler range is covered. Pairwise comparison yields the worst case ISR. ISR is a popular figure-of-merit for interference analysis. The computation involves calculation of the maximum power of the interfering signal in the user-specified analysis bandwidth. However, ISR alone does not discriminate the relative position of the interference to the signal power distribution of the carrier, subcarrier and symbol loops as well as their associated harmonics. These effects are covered by another figure-of-merit called system loss. It shows an equivalent loss in the signal-energy-to-noise-power-spectral-density ratio ( E a , ) due to tone interference. System loss is different for various types of receivers under the same interference conditions. Generic digital receiver model is installed in SAT 5 for the evaluation of system loss. An illustration of SAT interference analysis is shown in figure 6. In this example, we have a Pioneer downlink signal beyond Saturn’s range being interfered by emission from Cosmos, a Russian low Earth orbiting (LEO) navigation satellite at an altitude of about 1000km. Another mission potentially affected by Cosmos is Hubble with its emergency link operating at 2287.5MHz. By entering the appropriate mission parameters into the SAT link budget table, the synthesized received signal power spectrum will automatically account for the space propagation loss as well as the antenna gains. After band-pass filtered, their power spectra are displayed in figure 6. To perform interference analysis, the ground antenna, amplifier and receiver have to be properly configured. In this example, a 34-meter beam-waveguide (BWG) antenna is used for Pioneer while a 70-meter BWG is used for Hubble emergency link. Default settings for the low-noise amplifier (LNA) and the digital receiver are used for this analysis. The results show that with a Doppler uncertainty of 2OOkH2, neither missions will be able to meet the -20dB ISR criterion. The carrier loop will

drop lock on the Pioneer downlink. However, Hubble will be able to operate if the angle between the signal from Cosmos and the ground antenna main lobe is more than the minimum cone angle of 0.148 degrees.
5. OVERVIEW OF SAT DEVELOPMENT
SAT has been helphl to spectrum managers in conducting desktop interference analyses with a user friendly interface. In the future, SAT will provide a signal workspace where a user can create an arbitrary composite signavinterference. With this capability, SAT can become a design tool for the communication analyst in addition to being an analysis tool. There are also plans to build up the file YO capabilities so that it can share data through an application interface, perhaps with an orbit analysis software or a spread sheet presentation software.
6. ACKNOWLEDGMENTS
This paper presents the results of research carried out at the Jet Propulsion Laboratory, California Institute of Technology under contract with the National Aeronautics and Space Administration. The author would like to acknowledge the contribution of modeling and programming by F. Chen, J. Rucker, M. Shihabi, K. Widyono, K. Ondrhiri, K. Angkasa, J. Gevargiz, L. Truong and E. Kidd.
REFERENCES
(1) Low, P., “Radio frequency interference effects of continuos sinewave signals on telemetry data,” JPL Progress Rept. 42-40, May 1977.
( 2 ) Low, P., “Radio frequency interference effects of continuous wave signals on telemetry data: part II,” JPL Progress Rept. 42-51, March 1979.
(3) Lo, V., “Characterization and Simulation of End-to-End Data Link Performance of the NASA Deep Space Network,’’ Proc. ZCC, Montreal Canada, June 1997.
(4) International Telecommunication Union, Radio Regulations, Edition of 1990, Appendices 2, Annex 111, Geneva 1990.
( 5 ) Yuen, J.H. ed., Deep Space Telecommunications Systems Engineering, Plenum, 1983.

Figure 1: Architecture of SAT Processing Elements
Figure 2: Sample Phase Modulated Signals in SAT Menu
2.240000 Increment 2.00 MHz 2.250000 GHz Span 20.00 MHz 2.260000
Figure 3: Sample Frequency Modulated Signals in SAT Menu
dBW RBw - 1 i O
Figure 4: Application of Spikes to a Sample Spectrum

/
2 246000 increment a00 on k ~ : 2 2501100 $;HZ Span R 00 MHz 2 '54l100
..
2 283000 increment 1 20 MHz 2 ?8E1000 Gti: Span 12.00 MHz 2 2'35000
Figure 6: SAT Configuration Menu for Interference Analysis

![Spectral Selective Solar Light Enhanced Photocatalysis ...Heterogeneous photocatalysis is an attractive method for air purification [6–9]. Light illumination of particulate metal](https://static.fdocuments.net/doc/165x107/5f9becb004b38228337a08ed/spectral-selective-solar-light-enhanced-photocatalysis-heterogeneous-photocatalysis.jpg)