An Empirical Study of Mutual Fund Excessive Fee Litigation ... · An Empirical Study of Mutual Fund...
48
An Empirical Study of Mutual Fund Excessive Fee Litigation: Do the Merits Matter? Quinn Curtis University of Virginia School of Law * John Morley University of Virginia School of Law ** September 18, 2012 ABSTRACT: Building on the U.S. Supreme Court’s recent decision in Jones v. Harris Associates, this paper presents the first comprehensive empirical study of mutual fund excessive fee liability under section 36(b) of the Investment Company Act. We use a hand-collected dataset of nearly all excessive fee complaints filed between 2000 and 2009 to investigate several topics, including the relationship between fee levels and the odds that funds would be targeted by excessive fee suits, the relationship between fee levels and suit outcomes, the relationship between excessive fee suits and subsequent fee changes, and the relationship between excessive fee suits and subsequent asset flows. Our most basic finding is that although fees had some ability to predict which funds would be targeted, the strongest predictor of targeting was family size: funds in larger families were much more likely to be targeted than funds in smaller families. * Associate Professor of Law, University of Virginia School of Law. [email protected]. ** Associate Professor of Law, University of Virginia School of Law. [email protected]. We thank Julie Wulf and three anonymous referees for editorial advice and substantive comments. We thank Peter Hilton, Bryce Lowder, Matthew Pearl, Michael Pergler and Stephen Sovinsky for excellent research assistance. We also thank James Benedict, William Birdthistle, Richard Evans, Richard Hynes, Louis Kaplow, Stefan Lewellen, Peter Molk, Eric Roiter and Roberta Romano, as well as participants in the George Mason Law and Economics Colloquium, the Harvard Law School Law and Economics Seminar, the Conference on Empirical Legal Studies and the American Law and Economics Association Annual Meeting for comments and suggestions. The Yale Law School Center for the Study of Corporate Law and the John R. Raben/Sullivan & Cromwell fund at Yale Law School provided research support.
Transcript of An Empirical Study of Mutual Fund Excessive Fee Litigation ... · An Empirical Study of Mutual Fund...

An Empirical Study of Mutual Fund Excessive Fee Litigation:
Do the Merits Matter?
Quinn Curtis
University of Virginia School of Law*
John Morley
University of Virginia School of Law**
September 18, 2012
ABSTRACT: Building on the U.S. Supreme Court’s recent decision in Jones v. Harris
Associates, this paper presents the first comprehensive empirical study of mutual fund
excessive fee liability under section 36(b) of the Investment Company Act. We use a
hand-collected dataset of nearly all excessive fee complaints filed between 2000 and
2009 to investigate several topics, including the relationship between fee levels and the
odds that funds would be targeted by excessive fee suits, the relationship between fee
levels and suit outcomes, the relationship between excessive fee suits and subsequent fee
changes, and the relationship between excessive fee suits and subsequent asset flows. Our
most basic finding is that although fees had some ability to predict which funds would be
targeted, the strongest predictor of targeting was family size: funds in larger families
were much more likely to be targeted than funds in smaller families.
* Associate Professor of Law, University of Virginia School of Law. [email protected].
** Associate Professor of Law, University of Virginia School of Law. [email protected]. We
thank Julie Wulf and three anonymous referees for editorial advice and substantive comments.
We thank Peter Hilton, Bryce Lowder, Matthew Pearl, Michael Pergler and Stephen Sovinsky for
excellent research assistance. We also thank James Benedict, William Birdthistle, Richard Evans,
Richard Hynes, Louis Kaplow, Stefan Lewellen, Peter Molk, Eric Roiter and Roberta Romano, as
well as participants in the George Mason Law and Economics Colloquium, the Harvard Law
School Law and Economics Seminar, the Conference on Empirical Legal Studies and the
American Law and Economics Association Annual Meeting for comments and suggestions. The
Yale Law School Center for the Study of Corporate Law and the John R. Raben/Sullivan &
Cromwell fund at Yale Law School provided research support.
ts453
Posted w Logo

Curtis and Morley
2
1. Introduction
This paper presents the first comprehensive empirical study of mutual fund
excessive fee liability under section 36(b) of the Investment Company Act of 1940 (ICA).
This unusual form of liability allows shareholders and the SEC to sue fund advisers based
simply on the theory that a fund’s fees are too high, even if the fees have been fully and
accurately disclosed.
Our results rely on a hand-collected dataset of 91 consolidated lawsuits filed
against the advisers of 2,770 open-end mutual funds between the beginning of 2000 and
the end of 2009. These suits represent all or nearly all complaints alleging a violation of
section 36(b) during our study period, with the exception of a few suits that grew out of
the market-timing and late-trading scandals of 2003 and 2004.
We start by examining which factors predicted which funds would be targeted for
excessive fee suits. In some of our tests, fees positively and significantly predicted
whether a fund would be targeted. The probability that a fund would be targeted rose only
very gradually as fees increased, however, and we find that the size of a fund’s complex
(i.e., the total amount of assets in all funds operated by the fund’s adviser) was a stronger
predictor of targeting than fees. In fact, funds in the smallest one-third of families were
almost never affected by suits during our study period, even though they were the most
likely to charge fees at the extreme high end of the fee distribution. We also study the
relationship between board independence and targeting and find no strong evidence to
suggest that board independence is associated with the probability of targeting.

Curtis and Morley
3
We next study the relationship between fees and case outcomes and discover that
fees were positively associated with the incidence of settlements and negatively
associated with dismissals. We then conclude by studying how funds changed after being
targeted by excessive fee suits. We analyze whether fees changed and find some evidence
that targeted funds actually increased their fees relative to untargeted funds. We also find
some evidence that funds and families targeted by excessive fee suits actually attracted
more investment after the filing of the suits than comparable untargeted funds did.
To be clear, because we have no exogenous variation to exploit, we cannot
confidently opine on the existence or absence of causal relationships. We can, however,
confidently point to certain associations, and these associations may at least suggest the
existence or absence of causal relationships.
Excessive fee liability has recently attracted substantial scholarly and public
attention. In March 2010, the United States Supreme Court rendered a landmark decision
on the scope and future of excessive fee liability in the case of Jones v. Harris Associates
L.P.1 Before reaching the Supreme Court, the case entangled Seventh Circuit Judges
Frank Easterbrook and Richard Posner, both former University of Chicago Law School
professors and pioneers of the law-and-economics movement, in a widely discussed
dispute about the basic terms of excessive fee liability. Easterbrook argued that such
liability should be limited only to cases involving fraud and misconduct in the setting of
fees. Posner argued for maintaining liability for the simple excessiveness even of fully 1 Jones v. Harris Assocs. L.P. (Jones I), 527 F.3d 627 (7th Cir. 2008), reh’g denied, (Jones II)
537 F.3d 728, 729 (7th Cir. 2008) (Posner, J., dissenting), vacated and remanded, (Jones III) 130
S. Ct. 1418 (2010).

Curtis and Morley
4
disclosed fees. The Supreme Court sided with Posner and maintained the status quo in the
circuit courts, allowing liability even for fully disclosed fees.
Excessive fee liability gained still further prominence in September of 2010 when
the SEC announced a new initiative to investigate excessive mutual fund fees under
section 36(b) (Volz 2010). The SEC has never before used its authority under the statute.
Excessive fee litigation can also provide a unique perspective on securities class
action and corporate derivative litigation generally. The study of these forms of litigation
has long been animated by questions about whether the merits of these lawsuits matter in
determining which defendants are targeted and how cases are resolved, or whether
defendants simply pay settlements in order to avoid the expense and risk of litigation
irrespective of the defendants’ actual liability. A major obstacle to discerning whether the
merits matter in these suits is that the merits are generally very hard to perceive. In a
conventional securities class action, for example, it is impossible to say for sure whether
potential and actual defendants actually committed fraud, because fraud is extremely
difficult to perceive objectively.
By contrast, the merits of excessive fee lawsuits are uniquely easy to perceive.
We can directly observe the central facts in fee lawsuits by using the Center for Research
in Securities Prices’ (CRSP) mutual fund database. The database includes all fees in the
entire universe of mutual funds as well as a number of other useful data points. To be
sure, the application of the law to these facts is frequently uncertain due to the vagueness
of the applicable legal standard. However, our ability at least to perceive the facts with
clarity makes it easy to compare how the law treats cases with similar merits.

Curtis and Morley
5
Although no excessive fee suit has ever produced a verdict for plaintiffs,
excessive fee liability has broad practical significance for the mutual fund industry and its
$12 trillion in assets. Our dataset shows that about a quarter of all funds in existence
since 2000 have been affected by at least one excessive fee suit in that time. These suits
are costly to defend and settlements are not uncommon. The threat of excessive fee
litigation therefore casts a long shadow over the mutual fund industry. Practitioners
widely believe that the desire to avoid fee liability has pushed mutual fund boards and
managers to adopt a variety of costly governance rituals. Many of these rituals are useful
as evidence in litigation, but their intrinsic value to investors has been questioned
(Sterngold 2012, Morley and Curtis 2010, Spatt 2006).
2. Institutional Background
2.1 Standard for Liability
Mutual funds are typically operated by external organizations known as
“advisers” or “managers,” such as Fidelity, Goldman Sachs, or Vanguard. These advisers
became subject to excessive fee liability in 1970, when Congress added section 36(b) to
the ICA. In relevant part, section 36(b) reads:
[T]he investment adviser of a registered investment company shall be deemed to
have a fiduciary duty with respect to the receipt of compensation for services, or
of payments of a material nature, paid by such registered investment company, or
by the security holders thereof, to such investment adviser or any affiliated person
of such investment adviser….
Section 36(b) by its terms says very little about what exactly advisers’ “fiduciary duty”
with respect to fees entails. In 1982, the Second Circuit Court of Appeals addressed this

Curtis and Morley
6
problem by adopting an interpretive standard in Gartenberg v. Merrill Lynch Asset
Management, Inc., 694 F.2d 923, 928 (2d Cir. 1982):
[T]he test is essentially whether the fee schedule represents a charge within the
range of what would have been negotiated at arm's-length in light of all of the
surrounding circumstances .... To be guilty of a violation of § 36(b), ... the adviser
must charge a fee that is so disproportionately large that it bears no reasonable
relationship to the services rendered and could not have been the product of arm's
length bargaining.
Subsequent opinions interpreted Gartenberg as having identified six factors that structure
the analysis of the main standard in the preceding quotation (Krinsk v. Fund Asset Mgmt.,
Inc., 875 F.2d 404, 409 (2d Cir. 1989):
(a) the nature and quality of services provided to fund shareholders; (b) the
profitability of the fund to the adviser-manager; (c) fall-out benefits; (d)
economies of scale; (e) comparative fee structures; and (f) the independence and
conscientiousness of the trustees.2
Gartenberg made it clear that even advisers who charge fees below the rates prevailing
among similar funds may be subject to liability. The court stated that “[r]eliance on
prevailing industry advisory fees” by itself “will not satisfy § 36(b)” (Gartenberg v. Merrill
Lynch, 694 F.2d 923, 929 2d Cir. 1982).
The Gartenberg standard was widely accepted until 2009, when Judge Frank
Easterbrook of the Seventh Circuit expressly rejected the standard in Jones v. Harris
Associates L.P. Easterbrook replaced Gartenberg with a standard that would have
2 “Fall-out benefits” refer to benefits advisers receive indirectly from managing a fund, such as
increases in the amount of brokerage or private financial counseling business that an adviser
might gain as a result of its work with a fund.

Curtis and Morley
7
allowed liability only in cases involving fraud or misconduct.3 In a dissent from a denial
of rehearing en banc, Judge Richard Posner heavily criticized Easterbrook’s standard and
advocated maintaining the Gartenberg standard.4 In March 2010, the Supreme Court
vacated Easterbrook’s decision and expressly adopted the Gartenberg standard.5
2.2 Unique Procedural Characteristics
Section 36(b) offers plaintiffs’ lawyers two procedural advantages relative to
conventional class and derivative actions. First, plaintiffs’ lawyers can bring a suit on
behalf of all shareholders in a fund without having to obtain class certification or to make
demand on a fund’s board. Section 36(b) allows suits to be brought on behalf of funds,
but not on behalf of fund investors. Section 36(b) suits thus cannot be maintained as class
actions and are similar in function to derivative suits.6 The U.S. Supreme Court has held,
however, that unlike conventional derivative suits, section 36(b) suits are not subject to
state laws that require shareholders to demand that boards of directors pursue the suits
before the shareholders are allowed to do so.7
3 Judge Easterbrook said, “[a] fiduciary duty differs from rate regulation. A fiduciary must make
full disclosure and play no tricks but is not subject to a cap on compensation.” Jones I, 527 F.3d,
at 632.
4 Jones’ primary innovation over Gartenberg was to resolve disagreement among the circuit
courts about the admissibility of evidence relating to differences between an adviser’s fees for its
retail and institutional clients. After Jones, such evidence is clearly admissible. Jones II, 537
F.3d, at 729.
5 Jones III, 130 S. Ct. at 1429.
6 Note, however, that section 36(b) claims may be pled alongside other claims that are pled as
class actions.
7 The basic theory is that because section 36(b) suits may be initiated only by shareholders or by
the SEC, the funds themselves have no authority to pursue the suits and so boards have no say
Curtis and Morley
8
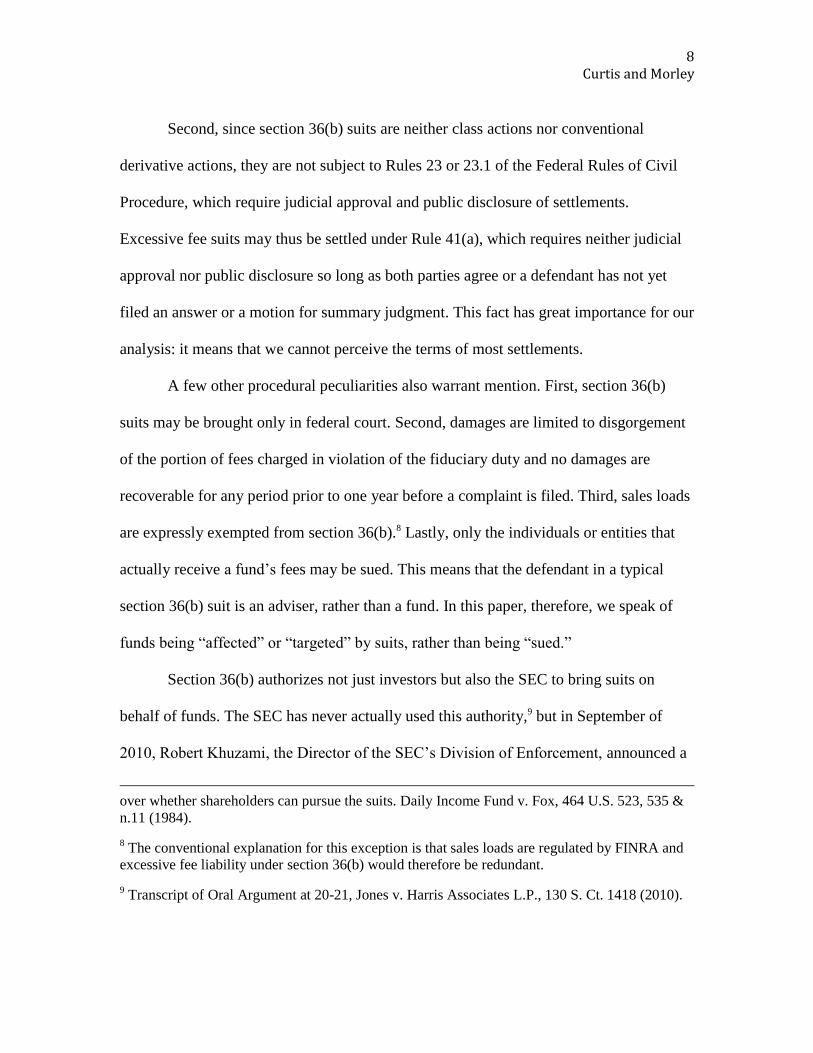
Second, since section 36(b) suits are neither class actions nor conventional
derivative actions, they are not subject to Rules 23 or 23.1 of the Federal Rules of Civil
Procedure, which require judicial approval and public disclosure of settlements.
Excessive fee suits may thus be settled under Rule 41(a), which requires neither judicial
approval nor public disclosure so long as both parties agree or a defendant has not yet
filed an answer or a motion for summary judgment. This fact has great importance for our
analysis: it means that we cannot perceive the terms of most settlements.
A few other procedural peculiarities also warrant mention. First, section 36(b)
suits may be brought only in federal court. Second, damages are limited to disgorgement
of the portion of fees charged in violation of the fiduciary duty and no damages are
recoverable for any period prior to one year before a complaint is filed. Third, sales loads
are expressly exempted from section 36(b).8 Lastly, only the individuals or entities that
actually receive a fund’s fees may be sued. This means that the defendant in a typical
section 36(b) suit is an adviser, rather than a fund. In this paper, therefore, we speak of
funds being “affected” or “targeted” by suits, rather than being “sued.”
Section 36(b) authorizes not just investors but also the SEC to bring suits on
behalf of funds. The SEC has never actually used this authority,9 but in September of
2010, Robert Khuzami, the Director of the SEC’s Division of Enforcement, announced a
over whether shareholders can pursue the suits. Daily Income Fund v. Fox, 464 U.S. 523, 535 &
n.11 (1984).
8 The conventional explanation for this exception is that sales loads are regulated by FINRA and
excessive fee liability under section 36(b) would therefore be redundant.
9 Transcript of Oral Argument at 20-21, Jones v. Harris Associates L.P., 130 S. Ct. 1418 (2010).
Curtis and Morley
9
Mutual Fund Fee Initiative, which is expected to result in examinations of mutual fund
investment advisers concerning their duties under section 36(b) (Volz 2010).
3. Literature Review
Empirical evidence on the functioning of section 36(b) is limited. In a brief study,
Coates (2010) collected a sample of 13 excessive fee suits and graphically plotted the
unadjusted fees and size of the funds affected by these suits against those of unaffected
funds. Johnson (2008) analyzed procedural characteristics of 150 published judicial
opinions that have cited Gartenberg, but did not attempt to identify the individual funds
subject to these suits or to study their characteristics. Henderson (2010) attempted a
rough estimate of the costs of excessive fee litigation based on conversations with
practitioners and the number of published opinions that have cited Gartenberg.
The dearth of empirical evidence has left an important analytical gap. In the
absence of data on the actual functioning of excessive fee liability, debate has focused
almost entirely on the problem this liability is intended to solve, rather than on the value
of this liability as a solution to that problem. In other words, the debate has centered on
whether the mutual fund fees are excessive, rather than on whether liability is the right
way to address fee excessiveness. (Freeman & Brown 2000, Coates and Hubbard 2007,
Birdthistle 2009, Hubbard, et al. 2010).10
10
Several amicus briefs in the Jones case dealt with the issue similarly. Brief for Birdthistle, et al.
as Amici Curiae Supporting Petitioners, Jones v. Harris Associates, 130 U.S. 1418 (2010) (No.
08-586), 2009 WL 1681458; Brief for Cohen, et al. as Amici Curiae Supporting Respondent,
Jones v. Harris Associates, 130 U.S. 1418 (2010) (No. 08-586), 2009 WL 2896315; Brief for
Litan, et al. as Amici Curiae Supporting Petitioners, Jones v. Harris Associates, 130 U.S. 1418
(2010) (No. 08-586), 2009 WL 1759017.

Curtis and Morley
10
For summaries of the large empirical literature on whether the merits matter in
securities class actions and corporate derivative litigation, we refer readers to Cox and
Thomas (2009) and Choi (2004). Our sense of this literature is that although a few studies
have suggested that the relationship between merits and outcomes is weak (Alexander
1991), there appears to be a growing consensus that the relationship is reasonably strong.
What most interests us, however, is that this literature consistently confronts a set
of serious methodological difficulties. The trouble is that the merits of securities class
action and corporate derivative suits are very difficult to perceive. The fraud and other
wrongful acts that sit at the heart of most of these suits are hard to see and hard to
measure. Researchers have therefore relied on a number of proxies for these suits’ merits
that are admirable but ultimately imperfect.
Thompson and Thomas (2004), for example, studied settlements in class actions
alleging director misconduct in corporate acquisitions. Since Thompson and Thomas
could not perceive whether the alleged misconduct actually occurred, they instead
proxied for this misconduct by studying the differences between acquirers’ initial offer
prices and the prices the acquirers ultimately paid to non-settling shareholders to
complete the transactions. Similarly, Cox, Thomas and Bai (2008) examined a set of class
actions filed between 1993 and 2005 and proxied for these suits’ merits by including
measures of provable losses, whether the SEC brought enforcement actions, defendant
companies’ total assets, and the length of class periods. Choi (2006) and Johnson, et al.
(2007) likewise use accounting restatements, evidence of insider selling and SEC
enforcement actions.

Curtis and Morley
11
We are aware of only one other attempt to study litigation specifically against
mutual fund advisers. Choi and Kahan (2007) studied the market-timing and late-trading
scandals of 2003 and 2004 and their effect on asset flows and investors’ willingness to
invest in funds involved in the scandals.
4. Data
4.1 General Description
Our data consist of a hand-collected set of 91 distinct excessive fee cases filed
between the beginning of 2000 and the end of 2009 against advisers of open-end mutual
funds.11 We collected the data from complaints and other filings available in PACER, a
fee-based online indexing system for federal court filings. We included in our dataset
only cases that met the following criteria: (1) either the initial complaint or a consolidated
or amended complaint alleged a violation of section 36(b) of the ICA; (2) the complaint
did not allege market-timing or late-trading activities; and (3) the initial complaint was
filed on or after January 1, 2000. We imposed criterion (2) because although many of the
numerous lawsuits that grew out of the market-timing and late-trading scandals of 2004
alleged violations of section 36(b), their allegations primarily concerned fraud and
misconduct, rather than fee levels. We imposed criterion (3) because few cases initiated
prior to January 1, 2000 had docket sheets with electronic documents on PACER.
We identified section 36(b) cases by first searching the databases of federal
complaints in Westlaw, LexisNexis and Bloomberg Law for the phrases “investment
11
We treat each group of consolidated lawsuits as a single case and take the relevant dates from
the lead case (which was almost always the first case filed).

Curtis and Morley
12
company” and “36(b).” We also searched Westlaw’s “allfeds” database, which includes
judicial opinions and briefs (as distinct from complaints). We found further cases in a
memo prepared by attorneys at Milbank, Tweed, Hadley & McCloy LLP, which
summarized recent litigation involving mutual funds and their advisers (Benedict, et al.
2008). Milbank has a leading mutual fund adviser defense practice, and it publishes the
memo annually through the Practicing Law Institute. We also consulted with several
experienced mutual fund litigators, who confirmed that we found all or substantially all
excessive fee complaints during our study period.
We obtained data on returns, total net assets, family affiliations, fees, and
investing styles from the Center for Research in Securities Prices’ (CRSP) mutual fund
database. To match the CRSP dataset to our hand-collected dataset, we manually
searched the CRSP fund header and historical fund header tables for the names of funds
that were listed in each complaint and were in existence on the date of the complaint.
Although 56 of our 91 cases were settled or voluntarily dismissed by the
plaintiffs, we were able to perceive details of these settlements in only five cases. The
reason, as described above, is that settlements in section 36(b) cases are not subject to the
same judicial approval and public disclosure requirements as settlements in most class
action and derivative suits.
4.2 Summary Description of Section 36(b) Litigation
The Jones v. Harris Associates case revealed that there is very little publicly
available evidence about even very basic characteristics of section 36(b) litigation,

Curtis and Morley
13
including the number and nature of suits. One of our primary contributions is therefore
simply to provide a basic description of this litigation.
Most of the cases in our dataset belonged to distinct clusters of suits. Each cluster
tended to initiate with a single core set of plaintiffs’ lawyers (with assorted local co-
counsel), and to adopt the same theories of liability in standard-form complaints. The
complaints in each cluster tended to be filed within a few days or months of each other.
During our study period no group of plaintiffs’ lawyers had substantial involvement in
more than one cluster of suits.
The most interesting cluster involved a set of 12 complaints filed by two South
Carolina plaintiffs’ law firms, Johnson Pope Bokor Ruppel & Burns and Richard Patrick
Westbrook & Brickman, and their co-counsel. Eleven of these cases were filed between
March 2004 and April 2005. The Jones case that reached the Supreme Court was part of
this group of suits. We have characterized these and several other unrelated cases as
“pure excessive fee” cases because they included no factual allegations that had the
flavor of fraud, deceit or other operational failing; the complaints argued only that the
fees in the relevant funds were excessive. In addition to the 12 cases brought by the South
Carolina firms, there were 13 other “pure excessive fee” cases, most of which were
among the few cases in our dataset that did not originate in clusters.
Another important cluster involved what we call “brokerage kickback”
allegations. This cluster contained 25 cases, nearly all of which were filed between
January and August of 2004 by Milberg LLP, the well-known securities class action law
firm, and various co-counsel. The cases generally claimed that the defendant adviser

Curtis and Morley
14
firms improperly rewarded brokers for selling funds shares, but these cases also alleged
that the funds’ fees were excessive.
Another group of 31 complaints originated with the law firms of Baron and Budd
PC and Cauley Bowman Carney & Williams PLLC and alleged that several different
advisers acted negligently by failing to make their funds participate in class action
settlements paid by the funds’ portfolio companies. These cases alleged violations of
section 36(b), but did not expressly allege that the funds’ fees were excessive.
Another six cases sued the advisers of funds that charged Rule 12b-1 fees after the
funds had stopped selling shares to new investors. Rule 12b-1 fees may be charged only
to pay for marketing and distribution expenses. These cases also alleged that the funds’
fees were excessive.
Institutional investors did not meaningfully participate as plaintiffs in any of the
cases in our dataset. This is consistent with the argument we have made elsewhere
(Morley and Curtis 2010) that large and sophisticated mutual fund shareholders will not
actively participate in excessive fee cases, because they will always prefer instead simply
to redeem and invest elsewhere.
< Table 1 >
Table 1 presents summary statistics and indicates that most lawsuits affected all or
most of a defendant adviser’s funds simultaneously. Because some of the 91 suits in our
dataset affected more than one family, the 91 suits collectively affected at least one fund
in a family on 116 separate occasions. In 57 of the 116 instances in which a family was
affected, the complaints named every fund in the family. Across all instances, the average

Curtis and Morley
15
portion of a family’s funds named in each lawsuit was 69%. As we explain below, the
suits that singled out funds within families tended to be those that alleged excessive fees.
4.3 Variables and Summary Statistics
We construct a dataset in which each fund is observed quarterly. The unbalanced
panel includes all open-end funds in the CRSP database with populated Lipper Objective
Code fields and Management Company Identifiers beginning January 1, 2000 and ending
December 31, 2009. The CRSP database maintains separate observations for each share
class in a fund. Since none of the complaints in our dataset specified which individual
share classes they targeted, the smallest unit of observation in our study is a fund. We
compute fund characteristics other than size, including returns and fees, as the size-
weighted mean of share class characteristics. We use fund names to identify share classes
within funds, since many funds do not report a Portfolio Identifier in CRSP. Table 1
presents summary statistics for the fund-quarter observations in the panel.
A fund is identified in a quarter as a suit observation if a section 36(b) complaint
was filed against the fund during the quarter. We construct a dummy variable that takes
the value 1 if the observation is a suit observation and 0 otherwise. The Fund Size
variable is the average total net assets of all of a mutual fund's share classes during a
quarter. Family Size is the total Fund Size of all funds with the same Management Code
in the same quarter minus the Fund Size of the observed fund. Annual Return is the
cumulative return over the four quarters prior to the observation. Style-Demeaned Return
is the Annual Return minus the mean Annual Return of all funds in the same investing
style as the observed fund on the observed date.

Curtis and Morley
16
We adjust for investing style in calculations of returns and fees, because fees and
risk/return profiles may vary systematically by investing style. A fund that invests in
small foreign companies, for example, is likely to have higher research and trade
execution costs than an S&P 500 index fund and is also likely to be riskier. Data on
investing styles come from the CRSP Lipper Objective Codes field. The Lipper Objective
Codes are alphanumeric identifiers that correspond to 166 distinct investing style
categories. The categories include, for example, S&P 500 index funds, Tennessee
municipal debt funds, utility funds, mid-cap growth funds, and so on. Because the Lipper
codes categorize index funds with other index funds that use the same index, we do not
include a separate variable for index funds in any of our analyses. The Lipper Objective
Codes are widely used in mutual fund econometrics to control for investing style.12
The main variable of interest for our study is a fund’s expense ratio. Expense ratio
reflects almost all of a fund’s material expenses. It is important to include almost all types
of expenses, because section 36(b) by its terms applies to any and all “payments of a
material nature” made by a fund. The only fees we exclude are load fees, which are one-
time charges that advisers assess at the time investors initially buy or redeem their shares.
The proceeds of these fees are often used to pay sales commissions and other distribution
expenses. We exclude these fees because section 36(b)(4) of the ICA expressly excludes
them from the section 36(b) fiduciary duty. Congress’ rationale for exempting these fees
12
Researchers also occasionally use subtler methods, but unfortunately we cannot use those
methods here. We cannot restrict the sample to domestic equity funds or classify based on factor
loadings and other returns measures that have been developed for equity funds (Sharpe 1992;
Brown and Goetzmann 1997; Chan, et al. 2002), because excessive fee suits target funds in all
investing styles, including bond funds.

Curtis and Morley
17
was probably that at the time section 36(b) was added to the ICA in 1970, the NASD
already regulated load fees through its rules on sales commissions.
The value of the “Unadjusted Expense Ratio” variable in our dataset for each
quarter is the mean of CRSP-reported expense ratios (minus load fees) over the four
quarters prior to the quarter of an observation.13 We average the variable over the four
quarters prior to an observation to be consistent with section 36(b)(3), which allows
recovery of fees paid after the date one year prior to the commencement of a suit and not
before. Excluding the current quarter also addresses the possibility that the filing of a suit
endogenously affected funds’ expense ratios in the quarters in which the suits were filed.
We also calculate three modified expense ratio measures that adjust for potential
systematic differences in fees across funds in different investing styles. We call the first
of these measures “Style-Demeaned Expense Ratio.” We calculate this variable by
subtracting from each observation’s Unadjusted Expense Ratio the mean expense ratio
among all funds in the same investing style on the same date.
The second expense ratio measure we call Expense Quantile. We rank all of the
funds in a given investing style on each date and assign each fund a number between 0
and 1 equal to the fraction of funds in the same investing style on the same date that
charged lower fees than the observed fund. Expense Quantile prevents us from
overweighting styles in which expenses vary greatly by expressing fees in a manner that
is unrelated to the variance of an investing style’s expense ratio distribution. 13
For a given date the CRSP database gives the expense ratio for the most recently completed
fiscal year. We date-shift this data to obtain the expense ratio that was actually charged in each
quarter and then take this value as an input in our rolling average.

Curtis and Morley
18
The third expense ratio measure we call Unexplained Expense Ratio. We
calculate this by first pooling our sample of fund-quarter observations and using ordinary
least squares to regress Unadjusted Expense Ratio on Fund Size, Family Size, Style-
Demeaned Returns, a variable that indicates the percentage of the fund’s net assets held
in institutional share classes, and a dummy variable that flags funds that had share classes
with a 12b-1 fee in excess of 0.25%. We include the 12b-1 fee dummy because many
funds use the revenue generated by 12b-1 fees to compensate brokers who provide
potentially useful ancillary services such as financial advice (Bergstresser, et al. 2009).14
We also include date and style dummies. We use the coefficients from this regression to
calculate a predicted expense ratio for each fund-quarter observation. We next calculate
the differences between the actual expense ratios and the predicted expense ratios for
each observation—i.e., the residuals—and average them over the four quarters prior to
the current quarter to obtain the Unexplained Expense Ratio. This variable is similar in
concept to excess compensation measures that are often used in studies of executive
compensation (e.g., Core, Holthausen and Larcker 2010).
We separately report some of our results for the full set of cases and also for two
subsets of cases. The first subset, which we term “Fee Allegation cases,” includes only
cases that alleged that the targeted funds’ fees were excessive and excludes cases that
alleged a violation of section 36(b) but did not allege that fees were excessive. This
14
We use 0.25% as the cutoff for 12b-1 fees, because this cut-off is well above the mean 12b-1
fees in funds that do not use brokers (Bergstresser, et al. 2009) and because the SEC uses 0.25%
as the dividing line to differentiate funds that can advertise themselves as “no-load” funds from
funds that cannot.

Curtis and Morley
19
subset thus includes the “pure excessive fee” cases, the brokerage kickback cases, and the
cases that alleged improper charging of 12b-1 fees, but excludes the cases that alleged
failures to participate in class actions and the remaining miscellaneous cases. A second
subset, which we call “Pure Excessive Fee cases,” is a nested subset of the Fee Allegation
cases and includes just the cases that alleged only that a fund’s fees were excessive and
did not allege fraud or other wrongdoing.
Notably, there was a close correlation between whether a case alleged excessive
fees and whether it selectively targeted individual funds within a family (rather than
targeting the entire family). Almost all of the suits that contained excessive fee
allegations—more than 90%—selectively targeted individual funds, while the great
majority of suits that contained no fee allegations—about 75%—targeted entire families.
5. What is an “Excessive” Fee?
It is not clear what exactly makes a fee “excessive.” Section 36(b) by its terms
speaks only of a “fiduciary duty” and says nothing about excessiveness. And the only
reference points for excessiveness in the Gartenberg/Jones standard are the hypothetical
“arm’s length bargain” that a truly independent board might have obtained and the
“reasonable relationship” that fees must bear to the value of the “services rendered.”
Since we cannot say what the content of a hypothetical arm’s length bargain
should have been for any given fund or what exactly makes a fee “reasonable,” our
analysis can only be comparative, rather than absolute. Instead of asking whether funds
that charged excessive fees were targeted by excessive fee suits, we can ask only whether

Curtis and Morley
20
funds with relatively high fees were more likely to be targeted than comparable funds
with relatively low fees.
A related complication is that there are at least two different ways of
conceptualizing how fees ought to be compared. One way is to focus on advisers’
profitability. Under this way of thinking, a fee might be excessive if it generates revenue
for an adviser that greatly exceeds the adviser’s costs of running the fund. This approach
implies, for example, that a small adviser with no economies of scale could freely charge
higher fees than larger advisers if its expenses were higher than those of larger advisers.
The Unexplained Expense Ratio measure addresses this adviser-centered way of
thinking. Unexplained Expense Ratio constructs a simple model to predict an adviser’s
costs and then assesses whether a fund’s fees are higher than the model would predict.
Another way of thinking about fee excessiveness focuses instead on investors and
what they would have to pay for comparable services. The logic is that investors care
about fees, not about advisers’ profits. Given two funds that provide similar risks and
returns, investors should always prefer the fund with the lowest fees, regardless of which
fund’s advisers are more profitable. Under this investor-centered way of thinking, if an
adviser charges higher fees than advisers of comparable funds, the adviser may run afoul
of section 36(b) even if its costs are also high. The Expense Quantile and Style-
Demeaned Expense Ratio measures address this way of thinking. These measures simply
compare funds that provide similar services and do not consider an adviser’s costs or
profitability.

Curtis and Morley
21
The Gartenberg/Jones standard is ambivalent about these two ways of thinking
about fees. The “reasonable relationship” and “arm’s-length bargain” tests say nothing
about this distinction, and the six factors that supplement these tests suggest both an
interest in the investor-centered way of thinking (one of the factors is the fees charged by
other funds providing similar services) and in the adviser-centered way of thinking
(another factor is the profitability of the adviser).
6. Results
6.1 Targeting of Funds
We first examine the relationship between various fund and family characteristics
and the probability that a fund or family was affected by a lawsuit. Intuition suggests that
a number of characteristics might be related to the odds that a fund would become the
target of an excessive fee suit. Obviously, one possible predictor is fees. Another is
returns, because the Gartenberg/Jones standard assesses the reasonableness of fees in
“relationship to the services rendered.”
Another possible predictor is the size of funds and families. Plaintiffs’ lawyers
might disproportionately target larger funds and larger families for several reasons. Most
obviously, plaintiffs’ lawyers might simply seek deep pockets. Similarly, plaintiffs’
lawyers’ might sometimes receive percentages of total recoveries and might therefore
seek the largest recoveries by suing advisers who manage the largest amounts of assets
and thus charge the greatest total advisory fees. Perhaps less cynically, one might think
that well-meaning plaintiffs’ lawyers are attuned to the fact that large funds and families,
by virtue of their size, can potentially inflict the greatest harm on investors. Assuming

Curtis and Morley
22
plaintiffs’ lawyer can only pursue a limited number of suits, they might reasonably target
the largest advisers to achieve the greatest social good.
< Figure 1 >
Figures 1 and 2 present basic evidence on the relationships between fees and size
and the probability that a fund would become the target of an excessive fee suit. Figure 1
presents density histograms that compare fund-quarter observations affected by suits to
fund-quarter observations not affected by suits. Figure 1a compares Style-Demeaned
Expense Ratios in observations in which a lawsuit was filed to all other observations and
suggests that affected funds look substantially similar to unaffected funds. Figure 1b
compares the natural logarithms of Fund Size in affected and unaffected funds and
suggests strongly that affected funds are larger than unaffected funds. Figure 1c compares
log Family Size in affected families and unaffected families. We classify a family as
having been affected by a lawsuit if any of its funds were affected during the quarter.
Figure 1c suggests that the families of affected funds are on average much larger than the
families of unaffected funds.
< Figure 2 >
Figure 2 sorts fund-quarter observations by decile and shows graphs in which the
percentage of fund-quarter observations affected by suits appears on the vertical axis and
Unexplained Expense Ratio and Family Size appear on the horizontal axes. Figure 2a
exhibits a clearly discernible upward trend in targeting as Unexplained Expense Ratio
increases. This trend is gradual, however, and the percentage of funds targeted does not
increase substantially at the high end of the fee distribution. Note also that a substantial

Curtis and Morley
23
percentage of funds in the middle and low end of the distribution were targeted. Figure 2b
shows a powerful relationship between family size and targeting, and it shows that funds
in the bottom three deciles of Family Size were almost never affected by suits.
< Table 2 >
Table 2 presents the differences in means for the variables of interest between
fund-suit observations in which a lawsuit occurred and fund-suit observations in which a
lawsuit did not occur. We implement these comparisons as pooled OLS regressions of the
variables of interest on the lawsuit indicator variable and date dummies. The regression
model is:
.
We use OLS rather than a simple t-test for means comparisons to facilitate the inclusion
of the date and style dummies. Because suits tend to target many funds in the same
family, we cluster standard errors at the family level. For ease of interpretation, expense
ratio variables are coded as percentages, rather than decimals. We implement the
comparisons at the fund level and also at the family level by calculating family-level
variables as the size-weighted averages of the fund-level variables for the funds in each
family.
These comparisons show that targeted funds tended to be significantly larger and
to come from larger families than funds that were not targeted and that targeted families
were also larger. In the fund-level regression, the greater significance of Unexplained
Expense Ratio is most likely a result of the fact that Unexplained Expense Ratio
implicitly controls for family size, while the other fee variables do not. Similarly, in the

Curtis and Morley
24
family-level analysis, most of the expense ratio variables are significantly negative; only
the Unexplained Expense Ratio variable is significantly positive. This is consistent with
Figures 1-2, which suggests that small families are rarely targeted by excessive fee suits.
Thus, the only family-level fee variable that is positive is the one that adjusts for family
size.
To get a more precise picture of which factors were related to the likelihood that a
fund would become a target of an excessive fee suit, we run a series of pooled logit
regressions. Table 3 presents the results. The dependent variable in the Table 3
regressions is an indicator of lawsuits that included a fee allegation. We ignore suits that
did not allege fee excessiveness, since we do not expect fees significantly to predict the
incidence of such suits. All regressions include date dummies and cluster standard errors
at the family level. Results in Table 3 are reported as odds ratios.
< Table 3 >
Table 3 Panel A presents regressions in which the unit of observation is a fund. In
regressions that include controls for the natural logs of Fund Size and Family Size as well
as Style-Demeaned Returns, all three adjusted expense ratio variables are significant
positive predictors of whether a fund was affected by a suit. Returns and Fund Size are
generally not significant, but—consistent with Figure 1—Family Size is significant. The
regressions provide strong evidence that Family Size mattered even apart from its
possible correlation with fees, since fees are included as controls.
Table 3 Panel B attempts to model more subtly the relationship between expense
ratios and the incidence of excessive fee suits that is depicted in Figure 2. Panel B sorts

Curtis and Morley
25
the Expense Quantile and Unexplained Expense Ratio variables into deciles and assigns
dummy indicator variables to all but the bottom decile. The results mostly confirm the
relationship evident in Figure 2. The probability that a fund would be affected by a suit
increases gradually in a linear fashion through most of the expense ratio distribution and
levels off at the high end, declining in the highest decile.
We present p-values for a test of the difference between the coefficient for the
highest expense ratio decile in each regression and the coefficients for the other deciles.
These values measure how much a fund advisor would need to change its fees to obtain a
statistically significant decrease in the likelihood of a lawsuit. Notably, for the
Unexplained Expense Ratio model, we find no statistically significant difference in
lawsuit incidence between even the highest and lowest deciles of fees.
Since many lawsuits targeted entire families, Table 3 Panel C treats families as
the units of observation, rather than funds. The dependent variable takes the value 1 on an
observation date if a suit targeted all of the funds in the observed family on that date
(note that this excludes cases that singled out individual funds within the targeted
families). The independent variables are the size-weighted average values for all funds in
a family on the observation date. Panel C confirms the basic results in Panels A and B:
expense ratios and family size mattered, but returns did not.
We also separately test the effect of average Unexplained Expense Ratios for the
most expensive 25% and 10% of each family’s funds, on the theory that plaintiffs’
lawyers might be drawn to a family by its highest-fee funds, and might target other funds
in the family simply to increase the suits’ importance. The coefficients on Unexplained

Curtis and Morley
26
Expense Ratio for these particularly high-fee funds in models 4 and 5 are higher than the
coefficients for the simple family-wide average in model 2. The difference is slight,
however, and is oddly somewhat less pronounced in the top 10% than in the top 25%.
< Table 4 >
Table 4 compares targeted and untargeted funds within the families in which
some funds, but not all, were targeted. We identified 116 instances in which at least one
fund was targeted by a lawsuit. This number exceeds the total number of suits, because
some suits targeted more than one family. In 57 of these 116 instances, the lawsuits
affected every fund in the family. In the remaining 59 instances, the lawsuits affected
only a subset of funds in the family. For the 59 partially affected families, Table 4 reports
the differences in means between the affected and unaffected funds in the same family.
The means of all three of our adjusted expense ratio variables are significantly higher in
affected funds than in unaffected funds. This evidence is consistent with the idea that
plaintiffs’ lawyers actively target funds with higher fees, conditional on targeting a subset
of funds within a family.
Next, we test whether funds’ susceptibility to fee lawsuits is influenced by the
composition of their boards of directors, since one of the Gartenberg test’s six factors is
the board’s independence. Because the CRSP mutual funds database does not include
data about mutual fund directors, we collected this data by hand from Statements of
Additional Information filed by funds on the SEC’s EDGAR web site. The difficulty of
collecting this data by hand prevented us from doing it for every fund in our population,
and we thus used propensity-score matching to construct a paired sample of targeted and

Curtis and Morley
27
untargeted funds whose non-governance characteristics suggested that they would be
similarly susceptible to fee lawsuits (Rosenbaum and Rubin, 1985).15 We obtained board
composition data for 202 propensity-matched pairs. For targeted and untargeted funds,
we compared the percentage of independent directors and whether the chairperson was
independent. Surprisingly, targeted funds had significantly more independent directors—
81% as compared with 75% for untargeted funds. A Wilcoxian signed-rank test gives a z-
statistic of 4.812 on this difference. Using McNemar’s test we find no significant
difference in the likelihood that the chairperson is independent (p-value = 0.1843).
We caution that although the relationship between fees and the filing of excessive
fee suits appears to be somewhat modest, our results do not necessarily rule out a very
strong relationship. It is possible that the reason we observe a modest relationship is that
excessive fee suits are so powerfully related to excessive fees that the threat of these suits
has actually greatly reduced the frequency of excessive fees.16
This possibility seems unlikely, however. Section 36(b) is designed only to
provide compensation, not deterrence. The only penalty under the statute is disgorgement
of the excessive portion of an adviser’s fees. An adviser therefore has little reason to
reduce its fees in anticipation of a lawsuit. If it charges extra fees and then loses a suit,
15
We implement the propensity score match by first estimating the following logit regression for our entire
population of funds:
Using the betas from this model, we then construct a propensity score as the predicted probability that each
fund observation would be a lawsuit observation. We match each fund that was affected by a lawsuit with
the unaffected fund in the same style and quarter that had the closest propensity score. 16
Hanley and Hoberg (2012), for example, find that the threat of litigation causes IPO issuers and
underwriters to reduce litigation risk by underpricing and strategically disclosing information.

Curtis and Morley
28
the only direct consequence is that the adviser has to give the extra fees back. It thus
seems unlikely that the threat of section 36(b) liability has so thoroughly deterred
excessive fees that we would be unable to observe a truly powerful relationship between
fees and the filing of excessive fee suits if such a relationship actually existed.
Note that we have chosen not to address the role of plaintiffs’ lawyers explicitly.
This is because law firms are not characteristics of funds, which are our units of
observation; rather, they are characteristics of cases. Thus, the only way to analyze the
effect of law firms would be to partition the population into different cases brought by
different law firms. There are too few cases to support such a partition for each firm, and
so we instead partition by type of case (i.e., Fee Allegation, Pure Excessive Fee, etc.).
This accomplishes something similar to partitioning by law firm, since law firms tended
to be involved in only one type of case.
6.2 Case Outcomes
We also test whether fee levels were related to case outcomes. Table 5 presents
our statistical results. Since almost all lawsuits targeted multiple funds, the units of
observation in Table 5 are lawsuits. The expense ratio measures are thus the size-
weighted averages for all funds affected by each suit in the quarter of the suit’s filing or,
in the lower rows, the size-weighted averages of the top 25% and top 10% most
expensive funds.
< Table 5 >
Table 5 explores the relationships between fees and the outcomes of motions to
dismiss and fees and settlements. We identify unsuccessful motions to dismiss as those

Curtis and Morley
29
that were denied or granted only in part. Settlements are harder to identify. Under Rule
41(a) of the Federal Rules of Civil Procedure, settlements in section 36(b) cases do not
have to be disclosed or approved by judges. We therefore cannot perceive directly
whether most Rule 41(a) dismissals occurred because the defendants settled or because
the plaintiffs simply chose to abandon their claims. We attempt to proxy for the
occurrence of settlements by constructing an artificial measure. We coded a case as
having been settled if either (a) the case produced an observable settlement, or (b) the
case was voluntarily dismissed by the plaintiffs with prejudice. The logic behind
condition (b) is that plaintiffs would only dismiss with prejudice and give up their rights
to file again if they received some consideration in return. We exclude ongoing cases.
Our measures indicate that of the 78 cases in our population that had been
resolved, 27 were dismissed and 20 were settled. These rates of dismissal and settlement
suggest that excessive fee suits were somewhat less successful than ordinary securities
class action suits. Evidence in prior studies has shown that in ordinary securities class
actions, dismissals were apparently less common and settlements were apparently more
common than in excessive fee suits (Choi 2006; Johnson, et al. 2006). The dismissal and
settlement rates in excessive fee suits are roughly consistent with the rates found in a
recent study found of insurance class action lawsuits, however (Pace, et al. 2007).
Because the populations in these analyses are small, we avoid regressions in favor
of simpler methods. For each fee measure, Table 5 presents the difference in fees
between dismissed and non-dismissed cases and between settled and non-settled cases.
Broadly speaking, higher fees were associated with higher likelihoods of surviving

Curtis and Morley
30
motions to dismiss and higher likelihoods of settlement, which is consistent with the
notion that judges are processing these cases rationally.
We employ two tests of the statistical significance of the observed differences in
means. One is a simple two-sample t-test. The other is the Kolmogorov-Smirnov test,
which tests the equality of one-dimensional probability distributions. We include this test
because it is nonparametric. The tests show in general that dismissed cases had lower fees
than non-dismissed cases and settled cases had higher fees than unsettled cases, although
the differences were not statistically significant in most analyses. We caution that the lack
significance may be an artifact of the small sample size, and so readers should pay special
attention to the confidence intervals on the difference in means tests.
< Figure 3 >
Figure 3 presents evidence on case outcomes graphically. It shows a quantile-
quantile plot comparing the mean Style-Demeaned Expense Ratio in 300 quantiles of
targeted funds based on the outcomes of the cases that targeted them. To be clear, unlike
in Table 5, in Figure 3 the units of observation are funds and not lawsuits. This was
necessary to obtain enough observations to make the plot intelligible. The plots in both
Figures 3a and 3b stick very close to the 45-degree line, suggesting that fees were not
strongly related to case outcomes.
It may be useful to summarize the small handful of settlements that we were
actually able to perceive. For idiosyncratic procedural reasons, five cases produced

Curtis and Morley
31
settlements that we were able to perceive.17
Two of these were "brokerage kickback"
cases. In one, involving the Columbia funds, the defendant advisers agreed to introduce
breakpoint pricing for the funds, to disclose broker fee-sharing arrangements, and to
reduce soft dollar research expenditures. The defendants made no payments directly to
the funds, but the plaintiffs' attorneys received $450,000 plus expenses from the
defendants. In the other brokerage kickback case, involving the Wells Fargo funds, the
defendants paid $1.15 million into a settlement fund for people who purchased shares
during a specified period. The plaintiffs' attorneys received a quarter of that amount, or
$287,500, plus expenses.
Two of the remaining cases were a connected but unconsolidated pair of lawsuits
involving pure excessive fee claims against a set of ING funds. The defendants agreed to
settle both of these cases by paying $2 million to be divided among three funds. The
attorneys received a fee of $105,776 plus expenses, which the court calculated using a
modified lodestar method. The last settled case involved the Van Wagoner funds and
alleged that these funds valued their portfolio securities incorrectly. The defendants
agreed to add another independent director to the funds' boards and to involve the
independent directors more closely in valuations. The defendants made no payments to
the funds or plaintiffs, but paid the plaintiffs' attorneys $340,000 plus expenses.
6.3 Fee Changes in Targeted Funds
17
The main reason was that these cases included other claims in addition to section 36(b) claims,
and these other claims were subject to Rule 23 or 23.1 of the Federal Rules of Civil Procedure.

Curtis and Morley
32
We next examine how fees changed in funds that were targeted by section 36(b)
suits relative to other funds in the years after the suits were filed. Table 6 reports the
changes in expense ratios in funds targeted by section 36(b) suits. The population
includes only those funds that were affected by suits and for which data were
continuously available for 36 months after the filing of the suits’ initial complaints.
< Table 6 >
Because all of our expense ratio variables measure a fund’s expenses relative to
other funds in its investing style, a simple assessment of how these variables changed
over time in targeted funds has the effect of controlling for market-wide and style-wide
trends. The test compares the changes in targeted funds to the changes during the same
periods in comparable untargeted funds.
We separate Table 6 into two panels to facilitate the use of appropriate units of
observation. Panel A presents results for cases that affected only some of a family’s
funds. Since these cases affected only some funds in families, the unit of observation in
this panel is a fund. Panel B presents results for cases that affected every fund in a family,
and thus makes the unit of observation an entire family. Because Panel B performs the
analysis at the family level, we take the size-weighted average expense ratios for all
funds in the entire families, as well as the averages among the family’s most expensive
25% and 10% of funds.
In Panel A, all of the fee changes are positive, suggesting—contrary to
expectation—that funds targeted by excessive fee suits actually increased their fees
relative to comparable untargeted funds during the same periods. In Panel B, the family-

Curtis and Morley
33
wide average expenses increased, but expenses in the most expensive funds seem to have
declined. The decrease in the fees of particularly high-fee funds provides some
encouraging evidence that perhaps excessive fee suits helped to reduce at least the
highest fees in affected families. Of course, we should be cautious about inferring the
presence or absence of a causal relationship between lawsuits and fee changes, because
there is potentially a large bias in the selection of funds and families for lawsuits.
6.4 Asset Flows in Targeted Funds
We next examine the possibility that excessive fee suits inflict a kind of “market
penalty” on advisers by creating bad publicity and reducing investors’ willingness to
invest in the funds and pay advisers’ fees. Our methods for testing this hypothesis follow
closely the methods that Choi and Kahan (2007) used to investigate the effect of publicity
about market-timing and late-trading scandals on mutual fund asset flows.
<Table 7 >
Table 7 presents the results of an OLS regression that evaluates the changes in
asset flows in the year after an excessive fee suit is filed. In models 1 and 2, the unit of
observation is a fund, and in models 3 and 4, the unit of observation is a family.
Accordingly, in models 3 and 4 all variable values are the size-weighted averages for the
funds in each family. The dependent variable is the average of monthly fund flows during
the observed quarter, divided by the average flows for all funds in the same investing
style. The independent variable of interest, Suit Year, is an indicator that takes a positive
value if a fund or family was affected by a suit in the quarter of observation or the
preceding three quarters. In models 1 and 3, this variable indicates all suits in our dataset;

Curtis and Morley
34
in models 2 and 4 it indicates only “pure excessive fee” suits. The pure excessive fee
cases abstract from any effect that allegations other than excessive fee allegations might
have had on asset flows. We also include controls for properties of returns, fees, loads,
and asset flows to funds in the same investing style, as well as date fixed effects.
The signs on the Suit Year variable are inconsistent across models and are not
statistically significant. We therefore cannot discern a clear story about how excessive fee
suits might be related to asset flows. The low significance is, however, consistent with
our anecdotal impression that excessive fee suits received very little publicity.
7. Conclusions
The Jones case and the SEC’s decision to begin investigating excessive fees have
raised important questions: should the law impose liability only for fraud and misconduct
in the setting of fees, as Judge Easterbrook suggested in Jones, or should it continue
giving shareholders and the SEC the right to sue based simply on the excessiveness of
fees even when those fees have been fully and accurately disclosed? The data we present
should provide information to help answer these questions.

Curtis and Morley
35
REFERENCES
Alexander, Janet Cooper. 1991. “Do the Merits Matter? A Study of Settlements in
Securities Class Actions,” 43 Stanford Law Review 497-598.
Benedict, James N., Sean M. Murphy, C. Neil Gray, and Robert R. Miller. 2008. “Recent
Developments in Litigation Under the Investment Company Act of 1940,” 1667
Practicing Law Institute Corporate Law and Practice Course Handbook Series
761-958.
Birdthistle, William A. 2009. “Investment Indiscipline: A Behavioral Approach to
Mutual Fund Jurisprudence,” 2010 Illinois Law Review 61-108.
Choi, Stephen J. 2004. “The Evidence on Securities Class Actions,” 57 Vanderbilt Law
Review 1465-525.
Choi, Stephen J. 2006. “Do the Merits Matter Less After the Private Securities Litigation
Reform Act?” 23 Journal of Law, Economics, and Organization 598-626.
Choi, Stephen J., and Marcel Kahan. 2007. “The Market Penalty for Mutual Fund
Scandals,” 87 Boston University Law Review 1021-57.
Coates, John C. IV, and R. Glenn Hubbard. 2007. “Competition in the Mutual Fund
Industry: Evidence and Implications for Policy,” 33 Journal of Corporation Law
151-221.
Core, John E., Robert W. Holthausen, and David F. Larcker. 1999. “Corporate
Governance, Chief Executive Officer Compensation, and Firm Performance,” 51
Journal of Financial Economics 371-406.
Cox, James D., and Randall S. Thomas. 2006. “Does the Plaintiff Matter? An Empirical

Curtis and Morley
36
Analysis of Lead Plaintiffs in Securities Class Actions,” 106 Columbia Law Review
1587-1640.
Cox, James D., Randall S. Thomas, and Lynn Bai. 2008. “There are Plaintiffs and...There
are Plaintiffs: An Empirical Analysis of Securities Class Action Settlements,” 61
Vanderbilt Law Review 355-386.
Cox, James D., and Randall S. Thomas. 2009. “Mapping the American Shareholder
Litigation Experience: A Survey of Empirical Studies of the Enforcement of the
U.S. Securities Law,” 6 European Company and Financial Law Review 164-203.
Freeman, John P., and Stewart L. Brown. 2000. “Mutual Fund Advisory Fees: The Cost
of Conflicts of Interest,” 26 Journal of Corporation Law 610-73.
Hanley, Kathleein Weiss, and Gerard Hoberg. 2012. “Litigation Risk, Strategic
Disclosure and the Underpricing of Initial Public Offerings,” 103 Journal of
Financial Economics 235-54.
Henderson, Todd. 2010. “Justifying Jones,” 77 University of Chicago Law Review 1027-
1053.
Hubbard, R. Glenn, Michael F. Kohen, Stanley I. Ornstein, Mark Van Audenrode, and
Jimmy Royer. 2010. The Mutual Fund Industry: Competition and Investor Welfare.
New York: Columbia Business School Publishing.
Johnson, Lyman. 2008 “A Fresh Look at Director ‘Independence’: Mutual Fund Fee
Litigation and Gartenberg at Twenty-Five,” 61 Vanderbilt Law Review 497-542.
Johnson, Marilyn F., Karen K. Nelson, and A. C. Pritchard. 2006. “Do the Merits Matter
More? The Impact of the Private Securities Litigation Reform Act,” 23 Journal of

Curtis and Morley
37
Law, Economics, and Organization 627-52.
Morley, John, and Quinn Curtis. 2010. “Taking Exit Rights Seriously: Why Governance
and Fee Litigation Don’t Work in Mutual Funds,” 120 Yale Law Journal 84-142.
Pace, Nicholas M., Stephen J. Carroll, Ingo Vogelsang, and Laura Zakaras. 2007.
Insurance Class Actions in the United States. Santa Monica: RAND Corporation.
Rosenbaum, P. R., and Rubin, D. B. 1985. “Constructing a Control Group Using
Multivariate Matched Sampling Methods that Incorporate the Propensity Score,” 39
American Statistician 33–38.
Spatt, Chester. 2006. OEA Memorandum: Literature Review on Independent Mutual
Fund Chairs and Directors, December 29.
http://www.sec.gov/rules/proposed/s70304/oeamemo122906-litreview.pdf
Sterngold, James. 2012. “Is Your Fund’s Board Watching Out for You?” Wall Street
Journal Online June 9.
http://online.wsj.com/article/SB10001424052702303753904577450243418998540.
html.
Thompson, Robert B., and Randall S. Thomas. 2004. “The New Look of Shareholder
Litigation: Acquisition-Oriented Class Actions,” 57 Vanderbilt Law Review 133-
2009.
Volz, Beagan. 2010. “The SEC’s Plan Sets Lawyers Abuzz,” Financial Times (Oct. 3).

Curtis and Morley
38
38
Figure 1. Density Histograms of Affected and Unaffected Funds
1a. Style-Demeaned Expense Ratio 1b. Log Fund Size
1c. Log Family Size by Family

Curtis and Morley
39
39
Figure 2. Density Histograms of Affected and Unaffected Funds
Figure 2a. Suit Frequency by Unexplained Expense Ratio Decile
Figure 2b. Suit Frequency by Family Size Decile
Figure 3. Quantile-Quantile Plots of Style-Demeaned Expense Ratios in Affected
Funds by Case Outcome
This figure presents a quantile-quantile plot of the mean Style-Demeaned Expense Ratios in 300 quantiles
of funds based on the outcomes of the cases. Each dot represents the pairing of the Style-Demeaned
Expense Ratio in a particular quantile of funds with one case outcome against the corresponding quantile in
funds with the opposite case outcome. In Figure 3.a, the plots should lie above the 45-degree line if more
successful cases had higher fees, and below the line if they had lower fees. In Figure 3.b, the plots should
lie above the line if settled cases had higher fees, and below the line if they had lower fees.
3.a Dismissed and Non-Dismissed Cases 3.b Settled and Not Settled Cases
0
0.5
1
1.5
2
2.5
1 2 3 4 5 6 7 8 9 10
% O
bse
rvat
ion
s W
ith
a L
awsu
it
Unexplained Expense Ratio Decile
0
1
2
3
4
5
6
1 2 3 4 5 6 7 8 9 10%
Ob
serv
atio
ns
Wit
h a
Law
suit
Family Size Decile
-10
12
3
Me
an
Sty
le-D
em
ea
ne
d E
xpe
nse
Ratio
(N
ot D
ism
issed
)
-1 0 1 2 3Mean Style-Demeaned Expense Ratio (Dismissed Cases)

Curtis and Morley
40
40
Table 1. Summary Statistics Lawsuit data were collected from complaints and related documents filed in federal courts between January
1, 2000 and December 31, 2009 in cases that alleged violations of section 36(b) of the Investment
Company Act of 1940 against advisers of open-end mutual funds. Cases that alleged market-timing or late-
trading were excluded. We observe each fund quarterly.
Basic Information
Jan. 1, 2000 to Dec. 31,
2009 (40 Quarterly
Observations)
Total funds 12,157
Total families 1,015
Total fund-quarter observations 263,142
Lawsuits 91
Cases alleging excessive fees (“Fee Allegation Suits”) 56
Cases alleging only excessive fees (“Pure Excessive Fee Suits”) 25
Fund-quarter observations with a lawsuit 4,195
Funds targeted at least once during study period 2,769 23.8%
Fund families targeted at least once during study period 60 5.93%
Family-Level Targeting
Number of times a lawsuit targeted at least one fund in a family 116
Number of times a lawsuit targeted an entire family 57 49%
Average percentage of a family’s funds affected by a suit (among
suits that targeted only a portion of funds in a family) 40.4%
Key Variables
Mean Std. Dev
Expense Ratio .0113 .0060
Fund Size ($ millions) 1,043.3 4,463.0
Family Size ($ millions) 107,969 235,716
Quarterly Return 0.79% 9.5%

Curtis and Morley
41
41
Table 2. Simple OLS Regressions of Mutual Fund Characteristics on Lawsuit Dummy
This table presents the results of a series of pooled OLS regressions of variables of interest on the lawsuit indicator variable and date dummies. Each cell
in the table represents the results of a distinct regression and reports the coefficient on the lawsuit indicator variable. The columns contain dependent
variables, and rows contain codifications of the lawsuit indicator variable. “Fee Allegation Cases” expressly alleged that fees were excessive, and “Pure
Excessive Fee Cases” alleged only that fees were excessive. All variables express the averages over the four quarters prior to each observation. Panel A
treats individual funds as the units of observation. Panel B treats families as the units of observation and calculates variable values as the size-weighted
averages for all funds in the families. Panel A clusters standard errors at the family level. Panel B uses robust standard errors.
Panel A. Fund Level Regressions
n = 233,260
Unadjusted
Expense
Ratio
(%)
Style-
Demeaned
Expense
Ratio (%)
Expense
Quantile
Unexplained
Expense
Ratio
(%)
Fund Size
($ millions)
Family Size
($ millions)
Style-
Demeaned
Returns Over
Prior Year
Subset of
36(b) cases
flagged by
lawsuit
indicator
variable
All 36(b)
Cases
.017
(0.40)
.021
(0.54)
.025
(1.17)
.058**
(2.31)
1,036.1**
(2.46)
78,409.5***
(4.92)
-.0060
(-1.14)
Fee
Allegation
Cases
.055
(1.26)
.052
(1.23)
.040*
(1.76)
.068**
(2.30)
1,167.1*
(1.85)
90,745.5***
(3.04)
-.0030
(-0.55)
Pure
Excessive
Fee Cases
.080
(1.56)
.069
(1.40)
.048*
(1.73)
.063
(1.55)
1,887.4*
(1.81)
49,521.4
(1.37)
0.175
(1.50)
Panel B. Family-Level Regressions n = 21,542
Subset of
36(b) cases
flagged by
lawsuit
indicator
variable
All 36(b)
Cases
-.227***
(7.01)
-.203***
(6.85)
-.068***
(-4.10)
.030**
(1.39)
87,860***
(5.57)
-0.04***
(-3.41)
Fee
Allegation
Cases
-.200***
(5.63)
-.183***
(5.61) -.059***
(-3.23)
.038**
(2.20)
95,634***
(4.81)
-0.04***
(-3.45)
Pure
Excessive
Fee Cases
-.140***
(3.14)
-.139***
(3.20)
-.041*
(1.72)
.067**
(2.24)
103,384***
(3.21)
-0.03*
(1.80)

Curtis and Morley
42
42
Table 3. Logistic Regressions for Likelihood that a Fund or Family is Affected by a Fee Allegation Suit (Odds Ratios) This table presents the results of a series of pooled logit regressions using a binary dependent variable that indicates whether a fund in a given quarter was
affected by a section 36(b) suit that alleged the fund’s fees were excessive. We report all coefficients as odds ratios and scale expense ratio variables as
percentages. Panels A and B treat funds as the units of observation and report results from logit regressions. Panel A uses expense ratio variables with continuous
values and Panel B converts Expense Quantile and Unexplained Expense Ratio into deciles and uses dummies for each decile. Panel B also presents test statistics
on the probability that the coefficient on each decile is the same as the coefficient for the top decile. Panel C treats families as the units of observation and uses a
dependent variable that indicates only suits that targeted entire families. Panel C uses the expense and return variables as the size-weighted averages of those
variables across all funds in each family, and across the top 25% and top 10% of funds in each family by Unexplained Expense Ratio. All regressions include
date dummies. Panels A and B cluster standard errors at the family level. Panel C uses robust standard errors.
Panel A. Fund-Level Regressions with Continuous Expense Variables (Odds Ratios)
(1) (2) (3) (4) (5) (6)
Style-Demeaned Expense Ratio (%) 1.13
(1.13)
2.04***
(4.68)
Expense Quantile 1.56*
(1.63)
4.46***
(4.32)
Unexplained Expense Ratio (%) 1.32**
(2.47) 1.35
(1.42)
Style-Demeaned Returns in Prior
Year
.725
(-1.61)
.732
(-1.56)
0.89
(-0.58)
Ln(Fund Size)
($ millions)
1.01
(0.33)
1.01
(0.37)
. 97
(-1.10)
Ln(Family Size)
($ millions)
1.85***
(4.78)
1.85***
(4.73)
1.77***
(4.63)
n 101,255 101,255 96,669 97,995 97,995 97,995
Pseudo R2 0.2519 0.2529 0.2575 0.3674 0.3690 0. 3555
z-statistics in parentheses. * p < 0.10, ** p < 0.05, *** p < 0.01

Curtis and Morley
43
43
Panel B. Fund-Level Regressions with Expense Ratio Decile Dummies (Odds Ratios)
Unexplained Expense Ratio Decile Expense Deciles Within Style
Odds Ratio (z-stat) p-value for
Odds Ratio (z-stat)
p-value for
1 (lowest) 1 (base) -- 0.244 1 (base) -- 0.001***
2 1.06 0.33 0.300 2.64** 2.05 0.001***
3 1.13 0.65 0.227 3.14** 2.30 .003***
4 1.26 0.99 0.426 4.13*** 2.97 .121
5 1.27 0.89 0.391 4.41*** 2.95 .117
6 1.26 0.78 0.380 5.05*** 3.15 .332
7 1.34 0.99 0.602 5.07*** 3.10 .312
8 1.40 1.13 0.719 5.63*** 3.33 .710
9 1.56 1.37 0.580 6.47*** 3.46 .429
10 (highest) 1.47 1.17 1.000 5.94*** 3.19 1.000
Style-Demeaned
Returns 0.890 -0.56 0.797 -1.13
Ln(Fund Size)
(millions) 0.963 -1.11 1.008 0.27
Ln(Family Size)
(millions) 1.77*** 4.63 1.874*** 4.67
n 96,781
97,995
Pseudo R2 0.3557
0.3736
* p < 0.10, ** p < 0.05, *** p < 0.01

Curtis and Morley
44
44
Panel C. Incidence of Full-Family Suits: Family-Level Regressions with Continuous Expense Variables (Odds Ratios)
(1) (2) (3) (4) (5)
Family Average Style-Demeaned Expense
Ratio (%)
2.95***
(5.92)
Family Average Unexplained Expense
Ratio (%)
1.51
(0.80)
Family Average Expense Quantile 50.81***
(3.03)
Average Unexplained Expense Ratio in
most expensive 25% of family’s funds
1.81**
(2.55)
Average Unexplained Expense Ratio in
most expensive 10% of family’s funds
1.64*
(1.90)
Family Average Style-Demeaned Returns
in Prior Year
0.37
(1.25)
.146**
(2.39)
.464
(0.87)
.164**
(2.55)
.151***
(2.73)
Ln(Family Size) ($ millions) 2.47
***
(8.27)
2.21***
(9.21)
2.63***
(6.91)
2.17**
(9.35)
2.16***
(9.61)
n 3,271 3,249 3,261 3,249 3,240
Pseudo R2 .4384 .4204 .4772 .4228 .4227
z-statistics in parentheses. * p < 0.10, ** p < 0.05, *** p < 0.01

Curtis and Morley
45
45
Table 4. Within-Family Measures for Affected Fund Families
This table compares affected funds to unaffected funds within families when lawsuits targeted
only some of the funds in the families. We identified a total of 116 instances in which a suit
targeted at least one fund in a particular family. In 57 of these instances, the lawsuits affected
every fund in the family. In the remaining 59 instances, the lawsuits affected only a subset of
funds within the family. For the 59 partially affected families, this table reports the difference in
means between the affected and unaffected funds. The t-statistics are computed as paired tests at
the family level with 57 degrees of freedom.
Affected
Funds
Unaffected
Funds
Difference
(t-statistic)
Average Style-Demeaned Expense Ratio (%) 0.092 -0.119 .210***
(5.38)
Average Expense Quantile 0.560 0.440 .119***
(5.50)
Average Unexplained Expense Ratio (%) 0.158 0.058 .100**
(2.75)
Mean Fund Size ($ millions) 7,675 5,278 2,397
(1.53)

Curtis and Morley
46
46
Table 5. Relationship Between Fees and Case Outcomes This table presents evidence on the relationship between fees and case outcomes. The units of observation
are lawsuits. Only cases in which a motion to dismiss was filed and decided are included in the population
for the comparison of motion to dismiss outcomes and only cases that had reached final resolution were
included in the comparison of settlement outcomes. We present the mean difference and the 9% confidence
interval for the difference. As a non-parametric robustness check, we further compute the one-sided, two-
sample Kolmogorov-Smirnov p-value of the hypothesis that the distribution of the variable of interest is
smaller in the set of cases with the smaller reported mean. See Figure 5 for a graphical presentation of the
relationship between fees and case outcomes.
Summary Statistics
Motion to Dismiss Settlement
Dismissed Not Dismissed Settled Not Settled
N 27 22 23 55
Mean Style-Demeaned
Expense Ratio -.053 .010 .085 -.0550
Mean Difference -.063 .13
95% Conf. Interval [-.268, .142] [-.038, .320]
Kolmogorov-Smirnov Test p = 0.63 p =.45
Mean Expense Quantile .491 .516 .542 .494
Mean Difference -.025 0.048
95% Conf. Interval [-.135, 0.86] [-.050, .146]
Kolmogorov-Smirnov Test p = .63 p =.47
Mean Unexplained
Expense Ratio .078 .158 .202 .066
Mean Difference -.080 0.136*
95% Conf. Interval [-.257, .097] [-.005, .278]
Kolmogorov-Smirnov Test p = 0.49 p =.24
Mean Unexplained
Expense Ratio in most
expensive 25% of family’s
funds
.534 .510 .560 .452
Mean Difference 0.24 .107
95% Conf. Interval [-.130, .177] [-.027, .241]
Kolmogorov-Smirnov Test p = 0.42 p =.12
Mean Unexplained
Expense Ratio in most
expensive 10% of family’s
funds
.729 .668 .621 .711
Mean Difference .060 .090
95% Conf. Interval [-.129, .249] [-.073, .253]
Kolmogorov-Smirnov Test p = 0.24 P=.26

Curtis and Morley
47
47
Table 6. Change in Targeted Funds’ Expense Ratios After Lawsuits
This table presents the mean net-asset-weighted change in relative expense measures in targeted funds after
the suits were filed. Because each of the expense ratio variables measures a fund's expenses relative to
other funds in the same investing style, this simple before-after test has the effect of comparing the changes
in affected funds to changes over the same periods in unaffected funds. In Panel A we report results for
cases that affected only a subset of the targeted family’s funds and in Panel B we report results for cases
that affected all of the targeted family’s funds. In Panel A the unit of observation is a fund and in Panel B
the unit of observation is a family. In Panel B, we separately present results for all cases and only for cases
that made excessive fee allegations. We did not do this in Panel A because almost all cases in Panel A were
fee allegation cases. In each panel the population includes only those funds that were affected by suits and
for which there were 36 months of data available after the filing of the suits’ initial complaints. Changes are
measured between the value of each lagged expense variable in the quarter in which a suit was filed and the
value five, nine and thirteen quarters after the suit was filed, corresponding to the first, second, and third
years after the filing. Fund-level regressions clustered standard errors at the family level; family-level
regressions cluster at the lawsuit level.
One Year
Post-Suit
Two Years
Post-Suit
Three Years
Post-Suit
Panel A. Fund-Level Fee Changes for Suits that Selective Targeted Funds within
Families
Style-Demeaned Expense Ratio (%)
0.0212***
0.0267***
0.0371***
(3.08) (2.87) (3.02)
Unexplained Expense Ratio (%) 0.0206 0.0267 0.0404
*
(1.51) (1.43) (1.73)
Expense Quantile
0.00396 0.0000389 0.00169
(0.98) (0.01) (0.36)
n = 1186
Panel B. Family-Level Fee Changes for Suits that Target All Funds in a Family
All Cases (N=52)
Family Mean Unexplained Expense
Ratio
0.00307
(0.63)
0.00389
(0.31)
0.0176
(1.27)
Mean Unexplained Expense Ratio in
most expensive 25% of family’s funds
-0.00405
(-0.43)
-0.00943
(-0.75)
-0.00574
(-0.38)
Mean Unexplained Expense Ratio in
most expensive 10% of family’s funds
-0.0179
(-1.05)
-0.0306*
(-1.83)
-0.0338
(-1.52)
n=52
Excessive Fee Allegation Cases
Family Mean Unexplained Expense
Ratio
0.00803*
(2.23)
0.00201
(0.34)
0.0274**
(2.78)
Mean Unexplained Expense Ratio in
most expensive 25% of family’s funds
0.0108
(1.47)
-0.00945
(-0.81)
0.00304
(0.33)
Mean Unexplained Expense Ratio in
most expensive 10% of family’s funds
0.0158
(1.55)
-0.0126
(-0.97)
0.00169
(0.13)
n=25

Curtis and Morley
48
48
Table 7: Asset Flows Following Lawsuits This table presents the results of an OLS regression that assesses the predictors of asset flows into observed funds. In
models 1 and 2, the unit of observation is a fund and in models 3 and 4 it is a family. We observe each fund quarterly. For
the family-level regressions, we calculate variables using the size-weighted average values for all funds in each family.
The dependent variable is the average of monthly fund flows during the observed quarter divided by the average flow for
funds in the same investing style. Monthly fund flows are computed as
The key
independent variable of interest is “Suit Year,” which indicates whether a fund or family experienced a lawsuit in the
current or prior three quarters. Returns are divided into negative and positive values to capture any asymmetric response
of flows to under- or over-performance. All control variables except loads use lagged values from the quarter prior to the
quarter of an observation. Models 1 and 2 use fund fixed effects and models 3 and 4 use family fixed effects. Models 1
and 2 cluster standard errors at the family level. Models 3 and 4 use robust standard errors.
Fund Level Family Level
All Suits
Pure
Excessive
Fee Suits
All Suits
Pure
Excessive
Fee Suits
(1) (2) (3) (4)
Suit Year 0.00162 -0.168 0.0983 0.287
(1.28) (-0.56) (0.25) (0.79)
Positive Return 0.147***
19.18***
3.437 3.386
(5.67) (3.03) (0.24) (0.24)
Negative Return 0.0115 -10.76 -34.14 -34.14
(0.78) (-1.23) (-0.75) (-0.75)
Return Standard Deviation 0.0507***
4.140 -8.723 -8.863
(4.20) (1.56) (-1.00) (-1.01)
Unadjusted Expense Ratio 0.0272***
2.706* -0.0376 -0.0526
(5.23) (1.91) (-0.02) (-0.03)
Fund Size 0.00169 -0.529*
(1.41) (-1.88)
Family Size -51.21 -53.08
(-0.21) (-0.22)
Front Load 0.279 75.58 -47.30 -50.87
(0.31) (0.33) (-0.20) (-0.22)
Rear Load 0.631 -269.1 -0.789 -0.789
(1.27) (-1.63) (-1.52) (-1.52) R-Squared 0.00832 0.000613 0.00441 0.00442 n 67825 67825 4952 4952