An Empirical Study Into Factors Influencing the Use of Value-base
AN EMPIRICAL STUDY OF FACTORS INFLUENCING FINANCIAL
PERFORMANCE OF ISLAMIC VERSUS CONVENTIONAL BANKS IN KENYA
BY
GUYO ISMAIL GARO
A RESEARCH PROJECT SUBMITTED IN PARTIAL FULLFILMENT OF
THE REQUIREMENTS FOR THE AWARD OF THE DEGREE OF MASTER
IN BUSINESS ADMINISTRATION, UNIVERSITY OF NAIROBI
OCTOBER, 2013

ii
DECLARATION
I declare that this is my original work and to the best of my knowledge it has not been
submitted for a degree award in any University or Institution of higher learning.
Sign…………..………………………… Date…………………………..
Guyo Ismail Garo
D61/71346/2008
This research project has been submitted for examination with my approval as University
supervisor.
Sign…………..………………………… Date…………………………..
Dr. Joseph Lishenga, PhD.
Senior Lecturer,
Department of Finance and Accounting
School of Business,
University of Nairobi.

iii
ACKNOWLEDGEMENTS
I would like to express my sincere appreciation and deep thank to Almighty Allah, who
gave me the health, courage and wisdom to accomplish this project in good time. Indeed,
I would like admit that the completion of this project would not have been possible
without the assistance and contribution of a number of people in one way or the other. To
them all, I am greatly indebted.
It is a matter of great honour and pleasure for me to express my profound gratitude to my
supervisors especially Dr. Joseph Lishenga for his invaluable guidance, advices,
motivation and encouragements to make this project a success.
My special appreciation is extended to the University of Nairobi Council, for providing a
better learning environment for advancement of knowledge and training. I am also
grateful to all MBA course lecturers for their commitment and support during the entire
study period.
Last but not least, I wish to register my special thanks to my entire family for their moral
support, prayer and encouragement unconditionally all through the study period.

iv
DEDICATION
This research project is dedicated to my lovely children

v
ABSTRACT
Today’s international and domestic environments in which commercial banks operates in
are getting more challenging due to structural reforms of early 1980’s resulting to
globalization and deregulation of financial markets among others. All these changes led
to stiff competition among banks both at domestic and international market for
customer’s funds mobilization and utilization. The determinants of bank performance
have long been a major focus of banking research world over. The literature divides the
determinants into internal and external factors. This study examines empirically the
factors influencing the financial performance of Islamic versus conventional banks in
Kenya (2009 – 2012). The specific objectives of this study was to analyze how bank’s
specific; industry characteristics and macroeconomic variables affects the performance
commercial banks in the country and also to establish whether Islamic banks as new
concept are as profitable as conventional banks. The study employed causal comparative
research design as the main approach to guide the study. A simple random sampling
technique was used to select sample of two Islamic and eight conventional banks from a
stratified groups, based on CBK weighted composite index of small and large banks.
Data was analyzed using correlation and regression analysis and the results presented in
graphs and tables. The study findings showed that bank characteristic variables such as
interest spread, capital adequacy, size, and liquidity have positive and strong influence in
the performance of commercial banks, while management efficiency and asset quality
recorded strong and negative association to profitability. Furthermore, costs and profits
have inverse relationship. On the impacts of the industry specific factors, the results was
mixed; whereas the banking sector development variable proxy as credit to private sector
have a positive and insignificant influence on bank performance, the stock market
capitalization indicator recorded negative and insignificant influence on banks
profitability. More importantly, the study found that the macroeconomic determinants
such as real GDP growth rate showed positive and strong association to banks
profitability, while Inflation have negative and insignificant impacts on profitability.
Overall the study revealed that banks specific factors plays significant roles in
performance of the banks as they accounted for 80.6 percent of changes in bank
profitability. Additionally, on the matter of whether Islamic bank is as profitable as large
and small size conventional banks, the study concluded that large banks are far much
profitable than other banks categories, followed by small size conventional; while Islamic
banks was found to be the least profitable banks in the groups. This confirms the
assumption of relative market power theory. The reasons for significant differences in the
performance between bank types are due several advantages accruing to conventional
banks over Islamic banks. These include; strong capital base and economies of scale that
conventional banks specifically large banks enjoys compared to Islamic banks, which is
still young and evolving model. The study concluded that Islamic banks though barely six
years old in the country, are very promising as they are catching up with small size
conventional banks, if the performance trend exhibited in table 4.1 would be sustained in
future.

vi
LIST OF TABLES
Table 3.1: Population and sample frame 25
Table 4.1: Descriptive statistics for profitability variable (ROA) 31
Table 4.2: Descriptive statistic for independent variables 32
Table 4.3: Multicollinearity Statistics 36
Table 4.4: Correlation Matrix for Bank characteristics variables 38
Table 4.5: Goodness of Fit Statistics 39
Table 4.6: Significance of the Model 40
Table 4.7: Model Parameters 44
Table 4.8: Profitability across Bank Type 49
Table 4.9: Profitability of Commercial Banks across Groups 50
Table 4.10: Correlation Matrix with dummy variables for bank-types 63
Table 4.11: List of Selected Commercial Banks 65

vii
LIST OF FIGURES
Figure 4.1: Bank Profitability Trend (ROA) 31
Figure 4.2: Profitability Standardized Coefficients 47

viii
TABLE OF CONTENTS
DECLARATION ............................................................................................................ ii
ACKNOWLEDGEMENTS ........................................................................................... iii
DEDICATION ............................................................................................................... iv
ABSTRACT .................................................................................................................... v
LIST OF TABLES ......................................................................................................... vi
LIST OF FIGURES ...................................................................................................... vii
TABLE OF CONTENTS ............................................................................................. viii
LIST OF ABBREVIATIONS ......................................................................................... x
CHAPTER ONE ............................................................................................................. 1
INTRODUCTION .......................................................................................................... 1
1.1 Background of the Study ...................................................................................... 1
1.1.1 Factors that Determines Performance of Commercial Banks ............................ 3
1.1.2 Islamic Banking System .................................................................................... 4
1.1.3 Conventional Banking System ........................................................................... 5
1.1.4 Kenya Banking Sector ....................................................................................... 6
1.2 Research Problem ................................................................................................. 7
1.3 Research Objectives .............................................................................................. 9
1.4 Value of the Study ................................................................................................ 9
1.5 Justification of the Study .................................................................................... 10
CHAPTER TWO .......................................................................................................... 12
LITERATURE REVIEW ............................................................................................. 12
2.0 Introduction ......................................................................................................... 12
2.1 Theoretical Review ............................................................................................. 12
2.1.1 Market Power Theory ...................................................................................... 12
2.1.1.1 Structure Conduct Performance .................................................................... 13
2.1.1.2 The Relative Market Power .......................................................................... 13
2.1.2 The Efficiency Structure Theory ..................................................................... 14
2.1.3 The Balanced Portfolio Theory ........................................................................ 14
2.2 Bank Performance Indicators .............................................................................. 15

ix
2.3 Evaluation of factors Affecting Banks Performance .......................................... 16
2.3.1 Bank Specific (Internal) Factors ...................................................................... 16
2.3.2 Industry Specific Factors ................................................................................. 18
2.3.3 Macroeconomic Factors ................................................................................... 19
2.3 Review of Empirical Studies .............................................................................. 20
2.4 Summary of Literature Review ........................................................................... 22
CHAPTER THREE ...................................................................................................... 24
RESEARCH METHODOLOGY.................................................................................. 24
3.1 Introduction ......................................................................................................... 24
3.2 Research Design.................................................................................................. 24
3.3 Population of the Study ....................................................................................... 24
3.4 Sampling Design and Sample Size ..................................................................... 25
3.4 Data Collection ................................................................................................... 26
3.5 Data Analysis ...................................................................................................... 26
CHAPTER FOUR ......................................................................................................... 30
DATA ANALYSIS, RESULTS AND DISCUSSION ................................................. 30
4.1 Introduction ......................................................................................................... 30
4.2 Results and Discussion ....................................................................................... 30
4.3 Relationship between Bank Performance and its Determinants ......................... 34
4.4 Profitability Performance by Bank Type ............................................................ 47
CHAPTER FIVE: ......................................................................................................... 52
SUMMARY, CONCLUSIONS AND RECOMMENDATIONS................................. 52
5.1 Introduction ......................................................................................................... 52
5.2 Summary of the Findings .................................................................................... 52
5.3 Conclusions ......................................................................................................... 54
5.4 Limitations of the Study...................................................................................... 55
5.5 Recommendations ............................................................................................... 55
REFERENCES ............................................................................................................. 58
APPENDICES .............................................................................................................. 63
x
LIST OF ABBREVIATIONS
ATM: Automatic Teller Machine
CAMEL: Acronyms for Capital Adequacy, Asset Quality, Management Quality,
Earnings & Liquidity
CBK: Central Bank of Kenya
CRB: Credit Reference Bureaus
GDP: Gross Domestic Product
KNBS: Kenya National Bureau Statistics
MP: Market Power
PLS: Profit and Loss Sharing
ROA: Return on Assets
ROE: Return on Equity
RMP: Relative Market Power
SCP: Structure Conduct Performance
SD: Standard Deviation

1
CHAPTER ONE
INTRODUCTION
1.1 Background of the Study
Today’s international and domestic environments in which commercial banks operate
are getting more challenging. Due to effects of structural reforms of the late 1980s
that led to globalization, deregulation, innovation, technological advancement and
information’s revolution, it has become indispensible for local banks to remain
focused in redesigning its processes and products offering to customers in order to
match with unremitting financial innovations in the market that is driven by strong
competition from both domestic and foreign financial institutions (Shaher, Kasawneh
and Salem, 2011). Thus, the external environments in which banks compete for funds,
customers, and financial services, have impacts on bank performance. However, the
nature of uneven competition if not properly monitored, can have a negative impact
on banks’ profitability, as it reduces the interest spread earned by banks.
Understandably, though, a healthy and sustainable profitability is vital in maintaining
the stability of the banking system (Gischer and Guttner, 2002).
Similarly, Samad and Hassan (2000) noted that in a highly competitive financial
markets bank performance measures provides signal to depositor-investor, whether to
make the decision to invest or withdrawal from that bank. It is highly important for
managers to determine and evaluates financial position of their institution relative to
peer competitor and industry benchmarks. More importantly, the bank regulators,
being responsible for safety and soundness of banking system and preserving of
public confidence, should monitor bank’s performance in order to identify banks that

2
are experiencing adverse performance reporting. Therefore, persistent monitoring of
performance is essential to identify early enough, cases that may trigger any
unexpected contagion effects and financial crisis.
Berger, Hunter and Timme (1993), argued that if banks are efficient there would be an
improved profitability, greater amount of funds intermediation, better pricing and
quality services for customers leading to a sustainable economic growth that benefits
the whole society. More importantly, it can result into greater safety and soundness; if
the efficiency savings realized are applied to build-up capital buffer to mitigate
against any risk. However, the converse applies in case of inefficient intermediaries
leading to a contagion effects.
The financial sector, especially, banks is regarded as the perquisite for economic
progress. They are the provider of the major sources of funding for modern trade and
commerce. They are the engine of good financial system which enables investors to
get a better return. The sector experienced a rapid expansion of institutions in terms
volume and sizes over the past four decades; this unprecedented growth of banks also
resulted to an increased proliferation of financial crisis and bank’s non-performance
(Zubair, 2005). The differences in bank profitability levels can be attributed to
business orientation, bank features, industry characteristics, and external factors
driven. Thus, empirical researches on determinants of bank profitability usually
contain bank’s specific variables, industry and macroeconomic indicators. Against
this back drop, it is interesting to examine and evaluates the comparative analysis of
factors affecting the performance of these banking models in Kenya.
3
1.1.1 Factors that Determines Performance of Commercial Banks
The determinants of bank performance have long been a major focus of banking
research world over. The performance of commercial banks can be affected either
positively or negatively by the internal and external factors (Al-Tamimi, 2010; Haron,
2004). The internal factors are bank specific characteristics, further categories in to
financial statement variables and non-financial statement variables. The financial
statement variables relate to the decisions which directly involve items in the balance
sheet and income statement, while non-financial statement variables are outside the
financial statement. The financial statement indicators include; bank size, capital
ratios, liquidity, asset quality, deposits, operational efficiency, risk management etc.
The non-financial variables include; number of branches, employees, ATM,
customers, age of the bank, ownership etc. The internal factors are generally believed
to be within the control and influence of the management. Prudency dictates that
through the best practice in policies, strategies, and decision objectives; the
management and the board can influence the banks performance results positively
(Haron, 2004).
The external factors are sector wide or country wide factors which are considered to
be beyond the control and influence of the management and board but reflect on the
sound macroeconomic development and stability of financial industry as a whole.
Among the widely discussed external variables are competition, regulation,
concentration, market share, exchange rate, scarcity of capital, money supply,
inflation and GDP. The linkages between banks profitability, the internal and external
factors have been investigated empirically by means of cross-country regression, time
series analysis, panel studies or a country case study (Srairi, 2009).
4
1.1.2 Islamic Banking System
According to Moin (2008) Islamic banking is defined as banking in consonance with
the ethos and value system of Islam, governed in accordance with the principles of
Islamic Sharia’h. Islamic banking is consistent with principles of Islamic law
(Sharia’h) and economics. It is derived from a branch of sharia’h called fiqh
mua’malat (Islamic rules on transactions). According to Siddiqui (2008) Islamic
financial instruments are based on the principles that they exclude dealing in interest
(riba), does not possess major uncertainty (gharar) or gambling like features
(maysir), and prohibits undertaking of unlawful business (haram), while advocating
for profit and loss sharing principles and supports for asset-backed financial
transactions.
The Islamic banking model operates on the principle of profit and loss sharing (PLS)
concept developed by Siddiqi (1967) as an alternative to interest-based banking. The
PLS Model came into effect following strong condemnation by scholars that the
charging of any guaranteed returns on financing was not only unacceptable but also
illogical, irrational and unjust to the society. This led to development of Modaraba
contracts that recognizes partnership trading, where rate of return (profit) on
productive investments is shared in proportion to equity or efforts contributed by
either party(s). Siddiqi further developed and formalized the Islamic financial
intermediation system called “two-fold Modaraba” which entails a bank-depositor
and bank-users of funds relationship. The fundamental principle of a two–fold
Modaraba was a noble and economic wise credit system aim to empower
entrepreneurs to obtain financial resources based on profit sharing contract as opposed
to riba-based system.
5
Chapra (1985); Dar and Presley (2000) in their studies observed that similar to
conventional bank, Islamic bank plays roles of an intermediary and trustee of public
money, though, based on profit and loss sharing principles (PLS), assets backed, and
centers on risk-sharing mechanism; subject to return from real economic performance
underlying the contract, unlike conventional principle which is largely interest-based
and allows for risk transfer. Islamic banking is thus characterized by its unique terms
of reference for money, financial cooperation and investment. It stands for equity-
sharing, ethical framework and stake-taking, while doing away with a debt-based
relationship. Therefore, the concept of Islamic banking and finance is regarded as a
lynchpin to achieving the economic and social justice through share of profit and
losses by the stakeholders.
1.1.3 Conventional Banking System
According to historical evidence, banking operations dates as early as 34th
centuries
BC, during which religious temples acts as a custodian of the worshiper’s savings and
advance loans to those who needs finance, thus acting as banks (Chachi 2005). It was
believed that the ancient traditional banking system evolved from a dealership model.
The pioneer study by Ho-Saunders (1981), observed the initial conceptualization of
“bank firms” as mere intermediaries between lender and borrower. The modern
commercial banks collect deposits from customers in form of saving and lend-out the
money to borrowers at interest. The interest paid by the borrowers becomes
borrowing costs. The conventional banks charge a spread for intermediation roles of
providing financial immediacy services calculated as the differences between the
lending rate and the deposit rate. The degree of spread affects the interest rate
margin, which substantially contributes to the level of profitability of banks. The
6
interest rate margin approach is based on the Ho and Saunders (1981) dealership
model; further extended, by Angbazo (1997), and Saunders and Schumacher (2000)
(as cited in Gischer and Guttner, 2002). The fact that a bank is a risk-averse agent
stands ready, to accept randomly incoming deposits and make loan on demands.
Analogously to the posted buy and sell prices in securities trading, banks are
committed to the advertised deposit and loan rates for the next period. Due to
stochastically arrivals time of deposit inflows and loan requests, banks select optimal
deposit and loan rates that minimize the build-up of unwanted cash reserves and
excessive loan demands. They do this by adding a loan-granting fee to the riskless
interest rate and subtracting a deposit-granting fee from the riskless rate as
compensation for providing immediacy and for bearing interest rate risk (Gischer and
Guttner, 2002).
1.1.4 Kenya Banking Sector
As at 31st December 2012, the banking sector consisted of the Central Bank of Kenya
(CBK) as the regulator, 43 commercial banks (two fully fledged Islamic banks) and 1
mortgage finance company (MFC), 5 representative offices of foreign banks, 8
Deposit-Taking Microfinance Institutions (DTMs), 112 Forex Bureaus and 2 Credit
Reference Bureaus (CRBs). According to Central bank of Kenya, supervisory report
(2012) the financial performance of the banking sector remains stable and sound
characterized by improved performance compared to previous year; though, still
slowed down by sluggish global economy. The key financial highlights, as at 31
December 2012 are as follows; total assets stood at Kshs.2.32 trillion up from Kshs.
2.02 trillion recorded in 2011; customer deposits grew by 14.8 per cent to Kshs. 1.71
trillion, net loan and advances rise by 12.5 per cent to close at Kshs.1.29 trillion in

7
2012, while pre-tax profit reached Kshs. 107.9 billion; a rise of 20.6 per cent. The
sector’s average liquidity closed at 41.9 per cent up from 37 per cent recorded in 2011
compared to minimum 20 per cent threshold. The sector’s capital adequacy measured
by ratio of total capital to total risk weighted assets stood at 23 per cent up from 21
per cent, and better compared to 12 per cent statutory limit. The sector is also
supported by continued regional expansion, adoption of cost effective channels and
embracing innovative use of technology (CBK, 2012).
The journey to the ‘birth’ of Islamic banking in Kenya reached climax during the
budget speech of June 2006, after amendment of section 53 (1) of the Banking Act,
Chapter 488 laws of Kenya, resulting to an exemption of Islamic banks from the
provisions of section 12 that deals with restrictions on trading and investments. The
amendment was intended to pave way for the introduction of an innovative ways of
balance sheet management in the banking sector as a vehicle for financing sharia’h
compliant products. This amendment led to Barclays bank of Kenya, to become the
first pioneer bank to operate la-riba product under Islamic window. Subsequently, in
2007, First Community bank and Gulf African bank; were approved by the CBK to
operate as a fully fledged sharia’h compliant institution. Since then several
conventional banks have introduced Islamic windows among them the Kenya
Commercial Bank ltd, National Bank of Kenya and Chase Bank ltd (Jamia Mosque
Committee, 2007).
1.2 Research Problem
Islamic banks operate under PLS principles based on Islamic sharia’h law. They have
a responsibility just like conventional bank to support country’s economy through
mobilization of saving and provision of credit for business expansion. Suleiman

8
(2001), perhaps views Islamic banks as seeking a ‘just’ and ‘equitable distribution of
resources’ compared to non-Islamic banks. Islamic bank is based on Islamic faith and
its operations must be within the confines of Islamic law. Turk (2007) also observed
that Islamic financial institutions operate under the constraints of complying with
sharia’h, the Islamic legal code. Notwithstanding, they have to find alternative but
acceptable means to improve financial performance and compete in a banking
environments structured along western guidelines.
The evolution and widespread practice of Islamic finance over the past four decades
has led scholars, economists and policy makers to carryout empirical studies on the
financial performance of banks including comparative analysis across many countries.
One such study conducted by Mahmood (2005) (taken from Ika and Abdullah, 2011),
to evaluate the financial performance of Islamic and conventional banks in Pakistan
for the period 2000 to 2004, revealed that Islamic banks were superior to conventional
banks in all aspects. Another study conducted by Ika and Abdullah (2011), on
whether there are differences between the performances of Islamic and conventional
banks in Indonesia, during the year 2000 to 2007, observed no significant differences
between the two banking system except stronger liquidity position shown by Islamic
banks.
Notably, most of these studies are done in the developed economies. Therefore,
despite the banking sector prominence, a few related studies were done on
performance of banking sector in Kenya over the years. This includes studies by
Njihia (2005), Musundi (2008), Ibrahim (2009), Halkano (2012) and Ongore & Kusa
(2012) among others. However, there are only two studies done on comparative
analysis of two banking system but none of these studies fully evaluated the empirical

9
analysis of factors affecting financial performance of Islamic versus conventional
banks in Kenya, specifically, the effects of the external factors on banks performance.
Perhaps due the differences in the orientations, this is the gap that the current study
seeks to fill. Therefore this study seeks to answer the following research questions:
i. How do bank characteristic, industry and macroeconomic variables affect
commercial banks performance in Kenya?
ii. Is there any significant difference(s) between the performance of Islamic and
conventional banks in Kenya?
1.3 Research Objectives
The objectives of this study are as follows:
I. To identify and evaluate the major factors influencing the financial
performance of commercial banks in Kenya.
II. To establish whether Islamic banks are as profitable as conventional banks
operating in Kenya.
1.4 Value of the Study
This research finding would help potential investors and shareholders to identify
investment opportunity available to them, so that they can make best investment
decision. The finding would enable the bank management to focus on a competitive
strategy aim to improve shareholders value; while at the same time strive to meet
public expectations by embracing best market practice in terms of offering quality
services and improved efficiency.

10
The research findings are also beneficial to public, customers and potential customers
interested on effectiveness of customer service delivery mechanism offered by the
banks. This will inform them on whether they would wish to continue with business
or scale down their operations or withdraw their banking activities based on the result
of the institutional financial performances. The bank regulator is interested to find out
whether the financial system is sound, strong and earns public confidence at any
giving time. Therefore this research will guide policy makers and regulators on the
gaps that need to be closed to avoid any financial distress. The study should, in
addition, make significant contribution to a growing body of scholars’ and
academicians’ existing literatures on determinants of bank performance in the
country. Last but not least, finance students and academician may need the study
findings to stimulate further research in this area.
1.5 Justification of the Study
The studies by Ibrahim (2009) and Halkano (2012), though a comparative studies on
two banking models, narrowly focused on internal factors only. Yet it is a common
knowledge that banks cannot operate in a vacuum and thus their performances are
subject to external factors variations based on their orientations. Hence their studies
failed to extensively cover multiples of the internal factors, while completely missed
out on the external factors, which also play a significant roles in financial
performance of commercial banks. Notably, their studies somewhat applied simple
descriptive analysis to evaluate the data, while this study would employ multiples
regression model to analyze the data. In this study, Islamic banks would be compared
to the set of small and large conventional banks based on a weighted composite index
provided by CBK. Additionally, this study covers recent time frame (2009-2012),

11
based on quarterly performance reports, reflecting a more matured data compared to
Ibrahim, who had only one year data. More importantly, Islamic banks having begun
operations in 2008, recorded huge losses for first three years, hence it was obvious
that its ROA cannot match that of conventional banks then, compared to current
period, when it is making profits for better comparison. Therefore, the researcher
would evaluate multiple variables of both internal and external factors that are
important in explaining profitability performance of commercial banks in the country.

12
CHAPTER TWO
LITERATURE REVIEW
2.0 Introduction
This chapter presents an in-depth literature on relevant theories of performance and its
application to banks. It discusses performance indicators, and the evaluation of factors
affecting financial performance of banks. The chapter provides empirical review on
determinants of banks performance and concludes by giving the rationale for the
selected topic understudy.
2.1 Theoretical Review
There are various theories to explain determinants of bank performance and its
profitability. As Athanasoglou, Sophocles, and Matthaios (2005) observed, a more
organized application of industrial organization models to bank performance started in
late 1980s (as cited in Olweny & Shipho, 2011). These theories are discussed as
follows;
2.1.1 Market Power Theory
The Market Power (MP) theory states that the performance of the bank is influenced
by the market structure. The hypothesis suggests that only firms with large market
share and differentiated portfolios can win their competitors and earns monopolistic
profits. The market structure matters for the bank’s power irrespective of the nature of
banks, whether Islamic or conventional, as it can directly affect bank performance.

13
There are two distinct approaches within the MP theory: The traditional structure–
conduct performance and the relative market power theories as discussed below.
2.1.1.1 Structure Conduct Performance
The traditional structure–conduct-performance (SCP) hypothesis developed by (Bain,
1956) states that increased exogenous market forces in bank’s conduct influences its
profitability. The SCP paradigm assumes that higher level of bank concentration
allows a higher degree of cooperation between banks thus result to set of higher prices
and consequently gains substantial profits through oligopolistic behavior and
collusive argument. The SCP hypothesis states that bank performance depends on
various elements of market concentration, market structure, number and size of banks,
and collusion. The more concentrated the market, the less the degree of competition
and hence, the higher profitability.
2.1.1.2 The Relative Market Power
Shepherd (1986) formulated Relative Market Power (RMP) theory, which states that
earning supernormal profits are due to firms with well-differentiated products that can
increase market share and exercise their market power in pricing products.
Consequently, under the RMP hypothesis, individual market shares accurately
determine market power and market imperfections. The RMP hypothesis is
empirically proved when concentration introduced in the explanatory equations of
performance is found non-significant in contrast to market share which should be
positively and significantly correlated with price and/or profitability. Therefore, the
bank with a strong position in the market may either reinforce its domination over the
market or achieves a higher efficiency.

14
2.1.2 The Efficiency Structure Theory
Demsetz (1973) formulated the Efficiency Structure Theory (ES) which states that a
bank which operates more efficiently than its competitors gains higher profits
resulting from low operational costs. The same bank holds an important share of the
market. Consequently, differences at the level of efficiency create an unequal
distribution of positions within the market and an intense concentration. The
efficiency theory further suggests that enhanced managerial capability and scale
efficiency level leads to higher concentration and higher profitability. Among these
capabilities, the bank should be skilled in areas of knowledge sets which includes; the
talent to reinforce the training process and the relational network, its ability to master
the sense of prediction, selection and rely on human capital and its capability to
minimize cost while seeking adjustment of costs based on quality and products
volumes in order to be efficient. The efficiency structure hypothesis is usually divided
into the X-efficiency and scale efficiency hypotheses.
2.1.3 The Balanced Portfolio Theory
The portfolio theory approach formulated by Nzongang and Attemnkeng as cited in
Olweny and Shipho (2011); so far, was the most relevant and outstanding theory, as it
plays an important role in bank performance studies. According to this theory of asset
diversification, the optimum holding of each asset in a wealth holders portfolio is a
function of policy decision determined by a number of factors such as vector of rates
of return on all assets held in portfolio, a vector of risk associated with the ownership
of each financial assets and the size of the portfolio. Therefore, it implies that the
portfolio composition of the bank, its profit and the return to the shareholders is the

15
result of the optimum assets utilization, prudent management and overall policy
decisions of the board.
2.2 Bank Performance Indicators
Financial management theories have over the years provided various indexes for
measuring banks’ performances. However, Levonian (1994) stated that there was no
single universally accepted measure for firm’s performance (as cited in Soylu &
Durmaz, 2013). In evaluating banks’ performance, the use of financial ratio is most
prevalent in existing literatures. For instance, O’Connor (1973) and Libby (1975)
used ratios as a measure of performance (as cited in Samad, 2004). Accounting
measures have several strength, besides, it’s readily availability due to regulatory
requirements for its publication; they are also subject to internal controls, which
enhances data reliability. Generally, return on asset (ROA), return on equity (ROE),
return on capital employed (ROCE) and Net interest Margin (NIM) have been widely
used as profitability indicators. Samad and Hassan (2000) observed that bank
regulators often used financial ratios to evaluate banks performance over the years.
Also, the supervisory authority including the Central Bank of Kenya employs
CAMEL rating approach to assess the soundness and financial stability of commercial
banks in the country. The acronym stands for Capital adequacy, Asset quality,
Management quality, Earnings (profitability) and Liquidity (CBK, 2012).
1.2.1 Return on Asset
Return on asset (ROA) is considered one of the most popular ratios used to measure
financial performance of banking industry. The ROA ratio is computed by dividing
the net profit after tax over total assets. It reflects the ability of a bank’s management

16
to generate profits from the bank’s assets. This ratio put more emphasis on the
efficient utilization of assets to generate revenues. It is expected that the higher the
ratio, the higher the profitability.
2.3 Evaluation of factors Affecting Banks Performance
The determinants of bank performances can be classified into bank specific (internal)
and macroeconomic factors (external) (Al-Tamimi, 2010; Haron, 2004). The
relationships of these factors to profitability are discussed as below;
2.3.1 Bank Specific (Internal) Factors
Internal factors are bank specific characteristic, which affects bank performance.
They are influenced by decision of the management and the board strategy. The
relevant variables are discussed as follows;
2.3.1.1 Capital adequacy
In this study, capital adequacy will be measured using the ratio of equity to total
assets. It assists bank management to understand the shock captivating capability
during times of adverse development in the market. This variable is an indicator of
bank capital strength. The rationale is that the high equity/total assets ratio, the better
it will aid the bank in providing a strong cushion to increase its credit undertakings
leading to better profitability.
2.3.1.2 Asset Quality (Credit risk)
Asset quality will help the management to understand the risk with respect to the
exposure of a bank to borrowers. Asset quality in this study will be measured by the
ratio of nonperforming loans to total loan portfolio outstanding. Loans portfolio are

17
the main source of revenues for banks but equally considered as largest source of
credit risk due to the problem of adverse selection. Equally, asset quality can also be
used to measures the creditworthiness and reliability of the bank. Asset quality theory
suggests that increased nonperforming loans can lead to credit risk hence decline in
profitability.
2.3.1.3 Management Efficiency
This ratio measures superiority of the management performance through cost
efficiency operations. In this study, cost to income ratio will be utilized to measures
the management quality. This variable is calculated by dividing total operating
expenses by total operating income. This implies that the smaller the ratio, the greater
the operational efficiency. Thus, the cost to income ratio is expected to be inversely
related to profitability.
2.3.1.4 Liquidity ratio
This performance parameter measures the ability of the bank to quickly meet its
financial obligation arising from unforeseen circumstance that can result to an
insolvency risk. Liquidity means the ability to readily convert assets in to cash for
utilization without extraneous condition. The ratio of liquid assets (cash and bank
equivalent) to customer deposit is employed to capture liquidity. In order to hedge
against liquidity risk, banks often hold liquid assets to meet adverse shocks.
Therefore, the higher this ratio, the lesser liquid the bank and hence, the higher
expected profitability. The minimum liquidity ratio as stipulated by CBK is at 20
percent. This requirement is an absolute measure of solvency and is usually
established by regulatory authority.
18
2.3.1.5 Interest Spread
Interest rate spread is calculated as the difference between the average yields a bank
receives from loans and other interest-accruing activities and the average rate it pays
on customers’ deposits and borrowing funds. The net interest rate spread is a key
determinant of a bank’s profitability. The greater the spread, the more profitable the
financial institution is likely to be. However, for Islamic banks income from financing
activities is the appropriate terms used in Kenya. In this study a positive and strong
relationship between interest spread and profitability is expected.
2.3.1.6 Bank Size
Total assets are measure of bank size. In the balance sheet, bank assets consist of
short and long term in nature. In order to capture possible non-linear relationship
between size and profitability, the use of logarithm of total assets as a proxy for bank
size is paramount. The rationale behind this thinking is because large banks are more
likely to benefit from economies of scale. In this study it is assumed the bigger the
bank size the higher the profitability.
2.3.2 Industry Specific Factors
These are industry-wide factors that affect profitability of the financial sector
performance as a whole. In this study, banking sector development and financial
market development were considered;
2.3.2.1 Banking Sector Development
This refers to financial resources provided to private sector. It is calculated as the ratio
of domestic credit to private sector as a percentage of GDP. This variable proxy to

19
country’s banking sector development, which influences banking performance. It’s
expected that a robust and well structured banking sector development is due to
improved macroeconomic performance and hence positively affects the bank’s
profitability.
2.3.2.2 Financial Market Development
In this study the ratio of Stock Market Capitalization (SMC) to GDP is used as a
proxy for financial market development. The stock market plays a significant role in
country’s economic development through provision of short and long term funding to
enhance productivity. This variable is expected to have positive relationship with
profitability.
2.3.3 Macroeconomic Factors
These are country wide external factors beyond the control and influence of the
management that affects banks profitability. In isolate the effect of bank characteristic
on profitability. In this study, the GDP and inflation variables were considered;
2.3.3.1 Growth in Gross Domestic Product
This index measures country’s economic performance i.e. the total country’s outputs
in a single year. The real GDP growth rate is expected to have a positive relationship
with bank performance such that when country experience high growth rate, the
bank’s profits are expected to be higher.
2.3.3.2 Inflation Rate
Inflation rate as measured by percentage change in the price of goods and services in
a country. Inflation rate affects banks pricing of its products and services. The general

20
understanding is that banks continuously adjust its prices with changes in inflation
rate. Hence, there is expected a positive relationship between the inflation and
profitability, given that banks revised its pricing accordingly.
2.3 Review of Empirical Studies
In his paper Srairi (2009), examines the impact of bank characteristic,
macroeconomic, and financial structure on the profitability of conventional and
Islamic banks operating in GCC countries for the period 1999-2006, using regression
model. The selected sample includes 18 Islamic and 48 conventional banks. Empirical
results show that the profitability of both Islamic and conventional is mainly affected
by capital adequacy, credit risk and operational efficiency while liquidity and
financial risk have positive impact on Islamic banks only. The study also found that
GDP, money supply (M2) and stock market development positively influence
profitability. However, there is insignificant relationship between banking sector
development and inflation to profitability.
Jaffar and Manarvi (2011) directed a study on performance of Islamic and
conventional banks in Pakistan. The study included a sample of 5 banks from each
group for a period 2005–2009. The study reveals that Islamic banks performed well
in terms of capital adequacy and liquidity compared to conventional banks which also
performed better in earnings and management quality. However, the study observed
that asset quality has no impacts in both banks.
In his research Al-Tamimi (2010) investigated some significant factors influencing
the performance of UAE Islamic and conventional banks during the year 1996 to
2008, using regression analysis, specifically ROA and ROE as dependent variables.
21
The researcher observed that liquidity and concentration were the most significant
factors for conventional national banks whereas number of branches and costs were
reported as the most significant factors for Islamic banks performance.
As for the most recent literature, Zeitun (2012) conducted a study to assess the factors
that affect Islamic and conventional banks performance in GCC for the period 2002–
2009. The study had a sample of 13 Islamic and 38 conventional banks. The factors
studied were foreign ownership, bank specific variable and macroeconomic variables.
The study concluded that bank’s equity was important factor in maximizing the
profitability for conventional banks but negatively affected Islamic banks. As for cost
to income ratio reflected a negative and significant impact on performance of both
banks. The size of the banks supported the economies of scale utilizing the ROE for
Islamic banks. However, foreign ownership has no impacts on both banks, while
GDP was positively correlated; Inflation was found to be negatively related to the
banks performance.
A study by Ongore and Kusa (2012), investigated the determinants of financial
performance of commercial banks in Kenya, during the period 2001-2010, using
multiple regression and t-statistic analysis. The study had a sample of 37 banks fully
operational during the entire study period. The findings showed that bank specific
factors affected performance of commercial banks except for liquidity variable, while
the GDP (positively related) and inflation variables coupled with moderated
ownership identity showed an insignificant result at 5% significance level.
Accordingly a research conducted by Musundi (2008), on the relationship between
size and profitability of Kenyan commercial banks between the year 1998 and 2007.
The findings reveals that some variables like the number of ATM, number of

22
employees, net liquid assets, shareholders funds, customer deposits and bank loans
have positive effect on profitability; whereas the number of branches, total assets and
number of customers have a negative effect on profitability of banks.
Ibrahim (2009) compared performance of Kenyan conventional and Islamic banks
during 2008-2009, using financial performance ratios with a sample of 2 banks from
each group. The t-test and f-test were employed to analyze the data. The study
revealed that conventional banks were more profitable and efficient but more risky
and less solvent than Islamic banks. Additionally, another more recent comparative
study done by Halkano (2012), on performance of Islamic and conventional banks in
Kenya, for the period 2008-2011, from a selected sample of 2 Islamic and 5
conventional banks using financial ratios. The study captured four broad measures of
financial performances ratios such as profitability, liquidity, efficiency and risk and
solvency of banks. In comparison to Islamic banks, the conventional banks performed
better in all areas save for liquidity where the Islamic banks performed better.
2.4 Summary of Literature Review
The evolution and widespread practice of Islamic banking and finance over the past
four decades has generated interest and discussion amongst scholars, economists and
policy makers. This led to a large number of empirical studies been conducted about
determinants of bank performance coupled with comparative analysis. It is evident
from the above literature review that comparative bank performance showed mixed
results about Islamic and conventional banks performance. Bank performance is
measured by use of different financial indicators especially panel data, CAMEL rating
and financial ratios have been commonly applied. The above literature discussion
confirms a strong linkage between bank characteristic, industry factors and its

23
performances. Therefore this research aims to analyze how bank’s specific; industry
characteristics and macroeconomic variables affect the performance of two set of
banks, where both types of financial institutions operates side by side in Kenya.

24
CHAPTER THREE
RESEARCH METHODOLOGY
3.1 Introduction
This chapter provides an overview of the research methodology and tools used to
gather data to meet the objective of the study. It specifically entails the research
design, target population and sample design, data collection methods, and data
analysis techniques applied in the study.
3.2 Research Design
The study adopts a causal comparative research design to evaluate the factors
influencing the financial performance of Islamic and conventional banks in the
country. According to Mugenda and Mugenda (2003), in a causal comparative design,
the study creates two or more distinct group(s) whose performances are compared
based on certain parameters.
3.3 Population of the Study
The target population for this study was 43 commercial banks operating in Kenya,
broadly classified into three peer groups based on a weighted composite index of total
assets, deposits, capital size, number of deposit accounts and loan accounts. The
composite index market shares classified banks into the following categories: large
banks >5 per cent, medium banks >1 to <5 per cent and small banks <1 percent of
aggregate market share. As 31st December 2012, the statistics reveals that there are
only 6 large banks, 15 medium size banks and 22 small size banks (CBK, 2012).

25
3.4 Sampling Design and Sample Size
Cooper and Schindler (2003) define a sampling design as the procedures used in
selecting the sample. The stratified sampling technique was used to pick the sample
strata based on composite index. Simple random sampling method was employed to
select the conventional banks under study from each category of strata groups. The
selected sample consists of 10 commercial banks operating in the country during the
period under review. However, conventional banks offering window sharia’h
products and the entire medium size banks were excluded from the study. The aim of
the study was to compare Islamic banks to its peer of small size and large
conventional banks to be able to elicit any performance differences between the
groups based on their orientations. As shown in Table 3.I below, the sample
proportion for each category was quite adequate.
Table 3.1: Population and sample frame
Categories of banks Population
size
Sample
size
Sample
Proportion
Sample banks
Islamic banks (small–size) 2 2 100% First community and
Gulf Africa bank
Small-size Conventional
banks (peer)
20 5 25% ABC,Trans-National,
Victoria, K-Rep and
Development bank
Large-size Conventional 6 3 50% Equity, Coop and
Standard Chartered
Source: Author (2013)
26
3.4 Data Collection
The secondary data were sourced from the published quarterly and annual financial
statements and websites of the selected commercial banks. The sample is a balanced
panel data set observed over 16 quarters from year 2009–2012. The data on country’s
macroeconomic and financial sector variables was sourced from CBK, World Bank
and Kenya National Bureau of Statistics (KNBS) publications and websites.
3.5 Data Analysis
Statistical analysis was performed on data obtained from secondary source. The
process involved preparation of data through coding, editing and cleaning to ensure
accuracy and consistency and avoid any omission. The Statistical Package for Social
Sciences (SPSS) was used to provide the descriptive statistics (means, standard
deviations Kurtosis, and skewness) to elicit some differences in the performances.
The Analysis of Variance (ANOVA) was used to run the multiple linear regression
model outlined hereunder to determined how the internal and external variables
affects the performance of commercial banks in the country. Thereafter, several
techniques of data presentation including tables and graphs were employed to explain
the findings.
3.5.1 Profitability Determinants and Variables
Understandably profitability is the key yardstick for measuring financial performance
of any institution. Sinkey (as cited in Zeitun, 2012) described ROA as the best
measure of profitability. This study employed CAMEL rating approach in the
regression model to measure the profitability. The ROA as the major profitability
indicator (dependent) was used against 10 explanatory variables including

27
macroeconomic indicators. The bank-specific factors (independents) that was
considered in this study include; capital adequacy, asset quality (credit risk),
management capability, liquidity, interest spread, and bank size. This was proxy by
selected ratio to measure the influence on profitability. The financial sector
development and macroeconomic variables considered in this study are bank sector
development (BSD), stock market capitalization (SMC), real GDP growth rate and
inflation rate.
3.5.2 Model Formulation
According Hair, Black, Babin, Anderson, and Tathan (2006) multiple regression
analysis is described as a statistical technique that is used to analyze the relationship
between dependent variable and several independent variables. The objective is to
predict the dependent variable from known independent variables. Through the use
the weights also referred as regression coefficient, the relative contribution of each
independent variable to dependant variable is established. These weight influences the
power of prediction in the model. In this study, in order to identify the significant
factors and the relationship that affect the profitability of banks (2009-2012), a
multiple regression model was employed.
The model equation is as follows;-
yi,t = α + β1 CAi,t + β2AQi,t+ β3MEi,t + β4LQ i,t + β5INTSPRi,t+ β6SIZE i,t+
β7BSDi,t+ β8FMDi,t +β9GDPi,t + β10INFLi,t + εi,t
Where;
yi,t = Return on Assets (ROA) for bank i in year t, (dependent variable )

28
CAi,t = Capital Adequacy ratio ( Equity /Total Asset) for bank i in year t,
AQi,t = Asset Quality ratio (Gross nonperforming loan /Total loan) for bank i in year
t,
ME i, t = Management Efficiency ratio (Total Cost /Total income) for bank i in year t,
LQi, t = Liquidity ratio (Cash and cash equivalent/ Deposit & Borrowing) for bank i
in year t,
INTSPRi,t = Interest Spread ratio {(Interest income/earnings assets) minus (Interest
expense/(deposit and borrowing)} for bank i in year t,
SIZEi, t = Bank Size calculated as log of Total Asset for bank i in year t,
BSD, t = Banking Development index calculated as (Credit to private sector/GDP) in
year t,
FMD, t = Financial Market Development ratio as (Stock Market Capitalization/GDP)
in year t,
GDP, t = Real Gross Domestic Product growth rate in year t,
INFL, t = Inflation rate calculated as percentage change in Overall annual Inflation
rate in year t,
α = a constant,
β1 – β10 represents coefficients parameters, and
εi, t = error term; where i is cross sectional and t is time identifier

29
Dummy variables for the bank type were introduced.
The coefficient of determination R2 and the adjusted R
2 was used to determine the
level of variation in profitability of commercial bank in Kenya that can be explained
by independent variables, coupled with level of contribution and direction by each
factor as best predictor of dependent variable; while F-test was applied to assess any
statistical significance differences in the profitability performance of two sets of
banks.

30
CHAPTER FOUR
DATA ANALYSIS, RESULTS AND DISCUSSION
4.1 Introduction
This chapter presents analysis and findings of the study as set out in the research
objective and research methodology. The study findings are presented on what
influences performance of Islamic banks as contrasted with conventional banks. The
result findings include descriptive statistics, test for multicollinearity, and
econometric results amongst others. The data was exclusively gathered from the
secondary source obtained from selected banks websites, records from Central Bank
of Kenya and Economic survey reports from the Kenya National Bureau of Statistics.
4.2 Results and Discussion
4.2.1: Trend Analysis of bank performance
The result finding in Figure 4.1 below shows that all bank type exhibited a
progressive growth trends during the period. The cyclical trend is due to lack of
annualization of the data in the quarters though cumulatively taken at end of every
period. Perhaps, it can be deduced from the trend lines that though conventional banks
exhibited a better performance than Islamic banks in terms of profitability, the later
has demonstrated a superior performance and signs of viable business in the Kenyan
financial market, as reflected by a steep rise from loss making institution at the start of
period to a trajectory growth, in the later years to the extent of even matching the
performance of small commercial banks by December 2012. This means that there is

31
a greater potential and business case for Islamic banks in the country, save for lack of
enabling legal and regulatory framework which can pose some challenges.
Figure 4.1: Bank Profitability Trend (ROA)
Source: Author (2013)
Table 4.1: Descriptive statistics for profitability variable (ROA)
Dependent Variable N Min. Max. Mean SD
Return on Assets = Profitability (y) [Net
Profit After Tax/ Total Assets]
160 (0.033) 0.056 0.014 0.017
No of Observations 160
Source: Author (2013)

32
As per Table 4.1 above, the banking sector recorded an average profitability of 1.4
percent measured by return on assets over the period 2009-2012. During the study
period, ROA values in the group ranges from a minimum and negative value of (3.3
percent) to a maximum of 5.6 percent. This result is slightly lower compared to the
study by Ongore and Kusa (2012) on performance of Kenyan banks during the period
2001-2010, where the average ROA stood at 1.96 percent. The difference in the
performance is attributed to the inclusion of startup and loss-making Islamic banks in
the current study that was hitherto excluded from their study due to limitation of data.
Table 4.2: Descriptive statistics for independent variables
Code Independent Variable N Min. Max. Mean SD
CA Capital Adequacy Ratio = [Equity
/Total Asset]
160 0.089 0.394 0.165 0.059
AQR Asset Quality Ratio = [Gross
nonperforming loan /Total loan]
160 0.000 0.267 0.078 0.068
ME Management Efficiency = [Total
Cost /Total income]
160 0.338 1.991 0.717 0.314
LQ Liquidity = [Cash and cash
equivalent/ Deposit & Borrowing] 160 0.186 0.861 0.452 0.159
Intspr Interest Spread = [(Interest
income/earning assets) minus
(Interest expense/deposit and
borrowing)]
160 0.001 0.180 0.055 2.717
Size Bank Size = [Log Total Assets] 160 6.461 8.334 7.272 0.597
BSD Banking Sector Development=
[Credit to private sector/GDP (%)] 160 0.300 0.381 0.340 0.030
FMD Financial Market Development =
[Stock Market Capitalization/ GDP
(%)]
160 0.303 0.449 0.375 0.037
RGDP Real GDP = [Real GDP Growth
rate (%)]
160 0.010 0.072 0.043 0.015
33
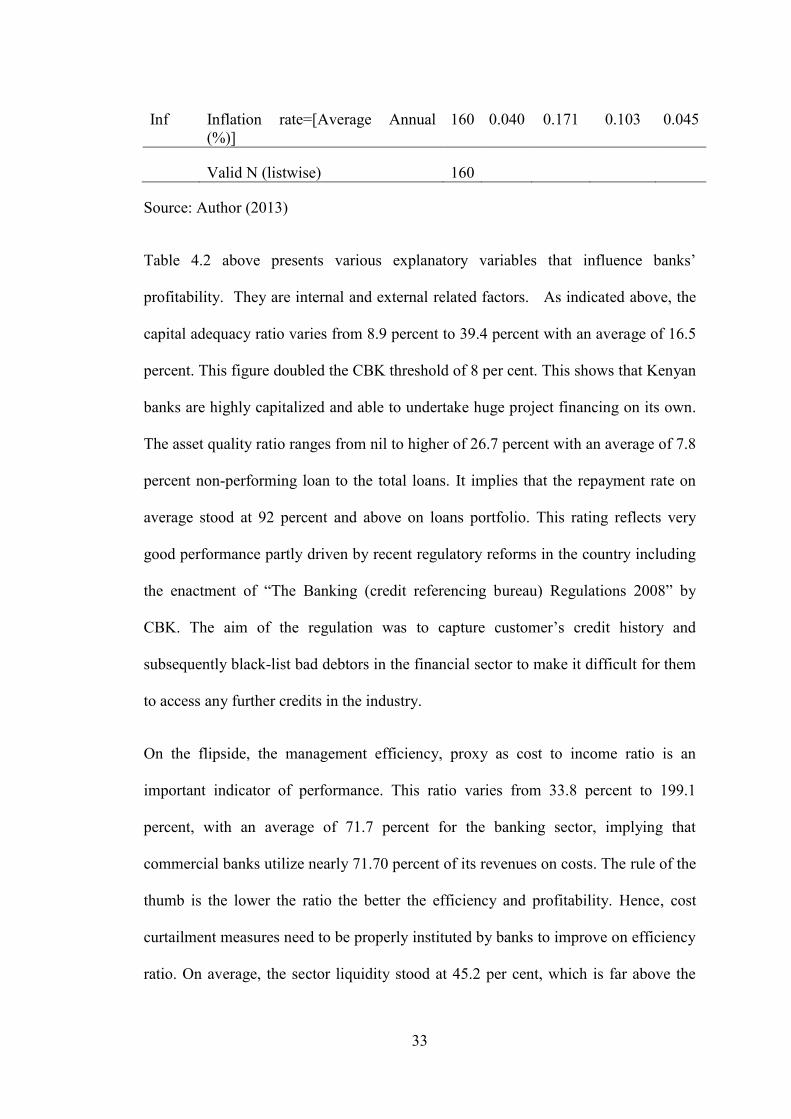
Inf Inflation rate=[Average Annual
(%)]
160 0.040 0.171 0.103 0.045
Valid N (listwise) 160
Source: Author (2013)
Table 4.2 above presents various explanatory variables that influence banks’
profitability. They are internal and external related factors. As indicated above, the
capital adequacy ratio varies from 8.9 percent to 39.4 percent with an average of 16.5
percent. This figure doubled the CBK threshold of 8 per cent. This shows that Kenyan
banks are highly capitalized and able to undertake huge project financing on its own.
The asset quality ratio ranges from nil to higher of 26.7 percent with an average of 7.8
percent non-performing loan to the total loans. It implies that the repayment rate on
average stood at 92 percent and above on loans portfolio. This rating reflects very
good performance partly driven by recent regulatory reforms in the country including
the enactment of “The Banking (credit referencing bureau) Regulations 2008” by
CBK. The aim of the regulation was to capture customer’s credit history and
subsequently black-list bad debtors in the financial sector to make it difficult for them
to access any further credits in the industry.
On the flipside, the management efficiency, proxy as cost to income ratio is an
important indicator of performance. This ratio varies from 33.8 percent to 199.1
percent, with an average of 71.7 percent for the banking sector, implying that
commercial banks utilize nearly 71.70 percent of its revenues on costs. The rule of the
thumb is the lower the ratio the better the efficiency and profitability. Hence, cost
curtailment measures need to be properly instituted by banks to improve on efficiency
ratio. On average, the sector liquidity stood at 45.2 per cent, which is far above the

34
statutory minimum requirements of 20 percent. This shows that Kenyan banks are
highly liquid in order to cushion it from any adverse liquidity related matters. The
interest spread was also important on financial performance of banks. The study
reveals that on average Kenyan banks enjoys interest spread of 5.5 percent between
interest charged on loan facility vis-à-vis interests paid on customer’s deposits and
borrowed funds.
Similarly, the study considered macroeconomic factors and interestingly the outcomes
was quite promising, despite the slowed growth of the global economy. During the
study period, the average GDP stood at 4.3 percent and the inflation rate was at 10.2
percent, while the banking sector development and stock market capitalization
showed an upward trend averaged 34 percent and 37.5 percent respectively, thus
supporting the banks performance.
4.3 Relationship between Bank Performance and its Determinants
This study sought to establish the relationship between bank characteristic, industry
and macroeconomic factors and the profitability of Kenyan banks. From the onset, it
was hypothesized that bank characteristics, industry specific factors and
macroeconomic variables affects bank financial performance. Therefore, the first task
was to establish the effects of relationship between profitability (ROA) and bank
characteristic variables represented by capital adequacy, asset quality, management
efficiency, liquidity, interest spread and size by using the multiples regression
analysis formula restated as below.
Yi,t = α + β1CAi,t + β2AQi,t + β3MEi,t + β4LQi,t + β5INTSPRi,t + β6SIZEi,t + εi,
35
4.3.1 Model Assumptions
In order to ensure that the collected data is suitable for the basic linear regression
model, some few diagnostic tests were carried out to ensure that key assumptions of
the regression model are not violated. Tests to detect the presence of multicollinearity
goodness of fit and autocorrelation were conducted as follows.
4.3.1.1 Multicollinearity Test
Collinearity is defined as linear association between two independent variables.
Multicollinearity refers to correlation among three or more independent variables
whereas perfect multicollinearity refers to an extreme case of collinearity or
multicollinearity, in which one independent variable is perfectly predicted by another
independent variable (Hair et al, 2006). The presence of multicollinearity condition
distorts the standard error of estimates and hence leading to problems when
conducting tests for statistical significance of parameters. The study conducted a
multicollinearity tests to determine if two or more predictor (independent) variables in
the multiple regression model are highly correlated. The diagnostic measures for
multicollinearity check are tolerance and variance inflation factor (VIF) values. The
two measures indicate the degree to which each independent variable is explained by
another independent variable (Hair et al, 2006). The Tolerance value indicates the
percent of variance in the independent variable that cannot be accounted for by the
other independent variable, while VIF is the inverse of tolerance. Table 4.3 below
showed that tolerance values ranged between 0.292 and 0.683, while VIF values
ranged between 1.464 and 3.423, which is within the acceptable limits placed by
researchers. According to rule of thumb, tolerance values above 0.1 or 10 percent
(Tabachnick and Fidell, 2001). Likewise, Gujarati (2003) rule of thumb regarding the

36
benchmark of VIF value is that if VIF value does not exceed 10 for a variable there is
no need for concern. The objective is therefore to use independent variables that have
low multicollinearity. While similarly, each independent variable should possess
higher correlation with dependent variable for better predictive power (Hair et al,
2006).
Table 4.3: Multicollinearity Statistics
Statistic CA AQ ME LQ INTSPR SIZE BSD FMD GDP Infl
Tolerance 0.646 0.657 0.641 0.510 0.693 0.682 0.516 0.295 0.409 0.408
VIF 1.548 1.522 1.561 1.959 1.443 1.466 1.938 3.384 2.445 2.454
Source: Author (2013)
4.3.2 Correlation Matrix
The study used correlation matrix to establish whether linear relationship exists
between individual variable and profitability of commercial banks. The higher the
coefficient values, the stronger the relationship, and the smaller the coefficient values
the weaker relationship to be observed. The signs also indicate the direction of the
relationship such that a positive sign signifies a positive association, while a negative
sign is an indicator of inverse relationship. Correlation coefficient measures only the
degree of linear association between two variables. Values of correlations coefficient
are always between -1 and + 1. A correlation coefficient of + 1 indicates that two
variables are perfectly related in a positive linear sense while a correlation coefficient

37
of -1 indicates that two variables are perfectly related in a negative linear sense. A
coefficient of 0 indicates no linear relation exists.
The correlation results presented on Table 4.4 shows that there was low but positive
linear association between profitability and capital adequacy and liquidity; moderately
high and positive linear association was established between profitability and size;
negative but low linear relationship was established between profitability and asset
quality and interest spread; and, negative and strong linear association was established
between management efficiency and profitability. This was expected as costs reduce
profitability. However, the correlation matrix shown in table 4.4 just indicates
significance of relationship but not necessarily an indicator of presence of
multicollinearity between variables. Therefore the strong correlation is only presence
between the ROA and the independent variables save for asset quality and liquidity
variables.
Table 4.10 in the appendices’ shows the effects of correlation after the introduction of
macroeconomic variables as control variables. From the analysis the banking sector
development, financial market development and real GDP have positive and low
association to profitability, while inflation shows negative and low association to
profitability. The financial sector development of course is expected to compliment
the roles of banks in availing cash for investment purpose through bonds and shares
listing. Therefore the relationship was expected to be positive. It is expected that GDP
grow imply better economic prospects and hence banks also make good returns in
terms of profitability than during economic turmoil’s when banks post declined
profitability. Similarly inflation as macroeconomic indicators has negative effects on
pricing and purchasing power of consumers hence affecting cost of living negatively.

38
Table 4.4: Correlation Matrix for Bank characteristics variables
Variables
Capital
Adequacy
Asset
Quality
Management
Efficiency Liquidity
Interest
Spread Size
CA 1.000
AQ 0.417 1.000
ME -0.011 0.107 1.000
LQ 0.425 0.416 -0.239 1.000
INTSPR 0.034 0.074 0.098 -0.372 1.000
SIZE -0.223 -0.321 -0.437 -0.163 0.101 1.000
ROA (y) 0.213* -0.096 -0.765* 0.144 0.301* 0.504*
(*) denote significance at 5% level (two-tailed) to profitability (y).
Source: Author (2013)
4.3.3: Goodness of Fit Statistics
In the endeavor, the study sought to determine the goodness of fit of the regression
equation using the coefficient of determination between the overall independent
variables and profitability. The coefficient of determination established the strength of
the relationship. Table 4.5 illustrates that the strength of the relationship between
profitability and independent variables. From the determination coefficients, it can be
noted that there is a strong relationship between dependent and independent variables
given an R2 values of 0.830 and adjusted R
2 value of 0.819. This shows that the
explanatory variables (capital adequacy, asset quality, management efficiency,
liquidity, interest spread and size) as moderated by the intervening variables (banking
development index, financial market development, real GDP and inflation rate) in this

39
study accounts for 81.9% (or 80.6% for bank specific factors only) of the variations in
profitability as measured by ROA. This implies that the internal factors play a
significant role in bank profitability compared to external factors which accounts for
1.3% only.
Therefore this results support the Efficiency Structure Theory (EST) which suggests
that enhanced managerial capability and scale efficiency level leads to higher
concentration, and higher profitability. Thus, the management and the board should
ensure that internal factors are objectively planned and prioritized for a better
performance.
Table 4.5: Goodness of Fit Statistics
No of
Observations
Sum of
weights
DF2 R² Adj. R² MSE RMSE DW Cp
160 160 149 0.830 0.819 000 0.007 1.581 11
Source: Author (2013)
The study used Durbin Watson (DW) test to check that the residuals of the models
were not autocorrelated since independence of the residuals is one of the basic
hypotheses of regression analysis. Being that the DW statistic were close to the
prescribed value of 2.0 (1.581) for residual independence, it can be concluded that
there was weak autocorrelation. Similarly, where the values of mean square error
(MSE), root mean squared error (RMSE) and sum square error (SSE) are either zero
or approaching zero, it’s an indicative of better model useful for prediction as
indicated below.

40
4.3.4: Significance of the Regression Model
The first step in interpreting a regression model is to ensure that overall model is
statistically significant. This implies that empirical assessment on whether regression
model can be generalized for whole population from which the sample was drawn
from (Hair et al, 2006). In this study, Analysis of Variance (ANOVA) was used to
make simultaneous comparisons between two or more means; thus, testing whether a
significant relation exists between variables (dependent and independent variables).
This helps in bringing out the significance of the regression model. The ANOVA
results presented in Table 4.6 shows that the regression model has F-value of 72.998
and the associated p-value of the F-test <.0001, which is less than the significance
level of 0.05. This indicates that the model has a probability of less than 0.1% of
giving false prediction. This test implies the significance of the overall model.
Table 4.6: Significance of the Model
Source DF Sum of
squares
Mean squares F Pr > F
Regression 10 0.037 0.004 72.998 < 0.0001
Error 149 0.008 0.000
Total 159 0.045
Source: Author (2013)

41
4.3.5 Regression Results for each Variable
This section examines the role played by each independent variable in the prediction
of the dependent variable. The t-test is used to perform the examination. The
regression coefficient provides two kind of information’s: first, the strength of the
relationship between the independent variables and the dependent variable, in the
regression equation, secondly the type of the relationship whether positive or negative
sign. The coefficient values indicate the change in dependent variable as a result of a
unit change in independent variable (Hair et al, 2006).
The empirical result as per Table 4.7 indicates that capital adequacy variable has a
positive and significant impact on commercial banks profitability in the country. This
result is consistent with previous studies (Bashir and Hassan, 2003; Srairi 2009;
Ongore and Kusa 2012) providing evidence to the argument that banks with a strong
capital base are able to pursue business opportunities more effectively than less
capitalized banks. Also strong capital base enabled banks to continue advancing
credits to private sector which is gradually experiencing a tremendous growth in the
recent past. Due to oligopolistic nature of Kenyan banking sector that generally
pursues deals with a moderate risk hence earning higher profitability than financing
highly risky projects.
Asset quality variable depicts a negative and significant relationship to profitability
ratio for all banks in the sample. This can be explained by the fact that provisioning as
an expense has inverse relationship to profitability. However, asset quality ratio has
been on upward trend especially with the licensing of credit reference bureaus in the
country implying less provisioning because of the stringent measure put in place at
screening and appraisal levels to lockout serial defaulters from accessing credit. This

42
finding is consistent with Srairi, (2009); but differed from (Jaffar and Manarvi, 2011)
study which reported that asset quality has no impact on profitability.
Management efficiency variable proxy as cost to income ratio shows a negative and
strong statistical association to banks profitability. This finding shows that the cost
decisions of bank management are instrumental in influencing bank performance.
This result is consistent with previous studies by (Kosmidou and Pasiouras, 2007;
Srairi, 2009; Zeitun, 2012) among others, but inconsistent with the study by Ongore
and Kusa 2012, which showed a positive relationship between operational efficiency
and banks profitability in Kenya. However, the coefficient value is expected to be
negative because of inverse relationship between cost and profits.
The liquidity variable was found to be positive and strongly related to profitability of
the banks. This result is consistent with Ongore and Kusa, (2012) but differ from Al-
Tamimi, (2010) findings. Given that all banks have more than threshold liquidity the
positive impact was expected. However, liquidity variable is a double edged effect on
banks because more of it implies idle cash which results to reduction in profits, while
lack of it implies liquidity risk which can endanger bank smooth operations due to
adverse shocks. Therefore management has to strike a trade off as to the level of
average level of liquid cash that a bank required to maintain at any given time.
Turning to interest spread (financing income spread is a term for Islamic bank)
variable as expected shows positive and strong association to profitability. This
implies that commercial banks though has diversified its revenue based still heavily
relies on interest income; hence, interest spread still matter a lot. After the
introduction of dummy variables for all bank-type, the study revealed that
individually, none of the bank groups (as indicated in Table 4.10 appendix) have any
43
significance correlation to interest spread factor. In fact the small conventional banks
category showed negative and insignificant relation to interest spread implying that
they have either diversified their revenues stream or their margin is highly eroded
while in the case of Islamic banks and large conventional banks reflects positive
relationship to profitability.
The size variable proxy as log of total assets has a positive and significant influence
on profitability for all bank types. This finding is consistent with previous studies
(Maghyerech and Shammout, 2004; Zeitun, 2012). The bank size is a measure of the
outcome of the management strategic goal and policy objective in order to benefit
from economies of scales gained over years, such that large banks are expected to
operate efficiently at lower cost hence better profitability.
As regards, the impacts of external factors such as the macroeconomic and industry
specific variables, these variables has mixed results on banks profitability as indicated
in Table 4.7. The banking sector development variable proxy as value of credit to
private sector revealed a positive and insignificant relation to banks profitability. This
result is inconsistent to Srairi (2009) findings which showed significant effects.
Likewise, the stock market capitalization shows negative and insignificant result, and
was therefore inconsistent with results of Srairi, (2009), study which showed that
stock market capitalization had positive association with profitability.
Additionally, the empirical results on macroeconomic factors represented by real
GDP growth rate and inflation showed mixed results. The study revealed that real
GDP growth rate was positive and significantly related to profitability, while inflation
rate was negatively related to performance, though, insignificant. These findings was
consistent with Srairi (2009) but inconsistent with (Ongore and Kusa, 2012; Zeitun,
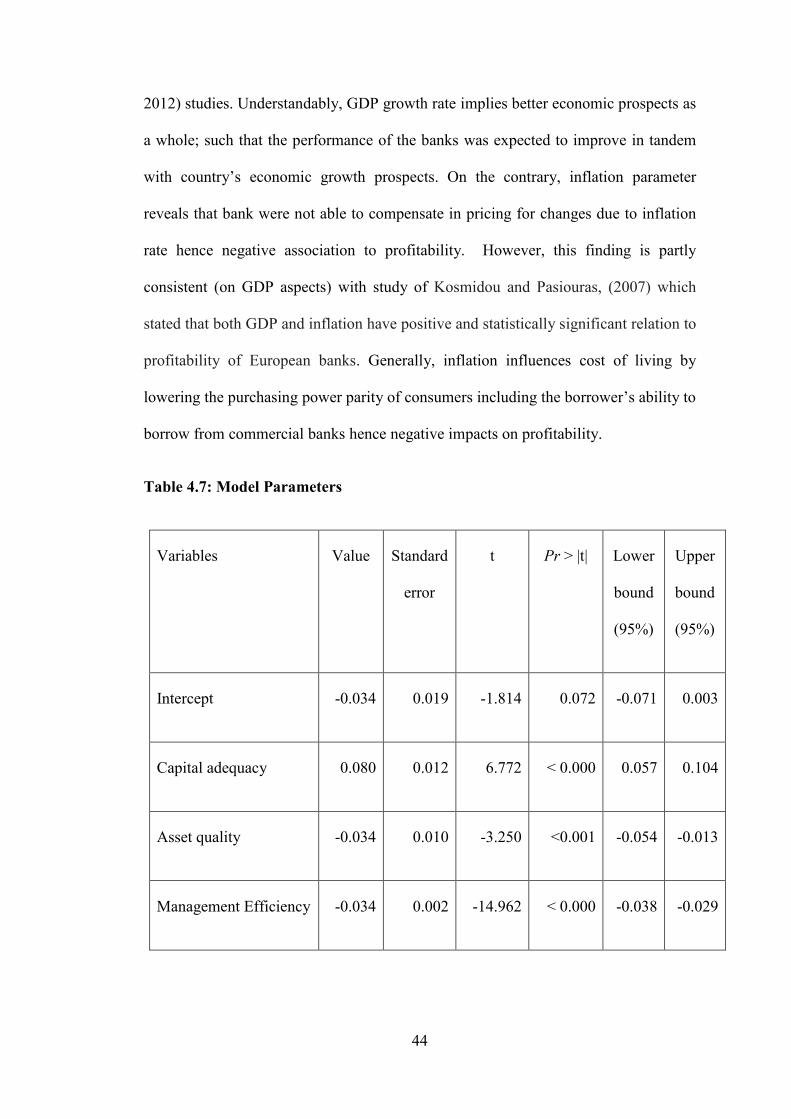
44
2012) studies. Understandably, GDP growth rate implies better economic prospects as
a whole; such that the performance of the banks was expected to improve in tandem
with country’s economic growth prospects. On the contrary, inflation parameter
reveals that bank were not able to compensate in pricing for changes due to inflation
rate hence negative association to profitability. However, this finding is partly
consistent (on GDP aspects) with study of Kosmidou and Pasiouras, (2007) which
stated that both GDP and inflation have positive and statistically significant relation to
profitability of European banks. Generally, inflation influences cost of living by
lowering the purchasing power parity of consumers including the borrower’s ability to
borrow from commercial banks hence negative impacts on profitability.
Table 4.7: Model Parameters
Variables Value Standard
error
t Pr > |t| Lower
bound
(95%)
Upper
bound
(95%)
Intercept -0.034 0.019 -1.814 0.072 -0.071 0.003
Capital adequacy 0.080 0.012 6.772 < 0.000 0.057 0.104
Asset quality -0.034 0.010 -3.250 <0.001 -0.054 -0.013
Management Efficiency -0.034 0.002 -14.962 < 0.000 -0.038 -0.029

45
Liquidity 0.010 0.005 2.003 0.047 0.000 0.020
Interest Spread 0.183 0.021 8.808 <0.000 0.142 0.224
Size 0.006 0.001 5.135 <0.000 0.004 0.008
Banking Sector Devpt. 0.027 0.026 1.025 0.307 -0.025 0.078
Financial Market
Development
-0.024 0.028 -0.869 0.386 -0.080 0.031
Real GDP 0.134 0.058 2.298 0.023 0.019 0.249
Inflation rate -0.014 0.020 -0.724 0.470 -0.053 0.025
Source: Author (2013)
The multiple linear regression analysis formula is given as:
Yi,t = α + β1CAi,t + β2AQi,t + β3MEi,t + β4LQi,t + β5INTSPRi,t + β6SIZEi,t +
β7BSDi,t + β8FMDi,t + β9GDPi,t + β10INFi,t + εi,
From the table, the equation for regression model is formed as follows:
Profitability (y) = -0.034+ 0.080*Capital Adequacy - 0.034*Asset Quality –
0.034*Management Efficiency + 0.010*Liquidity + 0.183*Interest Spread +
0.006*Size + 0.027*Banking Sector Development – 0.024*Financial Market
Development + 0.134*Real GDP – 0.014*Inflation Rate

46
As derived from the result in Table 4.7 above, the equation indicates that holding
capital adequacy, asset quality, management efficiency, liquidity, interest spread, size
and macroeconomic factors at zero, profitability ratio (ROA) will be -0.034. It was
further established that a unit increase in capital adequacy at a time, while holding
other factors constant, will lead to an increase in ROA by a factor value of 0.080 as
indicated in the above unstandardized regression coefficient value column with a
corresponding p-values (in this case p<.000) and similar interpretation for the rest of
factors. Among the intervening variables, Banking Sector Development (0.027,
p=.307) and real GDP (0.134, p=.023) had positive effect on commercial banks
profitability, though the later is significant; while financial market development (-
0.024, p=.386) and the inflation rate (-0.014, p=.470) had negative effects on
commercial banks profitability.
As a matter of fact, the p-value is an important indicator of regression model. If the p-
value of the regression coefficient of an independent variable is less than the
significance level (r <0.05), then as a rule, this particular regressor is a significant
predictor of the dependent variable and vice versa. From the above table, it is clear
that all bank specific variables are significantly related to ROA; hence they are good
predictor of the model. However, from the intervening factors only real GDP is best
predictor having met the threshold.
The above figure 4.2 depicts a standardized graphical presentation of the impacts of
internal and external factors on banks performance in Kenya. A review of the
standardized regression coefficients of the independent variables indicates that among
the 10 independent factors, the interest spread is best positive predictor while the
management efficiency is best negative predictor for bank profitability.

47
Figure 4.2: Profitability Standardized Coefficients
Source: Author (2013)
The bar graph shows a positive relationship between capital adequacy, liquidity,
interest spread, size, banking sector development and real GDP growth rate. While
asset quality, management efficiency, financial market development, and inflation
shows negative association to profitability measured by return on assets. The higher
the graph from integer; the stronger the impact it has on the profitability and the
closer it’s the weaker the relationship.
4.4 Profitability Performance by Bank Type
This study’s second objective sought to establish whether profitability based on the
bank-type across the groups of small, large and Islamic banks is similar or not. The
results of this findings is presented in Table 4.8 below, which shows that large banks
had the largest positive ROA value with corresponding lowest standard deviation

48
(M=0.0262, SD=0.0126), followed by small commercial banks ROA at (M= 0.0134),
whereas Islamic bank recorded negative value of (M=-.0028). The Islamic banks
recorded the highest variance in performance given a standard deviation of 0.0165,
reflecting disparities in the performance over the period. Perhaps, the dismal
performance of Islamic bank can be attributed to its model, which is still at formative
stage in the country. During this period, Islamic banks have recorded losses in the first
three years, of the five years of its operations. This is of course expected for any start-
up venture especially of higher capital intensive. Another reason for poor performance
could be due to aggressive set up of branch networks in a short span, without a proper
timeframe for breakeven from earlier branches leading to accumulation of losses
compared to conventional banks which are matured, well structured and highly
capitalized, and hence increasing their profitability levels.
In nutshell, the analysis below reveals that large banks performed better among the
groups, followed by small commercial banks; while Islamic banks recorded the least
profitability performance. This findings is consistent with previous studies (Ibrahim,
2009; Jaffar & Manarvi, 2011; Halkano, 2012: Soylu & Durmaz, 2013) providing
support to the argument that conventional banks performed better than Islamic banks
in terms of profitability but contradicts Mahmood, (2005) finding which showed that
Islamic bank performed better than conventional banks. This set of performance
scenarios can best be explained by Relative Market Power (RMP) theory, which
depicts that banks with more differentiated products and enjoys higher concentration
in terms of market powers generates more profits than the banks with lower market
share. This finding can further be explained by Table 4.10 at the appendices which
shows that large banks are strongly and positively associated with profitability,
compared to small size conventional banks which is negatively and insignificantly

49
associated with ROA, while Islamic banks is strongly but negatively associated with
ROA. This implies significance difference in performance between the groups.
Table 4.8: Profitability (ROA) across Bank Type
Bank Type Mean SD Kurtosis Skewness
Small Conventional Banks .0134 .0127 2.213 (.904)
Islamic Banks (small) (.0028) .0165 (.887) (.420)
Large Conventional Banks .0262 .0126 (.298) .535
All banks combined .0140 .0168 .949 (.519)
Source: Author (2013)
The regression model used the Analysis of Variance (ANOVA) test to establish
whether there is a significant difference in profitability of the commercial banks
across groups (Islamic, small and large commercial banks). The ANOVA results
presented in Table 4.9 shows that there was a significant differences in the
profitability of the commercial banks (p<.001); simply put, the probability of this
result occurring by chance is less than one time out of 1,000. Therefore, the
differences in profitability are real and not due to sampling error. More importantly,
from Table 4.10 at the appendices, after introduction for the dummy variable for
bank-type, Islamic bank is strongly and negatively correlated to ROA, compared to
small size conventional bank which is negative and insignificantly correlated; while
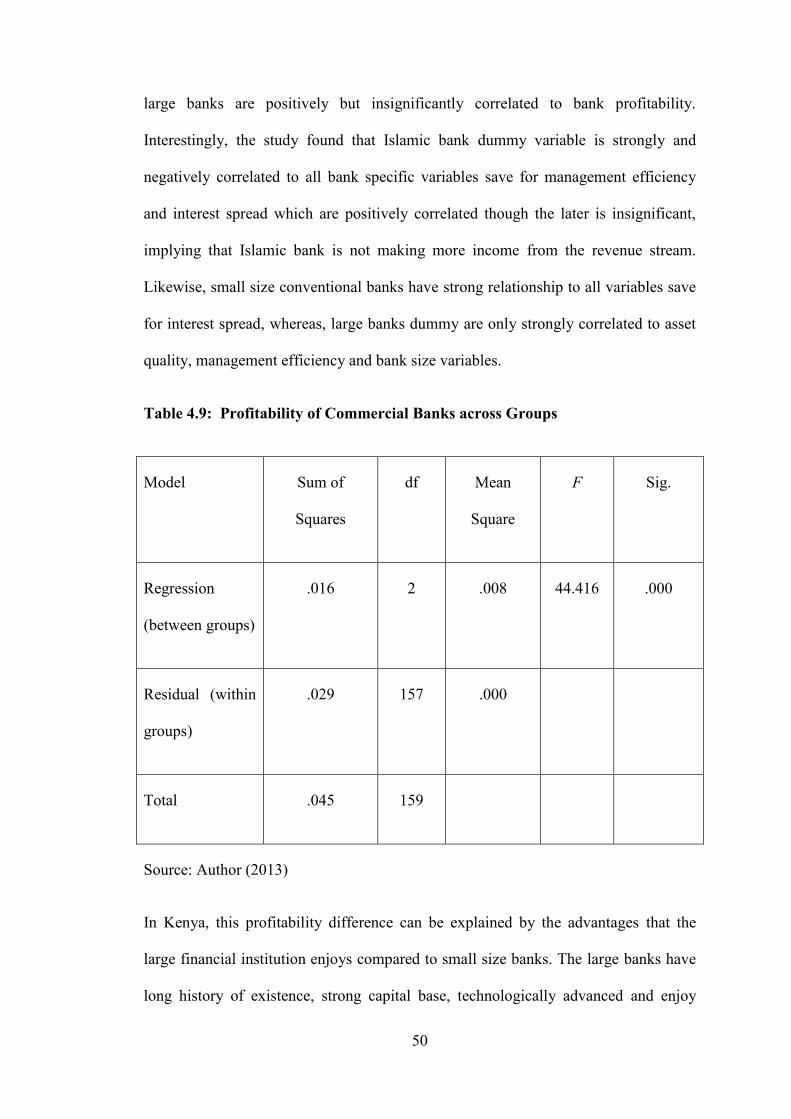
50
large banks are positively but insignificantly correlated to bank profitability.
Interestingly, the study found that Islamic bank dummy variable is strongly and
negatively correlated to all bank specific variables save for management efficiency
and interest spread which are positively correlated though the later is insignificant,
implying that Islamic bank is not making more income from the revenue stream.
Likewise, small size conventional banks have strong relationship to all variables save
for interest spread, whereas, large banks dummy are only strongly correlated to asset
quality, management efficiency and bank size variables.
Table 4.9: Profitability of Commercial Banks across Groups
Model Sum of
Squares
df Mean
Square
F Sig.
Regression
(between groups)
.016 2 .008 44.416 .000
Residual (within
groups)
.029 157 .000
Total .045 159
Source: Author (2013)
In Kenya, this profitability difference can be explained by the advantages that the
large financial institution enjoys compared to small size banks. The large banks have
long history of existence, strong capital base, technologically advanced and enjoy

51
economies of scale over the years compared to other bank-types, which are less
capitalized and hence could not invest in latest technology and experienced human
capital. More importantly, the small size conventional banks by classification through
weighted composite index of have less than 1 percent of the markets share, while the
large banks is said to have over 5 percent of market shares (CBK, 2012). The
difference in terms of composite market share is quite huge and therefore can explain
the performance difference accruing due to economies of scale. As for Islamic bank,
we understand that the banks is still at early formative stage of establishing itself and
may take sometimes before it can fully competes with large banks. However, it is
important to appreciate that the operationalization of these banking model has
contributed to improvement on financial inclusiveness in the country from the
segment that was hitherto unbanked or ignoring credits due to prevalence of interest
element charged by conventional banks in their transactions that are not permissible
according to their faith.
52
CHAPTER FIVE:
SUMMARY, CONCLUSIONS AND RECOMMENDATIONS
5.1 Introduction
This chapter presents the summary of findings, conclusions and limitation of the study
and the subsequent recommendations.
5.2 Summary of the Findings
This study sought to investigate the determinants of banks’ performance for Islamic
and conventional commercial banks in Kenya during the period 2009 to 2012. The
factors that may affect profitability, measured by the return on assets, involve bank-
specific characteristics, financial industry and macroeconomic variables.
The empirical results showed that all selected set of bank characteristic factors of
capital adequacy, interest spread, asset quality, management efficiency, size and
liquidity are major determinants of bank performance and hence significantly
influence profitability. Perhaps, from the study interest spread, followed by capital
adequacy, bank size and liquidity have positive effects, while the coefficient of
management efficiency followed by asset quality have the highest and negative
impacts on profitability of the commercial banks. This is so because firms including
banks have to invest optimally in both human and capital resources for it to generate
revenues which translate to profitability. Conversely, the study found out that assets
quality has negative and significant influence on profitability. It is expected that
provisioning have inverse relationship to profitability. To isolate the effects of bank
characteristics on bank profitability, industry variables and macroeconomic factors

53
were considered. As for the impact of the industry specific variables, on banks
performance; the study revealed that banking sector development index shows
positive and insignificant relationship to banks profitability. While the financial
market development indicator proxy as stock market capitalization recorded a
negative and insignificant association with bank profitability. The macroeconomic
factors represented by real GDP growth rate showed a positive and significance
relationship to profitability, implying that robust economic growth can support banks
performance, while the factor of inflation variable has negative and insignificant
impact on performance of the commercial banks in Kenya. This may hold true as
inflation tends to escalate the cost of living which lower purchasing power parity for
consumers including absorption of the credit services.
Comparatively, the study revealed that the performance of Islamic, small size
conventional and large conventional banks is significantly different between the
groups, with large banks performed better than the small size conventional banks,
while Islamic banks found to be the least performing in the group over the period of
the study. The Islamic banks least performance is attributed to the fact that these
banks are embracing new phenomenon in Kenya and still emerging concept world
over, with slightly over four decades of existence compared to conventional banks
which have long history of existence and have benefited from empirical studies. In
Kenya, the concept is pretty new, just over five years old but attempting to bridge the
gap in terms of financial inclusiveness for segment not previous served or ignored
borrowing due to charging of interest by conventional banks. However, the bank is
facing some legal and structural challenges that should be addressed in order to
perfects its operations. Therefore, based on trend performance depicted in figure 4.1
above, the banking model is quite viable and promising and it is just a matter of time

54
before it catch up with the rest of commercial banks, provided that the legal and
structural factors are firmed up for ease of doing Islamic compliant business in the
country.
5.3 Conclusions
The empirical results showed that interest spread followed by capital adequacy has the
highest positive significant effects on profitability for commercial banks in Kenya
followed by bank size, real GDP, liquidity and banking sector development
respectively. While management efficiency had the highest significant effect though
negative on profitability for all bank type followed by asset quality, financial market
development and inflation respectively, even though, the later are insignificant.
Overall, this empirical study provides evidence that bank specific factors which are
within the ambit of management and the board have the most significant impacts on
financial performance of commercial banks in Kenya, as depicted by adjusted R2 of
80.6 % (with a paltry 1.3% supported by macroeconomic variables). Therefore this
results support the Efficiency Structure Theory which suggests that enhanced
managerial capability and scale efficiency level leads to higher concentration, and
higher profitability.
Finally, the study confirmed that there are indeed differences in the profitability
performance of commercial banks as measured by return on assets. The large
conventional banks continued to dominates the financial industry and make
supernormal profits supporting the theory of relative market power (RMP) hypothesis,
followed by small conventional banks, while Islamic bank was the least performing

55
banks in the groups, though shaping up very fast to competes with their counter parts
in the small size bank category.
5.4 Limitations of the Study
This study has some limitations and thus should be carefully considered when
interpreting the results. It is important to note that the study was constrained by the
number of Islamic banks operating in the country, which are only two, since inception
five years ago. This has the impacts on number of variables; resulting to limited
number of observations that cannot be reliably analyzed through multiple regression
model that would have explained the effects of each variable on profitability
performance based on bank-type for a better result. Due to data limitation from
Islamic banks, the study was not able to further interrogate how each of these
variables affects profitability for each bank type and differences between each of the
group, if any. The time frame was relatively short covering four years period, which
was based on number of years of existence for Islamic banks for balanced
observations, even though 2008 was excluded since it was inception year.
More importantly, this study have not examined any non-financial factors, which may
have impacts on banks performance especially ownership issues, number of branch,
customers, employees etc. It is estimated that the inclusion of these variables may
alter the results of the current findings.
5.5 Recommendations
On the basis of the study findings and conclusions, the following recommendations
are made on ways of improving the financial performance of commercial banks
specifically, the Islamic banks in order for them to catch up with rest of the

56
institutions in Kenya. This calls for regulatory adjustments to address challenges
highlighted in the findings.
5.5.1 Policy recommendation and best practice
The study recommends that the government through CBK should enact laws for the
harmonization of sharia’h advisory boards in the country. The advisory committee
shall fit into a subcommittee of the CBK board to strengthen the supervisory team.
Their roles include addressing the problems of acceptability of sharia’h rulings on
Islamic products and services offered by sharia’h compliant institution across board.
This board shall consult Islamic finance expert and standard setters in the best way to
manage conflicting Islamic financial products and services matters amicably.
The legal and regulatory framework of Islamic finance requires further enactment of
laws to make it consistent with international best practices, while maintaining the
unique features of Islamic finance and not compromising sharia’h principles. For
instance, the process that requires banks to own property first before it transfers to the
buyer need to be clarified for avoidance of any doubts on taxation matters. This will
iron out the issue of double taxation and stamp duty that will arise due to tax regime
in the country. The issue of zakat collection as a mechanism to support charity work
and government revenue should be embraced. Also consumer-protection and financial
literacy on Islamic finance is an emerging area for regulators.
Lastly, the CBK need to introduce sharia’h compliant liquidity mechanism by
creating window of linkage with international partner in Arab world, where Islamic
banks have developed. As in the case for conventional banks, there needs to have an
integrated liquidity management framework in the Islamic financial system. The

57
framework involves having the mechanism and vehicle to address short-term liquidity
problems, and resolving insolvency issues in Islamic financial institutions.
5.5.2 Areas for further studies
Future comparative bank performance studies in Kenya should incorporates all banks
categories including the medium size conventional banks which were excluded from
this study coupled with more variables including the non-financial factors and longer
time frame that captures the differences in the banking model for better results.
It is further recommended that a studies be done on why Kenyan banks continues to
make huge profits compared to other industry or sectors in the country, despite
marginal growth in the economy, this call for cross-sectoral performance studies.
More importantly Kenyan Islamic banks performance can be compared to their
counterpart in North Africa or Middle East countries. Another possible area for study
is to examines the differences in the determinants of between pure Islamic, pure
conventional and mixed (providing Islamic and conventional services).
58
REFERENCES
Al-Tamimi, H.H. (2010). Factors influencing performance of the UAE Islamic and
conventional national banks. Global Journal of Business Research, 4, 1-9.
Bain, J. (1956). Barriers to new competition. Cambridge, Mass Harvard University
press.
Bashir, H., & Hassan, M. (2003). Determinants of Islamic Banking Profitability.
Paper presented at the Proceedings of the Economic research forum 10th
Annual conference: Marrakech, Morocco, December 16-18.
Berger, A.N., Hunter, W.C., & Timme, S.G. (1993). The efficiency of financial
institutions: A review and preview of research past, present and future.
Journal Banking and Finance, 17, 221-249.
Central Bank of Kenya (2012). Bank supervision Department: Annual report 2012.
Chachi, A. (2005). Origin and development of commercial and Islamic banking
operations. Islamic Economics Research Centre, 18(2), 3-25.
Chapra, M. U. (1985). Towards a Just Monetary System: Leicester, UK. The Islamic
Foundation
Cooper, D.R., & Schindler, P.S. (2003). Business research methods. New York:
McGraw-Hill Irwin.
Dar, H.A., & Presley, J.R. (2000). Lack of profit loss sharing in Islamic banking:
Management and control imbalances. International Journal of Islamic
Financial Services, 2, 3-18.
59
Demsetz, H. (1973). Industry structure, market rivalry, and public policy. Journal of
Law and Economics 16, 1-9.
Jamia Mosque Committee (2007, June 01). History as Islamic bank comes to Kenya.
The Friday Bulletin, 214(1).
Gischer, H., & Jṻttner D.J. (2002). Global competition, fee income and interest rate
margin of bank. Paper presented at Financial Management Association
Conference, Copenhagen.
Gujarati, D.N.(2003). Basic econometrics (4th
ed.).New York: McGraw-Hill.
Halkano, M. (2012). Performance of Islamic and conventional banks in Kenya: A
comparative analysis. Unpublished MBA Project, University of Nairobi.
Hair, J., Black, W., Babin, B., Anderson, R., & Tatham, R.(2006). Multivariate data
analysis. (6th
ed.) Upper Saddle River, Jersey, United States of America.
Pearson, Prentice-Hall.
Haron, S. (2004). Determinants of Islamic bank profitability. Global Journal of
Finance and Economics, USA, 1(1).
Ho, T. S., & Saunders, A. (1981). The determinants of bank interest margins: Theory
and empirical evidence. Journal of Financial and Quantitative Analysis, 16,
581-600.
Ibrahim, O.H. (2009). A comparative study on the financial performance of Islamic
banks and conventional banks in Kenya. Unpublished MBA Project,
University of Nairobi.

60
Ika, S.R., & Abdullah, N. (2011). A comparative study of financial performance of
Islamic banks and conventional banks in Indonesia. Journal of Business and
Social Science, 2, (15).
Jaffar, M., & Manarvi, I.(2011). Performance comparison of Islamic and conventional
banks in Pakistan. Global Journal of Management and Business Research,
11(1), 60-66.
Kosmidou, M., & Pasiouras, F. (2007). Factors influencing the profitability of
domestic and foreign commercial banks in the European Union. Research in
International Business and Finance, 21 (2), 222-237.
Maghyerech, A., & Shammout, M. (2004). Determinants of commercial banks
performance in Jordan, Arabic Economic Research, 32(33), 3-33.
Moin, M.S. (2008). Performance of Islamic banking and conventional banking in
Pakistan: A comparative study. MBA Project, University of Skovde, School of
Technology and Society.
Mugenda, O., & Mugenda, A. (2003). Research methods: Quantitative and qualitative
approaches. Nairobi, Acts Press.
Musundi, A.A. (2008). The relationship between size and profitability of Kenyan
banks. A case of commercial banks in Kenya. Unpublished MBA Project,
University of Nairobi.
Njihia, J.K. (2005). The determinants of banks profitability: The case of commercial
banks in Kenya. Unpublished MBA Project, University of Nairobi.

61
Olweny, T. & Shipho, T.M. (2011). Effects of banking sectoral factors on the
profitability of commercial banks in Kenya. Economics and Finance Review,
1(5), 1-30.
Ongore, V.O, & Kusa, G.B. (2012). Determinants of financial performance of
commercial banks in Kenya. International Journal of Economics and
Financial issues, 3(1), 237-252.
Samad, A. (2004). Performance of interest free-Islamic banks vis-à-vis interest based
conventional banks of Bahrain. IIUM journal of Economic and Management,
12, 2.
Samad, A., & Hassan, K. (2000). The performance Malaysian Islamic bank during
1984-1997: An exploratory study. Thoughts on Economics 10(1), 7-26.
Shaher,T., Kasawneh, O., & Salem, R. (2011). The major factors that affect banks
performance in Middle Eastern Countries. Journal of Money, Investment and
Banking. Issue No. 20.
Shepherd W.G. (1986). Tobins’ q and the structure performance relationship:
Comment. The American Economic Review, 76(5), 1205-1210.
Siddiqi, M.N. (1967). Banking without interest. Islamic Publication, Lahore.
Siddiqui, A. (2008). Financial contracts, risk and performance of Islamic banking.
Managerial Finance, 34(10), 680-694.
Srairi, S.A. (2009). Factors influencing the profitability of conventional banks and
Islamic banks in GCC countries. Review of Islamic Economics, 13(1), 5-30.

62
Soylu, A. & Durmaz, N. (2013). On profitability of interest-free versus interest-based
banks in Turkey. The Australian Economic Review, 46,176-188.
Suleiman, M.N. (2001). Corporate Governance in Islamic Banks: Society and
Economy in Central and Eastern Europe. Journal of Budapest University of
Economic Sciences and Public Administration, XXII, 3.
Tabachnick, B. G., & Fidell, L. S. (2001). Using Multivariate Statistics (4th ed.).
Boston, MA: Allyn and Bacon
Turk, A.R. (2007). On the rise of Islamic banking among giant commercial banks: A
Performance and Efficiency Analysis. Journal of International Business and
Economics, VII.
Zeitun, R. (2012). Determinant of Islamic and conventional banks performance in
GCC countries. Global Economy and Finance Journal 5 (1), 53-72
Zubair, H. (2005): Evaluation of Islamic banking performance: On the current use of
econometric models. Paper Presented at Sixth International Conference on
Islamic Economics and Finance, 19(1), 229-248.

63
APPENDICES
Table 4.10: Correlation Matrix with dummy variables for bank-types
return on
assets
capital adequac
y ratio
asset quality ratio
management
efficiency liquidity
interest
spread
bank size
banking sector
development
financial market
development
real gdp
Infl. rate
Small conv. banks
Islamic banks
large conv. banks
return on assets
Pearson Correlation
1 .213** -.096 -.765** .144 .301** .504** .304** .086 .277** -.120 -.037 -.501** .478**
Sig. (2-tailed)
.007 .228 .000 .070 .000 .000 .000 .278 .000 .132 .645 .000 .000
capital adequacy ratio
Pearson Correlation
.213** 1 .417** -.011 .425** .034 -.223** -.256** .016 -.110 .031 .295** -.288** -.070
Sig. (2-tailed) .007
.000 .887 .000 .670 .005 .001 .836 .168 .693 .000 .000 .377
asset quality ratio
Pearson Correlation
-.096 .417** 1 .107 .416** .074 -.321** -.136 .058 -.025 -.057 .487** -.275** -.291**
Sig. (2-tailed) .228 .000
.180 .000 .349 .000 .087 .467 .757 .478 .000 .000 .000
management efficiency
Pearson Correlation
-.765** -.011 .107 1 -.239** .098 -.437** -.288** -.049 -.195* .065 -.162* .635** -.378**
Sig. (2-tailed) .000 .887 .180
.002 .219 .000 .000 .538 .014 .416 .041 .000 .000
liquidity Pearson Correlation
.144 .425** .416** -.239** 1 -.372**
-.163* -.047 .076 .030 -.090 .322** -.243** -.139
Sig. (2-tailed) .070 .000 .000 .002
.000 .040 .559 .339 .704 .260 .000 .002 .089
interest spread Pearson Correlation
.301** .034 .074 .098 -.372** 1 .101 .125 .045 .104 -.113 -.083 .002 .262
Sig. (2-tailed) .000 .670 .349 .219 .000
.202 .116 .573 .192 .155 .295 .982 .065
bank size Pearson Correlation
.504** -.223** -.321** -.437** -.163* .101 1 .173* -.004 .078 .005 -.625** -.327** .968**
Sig. (2-tailed) .000 .005 .000 .000 .040 .202
.029 .960 .329 .945 .000 .000 .000
banking sector development
Pearson Correlation
.304** -.256** -.136 -.288** -.047 .125 .173* 1 -.185* .389** .125 .000 .000 .000
Sig. (2-tailed) .000 .001 .087 .000 .559 .116 .029
.019 .000 .114 1.000 1.000 1.000

64
financial market development
Pearson Correlation
.086 .016 .058 -.049 .076 .045 -.004 -.185* 1 .579** -.756** .000 .000 .000
Sig. (2-tailed) .278 .836 .467 .538 .339 .573 .960 .019
.000 .000 1.000 1.000 1.000
Real GDP Pearson Correlation
.277** -.110 -.025 -.195* .030 .104 .078 .389** .579** 1 -.465** .000 .000 .000
Sig. (2-tailed) .000 .168 .757 .014 .704 .192 .329 .000 .000
.000 1.000 1.000 1.000
inflation rate Pearson Correlation
-.120 .031 -.057 .065 -.090 -.113 .005 .125 -.756** -.465** 1 .000 .000 .000
Sig. (2-tailed) .132 .693 .478 .416 .260 .155 .945 .114 .000 .000
1.000 1.000 1.000
Small Conventional Banks
Pearson Correlation
-.037 .295** .487** -.162* .322** -.083 -.625** .000 .000 .000 .000 1 -.500** -.655**
Sig. (2-tailed) .645 .000 .000 .041 .000 .295 .000 1.000 1.000 1.000 1.000
.000 .000
Islamic Banks Pearson Correlation
-.501** -.288** -.275** .635** -.243** .002 -.327** .000 .000 .000 .000 -.500** 1 -.327**
Sig. (2-tailed) .000 .000 .000 .000 .002 .982 .000 1.000 1.000 1.000 1.000 .000
.000
large Conventional Banks
Pearson Correlation
.478** -.070 -.291** -.378** -.139 .089 .968** .000 .000 .000 .000 -.655** -.327** 1
Sig. (2-tailed) .000 .377 .000 .000 .081 .262 .000 1.000 1.000 1.000 1.000 .000 .000
No of Obs-ervations
160
160
160
160 160
160
160
160
160
160
160
160 160
160
(**) and (*) denote significance at 1% and 5% level (two-tailed) respectively
Source: Author (2013)

65
Table 4.11: List of Selected Commercial Banks
Bank Islamic
bank
Small
Commercial
Large
Commercial
Frequency
Africa Banking Corp. ltd 0 16 0 16
Co-operative bank 0 0 16 16
Development bank 0 16 0 16
Equity bank ltd 0 0 16 16
First Community 16 0 0 16
Gulf Afican bank 16 0 0 16
K-Rep bank ltd 0 16 0 16
Standard Charttered 0 0 16 16
Trans National bank 0 16 0 16
Victoria commercial bank 0 16 0 16
Total 32 80 48 160