AN EMPIRICAL COMPARISON BETWEEN THE NEO-FFI AND...
84
AN EMPIRICAL COMPARISON BETWEEN THE NEO-FFI AND THE WPI AND THE RELATIONSHIP BETWEEN SELF-EFFICACY AND WORKPLACE PERSONALITY A Dissertation by LAUREN MICHEL OROZCO Submitted to the Office of Graduate Studies of Texas A&M University in partial fulfillment of the requirements for the degree of DOCTOR OF PHILOSOPHY December 2010 Major Subject: Counseling Psychology
-
Upload
hoangthuan -
Category
Documents
-
view
236 -
download
0
Transcript of AN EMPIRICAL COMPARISON BETWEEN THE NEO-FFI AND...
AN EMPIRICAL COMPARISON BETWEEN THE NEO-FFI AND THE WPI
AND THE RELATIONSHIP BETWEEN SELF-EFFICACY AND WORKPLACE
PERSONALITY
A Dissertation
by
LAUREN MICHEL OROZCO
Submitted to the Office of Graduate Studies of
Texas A&M University
in partial fulfillment of the requirements for the degree of
DOCTOR OF PHILOSOPHY
December 2010
Major Subject: Counseling Psychology

An Empirical Comparison between the NEO-FFI and the WPI and the Relationship
between Self-Efficacy and Workplace Personality
Copyright 2010 Lauren Michel Orozco
AN EMPIRICAL COMPARISON BETWEEN THE NEO-FFI AND THE WPI
AND THE RELATIONSHIP BETWEEN SELF-EFFICACY AND WORKPLACE
PERSONALITY
A Dissertation
by
LAUREN MICHEL OROZCO
Submitted to the Office of Graduate Studies of
Texas A&M University
in partial fulfillment of the requirements for the degree of
DOCTOR OF PHILOSOPHY
Approved by:
Chair of Committee, Daniel Brossart Committee Members, Timothy Elliott
William Rae
Winfred Arthur, Jr.
Head of Department, Victor Willson
December 2010
Major Subject: Counseling Psychology
iii
ABSTRACT
An Empirical Comparison between the NEO-FFI and the WPI and the Relationship
between Self-Efficacy and Workplace Personality.
(December 2010)
Lauren Michel Orozco, B.A.; M.S., Texas A&M University
Chair of Advisory Committee: Dr. Daniel Brossart
While much research has been devoted to the study of personality, the separate
construct of “workplace personality” is beginning to gain empirical attention. The
current study takes a closer look at the factor structure of the Workplace Personality
Inventory, a measure used to describe workplace personality using sixteen different
scales measuring traits associated with positive job performance. This study also uses
correlation analyses to determine the relation between workplace personality, personality
traits, and self-efficacy. Social Cognitive Career Theory (SCCT) emphasizes the unique
and important contribution of self-efficacy to career development and exploration. The
present study determines the relationship between personality as measured by the NEO-
FFI and workplace personality as it is measured by the WPI. The present study also uses
self-efficacy scores and indicators of the Big Five personality factors (as measured by
the NEO-FFI) to predict workplace personality. Results show that despite some logical
correlations between scales on the NEO-FFI and the WPI, the measures are not
redundant, showing the WPI to assess aspects of personality that the NEO-FFI does not.
iv
Further, in support of SCCT, self-efficacy was shown to significantly correlate with
workplace personality. Practical implications and limitations of the study are also
discussed.
v
DEDICATION
I dedicate this project first and foremost to my mom and dad, who have loved
and supported me both in my education and throughout my life. Mom, each
encouraging phone call and care package helped me day by day and your unwavering
belief in me was invaluable. Dad, whether it was encouragement, sharing your own
experiences, or giving me space, your support was always felt and appreciated beyond
words, especially during the internship process.
For my husband and best friend, Bear, who moved with me across the country
and back again so that I could finish graduate school. I am sure I was not the most fun
person to live with at times but you always made me feel like I was. Thank you for
being next to me every day and loving me through it.
Thank you for all of your love and support through all of the stress, setbacks, and
triumphs during the past five years and always.
vi
ACKNOWLEDGMENTS
I would like to express my sincere gratitude to my committee, who offered
continual support and understanding throughout this process. To Dr. Judy Chartrand,
Ms. Barbra Ann Frazier, Mr. Mark Rose, and everyone at Pearson Education, Inc. who
made this project possible, thank you for providing me the opportunity to collaborate
with you. I have never worked with a more kind, reliable, and helpful team of people.
This project would not have been possible without your support. To Drs. Amy Claxton
and Patrick Sylvers, I am so thankful for your help and guidance with data analysis.
Your patience, help, and encouragement kept me motivated and helped move this project
forward.
vii
TABLE OF CONTENTS
Page
ABSTRACT .............................................................................................................. iii
DEDICATION .......................................................................................................... v
ACKNOWLEDGMENTS ......................................................................................... vi
TABLE OF CONTENTS .......................................................................................... vii
LIST OF TABLES .................................................................................................... viii
LIST OF FIGURES ................................................................................................... ix
CHAPTER
I INTRODUCTION ................................................................................ 1
II LITERATURE REVIEW ..................................................................... 5
Models of Personality ..................................................................... 5
Vocational Psychology and Work Styles ....................................... 8
Self-Efficacy ................................................................................... 12
Frame-of-Reference Effects ........................................................... 17
Conclusion ...................................................................................... 18
III METHODOLOGY ............................................................................... 20
Participants ..................................................................................... 20
Measures ......................................................................................... 21
Procedures ...................................................................................... 24
IV RESULTS ............................................................................................. 26
V DISCUSSION AND CONCLUSION ................................................... 51
Limitations and Areas of Future Research ..................................... 61
REFERENCES .......................................................................................................... 66
VITA ......................................................................................................................... 74
viii
LIST OF TABLES
TABLE Page
1 Mean raw scores and standards deviations for the WPI, NEO-FFI,
and GSES ................................................................................................... 31
2 Zero order correlations for the 16 scales of the WPI ................................. 32
3 WPI unrotated factor matrix ....................................................................... 33
4 Pearson Product Moment Correlations between the WPI and the
Five Factors ................................................................................................ 36
5 Tests of canonical dimensions .................................................................... 37
6 Standardized canonical coefficients ........................................................... 40
7 Correlations between the WPI and self-efficacy ........................................ 41
8 Zero Order Correlations for the NEO-FFI ................................................. 43
9 Achievement Orientation predicted by the Five Factors and
self-efficacy ................................................................................................ 44
10 Adjustment predicted by the Five Factors and self-efficacy ..................... 45
11 Independence predicted by the Five Factors and self-efficacy ................. 46
12 Interpersonal Orientation predicted by the Five Factors and
self-efficacy ............................................................................................... 47
13 Practical Intelligence predicted by the Five Factors and self-efficacy ...... 48
14 Social Influence predicted by the Five Factors and self-efficacy ............. 49
15 Conscientiousness predicted by the Five Factors and self-efficacy .......... 50
ix
LIST OF FIGURES
FIGURE Page
1 Box plot representing outliers for scales on the NEO-FFI, GSES,
and WPI ...................................................................................................... 29
2 Hypothesized seven-factor model for the WPI .......................................... 29
3 Scree plot reflecting eigenvalues for 16 possible factors of the WPI ........ 30
1
CHAPTER I
INTRODUCTION
From choosing a mate to choosing a career, personality creates individuality and
has a significant influence on peoples’ lives. The assessment of personality and
individual differences is therefore important to many areas of psychology and life in
general. It is important to have dependable inventories in order to assess personality and
to understand people and their needs. The NEO-FFI has been a well-researched measure
of personality since its development in 1985 and is one of the most widely used
personality inventories based on the Five Factor Model of personality. The Workplace
Personality Inventory (WPI) is a new, reliable measure that assesses sixteen work styles
thought to be important to job success. It is vital for new measures of personality, such
as the WPI, to be compared to existing measures, like the NEO, in order to evaluate its
validity and uniqueness.
One’s personality includes not only descriptive traits and characteristics but also
preferences based on those traits. Personality, then, plays a big role in career choice and
development. For example, someone with an outgoing and social personality might
enjoy a career with a lot of interaction and teamwork. As Farh, Leong, and Law report
____________
This dissertation follows the style of the Journal of Applied Psychology.
2
(1998), persons with a high level of congruence between their vocational personality
type and their work environment experience a higher level of job satisfaction and longer
tenure at their jobs. This hypothesis provided the basis for Holland’s model of
occupational personality, which proposes six different interest types (and thus
corresponding work environments). It could be argued then that “workplace
personality” is a dimension of personality and therefore, needs to be explained through
separate measures such as the WPI. Betz and Borgen (2000) discuss the incorporation of
Personal Style Scales in the revised Strong Interest Inventory (SII) due to the linkage
between personality and interests. The four Personal Style Scales now included in the
SII include Work Style, Learning Environment, Leadership Style, and Risk-
Taking/Adventure. Work Style distinguishes between those who prefer to work with
people and those who prefer to work with data. Learning Environment distinguished
between people who prefer an academic environment from those who prefer working in
a practical (hands-on) environment. Leadership Style separates those who prefer to take
a leadership role from those who do not. Finally, the Risk-Taking/Adventure scale
distinguished those who like to take risks from those that prefer to play it safe.
In addition to personality, a second important factor related to career
development is self-efficacy, or one’s confidence at performing specific tasks. It is
important to distinguish between personality and self-efficacy. For example, someone
may have a personality style which reflects a preference for technological or scientific
work yet has low self-efficacy when it comes to working a computer. This would lead to
important recommendations like possibly more on-the-job training, further assessment,
3
or even choosing a career that provides a closer match between personality and self-
efficacy. Perhaps the best way to choose a career is to use both personality and self-
efficacy to predict how one would function in a work environment, or to predict his or
her workplace personality. Social Cognitive Career Theory (which will be discussed
further) speaks to the importance of self-efficacy in performing job-related tasks.
The present study will attempt to replicate the factor structure of the WPI.
Because it is important for new measures to be compared to existing measures, this study
will also provide an empirical comparison between the WPI and the NEO-FFM in order
to determine how the measures align and how they are different. The present study
attempts to establish convergent and discriminate validity of the WPI by comparing it to
the NEO-FFI, an established measure of personality. This comparison will highlight
different aspects of personality that are not assessed by measures of general personality,
which may have implications for the use of personality measures in a vocational setting.
Finally, this study will use respondent profiles on the NEO-FFM and the General Self-
Efficacy Scale GSES (measuring self-efficacy) and attempt to predict domains of
workplace personality on the WPI. While the majority of studies within Social
Cognitive Career Theory have shown that self-efficacy on specific tasks improves
performance of those tasks (Lent, Brown, & Hackett, 1994, 1996), the role of a general
sense of self-efficacy in the workplace is less known. This study will add to the
literature in Social Cognitive Career Theory by further examining the relationship
between general self-efficacy and traits that have been proven to be important for
vocational success (or workplace personality). Examining whether or not specific
4
personality traits and/or self-efficacy predict work styles that are proven to contribute to
job success is meaningful for employers looking to hire job candidates with specific
skills or traits.
Research questions are as follows:
1. Can we replicate the factor structure of the WPI?
2. How do the scales on the WPI compare to the Five Factors?
3. What is the pattern of correlation between workplace personality
and self-efficacy?
4. Can we predict workplace personality using the NEO personality
profile and self-efficacy scores?
5
CHAPTER II
LITERATURE REVIEW
Models of Personality
Five-Factor Model. Personality and individual differences have been a popular
area of study within the field of psychology for decades. Many have attempted to
describe personality by narrowing down the many descriptive personality traits to a few
general factors. The most well-known models of personality will be discussed presently.
One of these models, the Five Factor Model articulated by Costa and McCrae (1985),
maps personality traits onto five general factors. These factors are Openness to
experience, Conscientiousness, Extraversion, Agreeableness, and Neuroticism. Costa
and McCrae (1985, 1992) outline each of these five factors in detail. Openness to
experience is characterized by attributes such as independence of judgment, active
imagination, and, preference for variety. Someone with high conscientiousness is
someone who possesses a high sense of purposefulness and responsibility and is often
very trustworthy. People scoring high on extraversion tend to be sociable and assertive.
The Agreeableness scale will be high for people who are trusting, accepting, and easily
moved. And finally, Neuroticism is described as being the opposite of emotional
stability. People high on this scale tend to experience low self-esteem, pessimism, and
guilt more intensely than others.
A conceptually similar model of personality to the Five Factor Model is the Big
Five. While Costa and McCrae were the originators of the Five Factor Model, Goldberg
proposed a thoughtful conceptualization of the Big Five personality factors in the early
6
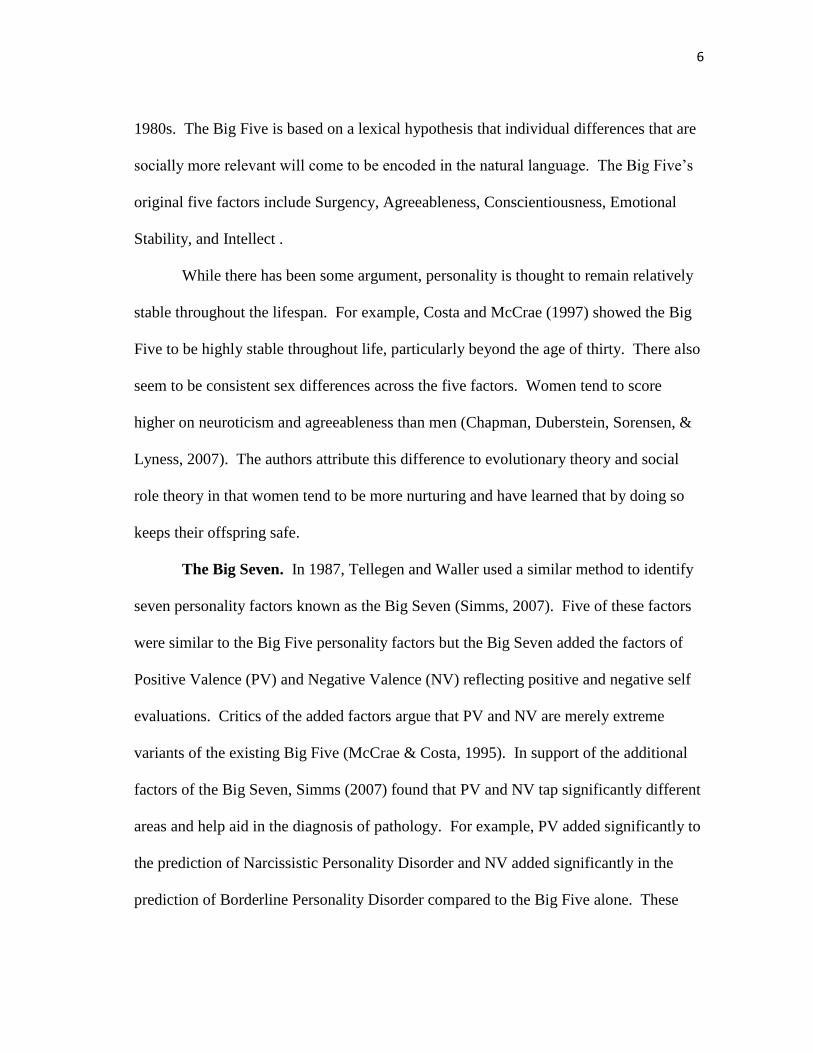
1980s. The Big Five is based on a lexical hypothesis that individual differences that are
socially more relevant will come to be encoded in the natural language. The Big Five’s
original five factors include Surgency, Agreeableness, Conscientiousness, Emotional
Stability, and Intellect .
While there has been some argument, personality is thought to remain relatively
stable throughout the lifespan. For example, Costa and McCrae (1997) showed the Big
Five to be highly stable throughout life, particularly beyond the age of thirty. There also
seem to be consistent sex differences across the five factors. Women tend to score
higher on neuroticism and agreeableness than men (Chapman, Duberstein, Sorensen, &
Lyness, 2007). The authors attribute this difference to evolutionary theory and social
role theory in that women tend to be more nurturing and have learned that by doing so
keeps their offspring safe.
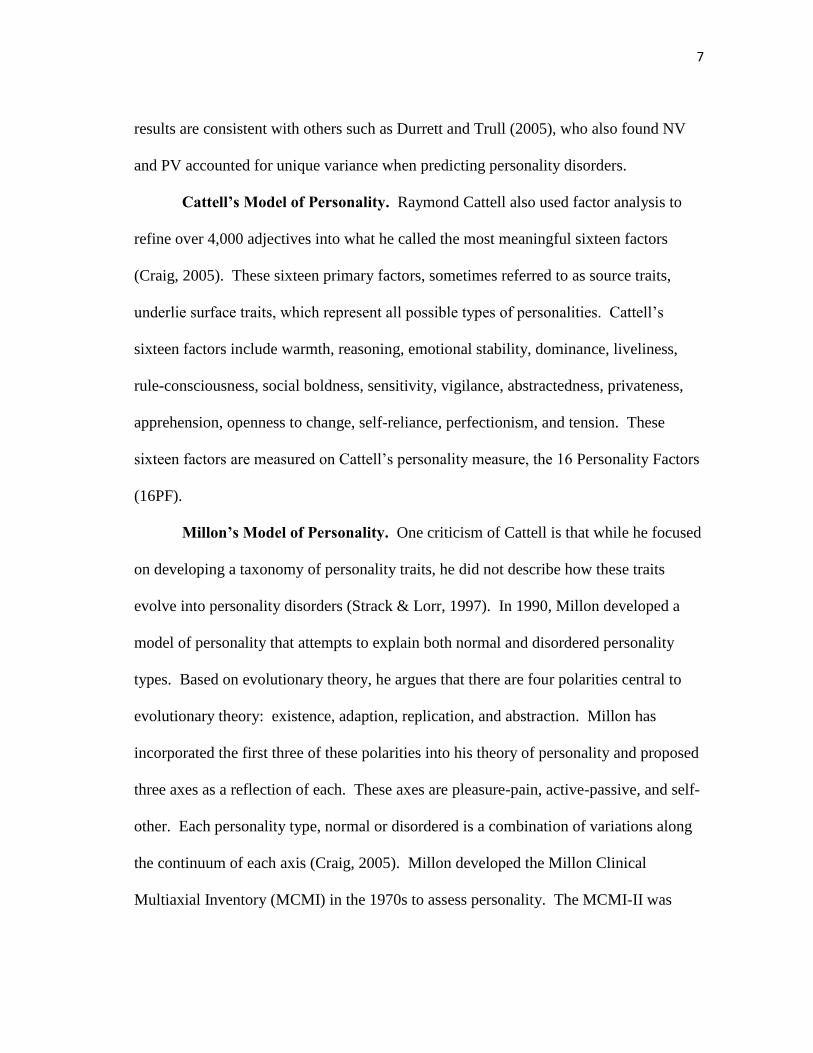
The Big Seven. In 1987, Tellegen and Waller used a similar method to identify
seven personality factors known as the Big Seven (Simms, 2007). Five of these factors
were similar to the Big Five personality factors but the Big Seven added the factors of
Positive Valence (PV) and Negative Valence (NV) reflecting positive and negative self
evaluations. Critics of the added factors argue that PV and NV are merely extreme
variants of the existing Big Five (McCrae & Costa, 1995). In support of the additional
factors of the Big Seven, Simms (2007) found that PV and NV tap significantly different
areas and help aid in the diagnosis of pathology. For example, PV added significantly to
the prediction of Narcissistic Personality Disorder and NV added significantly in the
prediction of Borderline Personality Disorder compared to the Big Five alone. These
7
results are consistent with others such as Durrett and Trull (2005), who also found NV
and PV accounted for unique variance when predicting personality disorders.
Cattell’s Model of Personality. Raymond Cattell also used factor analysis to
refine over 4,000 adjectives into what he called the most meaningful sixteen factors
(Craig, 2005). These sixteen primary factors, sometimes referred to as source traits,
underlie surface traits, which represent all possible types of personalities. Cattell’s
sixteen factors include warmth, reasoning, emotional stability, dominance, liveliness,
rule-consciousness, social boldness, sensitivity, vigilance, abstractedness, privateness,
apprehension, openness to change, self-reliance, perfectionism, and tension. These
sixteen factors are measured on Cattell’s personality measure, the 16 Personality Factors
(16PF).
Millon’s Model of Personality. One criticism of Cattell is that while he focused
on developing a taxonomy of personality traits, he did not describe how these traits
evolve into personality disorders (Strack & Lorr, 1997). In 1990, Millon developed a
model of personality that attempts to explain both normal and disordered personality
types. Based on evolutionary theory, he argues that there are four polarities central to
evolutionary theory: existence, adaption, replication, and abstraction. Millon has
incorporated the first three of these polarities into his theory of personality and proposed
three axes as a reflection of each. These axes are pleasure-pain, active-passive, and self-
other. Each personality type, normal or disordered is a combination of variations along
the continuum of each axis (Craig, 2005). Millon developed the Millon Clinical
Multiaxial Inventory (MCMI) in the 1970s to assess personality. The MCMI-II was
8
published in 1987 and most recently (in 2009) the MCMI-III was completed with the
addition of the Grossman Facet Scales (Millon, Davis, Millon, & Grossman, 2009).
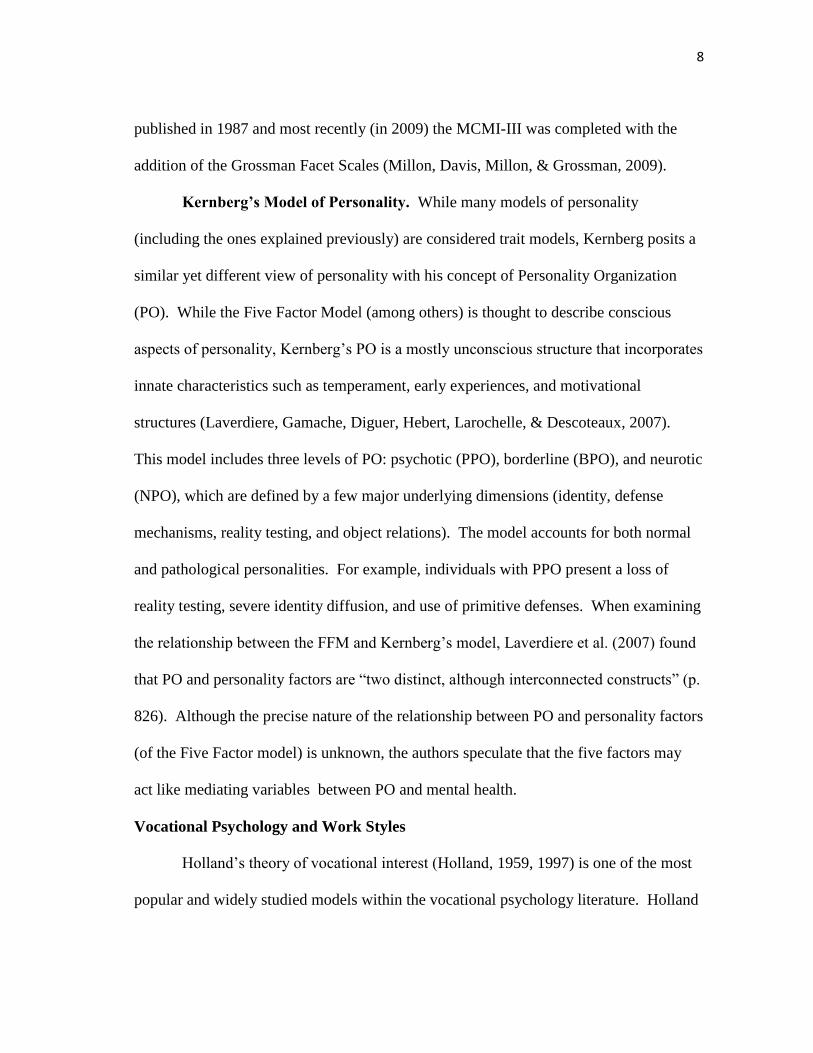
Kernberg’s Model of Personality. While many models of personality
(including the ones explained previously) are considered trait models, Kernberg posits a
similar yet different view of personality with his concept of Personality Organization
(PO). While the Five Factor Model (among others) is thought to describe conscious
aspects of personality, Kernberg’s PO is a mostly unconscious structure that incorporates
innate characteristics such as temperament, early experiences, and motivational
structures (Laverdiere, Gamache, Diguer, Hebert, Larochelle, & Descoteaux, 2007).
This model includes three levels of PO: psychotic (PPO), borderline (BPO), and neurotic
(NPO), which are defined by a few major underlying dimensions (identity, defense
mechanisms, reality testing, and object relations). The model accounts for both normal
and pathological personalities. For example, individuals with PPO present a loss of
reality testing, severe identity diffusion, and use of primitive defenses. When examining
the relationship between the FFM and Kernberg’s model, Laverdiere et al. (2007) found
that PO and personality factors are “two distinct, although interconnected constructs” (p.
826). Although the precise nature of the relationship between PO and personality factors
(of the Five Factor model) is unknown, the authors speculate that the five factors may
act like mediating variables between PO and mental health.
Vocational Psychology and Work Styles
Holland’s theory of vocational interest (Holland, 1959, 1997) is one of the most
popular and widely studied models within the vocational psychology literature. Holland
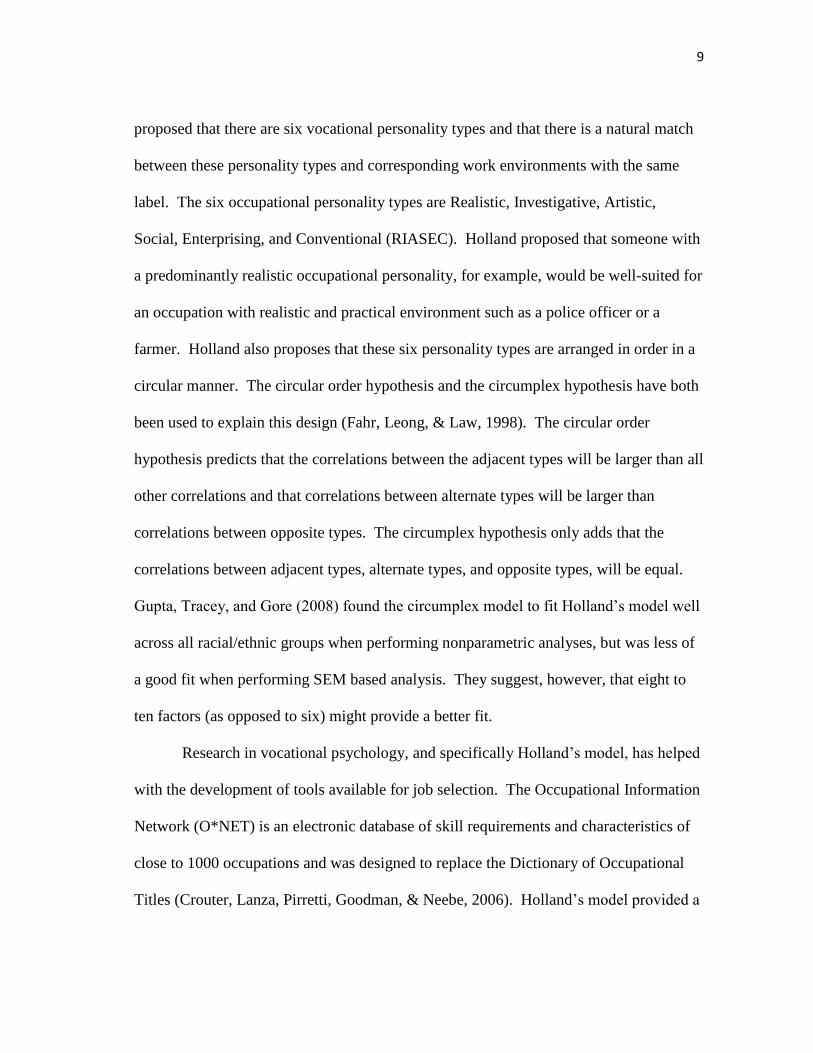
9
proposed that there are six vocational personality types and that there is a natural match
between these personality types and corresponding work environments with the same
label. The six occupational personality types are Realistic, Investigative, Artistic,
Social, Enterprising, and Conventional (RIASEC). Holland proposed that someone with
a predominantly realistic occupational personality, for example, would be well-suited for
an occupation with realistic and practical environment such as a police officer or a
farmer. Holland also proposes that these six personality types are arranged in order in a
circular manner. The circular order hypothesis and the circumplex hypothesis have both
been used to explain this design (Fahr, Leong, & Law, 1998). The circular order
hypothesis predicts that the correlations between the adjacent types will be larger than all
other correlations and that correlations between alternate types will be larger than
correlations between opposite types. The circumplex hypothesis only adds that the
correlations between adjacent types, alternate types, and opposite types, will be equal.
Gupta, Tracey, and Gore (2008) found the circumplex model to fit Holland’s model well
across all racial/ethnic groups when performing nonparametric analyses, but was less of
a good fit when performing SEM based analysis. They suggest, however, that eight to
ten factors (as opposed to six) might provide a better fit.
Research in vocational psychology, and specifically Holland’s model, has helped
with the development of tools available for job selection. The Occupational Information
Network (O*NET) is an electronic database of skill requirements and characteristics of
close to 1000 occupations and was designed to replace the Dictionary of Occupational
Titles (Crouter, Lanza, Pirretti, Goodman, & Neebe, 2006). Holland’s model provided a
10
theoretical framework for the Interest Profiler on the O*NET website. The Interest
Profiler is a self-assessment tool that can help people discover the type of work activities
and thus, occupations that they would like by measuring the six interest areas of
Holland’s typology. Eggerth, Bowles, Tunick, and Andrew (2005) compared the
Holland code classifications from the O*NET to the Holland code classifications from
the Strong Interest Inventory and the Dictionary of Holland Occupational Types since
each uses a different method to assign the codes. All comparisons with the O*NET were
intermediate in value with correlations around .70. The mean pairwise rate of agreement
between the O*NET, SII, and the DHOC was 70.60% for the first Holland Code letter.
However, when comparisons were made across all three sources, the rate of agreement
was only 15.71%. The O*NET serves as the framework for the development of the
WPI.
There has been considerable research connecting Holland’s model to the Five
Factor Model of personality. For example, extroversion tends to be positively associated
with enterprising interests and social interests, openness is associated with artistic and
investigative interests, agreeableness is positively correlated with social interests, and
conscientiousness is correlated with conventional interests. Neuroticism has not been
meaningfully correlated with any of Holland’s types (Barrick, Mount, & Gupta, 2003).
Neuroticism has, however, been found to be positively associated with greater career
indecision and poorer job performance (Tokar, Fischer, & Subich, 1998). Related to
career issues, higher neuroticism has been associated with lower personality-job
11
congruence, greater career indecision, more negative perceptions of occupational
stressors, and poorer job performance ratings (Tokar et al., 1998)
Sanz, Gil, Garcia-Vera, and Barrasa (2008) examined the relationship between
psychological needs and behavior patterns at work by comparing the NEO-FFI and the
Personality and Preference Inventory-Normative (PAPI-N). The PAPI-N is designed to
measure the most relevant needs in the work world as well as an individual’s behaviors
in work-related situations. The authors found a linkage between the two measures in
that the measures were highly positively correlated . For example, the factor,
Extraversion was significantly correlated with the scales of Leadership and Relating
Closely on the PAPI-N. The study demonstrated that the behavior patterns and needs
assessed by the PAPI-N “…can be coherently organized and interpreted within the
framework…” of the Five Factors (p. 55). Clearly, personality is related to vocational
needs and behavior.
The construct of workplace personality has not been clearly or consistently
defined in the literature. The Workplace Personality Inventory (WPI), which is used in
the present study, utilizes the Work Styles used in the development of the O*NET.
Borman, Kubisiak, and Schneider (1999) explain that while the term “work personality”
could be used in place of “work style,” they wanted to avoid using a clinically oriented
construct. The work styles taxonomy includes seven first-level constructs and seventeen
second-level constructs and is based on past research both in personality and job
performance. They describe work styles as traits that prove to be good predictors of job
performance. The WPI (used in the present study) is based on these work styles.
12
Self-Efficacy
Self-efficacy refers to one’s self-belief in successfully completing a specific task
(Rottinghaus, Betz, & Borgen, 2003). In 1981, Hackett and Betz applied Bandura’s
construct of self-efficacy to the counseling literature, showing that both interest and self-
efficacy are vital to career choice. For example, a career in mathematics requires both
an interest in mathematics and confidence in one’s ability to perform the tasks required
for a job in the field. Further, Chartrand, Borgan, Betz, and Donnay (2002)
demonstrated that there is a moderate to strong relationship between interests and self-
efficacy, shown by correlations on the Strong Interest Inventory and the Skills
Confidence Inventory. The authors also emphasize that interventions aimed at
increasing self-efficacy tend to be useful and successful. This means that if interest is
high and self-efficacy is low, it is still possible to be successful in the given task with the
incorporation of an intervention to increase self-efficacy.
According to Betz and Borgen (2000), self-efficacy is important in narrowing
down career options, and low self-efficacy is thought to limit initial interest development
by causing one to avoid experiences that would facilitate the development of new
interests. Betz, Harmon, and Borgen (1996) looked for sex differences in confidence
levels for Holland’s six occupational themes. They found that women had higher self-
efficacy in Realistic and Social themed occupations, while men reported higher self-
efficacy within Enterprising, Investigative, and Conventional themed occupations.
There was an absence of sex difference within occupational groups meaning, for
example, that a male and female architect reported almost identical confidence profiles.
13
Betz, Borgen, Rottinghaus, Paulsen, Halper, and Harmon (2003) correlated the Holland
themes with the scales from the Expanded Skills Confidence Inventory (ESCI), which
measures self-efficacy. Many of the SCI scales loaded heavily on one of Holland’s
themes, and sometimes secondary loadings occurred. For example, Using Technology
correlated highly with Conscientiousness and Organizational Management correlated
highly with both Extraversion and Conscientiousness.
Larson and Borgen (2006) nicely outline the important relationship between
personality and self-efficacy. They presume that “…personality is a driver of the
acquisition of self-efficacy – that is, that most personality development precedes the
development of vocational self-efficacy (p. 298).” As mentioned previously, much of
the current research has focused on self-efficacy and interests but little has been done in
relation to self-efficacy and personality. Hartman and Betz (2007) did find that within
the Five Factors, conscientiousness and extraversion were the two factors that were
positively associated with many areas of occupational self-efficacy, while neuroticism
had a negative association with these scales. Agreeableness had no significant
relationship with self-efficacy.
Holland has asserted that interest inventories are measures of personality (1997).
However, Mount, Barrick, Scullen, and Rounds (2006) differentiate between the two.
As reported by Chartrand, Borgan, Betz, and Donnay (2002), they view interests as
preferences that influence choices in environment, activity, and satisfaction associated
with those choices. They see personality as
14
…traits pertaining to self-regulatory and motivational processes that influence
outcomes associated with performance on the chosen tasks – that is, interests
drive people toward types of environment whereas personality traits determine
how they interact in those chosen environments. (p. 298)
It is therefore important to examine the interaction of personality and self-efficacy and
not to assume that just because interests correlate with self-efficacy, personality does as
well. Larson and Borgen (2006) found that personality matters tremendously in career
self-efficacy by showing that the personality factor of openness, for example, not only
contributes to an interest in artistic pursuits but drive’s confidence in that area as well.
Social Cognitive Career Theory. The importance of self-efficacy to career
interests, choices, and performance is outlined by Lent, Brown, and Hackett (1996) in
their development of the Social Cognitive Career Theory (SCCT). Adapted from
Bandura’s Social Cognitive Theory, Social Cognitive Career Theory emphasizes the
importance of self-efficacy when it comes to career choice, development, and
performance. According to the authors’ empirically supported model, self-efficacy
serves as a mediator between career choice and development. While self-efficacy,
outcome expectations (belief about the outcomes of performing specific behaviors), and
goals, are all relevant constructs, it is those vocational areas in which people are most
efficacious that have the biggest influence on career development. Lent, Brown, and
Hackett further explain that both skill and a sense of self-efficacy is required for
competent career performance. Rogers, Creed, and Glendon (2008) expanded on their
work by testing the role of personality and SCCT variables in career planning and
15
exploration. Hierarchical regression analyses were performed in an attempt to predict
career planning. Achievement in school was entered first and accounted for 2.4% of the
variance. Personality factors (as measured by the NEO-FFI) accounted for 16.4% of the
variance at the second step of the equation. The SCCT variables of self-efficacy and
outcome expectations were entered third and accounted for a significant 14.9% of the
variance. Self-efficacy, unlike outcome expectations, was shown to serve a mediating
role for both career planning and exploration as it was significantly associated with the
outcome variable and reduced the standardized beta weights for the personality factors
of conscientiousness and openness. To summarize, Rogers et al. (2008) found that those
with high self-efficacy in making career decisions were more likely to make career plans
and engage in career exploration. Larson, Wei, Wu, Borgen, and Bailey (2007) further
explain Social Cognitive Career Theory by stating
Personality, along with contextual affordances, influences learning experiences,
which in turn influence self-efficacy and outcome expectations. Self-efficacy
and outcome expectations then impact the development of interests, which in
turn influence choice goals and, subsequently, choice actions. (p. 395)
The authors emphasize that both personality traits and self-efficacy are unique and vital
to career development. Like Rogers et al., they also found that self-efficacy contributed
significantly in predicting students’ choice goals and actions, beyond personality alone.
As explained by Larson et al. (2007), choice goals refer to aspirations to pursue a
specific career and choice actions refer to actions in which a choice has been
implemented (Lent, Brown, & Hackett, 1994). It is clear that self-efficacy (at least when
16
it comes to career exploration) plays a large role in whether or not people chose to set
goals and engage in career exploration. Due to the significance of self-efficacy to career
development, the present study attempts to use self-efficacy as an additional predictor
(along with general personality) of workplace personality.
Core Self-Evaluation. Much like Social Cognitive Career Theory places
emphasis on self-efficacy, core self-evaluations are theorized to play an important role in
job satisfaction and performance. Judge, Locke, and Durham (1997) coined the term
“core evaluations” to describe “…fundamental, subconscious conclusions individuals
reach about themselves, other people, and the world” (p. 18). They describe four core
evaluations of the self: self-esteem (the value one places on oneself), generalized self-
efficacy (an estimate of one’s capabilities), neuroticism (negative affectivity), and locus
of control (the degree to which individuals feel in control of events in their lives). Under
this theory, how one appraises oneself has an effect on job satisfaction. Kacmar,
Collins, Harris, and Judge (2009) argue that while the Five Factors account for a large
amount of variance in describing personality, they do not account for differences in how
individuals appraise and evaluate themselves, which, as previously mentioned, has been
proven to be important in job performance (Pearson, 2007). In 1998, Judge et al. found
that core self-evaluations have significant effects on job satisfaction, with self-esteem
and generalized self-efficacy contributing the most. Judge and Bono (2001) point out
that Conscientiousness is often thought of as the “primary dispositional predictor of job
performance” (p. 85). They were able to show that core self-evaluations were correlated
with job performance to the same moderate degree that Conscientiousness was from the
17
Five Factor Model. In a later study, Judge and Hurst (2008) found similar results in that
those with negative core self-evaluations were slower to complete education which
affected job status and satisfaction in a negative way when compared to those with
positive core self-evaluations.
Frame-of-Reference Effects
It is often assumed in personality testing that individuals respond to items in a
way that indicates how they feel and behave in a very general sense, across situations
(Lievens, De Corte, & Schollaert, 2008). This assumption is reflected in the way that the
items of a measure are worded in that items often do not specify a frame of reference.
For example, an item that reads, “I am detail-oriented,” lacks a frame-of-reference and
respondents may contextualize their responses in very different ways. However, an item
that reads, “I am detail-oriented at work” provides a specific and consistent frame-of-
reference. Research has shown that contextualized items (items containing a frame-of-
reference) lead to higher criterion-related validity (Hunthausen, Truxillo, Bauer, &
Hammer, 2003; Schmit, Ryan, Stierwalt, & Powell, 1995). Lievens, De Corte, and
Schollaert (2008) further showed that validity may vary considerably depending on the
frame-of-reference used. In a sample of 337 students, they found reliability was highest
when participants responded to a large number of items using the same frame-of-
reference (as opposed to switching frequently). They further explain that, “…simply
imposing a frame-of-reference is not enough. It is equally important to ensure that test-
takers adopt a frame-of-reference that conceptually overlaps with the criterion” (pp.
277).
18
Smith, Hanges, and Dickson (2001) discuss the relation of frame-of-reference
effects to personnel selection. They argue that since job applicants have something to
gain or lose as a result of the way they respond to a test, they may alter their responses
(and therefore their frame-of-reference) in order to fit their idea of how an ideal
employee would answer. This brings into question the value of personality measures in
non-volunteer samples, or situations in which respondents have something to gain or
lose. Schmit and Ryan (1993) compared the results from a sample of both students and
job applicants who took the NEO-FFI. They found that among the job-applicant sample
(the non-volunteer sample), a sixth factor (in addition to the five factors) emerged. They
called this factor the ideal employee factor that contained components of both the
Agreeableness and Conscientiousness scales. However, Smith, Hanges, and Dickson
(2001) were not able to replicate the finding of the sixth factor. Schmit et al. (1995) also
looked at the frame-of-reference effect in job applicants. They found validity of the
NEO-FFI to be highest when items were altered to include a frame-of-reference (such as
adding “at work” to the end of an item). They further explained that validity was
essentially zero when general context items were used. Overall, incorporating a frame-
of-reference seems to increase the validity of personality measures, especially when it
comes to non-volunteer populations such as in personnel selection.
Conclusion
The Five Factor Model of personality is one of many models that attempt to
narrow down the list of personality traits into a small number of factors while still
accounting for a wide range of individual differences. Workplace personality is a newer
19
concept in the literature that refers to personality in a vocational setting, or how one
thinks and behaves at work. It will be important to examine how workplace personality
is similar to and different from personality in the general sense in terms of how it is
measured and what it accounts for that general personality measures do not. Social
Cognitive Career Theory emphasizes the importance of self-efficacy in career choice,
development, and performance but usually focuses on self-efficacy for specific work-
related tasks as opposed to a general sense of self-efficacy as the present study will
examine. It is important for both employers and potential employees to have an
understanding of how personality and self-efficacy can be useful in predicting how
someone will function and perform in the workplace and has implications for hiring and
maintaining successful employees.
20
CHAPTER III
METHODOLOGY
Participants
A convenience sample was obtained of 101 adults, ages 18 and older. In order to
acquire a group of working individuals in the sample, written requests were sent to small
businesses, college classrooms, and community organizations to request participation.
The group of 101 participants was comprised of 62.1% women (n = 64) and 32.6% men
(n = 31). Self-reported ethnicity was as follows: 78.6% (n = 81) Caucasian, 7.8% (n = 8)
Hispanic/Latino/a, 3% (n = 3) Asian/Pacific Islander, 1% (n = 1) African American, and
1% (n = 1) Native American. Ages of the participants were organized into the following
ranges: 16-20 (2.9%, n = 3), 21-24 (19.4%, n = 20), 25-29 (11.7%, n = 12), 30-34 (7.8%,
n = 8), 35-39 (1%, n = 1), 40-49 (17.5%, n = 18), 50-59 (9.7%, n = 10), 60-69 (12.6%, n
= 13), and 70 and older (7.8%, n = 8). Every participant in this study is a high school
graduate with 16.5% (n = 17) finishing between one and four years of college, 4.9% (n =
5) obtaining an associate’s degree, 40.8% (n = 40) having a bachelor’s degree, and
22.3% (n = 23) obtaining a graduate degree (master’s or doctorate). It should be noted
that some participants chose not to respond to demographic questions. It should be
noted that 26 additional respondents completed the NEO-FFI and the GSES but failed to
complete the WPI. And so, these participants were dropped from the study due to
incomplete data.
21
Measures
NEO-FFI. The NEO Five Factor Inventory (NEO-FFI) is the short form of the
revised NEO personality inventory (NEO-PI), introduced by Costa and McCrae in 1992.
It contains 60 of the strongest items from the NEO-PI, which measure five personality
factors using a 5-point Likert style rating scale. The instrument measures personality in
terms of five factors: Openness, Conscientiousness, Extraversion, Agreeableness, and
Neuroticism. Costa and McCrae (1992) reported internal consistencies from .68 to .86
for each of the five factors and test-retest correlations ranged from .75 to .83. In the
present study, coefficient alphas for the five factors ranged from .63 (Extraversion) to
.87 (Openness).
Workplace Personality Inventory (WPI). The Workplace Personality
Inventory (WPI) is a new measure used to measure sixteen work-related personality
traits (within seven domains) shown to be important to job success in a variety of jobs.
The seven higher-order domains include Achievement Orientation, Interpersonal
Orientation, Adjustment, Conscientiousness, Practical Intelligence, Social Influence, and
Independence. The Achievement Orientation domain is made up of Achievement,
Initiative, and Persistence scales. Interpersonal Orientation contains the scales of
Cooperation, Concern for Others, and Social Orientation. The third domain of
Adjustment is also comprised of three scales: Self Control, Stress Tolerance, and
Adaptability. The scales of Dependability, Attention to Detail, and Integrity/Rule
Following make up the Conscientiousness domain. Practical Intelligence contains scales
measuring Innovation and Analytical Thinking. The final two domains (Social Influence
22
and Independence) are each made up of a single scale: Leadership and Independence
respectively.
This seven factor, sixteen scale, model was developed rationally (as opposed to
empirically), meaning that it is based on what makes logical sense as opposed to being
based on empirical, quantitative research. The work styles are based on the Work Styles
personality taxonomy included in the Occupational Information Network (O*NET)
online database and endorsed by the United Stated Department of Labor. In order to
protect against the presentation of an overly favorable image, the WPI includes a scale
called “Unlikely Virtues.” In sum, the instrument contains 216 items and takes
approximately thirty minutes to administer.
Different taxonomies within personnel selection were reviewed prior to coming
up with the taxonomy used in both O*NET and the WPI. These taxonomies include the
Five Factor Model, the Hogan Personality Inventory, the Occupational Personality
Questionnaire, and the Assessment of Background and Life Experiences. After
examining literature reviews and meta-analyses, the work styles that proved to correlate
highest with important job behaviors or work-related criteria were included. The initial
item bank included 420 items taken from 12 different assessments and produced ninety-
nine of the final items used. A second bank was used which contained 169 items
measuring mental processes directed toward action. Fourteen items from this pool were
used. The third item bank consisted of 246 experimental items written by a team of
personality researchers to address gaps in the previous item banks as well as writing the
items for the Unlikely Virtues scale. One hundred thirty-three of these items were used.
23
Items were chosen based on subtlety (the more the better), having been previously
tested, avoidance of colloquial expressions (to enhance cultural sensitivity), alignment to
one of the work styles (and including items tapping a mix of high and low levels of each
trait), and fitting an eighth grade reading level. A pilot study was done and final item
selection was determined by using Item Response Theory, differential item functioning,
and Classical Test Theory
Pearson (2007) reports reliability and validity studies in order to demonstrate the
usefulness of their instrument. Early reliability studies show a median coefficient alpha
of .76. Relating to validity, convergent validity yielded correlations of .5 or better with
Occupational Personality Questionnaire (OPQ) and the Hogan Personality Inventory
(HPI), with many above .70. Criterion-related validity studies performed by Pearson
showed that the WPI scales are related to on-the-job performance of employees in
various occupations with a correlation of .21 and higher. Finally, the scales were also
shown to be independent and adequately differentiate different work styles for each job.
General Self-Efficacy Scale (GSES). The General Self-Efficacy Scale is a ten-
item scale intended to measure perceived self-efficacy. Originally developed in German
by Matthias Jerusalem and Ralf Schwarzer in 1981, the scale has been adapted to 26
other languages and is intended for ages 12 and older. With regard to reliability, in
samples from 23 nations, coefficient alphas ranged from .76 to .90 with the majority
falling in the high .80s (Scholz, Gutierrez, Shonali, & Schwarzer, 2002). Criterion-
related validity was found on numerous occasions where positive correlations were
found with positive emotions, such as optimism, and negative correlations were found
24
with negative emotions, such as anxiety and stress (Luszczynska, Scholz, & Schwarzer,
2005).
Procedures
As previously mentioned, participation was solicited through word of mouth
followed by written requests to small businesses, one college classroom, and a
community organization. Associates and colleagues of the primary researcher suggested
specific local businesses or organizations of which they were affiliated that may be
willing to participate in the research study. A small medical clinic and an investment
firm were contacted along with a local athletic club. The primary researcher contacted
the organizations via email and arranged a meeting to describe the nature and purpose of
the study and solicit volunteers. Those interested in volunteering received the
information sheet and verbally consented to participate. While the sample was one of
convenience and participants had an indirect relationship with the researcher,
participation was voluntary and all respondents expressed verbal consent to participate.
In all cases, respondents resided in large urban areas in both the Pacific Northwest and in
the southern part of the United States. After receiving the information sheet and
consenting to participate, participants were given paper copies of each measure and
instructed to answer all items. To ensure anonymity, a five digit code consisting of a
letter and four numbers (usually first initial and last four digits of the participant’s Social
Security Number) was used in place of a name. In all cases, the primary researcher
supervised the administration of the NEO and the GSES and requested the participant’s
email address along with his or her corresponding code so that results from online
25
measures could be paired with paper/pencil tests. The participant was then sent a link to
the WPI to complete at his or her convenience. In cases of delayed responding, a
reminder email was sent to participants reminding them to complete the online measure
if they were still interested in participating in the study.
26
CHAPTER IV
RESULTS
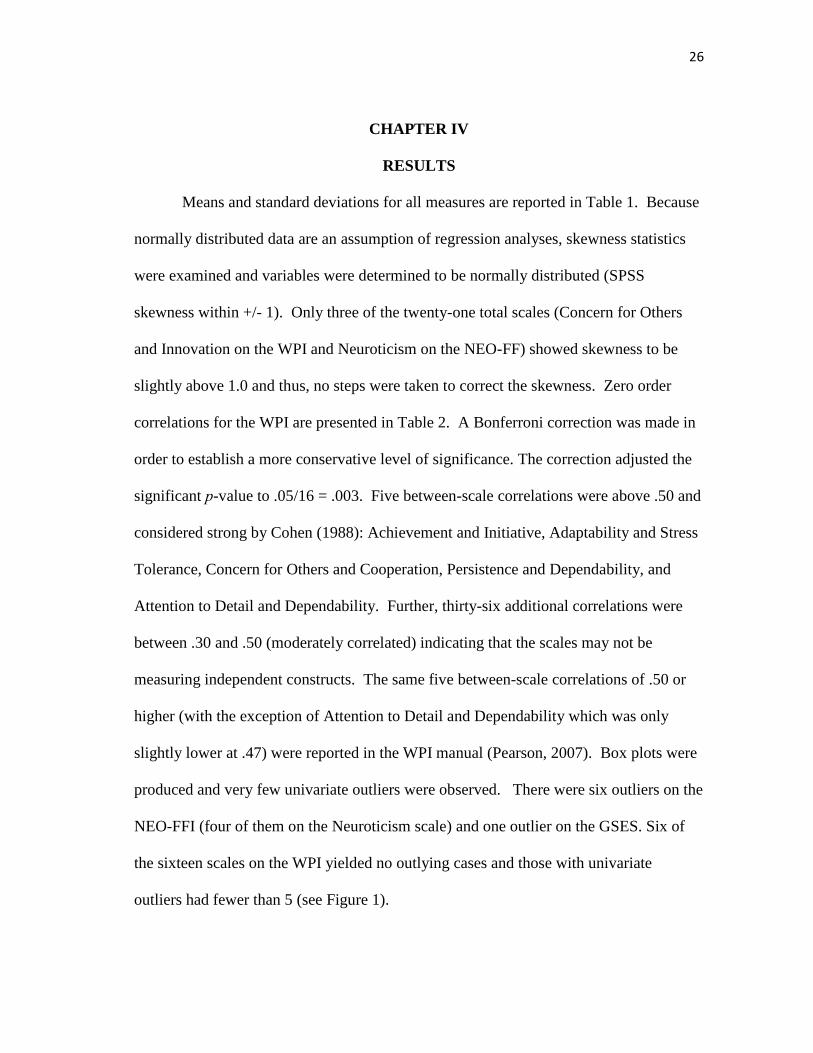
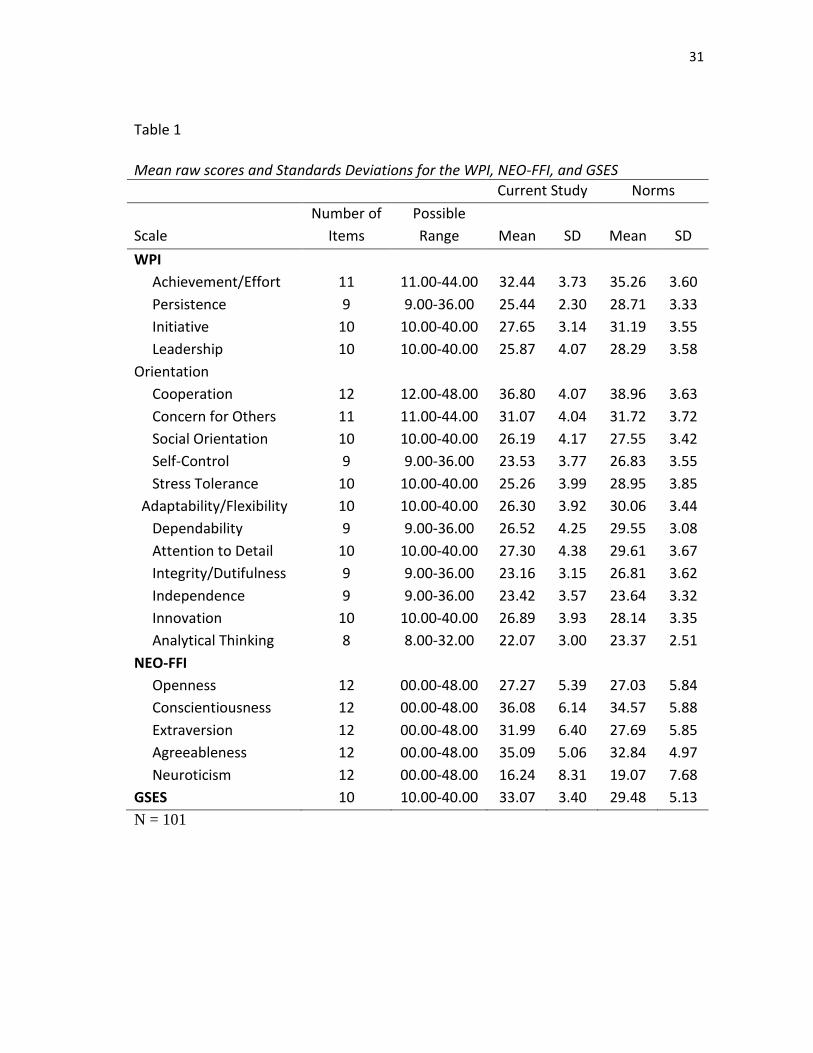
Means and standard deviations for all measures are reported in Table 1. Because
normally distributed data are an assumption of regression analyses, skewness statistics
were examined and variables were determined to be normally distributed (SPSS
skewness within +/- 1). Only three of the twenty-one total scales (Concern for Others
and Innovation on the WPI and Neuroticism on the NEO-FF) showed skewness to be
slightly above 1.0 and thus, no steps were taken to correct the skewness. Zero order
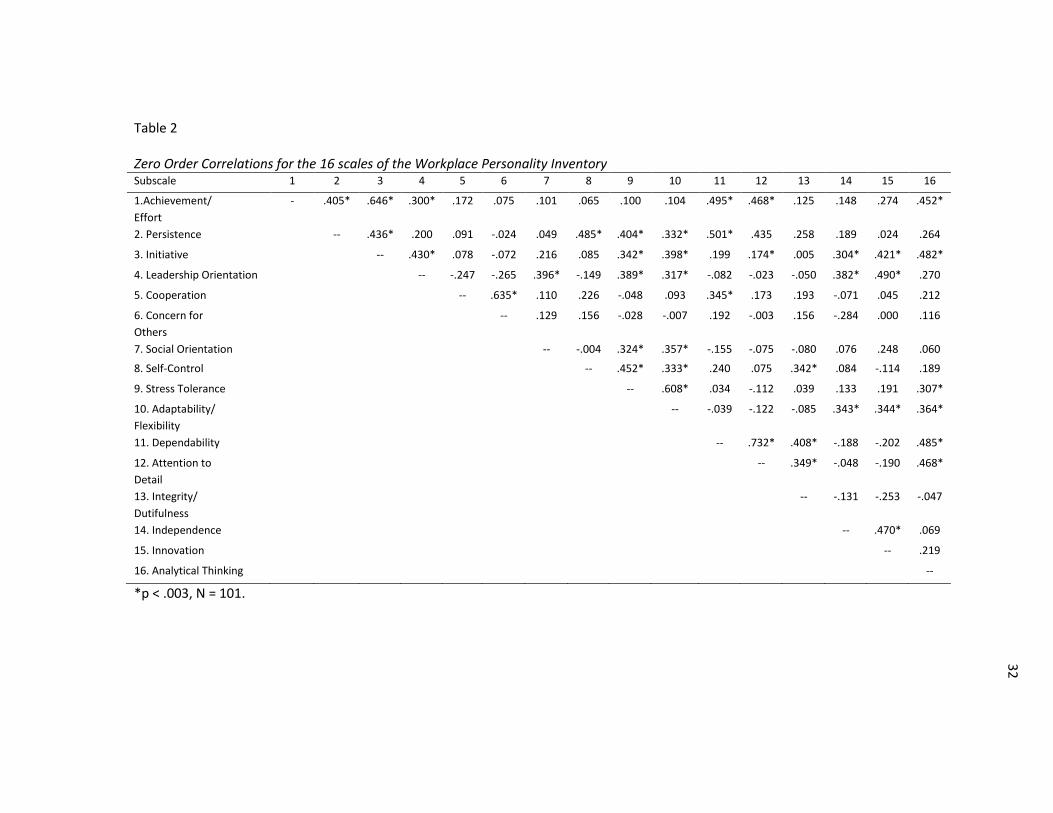
correlations for the WPI are presented in Table 2. A Bonferroni correction was made in
order to establish a more conservative level of significance. The correction adjusted the
significant p-value to .05/16 = .003. Five between-scale correlations were above .50 and
considered strong by Cohen (1988): Achievement and Initiative, Adaptability and Stress
Tolerance, Concern for Others and Cooperation, Persistence and Dependability, and
Attention to Detail and Dependability. Further, thirty-six additional correlations were
between .30 and .50 (moderately correlated) indicating that the scales may not be
measuring independent constructs. The same five between-scale correlations of .50 or
higher (with the exception of Attention to Detail and Dependability which was only
slightly lower at .47) were reported in the WPI manual (Pearson, 2007). Box plots were
produced and very few univariate outliers were observed. There were six outliers on the
NEO-FFI (four of them on the Neuroticism scale) and one outlier on the GSES. Six of
the sixteen scales on the WPI yielded no outlying cases and those with univariate
outliers had fewer than 5 (see Figure 1).
27
Question #1: Can the factor structure of the WPI be replicated?
The first question analyzed the factor structure of the WPI. A confirmatory
factor analysis (CFA) was performed in an attempt to confirm the model reflected in the
WPI. MacCallum, Widaman, Zhang, and Hong (1999) suggested that while higher
sample sizes are preferred when conducting a CFA, sample size becomes less of a
concern when factor loadings and thus, communalities are high. While the current
sample size is considered low, scale reliabilities of the WPI have been found to be high,
with sixteen out of the seventeen scales yielding alpha coefficients greater than .70
(Pearson, 2007). Thus, it was determined that the CFA could still be performed.
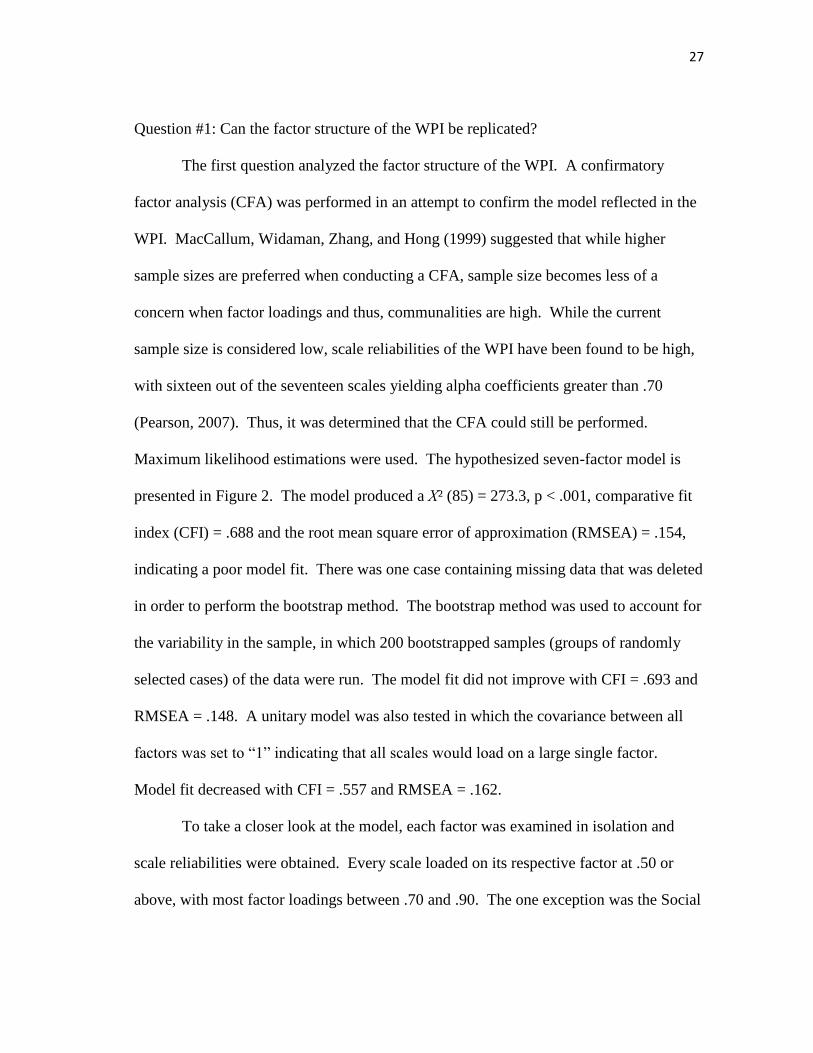
Maximum likelihood estimations were used. The hypothesized seven-factor model is
presented in Figure 2. The model produced a X² (85) = 273.3, p < .001, comparative fit
index (CFI) = .688 and the root mean square error of approximation (RMSEA) = .154,
indicating a poor model fit. There was one case containing missing data that was deleted
in order to perform the bootstrap method. The bootstrap method was used to account for
the variability in the sample, in which 200 bootstrapped samples (groups of randomly
selected cases) of the data were run. The model fit did not improve with CFI = .693 and
RMSEA = .148. A unitary model was also tested in which the covariance between all
factors was set to “1” indicating that all scales would load on a large single factor.
Model fit decreased with CFI = .557 and RMSEA = .162.
To take a closer look at the model, each factor was examined in isolation and
scale reliabilities were obtained. Every scale loaded on its respective factor at .50 or
above, with most factor loadings between .70 and .90. The one exception was the Social
28
Orientation scale within the Interpersonal Orientation domain. This scale produced a
factor loading of only .15, affecting not only the Interpersonal Orientation factor but the
entire model fit. The model was run again without the Social Orientation scale but the
model only improved slightly with CFI = .734 and RMSEA = .146. Since two of the
factors (Social Influence and Independence) are only represented by one scale each, the
model was run without these two single-scale factors. Model fit was not affected with
CFI = .735 and RMSEA = .150. A final CFA was run that included only those factors
containing more than two scales and excluding the Interpersonal Orientation factor since
it contained the problematic scale of Social Orientation. Once again, model fit could not
be obtained with CFI = .748 and RMSEA = .183. Sample size proved to be too small to
obtain acceptable model fit.
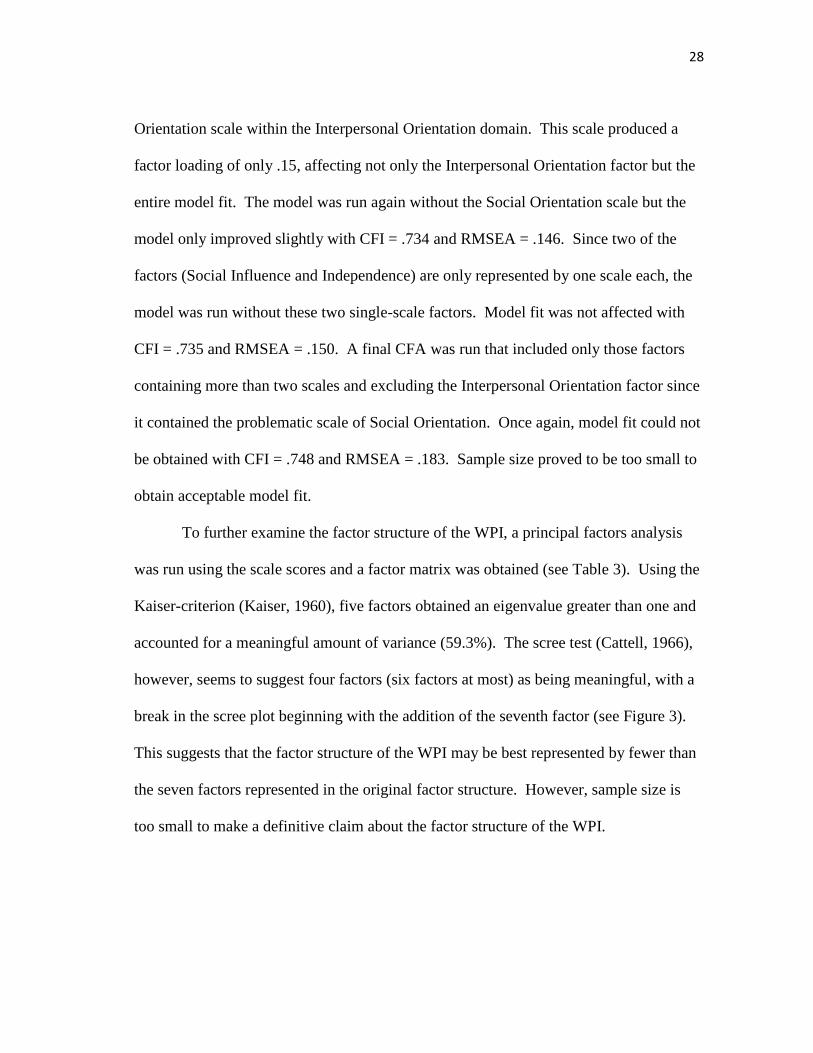
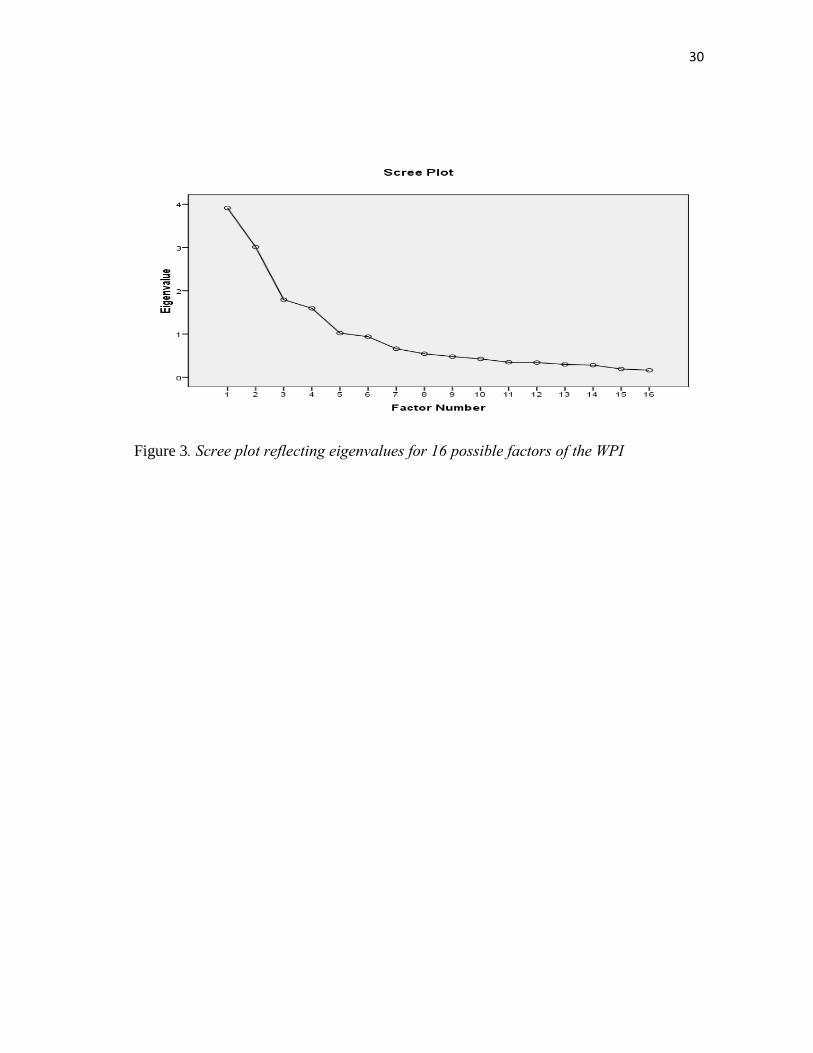
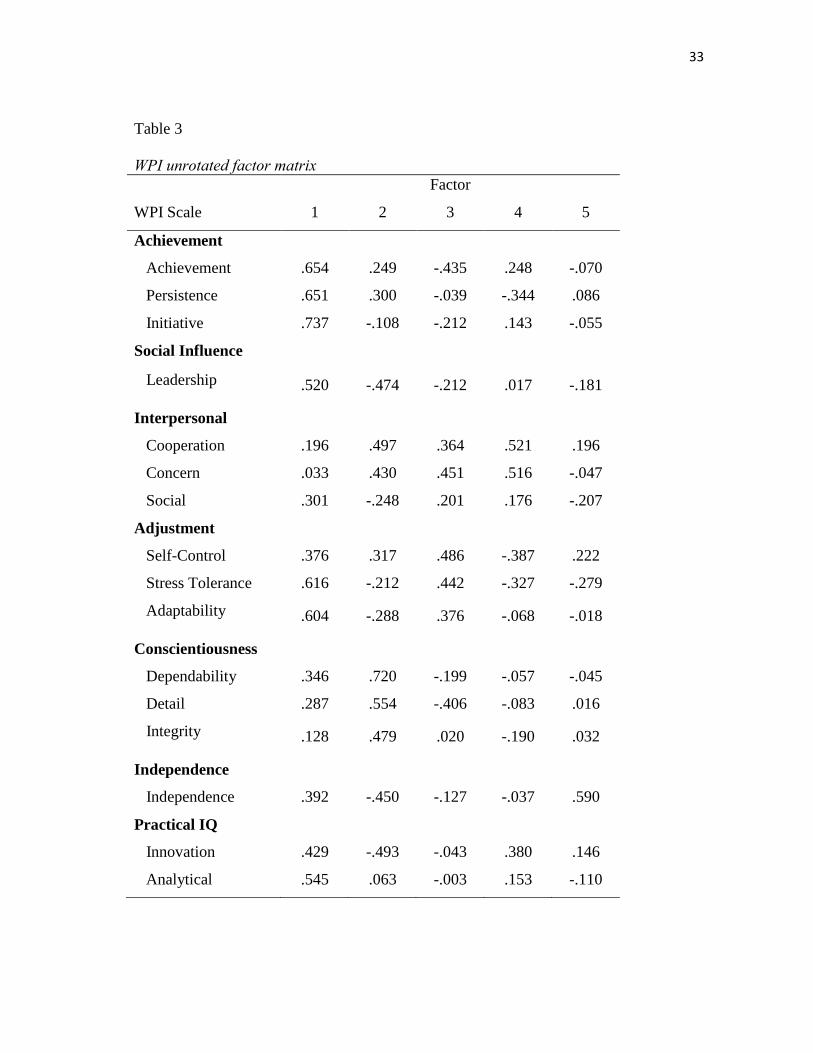
To further examine the factor structure of the WPI, a principal factors analysis
was run using the scale scores and a factor matrix was obtained (see Table 3). Using the
Kaiser-criterion (Kaiser, 1960), five factors obtained an eigenvalue greater than one and
accounted for a meaningful amount of variance (59.3%). The scree test (Cattell, 1966),
however, seems to suggest four factors (six factors at most) as being meaningful, with a
break in the scree plot beginning with the addition of the seventh factor (see Figure 3).
This suggests that the factor structure of the WPI may be best represented by fewer than
the seven factors represented in the original factor structure. However, sample size is
too small to make a definitive claim about the factor structure of the WPI.

29
Figure 1. Box plot representing outliers for scales of the NEO-FFI, GSES, and WPI
Figure 2. Hypothesized seven-factor model for WPI
30
Figure 3. Scree plot reflecting eigenvalues for 16 possible factors of the WPI
31
Table 1
Mean raw scores and Standards Deviations for the WPI, NEO-FFI, and GSES
Current Study Norms
Scale
Number of
Items
Possible
Range
Mean
SD
Mean
SD
WPI
Achievement/Effort 11 11.00-44.00 32.44 3.73 35.26 3.60
Persistence 9 9.00-36.00 25.44 2.30 28.71 3.33
Initiative 10 10.00-40.00 27.65 3.14 31.19 3.55
Leadership
Orientation
10 10.00-40.00 25.87 4.07 28.29 3.58
Cooperation 12 12.00-48.00 36.80 4.07 38.96 3.63
Concern for Others 11 11.00-44.00 31.07 4.04 31.72 3.72
Social Orientation 10 10.00-40.00 26.19 4.17 27.55 3.42
Self-Control 9 9.00-36.00 23.53 3.77 26.83 3.55
Stress Tolerance 10 10.00-40.00 25.26 3.99 28.95 3.85
Adaptability/Flexibility 10 10.00-40.00 26.30 3.92 30.06 3.44
Dependability 9 9.00-36.00 26.52 4.25 29.55 3.08
Attention to Detail 10 10.00-40.00 27.30 4.38 29.61 3.67
Integrity/Dutifulness 9 9.00-36.00 23.16 3.15 26.81 3.62
Independence 9 9.00-36.00 23.42 3.57 23.64 3.32
Innovation 10 10.00-40.00 26.89 3.93 28.14 3.35
Analytical Thinking 8 8.00-32.00 22.07 3.00 23.37 2.51
NEO-FFI
Openness 12 00.00-48.00 27.27 5.39 27.03 5.84
Conscientiousness 12 00.00-48.00 36.08 6.14 34.57 5.88
Extraversion 12 00.00-48.00 31.99 6.40 27.69 5.85
Agreeableness 12 00.00-48.00 35.09 5.06 32.84 4.97
Neuroticism 12 00.00-48.00 16.24 8.31 19.07 7.68
GSES 10 10.00-40.00 33.07 3.40 29.48 5.13
N = 101
2
9
32
Table 2 Zero Order Correlations for the 16 scales of the Workplace Personality Inventory Subscale 1 2 3 4 5 6 7 8 9 10 11 12 13 14 15 16
1.Achievement/
Effort
- .405* .646* .300* .172 .075 .101 .065 .100 .104 .495* .468* .125 .148 .274 .452*
2. Persistence -- .436* .200 .091 -.024 .049 .485* .404* .332* .501* .435 .258 .189 .024 .264
3. Initiative -- .430* .078 -.072 .216 .085 .342* .398* .199 .174* .005 .304* .421* .482*
4. Leadership Orientation -- -.247 -.265 .396* -.149 .389* .317* -.082 -.023 -.050 .382* .490* .270
5. Cooperation -- .635* .110 .226 -.048 .093 .345* .173 .193 -.071 .045 .212
6. Concern for
Others
-- .129 .156 -.028 -.007 .192 -.003 .156 -.284 .000 .116
7. Social Orientation -- -.004 .324* .357* -.155 -.075 -.080 .076 .248 .060
8. Self-Control -- .452* .333* .240 .075 .342* .084 -.114 .189
9. Stress Tolerance -- .608* .034 -.112 .039 .133 .191 .307*
10. Adaptability/
Flexibility
-- -.039 -.122 -.085 .343* .344* .364*
11. Dependability -- .732* .408* -.188 -.202 .485*
12. Attention to
Detail
-- .349* -.048 -.190 .468*
13. Integrity/
Dutifulness
-- -.131 -.253 -.047
14. Independence -- .470* .069
15. Innovation -- .219
16. Analytical Thinking --
*p < .003, N = 101.
33
Table 3
WPI unrotated factor matrix Factor
WPI Scale 1 2 3 4 5
Achievement
Achievement .654 .249 -.435 .248 -.070
Persistence .651 .300 -.039 -.344 .086
Initiative .737 -.108 -.212 .143 -.055
Social Influence
Leadership .520 -.474 -.212 .017 -.181
Interpersonal
Cooperation .196 .497 .364 .521 .196
Concern .033 .430 .451 .516 -.047
Social .301 -.248 .201 .176 -.207
Adjustment
Self-Control .376 .317 .486 -.387 .222
Stress Tolerance .616 -.212 .442 -.327 -.279
Adaptability .604 -.288 .376 -.068 -.018
Conscientiousness
Dependability .346 .720 -.199 -.057 -.045
Detail .287 .554 -.406 -.083 .016
Integrity .128 .479 .020 -.190 .032
Independence
Independence .392 -.450 -.127 -.037 .590
Practical IQ
Innovation .429 -.493 -.043 .380 .146
Analytical .545 .063 -.003 .153 -.110
34
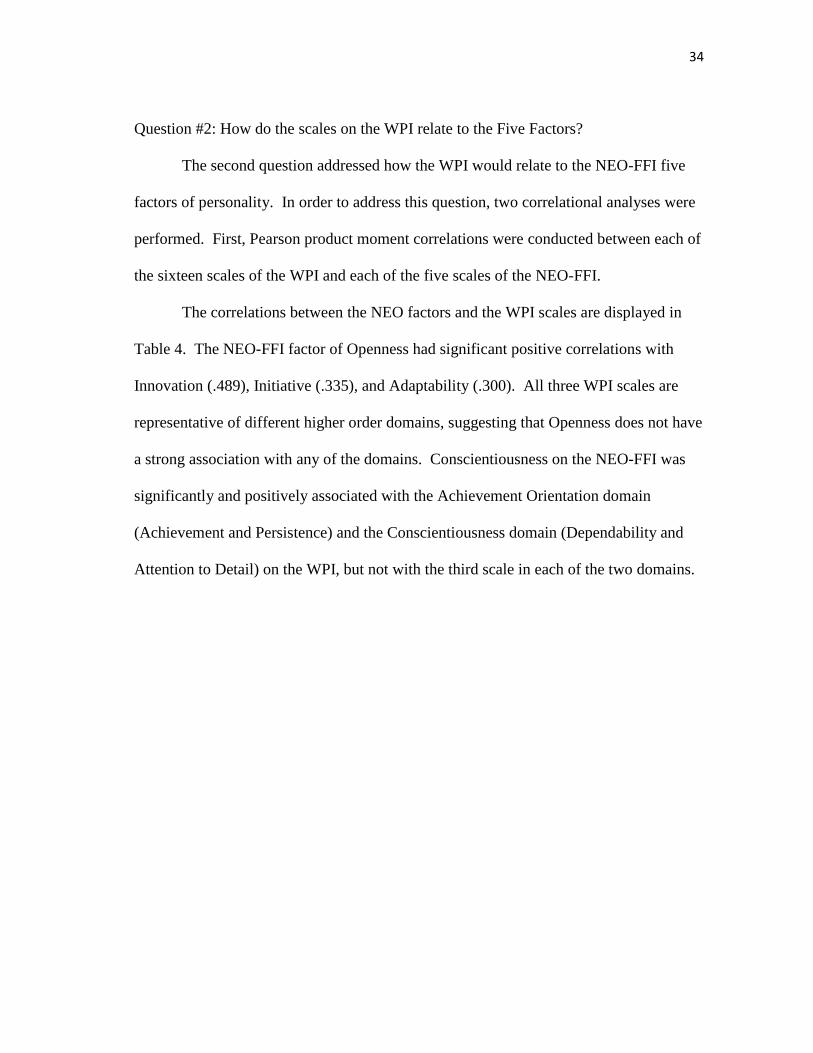
Question #2: How do the scales on the WPI relate to the Five Factors?
The second question addressed how the WPI would relate to the NEO-FFI five
factors of personality. In order to address this question, two correlational analyses were
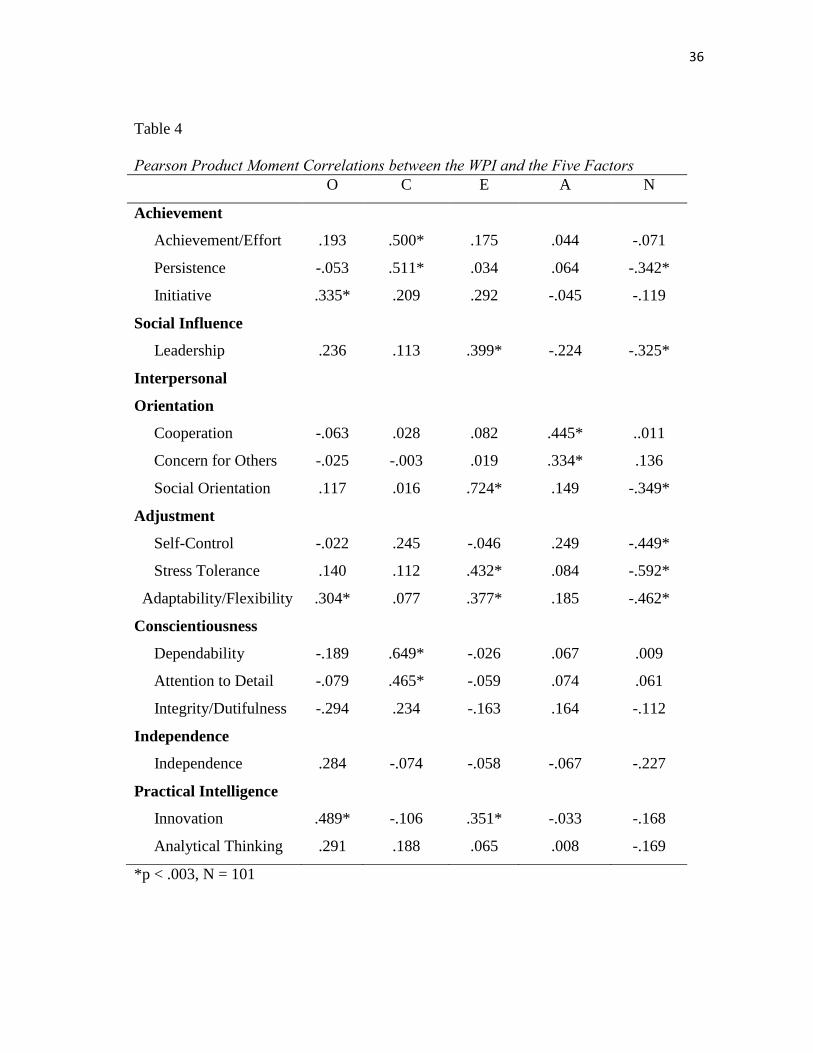
performed. First, Pearson product moment correlations were conducted between each of
the sixteen scales of the WPI and each of the five scales of the NEO-FFI.
The correlations between the NEO factors and the WPI scales are displayed in
Table 4. The NEO-FFI factor of Openness had significant positive correlations with
Innovation (.489), Initiative (.335), and Adaptability (.300). All three WPI scales are
representative of different higher order domains, suggesting that Openness does not have
a strong association with any of the domains. Conscientiousness on the NEO-FFI was
significantly and positively associated with the Achievement Orientation domain
(Achievement and Persistence) and the Conscientiousness domain (Dependability and
Attention to Detail) on the WPI, but not with the third scale in each of the two domains.
35
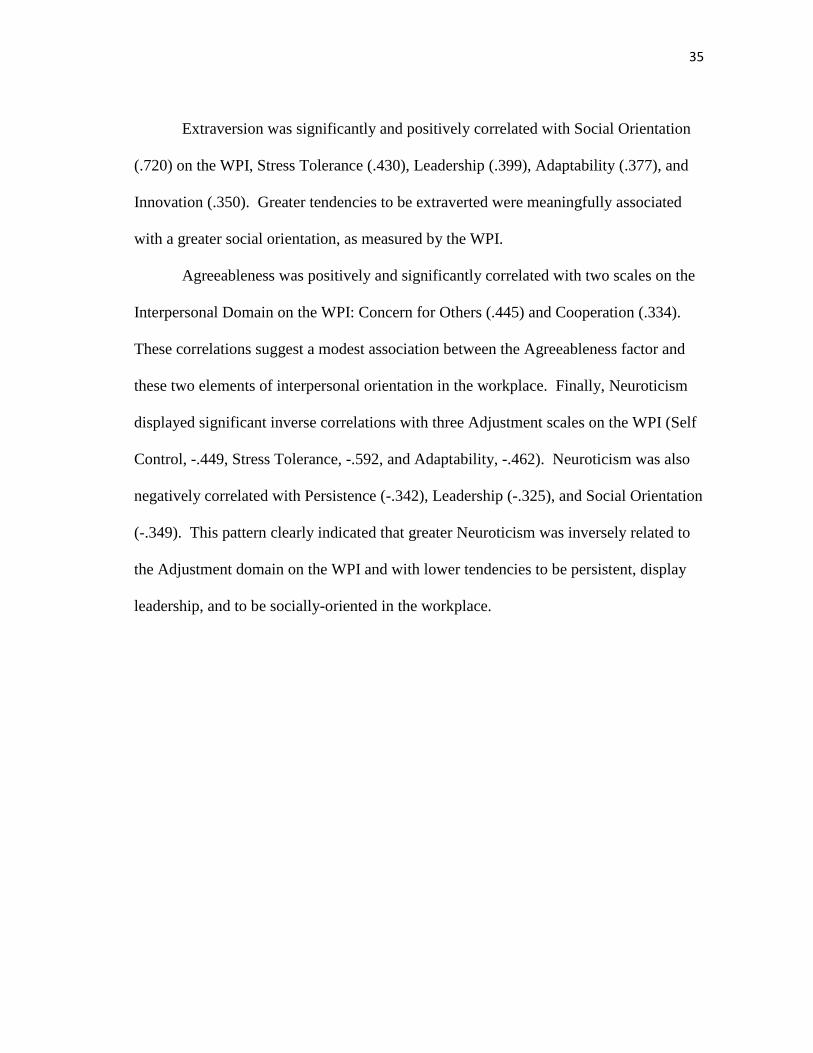
Extraversion was significantly and positively correlated with Social Orientation
(.720) on the WPI, Stress Tolerance (.430), Leadership (.399), Adaptability (.377), and
Innovation (.350). Greater tendencies to be extraverted were meaningfully associated
with a greater social orientation, as measured by the WPI.
Agreeableness was positively and significantly correlated with two scales on the
Interpersonal Domain on the WPI: Concern for Others (.445) and Cooperation (.334).
These correlations suggest a modest association between the Agreeableness factor and
these two elements of interpersonal orientation in the workplace. Finally, Neuroticism
displayed significant inverse correlations with three Adjustment scales on the WPI (Self
Control, -.449, Stress Tolerance, -.592, and Adaptability, -.462). Neuroticism was also
negatively correlated with Persistence (-.342), Leadership (-.325), and Social Orientation
(-.349). This pattern clearly indicated that greater Neuroticism was inversely related to
the Adjustment domain on the WPI and with lower tendencies to be persistent, display
leadership, and to be socially-oriented in the workplace.
36
Table 4
Pearson Product Moment Correlations between the WPI and the Five Factors O C E A N
Achievement
Achievement/Effort .193 .500* .175 .044 -.071
Persistence -.053 .511* .034 .064 -.342*
Initiative .335* .209 .292 -.045 -.119
Social Influence
Leadership .236 .113 .399* -.224 -.325*
Interpersonal
Orientation
Cooperation -.063 .028 .082 .445* ..011
Concern for Others -.025 -.003 .019 .334* .136
Social Orientation .117 .016 .724* .149 -.349*
Adjustment
Self-Control -.022 .245 -.046 .249 -.449*
Stress Tolerance .140 .112 .432* .084 -.592*
Adaptability/Flexibility .304* .077 .377* .185 -.462*
Conscientiousness
Dependability -.189 .649* -.026 .067 .009
Attention to Detail -.079 .465* -.059 .074 .061
Integrity/Dutifulness -.294 .234 -.163 .164 -.112
Independence
Independence .284 -.074 -.058 -.067 -.227
Practical Intelligence
Innovation .489* -.106 .351* -.033 -.168
Analytical Thinking .291 .188 .065 .008 -.169
*p < .003, N = 101
37
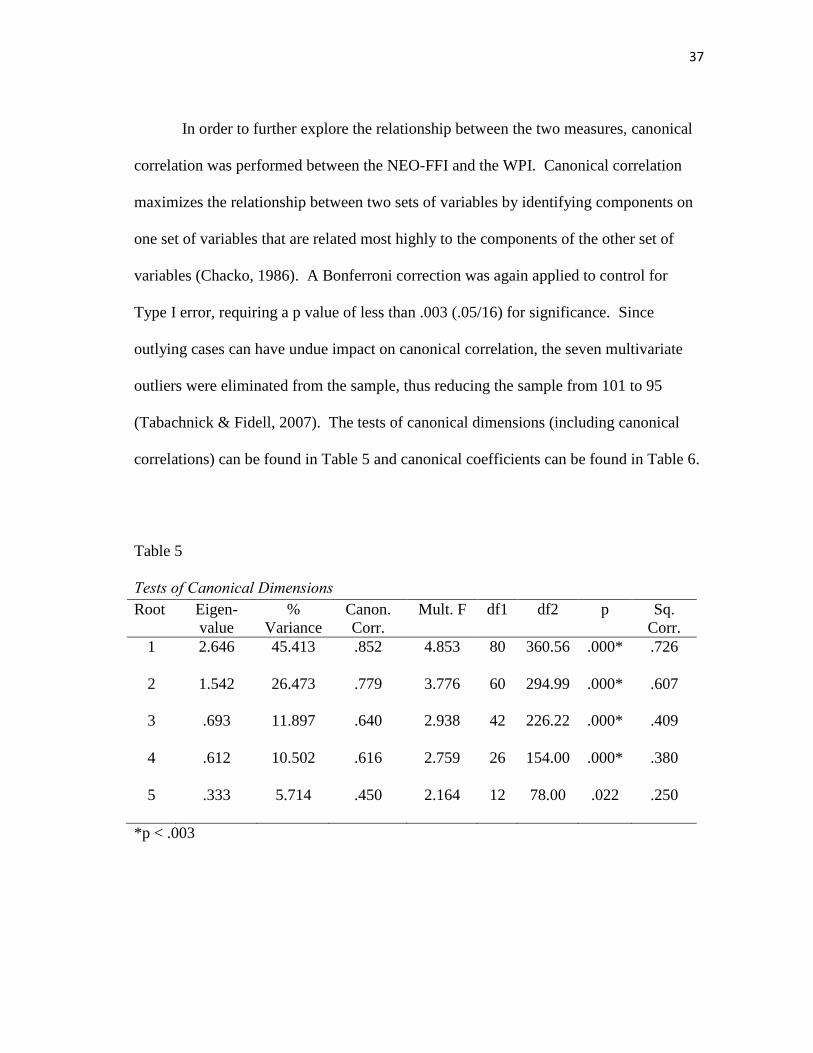
In order to further explore the relationship between the two measures, canonical
correlation was performed between the NEO-FFI and the WPI. Canonical correlation
maximizes the relationship between two sets of variables by identifying components on
one set of variables that are related most highly to the components of the other set of
variables (Chacko, 1986). A Bonferroni correction was again applied to control for
Type I error, requiring a p value of less than .003 (.05/16) for significance. Since
outlying cases can have undue impact on canonical correlation, the seven multivariate
outliers were eliminated from the sample, thus reducing the sample from 101 to 95
(Tabachnick & Fidell, 2007). The tests of canonical dimensions (including canonical
correlations) can be found in Table 5 and canonical coefficients can be found in Table 6.
Table 5
Tests of Canonical Dimensions Root Eigen-
value
%
Variance
Canon.
Corr.
Mult. F df1 df2 p Sq.
Corr.
1 2.646 45.413 .852 4.853 80 360.56 .000* .726
2 1.542 26.473 .779 3.776 60 294.99 .000* .607
3 .693 11.897 .640 2.938 42 226.22 .000* .409
4 .612 10.502 .616 2.759 26 154.00 .000* .380
5 .333 5.714 .450 2.164 12 78.00 .022 .250
*p < .003
38
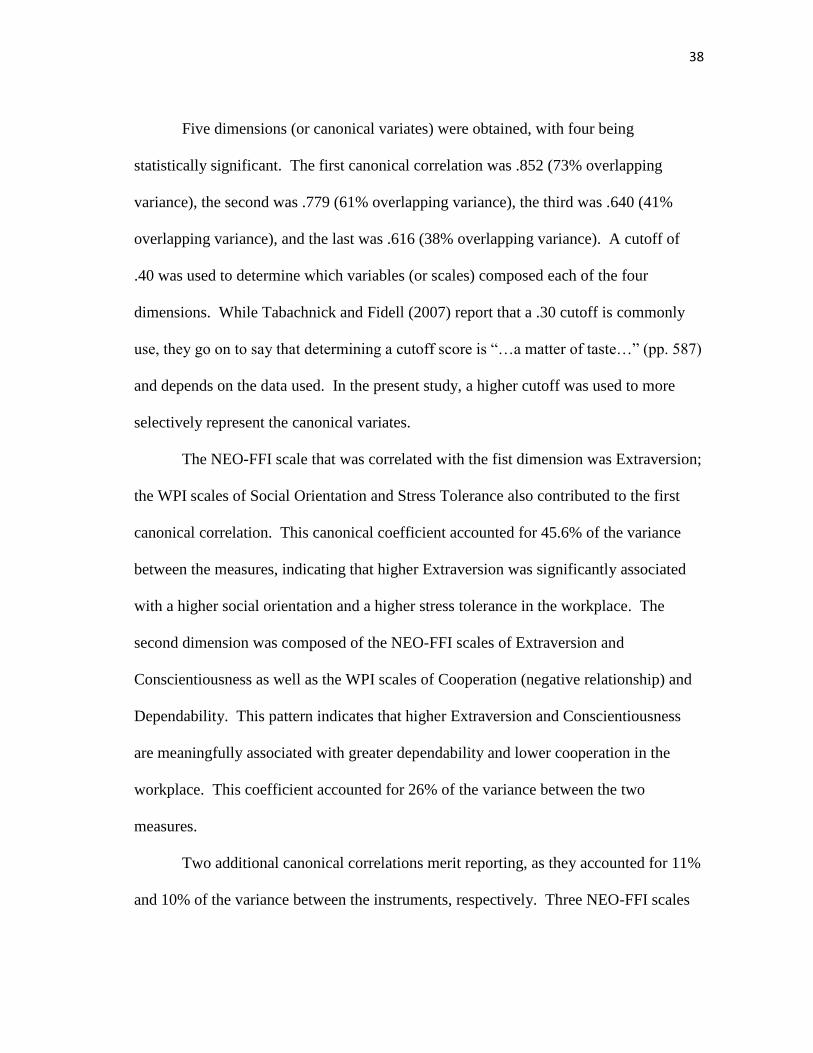
Five dimensions (or canonical variates) were obtained, with four being
statistically significant. The first canonical correlation was .852 (73% overlapping
variance), the second was .779 (61% overlapping variance), the third was .640 (41%
overlapping variance), and the last was .616 (38% overlapping variance). A cutoff of
.40 was used to determine which variables (or scales) composed each of the four
dimensions. While Tabachnick and Fidell (2007) report that a .30 cutoff is commonly
use, they go on to say that determining a cutoff score is “…a matter of taste…” (pp. 587)
and depends on the data used. In the present study, a higher cutoff was used to more
selectively represent the canonical variates.
The NEO-FFI scale that was correlated with the fist dimension was Extraversion;
the WPI scales of Social Orientation and Stress Tolerance also contributed to the first
canonical correlation. This canonical coefficient accounted for 45.6% of the variance
between the measures, indicating that higher Extraversion was significantly associated
with a higher social orientation and a higher stress tolerance in the workplace. The
second dimension was composed of the NEO-FFI scales of Extraversion and
Conscientiousness as well as the WPI scales of Cooperation (negative relationship) and
Dependability. This pattern indicates that higher Extraversion and Conscientiousness
are meaningfully associated with greater dependability and lower cooperation in the
workplace. This coefficient accounted for 26% of the variance between the two
measures.
Two additional canonical correlations merit reporting, as they accounted for 11%
and 10% of the variance between the instruments, respectively. Three NEO-FFI scales
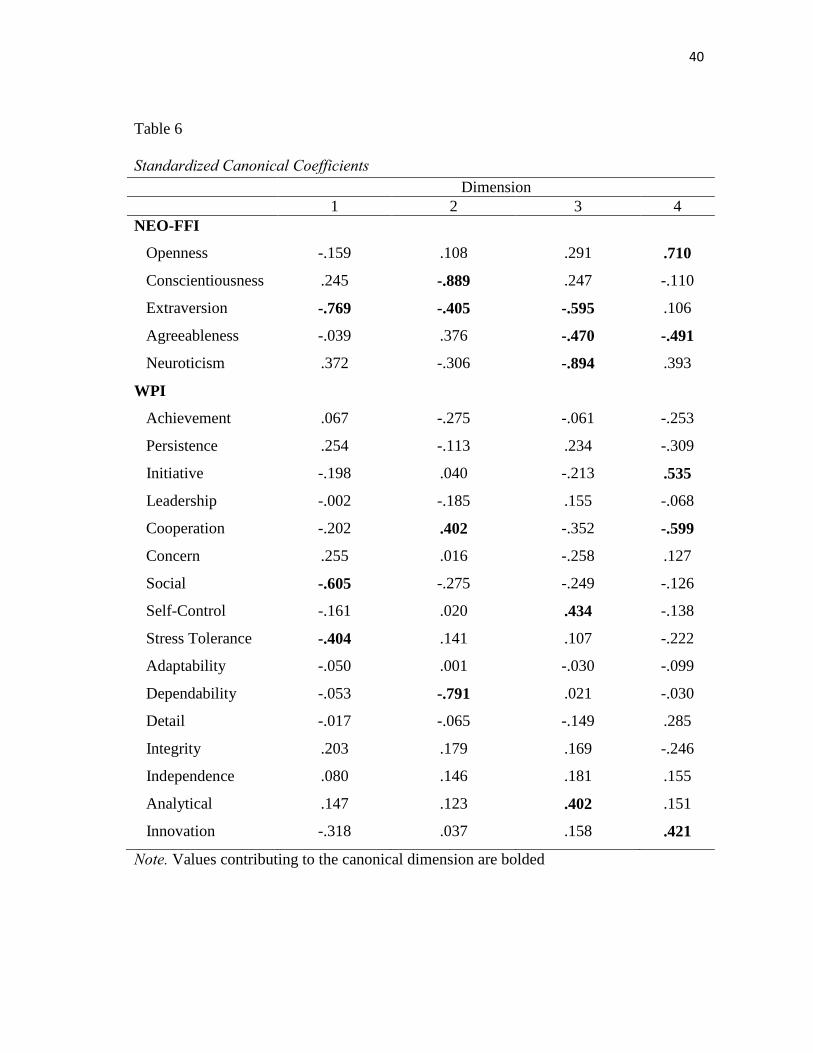
39
(Extraversion, Agreeableness, and Neuroticism) contributed to the third canonical
coefficient, and two WPI scales were inversely associated with it, Self-Control and
Analytical Thinking. Finally, Openness and Agreeableness were negatively associated
with the fourth canonical coefficient. Initiative and Innovation on the WPI were
associated with this canonical correlation, and Cooperation was inversely associated
with it.
Question 3: What is the pattern of correlation between workplace personality and self-
efficacy?
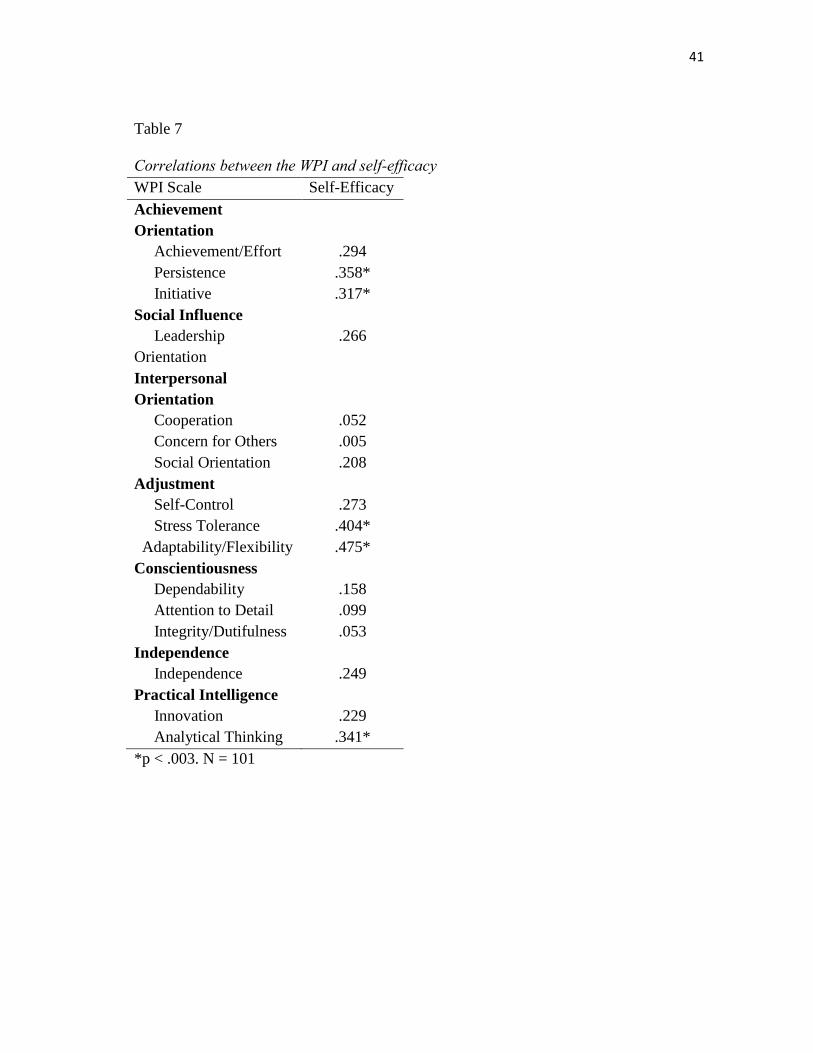
The third question addresses the pattern of correlation between workplace
personality and self-efficacy. Correlations were conducted between self-efficacy and
each scale of the WPI with correlation coefficients appearing in Table 7. As in the
previous analyses, a Bonferroni correction was applied and p values below .003 (16/.05)
were considered significant. Generalized self-efficacy was shown to correlate positively
and significantly with the WPI scales of Persistence, Initiative, Stress Tolerance,
Adaptability/Flexibility, and Analytical Thinking (r’s ranging from .310 to .475). This
pattern indicates that a greater general self-efficacy is moderately yet significantly
associated with greater persistence, initiative, stress tolerance, adaptability, and tendency
to think analytically in the workplace.
40
Table 6
Standardized Canonical Coefficients Dimension
1 2 3 4
NEO-FFI
Openness -.159 .108 .291 .710
Conscientiousness .245 -.889 .247 -.110
Extraversion -.769 -.405 -.595 .106
Agreeableness -.039 .376 -.470 -.491
Neuroticism .372 -.306 -.894 .393
WPI
Achievement .067 -.275 -.061 -.253
Persistence .254 -.113 .234 -.309
Initiative -.198 .040 -.213 .535
Leadership -.002 -.185 .155 -.068
Cooperation -.202 .402 -.352 -.599
Concern .255 .016 -.258 .127
Social -.605 -.275 -.249 -.126
Self-Control -.161 .020 .434 -.138
Stress Tolerance -.404 .141 .107 -.222
Adaptability -.050 .001 -.030 -.099
Dependability -.053 -.791 .021 -.030
Detail -.017 -.065 -.149 .285
Integrity .203 .179 .169 -.246
Independence .080 .146 .181 .155
Analytical .147 .123 .402 .151
Innovation -.318 .037 .158 .421
Note. Values contributing to the canonical dimension are bolded
41
Table 7
Correlations between the WPI and self-efficacy WPI Scale Self-Efficacy
Achievement
Orientation
Achievement/Effort .294
Persistence .358*
Initiative .317*
Social Influence
Leadership
Orientation
.266
Interpersonal
Orientation
Cooperation .052
Concern for Others .005
Social Orientation .208
Adjustment
Self-Control .273
Stress Tolerance .404*
Adaptability/Flexibility .475*
Conscientiousness
Dependability .158
Attention to Detail .099
Integrity/Dutifulness .053
Independence
Independence .249
Practical Intelligence
Innovation .229
Analytical Thinking .341*
*p < .003. N = 101
42
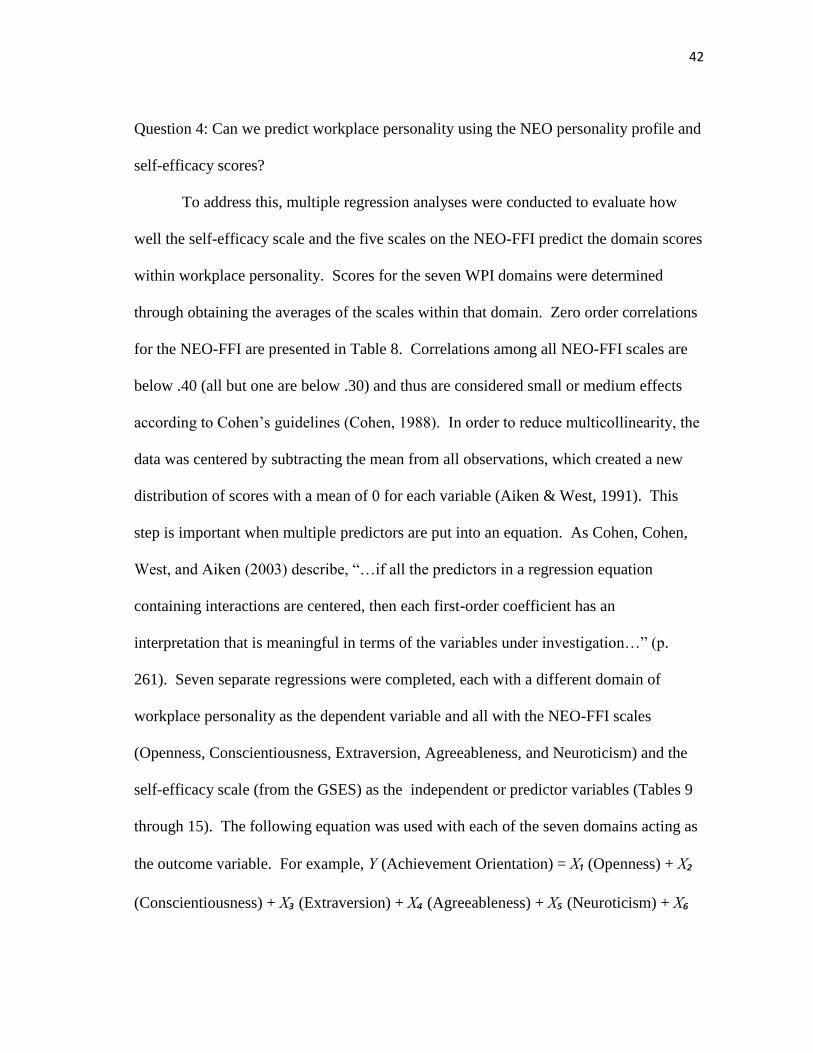
Question 4: Can we predict workplace personality using the NEO personality profile and
self-efficacy scores?
To address this, multiple regression analyses were conducted to evaluate how
well the self-efficacy scale and the five scales on the NEO-FFI predict the domain scores
within workplace personality. Scores for the seven WPI domains were determined
through obtaining the averages of the scales within that domain. Zero order correlations
for the NEO-FFI are presented in Table 8. Correlations among all NEO-FFI scales are
below .40 (all but one are below .30) and thus are considered small or medium effects
according to Cohen’s guidelines (Cohen, 1988). In order to reduce multicollinearity, the
data was centered by subtracting the mean from all observations, which created a new
distribution of scores with a mean of 0 for each variable (Aiken & West, 1991). This
step is important when multiple predictors are put into an equation. As Cohen, Cohen,
West, and Aiken (2003) describe, “…if all the predictors in a regression equation
containing interactions are centered, then each first-order coefficient has an
interpretation that is meaningful in terms of the variables under investigation…” (p.
261). Seven separate regressions were completed, each with a different domain of
workplace personality as the dependent variable and all with the NEO-FFI scales
(Openness, Conscientiousness, Extraversion, Agreeableness, and Neuroticism) and the
self-efficacy scale (from the GSES) as the independent or predictor variables (Tables 9
through 15). The following equation was used with each of the seven domains acting as
the outcome variable. For example, Y (Achievement Orientation) = X₁ (Openness) + X₂
(Conscientiousness) + X₃ (Extraversion) + X₄ (Agreeableness) + X₅ (Neuroticism) + X₆

43
(SE) + e. Since the scales on the NEO-FFI were not highly correlated with each other,
they were used concurrently as predictors. As in previous analyses, a bonferroni
correction was applied to control for Type I error, requiring a p value of less than .007
(.05/7) for significance. Power was calculated and assessed to be high, meaning there is
a high probability of not committing Type II error. Power was above .990 on every
analysis except for the equation which set Independence as the dependent variable where
power was .505.
Table 8
Zero Order Correlations for the NEO-FFI NEO-FFI Scale 1 2 3 4 5
1. Openness -- -.067 .200* -.028 -.039
2.Conscientiousness -- .085 .176 -.255*
3.Extraversion -- .148 -.374**
4.Agreeableness -- .242*
5. Neuroticism --
*p < .05 **p < .01. N = 101
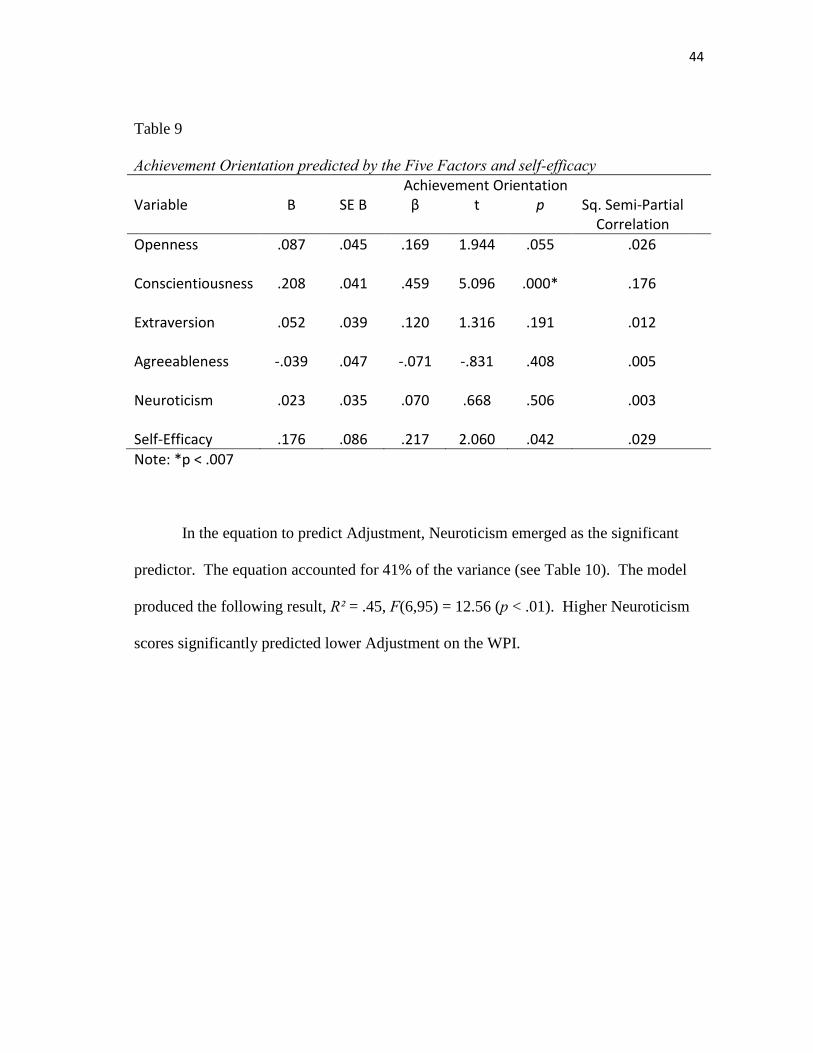
In the first equation, Achievement Orientation was used as the outcome variable.
Conscientiousness emerged as a significant predictor of the NEO scales and the entire
equation accounted for 32% of the variance in Achievement Orientation (see Table 9).
The model produced the following result, R² = .36, F(6,95) = 8.90 (p < .01).
44
Table 9
Achievement Orientation predicted by the Five Factors and self-efficacy Achievement Orientation Variable B SE B β t p Sq. Semi-Partial
Correlation
Openness .087 .045 .169 1.944 .055 .026 Conscientiousness .208 .041 .459 5.096 .000* .176 Extraversion .052 .039 .120 1.316 .191 .012 Agreeableness -.039 .047 -.071 -.831 .408 .005 Neuroticism .023 .035 .070 .668 .506 .003 Self-Efficacy .176 .086 .217 2.060 .042 .029
Note: *p < .007
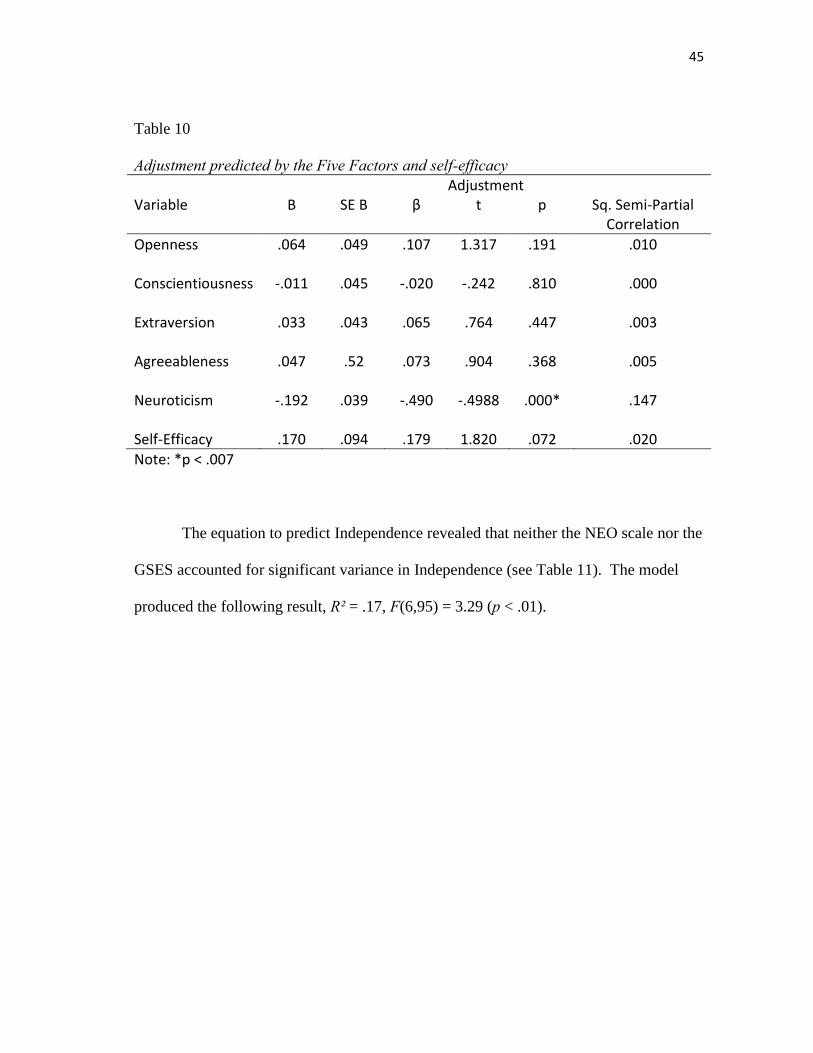
In the equation to predict Adjustment, Neuroticism emerged as the significant
predictor. The equation accounted for 41% of the variance (see Table 10). The model
produced the following result, R² = .45, F(6,95) = 12.56 (p < .01). Higher Neuroticism
scores significantly predicted lower Adjustment on the WPI.
45
Table 10
Adjustment predicted by the Five Factors and self-efficacy Adjustment Variable B SE B β t p Sq. Semi-Partial
Correlation
Openness .064 .049 .107 1.317 .191 .010 Conscientiousness -.011 .045 -.020 -.242 .810 .000 Extraversion .033 .043 .065 .764 .447 .003 Agreeableness .047 .52 .073 .904 .368 .005 Neuroticism -.192 .039 -.490 -.4988 .000* .147 Self-Efficacy .170 .094 .179 1.820 .072 .020
Note: *p < .007
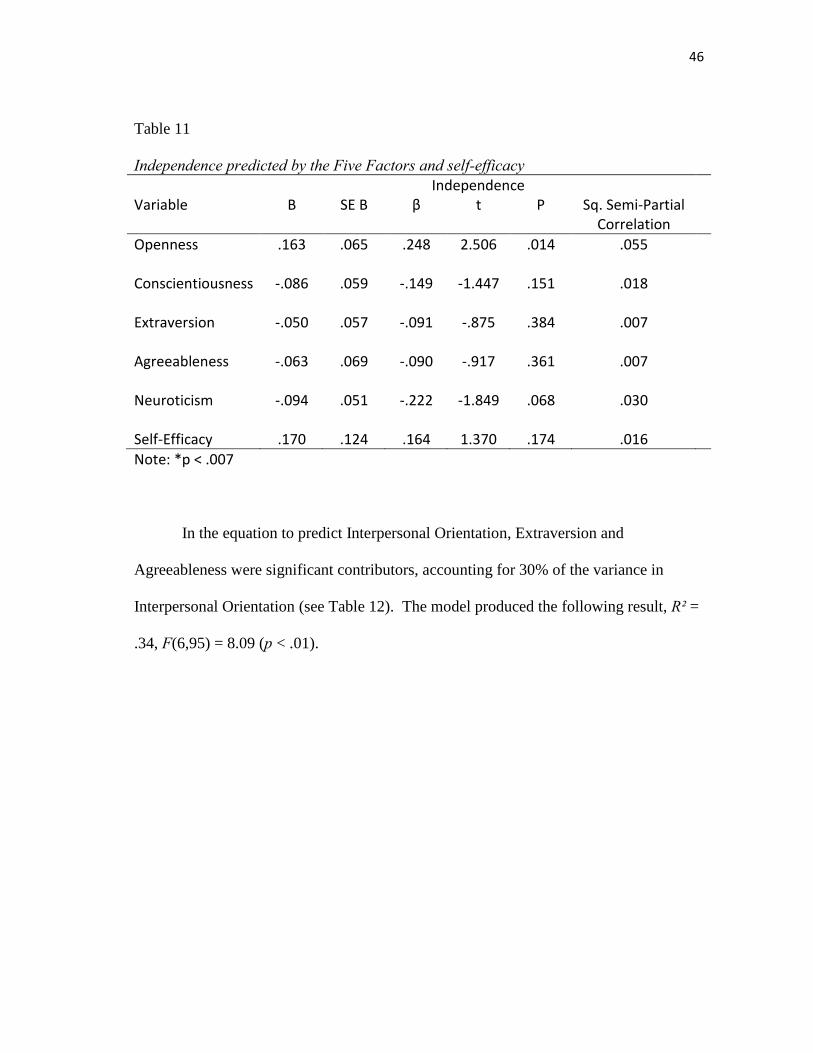
The equation to predict Independence revealed that neither the NEO scale nor the
GSES accounted for significant variance in Independence (see Table 11). The model
produced the following result, R² = .17, F(6,95) = 3.29 (p < .01).
46
Table 11
Independence predicted by the Five Factors and self-efficacy Independence Variable B SE B β t P Sq. Semi-Partial
Correlation
Openness .163 .065 .248 2.506 .014 .055 Conscientiousness -.086 .059 -.149 -1.447 .151 .018 Extraversion -.050 .057 -.091 -.875 .384 .007 Agreeableness -.063 .069 -.090 -.917 .361 .007 Neuroticism -.094 .051 -.222 -1.849 .068 .030 Self-Efficacy .170 .124 .164 1.370 .174 .016
Note: *p < .007
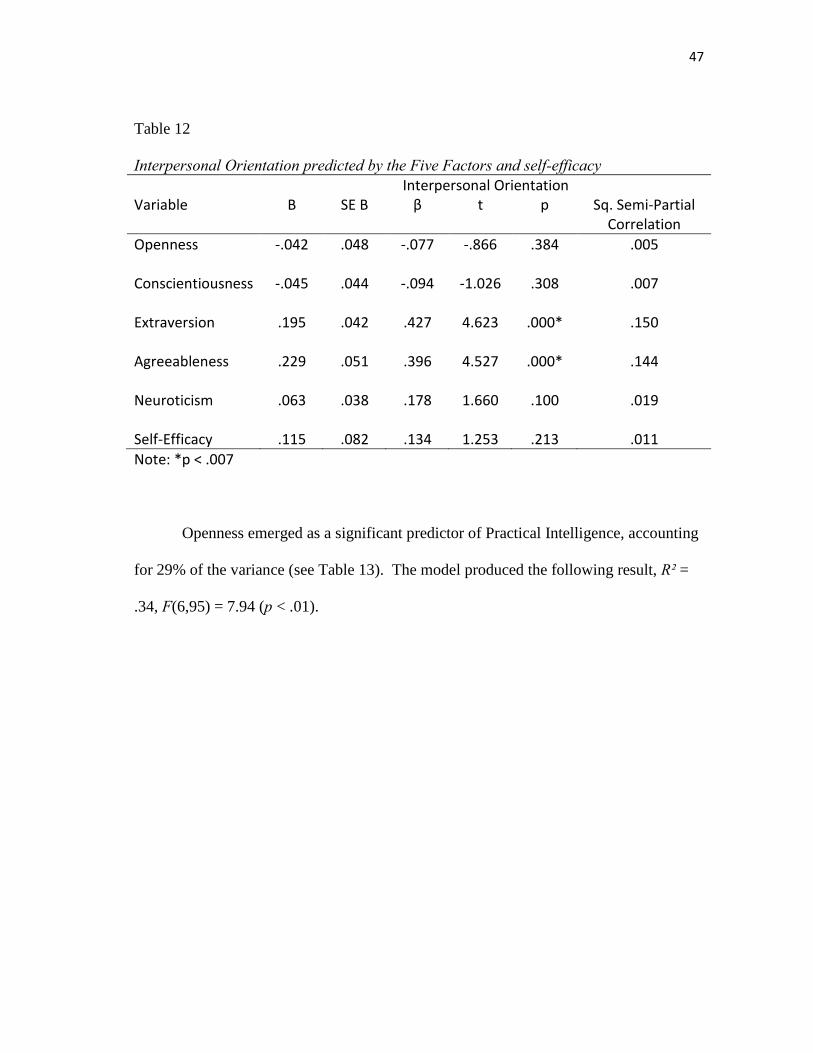
In the equation to predict Interpersonal Orientation, Extraversion and
Agreeableness were significant contributors, accounting for 30% of the variance in
Interpersonal Orientation (see Table 12). The model produced the following result, R² =
.34, F(6,95) = 8.09 (p < .01).
47
Table 12
Interpersonal Orientation predicted by the Five Factors and self-efficacy Interpersonal Orientation Variable B SE B β t p Sq. Semi-Partial
Correlation
Openness -.042 .048 -.077 -.866 .384 .005 Conscientiousness -.045 .044 -.094 -1.026 .308 .007 Extraversion .195 .042 .427 4.623 .000* .150 Agreeableness .229 .051 .396 4.527 .000* .144 Neuroticism .063 .038 .178 1.660 .100 .019 Self-Efficacy .115 .082 .134 1.253 .213 .011
Note: *p < .007
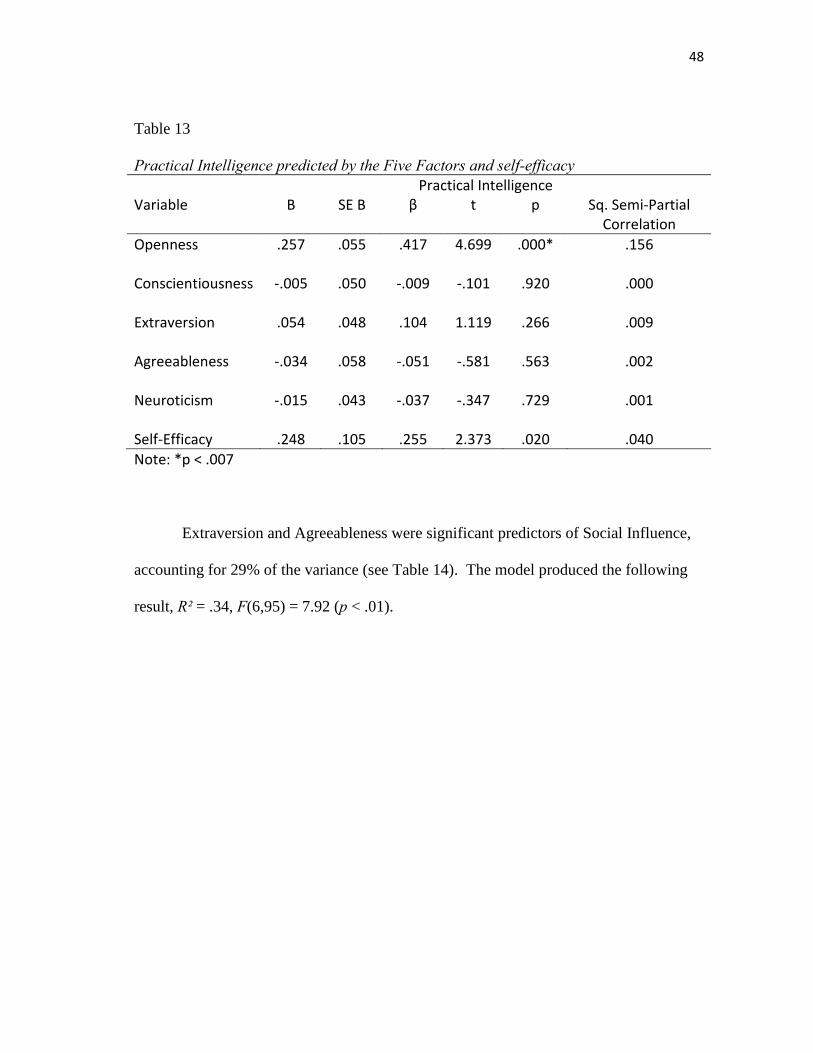
Openness emerged as a significant predictor of Practical Intelligence, accounting
for 29% of the variance (see Table 13). The model produced the following result, R² =
.34, F(6,95) = 7.94 (p < .01).
48
Table 13
Practical Intelligence predicted by the Five Factors and self-efficacy Practical Intelligence Variable B SE B β t p Sq. Semi-Partial
Correlation
Openness .257 .055 .417 4.699 .000* .156 Conscientiousness -.005 .050 -.009 -.101 .920 .000 Extraversion .054 .048 .104 1.119 .266 .009 Agreeableness -.034 .058 -.051 -.581 .563 .002 Neuroticism -.015 .043 -.037 -.347 .729 .001 Self-Efficacy .248 .105 .255 2.373 .020 .040
Note: *p < .007
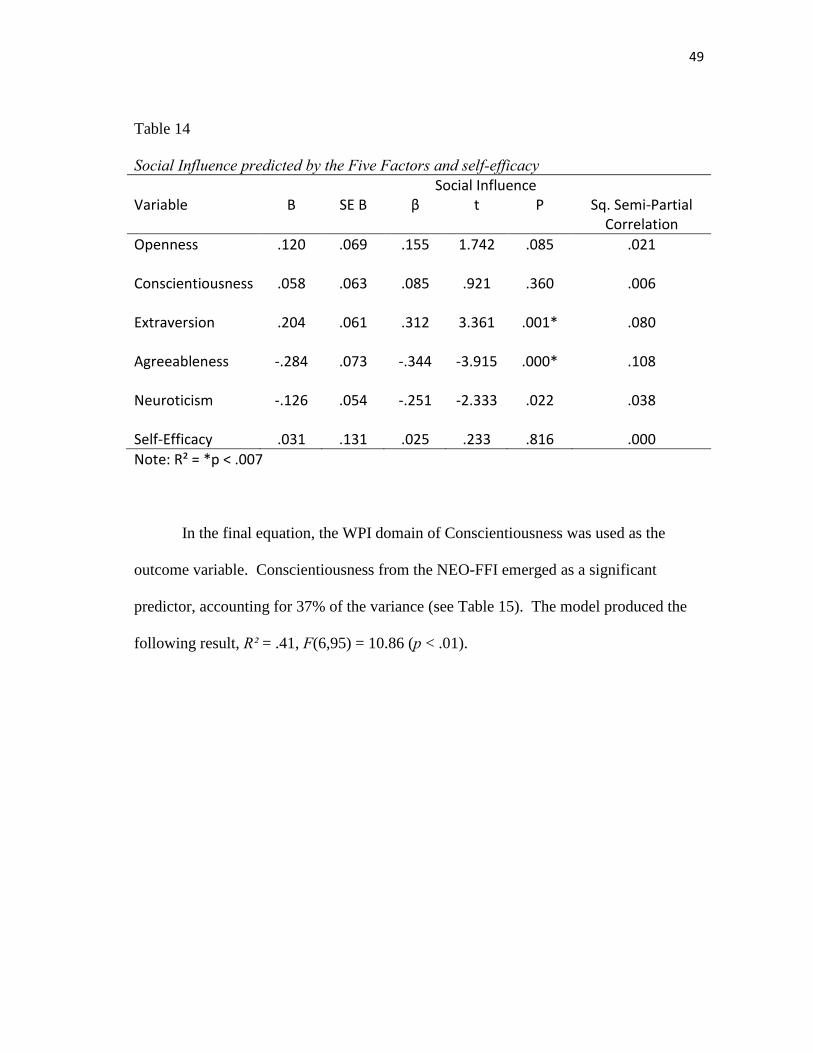
Extraversion and Agreeableness were significant predictors of Social Influence,
accounting for 29% of the variance (see Table 14). The model produced the following
result, R² = .34, F(6,95) = 7.92 (p < .01).
49
Table 14
Social Influence predicted by the Five Factors and self-efficacy Social Influence Variable B SE B β t P Sq. Semi-Partial
Correlation
Openness .120 .069 .155 1.742 .085 .021 Conscientiousness .058 .063 .085 .921 .360 .006 Extraversion .204 .061 .312 3.361 .001* .080 Agreeableness -.284 .073 -.344 -3.915 .000* .108 Neuroticism -.126 .054 -.251 -2.333 .022 .038 Self-Efficacy .031 .131 .025 .233 .816 .000
Note: R² = *p < .007
In the final equation, the WPI domain of Conscientiousness was used as the
outcome variable. Conscientiousness from the NEO-FFI emerged as a significant
predictor, accounting for 37% of the variance (see Table 15). The model produced the
following result, R² = .41, F(6,95) = 10.86 (p < .01).
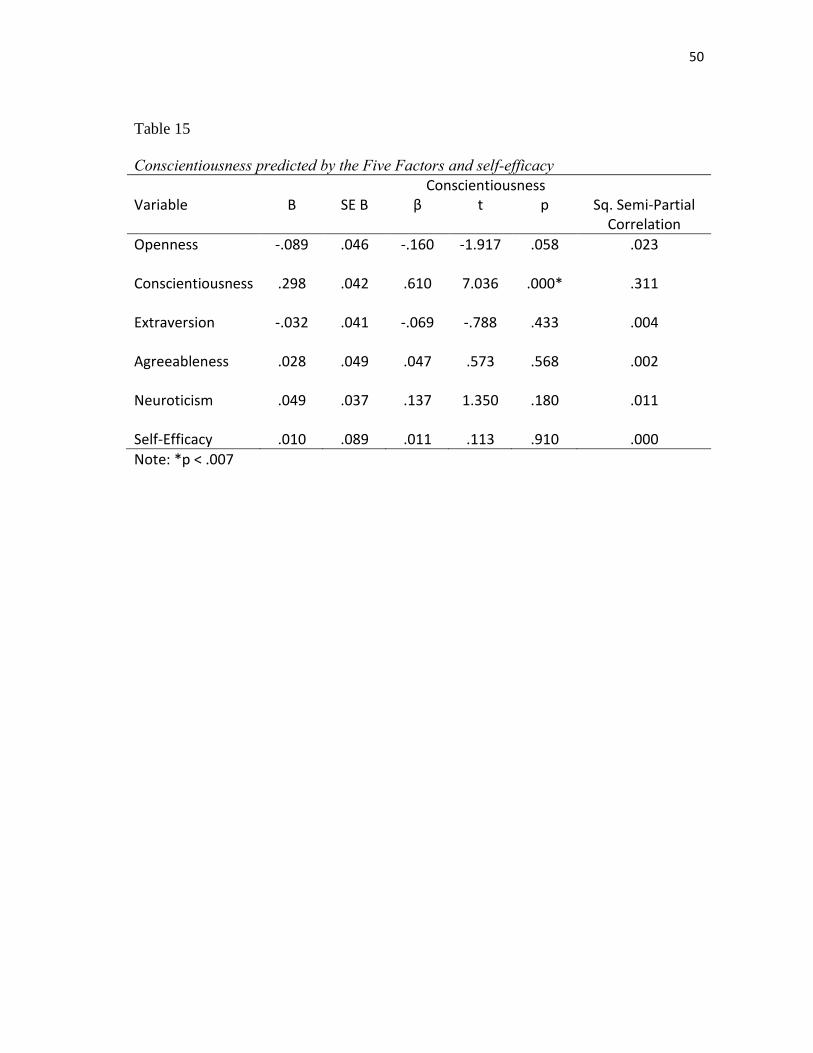
50
Table 15
Conscientiousness predicted by the Five Factors and self-efficacy Conscientiousness Variable B SE B β t p Sq. Semi-Partial
Correlation
Openness -.089 .046 -.160 -1.917 .058 .023 Conscientiousness .298 .042 .610 7.036 .000* .311 Extraversion -.032 .041 -.069 -.788 .433 .004 Agreeableness .028 .049 .047 .573 .568 .002 Neuroticism .049 .037 .137 1.350 .180 .011 Self-Efficacy .010 .089 .011 .113 .910 .000
Note: *p < .007
51
CHAPTER V
DISCUSSION AND CONCLUSION
The present study had four primary goals. The first goal was to attempt to
replicate the factor structure of the WPI. Different models were tested including the
original seven-factor model, models containing three and four factors, and a single factor
model. Model fit could not be obtained and thus the factor structure could not be
replicated. Due to the high volume of parameters, a much larger sample size is required
to obtain meaningful results. A principal factors analysis was run in an attempt to learn
more about the factors within the WPI from an exploratory view. Keeping in mind the
limited sample size, results suggested that five factors (using the Kaiser-criterion) or six
factors (using the scree test) may provide a better fit than the seven factors used in the
WPI. It is also worth noting that upon closer look of the data, the Interpersonal
Orientation domain proved to be the most problematic domain within the model in terms
of obtaining model fit in that the factor loading for one of the scales was very low.
In addition to sample size, there are other possible explanations for the inability
to confirm the factor structure of the WPI. As Gignac (2009) mentions, several
researchers have been unable to replicate the Five Factor Model of personality as used in
the NEO-FFI. Both the Five Factor Model and the model used by the WPI are rationally
derived; consequently, this may make it difficult to empirically confirm their factor
structure. As previously mentioned, five of the between-scale correlations on the WPI
are strongly correlated as interpreted by Cohen (1988) and an additional 36 are
moderately correlated. This suggests that there is some overlap between the scales and
52
the scales may not be measuring unique and independent constructs, making it difficult
to confirm the factor structure.
The second goal of the present study was to explore the relationship between the
sixteen scales on the WPI and the five factors as measured on the NEO-FFI. Both zero
order Pearson product moment correlations and canonical correlations were obtained to
determine the relationship between the two measures.
With regard to the canonical analyses, four significant canonical dimensions
were elicited from the data, which serve to maximize our understanding of the
relationship between the NEO-FFI and the WPI. The first canonical dimension included
the criterion variables of extraversion on the NEO-FFI and both social orientation and
stress tolerance on the WPI, with extraversion and social orientation as the primary
contributors. Product-moment correlations also show Extraversion on the NEO-FFI and
Social Orientation on the WPI to be the two scales which are most highly correlated
compared with other scale comparisons. Both scales are representative of preferences
for working with others and for being outgoing. This relationship adds to the construct
validity of this particular scale on the WPI as it correlates with a scale measuring a
similar construct on the NEO-FFI. The first dimension was also composed of the WPI
scale of Stress Tolerance. Perhaps those who are more inclined to work with others, also
have a greater tolerance for stress in the workplace.
The Conscientiousness scale on the NEO-FFI and the Dependability scale on the
WPI were the primary contributors to the second canonical dimension indicating a high
correlation between these two scales. This was also obtained in the product-moment
53
correlation analysis, which showed Conscientiousness on the NEO-FFI to correlate most
with the domains of Achievement Orientation and Conscientiousness on the WPI. As
previously mentioned, persons scoring high in Conscientiousness on the NEO-FFI are
thought to be responsible and trustworthy - descriptors that also describe persons scoring
high on Dependability on the WPI, again supporting the construct validity of the WPI.
While Extraversion on the NEO-FFI also contributed to this dimension, as did
Cooperation on the WPI (in the opposite direction), both scales were not as highly
correlated with the dimension as Conscientiousness and Dependability. This does
suggest, however, that those who are dependable and conscientious also tend to be
extraverted. The negative relationship with cooperation suggests that while they may be
dependable and have a preference to working with others, they may not be as skilled at
cooperation. It could be argued that an employee who is detail oriented and responsible
may be more focused on completing the task at hand and on remaining in control than on
cooperating.
The most significant criterion contributing to the third canonical dimension was
Neuroticism. Other contributors included a negative relationship with both Self-Control
and Analytical Thinking on the WPI. This suggests that those higher on Neuroticism
have lower scores on both Self-Control and Analytical Thinking. Since the Neuroticism
scale is a measure of emotional instability, it is no surprise that it would be inversely
related to Self-Control, which measures the ability to maintain composure in difficult
situations. As one would expect, product-moment correlations showed Neuroticism on
the NEO-FFI to correlate negatively and significantly with all three scales of the
54
Adjustment domain on the WPI. Further, since Analytical Thinking on the WPI
addresses one’s ability to use logic and produce high quality work, it is easy to see how
emotional instability would work against this skill. For example, if an employee
becomes overwhelmed easily or is unable to maintain composure, it would be difficult
for him or her to think logically and critically.
The final significant canonical variate was composed of positive relationships
between Openness (NEO-FFI), Initiative (WPI), and Innovation (WPI). This
relationship was also reflected in the product-moment correlations. As previously
mentioned, according to Costa and McCrae (1985, 1992), persons high in Openness tend
to have active imaginations and prefer variety. Similarly, persons high on the WPI
scales of Initiative and Innovation are thought to be active in pursuing new (possibly
different) possibilities. The value of newness seems to be reflected in all three of these
scales. The Agreeableness factor on the NEO-FFI and Cooperation on the WPI
contributed to the fourth dimension as having a negative relationship. It appears that
persons or employees who are innovative and take initiative tend to be less cooperative
and agreeable. It may be that they are more invested in furthering their own ideas than
in cooperating with others.
Overall, the two measures seem to align in some important ways, which adds to
the convergent validity of the WPI. They correlate highly when it comes to these four
dimensions that could be summarized as measuring social qualities, reliability,
pessimism or instable affect, and openness and initiative in pursuing new ideas. The
NEO-FFI factor of Extraversion was shown to correlate most often with the WPI
55
compared with other factors on the NEO-FFI. The two measures seem to be most
related when it comes to their ability to assess cooperation and relationships with others
due to the fact that Extraversion on the NEO-FFI and Cooperation on the WPI appear
most often in accounting for the variance in the canonical dimensions. The NEO-FFI
does seem to do satisfactorily at capturing a person’s ability to work well with others,
which is also important for success in the workplace. An implication of this involves
employers using the NEO-FFI during the hiring process.
These results also indicate that the NEO-FFI may not address some traits of
workplace personality that have proven to be important to vocational success. For
example, half (eight) of the WPI scales did not fall into any of the four significant
canonical variates indicating that they were not needed to maximize the correlation
between the two measures. Achievement, Persistence, Leadership, Concern for Others,
Adaptability, Attention to Detail, Integrity/Rule Following, and Independence all had
canonical coefficients below the cutoff score and were not included in any of the four
dimensions. All five factors of the NEO-FFI were accounted for in at least one of the
canonical dimensions. It could be argued that the WPI scales that did not appear in one
of the dimensions measure those aspects of personality that are specific to workplace
personality. Overall, there are some areas in which the NEO-FFI does correlate with the
WPI but some in which it does not. This could be considered evidence that the WPI
measures traits that are unique and important to vocational success that the NEO-FFI
does not address, but this goes beyond the scope of the current study.
56
The NEO-FFI and the WPI correlate highly in many expected ways, supporting
the convergent validity of the WPI. For example, as previously mentioned, Extraversion
on the NEO-FFI and Social Orientation on the WPI obtained the highest significant
correlation. Both scales measure very similar constructs, contributing to the convergent
validity of the WPI. Also, both measures attempt to measure conscientiousness: the
NEO-FFI through a single scale, and the WPI through a combination of three scales
(Attention to Detail, Dependability, and Integrity/Dutifulness). The NEO-FFI scale was
highly correlated with both Attention to Detail and Dependability on the WPI, again
adding to its construct validity. Perhaps Integrity/Dutifulness measures a piece of
conscientiousness that is too specific to the workplace to correlate highly with
conscientiousness in a general way.
The current study also produced evidence of discriminate validity, as certain
scales that measure theoretically unrelated constructs had very low correlations. For
example, the three lowest correlations between the two measures were between Concern
for Others (WPI) and Conscientiousness (NEO-FFI), Dependability (WPI) and
Neuroticism (NEO-FFI), and Analytical Thinking (WPI) and Agreeableness (NEO-FFI).
It would not be expected that a scale measuring a respondent’s level of agreeableness to
be meaningfully related to the degree to which he or she can engage in critical thinking
or problem solving.
The third goal of this study was to determine possible relations between the
domains of workplace personality and self-efficacy. As previously mentioned, other
studies have examined how career self-efficacy correlates with general personality
57
(Hartman & Betz, 2007). The present study was exploratory in nature and examined
correlations between general self-efficacy and workplace personality. A general sense
of self-efficacy (as measured by the GSES) was significantly correlated with higher
scores on Persistence, Initiative, Stress Tolerance, Adaptability/Flexibility, and
Analytical Thinking on the WPI. It is worth noting that none of the scales on the WPI
correlated negatively with self-efficacy, indicating that high scores in all areas of
workplace personality were associated with higher scores on overall sense of self-
efficacy. This means that generally, confident people score higher on workplace
personality scales, which in turn predicts better job performance. It is expected that in
order to both take initiative (as assessed through the Initiative scale on the WPI) and
persist through obstacles and challenges (as assessed through the Persistence scale on the
WPI), one must have the confidence to do so. Therefore, it is logical to think that these
two scales are correlated with higher self-efficacy.
Results suggest that those with a higher ability to tolerate stress and adapt in the
face of obstacles also have higher levels of self-efficacy. Finally, there was a significant
relationship between self-efficacy and analytical thinking indicating that those who are
able to use logic to address work-related issues also have high general self-efficacy.
These correlations lend credence to the importance of self-efficacy to work performance
as described by Social Cognitive Career Theory since these workplace personality traits
have been proven to job success (Pearson, 2007). While SCCT emphasizes about the
importance of career-related self-efficacy, it appears that a general sense of self-efficacy
is also important in its relationship to workplace personality in that a higher sense of
58
general self-efficacy is related to higher scores on a number of workplace personality
traits.
The final goal of the present study was to attempt to predict workplace
personality based on scores on the NEO-FFI and the GSES. This was done be entering
all five factors of the NEO-FFI and self-efficacy as measured by the GSES as predictors
for each domain of workplace personality. In the workplace domain of Achievement
Orientation, the only significant predictor was Conscientiousness on the NEO-FFI
(compared to other personality factors and self-efficacy). This means that the employee
characteristics of responsibility and attention to detail are good predictors of someone
who takes initiative, is persistent, and strives towards his or her goals. Similarly,
Conscientiousness on the NEO-FFI also proved to be a significant predictor of
Consciousness on the WPI. These scales are highly correlated and seem to be measuring
similar constructs, lending to the construct validity of the WPI in the way it is measuring
conscientiousness.
A separate regression analysis showed that the domain of Adjustment was best
predicted by Neuroticism on the NEO-FFI. Thus, persons with lower scores on
Neuroticism predicted higher scores on Adjustment. Employees scoring high on the
Adjustment domain show an ability to cope with and manage different situations and
accept criticism well. Therefore if these are particularly important traits for a given job,
results show that it would be useful to assess the neuroticism of potential job candidates
as lower neuroticism has been shown to be a predictor for these traits. For example, in a
dynamic work environment in which things are frequently changing and employees must
59
function independently and adapt to changes quickly, a low level of neuroticism is a
good predictor of their ability to do so.
The NEO-FFI factors of Agreeableness and Extraversion were significant
predictors for two of the WPI domains: Interpersonal Orientation and Social Influence
(Leadership). Since the two measures are assessing similar constructs in desire and
ability to work with others, this comes as no surprise and again speaks to the construct
validity of the WPI.
Finally, Openness on the NEO-FFI was shown to be a significant predictor of the
WPI domain, Practical Intelligence. As previously mentioned, those with high scores on
the Openness factor are described as having an active imagination and a preference for
variety. The domain of Practical Intelligence refers to an ability to generate new ideas
and to think logically and critically. Both openness and practical intelligence seem to
relate to creativity and critical thinking. This result demonstrates that persons who are
imaginative and open to new experiences predict an ability to be creative and to think
critically in the workplace.
Collectively, results from the correlational and regression analyses highlight how
the two instruments are most related. Conscientiousness on the NEO-FFI is most related
to Conscientiousness and Achievement scales on the WPI. Extraversion on the NEO-
FFI is related to and predictive of Social Influence and Interpersonal Orientation scales
on the WPI, and Neuroticism on the NEO-FFI effectively predicts the Adjustment
domain on the WPI and is correlated significantly with all scales within the domain.
60
As previously mentioned, Independence on the WPI was not significantly
correlated with any of the five factors. As expected then, it was also not significantly
predicted by any of the five factors or self-efficacy. Interestingly, general self-efficacy
was not a significant predictor of any of the seven domains of workplace personality.
Social Cognitive Career Theory posits that self-efficacy plays a major role in career
choice and goal-oriented behavior. While self-efficacy was positively and significantly
correlated with five scales on the WPI, this study did not find general self-efficacy to be
a significant predictor of trait domains proven to be important to workplace success. It
seems that for general self-efficacy to be a useful predictor of vocational success, it is
important for it to be measured on specific work-related tasks. While general-self-
efficacy was positively correlated with a number of workplace personality scales, when
looking at the seven domains, it did not have predictive power. There was no domain in
which self-efficacy was correlated with all scales within that domain. For example,
while general self-efficacy showed a significant positive relationship with Persistence
and Initiative within the Achievement Orientation domain, it was not related to
Achievement/Effort. Similarly, while self-efficacy was positively correlated with both
Adaptability/Flexibility and Stress Tolerance within the Adjustment domain, it did not
prove to be related to Self-Control. Therefore, while general self-efficacy is related to a
number of workplace personality traits, it did not have predictive power for any of the
domains.
While general self-efficacy was not a significant predictor of workplace
personality domains, the present study provided further evidence for the usefulness of

61
self-efficacy in a vocational setting since self-efficacy did correlate positively and
significantly with a number of workplace personality traits. While past research has
shown that self-efficacy is a unique and important indicator of career exploration and
career choice actions, the current study shows that general self-efficacy is also correlated
with traits that have been proven to be important to job success despite the lack of
predictive power. This speaks to the value of assessing self-efficacy when interviewing
potential employees as well as the value of communicating a sense of self-efficacy when
interviewing for potential jobs.
The present study also provided more information about the WPI as a unique tool
for measuring aspects of workplace personality that are not measured by measures of
general personality such as the NEO-FFI. In some expected ways, such as between
interpersonal characteristics and conscientiousness, the scales were closely correlated
indicating that on the NEO-FFI, higher Extraversion and lower Neuroticism are good
predictors of many aspects of workplace personality that have proven to lead to success
in the workplace. However, the WPI seems to assess some areas of personality that the
NEO-FFI does not, suggesting that is a unique tool in vocational assessment.
Limitations and Areas of Future Research
There were some limitations to this study that are worth mentioning. One of the
primary limitations has to do with the small sample size. While the sample was
sufficient when it comes to accepted standards for correlational analyses, the sample size
proved insufficient for producing meaningful results on the CFA. Analyses should be
done replicating the factor structure of the WPI using a larger sample size. The current
62
sample was also highly educated when compared to the general population, and thus,
have obtained a certain level of success. It is also worth noting that they were also from
major urban areas, so rural areas were not represented in the current sample. Over 40%
of the current sample reported obtaining a bachelor’s degree as opposed to about twenty-
four percent of the general population (U.S. Census Bureau, 2010). Thus, the current
sample may be more vocationally successful than the general population. While the
present study provided correlations between general self-efficacy and workplace
personality, future studies could correlate workplace personality with career-specific
self-efficacy using measures such as the Skills Confidence Inventory, which measures
self-efficacy for specific vocations tasks. It would be valuable to determine if self-
efficacy for specific tasks would be a significant predictor or workplace personality
domains since general self-efficacy was not.
It is also worth noting that two different methods of administration were used in
the present study: the NEO-FFI and the GSES were administered utilizing the
conventional paper/pencil method, and participants responded to the WPI using
computer administration. In their study, Davis and Cowles (1989) administered a
number of tests to different groups of participants utilizing both paper/pencil and
computerized versions. They found that while computerized administered tests showed
higher test-retest reliability, they also found respondents more likely to “fake good”
when compared to paper/pencil administration. However, when it comes to item scores
and scale intercorrelations, Merten and Siebert (1997) found no significant difference
between the paper/pencil form and the computerized form of both the Eysenck
63
Personality Questionnaire – Revised and the Carroll Rating Scale for Depression. Thus,
it is unknown to what degree the two types of administration affected the results of the
current study. Further, while personality is thought to be a stable construct, the measures
were typically not completed at the same sitting, causing the measures to be completed
at different times. Many respondents did complete the online measure the same day as
the paper/pencil measures, others completed the measures days (and in some cases
weeks) apart. This is a possible limitation of the study since the administration of the
online measure was not supervised.
Because a respondent’s frame-of-reference has been shown to make s difference
in the validity of a measure, future studies should examine any differences in NEO-FFI
scores with and without a specific work-related frame-of-reference. Also, it may be
valuable to add a frame-of-reference to each item on the WPI as well to see if it adds to
its validity. Currently, seventy-five of the two hundred and sixteen items (34.7%) on the
WPI contain a specific work-related frame of reference (such as “at work,” “on the job,”
or “with employees”). The remaining items do not provide a frame of reference for the
respondent. For example, the item “When I disagree with someone I typically tell them”
does not contain a frame-of-reference and may be answered differently depending on the
reference used by each respondent. It is unknown whether or not specifying
“workplace” in the title of the measure provides enough of a frame-of-reference that
stays with the respondent throughout each item of the test.
While the current study used the five factors of the NEO-FFI and general self-
efficacy to predict workplace personality domains, future study could add predictor
64
variables of locus of control and self-esteem in order to further the research in core self-
evaluations. Since generalized self-efficacy was not shown to be a significant predictor
of any of the workplace domains, it would be interesting to see if adding other self-
evaluations would provide any predictive power.
Another notable issue involves the differing specificity of the two measures
compared. The NEO-FFI is the short form of the Revised NEO-PI, which contains two
hundred and forty three items and contains thirty additional facet scales. There are six
facet scales that make up each of the five measured factors. Therefore, the NEO-PI
provides more specificity than the NEO-FFI, and perhaps more consistent with the level
of specificity the WPI provides. Future studies should compare the WPI with the more
specific NEO-PI to see if the areas of the WPI that did not correlate with the NEO-FFI
are accounted for by the NEO-PI. Finally, since the present study provided a
comparison of the NEO-FFI and the WPI and outlined the ways in which they measure
similar and different constructs, a next logical step is to compare how well each measure
predicts work-related outcome variables (such as job satisfaction or performance). This
would also add to the validity of the WPI in that it would provide some indication that
the WPI is performing as intended.
In summary, the present study adds to the research in Social Cognitive Career
Theory that emphasizes the importance of self-efficacy to career development and
performance by demonstrating positive and significant correlations between general self-
efficacy and some personality traits that have been shown to contribute to success in the
workplace. When interviewing potential job candidates, it may be beneficial for
65
employers to assess the self-efficacy of the interviewee in addition to workplace
personality traits. The fact that the WPI taps into different traits that the NEO-FFI does
not speaks to the uniqueness of workplace personality when compared to personality in
the general sense and the use of utilizing measures of workplace personality in a
vocational setting.
66
REFERENCES
Ashton, M.C. & Lee, K. (2005). Honesty-humility, the Big Five, and the Five Factor Model.
Journal of Personality, 73, 1321-1354.
Barrick, M.R., Mount, M.K., & Gupta, R. (2003). Meta-analysis of the relationship between
the Five Factor Model and Holland’s occupational types. Personnel Psychology, 56, 45-
73.
Betz, N.E., & Borgen, F.H. (2000). The future of career assessment: Integrating vocational
interests with self-efficacy and personal styles. Journal of Career Assessment, 8, 329-
338.
Betz, N.E., Borgen, F.H., & Harmon, L.W. (1996). Skills Confidence Inventory. Palo Alto,
CA: Consulting Psychologists Press.
Betz, N.E., Borgen, F.H., & Harmon, L.W. (1996). The relationships of self-efficacy for the
Holland themes too gender, occupational group membership, and vocational interest.
Journal of Counseling Psychology, 43, 90-98.
Betz, N.E., Borgen, F.H., Rottinghaus, P., Paulsen, A., Halper, C.R., & Harmon, L.W.
(2003). The Expanded Skills Confidence Inventory: Measuring basic dimensions of
vocational activity. Journal of Vocational Behavior, 62, 76-100.
Borman, W.C., Kubisiak, U.C., & Schneider, R.J. (1999). Work styles. In N.G. Peterson,
M.D. Mumford, W.C. Borman, P.R. Jeanneret, & E.A. Fleishman (Eds.), An
occupational information system for the 21st century: The development of the O*NET
(pp. 213-226). Washington DC: American Psychological Association.
67
Cattell, R.B. (1966). The scree test for the number of factors. Multivariate Behavioral
Research, 1, 245-276.
Chacko, H.E. (1986, November). An example of the use of canonical correlation analysis.
Paper presented at the Annual Meeting of the Mid-South Educational Research
Association, Memphis, TN.
Chapman, B.P., Duberstein, P.R., Sorensen, S., & Lyness, J.M. (2007). Gender differences
in Five Factor Model personality traits in an elderly cohort. Personality and Individual
Differences, 43, 1594-1603.
Chartrand, J.M., Borgen, F.H., Betz, N.E., & Donnay, D. (2002). Using the Strong Interest
Inventory and the Skills Confidence Inventory to explain career goals. Journal of Career
Assessment, 10, 169-189.
Cohen, J. (1988). Statistical power analysis for the behavioral sciences (2nd ed.). Hillsdale,
NJ: Erlbaum.
Cohen, J., Cohen, P., West, S.G., & Aiken, L.S. (2003). Applied multiple
regression/correlation analysis for the behavioral sciences (3rd ed.). Hillsdale, NJ: LEA.
Costa, P.T., Jr., & McCrae, R.R. (1992). Revised NEO Personality Inventory (NEO-PI-R)
and NEO Five Factor Inventory (NEO-FFI) professional manual. Odessa, FL:
Psychological Assessment Resources.
Costa, P.T., Jr., & McCrae, R.R. (1997). Set like plaster? Evidence for the stability of adult
personality. In T.F. Heatherton & J.L. Weinberger (Eds.). Can personality change (pp.
21-41). Washington DC: American Psychological Association.
68
Craig, R.J. (2005). Personality-guided forensic psychology. In R. Craig (Ed.) Personality-
guided psychology (pp. 39-53). Washington, DC: American Psychological Association.
Crouter, A.C., Lanza, S.T., Pirretti, A., Goodman, W.B., & Neebe, E. (2006). The O*NET
jobs classification system: A primer for family researchers. Family Relations, 55, 461-
472.
Davis, C. & Cowles, M. (1989). Automated psychological testing: Method of
administration, need for approval, and measures of anxiety. Educational and
Psychological Measurement, 49, 311-320.
Durrett, C. & Trull, T.J. (2005). An evaluation of evaluative personality terms: A
comparison of the Big Seven and Five-Factor Model in predicting psychopathology.
Psychological Assessment, 17, 359-368
Eggerth, D.E., Bowles, S.M., Tunick, R.H., & Andrew, M.E. (2005). Convergent validity of
O*NET Holland code classification. Journal of Career Assessment, 13, 150-168.
Farh, J., Leong, F.T.L., & Law, K.S. (1998). Cross-cultural validity of Holland’s model in
Hong Kong. Journal of Vocational Behavior, 52, 425-440.
Gignac, G.E. (2009). Partial confirmatory factor analysis: Described and illustrated on the
NEO-PI-R. Journal of Personality Assessment, 91, 40-47.
Gupta, S., Tracey, T.J.G., & Gore, P. (2008). Structural examination of RIASEC scales in
high school students: Variation across ethnicity and method. Journal of Vocational
Behavior, 72, 1-13.
Hackett, G., & Betz, N.E. (1981). A self-efficacy approach to career development of
women. Journal of Vocational Behavior, 18, 326-339.
69
Hartman, R.O., & Betz, N.E. (2007). The Five-Factor Model and career self-efficacy:
General and domain-specific relationships. Journal of Career Assessment, 15, 145-161.
Holland, J.L. (1959). A theory of vocational choice. Journal of Counseling Psychology, 6,
35-45.
Holland, J.L. (1997). Making vocational choices: A theory of vocational personalities and
work environments (3rd ed.), Englewood Cliffs, NJ: Prentice-Hall.
Hunthausen, J.M., Truxillo, D.M., Bauer, T.N., & Hammer, L.B. (2003). A field study of
frame-of-reference effects on personality test validity. Journal of Applied Psychology,
88, 545-551.
Judge, T.A. & Bono, J.E. (2001). Relationship of core self-evaluation traits – self-esteem,
generalized self-efficacy, locus of control, and emotional stability – with job satisfaction
and job performance: A meta-analysis. Journal of Applied Psychology, 86, 80-92.
Judge, T.A. & Hurst, C. (2008). How the rich (and happy) get richer (and happier):
Relationship of core self-evaluations to trajectories in attaining work success. Journal of
Applied Psychology, 93, 849-863.
Judge, T.A., Locke, E.A., & Durham, C.C. (1997). The dispositional causes of job
satisfaction: A core evaluations approach. Research in Organizational Behavior, 19,
151-188.
Judge, T.A., Locke, E.A., Durham, C.C., & Kluger, A.N. (1998). Dispositional effects on
job and life satisfaction: The role of core evaluations. Journal of Applied Psychology,
83, 17-34.
70
Kacmar, K.M., Collins, B.J., Harris, K.J., & Judge, T.A. (2009). Core self-evaluations and
job performance: The role of perceived work environment. Journal of Applied
Psychology, 94, 1572-1580.
Kaiser, H.F. (1960). The application of electronic computers to factor analysis. Educational
and Psychological Measurement, 20, 141-151.
Larson, L.M., & Borgen, F.H. (2006). Do personality traits contribute to vocational self-
efficacy? Journal of Career Assessment, 14, 295-311.
Larson, L.M., Wei, M., Wu, T., Borgen, F.H., & Bailey, D.C. (2007). Discriminating among
educational majors and career aspirations in Taiwanese undergraduates: The contribution
of personality and self-efficacy. Journal of Counseling Psychology, 54, 395-408.
Laverdiere, O., Gamache, D., Diguer, L., Hebert, E., Larochelle, S., & Descoteaux, J.
(2007). Personality organization, Five-Factor Model and mental health. The Journal of
Nervous and Mental Disease, 195, 819-829.
Lent, R.W., Brown, S.D., & Hackett, G. (1994). Toward a unifying social cognitive theory
of career and academic interest, choice, and performance. Journal of Vocational
Behavior, 45, 79-122.
Lievens, F., De Corte, W., & Schollaert, E. (2008). A closer look at the frame-of-reference
effect in personality scale scores and validity. Journal of Applied Psychology, 93, 268-
279.
Luszczynska, A., Scholz, U., & Schwarzer, R. (2005). General self-efficacy scale:
Multicultural validation studies. The Journal of Psychology, 139, 439-457.
71
MacCallum, R.C., Widaman, K.F., Zhang, S., & Hong, S. (1999). Sample size in factor
analysis. Psychological Methods, 4, 84-99.
McCrae, R.R. & Costa, P.T. Jr. (1995). Positive and negative valence within the Five Factor
Model. Journal of Research in Personality, 29, 443-460.
Merten, T. & Siebert, K. (1997). A comparison of computerized and conventional
administration of the EPQ-R and the CRS: Further data on the Merten and Ruch (1996)
study. Personality and Individual Differences, 22, 283-286.
Millon, T., Davis, R., Millon, C., & Grossman, S. (2009). The Millon Clinical Multiaxial
Inventory-III (2009) with new norms and updated scoring. Retrieved April 16, 2010,
from Theodore Millon’s website: http://www.millon.net.
Mount, M.K., Barrick, M.R., Scullen, S.M., & Rounds, J. (2005). Higher-order dimensions
of the Big Five personality traits and the Big Six vocational interest types. Personnel
Psychology, 58, 447-478.
Pearson, Inc. (2007). HWPI: Evidence of reliability and validity [Technical Report].
Pearson, Inc, New York, NY.
Rogers, M.E., Creed, P.A., & Glendon, A.I. (2008). The role of personality in adolescent
career planning and exploration: A social cognitive perspective. Journal of Vocational
Behavior, 73, 132-142.
Rottinghaus, P.J., Betz, N.E., & Borgen, F.H. (2003). Validity of parallel measures of
vocational interests and confidence. Journal of Career Assessment, 11, 355-378.
Sanz, J., Gil, F., Garcia-Vera, M., & Barrasa, A. (2008). Needs and cognitions/behavior
patterns at work and the Big Five: An assessment of the Personality and Preference
72
Inventory – Normative (PAPI-N) from the perspective of the Five-Factor Model.
International Journal of Selection and Assessment, 16, 46-58.
Schmit, M.J. & Ryan, A.M. (1993). The Big Five in personnel selection: Factor structure in
applicant and non-applicant populations. Journal of Applied Psychology, 78, 966-974.
Schmit, M.J., Ryan, A.M., Stierwalt, S.L., & Powell, A.B. (1995). Frame-of-reference
effects on personality scale scores and criterion-related validity. Journal of Applied
Psychology, 80, 607-620.
Scholz, U., Gutierrez, B.D., Shonali, S., & Schwarzer, R. (2002). Is general self-efficacy a
universal construct? European Journal of Psychological Assessment, 18, 242-251.
Simms, L.J. (2007). The Big Seven Model of personality and its relevance to personality
pathology. Journal of Personality, 75, 65-94.
Smith, D.B., Hanges, P.J., & Dickson, M.W. (2001). Personnel selection and the Five-Factor
Model: Reexamining the effects of applicant’s frame-of-reference. Journal of Applied
Psychology, 86, 304-315.
Strack, S., & Lorr, M. (1997). The challenge of differentiating normal and disordered
personalities. Journal of Personality Disorders, 11, 105-122.
Tabachnick, B.G., Fidell, L.S. (2007). Canonical correlation. In S. Hartman (Ed.), Using
multivariate statistics (pp. 567-606). Boston, MA: Pearson Education, Inc.
Tokar, D.M., Fischer, A.R., & Subich, L.M. (1998). Personality and vocational behavior: A
selective review of the literature, 1993-1997. Journal of Vocational Behavior, 53, 115-
153.
73
U.S. Census Bureau. (2010, February 23). State and county Quickfacts: USA. Retrieved
April 20, 2010, from http://quickfacts.census.gov.
74
VITA
Name: Lauren Michel Orozco
Address: Department of Educational Psychology
College of Education
Texas A&M University
4225 TAMU
College Station, TX 77843-4225
Email Address: [email protected]
Education: Ph.D., Counseling Psychology, Texas A&M University, 2010
M.S., Counseling Psychology, Texas A&M University, 2007
B.A., Psychology, Texas A&M University, 2005
APA Accredited Pre-doctoral Internship:
VA Puget Sound Health Care System – American Lake Division