An empirical analysis of Pakistan’s bilateral trade and ... · economic consequences of the...
18
ECONOMIC METHODOLOGY | RESEARCH ARTICLE An empirical analysis of Pakistan’s bilateral trade and trade potential with China: A gravity model approach Muhammad Saqib Irshad 1 *, Qi Xin 2 , Zhang Hui 3 and Hamza Arshad 1 Abstract: The decades-long history of friendly relationship in both countries bore the fruits in the form of Pakistan–China free-trade agreement (PCFTA) in 2006. This paper aims to estimate Pakistan’s bilateral trade potential with China by employing gravity model of trade in a panel data set covering the period 1992–2015. In an attempt to obtain unbiased results we have utilized various estimation methods as suggested by the recent empirical literature on gravity equation to acquire the maximum variation in results. The results from EGLS, REM, two-stage EGLS, GMM, Tobit and PPML have shown that Pakistan’ bilateral trade with all FTA partner countries is positively affected by GDPs, religion, WTO, trade openness in both countries and the common border; whereas negatively affected by geographical distance and inflation. It is also stated that common language and (Trade Agreements) PTA found to be pessimistically exaggerated bilateral trade of Pakistan with FTA partners. The overall PTA effect is negative and highly significant albeit we have found immense trade potential of Pakistan in case of China by most of the estimation techniques. The industry of Pakistan and exporters should adopt new measures to boost and diversify the exports to China and to bring about a reasonable equality in mutual trading relations. Muhammad Saqib Irshad ABOUT THE AUTHORS Muhammad Saqib Irshad is a Pakistani national, He earned PhD from Tianjin University of Finance and Economics in major International Economics and Trade. His research mainly focused on Asia’s foreign trade, China’s Belt and Road initiative and China-Pakistan economic corridor & various Macroeconomics fields. He earned Master degree also from China, Northeast Normal University in major International Trade. Prof. Qi Xin is the head of department of international education in Tianjin University of Finance and Economics. Her primary research fields include International trade and economics and Intellectual property rights. Mr Zhang Hui earned his master’s degree in Arts from the foreign language department, Tianjin University of Finance and Economics and planning to pursue PhD in the major of International Economics & Trade. Hamza Arshad is a Pakistani national, doing master in Tianjin University of Finance and Economics in major International trade. PUBLIC INTEREST STATEMENT The continuing trend of globalization has made International trade one of the most extensively researched topics in the economic literature. This study examines the Pakistan’s bilateral trade with countries who established the trade agree- ments to enhance their trade internationally. The world has been continuously transforming in many ways since Pakistan and China established diplomatic relationship 65 years ago. However, in our relations, nothing has changed in terms of mutual understanding and cordiality. Pakistan signed trade agreement with China in 2006, since then Pakistan attempts to enhance their exports to China. We have proved from our gravity estimation by using multiple estimation techniques that both nations have potential to expand their trade. Besides, the findings suggest that Pakistan has weak supporting industries so he has heavily relied on imports for his exports. Pakistan should move towards increasing the export of agricultural, textile and manufactured goods and diversified its exports to China to manipulate his trade balance. Irshad et al., Cogent Economics & Finance (2018), 6: 1504409 https://doi.org/10.1080/23322039.2018.1504409 © 2018 The Author(s). This open access article is distributed under a Creative Commons Attribution (CC-BY) 4.0 license. Received: 24 February 2018 Accepted: 20 July 2018 First Published: 30 July 2018 *Corresponding author: Muhammad Saqib Irshad, School of Economics, Tianjin University of Finance and Economics, Zhujiang Road, No.25, Hexi Dist, 300222 Tianjin, China E-mail: mohd_saqib_malik@hotmail. com Reviewing editor: Duncan Watson, Economics, University of East Anglia, United Kingdom Additional information is available at the end of the article Page 1 of 18
Transcript of An empirical analysis of Pakistan’s bilateral trade and ... · economic consequences of the...

ECONOMIC METHODOLOGY | RESEARCH ARTICLE
An empirical analysis of Pakistan’s bilateral tradeand trade potential with China: A gravity modelapproachMuhammad Saqib Irshad1*, Qi Xin2, Zhang Hui3 and Hamza Arshad1
Abstract: The decades-long history of friendly relationship in both countries bore thefruits in the form of Pakistan–China free-trade agreement (PCFTA) in 2006. This paperaims to estimate Pakistan’s bilateral trade potential with China by employing gravitymodel of trade in a panel data set covering the period 1992–2015. In an attempt toobtain unbiased results we have utilized various estimation methods as suggested bythe recent empirical literature on gravity equation to acquire themaximum variation inresults. The results from EGLS, REM, two-stage EGLS, GMM, Tobit and PPML have shownthat Pakistan’ bilateral trade with all FTA partner countries is positively affected byGDPs, religion, WTO, trade openness in both countries and the common border;whereas negatively affected by geographical distance and inflation. It is also statedthat common language and (Trade Agreements) PTA found to be pessimisticallyexaggerated bilateral trade of Pakistan with FTA partners. The overall PTA effect isnegative and highly significant albeit we have found immense trade potential ofPakistan in case of China bymost of the estimation techniques. The industry of Pakistanand exporters should adopt new measures to boost and diversify the exports to Chinaand to bring about a reasonable equality in mutual trading relations.
Muhammad Saqib Irshad
ABOUT THE AUTHORSMuhammad Saqib Irshad is a Pakistani national,He earned PhD from Tianjin University of Financeand Economics in major International Economicsand Trade. His research mainly focused on Asia’sforeign trade, China’s Belt and Road initiativeand China-Pakistan economic corridor & variousMacroeconomics fields. He earned Master degreealso from China, Northeast Normal University inmajor International Trade.
Prof. Qi Xin is the head of department ofinternational education in Tianjin University ofFinance and Economics. Her primary researchfields include International trade and economicsand Intellectual property rights.
Mr Zhang Hui earned his master’s degree inArts from the foreign language department,Tianjin University of Finance and Economics andplanning to pursue PhD in the major ofInternational Economics & Trade.
Hamza Arshad is a Pakistani national, doingmaster in Tianjin University of Finance andEconomics in major International trade.
PUBLIC INTEREST STATEMENTThe continuing trend of globalization has madeInternational trade one of the most extensivelyresearched topics in the economic literature. Thisstudy examines the Pakistan’s bilateral tradewith countries who established the trade agree-ments to enhance their trade internationally. Theworld has been continuously transforming inmany ways since Pakistan and China establisheddiplomatic relationship 65 years ago. However, inour relations, nothing has changed in terms ofmutual understanding and cordiality. Pakistansigned trade agreement with China in 2006,since then Pakistan attempts to enhance theirexports to China. We have proved from ourgravity estimation by using multiple estimationtechniques that both nations have potential toexpand their trade. Besides, the findings suggestthat Pakistan has weak supporting industries sohe has heavily relied on imports for his exports.Pakistan should move towards increasing theexport of agricultural, textile and manufacturedgoods and diversified its exports to China tomanipulate his trade balance.
Irshad et al., Cogent Economics & Finance (2018), 6: 1504409https://doi.org/10.1080/23322039.2018.1504409
© 2018 The Author(s). This open access article is distributed under a Creative CommonsAttribution (CC-BY) 4.0 license.
Received: 24 February 2018Accepted: 20 July 2018First Published: 30 July 2018
*Corresponding author: MuhammadSaqib Irshad, School of Economics,Tianjin University of Finance andEconomics, Zhujiang Road, No.25, HexiDist, 300222 Tianjin, ChinaE-mail: [email protected]
Reviewing editor:Duncan Watson, Economics,University of East Anglia, UnitedKingdom
Additional information is available atthe end of the article
Page 1 of 18

Subjects: Macroeconomics; Econometrics; International Economics; DevelopmentEconomics
Keywords: PCFTA; gravity model; panel data; trade potential; China; Pakistan
1. IntroductionInternational Trade relations among nations are becoming increasingly important in a rapidlychanging world, and foreign affairs and global issues among states have become more obviouswithin the international system. International Trade established its own identity in the globalworld. All the way through human history, people acquired knowledge from their environmentand get influenced by immediate nations. The nation learned and developed their lives by theacquisition of skills and mode of life that suits them. Even at present, this process has notcongested. Different nations that have dissimilar demographics and history adopt and gainknowledge from each other. The cultural diversity between countries has its consequence ontrade in a complex way. Furthermore, trade among nations has its special effects on culture.Correspondingly, there is a high possibility that nations with common cultural attributes mighttrade more. Although trade is built on comparative advantage, subsequently with diverseculture, higher trading may be possible (Cyrus, 2011). The benefits from trade could differfrom country to country based on its national welfare, economic, political, regional andstrategic state of affairs. Countries tend to agree upon mutual free-trade agreement whenmultilateral liberalization is unattainable. The more free-trade could facilitate to boost innational welfare.
The politics of modern world is changing every day and all developing countries look for newmarkets to survive in all situations (Irshad & Xin, 2014). Keeping above objective in mind, Pakistanlike other nations is also altering its direction of policies towards growing efforts to grasp gains fromtrade through plurilateral and bilateral agreements. Bilateral relations seek mutually advantageousarrangements with the goal of reducing tariffs and eliminating non-tariff barriers (NTBs). Appendix A1in appendix demonstrates the recent trade agreements of Pakistan with other regional blocs andnations in the world, especially immediate neighbours particularly China. The Islamic Republic ofPakistan and the People’s Republic of China have adored long-lasting and friendly ties—regardlessof their ideological differences, evident in their very names (Irshad, Xin, & Arshad, 2015). Pakistan andChina are both members of World Trade Organization (WTO) and in accordance with Article XXIV ofGeneral Agreement on Tariffs and Trade (GATT), WTO members are allowed to enter into bilateral orregional agreements provided they cover a large number of bilateral trade flows and they do not havenet trade diversion effect. Both the nations have dissimilar economic structures and constructedaccordingly. According to WTO policy review, China continues to expand its bilateral and regionalfree-trade agreements (Xin, Irshad, & Hao, 2014).
Rising trend in globalization and new realities that are emerging on the international horizon isalso pushing Pakistan to reassert its position in East Asia and chase for a pro-active policy towardsChina (Irshad, Xin, Xuan, & Arshad, 2016). Pakistan has recently witnessed a significant increase inexports as a result of rapid improvement in the international trading environment. During 2015,Pakistan’s exports remained at US$ 25.5 billion which is 9.44% of gross domestic product (GDP),while import remained at US$ 44 billion which is 16.29% of GDP in the same year. Similarly,Pakistan imports share with China in the year 2015 account US$ 11.08 billion which is 25.18% oftotal imports, while Pakistan’s share of exports to China accounts US$ 1.93 billion which is 7.56% oftotal exports of Pakistan to the world in the same year (Irshad & Xin, 2015a). Trade policy inPakistan has a significant role in growing or lessening overall exports of Pakistan. Pakistan’seconomy has depended on the agricultural sector in the premature stages of development,because of lacking in industrial base and infrastructural capability in the early stage of develop-ment (Irshad & Xin, 2017a). Table 1 reveals the values of Pakistan’s overall imports and exportswith the world and specifically with China.
Irshad et al., Cogent Economics & Finance (2018), 6: 1504409https://doi.org/10.1080/23322039.2018.1504409
Page 2 of 18

After signing FTA, both countries experienced an upward trend in bilateral trade which resultedin rapid increase of imports US$ 11 billion in 2015 which is calculated 278% growth rate comparedto US$ 2.91 billion in 2006. China has obtained substantial advantage after signing the FTA withPakistan. China has established win-win relationships in its targeted market by providing commonbenefits to its counterparts (Irshad & Xin, 2015b). Pakistan exports to China recorded slow growthrate compared to imports from China. Both countries should restudy the tariff elimination pro-cesses and reduce the tariff on maximum goods traded between them. Such as, FTA betweenChina and South Korea will officially come into force starting 20 December 2015. Under the deal,both countries eliminated the tariff on more than 90% of highly traded goods within 20 years afterthe implementation (Hua Xia, 2015). That is what Pakistan seeks from China; an elimination oftariff should be on highly traded goods not at the limited goods. Keeping the above intention inmind, current study endeavours to expose the most imperative and the key influential factors ofPakistan’s bilateral trade with China. Trade literature studies confirm that bilateral trades betweennations are affected by several factors and variables. These factors range from income to the levelof development of countries, the general distinctiveness of a population such as common lan-guage, common history or religion to shared border. In this paper, we will use the gravity model oftrade to check the influence of Pakistan’s bilateral trade with China and will estimate the tradepotential for Pakistan in the Chinese market. Economic hypothesis and empirical evidence have
Table 1. Pakistan total imports and exports to world and China (million US$)
Year Pak exportto China
PakimportfromChina
Pakexport toWorld
PakimportfromWorld
Totaltradedeficit
(%) PakimportshareChina
(%) Pakexportshare inChina
1992 540 420 7,351 9,423 −2,072 4.46 7.35
1993 599 436 6,720 9,545 −2,825 4.57 8.91
1994 340 475 7,400 8,931 −1,531 5.32 4.59
1995 121 515 8,029 11,515 −3,486 4.47 1.51
1996 118 574 9,365 12,189 −2,824 4.71 1.26
1997 158 584 8,758 11,650 −2,892 5.01 1.80
1998 422 154 8,514 9,333 −819 1.65 4.96
1999 446 180 8,424 10,207 −1,783 1.76 5.29
2000 550 244 9,028 10,864 −1,836 2.25 6.09
2001 487 289 9,238 10,191 −953 2.84 5.27
2002 698 236 9,913 11,233 −1,320 2.10 7.04
2003 259 957.33 11,930 13,038 −1,108 7.34 2.17
2004 300 1,488.8 13,379 17,949 −4,570 8.29 2.24
2005 435 2,349.4 16,051 25,357 −9,306 9.27 2.71
2006 506 2,914.9 16,930 29,825 −12,895 9.77 2.99
2007 613 4,164.3 17,829 32,590 −14,761 12.78 3.44
2008 726 4,738 20,323 42,329 −22,006 11.19 3.57
2009 997 3,780 17,523 31,668 −14,145 11.94 5.69
2010 1,435 5,247.7 21,410 37,807 −16,397 13.88 6.70
2011 1,678 6,470.6 25,383 44,012 −18,629 14.70 6.61
2012 2,619 6,687.6 24,567 44,105 −19,538 15.16 10.66
2013 2,652 6,626.3 25,121 44,647 −19,526 14.84 10.56
2014 2,252 9,588.4 24,706 47,434 −22,728 20.21 9.12
2015 1,934 11,079 22,188 44,219 −22,031 25.05 8.72
Source: Author’s own calculation based on UN COMTRADE statistics.
Irshad et al., Cogent Economics & Finance (2018), 6: 1504409https://doi.org/10.1080/23322039.2018.1504409
Page 3 of 18

obviously established the relations between trade, productivity and economic development.Countries that have bulky internal markets have also gained from desegregation into the globaleconomy and opening up their economies (Irshad, Xin, Hao, & Arshad, 2017; Irshad et al., 2018).Gravity model has become the most important tool in international trade analysis over the years.Other “flagship” trade theories are useful for determining the ground of export/imports perfor-mances. However, it is gravity that enables to determine and predict actual trade flows oreconomic consequences of the establishments of preferential trade agreements Brodzicki, Ciołek,and Śledziewska (2017). In this article we have attempted to examine Pakistan’s bilateral tradewith only considering FTA countries of Pakistan and to get trade potentials only for China through agravity model approach by multiple estimation techniques suggested by previous literature.Therefore, this study leads to make new research results for scholars and policymakers.
Its remainder proceeds as follows. Section 2 briefly explained the literature related to our studyand on gravity model theoretical and empirical approach. The model specification, data sourcesand methodological aspects are introduced in Section 3. While Section 4 reports and discussesestimation results from gravity model by using various estimation techniques and the potentialsfor Pakistan and China future trade. Finally, Section 5 concludes with policy implications.
2. Literature review and gravity modelToday’s world in the epoch of globalization seeing as the beginning of the third millennium becauseeconomies started out to be integrated since then in terms of goods, traditions, trade, investments andvarious others factors (Irshad et al., 2016). Before starting off with the gravity model, it might be a goodinitiative to elucidate the dissimilar trade flow modelling techniques existing and why gravity model isthe alternative for this meticulous research work. Trade flow modelling has been broadly exploredthroughout the past three-four decades using two techniques, simulation models and econometricmodels (Jong, Hugh, Warren, & Jenny, 2002; World Bank, 2005). The major fundamental dissimilaritybetween both models is (a) simulation models intend to study and analyse the trade flows and itsimpact, while (b) econometric models endeavour to formulate future forecasts anchored in past tradeflow patterns. Similarly, econometric approaches for modelling trade flows have focused on the gravitymodel pattern because of the robust performance of themodel and the inadequate need for parameterassumptions. Therefore, the plenteous literature on gravity models and their application in trade flowshave materialized during the last decade and for the similar reasons of robustness and simplicity, thisarticle exploits the gravity model of trade. The gravity model is derived from Newton’s Law of UniversalGravitation which states that the gravitational attraction between two objects is directly proportional totheir masses and is inversely proportional to the square of their distance. Moreover, plentiful researchersendowed with the theoretical justifications by estimating the model with diverse sets of variables andconditions. For instance, Linnemann’s (1966) presented partial equilibriummodel of export and import,and added an additional variable to the model to reflect the trade flow composition, is a traditionalapplication of the gravity model. After that, Leamer (1974) customized the model with additionalvariables to determine the impact of income and population. Another research by Anderson (1979)derived the model by applying utility functions and product differentiation. In a series of papers,Bergstrand (1985, 1989, 1990) has formed several attempts so as to explore the theoretical determina-tion of trade by utilizing Constant Elasticity of Substitution (CES) and monopolistic competition models.Helpman and Krugman (1985) derived the gravity model under the assumption of increasing returns toscale in production. Deardorff’s (1998) research proved that gravity model is consistent with Hecksher-Ohlin trade theory. Whereas Anderson and van Wincoop (2001) provided an understanding of howborder barriers affect trade. Baier et al. (2002) explained the endogeneity of international trade flowsand free-trade agreements by employing gravity approach. Evenett and Keller (2002) theoreticallyexplained the success of gravity equation and they have proved that gravity is the best approach tomodelling trade-related flows. In another study, Martinez-Zarzaso (2003) evaluated the effects ofpreferential agreements on the bilateral trade flows among 47 countries in several economic blocsand areas during 1980–1999. Papazoglou (2007a) endeavored to discover potential trade flows forGreece to the EU member states by employing a gravity model. In his conclusion, he stated that actualexports of Greece fall short of potential ones, while the opposite is true for Greek imports. Xuegang,
Irshad et al., Cogent Economics & Finance (2018), 6: 1504409https://doi.org/10.1080/23322039.2018.1504409
Page 4 of 18

Zhaoping, and Xuling (2008) used the three explanatory variables GDP, GDP per capita and ShanghaiCooperation Organization (SCO) to construct a gravitymodel for Xinjiang’s bilateral trade. Their outcomeillustrated that all the three variables distress the Xinjiang’s bilateral trade. The dissimilarities in abovemention theories are facilitated to explain the various diversities in the outcome of the empiricalapplications. In a nutshell, in last 50 years, numerous attempts have been put in the empirical analysisof international trade to enlighten bilateral trade through the gravity model of trade (Disdier & Head,2003; Kepaptsoglou, Karlaftis, & Tsamboulas, 2010). Irshad et al. (2018) also applied gravity model toestimate China’s trade pattern with OPEC member countries over the period 1990–2016. They havefound that China’s bilateral trade with OPEC members positively impacts GDP, income (GDP per capita),trade openness in China and the WTO member countries in OPEC while the negative influence ondistance. A multitude of empirical applications of the gravity model exists in the literature of bilateraltrade, which has contributed to the perfection of performance in the gravity equation.
A simple baseline gravity model which can be written as an equation:
BTij ¼ CðYiYjÞβTCγijεij; (1)
where BTij refers to the total trade volume between country i and country j, Yi and Yj are the grossdomestic products of the countries i and j, TCij taken as the trade cost, a proxy variable for the
geographical distance between both countries, whereas εij is the stochastic error term and C, β and
γ are the coefficients to be derived empirically. The above equation is transformed into log-linearform so that it conforms to the usual regression analysis and can be written as Equation (2):
LnðBTijÞ ¼ þβLnðYiYjÞ þ γLnðTCijÞ þ εij (2)
Equation (2) is the traditional gravity model and once estimated provides with comparatively goodresults. On the other hand, the actual world situation is not so easy to be represented by such afew factors. In addition to the habitual variables of GDP and distance, researches in this particularfield have often employed other factors like GDP per capita (Bun & Klaassen, 2007; Kang &Fratianni, 2006), population (Elliott, 2007; Tzouvelekas, 2007; Papazoglou 2007b), exchange rates(Kandogan, 2005; Tang, 2005; Thorpe & Zhang, 2005), geographic size (Kucera & Sarna, 2006;Soloaga & Winters, 2001), infrastructure (Carrere, 2006; Martinez et al., 2005), common countrycharacteristics like language, border, currency unions, signatories to bilateral trade agreements(Grant & Lambert, 2008; Irshad & Xin, 2017a; Melitz, 2007), etc., to efficiently identify the mostimperative factors distressing the bilateral trade between countries.
3. The model, sample and data size
3.1. The modelAt first, this studywill establish a gravitymodel of bilateral trade for Pakistan. Then, the estimatedmodelwill be used to forecast the potential trade between Pakistan and China. The gravity model of bilateraltrade in our case is that trade between Pakistan being country (i) and FTA country (j) is a function of theirparticular GDPs, and the geographic remoteness between the trading partners and hence can bewritten as:
LnðBTijtÞ ¼ πo þ π1Ln GDPit:GDPjt� �þ π2LnðTCijtÞ þ εijt (3)
After reviewing previous researchers and detailed approaching hooked on the trade patterns ofPakistan with FTA countries and especially to take into consideration current study requirementsPakistan’s bilateral trade with China (before and after) signing FTA, the following set of variablesare taken into consideration. Equation (3) then becomes:
LnðBTijtÞ ¼ βo þ β1Ln GDPit:GDPjt� �þ β2LnðTCijtÞ þ β3Ln INFit:INFjt
� �þ β4TOPit þ β5TOPjtþ β6Relgijt þ β7Langijt þ β8Bordijt þ β9WTOijt þ β10PTAijt þ εijt
(4)
Irshad et al., Cogent Economics & Finance (2018), 6: 1504409https://doi.org/10.1080/23322039.2018.1504409
Page 5 of 18

where LnðBTijtÞ represents natural log of bilateral trade volume between countries i and j in a particular
year t, Ln GDPit:GDPjt� �
is the natural log of product of GDPs of the Pakistan and its trade partner in year t.
The Ln INFit:INFjt� �
is natural log of Inflation in Pakistan and its trading partner country in year t. TOPit and
TOPjt trade openness in Pakistan and partner country in year t respectively. Relgijt is a religion, a dummy
variable, given a value of 1 if a country’s national religion or more than 80% of the population of thatcountry follows the same religion as the partner country or 0 otherwise. Meanwhile, Langijt stands for
common language also a dummy given a value 1 if both countries speak same language. Where, BorijtBorder, dummy variable, which is given a value of 1 if countries i and j shares a commonborder or a valueof 0 otherwise. WTOijt is a dummy, with a value of 1 if the country i and country j are members of the
World Trade Organization in year t or 0 otherwise. PTAijt also a dummy variable, if country i and country j
having trade agreement in particular year t then given a value of 1 otherwise 0.
The justification for the inclusion of GDP and trade cost variables in the equation is clearlymanifested being these parts of the standard gravity model specification. Whereas GDP of Pakistanand its trading partner in time t are used as a measure of economic size. This variable is expectedto be positive and significantly related to trade. Trade cost variable is used in the analysis as aproxy for transportation cost between Pakistan and the trading partners. This variable is expectedto have a negative effect to trade as transport cost increases with the distance between countries.The rest of the variables are explained as follows.
To check the effect of inflation at the bilateral trade of Pakistan with her trading partner we haveemployed inflation as a proxy for GDP deflator in our model. Inflation, as measured by the yearlygrowth rate of the GDP implicit deflator, demonstrates the rate of price change in the economy asa whole. The GDP implicit deflator is the ratio of GDP in current local currency to GDP in constantlocal currency. We are expecting the negative sign of the inflation.
The more open a country, the greater its involvement in the trade. The proportion of customs-to-total tax revenues or the trade-GDP ratio can be used as proxies for openness. However, the latterproxy is often professed for obvious reasons. Hence, we also use this variable as a proxy foropenness, first and foremost because data is available for the countries concerned.
Wehave employed four dummyvariables in our regression such as religion, border,WTO, PTA. Religionand language are cultural variables included in the estimation to understand their effects on the bilateraltrade flow of Pakistan with FTA countries. The hypothesis is that countries with the same culture tend totrademore and vice versa. Countries that share a commonborder are likely to have strong bilateral traderelations, and hence the variable is expected to have a positive effect on trade. Border variable has avalue of 1 if partner country shares a common border. The variable representing the membership ofcountries into the World Trade Organization, WTO, is included to find whether being part of thisorganization can have an effect on the bilateral trade between countries or not. This variable is expectedto be positive and significant. PTA is another dummy variable used to explain the trade pattern betweentwo countries. A value of 1 is given if country i and country j has a trade agreement or given a value of 0otherwise. PTA is expected to have positive and a significant effect on the trade.
3.2. Sample size and data sourceThe dataset is a balanced panel containing annual total merchandize trade volume (merchandizeimports+ merchandize exports), GDP, distance, Inflation, Trade openness, and dummies of Pakistanand 251 of its trading partners including China. We have selected those countries that have signeda free-trade agreement or any preferential trade agreement with Pakistan, some of the countrieshave one-to-one signed FTA or some are the part of regional trade agreement (see Appendix A1 inthe appendix). Data is collected for the time period ranging from 1992 to 2015 and total observa-tions are (24 × 25 = 600). Our analysis starts in 1992 because several trading partners’ transitiontook more time and there was no trade data available for the previous years. Table 2 demonstratesthe summary of variables that we have used in our model and the data sources from where we get
Irshad et al., Cogent Economics & Finance (2018), 6: 1504409https://doi.org/10.1080/23322039.2018.1504409
Page 6 of 18

data and make some manipulation to get fit into our model. For the descriptive statistics of thegravity equation used in this study is placed in Appendix A5.
4. Estimation results and discussion
4.1. Panel cross-section dependence (CD) testCross-section dependence in macro panel data has acknowledged loads of consideration in theemerging panel time series literature over the past decade. This kind of correlation possibly willoccur from worldwide common shocks with heterogeneous impact across countries, such as the oilcrises in the 1970s or the global financial crisis from 2007 onwards. Alternatively, it can be the result oflocal spillover effects between countries or regions (Eberhardt & Teal, 2011; Moscone & Tosetti, 2009).Before estimating gravity equation, CD test should be tested to observe whether the sample data arecross-sectionally dependent or independent. Otherwise, based on the assumptions (Breusch & Pagan,1980; Pesaran, 2004), the results of our gravity equation would be prejudiced and incompatible. Inaccordance with the time and cross sections in our gravity equation, Pesaran’s (2004) residual CD testis calculated anchored in the pairwise correlation coefficients cit in this fashion:
CD ¼ffiffiffiffiffiffiffiffiffiffiffiffiffiffiffiffiffiffiffi
2N N� 1ð Þ
s∑i¼1
N∑
j¼iþ1
N
ffiffiffiffiffiffiffiffiffiffiffiTij cit
q:
We calculated CD test only for time-variant variables in our gravity equation because of CD testunable to define in case of time-invariant variables (Esfahani & Rasoulinezhad, 2017; Irshad, Xin &Arshad, 2018). Based on the result of Pesaran’s (2004) CD test, shown in Table 3, the nullhypothesis (no CD in residuals) can be strongly rejected at the 5% level. It implies that all thepanel time series have strong evidence for cross-sectional dependence.
4.2. Gravity model estimationIn order to determine the CD test, we have endeavoured to apply diverse techniques founded inliterature and mostly found that our model accurately fits the gravity theory. The techniques we
Table 2. Demonstrates the variables, expected signs and data sources
Variable Value Sign Source
Bilateral trade volume USD thousands UN Comtrade Database/Pakistan Bureau of Statistics
Gross domestic product (GDP)Pakistan, partner
USD thousands + World DevelopmentIndicators (2016)
Distance (TC) Kilometer − CEPII andhttp://www.indo.com/distance/
InflationPakistan (i), partner (j)
Proxy (% of GDP deflator) − World DevelopmentIndicators (2016)
Trade openness(trade/GDP)Pakistan, partner
Ratio + UN Comtrade Database/Pakistan Bureau of Statistics,World DevelopmentIndicators (2016)
Religion (Dummy), (Islam) 0,1 + CIA (The World fact book)
Language (Dummy), (English) 0,1 + CIA (The World factbook)
Common border/adjacency(Dummy)
0,1 + World atlas websitehttp://www.worldatlas.com/
WTO (dummy) 0,1 + World Trade Organization
Preferential trade agreements(PTAs) dummy
0,1 + Asia Regional IntegrationCenterhttps://aric.adb.org/fta-country
Irshad et al., Cogent Economics & Finance (2018), 6: 1504409https://doi.org/10.1080/23322039.2018.1504409
Page 7 of 18

used to calculate Pakistan’s bilateral trade with FTA countries all appear with highly significanteffect. We have found that the results of different estimation techniques somehow comparablesuch as EGLS predict the similar results as GMM whereas two-stage EGLS appeared with the similarresults like Tobit and latterly REM and PPML results are different. We have estimated same modelwith six estimation techniques2 as suggested by recent literature to get maximum variations in ourgravity model. At first, we have used panel EGLS with cross-section weights and found that theR-squared 0.87 similar like GMM which is considered as good level and all variables are highlysignificant with expected signs except common language and regional trade agreements. Thismay be the interesting finding of this paper as the overall effect of FTA on Pakistan’s bilateral tradeis negative because the trade environment is not favourable to Pakistan and it mostly results in thetrade deficit. In case of joint GDP, the results reveal that a 1% increase in the joint GDP of Pakistanand FTA partner countries raises the bilateral trade volume by approximately 1.9%3 to 0.59%(maximum and minimum coefficient value we get) by using different estimation. It can be noticedthat REM, TEGLS and Tobit predict little lower increase rate compared to other techniques (seeTable 3). The distance used as a proxy for trade costs negatively effect on bilateral trade ofPakistan with FTA member counties longer the distance lessen the trade. 1% rise in distancedecreases the trade volume by 1.2% [= exp(0.15)] to 0.21%, maximum calculated by PPMLwhereas minimum by Tobit and TEGLS.
With regard to the inflation, among our estimations, this variable appears statistically significantand negative at the 1% level. The results show that by 1% increase in the inflation rate in Pakistan,FTA partner country will reduce the bilateral trade by 1.2–0.2% which means people will have moremoney to buy products. This raises demand, which raises the price of goods in a country whichresults in need of more money to buy the same product which was earlier bought at low price.
The findings of all the six methods provide the evidence of the strong positive impact on thetrade openness in Pakistan and FTA countries. A 1% increase in Pakistan’s trade openness levelraises the bilateral trade volume by 10.75% (maximum calculated by PPML and minimum EGLSand GMM) to 2.61%. Similarly, 1% increase trade openness in the FTA partner country raises thebilateral trade volume by 2–0.7%.4 The results of our model clarified that there is definite potentialin Pakistan and FTA partner countries to expand their bilateral trade. In case of common religion,Pakistan tends to trade more with them and our model results also bystander for the theory “thecourtiers have common religion tend to trade more”. Religion variable is highly significant andpositively influences bilateral trade of Pakistan with FTA partner countries which is calculated as1% increase in common religion countries leads bilateral trade by 1.18% [= exp(0.78) − 1] to 0.36%[= exp(0.31) − 1]. It is obvious because in our sample of 25 countries and 15 countries have acommon religion like Pakistan (Islam). Another phenomenon sharing the same language alsoboosts trade among partners but in our case, it shows a negative effect on Pakistan bilateraltrade with FTA partners because only seven countries have the same language as Pakistan officiallanguage is English and the trade ratio is larger with those counties whose language is not the
Table 3. Pesaran’s (2004) CD test
Variables Pesaran’s CD test Prob.
Bilateral trade volume 43.20 0.00
Product of GDPs 82.19 0.00
Inflation 39.48 0.00
T-opennessPakistan
84.85 0.00
T-opennesspartner
9.92 0.00
Source: Authors’ compilation from STATA 14.0.
Irshad et al., Cogent Economics & Finance (2018), 6: 1504409https://doi.org/10.1080/23322039.2018.1504409
Page 8 of 18

same. In our model, it is estimated as 1% increase in common language countries decreasesbilateral trade by 0.21–0.25%5 respectively.
Similarly, in case of the Common border, it is always a privilege to trade with neighbour countriesbecause many factors might have less impact such as trade cost and cultural influence. Our modelestimation also proved that Pakistan tends to trade more with neighbouring countries such as
Table 4. Results of gravity model (dependent variable: total trade of Pakistan with FTA partnercountry)
Independent variable EGLSa REM Two-stageEGLSa
GMMa,b Tobit PPMLc
Constant −19.93*** −14.06*** −17.62*** −19.93*** −17.62*** −12.45***
(0.655) (2.99) (0.96) (0.65) (1.13) (1.40)
Product of GDPs 0.83*** 0.59*** 0.77*** 0.83*** 0.77*** 0.65***
(0.013) (0.05) (0.02) (0.01) (0.02) (0.04)
Trade cost −0.2*** 0.25 −0.21*** −0.2*** −0.21** −0.15**
(0.056) (0.31) (0.08) (0.05) (0.08) (0.07)
Inflation −0.1** −0.1*** −0.19*** −0.07*** −0.19*** −0.20***
(0.029) (0.03) (0.06) (0.03) (0.04) (0.04)
T-openness Pakistan 2.61*** 2.93** 4.29** 2.61*** 4.29** 6.98**
(0.711) (1.25) (1.91) (0.71) (1.86) (1.42)
T-openness partner 1.01*** 0.70*** 0.79*** 1.01*** 0.79*** 0.70***
(0.115) (0.23) (0.18) (0.11) (0.21) (0.15)
Religion 0.78*** 0.55* 0.62*** 0.78*** 0.62*** 0.31***
(0.062) (0.60) (0.06) (0.06) (0.13) (0.11)
Language −0.22*** 0.21 −0.19*** −0.22*** −0.19 −0.20**
(0.057) (0.56) (0.06) (0.06) (0.12) (0.09)
Border 1.61*** 2.53*** 2.04*** 1.60*** 2.04*** 0.51***
(0.140) (0.77) (0.17) (0.14) (0.19) (0.15)
WTO 1.26*** 0.18* 1.16*** 1.26*** 1.16*** 0.01**
membership (0.122) (0.19) (0.11) (0.12) (0.17) (0.13)
Trade agreements −0.80*** −0.32** −0.80*** −0.8*** −0.81*** −0.05
(0.097) (0.14) (0.17) (0.10) (0.13) (0.13)
Diagnostic test
R-squared 0.87 0.43 0.72 0.87 – 0.88
SE of regression 1.31 0.87 1.38 1.31 1.38 –
F-statistic (Prob.) 389.623 43.67 154.35 – – –
(0.00)
Durbin-Watson 0.56 1.11 0.49 0.56 – –
Mean absolute error 1.06 0.55 1.08 1.06 1.08 –
Bias proportion 0.00 0.00 0.00 0.00 0.00 –
Variance proportion 0.08 0.03 0.08 0.08 0.08 –
Pseudo log-likelihood – – – – – −77,860,401
Source: Authors’ estimation.Notes: ***, **, and * indicate significant at 1%, 5% and 10% respectively.a White cross-section standard errors & covariance.b With Cross-section weights.c Dependent variable in level.
Irshad et al., Cogent Economics & Finance (2018), 6: 1504409https://doi.org/10.1080/23322039.2018.1504409
Page 9 of 18

Afghanistan, China, and Iran but with India, there are some political constraints. A 1% increase incommon border country enhances bilateral trade by 11.55% [= exp(2.53) − 1] to 0.67% [= exp(0.51) − 1]where the maximum coefficient estimated by REM and the minimum coefficient value by PPML. It iscommon that countries have WTO membership trading more with each other because they are some-how bound to reduce the tariff on trade. In our case, the coefficient of WTO membership is estimatedwith a maximum value at 2.53–0.01% respectively. This indicates that bilateral trade of Pakistanincreases by nearly 2.53% (by EGLS and GMM) when Pakistan trades with WTO member countries.
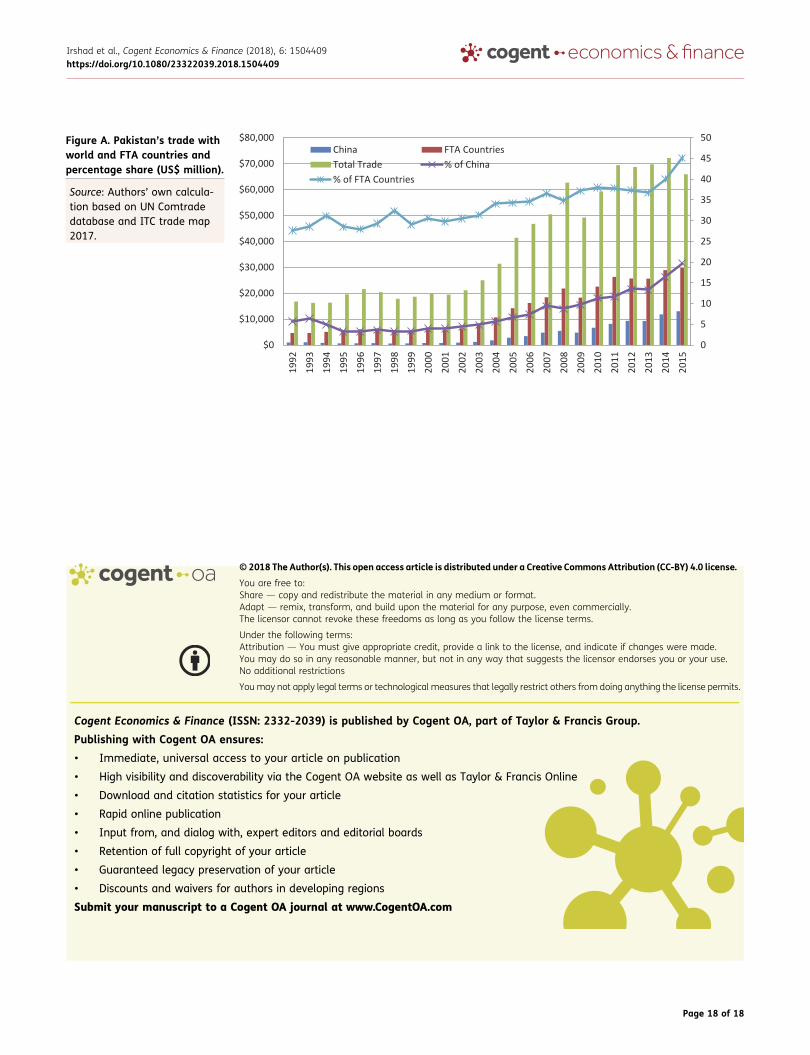
With regard to the trade agreements, surprisingly we have found a negative and highly sig-nificant effect on Pakistan bilateral trade with FTA countries which is strange because Pakistan’strade with countries who have already signed a trade agreement with Pakistan is under potentialand not fully utilized. Other researchers also find the negative or ambiguous effect of tradeagreements on trade (Robert et al., 2015). Figure A in the appendix shows that Pakistan’s tradewithin direction such as trade with China, FTA countries and total trade also with percentage share.Despite this, we have calculated that Pakistan has huge trade potential, particularly with China bymost of the estimation methods. China and Pakistan should make fruitful arrangements toenhance their mutual trade and to reduce trade barriers and also provide maximum marketaccess to each other.
The log-linear model is used to tackle the dilemma of heteroskedasticity and serial correlation inthe panel regression model. The value of the F-statistic shows the goodness of fit of the regressionmodel. The forecasting efficiency of the model is evaluated using Mean Abs. Error, Thiel InequalityCoefficient, and corresponding Bias and variance proportion. The outcome of diagnostic testsrecommends using the model for evaluation of trade potential of Pakistan, particularly for China.
4.3. Estimation of trade potentialsFinally, the estimation of Pakistan’s trade potential for China is calculated. The results obtainedfrom the gravity equation 4 are subject to evaluation of the forecasting efficiency. We haveestimated gravity model for Pakistan vis-à-vis 25 countries those who have already signed FTAwith Pakistan for a fairly long period (1992–2015) with total 600 observations. We do not have zerotrade in our sample. The calculation for estimating Pakistan’s trade potential for China is(ΔT ¼ Potential trade value� actual trade value). In other words, it represents the absolute differ-ence between the potential (predicted) and the actual level of trade (P − A) where a positive valueimplies the possibility of trade expansion in the future while a negative value shows that Pakistanhas exceeded its trade potential with China. Figure 1 shows the trade potential of Pakistan withChina for each technique we used to estimate our gravity model equation. Our results for most ofthe estimation techniques show that Pakistan has clear trade potential with China. After signingPakistan–China FTA trade figures between these two countries witnessed that higher trade valuesand for future is great opportunity for Pakistan to explore markets in China’s huge population. Eventhough, Pakistan gaining trade deficit whilst trading with China because of less export diversity andlack of expertise in exports competiveness of Pakistan. Pakistan exports to China have more thantripled from US$ 506 million in beginning of FTA year 2006 to US$ 1.9 billion in year 2015 but arestill far below the potential. Pakistan lacks a comprehensive country-specific strategy. The privatesector and all the ministries and state-run institutions need to coordinate their efforts to penetrateinto the Chinese markets. Pakistan continues to run a huge trade deficit with China. Whereas Chinahas moved to high value-added, high-tech exports Pakistan still exports low value-added items.There is need to step up production of globally competitive products and improve marketing skillsto create additional demand for exports. Pakistan should also focus on exporting some value-added raw materials to China like cotton yarn of higher counts and fabrics of better quality. A hugepotential exists there for exports of leather, chromium ore, copper and chemicals, surgical instru-ments, sport goods, light engineering products, finished granites, onyx and marbles, gem andjewellery, furniture, handicrafts, food items and fruits and vegetables. But as higher incomes havemade Chinese consumers quality-conscious, all exports must meet new standards.
Irshad et al., Cogent Economics & Finance (2018), 6: 1504409https://doi.org/10.1080/23322039.2018.1504409
Page 10 of 18

From the above graphs, we can see that only REM and PPML have shown that Pakistantrading potential with China is getting exhausted and other all estimation results clearlypredict the huge trade potential for Pakistan to expand its trade with China. Thestudy urges Pakistan to develop domestic supply potential and diversify its exports to poten-tial economies particularly China and Pakistan should talk with China to reducemore tariff barriers on Pakistan imports and provide extra market access to Pakistaniproducts.
-2
-1
0
1
2
19
92
19
93
19
94
19
95
19
96
19
97
19
98
19
99
20
00
20
01
20
02
20
03
20
04
20
05
20
06
20
07
20
08
20
09
20
10
20
11
20
12
20
13
20
14
20
15
EGLS
-1
-0.5
0
0.5
1
1.5
19
92
19
93
19
94
19
95
19
96
19
97
19
98
19
99
20
00
20
01
20
02
20
03
20
04
20
05
20
06
20
07
20
08
20
09
20
10
20
11
20
12
20
13
20
14
20
15
REM
-2
-1
0
1
2
3
19
92
19
93
19
94
19
95
19
96
19
97
19
98
19
99
20
00
20
01
20
02
20
03
20
04
20
05
20
06
20
07
20
08
20
09
20
10
20
11
20
12
20
13
20
14
20
15
Two-stage EGLS
-2
-1
0
1
2
19
92
19
93
19
94
19
95
19
96
19
97
19
98
19
99
20
00
20
01
20
02
20
03
20
04
20
05
20
06
20
07
20
08
20
09
20
10
20
11
20
12
20
13
20
14
20
15
GMM
-2
-1
0
1
2
3
19
92
19
93
19
94
19
95
19
96
19
97
19
98
19
99
20
00
20
01
20
02
20
03
20
04
20
05
20
06
20
07
20
08
20
09
20
10
20
11
20
12
20
13
20
14
20
15
Tobit
-$3,000
-$2,000
-$1,000
$0
$1,000
$2,000
$3,000
19
92
19
93
19
94
19
95
19
96
19
97
19
98
19
99
20
00
20
01
20
02
20
03
20
04
20
05
20
06
20
07
20
08
20
09
20
10
20
11
20
12
20
13
20
14
20
15
PPML USD(million)
Figure 1. Results for Pakistan’strade potential with China.
Source: Authors estimationbased on gravity equation 4results.
Irshad et al., Cogent Economics & Finance (2018), 6: 1504409https://doi.org/10.1080/23322039.2018.1504409
Page 11 of 18

5. Conclusion and policy implicationIn our study, we investigated the effect of Pakistan bilateral trade with FTA partner countries andregional trade agreements, particularly for China to evaluate with trade potential. The data formyears 1992–2015 were analysed to estimate Pakistan–China bilateral trade potential. We havetried to use maximum estimation techniques such as EGLS, REM, two-stage EGLS, GMM, Tobit andPPML. All the estimation results appeared with highly significant and expected signs exceptlanguage and PTA. Our estimation proved that both countries’ GDPs and trade openness havegreat influence on Pakistan bilateral trade with China and other FTA countries. The border effectalso factors Pakistan to maximize its trade relation with China. Both counties are members of WTO,therefore, it is also a huge opportunity for both countries to minimize tariff on greatly traded goodsand to provide maximum market access to each other’s products. From our study, most of thepotential equations show that Pakistan has room to expand its bilateral trade with China especiallythe exports to China. Pakistan and China signed an agreement in the year 2006 since then thetrade between both counties has been growing rapidly but China’s share getting larger in Pakistanimports and Pakistan failed to increase its exports to China. In South Asia, China only has FTA withPakistan which is the great opportunity for both counties to maintain their trade balance andcontinue mutual economic cooperation. Impact of free-trade agreements on the economy of acountry still lingered a contentious concern and these effects vary from country to country.Sometimes, free-trade agreement and trade liberalization policies may also adversely impactlocal industry of a country. Successful implementation of free-trade agreement would lead to areduction or elimination of import tariffs that could have a negative impact. Pakistan–China FTA ishelpful in achieving export-led growth policy of Pakistan. Our results show that trade betweenPakistan has increased exports to China but less than imports so that both countries must continuetheir policies to further improvement in bilateral cooperation and to minimize the trade deficit.
Taken as a whole, it can be noted that following other factors influencing Pakistan’s bilateraltrade with FTA countries such as geopolitical concerns, tariffs and pricing and import substitu-tion policy, the authors recommend future research studies with larger data about thesefactors giving better results and fewer errors. Additionally, future avenues of research shouldconsider the estimation of the gravity model with some other variables or industrial andproduct level for exports and imports separately. However, from our point of view, thisresearch, proves useful and has some interesting findings, which can help economists andpolicymakers to achieve a better view of Pakistan’s bilateral trade with FTA countries andspecifically with China.
FundingThe authors received no direct funding for this research.
Author detailsMuhammad Saqib Irshad1
E-mail: [email protected]: [email protected] ID: http://orcid.org/0000-0003-3217-4163Qi Xin2
E-mail: [email protected] ID: http://orcid.org/0000-0003-1191-3158Zhang Hui3
E-mail: [email protected] ID: http://orcid.org/0000-0003-3217-4163Hamza Arshad1
E-mail: [email protected] ID: http://orcid.org/0000-0003-4566-046X1 Department of International Economics &Trade, TianjinUniversity of Finance and Economics, Zhujiang Road, No.25, Hexi Dist, 300222 Tianjin, China.
2 College of International Education, Tianjin University ofFinance and Economics, Zhujiang Road, No.25, Hexi Dist,300222 Tianjin, China.
3 Foreign Language Department, Tianjin University ofFinance and Economics, Zhujiang Road, No. 25, Hexi Dist,300222 Tianjin, China.
Citation informationCite this article as: An empirical analysis of Pakistan’sbilateral trade and trade potential with China: A gravitymodel approach, Muhammad Saqib Irshad, Qi Xin, ZhangHui & Hamza Arshad, Cogent Economics & Finance (2018),6: 1504409.
Notes1. Afghanistan, Argentina, Azerbaijan, Bangladesh,
Brazil, China, Egypt, India, Indonesia, Iran,Kazakhstan, Kyrgyzstan, Malaysia, Maldives,Mauritius, Nepal, Nigeria, Paraguay, Sri Lanka,Tajikistan, Turkey, Turkmenistan, Uruguay, USA andUzbekistan.
2. EGLS (Estimated Generalized Least Square with cross-sectional weights), REM (Random Effects Model), Two-stage EGLS (Two-Stage Estimated Generalized LeastSquare), GMM (Generalized Method of Moment—onestep estimator), PPML (Poisson pseudo-maximumlikelihood).
Irshad et al., Cogent Economics & Finance (2018), 6: 1504409https://doi.org/10.1080/23322039.2018.1504409
Page 12 of 18

3. [= exp(coefficient)], Coefficients estimated by PoissonPseudo-Maximum Likelihood (PPML) method as sug-gested by Silva and Tenreyro (2006).
4. Maximum estimation results by PPML techniques andminimum results by REM.
5. It is calculated as 0.21 [= exp(0.19) − 1] and 0.25[= exp(0.22) − 1].
ReferencesAnderson, J. E. (1979). A theoretical foundation for the
gravity equation. American Economic Review, 69(1),106–116.
Anderson, J. E., & vanWincoop, E. (2001). Border, trade andwelfare. Boston College Working Paper 508, Boston.
Baier, S. L., & Bergstrand, J. H. (2002). On the endogeneityof international trade flows and free trade agree-ments. Manuscript March 2002.
Bergstrand, J. H. (1985). The gravity equation in interna-tional trade: Some microeconomic foundations andempirical evidence. Review of Economics andStatistics, 67, 474–481. doi:10.2307/1925976
Bergstrand, J. H. (1989). The generalized gravity equation,monopolistic competition and the factor—Proportions theory in international trade. Review ofEconomics and Statistics, 71, 143–153. doi:10.2307/1928061
Bergstrand, J. H. (1990). The Heckscher-Ohlin-Samuelsonmodel, the Linder hypothesis and the determinantsof bilateral intra-industry trade. Economic Journal,100, 1216–1229. doi:10.2307/2233969
Breusch, T. S., & Pagan, A. R. (1980). The Lagrange multi-plier test and its applications to model specificationin econometrics. Review of Econometric Studies, 47(1), 239–253. doi:10.2307/2297111
Brodzicki, T., Ciołek, D., & Śledziewska, K. (2017). Whatreally determines Polish exports? The semi-mixedeffects gravity model for Poland. ArgumentaOeconomica, 2(39), 5–19.
Bun, M. J. G., & Klaassen, F. J. G. M. (2007). The Euro effecton trade is not as large as commonly thought. OxfordBulletin of Economics and Statistics, 69(4), 473–496.doi:10.1111/j.1468-0084.2007.00448.x
Carrere, C. (2006). Revisiting the effects of regional tradeagreements on trade flows with proper specificationof the gravity model. European Economic Review, 50(2), 223–247. doi:10.1016/j.euroecorev.2004.06.001
Cyrus, T. (2011). Cultural proximity and bilateral trade inthe European Union. Retrieved from http://www.euce.org/eusa/2011/papers/12d_cyrus.pdf.
Deardorff, A. V. (1998). Determinants of bilateral trade:Does gravity work in a neoclassical world? In J. A.Frankel (Ed.), The regionalization of the world econ-omy. Chicago, IL: University of Chicago Press.
Disdier, A. C., & Head, K. (2003). Exaggerated reports on thedeath of distance. Mineo: Lessons from a Meta-Analysis.
Eberhardt, M., & Teal, F. (2011). ‘Econometrics for grum-blers: A new look at the literature on cross-countrygrowth empirics’. Journal of Economic Surveys, 25(1),109–155. doi:10.1111/joes.2011.25.issue-1
Elliott, D. R. (2007). Caribbean regionalism and theexpectation of increased trade: Insights from a time-series gravity model. Journal of International Tradeand Economic Development, 16(1), 117–136.doi:10.1080/09638190601165830
Esfahani, M. N., & Rasoulinezhad, E. (2017). Iran’s tradepolicy of Asianization and de-Europeanization undersanctions. Journal of Economic Studies, 44(4), 552–567.
Evenett, S., & Keller, W. (2002). On theories explaining thesuccess of the gravity equation. Journal of PoliticalEconomy, 110(2), 281–316. doi:10.1086/338746
Grant, J. S., & Lambert, D. M. (2008). Do regional tradeagreements increase members’ agricultural trade?American Journal of Agricultural Economics, 90(3),765–782.
Helpman, E., & Krugman, P. R. (1985). Market structureand international trade. Cambridge, MA: MIT Press.
Irshad, M. S., & Xin, Q. (2014). A new perspective of theChina-ASEAN free trade area and the story of top tenproducts. European Journal of Business andManagement, 6(18), 1–8.
Irshad, M. S., & Xin, Q. (2015a). Pakistan China free tradeagreement (PCFTA) treaty model: Capability, pro-spects and disputes. Academic ResearchInternational, 6(3), 53–60.
Irshad, M. S., & Xin, Q. (2015b). Rising trend in import andexports of Pakistan FTA partners in recent years.Academic Research International, 6(4), 320–331.
Irshad, M. S., & Xin, Q. (2017a). Determinants of exportscompetitiveness: An empirical analysis throughrevealed comparative advantage of external sectorof Pakistan. Asian Economic and Financial Review, 6(3), 623–633.
Irshad, M. S., & Xin, Q. (2017b). The gravity behind SouthKorea’s international trade: A panel data approach.The Myanmar Journal, 4(2), 76–89.
Irshad, M. S., Xin, Q., & Arshad, H. (2015). One belt oneroad: Does China-Pakistan Economic Corridor benefitfor Pakistan’s economy? Journal of Economics andSustainable Development, 6(24), 200–207.
Irshad, M. S., Xin, Q., Ayaz, M., & Ali, F. (2016). The role ofcharismatic world trade organization and theexpansion of free international trade. InternationalJournal of Management Science and BusinessAdministration, 2(3), 17–23.
Irshad, M. S., Xin, Q., Hao, H., & Arshad, H. (2017). SWOTanalysis of Pakistan–China free trade agreement:PROS and CONS. International Journal of Asian SocialSciences, 7(1), 45–53. doi:10.18488/journal.1
Irshad, M. S., Xin, Q., Shahriar, S., & Ali, F. (2018). SouthKorea’s potential export flow: A panel gravityapproach. Asian Journal of Empirical Research, 8(4),124–139.
Irshad, M. S., Xin, Q., Shahriar, S., & Arshad, H. (2018).A panel data analysis of China’s trade patternwith OPEC members: Gravity model approach.Asian Economic and Financial Review, 8(1), 103–116.
Irshad, M. S., Xin, Q., Xuan, L., & Arshad, H. (2016). Deltoidanalysis of Pakistan-ASEAN-China free trade agree-ments and opportunity for Pakistan. Asian Economicand Financial Review, 6(5), 228–237. doi:10.18488/journal.aefr/2016.6.5/102.5.228.237
Irshad, M. S., Xin, Q., & Arshad, H. (2018). Competitivenessof Pakistani rice in international market and exportpotential with global world: A panel gravityapproach. Cogent Economics & Finance, 6, 1-8.https://doi.org/10.1080/23322039.2018.1486690
Jong, G. D., Hugh, G., Warren, W., & Jenny, W. (2002).Study on ideas on a new national freight model sys-tem for Sweden. Norway: RAND Corporation.
Kandogan, Y. (2005). Evidence for the natural tradepartners theory from the Euro-Mediterranean region.Working Paper Series No. 2005-01.University ofMichigan-Flint School of Management.
Kang, H., & Fratianni, M. (2006). International trade, OECDmembership, and religion. Open Economic Review, 17(4–5), 493–508. doi:10.1007/s11079-006-0361-y
Kepaptsoglou, K., Karlaftis, M. G., & Tsamboulas, D. (2010).The gravity model specification for modelling inter-national trade flows and free trade agreements
Irshad et al., Cogent Economics & Finance (2018), 6: 1504409https://doi.org/10.1080/23322039.2018.1504409
Page 13 of 18
effects. The Open Economics Journal, 3, 1–13.doi:10.2174/1874919401003010001
Kucera, D., & Sarna, R. (2006). Trade union rights,democracy, and exports: A gravity model approach.Review of International Economics, 14(5), 859–882.doi:10.1111/roie.2006.14.issue-5
Leamer, E. E. (1974). The commodity composition ofinternational trade in manufactures: An empiricalanalysis. Oxford Economic Papers, 26(3), 350-374.
Linnemann, H. (1966). Modeling international trade flows:An econometric approach. Amsterdam: North-Holland.
Martinez, et al (2005). Transport costs and trade:Empirical evidence for Latin American imports fromthe European Union. Journal of International Tradeand Economic Development, 14(3), 353–371.doi:10.1080/09638190500212121
Martinez-Zarzaso, I. (2003). Gravity model: An applica-tion to trade between regional blocs. AtlanticEconomic Journal, 31(2), 174–187. doi:10.1007/BF02319869
Melitz, J. (2007). North, South and distance in the gravitymodel. European Economic Review, 51(4), 971–991.doi:10.1016/j.euroecorev.2006.07.001
Moscone, F., & Tosetti, E. (2009). A review and comparisonof tests of cross-section independence in Panels.Journal of Economic Surveys, Vol. 23(3), pp.528–561.doi:10.1111/joes.2009.23.issue-3
Papazoglou, C. (2007a). Greece’s potential trade flows: Agravity model approach. International Advances inEconomic Research, 13(4), 403–414. doi:10.1007/s11294-007-9107-x
Papazoglou, C. (2007b). Greece’s potential trade flows: Agravity model approach. International Advances inEconomic Research, 13(4), 403–414. doi:10.1007/s11294-007-9107-x
Pesaran, M. H. (2004), General diagnostic tests for crosssection dependence in panels, IZA Discussion Paper No.1240, Retrieved from: http://repec.iza.org/dp1240.pdf
Robert, B., Felix, B., Jared, G., Wayne, C., & Paul G. (2015).Exploring the links between bilateral and regionaltrade agreements and merchandise trade. Asian andPacific Policy Studies, 2(3), 467–484.
Silva, J. S., & Tenreyro, S. (2006). The log of gravity. TheReview of Economics and Statistics, 88, 641–658.doi:10.1162/rest.88.4.641
Soloaga, I., & Winters, A. (2001). Regionalism in theNineties: What effect on trade? The North AmericanJournal of Economics and Finance, 12(1), 1–29.doi:10.1016/S1062-9408(01)00042-0
Tang, D. (2005). Effects of the regional trading arrange-ments on trade: Evidence from the NAFTA, ANZCERand ASEAN countries, 1989–2000. Journal ofInternational Trade and Economic Development, 14(2), 241–265. doi:10.1080/09638190500093562
Thorpe, M., & Zhang, Z. (2005). Study of the measurementand determinants of intra-industry trade in East Asia.Asian Economic Journal, 19(2), 231–247. doi:10.1111/asej.2005.19.issue-2
Tzouvelekas, V. (2007). Accounting for pairwise hetero-geneity in bilateral trade flows: A stochastic varyingcoefficient gravity model. Applied Economic Letters,14(12), 927–930. doi:10.1080/13504850600705919
World Bank. (2005). Global Economic Prospects.Washington, DC.
Xia, H. (2015). Spotlight: China South Korea to deepeneconomics ties with FTA implementation. Availablefrom http://news.xinhuanet.com/english/2015-12/19/c_134933148.htm
Xin, Q., Irshad, M. S., & Hao, H. (2014). Boon or bane:Assessing the environment of China’s free trade agree-ments with other nations. International Journal ofBusiness and Management Review, Vol. 2(No.5), 1–13.
Xuegang, C., Zhaoping, Y., & Xuling, L. (2008). Empiricalanalysis of Xinjiang’s bilateral trade: Gravity modelapproach. Chinese Geographical Science, Vol. 18(No.1), pp. 9–16. doi:10.1007/s11769-008-0009-5
Irshad et al., Cogent Economics & Finance (2018), 6: 1504409https://doi.org/10.1080/23322039.2018.1504409
Page 14 of 18

Appendix
Appendix A1. Pakistan’s free-trade agreements with Regional trading blocs and specificcountries
Signed In effect Trading blocs Countries2003–07 2008–01 Economic Cooperation
Organization (ECO)Afghanistan, Azerbaijan, Iran,Kazakhstan, Kyrgyzstan,Pakistan, Tajikistan, Turkey,Turkmenistan, Uzbekistan
2006–07 2009–06 MERCOSUR Preferential TradeAgreement
Argentina, Brazil, Pakistan,Paraguay, Uruguay
2006–05 2011–08 Preferential Tariff Arrangement-Group of Eight DevelopingCountries (PTA-D8)
Bangladesh, Egypt, Indonesia,Iran, Malaysia, Nigeria, Pakistan,Turkey
2004–01 2006–01 South Asian Free Trade Area(SAFTA)
Bangladesh, Bhutan, India,Maldives, Nepal, Pakistan, SriLanka
Signed In effect Country
2006–11 2007–07 China
2012–02 2013–09 Indonesia
2007–11 2008–01 Malaysia
2007–07 2007–11 Mauritius
2002–08 2005–06 Sri Lanka
2003–06 2003–06 USA
2004–04 2006–09 Iran
Source: Asian Regional Integration Center, Asian Development Bank.
Irshad et al., Cogent Economics & Finance (2018), 6: 1504409https://doi.org/10.1080/23322039.2018.1504409
Page 15 of 18
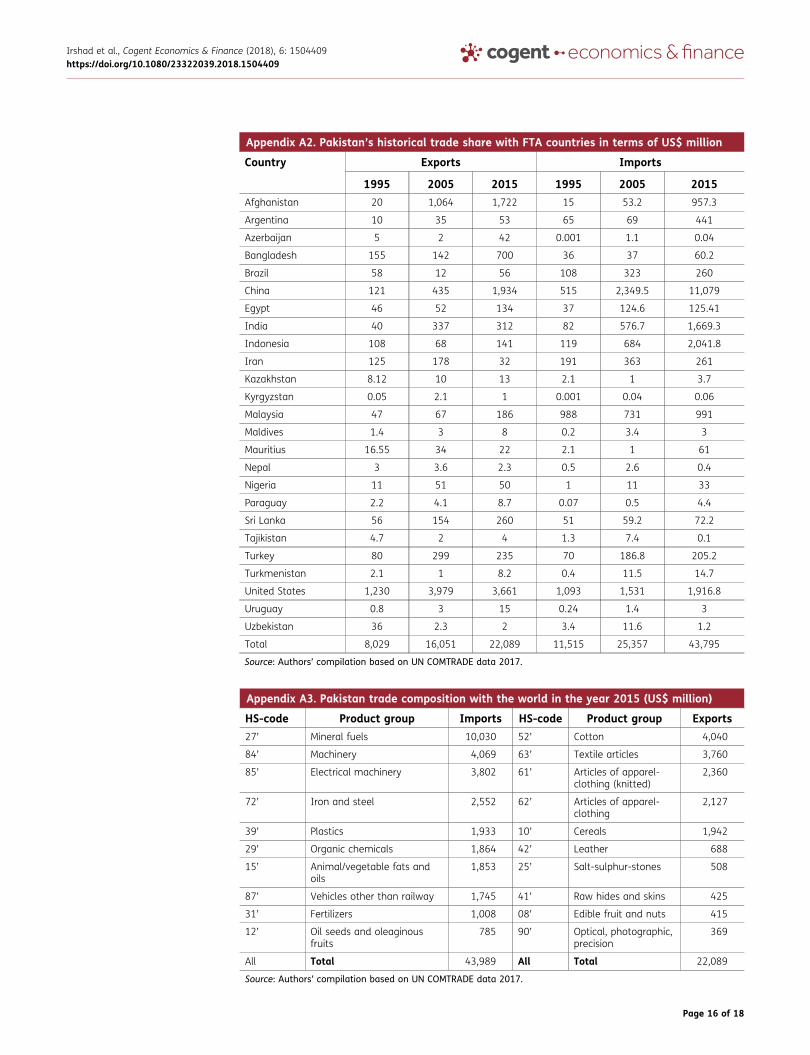
Appendix A2. Pakistan’s historical trade share with FTA countries in terms of US$ million
Country Exports Imports
1995 2005 2015 1995 2005 2015Afghanistan 20 1,064 1,722 15 53.2 957.3
Argentina 10 35 53 65 69 441
Azerbaijan 5 2 42 0.001 1.1 0.04
Bangladesh 155 142 700 36 37 60.2
Brazil 58 12 56 108 323 260
China 121 435 1,934 515 2,349.5 11,079
Egypt 46 52 134 37 124.6 125.41
India 40 337 312 82 576.7 1,669.3
Indonesia 108 68 141 119 684 2,041.8
Iran 125 178 32 191 363 261
Kazakhstan 8.12 10 13 2.1 1 3.7
Kyrgyzstan 0.05 2.1 1 0.001 0.04 0.06
Malaysia 47 67 186 988 731 991
Maldives 1.4 3 8 0.2 3.4 3
Mauritius 16.55 34 22 2.1 1 61
Nepal 3 3.6 2.3 0.5 2.6 0.4
Nigeria 11 51 50 1 11 33
Paraguay 2.2 4.1 8.7 0.07 0.5 4.4
Sri Lanka 56 154 260 51 59.2 72.2
Tajikistan 4.7 2 4 1.3 7.4 0.1
Turkey 80 299 235 70 186.8 205.2
Turkmenistan 2.1 1 8.2 0.4 11.5 14.7
United States 1,230 3,979 3,661 1,093 1,531 1,916.8
Uruguay 0.8 3 15 0.24 1.4 3
Uzbekistan 36 2.3 2 3.4 11.6 1.2
Total 8,029 16,051 22,089 11,515 25,357 43,795
Source: Authors’ compilation based on UN COMTRADE data 2017.
Appendix A3. Pakistan trade composition with the world in the year 2015 (US$ million)
HS-code Product group Imports HS-code Product group Exports
27’ Mineral fuels 10,030 52’ Cotton 4,040
84’ Machinery 4,069 63’ Textile articles 3,760
85’ Electrical machinery 3,802 61’ Articles of apparel-clothing (knitted)
2,360
72’ Iron and steel 2,552 62’ Articles of apparel-clothing
2,127
39’ Plastics 1,933 10’ Cereals 1,942
29’ Organic chemicals 1,864 42’ Leather 688
15’ Animal/vegetable fats andoils
1,853 25’ Salt-sulphur-stones 508
87’ Vehicles other than railway 1,745 41’ Raw hides and skins 425
31’ Fertilizers 1,008 08’ Edible fruit and nuts 415
12’ Oil seeds and oleaginousfruits
785 90’ Optical, photographic,precision
369
All Total 43,989 All Total 22,089
Source: Authors’ compilation based on UN COMTRADE data 2017.
Irshad et al., Cogent Economics & Finance (2018), 6: 1504409https://doi.org/10.1080/23322039.2018.1504409
Page 16 of 18

Appendix A4. Pakistan trade composition with China in the year 2015 (US$ million)
HS-code Product group Imports HS-code Product group Exports
85’ Electrical machinery 3,364 52’ Cotton 1,262
84’ Machinery 2,940 10’ Cereals 167
72’ Iron and steel 1,061 22’ Beverages 88
29’ Organic chemicals 636 26’ Ores, slag and ash 71
54’ Man-made filaments 556 25’ Salt, sulphur, stone 48
73’ Articles of iron orsteel
525 03’ Fish and Crustaceans 46
87’ Vehicles other thanrailway
398 41’ Rawhides and skins 42
39’ Plastics 364 74’ Cooper and articlesthereof
28
55’ Man-made staplefibres
307 08’ Edible fruit and nuts 27
31’ Fertilizers 300 63’ Textile articles 27
All Total 13,680 All Total 1,935
Source: Authors’ compilation based on UN COMTRADE data 2017.
Appendix A5. Descriptive statistics of variables used in gravity equation
Mean Median Maxi-mum
Mini-mum
Std.Dev.
Jarque-Bera
Probabi-lity
Sum SumSq.Dev.
Bilateraltrade
10.85 11.11 16.38 0.69 2.61 10.14 0.00 6,514 4,068
Product ofGDPs
36.26 36.22 43.02 30.26 2.61 9.71 0.01 2,1758 4,097
Trade cost 8.02 8.1 9.66 5.92 1.06 23.46 0.00 4,814 679
Inflation 4.4 4.35 10.34 −1.23 1.68 0.52 4.88 2,643 1,699
T-opennessPakistan
0.31 0.32 0.38 0.24 0.03 0.05 0.97 187.9 0.55
T-opennesspartner
0.55 0.44 1.92 0.12 0.34 459.6 0.00 328 69
Religion 0.6 1 1 0 0.49 100.7 0.00 360 144
Language 0.28 0 1 0 0.45 123 0.00 168 120.96
Border 0.16 0 1 0 0.37 395.9 0.00 96 80.6
WTOmembership
0.68 1 1 0 0.48 108.49 0.00 407 130.9
Tradeagreements
0.34 0 1 0 0.47 104.96 0.00 205 134.95
Irshad et al., Cogent Economics & Finance (2018), 6: 1504409https://doi.org/10.1080/23322039.2018.1504409
Page 17 of 18
©2018 The Author(s). This open access article is distributed under a Creative Commons Attribution (CC-BY) 4.0 license.
You are free to:Share — copy and redistribute the material in any medium or format.Adapt — remix, transform, and build upon the material for any purpose, even commercially.The licensor cannot revoke these freedoms as long as you follow the license terms.
Under the following terms:Attribution — You must give appropriate credit, provide a link to the license, and indicate if changes were made.You may do so in any reasonable manner, but not in any way that suggests the licensor endorses you or your use.No additional restrictions
Youmay not apply legal terms or technological measures that legally restrict others from doing anything the license permits.
Cogent Economics & Finance (ISSN: 2332-2039) is published by Cogent OA, part of Taylor & Francis Group.
Publishing with Cogent OA ensures:
• Immediate, universal access to your article on publication
• High visibility and discoverability via the Cogent OA website as well as Taylor & Francis Online
• Download and citation statistics for your article
• Rapid online publication
• Input from, and dialog with, expert editors and editorial boards
• Retention of full copyright of your article
• Guaranteed legacy preservation of your article
• Discounts and waivers for authors in developing regions
Submit your manuscript to a Cogent OA journal at www.CogentOA.com
0
5
10
15
20
25
30
35
40
45
50
$0
$10,000
$20,000
$30,000
$40,000
$50,000
$60,000
$70,000
$80,000
19
92
19
93
19
94
19
95
19
96
19
97
19
98
19
99
20
00
20
01
20
02
20
03
20
04
20
05
20
06
20
07
20
08
20
09
20
10
20
11
20
12
20
13
20
14
20
15
China FTA Countries
Total Trade % of China
% of FTA Countries
Figure A. Pakistan’s trade withworld and FTA countries andpercentage share (US$ million).
Source: Authors’ own calcula-tion based on UN Comtradedatabase and ITC trade map2017.
Irshad et al., Cogent Economics & Finance (2018), 6: 1504409https://doi.org/10.1080/23322039.2018.1504409
Page 18 of 18