Nuclear Power AFF – NCPA Workshop · Web viewNuclear Power AFF – NCPA Workshop ... Notes
1
An Economic Justification of the Use of Dispensing Technologies
in Independent Community Pharmacies
NCPA Foundation Research Grant May 31, 2001
2
Donna West, R.Ph., Ph.D. Jan Hastings, Pharm. D.
Ashley Earley, Pharm. D. Candidate University of Arkansas for Medical Sciences, College of Pharmacy
3
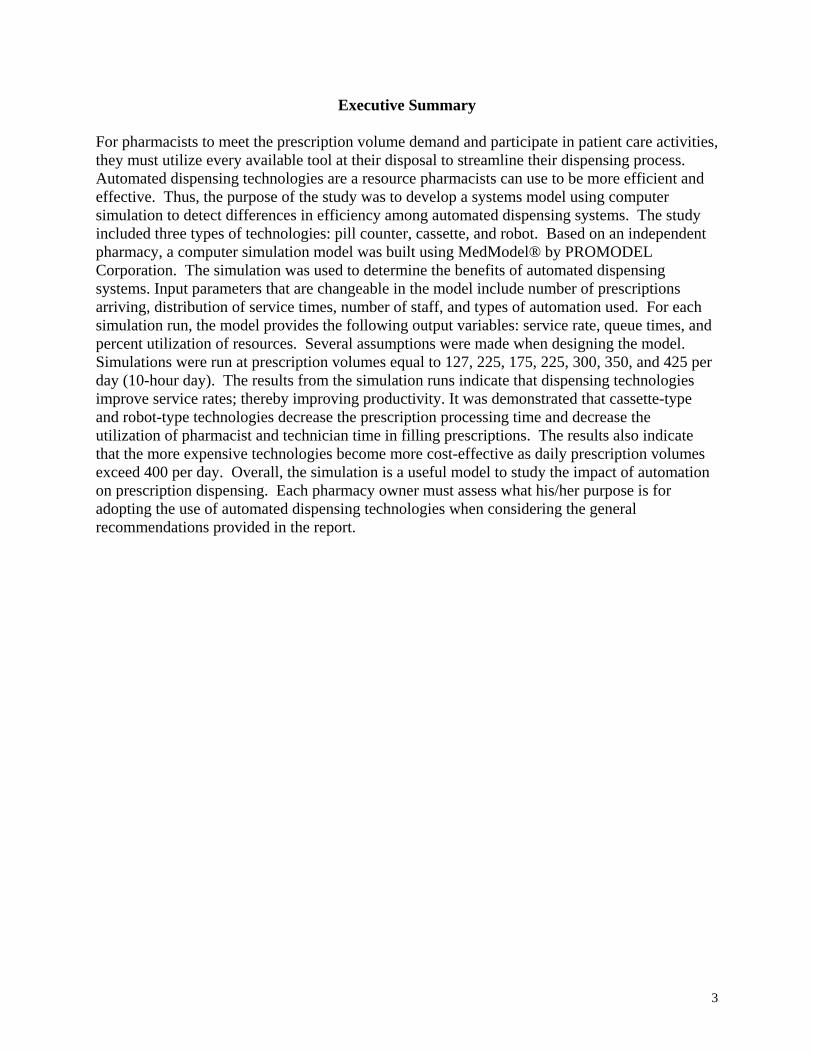
Executive Summary For pharmacists to meet the prescription volume demand and participate in patient care activities, they must utilize every available tool at their disposal to streamline their dispensing process. Automated dispensing technologies are a resource pharmacists can use to be more efficient and effective. Thus, the purpose of the study was to develop a systems model using computer simulation to detect differences in efficiency among automated dispensing systems. The study included three types of technologies: pill counter, cassette, and robot. Based on an independent pharmacy, a computer simulation model was built using MedModel® by PROMODEL Corporation. The simulation was used to determine the benefits of automated dispensing systems. Input parameters that are changeable in the model include number of prescriptions arriving, distribution of service times, number of staff, and types of automation used. For each simulation run, the model provides the following output variables: service rate, queue times, and percent utilization of resources. Several assumptions were made when designing the model. Simulations were run at prescription volumes equal to 127, 225, 175, 225, 300, 350, and 425 per day (10-hour day). The results from the simulation runs indicate that dispensing technologies improve service rates; thereby improving productivity. It was demonstrated that cassette-type and robot-type technologies decrease the prescription processing time and decrease the utilization of pharmacist and technician time in filling prescriptions. The results also indicate that the more expensive technologies become more cost-effective as daily prescription volumes exceed 400 per day. Overall, the simulation is a useful model to study the impact of automation on prescription dispensing. Each pharmacy owner must assess what his/her purpose is for adopting the use of automated dispensing technologies when considering the general recommendations provided in the report.

4
Background Pharmacists remain in a state of change and are constantly expanding their practices. Pharmacists are being encouraged to become more involved in direct patient care activities. The first and most critical step in the process of expanding a dispensing practice to include patient care activities is to provide the pharmacist the time necessary to provide patient care. Pharmacists will always have the ultimate responsibility for ensuring that the right medicine reaches the right patient at the right time. This task is especially difficult now, due to manpower shortages being experienced across the nation. The number of prescriptions being dispensed each year continues to increase; however, the number of pharmacy graduates at this time is not keeping pace with the increased prescription volume. The resulting consequence is increased workloads for pharmacists. Thus, for pharmacists to meet the prescription volume demand and participate in patient care activities, they must utilize every available tool at their disposal to streamline their dispensing process. Maximum utilization of pharmacy technicians is a necessity. Pharmacy practice acts in most states have legalized additional responsibilities for technicians in the past few years, but not all pharmacists have changed the role of technicians in their dispensing process. However, even when technicians are properly utilized, there still may be extended wait times and not enough time for pharmacists to counsel patients optimally. Technological methods for streamlining the dispensing process are available to pharmacists, but they vary not only in complexity but also in cost. Realizing that we live in a market-driven economy, entrepreneurs have been quick to develop and adopt the use of innovate technologies, and these advances in technology are changing the world. Likewise, advances in technology are changing pharmacy practice, and usually for the better (Barker, Felkey, Flynn, and Carper 1998). Technology has enabled pharmacists to be more efficient and more accurate. A few examples of how technology is being used in pharmacy practice today are listed below (Dankmyer 1999, West 1997, West 2000).
• Cornerdrugstore.com and other web sites are being used by pharmacists to promote their services and expand their markets.
• E-mail is allowing patients to communicate with their pharmacist and send refill requests in a convenient manner.
• Fax machines are enabling communication between pharmacies and physician offices. • The Internet is being used to send prescriptions electronically. • Automated dispensing technologies are being used to improve the efficiency of
prescription processing. Of specific interest is the use of automated dispensing technologies (e.g., pill counters, robotics). The first such systems were available in the 1970s. These systems simply counted tablets. Today automated dispensing systems that automate the entire dispensing process are available. These systems select the vial, count the medication, and label the prescription bottle. With a variety of automated dispensing technologies available, there are devices that are appropriate for different segments of the community pharmacy market based on prescription volume.
5
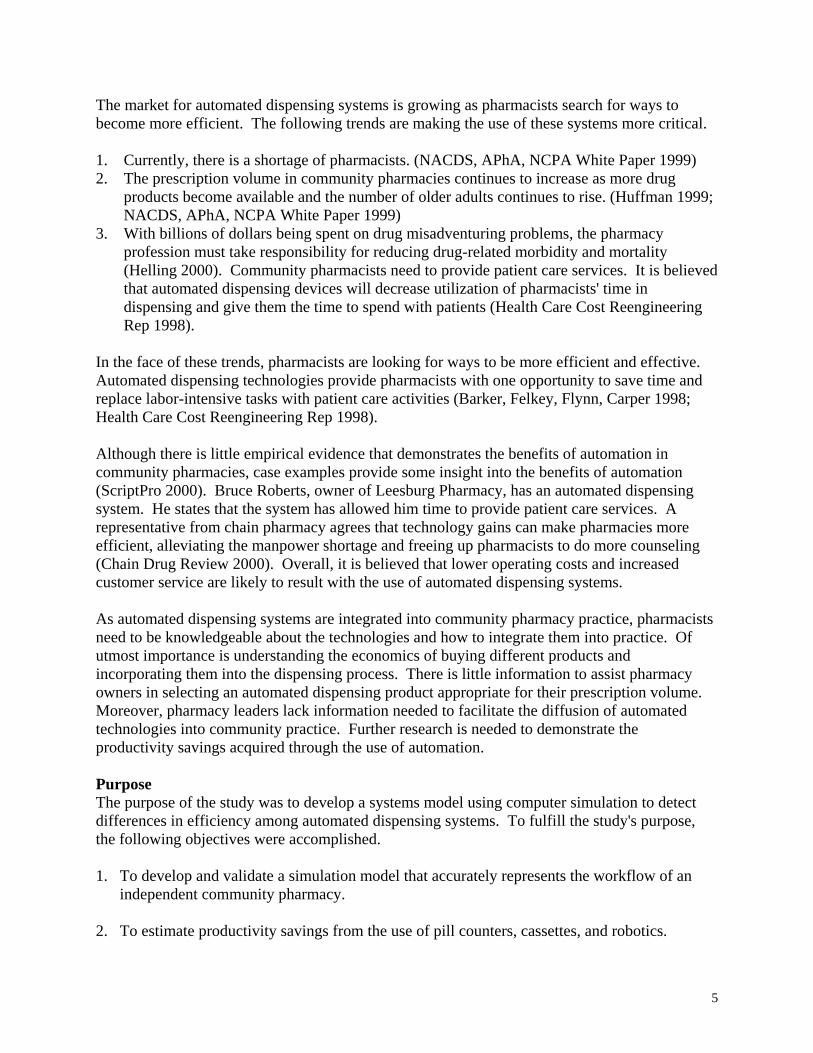
The market for automated dispensing systems is growing as pharmacists search for ways to become more efficient. The following trends are making the use of these systems more critical. 1. Currently, there is a shortage of pharmacists. (NACDS, APhA, NCPA White Paper 1999) 2. The prescription volume in community pharmacies continues to increase as more drug
products become available and the number of older adults continues to rise. (Huffman 1999; NACDS, APhA, NCPA White Paper 1999)
3. With billions of dollars being spent on drug misadventuring problems, the pharmacy profession must take responsibility for reducing drug-related morbidity and mortality (Helling 2000). Community pharmacists need to provide patient care services. It is believed that automated dispensing devices will decrease utilization of pharmacists' time in dispensing and give them the time to spend with patients (Health Care Cost Reengineering Rep 1998).
In the face of these trends, pharmacists are looking for ways to be more efficient and effective. Automated dispensing technologies provide pharmacists with one opportunity to save time and replace labor-intensive tasks with patient care activities (Barker, Felkey, Flynn, Carper 1998; Health Care Cost Reengineering Rep 1998). Although there is little empirical evidence that demonstrates the benefits of automation in community pharmacies, case examples provide some insight into the benefits of automation (ScriptPro 2000). Bruce Roberts, owner of Leesburg Pharmacy, has an automated dispensing system. He states that the system has allowed him time to provide patient care services. A representative from chain pharmacy agrees that technology gains can make pharmacies more efficient, alleviating the manpower shortage and freeing up pharmacists to do more counseling (Chain Drug Review 2000). Overall, it is believed that lower operating costs and increased customer service are likely to result with the use of automated dispensing systems. As automated dispensing systems are integrated into community pharmacy practice, pharmacists need to be knowledgeable about the technologies and how to integrate them into practice. Of utmost importance is understanding the economics of buying different products and incorporating them into the dispensing process. There is little information to assist pharmacy owners in selecting an automated dispensing product appropriate for their prescription volume. Moreover, pharmacy leaders lack information needed to facilitate the diffusion of automated technologies into community practice. Further research is needed to demonstrate the productivity savings acquired through the use of automation. Purpose The purpose of the study was to develop a systems model using computer simulation to detect differences in efficiency among automated dispensing systems. To fulfill the study's purpose, the following objectives were accomplished. 1. To develop and validate a simulation model that accurately represents the workflow of an
independent community pharmacy. 2. To estimate productivity savings from the use of pill counters, cassettes, and robotics.
6
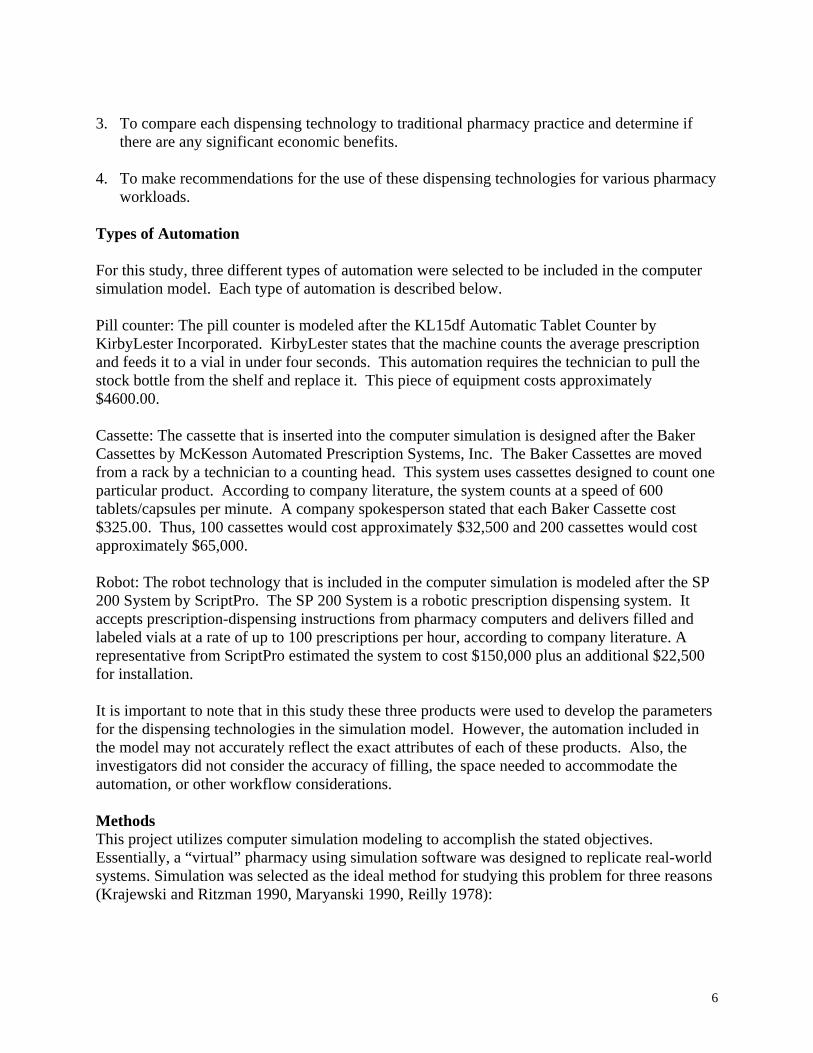
3. To compare each dispensing technology to traditional pharmacy practice and determine if
there are any significant economic benefits. 4. To make recommendations for the use of these dispensing technologies for various pharmacy
workloads. Types of Automation For this study, three different types of automation were selected to be included in the computer simulation model. Each type of automation is described below. Pill counter: The pill counter is modeled after the KL15df Automatic Tablet Counter by KirbyLester Incorporated. KirbyLester states that the machine counts the average prescription and feeds it to a vial in under four seconds. This automation requires the technician to pull the stock bottle from the shelf and replace it. This piece of equipment costs approximately $4600.00. Cassette: The cassette that is inserted into the computer simulation is designed after the Baker Cassettes by McKesson Automated Prescription Systems, Inc. The Baker Cassettes are moved from a rack by a technician to a counting head. This system uses cassettes designed to count one particular product. According to company literature, the system counts at a speed of 600 tablets/capsules per minute. A company spokesperson stated that each Baker Cassette cost $325.00. Thus, 100 cassettes would cost approximately $32,500 and 200 cassettes would cost approximately $65,000. Robot: The robot technology that is included in the computer simulation is modeled after the SP 200 System by ScriptPro. The SP 200 System is a robotic prescription dispensing system. It accepts prescription-dispensing instructions from pharmacy computers and delivers filled and labeled vials at a rate of up to 100 prescriptions per hour, according to company literature. A representative from ScriptPro estimated the system to cost $150,000 plus an additional $22,500 for installation. It is important to note that in this study these three products were used to develop the parameters for the dispensing technologies in the simulation model. However, the automation included in the model may not accurately reflect the exact attributes of each of these products. Also, the investigators did not consider the accuracy of filling, the space needed to accommodate the automation, or other workflow considerations. Methods This project utilizes computer simulation modeling to accomplish the stated objectives. Essentially, a “virtual” pharmacy using simulation software was designed to replicate real-world systems. Simulation was selected as the ideal method for studying this problem for three reasons (Krajewski and Ritzman 1990, Maryanski 1990, Reilly 1978):

7
1. Simulation makes it easier to think about system problems because you can spend time focusing on the inputs, processes, and outputs rather than on the complex interrelationships.
2. Simulation allows us to test multiple system configurations (e.g., variations in the inputs) within a very short time frame. This type of testing is often too impractical, costly, and time intensive in real-world systems.
3. It is not feasible to expect an independent pharmacy to adopt multiple technologies within a short period of time. Given the costs and significant workflow changes necessary to successfully implement dispensing technologies in a real-world independent pharmacy, simulation becomes the ideal choice.
The software program titled MedModel® by PROMODEL Corporation was used to build the computer simulation. The computer simulation design was based on an independent pharmacy located in Little Rock, Arkansas. The selected pharmacy was similar to the average pharmacy represented in the 2000 NCPA-Pharmacia Digest. A diagram of the independent pharmacy is included in Appendix A. Listed below are characteristics of the modeled pharmacy.
• Prescription volume ranges from 100-175 per day (average of 127 per day). • The pharmacy is open Monday-Friday, 8:30AM-6:30PM (10 hours). (The pharmacy is
open for 5 hours on Saturday; however, this was not included in the computer simulation model.)
• The pharmacy is located in a building with pediatrician offices. • Approximately 70% of the prescriptions enter the system via patient walks-in, and the
other 30% enter via telephone or fax. • Seventy percent of the prescriptions are paid for by third-parties. • 55% of the prescriptions are new, 45% of the prescriptions are refill.
Model Building Simulation building is an intensive and highly detailed process. In brief, it consists of observing an existing system, representing that system accurately in a computer language, and then modifying the model to simulate the effects of changes in the system. The project was completed in a series of steps. A flowchart outlining workflow in the pharmacy was developed, as shown in Appendix B. The flowchart was used as a guide for building the computer simulation. Based on the flowchart, the researchers and research assistants collected data for the following variables.
• Arrival rate-The distribution of arrivals into the system. • Time to enter prescription-The time from beginning of inputting prescription into
computer to label generated. • Time to fill prescription-The time required for technician to pull stock bottle, count
tablets, pour into vial, label prescription, and have pharmacist check it. • Time for prescription processing-Time involved from entering the prescription into the
computer to the final check by the pharmacist is completed. (Note this is not the combined time of entering and filling as these two activities can overlap).
8
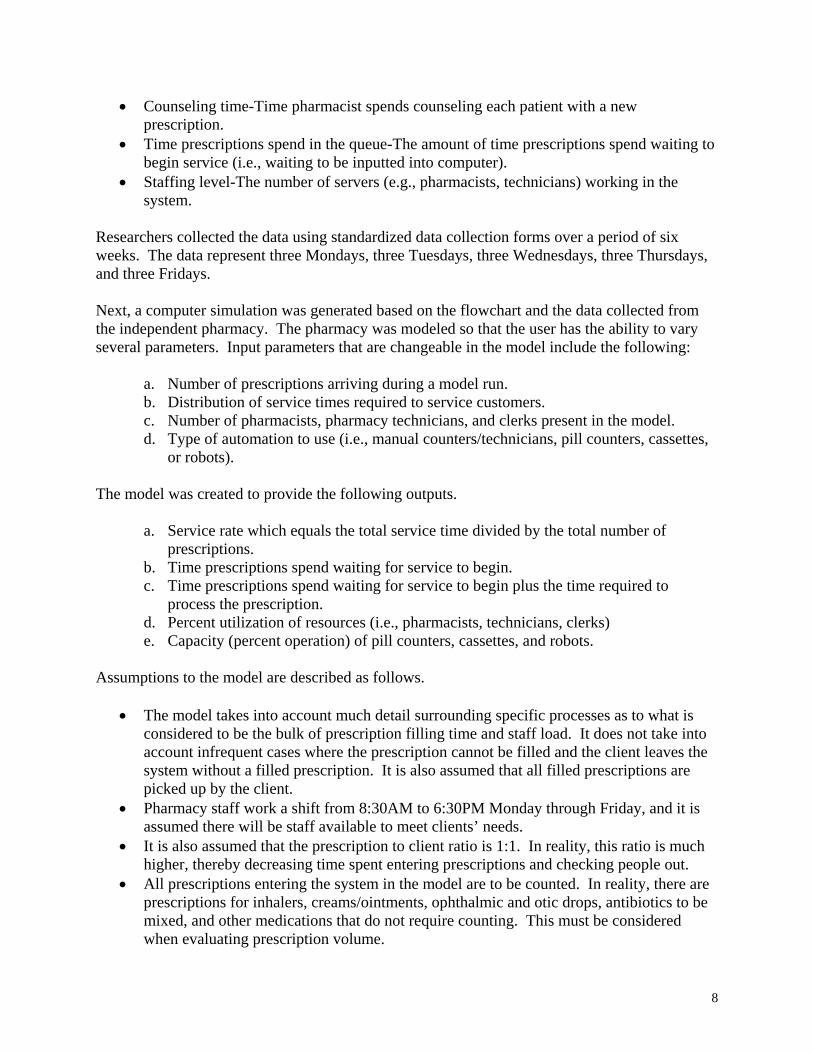
• Counseling time-Time pharmacist spends counseling each patient with a new prescription.
• Time prescriptions spend in the queue-The amount of time prescriptions spend waiting to begin service (i.e., waiting to be inputted into computer).
• Staffing level-The number of servers (e.g., pharmacists, technicians) working in the system.
Researchers collected the data using standardized data collection forms over a period of six weeks. The data represent three Mondays, three Tuesdays, three Wednesdays, three Thursdays, and three Fridays. Next, a computer simulation was generated based on the flowchart and the data collected from the independent pharmacy. The pharmacy was modeled so that the user has the ability to vary several parameters. Input parameters that are changeable in the model include the following:
a. Number of prescriptions arriving during a model run. b. Distribution of service times required to service customers. c. Number of pharmacists, pharmacy technicians, and clerks present in the model. d. Type of automation to use (i.e., manual counters/technicians, pill counters, cassettes,
or robots). The model was created to provide the following outputs.
a. Service rate which equals the total service time divided by the total number of prescriptions.
b. Time prescriptions spend waiting for service to begin. c. Time prescriptions spend waiting for service to begin plus the time required to
process the prescription. d. Percent utilization of resources (i.e., pharmacists, technicians, clerks) e. Capacity (percent operation) of pill counters, cassettes, and robots.
Assumptions to the model are described as follows.
• The model takes into account much detail surrounding specific processes as to what is
considered to be the bulk of prescription filling time and staff load. It does not take into account infrequent cases where the prescription cannot be filled and the client leaves the system without a filled prescription. It is also assumed that all filled prescriptions are picked up by the client.
• Pharmacy staff work a shift from 8:30AM to 6:30PM Monday through Friday, and it is assumed there will be staff available to meet clients’ needs.
• It is also assumed that the prescription to client ratio is 1:1. In reality, this ratio is much higher, thereby decreasing time spent entering prescriptions and checking people out.
• All prescriptions entering the system in the model are to be counted. In reality, there are prescriptions for inhalers, creams/ointments, ophthalmic and otic drops, antibiotics to be mixed, and other medications that do not require counting. This must be considered when evaluating prescription volume.

9
• The model depicts the prescription processing elements of a pharmacy. It does not include other activities that the pharmacist may participate in daily (e.g., counseling on over-the-counter products, answering questions via the telephone, purchasing and inventory control).
The model was verified by the owner of the modeled pharmacy and an expert panel. The panel consisted of three pharmacists who have extensive experience with community pharmacy. The panel verified that the computer simulation represented the observed independent pharmacy and was working correctly (e.g., the prescriptions were going to the correct place). Model Analysis After the model was deemed appropriate by the expert panel, one-week simulation runs for different prescription volumes using manual counters (technicians) and the three dispensing technologies were conducted. The model was run at prescription volumes of 127, 175, 225, 300, 350, and 425 per day (10-hour day). The data from the simulation reports were analyzed to report service rates, a measure of productivity. Descriptive statistics were generated to provide mean queue times, percent utilization of resources, and prescription processing times. Results Description of Independent Pharmacy As outlined above, data for several variables were collected from an independent pharmacy. The distributions of arrivals for each day of the week are presented in Appendix C. Based on the graphs, it is evident that Monday has the highest peaks. All five days had peaks and valleys for prescription arrival rates. The arrival of prescriptions on Friday afternoon was less than expected. One explanation for the low arrival rate is the location of the pharmacy in a building with pediatrician offices. It is likely that there are less scheduled appointments in these offices on Friday afternoons; thereby decreasing prescription volume in the pharmacy. The mean times for the other variables are listed in Table 1.
Table 1: Mean Time for Variables Used to Generate Pharmacy Simulation Variable Mean
Time to enter new prescription 152 seconds Time to enter refill prescription 102 seconds
Time to fill prescription 132 seconds Time prescriptions spend in the queue 786 seconds
(13 minutes and 6 seconds) Time for prescription processing 328 seconds
(5 minutes and 28 seconds) Counseling Time
(for new prescriptions) 40 seconds
It is important to note that the time to enter prescription includes the time necessary to submit prescriptions electronically. Although some prescriptions can be entered at a faster rate than the average, some prescriptions require time to change insurance information, change personal data,
10
resubmit due to modem problems, etc. However, the average time presented here does not take into consideration third-party problems (e.g., drug not on formulary, invalid birthday) and prescribing problems (e.g., need refill authorization, missing information on prescription) that must be corrected to continue entering the prescription. It was estimated that 10% of prescriptions filled in the model pharmacy have some problem that needs to be resolved, taking an average of 90 seconds to resolve. The average time the prescription was in the queue (i.e., waiting to be inputted into the computer) was over 13 minutes. This time represents the average time for all prescriptions, including the refills called in during the morning but not filled until later in the day. For clients who dropped off their prescription and waited for it, the average time in the queue was 1 minute and 30 seconds. For clients who were not waiting, the time in the queue was over 30 minutes. The time for prescription processing includes the total time; from time of computer entry to time of final check. This average time includes all prescriptions, with or without problems. In the model pharmacy, each client with a new prescription was counseled. The pharmacist spent approximately 40 seconds counseling on a new prescription. Because OBRA ’90 requires pharmacists to counsel on every new prescription, this variable was included in the computer simulation. The staffing level consisted of one pharmacist, one or two technicians, and one clerk in the prescription area. There were two computer terminals and one cash register. In this pharmacy, the pharmacist was the primary prescription order-entry person. When the pharmacist was being utilized, the technician would enter the prescription. The computer simulation was modeled so that both the pharmacist and technician enter orders, with the pharmacist being primary and the technician being secondary. However, based on state law, having the technician enter prescriptions and perform more duties should be considered. Simulation The simulation was created as explained in the methods section. A picture of the model is presented in Appendix D. To estimate productivity savings, service rates were calculated using different automation technologies at various prescription volumes. See Table 2 for the service rates. Each service rate was measured by dividing the total service time by the total number of prescriptions filled. The results suggest that automated dispensing technologies improve service rates, particularly as prescription volume increases. Thus, it is concluded that automation has the potential to improve productivity. At daily prescription volumes less than 200, automation improves service rates, given the same amount of staffing. With one pharmacist, one technician, and one clerk dispensing 127 prescriptions per day, it is more efficient to hire another technician than to add a dispensing technology. With one pharmacist, two technicians, and one clerk, filling 127 or 175 per day, adding technology provides little benefit with respect to service rates. The results indicate that automation improves service rates, but does not replace any staff (pharmacist/technician).
11
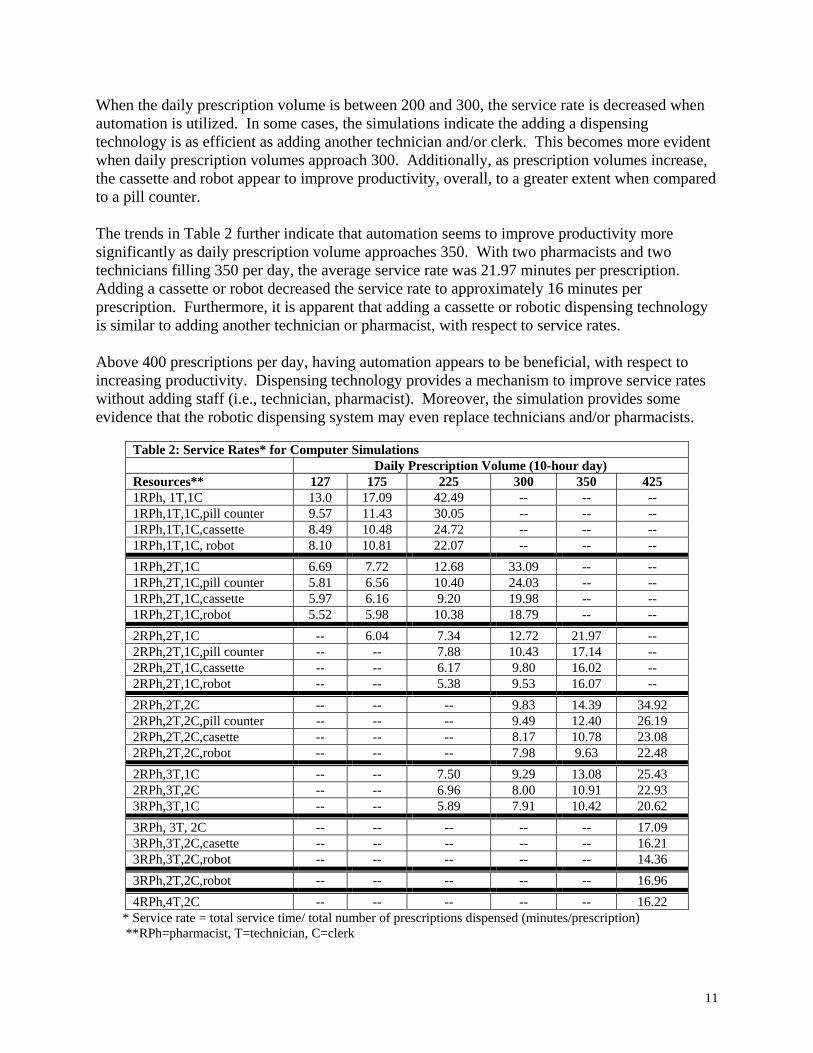
When the daily prescription volume is between 200 and 300, the service rate is decreased when automation is utilized. In some cases, the simulations indicate the adding a dispensing technology is as efficient as adding another technician and/or clerk. This becomes more evident when daily prescription volumes approach 300. Additionally, as prescription volumes increase, the cassette and robot appear to improve productivity, overall, to a greater extent when compared to a pill counter. The trends in Table 2 further indicate that automation seems to improve productivity more significantly as daily prescription volume approaches 350. With two pharmacists and two technicians filling 350 per day, the average service rate was 21.97 minutes per prescription. Adding a cassette or robot decreased the service rate to approximately 16 minutes per prescription. Furthermore, it is apparent that adding a cassette or robotic dispensing technology is similar to adding another technician or pharmacist, with respect to service rates. Above 400 prescriptions per day, having automation appears to be beneficial, with respect to increasing productivity. Dispensing technology provides a mechanism to improve service rates without adding staff (i.e., technician, pharmacist). Moreover, the simulation provides some evidence that the robotic dispensing system may even replace technicians and/or pharmacists.
Table 2: Service Rates* for Computer Simulations Daily Prescription Volume (10-hour day) Resources** 127 175 225 300 350 425 1RPh, 1T,1C 13.0 17.09 42.49 -- -- -- 1RPh,1T,1C,pill counter 9.57 11.43 30.05 -- -- -- 1RPh,1T,1C,cassette 8.49 10.48 24.72 -- -- -- 1RPh,1T,1C, robot 8.10 10.81 22.07 -- -- -- 1RPh,2T,1C 6.69 7.72 12.68 33.09 -- -- 1RPh,2T,1C,pill counter 5.81 6.56 10.40 24.03 -- -- 1RPh,2T,1C,cassette 5.97 6.16 9.20 19.98 -- -- 1RPh,2T,1C,robot 5.52 5.98 10.38 18.79 -- -- 2RPh,2T,1C -- 6.04 7.34 12.72 21.97 -- 2RPh,2T,1C,pill counter -- -- 7.88 10.43 17.14 -- 2RPh,2T,1C,cassette -- -- 6.17 9.80 16.02 -- 2RPh,2T,1C,robot -- -- 5.38 9.53 16.07 -- 2RPh,2T,2C -- -- -- 9.83 14.39 34.92 2RPh,2T,2C,pill counter -- -- -- 9.49 12.40 26.19 2RPh,2T,2C,casette -- -- -- 8.17 10.78 23.08 2RPh,2T,2C,robot -- -- -- 7.98 9.63 22.48 2RPh,3T,1C -- -- 7.50 9.29 13.08 25.43 2RPh,3T,2C -- -- 6.96 8.00 10.91 22.93 3RPh,3T,1C -- -- 5.89 7.91 10.42 20.62 3RPh, 3T, 2C -- -- -- -- -- 17.09 3RPh,3T,2C,casette -- -- -- -- -- 16.21 3RPh,3T,2C,robot -- -- -- -- -- 14.36 3RPh,2T,2C,robot -- -- -- -- -- 16.96 4RPh,4T,2C -- -- -- -- -- 16.22
* Service rate = total service time/ total number of prescriptions dispensed (minutes/prescription) **RPh=pharmacist, T=technician, C=clerk

12
It is not only important to analyze service rates, but it is important to assess the effect of dispensing technologies on the other output variables. Given daily prescription volumes of 127, 225, and 350, Tables 3, 4, and 5, respectively, provide the queue times, percent utilization of resources, and service rate information for several simulations. Overall, the data demonstrate that dispensing technologies not only influence the service rate, but also the queue times, pharmacist/technician utilization, and prescription processing times. These results provide evidence that prescription processing time (i.e., average minutes the prescription is in operation) is decreased when dispensing technologies are used. However, the three technologies included in the simulation do not decrease the "to be entered queue" time (i.e., the time the prescription spends in the queue waiting to be inputted into the computer). Thus, it is important to have adequate staff to service each customer and enter prescription orders. For example, at prescription volumes near 125 daily, adding a second technician is more efficient than adding automation. A second technician decreases the "to be entered queue" and therefore improves the service rate. As prescription volumes increase, automation has the potential to reduce the time pharmacists and technicians spend dispensing prescriptions. For example, at prescription volumes near 225 per day, the pharmacist is spending approximately 75% of his/her time filling prescriptions (see Table 4). Adding cassette or robot- type technology frees up the pharmacist's time both directly and indirectly. These technologies also free up the technician's time, which then allows the technician to perform other activities and indirectly reduce the utilization of the pharmacist in filling a prescription. Adding a second pharmacist reduces the service rate (even more than adding a dispensing technology) and allows each pharmacist to be utilized approximately 60% of the time filling prescriptions. Adding dispensing technology to a staff of two or more pharmacists is feasible. This should be considered as prescription volume continues to increase. In the simulations where daily prescription volume was 350 (see Table 5), it was demonstrated that the cassettes and robots decrease processing time, decrease the utilization of the pharmacist and technician in filling prescriptions, and decrease the "to be filled queue". Economic Considerations The results from the computer simulation runs indicate that dispensing technologies improve productivity, especially as daily prescription volume increases. Equally important is the cost of adopting the technology to realize the increase in productivity. Thus, the investigators evaluated the economic impact of adopting the use of technology in community pharmacy. The pill counter seemed to improve productivity most significantly at lower prescription volumes. The cost of this type technology is approximately $5,000 which is a minimal investment. This cost is less than hiring another technician for one year. However, the pill counter does not free up pharmacist/technician time significantly and does not replace a pharmacist or technician. At larger prescription volumes, other forms of automation may be a better investment.

13
Table 3: Output for One-Week Simulation Runs, Based on Daily Prescription Volume of 127 127 Rx/day* (total of 639/week) RESOURCES
OUTPUT
1Pharmacist 1Technician 1Clerk
1Pharmacist 2Technicians 1Clerk
1Pharmacist 1Technician 1Clerk 1 Pill Counter
1Pharmacist 2Technicians 1Clerk 1 Pill Counter
Queue (Q) Times: Minutes per entry Counter Q 0.05 0.06 0.05 0.05
To be entered Q 2.40 0.32 1.06 0.16 To be filled Q 2.42 0.12 1.10 0.07
Resources: % Utilization Pharmacist 59% 49% 55% 48%
Technician 1 50% 32% 56% 27% Technician 2 32% 27%
Clerk 39% 37% 38% 37% Pill Counter 11% 11%
Prescription Processing Variables Average Minutes Rx in Operation 3.91 3.98 3.39 3.43
Service Rate**: (avg min/Rx) 13.00 6.69 9.57 5.81 *10-hour day, 5 days a week **Service rate= total service time/total number of prescriptions filled
Table 4: Output for One-Week Simulation Runs, Based on Daily Prescription Volume of 225 225 per day* (total of 1127/week) RESOURCES
OUTPUT
1 Pharmacist 2 Technicians 1Clerk
1 Pharmacist 2 Technicians 1Clerk 1 Cassette
2 Pharmacist 2 Technicians 1Clerk
2 Pharmacists 2 Technicians 1Clerk 1 Cassette
Queue (Q) Times: Minutes per entry Counter Q 0.10 0.09 0.08 0.06
To be entered Q 4.18 3.36 1.24 0.86 To be filled Q 0.44 1.05 0.09 0.07
Resources: % Utilization Pharmacist 1 75% 70% 57% 56% Pharmacist 2 53% 49% Technician 1 64% 55% 47% 41% Technician 2 64% 55% 47% 41%
Clerk 60% 57% 55% 54% Cassette 11% 11%
Prescription Processing Variables Average Minutes Rx in Operation 3.97 3.25 3.89 3.21
Service Rate**: (avg min/Rx) 12.68 9.20 7.34 6.17 *10-hour day, 5 days a week ** Service rate=total service time/total number of prescriptions filled
14
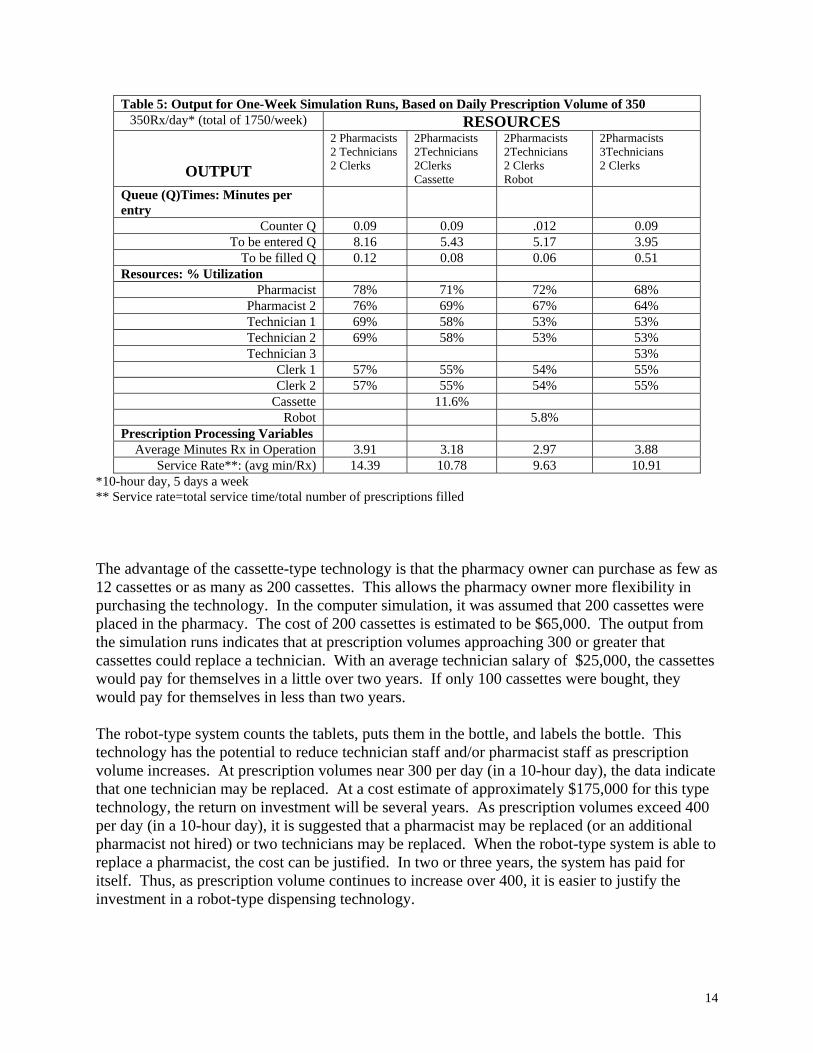
Table 5: Output for One-Week Simulation Runs, Based on Daily Prescription Volume of 350 350Rx/day* (total of 1750/week) RESOURCES
OUTPUT
2 Pharmacists 2 Technicians 2 Clerks
2Pharmacists 2Technicians 2Clerks Cassette
2Pharmacists 2Technicians 2 Clerks Robot
2Pharmacists 3Technicians 2 Clerks
Queue (Q)Times: Minutes per entry
Counter Q 0.09 0.09 .012 0.09 To be entered Q 8.16 5.43 5.17 3.95
To be filled Q 0.12 0.08 0.06 0.51 Resources: % Utilization
Pharmacist 78% 71% 72% 68% Pharmacist 2 76% 69% 67% 64% Technician 1 69% 58% 53% 53% Technician 2 69% 58% 53% 53% Technician 3 53%
Clerk 1 57% 55% 54% 55% Clerk 2 57% 55% 54% 55%
Cassette 11.6% Robot 5.8%
Prescription Processing Variables Average Minutes Rx in Operation 3.91 3.18 2.97 3.88
Service Rate**: (avg min/Rx) 14.39 10.78 9.63 10.91 *10-hour day, 5 days a week ** Service rate=total service time/total number of prescriptions filled The advantage of the cassette-type technology is that the pharmacy owner can purchase as few as 12 cassettes or as many as 200 cassettes. This allows the pharmacy owner more flexibility in purchasing the technology. In the computer simulation, it was assumed that 200 cassettes were placed in the pharmacy. The cost of 200 cassettes is estimated to be $65,000. The output from the simulation runs indicates that at prescription volumes approaching 300 or greater that cassettes could replace a technician. With an average technician salary of $25,000, the cassettes would pay for themselves in a little over two years. If only 100 cassettes were bought, they would pay for themselves in less than two years. The robot-type system counts the tablets, puts them in the bottle, and labels the bottle. This technology has the potential to reduce technician staff and/or pharmacist staff as prescription volume increases. At prescription volumes near 300 per day (in a 10-hour day), the data indicate that one technician may be replaced. At a cost estimate of approximately $175,000 for this type technology, the return on investment will be several years. As prescription volumes exceed 400 per day (in a 10-hour day), it is suggested that a pharmacist may be replaced (or an additional pharmacist not hired) or two technicians may be replaced. When the robot-type system is able to replace a pharmacist, the cost can be justified. In two or three years, the system has paid for itself. Thus, as prescription volume continues to increase over 400, it is easier to justify the investment in a robot-type dispensing technology.
15
Discussion It is evident that automation can be beneficial to community pharmacies. Depending on the goals of the pharmacy owner, automation can be used to free up pharmacist time for other patient care activities, to reduce service rates, or to maintain service rates without adding staff. When deciding whether to purchase a type of automation, it is necessary to consider what is the purpose of the automation. Are you trying to reduce staff? Are you having trouble finding a pharmacist due to the shortage and looking for dispensing technology to reduce the number of pharmacists needed? Are you trying to replace a technician? Are you wanting to free-up pharmacist time to provide more patient care services? Are you trying to improve service delivery time with the current staff? All of this must be considered when deciding to purchase a dispensing automation. The computer simulation results provide insight into when dispensing technologies should be considered. Some dispensing technologies simply speed up the "counting" process, where other technologies count the tablets, put them in a bottle, and label the bottle. As expected, these different automated systems vary in price. Each pharmacy owner must consider his/her store characteristics and purpose of automating when deciding whether to invest in technology. Given the results from the pharmacy simulation, some recommendations are provided below. These recommendations are general and should be used as guidelines only. The daily prescription volumes are based on a 10-hour day. Also, it is important to reiterate that the computer simulation assumed that all prescriptions were counted. Thus, at daily prescription volumes of 200, one must consider what percent of the 200 will not need to be counted. This adjustment should be considered when interpreting the recommendations. Prescription volume less than 200 per day: At daily prescription volumes less than 200, automated dispensing systems are probably not needed. A pill counter is the most feasible option because it does improve service rates for a relatively small investment. Prescription volume between 200 and 300 per day: When the daily prescription volume ranges from 200-300, the decision to automate significantly depends on the purpose of the automation. It is better to have two pharmacists and no automation than 1 pharmacist with automation. Having two pharmacists provides time for the pharmacist to provide other services as well as reduces service rates. However, as the prescription volume approaches 300, adding automation to the existing staff is a viable option to reduce service times and free up pharmacist time. At volumes close to 300, it is not likely that the automation will replace a pharmacist. However, replacing a technician is possible. Thus, when choosing a dispensing technology in this situation, it is important to consider cost. When replacing a technician (or not hiring an additional one), the cassette-type technology can be justified. Prescription volume between 300 and 400 per day: At prescription volumes averaging 350 per day, the results indicated that dispensing technologies improve productivity. Moreover, the technology will replace at least one technician if not two. This replacement depends on the purpose of adopting the technology. Using cassettes or robots in community pharmacy should be seriously considered. Again, the cassette-type technology provides a cost advantage.
16
Prescription volumes greater than 400 per day: Automation is clearly beneficial at daily prescription volumes of 400 or more. Pharmacists should consider adopting the use of dispensing technologies similar to cassettes or robotics. These technologies appear to decrease the service rate, free up pharmacist and technician time, and reduce staff needs. The robot automation begins to appear cost-effective at prescription volumes greater than 400. The simulation runs indicate that the robot-type technology may replace a pharmacist, making this technology more economically feasible. Limitations The primary limitations to this study are the assumptions previously discussed. Thus, when using the model, it is important to consider how these assumptions would affect the outcomes. Moreover, there was limited data to build the model. One-week runs are not as valid as one-month or even one-year runs. The model also fails to accommodate a second cash register, increased space needed for increased staff/automation, and other workflow considerations that are necessary as prescription volumes increase. Additionally, there are many other technologies that community pharmacists can utilize that this study did not evaluate. Conclusions The pharmacy computer simulation is a useful model to study the impact of automation on prescription dispensing. The results of the study substantiate the claim that automation improves productivity and decreases utilization of pharmacist/technician time in the prescription-dispensing process. However, an adequate staff of pharmacists and technicians is needed to wait on customers, enter and check prescriptions, and counsel patients. The three dispensing technologies included in this study do not improve all areas of service delivery. As prescription volumes increased, it became more evident that automated dispensing is beneficial. The model was able to demonstrate that automated dispensing technologies could free up technician time, which indirectly frees up pharmacist time. This time could then be spent on other activities, besides dispensing. The automation improves service rates and was able to replace staff or prevent the hiring of additional staff. Each pharmacist must assess what his/her purpose is for adopting the use of automated dispensing technologies. Understanding the purpose will provide further insight into what type of technology is needed for a particular pharmacy. Furthermore, cost must be considered. The cassette-type technology can be economically justified at lower prescription volumes. The robot-type technology is of greater value when prescription volumes are greater than 400. Acknowledgements Park West Pharmacy, Little Rock, Arkansas Smith Caldwell Drugstore, Benton, Arkansas Gibson Merchandise Group, Inc., Longview, Texas

17
References ----(1998). Automation is prescription for revamping services at North Carolina hospital. Health Care Cost Reengineering Representative 3(4): 53-56 Barker K, Felkey B, Flynn E, and Carper J (1998). White Paper on Automation in Pharmacy. Available at <http://www.ascp.com/public/pubs/tcp/1998/mar/feature2.shtml>, Accessed August 2, 2000. Dankmyer T (1999) NCPA Embraces On-line Solution. America's Pharmacist, 121(8), 21-23. Helling DK (2000). Implementing Yesterday's Promises. American Journal of Health-System Pharmacy, 57(6): 576-581. Huffman DC (editor) (1999). NCPA-Searle Digest. National Association of Community Pharmacists, Alexandria, VA. Krajewski L J and Ritzman LP (1990). Operations Management: Strategy and Analysis. (2nd ed.). Reading, MA: Addison-Wesley Publishing Co. Maryanski F (1980). Digital Computer Simulation. Rochelle Park, NJ: Hayden Book Company, Inc. NACDS, APhA, NCPA (1999). Implementing Effective Change in Meeting the Demands of Community Pharmacy Practice in the United States. White Paper, August 1999. Pinto D (editor) (2000). Advancing the Cause of Community Pharmacy. Chain Drug Review, July 17, 2000, pg 69. Reilly TA (1978). A Delay-Scheduling Model for Patients Using a Walk-In Clinic. Journal of Medical Systems, 2(4), 303-313. ScriptPro (2000). Customer Profile. Available at <http://www.scriptpro.com/profiles>, Accessed August 2, 2000. West D (2000). On-line Pharmacies: Implications for the Future. Drug Topics. 2000; 144(9): 83-92. West D (1997). Information Technologies in Community Pharmacy Practice, Thesis, University of Mississippi.

18
Appendix A
Diagram of Modeled Independent Pharmacy

19

20
Appendix B
Flowchart for Modeled Independent Pharmacy

21
22
Appendix C
Distribution of Arrivals for Modeled Independent Pharmacy

23

24

25
26
Appendix D
Display of Computer Simulation

27