An Economic Assessment of the Impact of HIV/AIDS on the ... · An Economic Assessment of the Impact...
52
An Economic Assessment of the Impact of HIV/AIDS on the KZN Economy and Its People Sectoral Impact Assessment Report October 1 2007 by Prof. Jeff Gow Health Economist and HIV/AIDS Researcher, HEARD, University of KwaZulu-Natal, Durban Mr. Gavin George HIV/AIDS Researcher, HEARD, University of KwaZulu-Natal, Durban Prof. Tim Quinlan Research Director HEARD, University of KwaZulu-Natal, Durban Dr. James Thurlow Postdoctoral Fellow International Food Policy Research Institute, Washington DC, U.S.A.
Transcript of An Economic Assessment of the Impact of HIV/AIDS on the ... · An Economic Assessment of the Impact...

An Economic Assessment of the Impact of HIV/AIDS on the KZN Economy and Its
People
Sectoral Impact Assessment Report October 1 2007
by
Prof. Jeff Gow
Health Economist and HIV/AIDS Researcher, HEARD, University of KwaZulu-Natal, Durban
Mr. Gavin George
HIV/AIDS Researcher, HEARD, University of KwaZulu-Natal, Durban
Prof. Tim Quinlan Research Director
HEARD, University of KwaZulu-Natal, Durban
Dr. James Thurlow Postdoctoral Fellow
International Food Policy Research Institute, Washington DC, U.S.A.
i
Contents i Authors iii Acknowledgements iii Executive Summary iv CHAPTER ONE INTRODUCTION 1 1.1 Aim of the Study 1 1.2 Study Report 1 1.3 Methodology 1 1.4 Region, Industry, Sector and Company Selection 3 CHAPTER TWO LITERATURE REVIEW 5 2.1 Introduction 5 2.2 Regional, Industry and Sectoral Economic Activity 5 2.3 Economic Impacts 14 CHAPTER THREE METHODOLOGY 20 3.1 Economic Impact Channels 20 3.2 The CGE Model 24 CHAPTER FOUR RESULTS AND ANALYSIS 27 4.1 Results and Analysis 27 4.2 Conclusions 37 REFERENCES 38 APPENDIX 41

ii
Figures 2.1 Employment Trends, March 2001 to March 2007 (South Africa) 6 2.2 Unemployment and discouraged work-seekers, March 2001 to March 2007 (South Africa) F 7 3.1 Demographic composition of household income groups in KZN, 2000 21 4.1 Change in average annual industry growth rates, 2002-2025 31 4.2 Regional growth incidence curves, 2002-2025 32 4.3 Channels’ impact on average GDP growth, 2002-2025 34 4.4 Channels’ impact on final year poverty rate, 2025 36
Tables 2.1 Employment by industry, March 2007 (South Africa) 7 2.2 Unemployment Rate by Gender and Population Group, March 2007 (South Africa) 8 2.3 KZN Employment by Municipality and Selected Industries, 2004 9 2.4 Workers by Industry, KZN, 2006 9 2.5 Workers by Gender and Industry, KZN, 2006 10 2.6 Male Workers by Race and Industry, KZN, 2006 10 2.7 Female Workers by Race and Industry, KZN, 2006 11 2.8 The projected impact of HIV/AIDS on the South African labour force 17 2.9 Summary of Macroeconomic Projections: No-AIDS vs. AIDS: No ART (% per annum) 18 2.10 Comparison with previous HIV/AIDS studies for South Africa 19 4.1 Growth and poverty results, 2002-2025 28 4.2 Labour market results, 2002-2025 29 4.3 Contribution of channel to change in growth and poverty rate 32
iii
Authors The researchers responsible for the collection of data, data analysis and preparation of this written report were Professor Jeff Gow, Health Economist and HIV/AIDS Researcher, Mr Gavin George, HIV/AIDS Researcher and Prof. Tim Quinlan, Research Director, HEARD, University of KwaZulu-Natal, Durban and Dr James Thurlow, Post Doctoral Fellow, IFPRI, Washington, USA.
Acknowledgements Many people and organisations assisted in the production of this report. Company representatives, chamber of commerce and industry organisations representatives, municipal and provincial government representatives and independent economic analysts both business and academic, contributed either information reference material or data. They then reviewed a first draft of the report and provided many useful insights and corrected inaccuracies before publication of this State of the Environment report. To all of those people listed below we thank you for your efforts. We would like to acknowledge the assistance of the following people in the production of this report: Nisaar Mohammed, Ranaveer Persad, Gareth Coleman, Kambale Kavese, Jabulile Madondo, Seelan Naicker, Yasmin Khan, Shunnon Tulsiram, Russell Curtis, Nicholas Mncube, Mabuyi Mnguni, Hennie Smit, Helen Ludwig, Garth Macartney, Andrew Layman, Phili Mkhize, Penny Milner-Smyth, Lindani Dhlomo, Claude Moodley, Paul Crowther, James Seymour, Lisa Brink, Gerrard Patzer, Justin Barnes, Rob Stewart, Clive Coetzee, Eugene de Beer, Graham Muller, Claude van der Merwe, Mark Colvin, Alan Matthews, Nicoli Nattrass, Kwame Owusu-Ampomah, Markus Haacker, Jocelyn Vass, Miriam Altman, John Stover and Steven Forsythe.

iv
EXECUTIVE SUMMARY Introduction The aim of the study was to estimate the macroeconomic impacts of a given level of HIV infection on of four prominent industries of the KZN provincial economy. Drawing on a new survey of HIV prevalence amongst workers in KZN firms, we developed a population/demographic model to capture the effects AIDS on workers across different occupations. An economic model was then used to estimate and describe the extent to which certain demographic shocks caused by AIDS are affecting economic growth and poverty reduction in KZN. The results from the population/demographic model were then linked to a CGE-microsimulation (CGE) economic model. In short, the CGE-microsimulation model is an advance over previous methodologies as it captures the detailed industry structure of South Africa’s economy and the linkages between producers and households in order to estimate the impact of AIDS on both growth and poverty. The CGE model exogenously captures a number of transmission mechanisms linking AIDS to growth and poverty. These include (i) changes in household populations and national demographic structure due to increased mortality; (ii) shifts in the level and skill-composition of labour supply; (iii) falling labour productivity due to morbidity; (iv) falling total factor productivity associated with systemic shocks to the economy; and (iv) changes in household health spending and savings behaviour. The model also endogenously captures other mechanisms, such as changes in public savings and its impact on investment and capital accumulation. Although not exhaustive, these transmission mechanisms provide a reasonable approximation of the main impacts of AIDS on growth, poverty and inequality. Key Results and Discussion Based on the demographic models’ projections, HIV/AIDS reduces KZN’s overall population growth rate from an average 1.85% during 2002-2025 under the Without AIDS scenario to 0.79% under the With AIDS scenario. This is larger than the decline in the population growth rate in RSA, reflecting the higher HIV prevalence rate in KZN. Similarly, the declines in population growth rates amongst the African population are substantially larger than for other racial groups due to higher prevalence amongst Africans. Declines in the labour supply are larger than declines in population growth rates in both regions. For example, the population growth rate falls by 1.06% in KZN whereas the employment growth rate falls by 1.12%. This reflects the concentration of HIV infections amongst working age adults. Since employment growth exceeds population growth, the dependency ratio falls slightly from 5.05 under the With AIDS scenario to 4.98 under the Without AIDS scenario. Much of this decline is driven by African households, whose lower-skilled workers have higher prevalence rates and are thus most heavily affected by HIV/AIDS. The results also indicate that while the detrimental growth-effect is large, the impact of HIV/AIDS on regional poverty headcounts is relatively small and that inequality would be higher in the absence of HIV/AIDS. In fact, the absolute number of poor people in KZN would be higher by 662,000 people in 2025. However, the population/demographic model also predicts
v
that 11.8 million people will die of HIV/AIDS in South Africa during 2002-2025, of which over 3 million will be in KwaZulu-Natal. High HIV prevalence and a larger proportion of AIDS sick people explains why HIV/AIDS has a more negative effect on labour productivity in KZN than in the rest of the country. While labour productivity is assumed to continuing growing at 1.8% under the With AIDS scenario, this is below the 1.92% annual growth that would have been achieved in the absence of AIDS-related morbidity and absence from work. This is slightly higher than the potential productivity growth of 1.88% in RSA. Declines in productivity are particularly pronounced for lower-skilled African workers, for whom HIV prevalence is particularly high. The impact of HIV/AIDS differs across industries and regions. Despite HIV/AIDS having a more detrimental effect on certain industries in RSA, most industries are more severely affected by HIV/AIDS in KZN than elsewhere in the economy. This is especially true for agriculture in KZN, where the AIDS survey and demographic model predict especially high HIV prevalence rates. This also has downstream implications for food processing in the province, which is also negatively affected as a result. Although the model does not capture rural-urban differences, the large increase in GDP growth rates for agriculture under the Without AIDS scenario suggests that HIV/AIDS impacts are likely to be more severe in rural areas. The results from this economic model indicate a significant decline in both GDP and per capita GDP as a result of HIV/AIDS. The model results indicate that the share of investment in GDP is 2.1% lower under the With AIDS scenario than under the Without AIDS scenario. While most of this decline in investment is due to the slowdown in economic growth caused by HIV/AIDS, about 28% of the decline results from lower savings rates amongst households. By 2025, the KZN economy will be 43% smaller than it could have been were it not for HIV/AIDS. Similarly, the rest of the country’s economy will be 37% smaller by 2025. The impact of HIV/AIDS on income poverty is small. In the absence of HIV/AIDS, the incidence of poverty (or the poverty headcount) would be slightly lower in RSA (i.e., 9.51 under the Without AIDS scenario compared to 10.50 under the With AIDS scenario). Furthermore, in KZN, the incidence of poverty would be slightly higher in the absence of HIV/AIDS. Declines in wages are particularly pronounced for lower-skilled African workers, whose wage growth rate falls from 2.63% per year under the With AIDS scenario to 1.86% year under the Without AIDS scenario. By contrast, wages for higher-skilled workers benefit more from faster economic growth and their growth rates accelerate. Thus, the structural constraints that are already contributing to high unemployment in South Africa would remain even in the absence of HIV/AIDS. The model results therefore indicate that KZN and the rest of South Africa would continue to become more capital and skill-intensive, even if the supply and productivity of lower-skilled workers was not being undermined by HIV/AIDS.

- 1 -
CHAPTER ONE INTRODUCTION 1.1 Aim of the Study The aim of this study was to estimate the economic impacts of a revealed level of HIV infection on the KwaZulu-Natal (KZN) provincial economy. This was done via an innovative method of using HIV prevalence data from four industries in the economy to extrapolate the impacts throughout the economy. 1.2 Study Report This study report is structured as follows. In the rest of Chapter One, the actual approach to this study is explained, introducing the basic model developed to undertake the analysis, and describing the sources of the data used. In Chapter Two, the economic literature on the regional, industry, sectoral and macro economic impacts of HIV/AIDS is reviewed and discussed in the context of South Africa. In Chapter Three the methodology to estimate the economic impacts using a computable general equilibrium (CGE) economic model are laid out. Chapter Four contains the results and analyses the impacts at three levels. Additionally, the policy implications of the impacts are canvassed. 1.3 Methodology The methodology used for the economic analysis is briefly outlined here. A more detailed explanation is found in Chapter Three. Economic Impacts There are negative economic impacts arising at the individual, household, company, industry, sector and government levels of a given level of HIV infection. Individual/Household Income and Expenditure: HIV progressively reduces household income through increasing levels of illness and ultimately can totally reduce household income to zero through death. Household expenditure patterns also change as a result of HIV illness. Health care expenditure increases, often quite dramatically. This precipitates reduced expenditure on a whole range of other household items like food, clothing and education. Saving rates are reduced and total savings are also reduced as a result of drawing down these for health care expenditure. Investment in future household needs like housing and education of children are reduced. In very low income households it has been shown that increased health care expenditures can result in the destruction of the household following the death of parents (Gow and Desmond, 2002). Company Performance: productivity is negatively affected by increased levels of HIV infection. Individual workers who are ill are less productive and without treatment HIV results in AIDS and increased levels of illness and ultimately death are experienced. Declining labour productivity results from the changing structure of the workforce and the reduction in the level of

- 2 -
experience of the remaining workers. When skilled workers are ill or die the loss of their skills result in a strongly negative impact on productivity (van den Heever, 2003). If those skills are in short supply then the losses will be exacerbated. This total factor productivity negative impact is added to by the direct and indirect cost increases that result from illness and death. Company Expenditure and Revenue: company revenue is decreased by reduced productivity of workers and the loss of skills. Expenditure increases are the result of both direct costs to business and indirect costs. Company direct cost increases include increased levels of contributions to worker pension, life, disability and medical benefit schemes. Indirect costs as a result of firms having increased absenteeism, presenteeism, increased recruitment, training and sick pay expenditures. Government Revenue and Expenditure: the loss of employees to HIV illness and death results in lost taxation revenue. This impact is minimised if employees are easily replaced from the pool of unemployed. However, as the skill level and therefore associated productivity of workers increases, the associated income and taxation contribution also increase. Given the skill shortage in South Africa and because HIV infects all job bands, higher levels of HIV will adversely affect government taxation revenue. Expenditure by government is increased primarily through increased health care expenditures. Government is also adversely affected by increased expenditure on its own employees. Economic Impact Channels The economic assessment of the impacts of HIV/AIDS accounts for not only households but also the other actors and institutions in an economy, such as firms, markets and government. However, broadening our analysis to account for these more macro level impacts necessitates excluding certain household-level impacts, especially those relating to social and non-income factors. We identify five main channels through which AIDS impacts on economic growth and people: (i) population; (ii) labour supply; (iii) labour productivity; (iv) total factor productivity; and (v) health spending and savings. Estimation The methodology to model the economic impacts of a given level of HIV infection was a two step process. Firstly, was the estimation of the population and labour force impact. Secondly, we used the estimates of the magnitude of the labour force impact to establish the extent of the impact on demand and supply factors within an economy. The first step of the process was executed by undertaking HIV sero-prevalence surveying and incidence modelling. The HIV prevalence surveys of the participating company workforces were conceived and supervised by Mark Colvin, Specialist Scientist, CADRE, Durban. They were conducted under the supervision of Cherie Cawood, Epicentre. The projections of HIV incidence in industry workforces used in the analysis were made by Alan Matthews, Senior Lecturer, School of Pure and Applied Physics, University of KwaZulu-Natal, Durban. The HIV prevalence survey and HIV incidences were reported separately. This current report needs to be read in the context of the Colvin and Matthews reports.

- 3 -
The second step of the process used those population and labour force impacts to model the industry, sectoral, provincial and macro economic impacts of the revealed level of HIV/AIDS illness and death, over a 20 year time horizon. These impacts were presented as a With AIDS scenario and a Without AIDS scenario. It known that high HIV infection levels without widespread ARV treatment programs lowers the overall population and therefore the size of the labour force and subsequently labour force growth rates. This will negatively affect both the production side and consumption side of the economy. 1.4 Region, Sector, Industry and Company Selection Regional One of the original foundations of this study was to be the sero-prevalence sampling of companies in four economic industries located in four KZN municipal/regional economies. The four locations and their corresponding district municipalities selected were Durban/Ethekwini, Port Shepstone/Ugu, Pietermaritzburg/Umgungundlovu and Richards Bay-Empangani/ Uthungulu. These four municipal economies account for over 75% of KZN GDP. The corollary to that research was to be the analysis of a wide range of pertinent data on the provincial and the four selected municipal economies in the context of the epidemic and in relation to the development strategies of their respective governments. Given difficulties in the recruitment of companies, in that no company outside of the Durban area would participate, the geographical focus of the study became Durban and KZN. Sectors and Industries The structure of the KZN economy can be viewed by defining all activity into one of three sectors: primary, secondary and tertiary. The primary sector which includes agriculture, fishing, forestry and mining industries accounts for 7% of KZN GDP (10% in South Africa). The secondary sector comprises industries related to manufacturing, construction and the supply or distribution of electricity, gas and water and accounts for 29% of KZN GDP (23% in South Africa). In KZN, manufacturing constitutes 83% of the secondary sector. The tertiary sector comprises services including wholesale and retail trade, catering and accommodation (tourism), transport, business services, communication, finance and insurance. The tertiary or services sector is by far the largest at 53% of both the KZN and South African economies. Four industries were selected as the number to be analysed in the study. The final selection of industries was done on the basis of individual company responses to the recruitment drive conducted by CADRE and Epicentre from May 2006 to February 2007. The sero-prevalence surveys were undertaken by CADRE and Epicentre on behalf of the KZN Department of Health. The selected industries and their contributions to KZN GDP (2004) are: Agriculture (also Forestry) 4.3% R10.0b Manufacturing 21.8% R50.4b Tourism (also Trade) 12.7% R29.4b Transport (also Communication) 11.6% R26.7b

- 4 -
Companies Fourteen companies participated in the HIV testing program. Companies were not randomly selected but actively recruited. Company participation was dependent upon co-payment for the HIV testing program by participating companies. Individual employee participation was also voluntary as for companies but with no expectation of payment required from individuals if they participated. The companies who participated in the four industries are listed hereunder: Agriculture (3): Rainbow, South African Sugar Association, Horse Racing Group Manufacturing (4): Aunde, Huntsman Tioxide, Intercloth, Unilever (two sites) Tourism (3): Durban Hilton, Fedics and Natal Sharks Board Transport (4): SADC Freight, National Ports Authority, Trucks, P and O Ports. All were based in the Ethekwini district.
- 5 -
CHAPTER TWO LITERATURE REVIEW 2.1 Introduction Numerous microeconomic studies have confirmed the detrimental effects of HIV/AIDS on individuals and households, including the displacement of human and financial resources towards health care; increased vulnerability from deteriorating livelihoods; heightened stigmatism and a fragmentation of social networks; and lower investments in human capital and nutrition. These individual and household-level effects have to be aggregated to the macro level in order to estimate the overall impact of the epidemic. Furthermore, while households are directly affected by HIV/AIDS, there are also implications for the economy as a whole. A further method of analysis is to examine the industry, sectoral and spatial distribution of economic activity. One of the original foundations of this study was to be the sero-prevalence sampling of companies in four industries located in four KZN municipal/regional economies. The four locations were Durban, Port Shepstone, Pietermaritzburg and Richards Bay-Empangani. The corollary to that research was to be the analysis of a wide range of pertinent data on the provincial and the four municipal economies in the context of the epidemic and in relation to the development strategies of their respective governments. Given difficulties in the recruitment of companies the geographical focus of the study became Durban and KZN whilst still retaining the industry distribution. The influence of the impacts of HIV/AIDS on the regional economies will be commented upon in the results and implications chapter, but empirically based judgements about the exact impacts in Port Shepstone, Pietermaritzburg and Richards Bay-Empangani will be eschewed. A macroeconomic assessment of the impacts of HIV/AIDS accounts not only for individuals and households but also other actors or institutions, such as companies and government (provincial and national). However, broadening the analysis usually requires that macroeconomic studies exclude certain microeconomic impacts. It is this attempt to capture the economy-wide impact of AIDS, albeit at the expense of certain transmission channels, that distinguishes the macro and micro strands of the literature. 2.2 Regional, Industry and Sectoral Economic Activity KZN's economic activity is concentrated in three core metropolitan areas (Durban, Pietermaritzburg and Richards Bay-Empangani) in a combination of industries (in order of importance): manufacturing, tourism, transport, as well as commercial and financial services. The material in this chapter is drawn from several sources: Statistics SA publications, Quantec statistics data base, the KwaZulu-Natal Economic Review 2005 written by Graham Muller Associates, the Economic Baseline Study of Ten Districts in KwaZulu-Natal written by WFA Pty Ltd and Graham Muller Associates and the KwaZulu-Natal Review 2003-4 written by Townsend. Employment

- 6 -
KZN is home to approximately 6 million working age individuals and 3 million of these are either employed or seeking employment. This figure excludes ‘disillusioned’ workers who have given up the search for employment. More than 50% of the unemployed in KZN have been without employment for more than 3 years, suggesting that the bulk of unemployment in the province is of a long-term structural nature rather than seasonal, frictional or cyclical. Labour force participation in the province declined from 57.8% in 2000 to 51.9% in 2005 due largely to decline in the labour force participation rate of the female population. The unemployment rate was 31.7% in 2005. There were 2 125 000 workers employed in the KZN economy in 2005 while the rest of the economically active population, consisting of 987 000 labour force participants (31.7%) were officially unemployed. KZN not only has one of the highest provincial unemployment rates, but by virtue of its large economically active population, one of the largest absolute number of unemployed as well. The most recent time series estimates of employment in KZN suggest that the province shed 220 000 jobs from 2000 to 2005. Over the past decade total employment in KZN has risen by close to half a million (475000) jobs. However, estimates of employment from the more recent revised time series from the Labour Force Survey (2000-2005) are less encouraging with KZN having shed approximately 220 000 jobs from September 2000 to March 2005. The slow growth in employment and rising unemployment rates experienced are not unique to KZN and have been experienced throughout South Africa since 1995. Unemployment rates peaked from 2001 to 2003, and the unemployment rate in KZN is consistently higher than the national average. Figure 2.1 Employment Trends, March 2001 to March 2007 (South Africa)
NEA = not economically active Source: Statistics South Africa (2007)

- 7 -
Figure 2.1 indicates that the size of the labour force in South Africa has been static over the past six years. In the past three years employment has increased by almost one million people. Figure 2.2 Unemployment and discouraged work-seekers, March 2001 to March 2007 (South Africa)
Source: Statistics South Africa (2007) As shown in Figure 2.2, in March 2007, the South African unemployment rate was 25.5%, whilst in KZN it was higher at 29.2%. The number of discouraged workers has fallen as overall employment prospects have increased. Table 2.1 Employment by industry, March 2007 (South Africa) Industry Thousand % Agriculture 1 075 11.3 Mining 452 4.7 Manufacturing 1 495 15.7 Utilities 92 0.9 Construction 635 6.6 Wholesale and retail trade
1 982 20.8
Transport 438 4.6 Finance 1 265 13.3 Community and personal services
2 048 21.5
Unspecified/Other 16 0.2 Total 9 498 100.0 Source: Statistics South Africa (2007) and Quantec Research Provincial Database
- 8 -
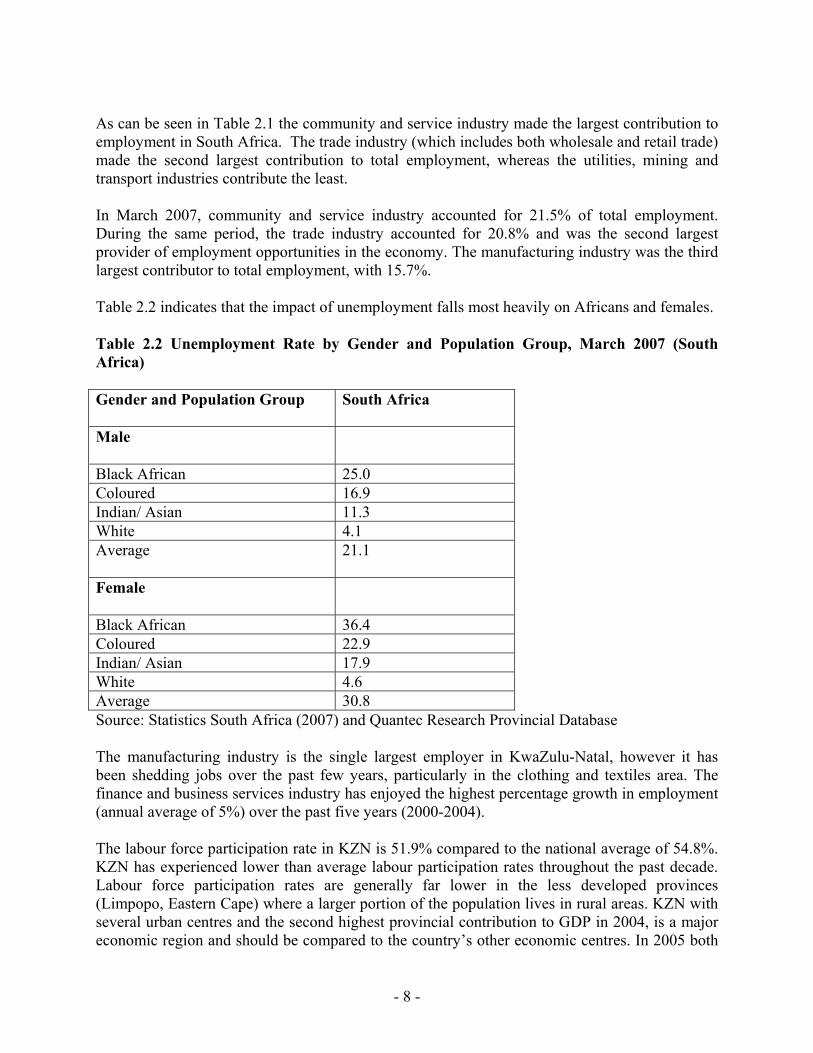
As can be seen in Table 2.1 the community and service industry made the largest contribution to employment in South Africa. The trade industry (which includes both wholesale and retail trade) made the second largest contribution to total employment, whereas the utilities, mining and transport industries contribute the least. In March 2007, community and service industry accounted for 21.5% of total employment. During the same period, the trade industry accounted for 20.8% and was the second largest provider of employment opportunities in the economy. The manufacturing industry was the third largest contributor to total employment, with 15.7%. Table 2.2 indicates that the impact of unemployment falls most heavily on Africans and females. Table 2.2 Unemployment Rate by Gender and Population Group, March 2007 (South Africa) Gender and Population Group
South Africa
Male
Black African 25.0 Coloured 16.9 Indian/ Asian 11.3 White 4.1 Average
21.1
Female
Black African 36.4 Coloured 22.9 Indian/ Asian 17.9 White 4.6 Average 30.8 Source: Statistics South Africa (2007) and Quantec Research Provincial Database The manufacturing industry is the single largest employer in KwaZulu-Natal, however it has been shedding jobs over the past few years, particularly in the clothing and textiles area. The finance and business services industry has enjoyed the highest percentage growth in employment (annual average of 5%) over the past five years (2000-2004). The labour force participation rate in KZN is 51.9% compared to the national average of 54.8%. KZN has experienced lower than average labour participation rates throughout the past decade. Labour force participation rates are generally far lower in the less developed provinces (Limpopo, Eastern Cape) where a larger portion of the population lives in rural areas. KZN with several urban centres and the second highest provincial contribution to GDP in 2004, is a major economic region and should be compared to the country’s other economic centres. In 2005 both

- 9 -
the Western Cape and Gauteng have far higher Labour Force Participation rates than KZN (both 65%). This may be explained by the fact that while KZN is a relatively developed province, it is also the most populous with a large percentage of its population living in rural areas far from the main employment nodes. Table 2.3 KZN Employment by Municipality and Selected Industries (2004)
Total
Agriculture, forestry and fishing
Manufacturing
Transport & communication
Community, social and other personal services
Others (6)
Kwazulu-Natal 1,349,186 112,760 286,610 38,175 229,980 681,661Ugu 68,210 12,393 8,483 1,154 13,472 32,708Umgungundlovu 166,214 27,268 29,329 3,210 27,682 78,725Uthukela 64,195 4,334 19,412 1,328 9,774 29,347Umzinyathi 32,933 6,876 3,324 484 5,616 16,633Amajuba 60,163 3,696 18,433 1,037 9,135 27,862Zululand 55,386 9,172 4,346 1,039 9,782 31,047Umkhanyakude 30,240 3,243 2,049 654 6,622 17,672Uthungulu 95,385 13,696 14,432 2,809 17,588 46,860iLembe 72,020 14,421 20,109 1,196 11,251 25,043Sisonke 35,763 7,950 3,513 428 5,852 18,020Ethekwini 668,677 9,711 163,180 24,836 113,206 357,744Source: Quantec Research Provincial Database The difference between employment and workers in each industry is the equivalent unemployment rate. Table 2.4 Workers by Industry, KZN, 2006 Agriculture, forestry and fishing 325,763 Mining 6,577 Manufacturing 403,902 Electricity, gas and water supply 14,677 Construction 174,433 Wholesale and retail trade 587,661 Transport, storage and communication 141,856 Financial intermediation, insurance, real estate and business services 205,674 Community, social and personal services 447,501 Total 2,308,043 Source: Statistics South Africa (2007)

- 10 -
Table 2.5 Workers by Gender and Industry, KZN, 2006 Industry Male Female Agriculture, forestry and fishing 148,140 177,623 Mining 5,482 1,095 Manufacturing 233,290 170,613 Electricity, gas and water supply 12,657 2,020 Construction 148,434 25,999 Wholesale and retail trade 307,968 279,693 Transport, storage and communication 127,442 14,414 Financial intermediation, insurance, real estate and business services 124,869 80,805 Community, social and personal services 206,281 241,219
Total 1,314,561 993,482
Source: Statistics South Africa (2007) Table 2.6 Male Workers by Race and Industry, KZN, 2006 Industry African Other Agriculture, forestry and fishing 137,138 11,002 Mining 5,482 2,159 Manufacturing 150,443 80,687 Electricity, gas and water supply 7,233 5,424 Construction 123,949 24,485 Wholesale and retail trade 199,940 108,028 Transport, storage and communication 101,767 25,675 Financial intermediation, insurance, real estate and business services 93,367 31,502 Community, social and personal services 133,600 72,681
Total 952,917 361,644
Source: Statistics South Africa (2007)
- 11 -
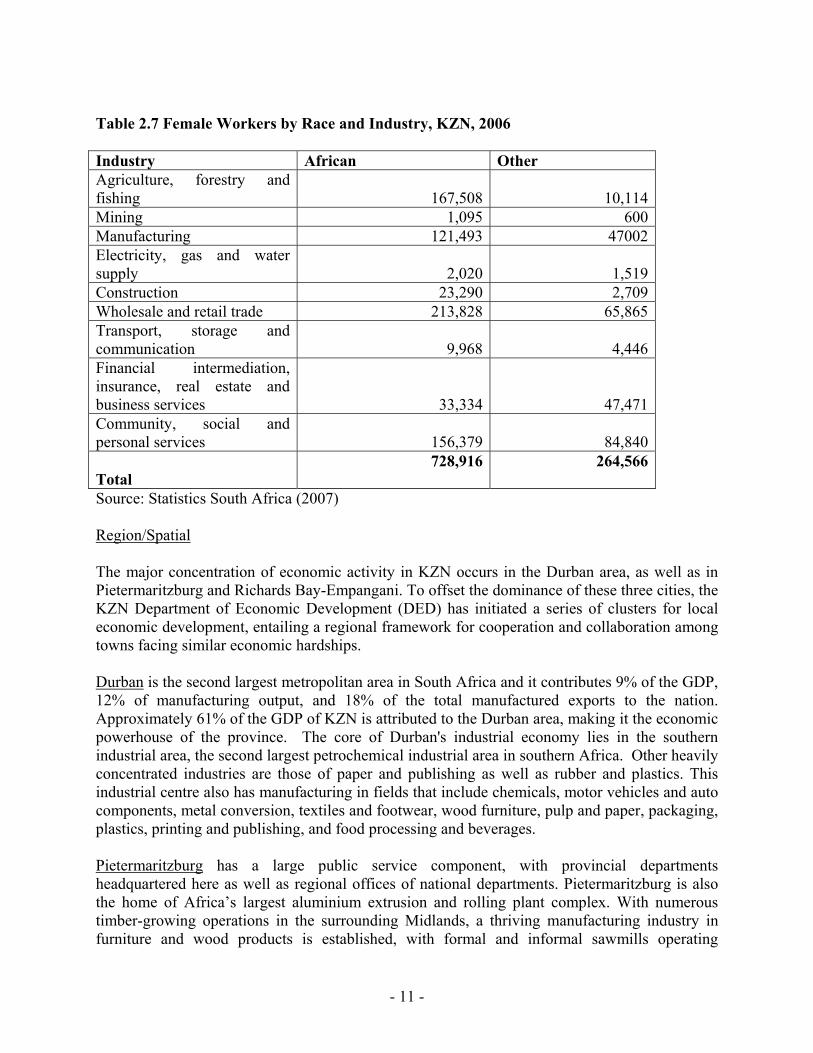
Table 2.7 Female Workers by Race and Industry, KZN, 2006 Industry African Other Agriculture, forestry and fishing 167,508 10,114 Mining 1,095 600 Manufacturing 121,493 47002 Electricity, gas and water supply 2,020 1,519 Construction 23,290 2,709 Wholesale and retail trade 213,828 65,865 Transport, storage and communication 9,968 4,446 Financial intermediation, insurance, real estate and business services 33,334 47,471 Community, social and personal services 156,379 84,840
Total 728,916 264,566
Source: Statistics South Africa (2007) Region/Spatial The major concentration of economic activity in KZN occurs in the Durban area, as well as in Pietermaritzburg and Richards Bay-Empangani. To offset the dominance of these three cities, the KZN Department of Economic Development (DED) has initiated a series of clusters for local economic development, entailing a regional framework for cooperation and collaboration among towns facing similar economic hardships. Durban is the second largest metropolitan area in South Africa and it contributes 9% of the GDP, 12% of manufacturing output, and 18% of the total manufactured exports to the nation. Approximately 61% of the GDP of KZN is attributed to the Durban area, making it the economic powerhouse of the province. The core of Durban's industrial economy lies in the southern industrial area, the second largest petrochemical industrial area in southern Africa. Other heavily concentrated industries are those of paper and publishing as well as rubber and plastics. This industrial centre also has manufacturing in fields that include chemicals, motor vehicles and auto components, metal conversion, textiles and footwear, wood furniture, pulp and paper, packaging, plastics, printing and publishing, and food processing and beverages. Pietermaritzburg has a large public service component, with provincial departments headquartered here as well as regional offices of national departments. Pietermaritzburg is also the home of Africa’s largest aluminium extrusion and rolling plant complex. With numerous timber-growing operations in the surrounding Midlands, a thriving manufacturing industry in furniture and wood products is established, with formal and informal sawmills operating

- 12 -
successfully. Commercial agriculture thrives, with head offices of primary cooperatives based here. Products include beef, dairy, sugar cane, citrus and mixed farming. Agribusiness includes manufacturing of equipment and production of crops. The economy in the Umgungundlovu municipality which encompasses Pietermaritzburg is primarily dependent upon manufacturing (22%), government services (16%), finance and business services (15%), wholesale, retail and tourism (14%), agriculture, forestry and fisheries (11%) and transport and communication (11%) (WFA, 2006). Richards Bay and Empangeni form the local municipality of Umhlatuze. It is the third most important in KZN in terms of economic production, after Durban and Pietermaritzburg. It contributes 7.6% of KZN GDP and 5.5% of formal employment. Manufacturing comprises the largest industry, followed by transport. The large-scale investments have resulted in a varied industrial base of coal terminals and aluminium smelters. Other industries include mining companies and paper mills, forestry, and production of materials handling equipment, fertiliser and specialised chemicals. The economy in the Uthungulu municipality which encompasses Richards Bay and Empangeni is dominated by large industry and the Richards Bay port. This is seen in the large role manufacturing (32%) and transport and communication (12%) play (WFA, 2006). The economy in the Ugu municipality which encompasses Port Shepstone is largely dependent upon finance and business services (16%), manufacturing (15%), government services (15%), wholesale, retail and tourism (15%) and agriculture, forestry and fisheries (13%) (WFA, 2006). The unemployment rate is high at 49% consistent with low levels of formal economic activities as evidenced by low levels of employment. Industries Agriculture – in KZN agriculture is specialised primarily on the basis of climate suitability. The coastal areas are utilised mainly for sugar cane and subtropical crops and vegetables. The south coast has banana plantations, while Hluhluwe on the north coast is known for pineapples, the Eshowe area for citrus and the Midlands for avocados. Forestry, annual crops and livestock can be found in the Midlands and northern areas, covering about 40% of the land area of KZN. The related agro-industrial or food processing industry (the largest in South Africa) sees downstream activities contributing significantly to the province’s GDP. Consisting of sugar factories, pulp and paper productions, and meat processing, among others, this subindustry of agriculture employs a large number of people. Manufacturing - is the largest industry of the KZN economy. It enjoys a comparative advantage over industry elsewhere in South Africa in terms of access to basic production inputs such as water and coal, as well as accessible marine waste disposal. Contributing to the high production figures, the major subsections in KZN’s manufacturing segment comprise the following: ♦ Basic metals ♦ Chemicals, rubber and plastics ♦ Food and beverages

- 13 -
♦ Pulp and paper products ♦ Textiles, clothing, leather and footwear Tourism - KZN is the leading tourist destination domestically, an important market that makes a significant contribution towards the economy. KZN boasts a greater diversity of resorts, people and cultures than any other province in South Africa, while also capturing a significant slice of the convention business. The focal point of the conference industry is the International Convention Centre in Durban. Major international conferences take place at the centre. The tourism industry in KZN has over recent times grown at a rate of between 5 to 8% per year. KZN Tourism is the provincial government agency through which tourism is promoted and developed. Transport Ports - Durban and Richards Bay serve as gateways to domestic and international markets and are two of Africa’s main ports. They provide linkages to southern Africa and handle approximately 78% of South Africa’s cargo tonnage. The Port of Durban is South Africa’s main general cargo and leading container port, handling over 30 million tons of cargo a year (representing 65% of all revenue earned by South African ports). The Port of Richards Bay is one of the world’s largest deepwater bulk-exporting ports, with planning in place to develop it further. Air - Durban International Airport has expanded its throughput in recent years and now handles over one and a half million passengers annually. A new major international airport at La Mercy on the North Coast has just recently commenced as part of the Dube Trade Port. The development will secure greater access to the international tourism market, holding significant implications for business and tourism as well as the important freight and communications network. The new airport at La Mercy should act as a catalyst for SME development. The logistics platform is designed to transform the area into an African gateway that would take advantage of established road and rail networks, as well as the proximity of the Durban and Richards Bay ports. Rail – KZN’s well-developed rail infrastructure forms a sizeable part of the national network. Spoornet utilises 2000 kilometres of railway line and runs daily trains on the main line between Durban and Gauteng, the main trade corrdior. Traffic conveyed consists of liquids, agricultural products, timber, cement, metals and minerals, as well as coal and ore. Road – there are approximately 38 400 kilometres of network in KZN. National and provincial roads are peripheral to rural areas, with toll systems in place on freeways. The band along the national N2 and N3 (the busiest import/export route in South Africa) concentrates the main areas of economic productivity.

- 14 -
2.3 Economic Impacts The macroeconomic effects of HIV/AIDS in the economy as a whole are an aggregation of the industry and sectoral level impacts as described in the previous section. Impacts The impact of HIV/AIDS on the national macroeconomy has been summarised; BER (2001:2):
1. A decline in the population and the labour force thus affecting the production potential (GDP) and expenditure;
2. Increased direct costs and indirect costs to private business; 3. Increased government expenditure given increased direct and indirect costs and increased
demand for public health care and social welfare given the care of AIDS orphans; 4. Increased cost burden for households given additional non-discretionary
expenditures on health care products and services as well as funeral costs. Labour Market Effects Previous macro-modelling results indicate that AIDS-related death and disability will result in a smaller labour force compared to a no-AIDS scenario. Early estimates suggested that the national labour force was projected to decline between 18 to 21% by 2015 (Quantek 2000, BER 2001). This is as a result of the progression of HIV/AIDS through the workforce and related impacts on life expectancy and mortality. It was predicted that the demand for labour, particularly unskilled labour, would decline due to the slowdown in economic growth. Hence employment levels will not increase, whilst the unemployment rate will not change significantly. Arndt and Lewis (2001) predict that unemployment among the unskilled increases marginally, but not resulting in major changes in the overall unemployment rate. This is largely due to the offsetting effect of an AIDS-induced reduction in the unskilled labour force and a reduction in labour demand due to slower economic growth. Wage rates, especially at skilled level, will increase as a consequence of skill shortages. However, this will be offset by increased direct costs related to benefit payments by the private and public sector and productivity declines. The overall result is a decline in the demand for labour (BER 2001). Main Macro Economic Indicators The main macro-economic impact studies conclude that HIV/AIDS will reduce the size and growth of the economy. Arndt and Lewis (2001) predict that year on year GDP growth rates will decline to 1% until 2008, with slight improvements into 2009 and 2010. By 2010 real GDP will be 17% lower than a no-AIDS scenario.

- 15 -
The BER (2001) concludes that the economic impact of HIV/ AIDS will be negative in that all major economic indicators will be declining. In comparison with a no-AIDS scenario, real GDP is projected to be 1.5% lower by 2010 and 5.7% lower by 2015. Thus year on year GDP growth rates will decline by an average of 0.5% per annum over the period 2002 to 2015. Quattek (2000) projects that real annual GDP will decline by 3.1% in 2006 to 2010, whilst in 2011 to 2015 it is expected to decline by 4.7%. By 2015 the average year on year GDP growth will be 0.3% to 0.4% lower than the comparable rate under a no- AIDS scenario. While the size of both the economy and the population will be smaller, per capita GDP will decline by 8% by 2010 compared to the no-AIDS scenario. This will reduce private discretionary expenditure, which will disproportionately be spent on essential health and food costs (Arndt and Lewis 2001). In spite of the differing results on HIV prevalence for KZN as noted earlier, the negative macro-economic impacts surveyed here will be significant for KZN, because the province has amongst the highest, if not the highest prevalence of HIV/AIDS within the national economy. Altman et al (2002) summarised the impacts thus: � Given the severity of the HIV/AIDS epidemic, KZN will experience significant declines in the size and nature of its population and labour force; � Economic growth is likely to decline, although by a much smaller margin than the projected contraction of the population and the labour force; � The impact on labour and skill supply will pose problems for vulnerable industries. � Industries, such as transport, tourism (see accommodation and catering) and manufacturing that are drivers of the provincial economy are vulnerable given increased labour turnover and replacement costs; � In the public sector, health and education are especially vulnerable in terms of responding to the increased demand for public healthcare, as well as the reduced capacity of education to supply labour to the rest of the economy; � Private sector costs are likely to increase which will translate in a decline in labour demand and lower fixed investment; � Public sector spending is likely to increase, putting pressure on the provincial budget. Estimation The most common approach to estimating the macroeconomic impact of AIDS has been to use a Solow growth model to capture changes in labour supply and productivity. These models are often augmented to include additional transmission mechanisms, such as savings and human and physical capital formation. Most studies using this approach have found that HIV/AIDS reduces economy-wide GDP growth. However, while the economy grows faster in the absence of AIDS, so too does the population, leading to declines in per capita GDP under less pessimistic growth

- 16 -
or productivity losses. This suggests that while AIDS reduces economic growth, it may in fact raise individual incomes. The disconnect between these findings and the severe impacts observed at the household-level suggests that an aggregate growth accounting framework may not satisfactorily capture important distributional effects. Therefore, while aggregate growth models find that AIDS does not cause economic collapse – a conclusion that has so far been borne out in Southern Africa – they are unable to estimate its impact on poverty and inequality. Two recent studies have focused on estimating the long-run impact of AIDS on human capital formation. Bell et al. (2003) use an overlapping generations model for South Africa and show that AIDS may undermine educational transfers and halve per capita incomes during 1960-2060. By contrast, Young (2006) uses a Ramsey-style growth model for South Africa to show that per capita incomes may be higher during 1995-2145 as a result of AIDS since limited resources are distributed amongst a smaller population. Some studies have examined the distributional impacts of AIDS. Greener et al. (2000), develop a survey-based microsimulation model of Botswana that first estimates the probability of individuals being infected, and then considers the impact on households by drawing on the results from BIDPA (2000). They find that AIDS increases the national incidence of poverty, it has no effect on income inequality. However, the macroeconomic impacts are still drawn from an aggregate model and so do not capture structural changes in growth and employment. Other approaches have been used elsewhere in Southern Africa to disaggregate the impact of AIDS on growth. For example, Arndt and Lewis (2001) used a computable general equilibrium (CGE) model of South Africa to jointly estimate impacts on producers and households, while explicitly capturing cross-industry linkages and labor markets. While this approach accommodates structural change, the use of aggregate representative households precludes the explicit measurement of poverty-effects. Accordingly, the proposed methodology will combine the above approaches by developing a disaggregated dynamic CGE and integrated microsimulation model. In this way the model will capture the effect of AIDS on the level and structure of growth while also assessing the province-wide impact on income poverty and inequality.
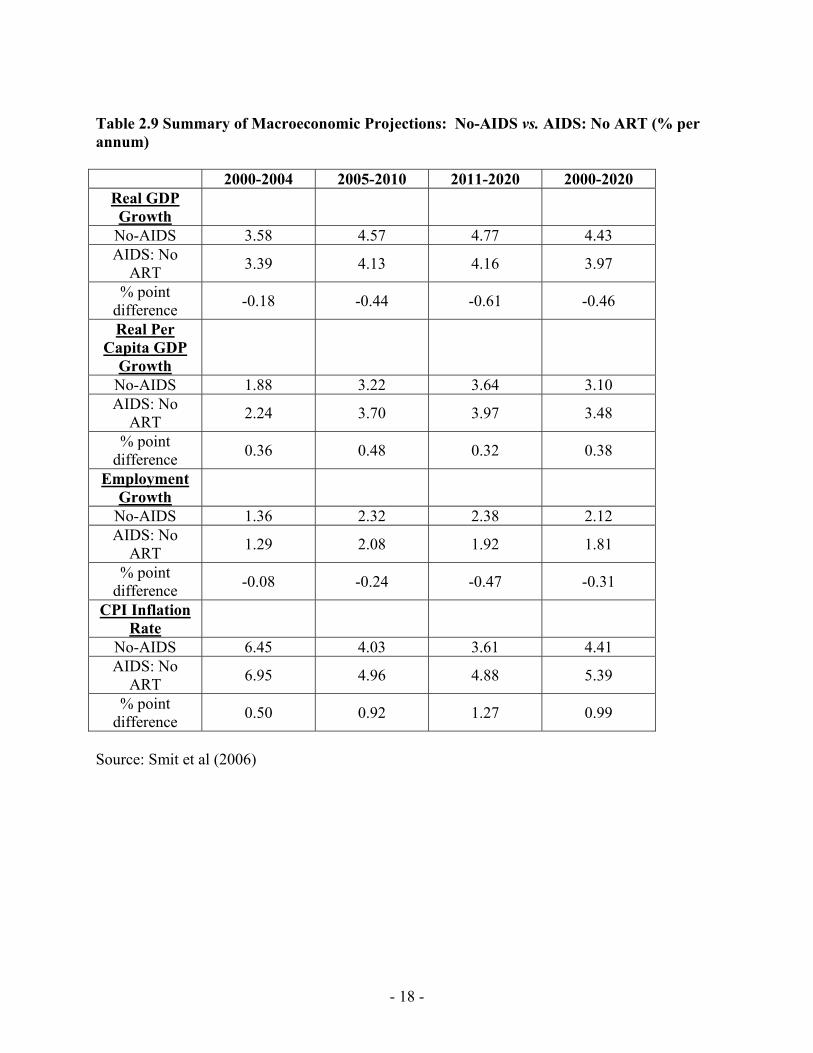
Smit et al (2006) conducted an analysis based on an adapted macro-econometric model of the South African economy. The modelling was based on inputs from: 1) the demographic impact of HIV/AIDS and 50% ART uptake scenario (ASSA model) 2) labour force implications of the demographic results and 3) the costing of ART and other interventions as well as other assumptions on channels and magnitude of the impact of HIV/AIDS. The model simulated three scenarios: No AIDS; AIDS: No ART; and AIDS: 50% ART uptake scenario. The results shown in Table 2.1 show that in the absence of AIDS the South African workforce in 2014 would have been 16% larger. The impact of a 50% uptake of ART would be reduce that value to 12.7%.

- 17 -
Table 2.8 The projected impact of HIV/AIDS on the South African labour force 2007 2008 2009 2010 2011 2012 2013 2014 No AIDS
17628880 17936295 18234775 18526767 18821960 19119217 19421866 19732459
AIDS: No ART
16572714 16656093 16719900 16771062 16822746 16875872 16934735 17003587
% change
16%
AIDS: 50% ART uptake
16644052 16776584 16901801 17021639 17141603 17258639 17375009 17493706
% change
12.7%
Source: Smit et al (2006)
- 18 -
Table 2.9 Summary of Macroeconomic Projections: No-AIDS vs. AIDS: No ART (% per annum)
2000-2004 2005-2010 2011-2020 2000-2020 Real GDP Growth
No-AIDS 3.58 4.57 4.77 4.43 AIDS: No
ART 3.39 4.13 4.16 3.97
% point difference -0.18 -0.44 -0.61 -0.46
Real Per Capita GDP
Growth
No-AIDS 1.88 3.22 3.64 3.10 AIDS: No
ART 2.24 3.70 3.97 3.48
% point difference 0.36 0.48 0.32 0.38
Employment Growth
No-AIDS 1.36 2.32 2.38 2.12 AIDS: No
ART 1.29 2.08 1.92 1.81
% point difference -0.08 -0.24 -0.47 -0.31
CPI Inflation Rate
No-AIDS 6.45 4.03 3.61 4.41 AIDS: No
ART 6.95 4.96 4.88 5.39
% point difference 0.50 0.92 1.27 0.99
Source: Smit et al (2006)

- 19 -
Table 2.10 Comparison with previous HIV/AIDS studies for South Africa
Authors Projection period & type of model
Average impact on GDP growth
Average impact on per capita
growth Quattek (2000) 2001 – 2015
Macro-Econometric
-0.3% Positive
Arndt & Lewis (2001)
1998 – 2010 CGE
-1.6% Negative
BER (2001) 2001 – 2015 Macro-
Econometric
-0.3% to -0.6% 0.7% to 1.0%
Bell, Devarajan and Gersbach (2003)
1990 – 2080; Overlapping-
generations (OLG) model
Devastating impact in absence of remedial action: income of average
family projected to be 86% lower by 2080 compared to No-AIDS
Smit et al (2006) 2000 – 2020
Macro-Econometric
-0.4% to -0.6% 0.3% to 0.4%
Source: Smit et al (2006) Vass (2005) explains the differing estimates of the macroeconomic models as being a function of the following criteria: Different models
It appears as though supply-constrained models such as CGE and OLG models tend to magnify the adverse impact of declining production (due to lower productivity and a smaller labour force), incomes and savings on overall economic growth
Different assumptions
Overly pessimistic assumptions on the impact of HIV/AIDS on total factor productivity Unrealistic assumptions of full employment in SA, while many of those infected with
HIV/AIDS are unemployed Unrealistic assumption of no remedial action by society Studies often ignore the fact that expenditure on health care products and services (by
government and the private sector) also contribute towards a country’s gross GDP

- 20 -
CHAPTER THREE METHODOLOGY 3.1 Economic Impact Channels The population/demographic model predicted the impact of AIDS on the size of the population and on the prevalence, morbidity and death rates of different groups of workers in KZN. These population and labour supply projections provide the basis on which we estimate the impact of AIDS on economic growth and income poverty. It should be noted that numerous studies have confirmed the detrimental effects of AIDS on non-income-based dimensions of poverty, including increased vulnerability from deteriorating livelihoods; heightened stigmatism and a fragmentation of social networks; and lower investments in human capital and nutrition (Casale and Whiteside, 2006). However, these household-level effects must be aggregated in order to estimate the overall impact of the pandemic. Furthermore, while households are directly affected by AIDS, there are also implications for the economy as a whole. Our macroeconomic assessment must account for not only households but also other actors or institutions, such as firms, markets and government. However, broadening our analysis necessitates excluding certain household-level impacts, especially those relating to social and non-income factors. Ultimately we identify five main channels through which AIDS impacts on growth and poverty: (i) population; (ii) labour supply; (iii) labour productivity; (iv) total factor productivity; and (v) health spending and savings. The first impact channel refers to the effects of HIV/AIDS on population and thus draw directly on the population/demographic projections. These projections are disaggregated by race, gender and age cohort. However, our objective is to estimate impacts on different groups of households (e.g. low-income versus high-income). The gender, age and racial composition of these household groups differs. Thus we first identify the demographic composition of different household groups in KZN and the rest of South Africa (RSA). We identify 56 household groups, which are split across two regions (KZN and RSA), two racial groups for de jure household heads (African and Other), and 14 income groups (ten expenditure deciles with the highest decile further disaggregated by quintile). The demographic composition of households in KZN is shown in Figure 3.1. While the gender composition of households across different income groups does not vary significantly, the age composition of these households varies dramatically. Almost 80% of lower-income households’ members are under 35 years of age, with a majority under the age of 20 years. Taking compositional differences is thus important when predicting population growth across household income groups. To derive population projections for the household groups, we multiply the base year population levels of each household group by the ratio of each period’s demographic projection relative to the base year’s population projection. Since the population estimates for each household group are drawn from the 2000 Income and Expenditure Survey (IES), the base year for these group-specific population projections in 2000. Since the IES reflects the current population distribution, these data contain the cumulative effects of AIDS to date.

- 21 -
Figure 3.1 Demographic composition of household income groups in KZN, 2000
0%
20%
40%
60%
80%
100%
D1 D2 D3 D4 D5 D6 D7 D8 D9 D10Q1
D10Q2
D10Q3
D10Q4
D10Q5
Household expenditure decile and quintile
Shar
e of
hou
seho
ld g
roup
's po
pula
tion
(%)
0-19
Female 20-34
Male 20-34
Male 35-49
Female 35-49
Male 50-64
Female 50-64
65+
Source: Own calculations using the re-weighted 2000 Income and Expenditure Survey. Thus, we first estimate group populations using projections the population/demographic model containing the effects of AIDS. This is shown in Equation 1, which shows the projected population for each household group in KZN or RSA. In the equation, t
rgadHA is the predicted
household group’s members population in year t (t = 1985-2025) and trgaPA is the
population/demographic model’s projected population. The value of brgadHA in the base year b
corresponds to the values appearing in the IES in year 2000. This calculation assumes that race r, gender g and age a rather than income decile d determines the population of household across different income groups.
trgat b
rgad rgad brga
PAHA HA
PA= ⋅ (1)
Having estimated household group populations containing the effects of HIV/AIDS, it is necessary to determine populations in the absence of HIV/AIDS. Again we draw on the population/demographic model’s projections. However, we cannot use the base year information from the survey, since this information already contains the effects of HIV/AIDS. Thus, as shown in Equation 2, we set the ‘without AIDS’ population for each household group t
rgadHN
equal to the ‘with AIDS’ the population projection in 1985 (t = 1). This reasonably assumes that the HIV/AIDS had not yet affected the population level and composition by 1985.
- 22 -
In Equation 3 we project group-specific populations based on the population projections from the population/demographic model that do not contain the effects of AIDS. Finally, we sum across gender and age cohort to arrive at the 28 household groups in each region (i.e., the 2 races in r and the 14 income groups in d).
1 1rgad rgadHN HA= (2)
11
trgat
rgad rgadrga
PNHN HN
PN= ⋅ (3)
A similar process is followed when estimating labour supply projections. Initial estimates on the demographic composition employment is drawn from the 2004 (September) Labour Force Survey (LFS). In keeping with the population/demographic model, worker employment is further disaggregated across industry of employment s and worker occupation o (i.e., skilled, semi-skilled and unskilled). In our occupational categorization of labour, ‘skilled’ labour includes professionals and managers; ‘semi-skilled’ labour includes technical assistants and machine operators; and ‘unskilled’ includes labourers and other elementary occupations. We initially estimate labour supply t
rgaosLA for time period by multiplying base year employment estimates by ‘with AIDS’ population projections from the population/demographic model. This is shown in Equation 4.
trgat b
rgaos rgaos brga
PALA LA
PA= ⋅ (4)
As with population, the base year information on labour supply from the LFS already contains the effects of HIV/AIDS, making it necessary to set labour supplies in the With AIDS and Without AIDS scenarios equal in 1985 (see Equation 5). The population/demographic model provides projections for worker death rates by industry and occupational categories ( t
rgaosd ). This information is used to determine the level of labour supply for each worker group for each time period in the absence of AIDS ( t
rgaosLN ). As shown in Equation 6, we set each year’s labour supply equal to the previous year’s labour supply plus the projected number of AIDS deaths to arrive a labour supply projection without the effects of AIDS. Finally, we sum across industries and age cohorts to arrive at the 12 labour groups used in the economic analysis (i.e., the 2 races in r multiplied by the 2 genders in g and the 3 occupations in o).
1 1rgaos rgaosLN LA= (5)
1t t t trgaos rgaos rgaos rgaosLN LN d LA−= + ⋅ (6)
The third impact channel captures the effect of AIDS on labour productivity. Unlike the labour supply projections detailed above, the labour productivity channel captures the effects of morbidity rather than mortality. We assume that workers infected by HIV are half as productive

- 23 -
as similar uninfected workers, while workers that are AIDS sick are one-fifth as productive. Since the labour supply projections described above capture the number of employees rather than number of work days, this labour productivity projection can be seen to include the effects of days absent from work, as well as infected workers’ declining capabilities at work. The population/demographic model provides projections for HIV prevalence ( t
rgaosp ) and
morbidity rates ( trgaosm ) for each group of workers in time period t. Thus the rate of labour
productivity growth under the ‘with AIDS’ scenario ( trgaoslpa ) is a weighted sum of the
productivity losses affected the productivity growth rate in the ‘without AIDS’ ( trgaoslpn ). This is
shown in Equation 7. For the 1- trgaosp workers that are uninfected have labour productivity
growth equal to the without AIDS scenario. However, the t trgaos rgaosp m− workers who are
infected but not AIDS sick have only half this rate of productivity growth. Finally, the trgaosm
AIDS sick workers’ productivity growth is only a fifth of that under the Without AIDS scenario.
( ) ( )1 0.5 0.2t t t t t t t trgaos rgaos rgaos rgaos rgaos rgaos rgaos rgaoslpa p lpn p m lpn m lpn= − ⋅ + ⋅ − ⋅ + ⋅ ⋅ (7)
Recent trends suggest that labour productivity in South Africa is growing by an average 1.8% per year. However, this current average contains the effects of AIDS. We therefore let the value of
trgaoslpa equal 1.8%, thus assuming that all workers’ productivity is growing at the same rate
under the ‘With AIDS’ scenario. We then derive the corresponding labour productivity growth rate that could have been achieved in the absence of AIDS. This is shown in Equation 8, which is a simple manipulation of Equation 7. Finally, we use the projected labour supply by age cohort from Equations 4 and 6 to weight the summation of labour productivity growth rates to arrive at an industry-specific productivity growth rate for each of the 12 labour groups in our analysis.
( ) ( )1 0.5 0.2
trgaost
rgaos t t t trgaos rgaos rgaos rgaos
lpalpn
p p m m=
− + ⋅ − + ⋅ (8)
The fourth impact channel refers to the effects of AIDS on total factor productivity (TFP) as opposed to its specific effect on labour productivity. These TFP losses are associated with systemic shocks to the economy caused by HIV/AIDS. For example, the loss of on-the-job experience due to AIDS morbidity and mortality reduces the productivity of uninfected workers as well as the capital or machinery with which they work. Similarly, the undermining of the education and health system through the loss of trained professionals will have detrimental effects on the entire economic system beyond these professionals’ own households and industries of employment. This is the first of the purely economic channels that cannot be informed by the population/demographic model. Given the multitude of systemic shocks likely to be caused by AIDS, as well as the lack of evidence on which to estimate the size of these shocks, we assume that AIDS reduces annual TFP growth by around 0.5% per year. This is similar to the size of the TFP losses identified in other macroeconomic studies for South Africa and other countries (see Arndt and Lewis, 2001; BIDPA, 2000; and Thurlow, 2006).

- 24 -
The fifth and final impact channel that we consider in our economic analysis refers to effects of AIDS on household health spending and savings behaviour. Freire (2002) estimates that AIDS causes households in South Africa to reduce their marginal savings rate by around 5%. Secondly, HIV/AIDS will cause an increase in spending on health care by affected households, thus reducing expenditures on other items. Reduced savings will have a negative impact on the accumulation of household assets, while increased spending on health care will cause worsen poverty if one excludes AIDS-related health spending from consumption-based poverty measures. We have therefore identified five main impact channels through which AIDS affects economic growth and income poverty. The first three of these channels are directly linked to the results of the population/demographic model, while the final two channels draw on findings from other micro- and macro-level studies. In the remainder of this section we describe the economic model used to estimate that extent to which these demographic shocks caused by AIDS are affecting economic growth and poverty reduction in KZN. 3.2 The CGE Model The economic model used in this study belongs to the class of computable general equilibrium (CGE) models (see Dervis et al., 1982) and is described in detail in Thurlow (2006). This section briefly describes the main characteristics of the model, while the model equations are given in the appendix. This study extends previous top-down aggregate growth models (see, for example, Smit, Ellis and Laubscher, 2006) by jointly estimating the impact of AIDS at the industry and household-level. To reflect the heterogeneity of South African producers, the CGE model is calibrated to a purpose-built 2002 social accounting matrix (SAM) that distinguishes between 25 productive industries, and is further disaggregated across two regions: KZN and the Rest of South Africa. Segmented markets are assumed for the 24 labour types in the model, which are disaggregated by region, race (African and Other), gender and occupational category (skilled, semi-skilled and unskilled). Unemployment rates are held constant, while labour and capital are fully employed and mobile across industries with flexible real wages and rates of return. Assuming full employment may appear to be a rigid assumption but it allows labour supply to adjust exogenously in response to the demographic projections. This assumption effectively implies that current unemployment rates are maintained (or do not change dramatically) and that new workers find some form of employment. In other words, if formal labour demand is insufficient then workers are forced to work in lower paying informal industries. Although producers maximize profits under constant returns to scale, they are constrained by factor market imperfections, such as segmented markets for skilled and unskilled labour. A nested production system is employed. At the lower levels, a constant elasticity of substitution function defines factor demand, while at the highest level, fixed-share intermediates are combined with factor value-added. Within the regional nesting of labour demand, a workers’ occupation is considered more important than their race or gender. By disaggregating production across industries the model captures the
- 25 -
changing structure of growth caused by HIV/AIDS. Furthermore, the detailed labour disaggregation allows the model to link to the projections from the population/demographic model and thus capture differences in workers’ prevalence rates and its effect on employment and wages. International trade is also modelled explicitly. Export supply is governed by a constant elasticity of transformation function based on endogenous relative prices. Import demand, for final and intermediates usage, is governed by an Armington function. Under the small country assumption, foreign prices are fixed and include relevant taxes and transactions margins. Armington elasticities are econometrically estimated for South Africa.
In order to capture the economy-wide impact of AIDS, the model considers a number of ‘institutions’, including the government, enterprises and households. The 56 household groups in the model are derived from the 2000 Income and Expenditure Survey (IES) and are disaggregated according to region, race of the de jure household head, and national expenditure deciles (with the top expenditure decile further disaggregated by quintile). Households and enterprises receive income in payment for producers’ use of their factors of production. These income patterns depend on each household’s physical and human capital endowments as reported in the IES. Both types of institutions pay taxes to government (based on fixed tax rates), save (based on marginal propensities to save), and make transfers to the rest of the world. Enterprises pay their remaining income to households. Households use their incomes to consume commodities under a linear expenditure system, with econometrically-estimated income elasticities. The government receives income from direct and indirect taxes, and then makes transfers domestically and abroad. The government also purchases commodities in the form of consumption expenditure and the remaining income is saved. Fiscal expenditure is disaggregated by administration, health and education functions. All private and public savings and foreign inflows are collected in a savings pool from which current investment is financed. By disaggregating households according to their income and expenditure patterns the model captures how AIDS affects households and regions differently. The model has three macroeconomic accounts: the savings and investment account; the current account, and the government account. A set of ‘closure’ rules ensure macroeconomic balance. A savings-driven closure is assumed for the savings-investment account, whereby the marginal propensities to save of households and enterprises are fixed, and real investment quantities adjust to ensure that the level of investment and savings are equal at equilibrium. For the current account it is assumed that the real exchange rate adjusts to maintain a fixed current account balance measured in foreign currency. Finally, for the government account, tax rates and real government consumption expenditure are fixed. Public administration and economic spending is a fixed share of GDP. Under this closure, the fiscal surplus adjusts to ensure that revenues equal recurrent expenditures. Together these closures allow the model to capture the impact of public and private savings on investment and growth. The model is recursive dynamic implying that parameters in the current period are determined by results from previous periods. For example, new capital stocks are endogenously determined by past levels of savings and investment, with new capital allocated across industries according to

- 26 -
differences in profit rates. The model therefore captures the impact of AIDS on physical capital accumulation. As described above, the economic model draws on the population/demographic model, by exogenously capturing changes in population for different household groups and labour supply for different labour categories. Finally, labour and total factor productivity (TFP) are updated exogenously according to the assumed impacts of AIDS as described above. The model is initially calibrated to the information contained in the 2002 regional SAM. The dynamic model is then solved for the 2002-2025 period as a series of equilibria, each one representing a single year. By imposing population and labour supply projections from the population/demographic model and drawing on recent trends for productivity growth, the CGE model produces a counterfactual growth path representing the With AIDS growth path that South Africa is currently following. The effects of HIV/AIDS on population, labour supply, productivity and household spending are then imposed on the model. The model is then re-solved for a new series of equilibria and differences between this Without AIDS scenario and the counterfactual With AIDS scenario are interpreted as the economy-wide impact of AIDS. The with and without dichotomy is the recommended approach which can take into account exogenous changes in the socio-economic environment like the HIV/AIDS epidemic imposes. This approach attempts to mimic the use of an experimental control and compares changes in the activity to change in a similar activity when the activity has not been implemented (AusAID, 2003). Finally, changes in poverty and inequality in the microsimulation module are measured using the same IES that was used to construct the SAM and CGE model. Analogous to sample weights, each representative household in the CGE model is an aggregation of a larger number of households in the survey. Since poverty in this study is defined according to per capita expenditure, changes in each household group’s expenditure on individual commodities in the CGE model is passed down to the survey, where the poverty measures are updated and poverty and inequality is recalculated. In summary, the CGE-microsimulation model is an advance over previous methodologies as it captures the detailed industry structure of South Africa’s economy and the linkages between producers and households in order to estimate the impact of AIDS on both growth and poverty. The CGE model exogenously captures a number of transmission mechanisms linking AIDS to growth and poverty. These include (i) changes in household populations and national demographic structure due to increased mortality; (ii) shifts in the level and skill-composition of labour supply; (iii) falling labour productivity due to morbidity; (iv) falling total factor productivity associated with systemic shocks to the economy; and (iv) changes in household health spending and savings behaviour. The model also endogenously captures other mechanisms, such as changes in public savings and its impact on investment and capital accumulation. Although not exhaustive, these transmission mechanisms provide a reasonable approximation of the main impacts of AIDS on growth, poverty and inequality.

- 27 -
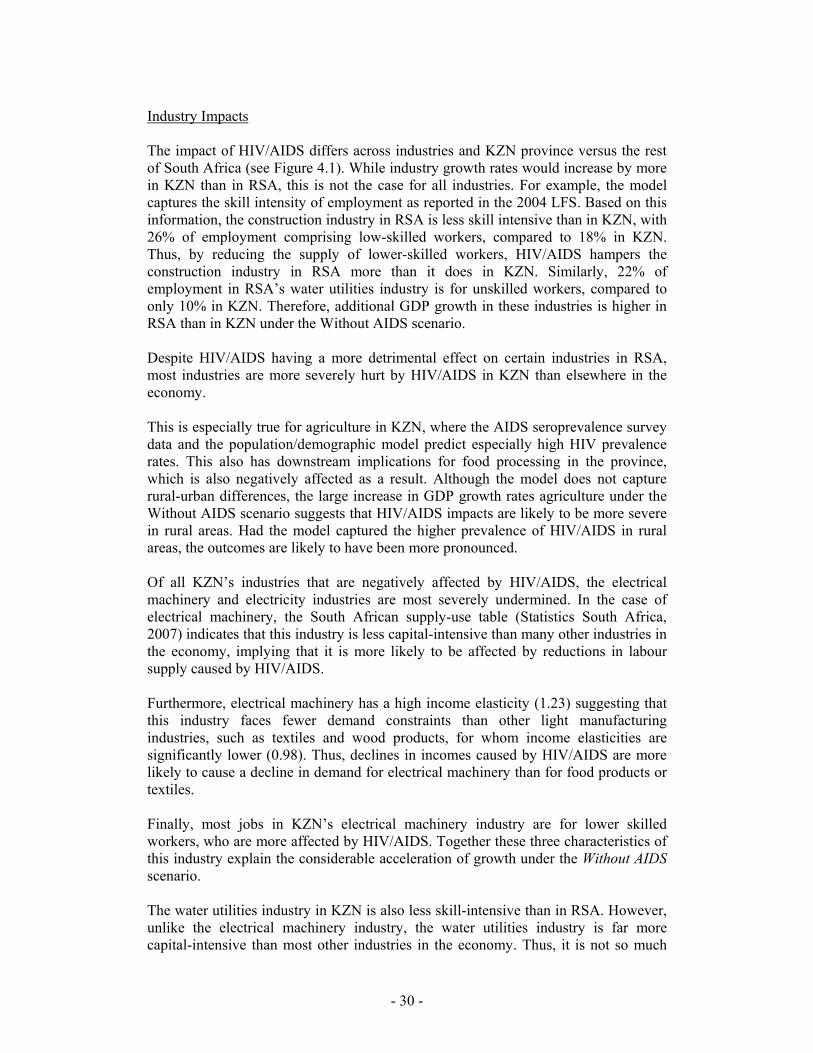
CHAPTER FOUR RESULTS AND ANALYSIS 4.1 Results and Analysis Tables 4.1 and 4.2 show the impact of HIV/AIDS on growth, employment and poverty in both KZN and RSA. Based on the population/demographic models’ projections, HIV/AIDS reduces KZN’s overall population growth rate from an average 1.85% during 2002-2025 under the Without AIDS scenario to 0.79% under the With AIDS scenario (see Table 4.1). This is larger than the decline in the population growth rate in RSA, reflecting the higher HIV prevalence rate in KZN. Similarly, the decline in population growth rates amongst the African population are substantially larger than for other racial groups due to higher prevalence amongst Africans. Macroeconomic Impacts Declines in the labour supply are larger than declines in population growth rates in both regions (see Table 4.2). For example, the population growth rate falls by 1.06% in KZN whereas the employment growth rate falls by 1.12%. This reflects the concentration of HIV infections amongst working age adults. Since employment growth exceeds population growth, the dependency ratio falls slightly from 5.05 under the With AIDS scenario to 4.98 under the Without AIDS scenario. Much of this decline is driven by African households, whose lower-skilled workers have higher prevalence rates and are thus most heavily affected by HIV/AIDS. Thus part of African households’ higher dependency ratio are driven by HIV/AIDS, which reduces the African working age population faster than the African population as a whole. The reverse is true for the Other racial group, albeit only slightly. High HIV prevalence and a larger proportion of AIDS sick people explains why HIV/AIDS has a more negative effect on labour productivity in KZN than in the rest of the country (see Table 4.2). While labour productivity is assumed to continuing growing at 1.8% under the With AIDS scenario, this is below the 1.92% annual growth that would have been achieved in the absence of AIDS-related morbidity and absence from work. This is slightly higher than the potential productivity growth of 1.88% in RSA. Declines in productivity are particularly pronounced for lower-skilled African workers, for whom HIV prevalence is particularly high. The differences in the labour supply and productivity effects of HIV/AIDS highlights the importance of taking skills and occupations into account when estimating macroeconomic impacts. Drawing on other studies, we assumed that HIV/AIDS causes annual TFP growth rates to decline by 0.5% per year (see Table 4.1). TFP growth in the economic model slightly exceeds this 0.5% per year due to endogenous shifts in resources towards more productive industries, thus driving up economy-wide TFP growth to around 0.6% per year. It should also be noted that the reported changes in the TFP growth rate are independent of the implied TFP changes caused by labour productivity improvements. Together, higher productivity and labour supply causes an expansion of GDP, whose average annual growth rate in KZN increases from 2.84% per year under the With AIDS scenario to 4.44% per year under the Without AIDS scenario. This implies that HIV/AIDS reduces KZN’s annual GDP growth rate by 1.60% per year during 2002-2025. This is larger than the negative impact of HIV/AIDS on the rest of South Africa’s GDP growth rate, which is reduced by 1.42% per year.

- 28 -
Table 4.1 Growth and poverty results, 2002-2025
KZN Rest of South Africa Annual growth, 2002-2025 Annual growth, 2002-2025
Initial value, 2002 With AIDS Without AIDS
Initial value, 2002 With AIDS Without AIDS
GDP (rands billions) 171 2.84 4.44 872 3.04 4.46GDP per capita (rands) 18,464 2.03 2.54 24,723 2.23 2.88
Population (millions) 9,250 0.79 1.85 35,252 0.79 1.54 African 7,999 0.93 2.08 28,045 0.94 1.80 Other 1,252 -0.23 -0.03 7,207 0.17 0.37
Dependency ratio (pop / employment) 4.86 5.05 4.98 4.41 4.40 4.31 African households 5.57 5.62 5.38 4.94 4.82 4.60 Other households 2.69 2.73 2.82 3.12 3.13 3.21
Total factor productivity - 0.03 0.60 - -0.04 0.50
Household savings rate (%) 1.76 1.40 3.51 0.50 0.40 1.00Health spending share of income (%) 13.55 20.87 14.33 14.02 21.44 14.90
Poverty rates (%) Incidence of poverty (P0) 36.66 19.46 20.00 24.83 10.50 9.51 Depth of poverty (P1) 14.73 6.02 6.20 9.40 3.46 3.15 Severity of poverty (P2) 7.71 2.69 2.77 4.91 1.74 1.60
Number of poor people (thousands) 3,391 2,157 2,819 8,752 4,438 4,759Number of AIDS deaths (thousands) 3,011 7,793Source: South Africa provincial CGE model results Notes: Poverty is measured using the 2-dollar-a-day poverty line (equal to R161 per adult equivalent per month in 2000 prices).

- 29 -
Table 4.2 Labour market results, 2002-2025
KZN Rest of South Africa Annual growth, 2002-2025 Annual growth, 2002-2025
Initial value, 2002 With AIDS Without AIDS
Initial value, 2002 With AIDS Without AIDS
Labour employment (1000s workers) 1,902 0.63 1.75 7,988 0.81 1.64 African 1,436 0.90 2.24 5,677 1.05 2.11 Skilled 184 0.87 1.73 679 1.01 1.67 Semi-skilled 718 0.99 2.23 2,844 1.06 2.04 Low skilled 534 0.78 2.43 2,154 1.05 2.33 Other 466 -0.31 -0.24 2,311 0.15 0.24 Skilled 215 -0.31 -0.27 853 0.22 0.26 Semi-skilled 220 -0.32 -0.23 1,047 0.13 0.22 Low skilled 31 -0.29 -0.12 412 0.09 0.25
Labour productivity - 1.80 1.92 - 1.80 1.88 African - 1.80 2.02 - 1.80 1.95 Skilled - 1.80 1.93 - 1.80 1.89 Semi-skilled - 1.80 2.02 - 1.80 1.96 Low skilled - 1.80 2.10 - 1.80 2.00 Other - 1.80 1.82 - 1.80 1.82 Skilled - 1.80 1.81 - 1.80 1.81 Semi-skilled - 1.80 1.81 - 1.80 1.82 Low skilled - 1.80 1.83 - 1.80 1.82
Labour wages (Rands per year) 75,511 3.09 4.05 96,054 2.94 3.93 African 59,219 2.48 2.88 91,944 2.67 3.33 Skilled 64,824 2.53 3.24 120,083 2.76 3.63 Semi-skilled 33,516 2.30 2.69 41,826 2.33 2.89 Low skilled 20,098 2.63 1.86 21,979 2.74 2.33 Other 91,803 3.44 4.68 100,163 3.19 4.41 Skilled 106,517 3.54 4.95 101,136 3.28 4.69 Semi-skilled 52,175 3.19 4.48 68,521 2.98 4.26 Low skilled 24,914 3.51 3.83 30,670 3.32 3.79Source: South Africa provincial CGE model results
- 30 -
Industry Impacts The impact of HIV/AIDS differs across industries and KZN province versus the rest of South Africa (see Figure 4.1). While industry growth rates would increase by more in KZN than in RSA, this is not the case for all industries. For example, the model captures the skill intensity of employment as reported in the 2004 LFS. Based on this information, the construction industry in RSA is less skill intensive than in KZN, with 26% of employment comprising low-skilled workers, compared to 18% in KZN. Thus, by reducing the supply of lower-skilled workers, HIV/AIDS hampers the construction industry in RSA more than it does in KZN. Similarly, 22% of employment in RSA’s water utilities industry is for unskilled workers, compared to only 10% in KZN. Therefore, additional GDP growth in these industries is higher in RSA than in KZN under the Without AIDS scenario. Despite HIV/AIDS having a more detrimental effect on certain industries in RSA, most industries are more severely hurt by HIV/AIDS in KZN than elsewhere in the economy. This is especially true for agriculture in KZN, where the AIDS seroprevalence survey data and the population/demographic model predict especially high HIV prevalence rates. This also has downstream implications for food processing in the province, which is also negatively affected as a result. Although the model does not capture rural-urban differences, the large increase in GDP growth rates agriculture under the Without AIDS scenario suggests that HIV/AIDS impacts are likely to be more severe in rural areas. Had the model captured the higher prevalence of HIV/AIDS in rural areas, the outcomes are likely to have been more pronounced. Of all KZN’s industries that are negatively affected by HIV/AIDS, the electrical machinery and electricity industries are most severely undermined. In the case of electrical machinery, the South African supply-use table (Statistics South Africa, 2007) indicates that this industry is less capital-intensive than many other industries in the economy, implying that it is more likely to be affected by reductions in labour supply caused by HIV/AIDS. Furthermore, electrical machinery has a high income elasticity (1.23) suggesting that this industry faces fewer demand constraints than other light manufacturing industries, such as textiles and wood products, for whom income elasticities are significantly lower (0.98). Thus, declines in incomes caused by HIV/AIDS are more likely to cause a decline in demand for electrical machinery than for food products or textiles. Finally, most jobs in KZN’s electrical machinery industry are for lower skilled workers, who are more affected by HIV/AIDS. Together these three characteristics of this industry explain the considerable acceleration of growth under the Without AIDS scenario. The water utilities industry in KZN is also less skill-intensive than in RSA. However, unlike the electrical machinery industry, the water utilities industry is far more capital-intensive than most other industries in the economy. Thus, it is not so much

- 31 -
the decline in labour supply that undermines growth in this industry, but more the negative consequences of HIV/AIDS for investment and capital accumulation. The model results indicate that the share of investment in GDP is 2.1% lower under the With AIDS scenario than under the Without AIDS scenario. While most of this decline in investment is due to the slowdown in economic growth caused by HIV/AIDS, about 28% of the decline results from lower savings rates amongst households (see Table 4.1).
Figure 4.1 Change in average annual industry growth rates, 2002-2025
1.00 1.25 1.50 1.75 2.00 2.25 2.50
ALL SECTORS
Agriculture
Mining
Food process ing
Textiles & clothing
Wood products
Chemicals
Non-metal minerals
Machinery
Elec. machinery
Scientific equip.
Transport equip.
Other manufactures
Electricity
Water
Construction
Trade services
Hotels & catering
Transport services
Communications
Financial services
Business services
Additional percentage points in average sectoral growth rate (%)
KwaZulu-Natal
Rest of South Africa
Source: South Africa provincial CGE model results
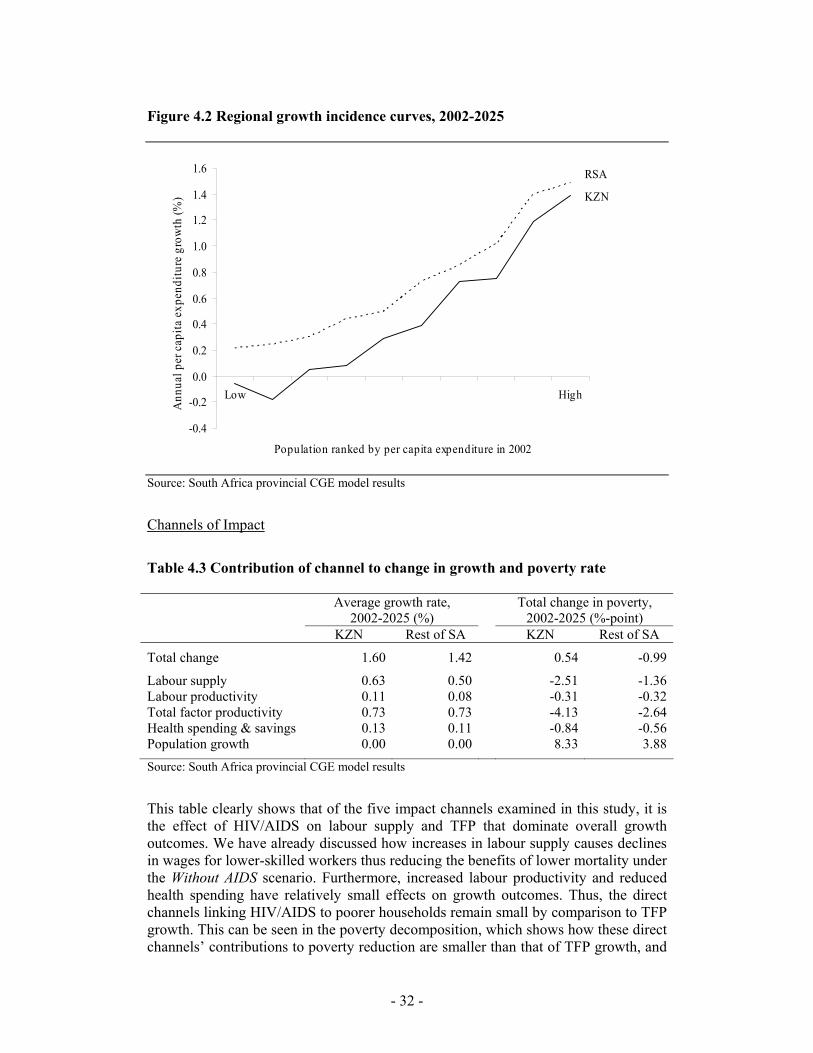
- 32 -
Figure 4.2 Regional growth incidence curves, 2002-2025
-0.4
-0.2
0.0
0.2
0.4
0.6
0.8
1.0
1.2
1.4
1.6
Low High
Population ranked by per capita expenditure in 2002
Ann
ual p
er c
apita
exp
endi
ture
gro
wth
(%)
RSA
KZN
Source: South Africa provincial CGE model results
Channels of Impact
Table 4.3 Contribution of channel to change in growth and poverty rate Average growth rate,
2002-2025 (%) Total change in poverty,
2002-2025 (%-point) KZN Rest of SA KZN Rest of SA
Total change 1.60 1.42 0.54 -0.99
Labour supply 0.63 0.50 -2.51 -1.36Labour productivity 0.11 0.08 -0.31 -0.32Total factor productivity 0.73 0.73 -4.13 -2.64Health spending & savings 0.13 0.11 -0.84 -0.56Population growth 0.00 0.00 8.33 3.88Source: South Africa provincial CGE model results
This table clearly shows that of the five impact channels examined in this study, it is the effect of HIV/AIDS on labour supply and TFP that dominate overall growth outcomes. We have already discussed how increases in labour supply causes declines in wages for lower-skilled workers thus reducing the benefits of lower mortality under the Without AIDS scenario. Furthermore, increased labour productivity and reduced health spending have relatively small effects on growth outcomes. Thus, the direct channels linking HIV/AIDS to poorer households remain small by comparison to TFP growth. This can be seen in the poverty decomposition, which shows how these direct channels’ contributions to poverty reduction are smaller than that of TFP growth, and
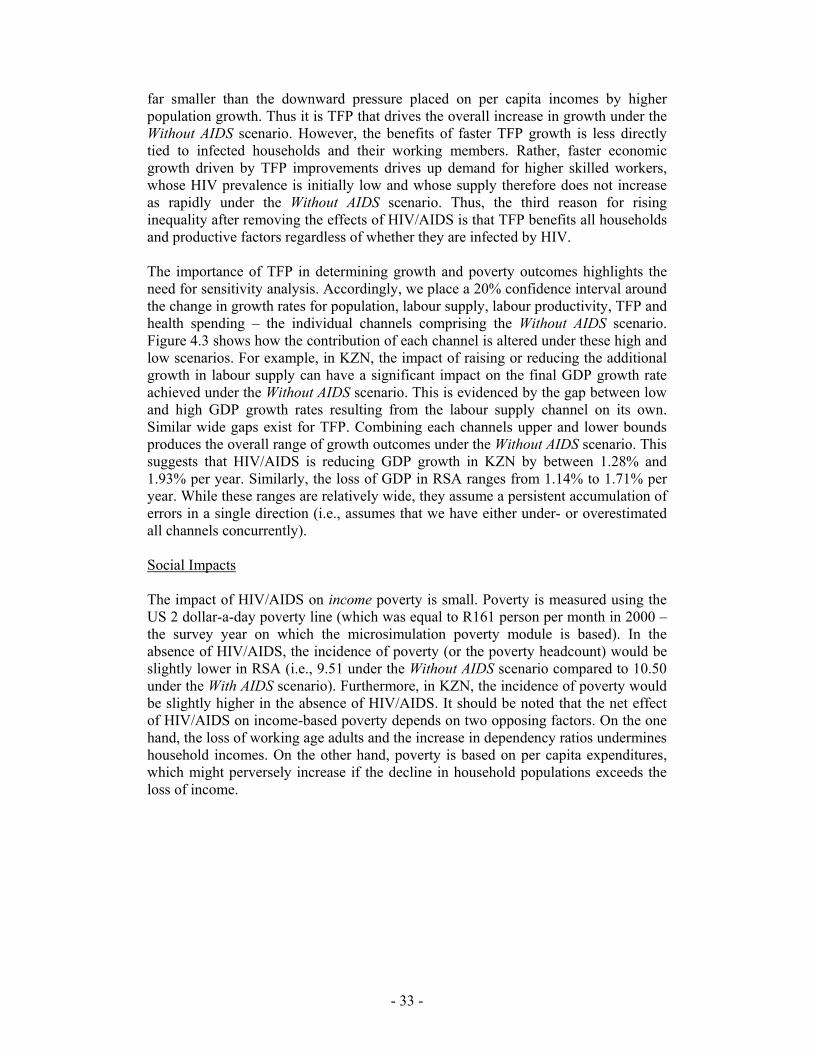
- 33 -
far smaller than the downward pressure placed on per capita incomes by higher population growth. Thus it is TFP that drives the overall increase in growth under the Without AIDS scenario. However, the benefits of faster TFP growth is less directly tied to infected households and their working members. Rather, faster economic growth driven by TFP improvements drives up demand for higher skilled workers, whose HIV prevalence is initially low and whose supply therefore does not increase as rapidly under the Without AIDS scenario. Thus, the third reason for rising inequality after removing the effects of HIV/AIDS is that TFP benefits all households and productive factors regardless of whether they are infected by HIV. The importance of TFP in determining growth and poverty outcomes highlights the need for sensitivity analysis. Accordingly, we place a 20% confidence interval around the change in growth rates for population, labour supply, labour productivity, TFP and health spending – the individual channels comprising the Without AIDS scenario. Figure 4.3 shows how the contribution of each channel is altered under these high and low scenarios. For example, in KZN, the impact of raising or reducing the additional growth in labour supply can have a significant impact on the final GDP growth rate achieved under the Without AIDS scenario. This is evidenced by the gap between low and high GDP growth rates resulting from the labour supply channel on its own. Similar wide gaps exist for TFP. Combining each channels upper and lower bounds produces the overall range of growth outcomes under the Without AIDS scenario. This suggests that HIV/AIDS is reducing GDP growth in KZN by between 1.28% and 1.93% per year. Similarly, the loss of GDP in RSA ranges from 1.14% to 1.71% per year. While these ranges are relatively wide, they assume a persistent accumulation of errors in a single direction (i.e., assumes that we have either under- or overestimated all channels concurrently). Social Impacts The impact of HIV/AIDS on income poverty is small. Poverty is measured using the US 2 dollar-a-day poverty line (which was equal to R161 person per month in 2000 – the survey year on which the microsimulation poverty module is based). In the absence of HIV/AIDS, the incidence of poverty (or the poverty headcount) would be slightly lower in RSA (i.e., 9.51 under the Without AIDS scenario compared to 10.50 under the With AIDS scenario). Furthermore, in KZN, the incidence of poverty would be slightly higher in the absence of HIV/AIDS. It should be noted that the net effect of HIV/AIDS on income-based poverty depends on two opposing factors. On the one hand, the loss of working age adults and the increase in dependency ratios undermines household incomes. On the other hand, poverty is based on per capita expenditures, which might perversely increase if the decline in household populations exceeds the loss of income.

- 34 -
Figure 4.3 Channels’ impact on average GDP growth, 2002-2025
KZN
3.56
4.444.444.444.28
2.84
3.46
2.5
3.0
3.5
4.0
4.5
5.0
With AIDS Laborsupply
Laborprod.
TFP Healthspending
Populationgrowth
WithoutAIDS
Ave
rage
ann
ual g
row
th ra
te (%
)
Res
t of S
outh
Afr
ica
3.61
4.46
3.53
3.04
4.34 4.46 4.46
2.5
3.0
3.5
4.0
4.5
5.0
With AIDS Laborsupply
Laborprod.
TFP Healthspending
Populationgrowth
WithoutAIDS
Ave
rage
ann
ual g
row
th ra
te (%
)
Source: South Africa provincial CGE model results Note: Outcomes are cumulative (for example, labour productivity includes the outcomes from labour supply). Horizontal bars show upper and lower bounds after assuming a 20% confidence interval around the additional growth rate resulting from each impact channel. It is a apparent contradiction that the model predicts a rise in poverty in KZN under the Without AIDS scenario, while also indicating that dependency ratios should decline, albeit only slightly. Thus, there must be other factors affecting household incomes that is causing poverty to rise in KZN. Here we find that it is the decline in wages caused by demand-constraints for increased labour supply that is causing household incomes to rise more slowly than population growth (see Table 4.2). Declines in wages are particularly pronounced for lower-skilled African workers, whose wage growth rate falls from 2.63% per year under the With AIDS scenario to 1.86% per year under the Without AIDS scenario. By contrast, wages for higher-skilled workers benefit more from faster economic growth and their growth rates accelerate. Thus, the structural constraints that are already contributing to high unemployment in South Africa would remain even in the absence of HIV/AIDS. The
- 35 -
model results therefore indicate that KZN and the rest of South Africa would continue to become more capital and skill-intensive, even if the supply and productivity of lower-skilled workers was not being undermined by HIV/AIDS. This result is robust to changes in labour market closures. Under an alternative closure we could have assumed that employment rather than wages adjusts to changes in labour market conditions. However, the negative income-effect would remain, with lower unemployment resulting from HIV/AIDS rather than higher wages. It is also an apparent contradiction that poverty rises in KZN under the Without AIDS scenario, despite the per capita GDP growth rate increasing by 0.5% (see Table 4.1). Here we find the importance of considering the industry and household detail not present in aggregate growth models. Aggregate GDP and consumption measures hide the distributional changes caused by HIV/AIDS. Figure shows the growth incidence curves for each region in the model. These curves show the annual percentage change in per capita expenditure for individual in the population ranked initially according to their level of per capita expenditure. Here we can see the effects of HIV/AIDS on South Africa’s income (or more accurately expenditure) distribution. Lower income households (shown on the left-hand side of the figure) benefit far less under the Without AIDS scenario than do higher income households, indicating a substantial rise in income inequality over the 2002-2025 period. That eliminating the effects of HIV/AIDS causes rising inequality is due to a number of reasons. First, as mentioned above, increased labour supply for lower-skilled workers is offset by falling wages and rising populations, leaving per capita incomes amongst households at the low-end of the distribution largely unchanged under the With AIDS scenario. The reverse is true for higher-skilled workers, whose incomes rise with faster economic growth. Secondly, as also mentioned above, the demographic structure of low-income households is heavily skewed towards children and younger adults (see Figure 3.1). Dependency ratios are thus especially high amongst poorer households, especially given the high level of unemployment amongst working age adults. Thus, the increase in the number of working age adults in these households is less likely to reduce dependency ratios, thereby allowing the household to benefit from faster economic growth. A third reason for the increase in inequality can be seen by examining the contribution of alternative channels to observed changes in GDP growth rates and poverty rates under the Without AIDS scenario (see Table 4.3). Figure 4.4 shows the impact of the same sensitivity analysis on poverty outcomes. It is important to note that population changes work in the opposite direction to other channels. What is also apparent is that the most important determinant of final year poverty is the change in the change in the size of the population, whose upper and lower bounds far exceed those of the other channels. While overestimating population growth would tend to raise final year poverty, overestimating all other channels growth effects would tend to reduce poverty. This explains why the cumulative confidence bands for all channels combined, as seen in the Without AIDS scenario, is very narrow. Thus, even if the predicted increase in labour supply under the Without AIDS scenario is underestimated, then this would likely imply a similar underestimation of population growth, which would dominate and cause poverty to increase in KZN.

- 36 -
Figure 4.4 Channels’ impact on final year poverty rate, 2025
KZN
20.00
16.6416.95
19.46
12.5211.68
20.00
9.0
11.0
13.0
15.0
17.0
19.0
21.0
23.0
WithAIDS
Laborsupply
Laborprod.
TFP Healthspending
Populationgrowth
WithoutAIDS
Ave
rage
ann
ual g
row
th ra
te (%
)
Res
t of S
outh
Afr
ica
9.519.51
6.366.73
10.50
9.32 9.19
0.0
2.0
4.0
6.0
8.0
10.0
12.0
WithAIDS
Laborsupply
Laborprod.
TFP Healthspending
Populationgrowth
WithoutAIDS
Ave
rage
ann
ual g
row
th ra
te (%
)
Source: South Africa provincial CGE model results Note: Outcomes are cumulative (for example, labour productivity includes the outcomes from labour supply). Horizontal bars show upper and lower bounds after assuming a 20% confidence interval around the additional growth rate resulting from each impact channel. Methodology Considerations The economic growth effect of HIV/AIDS is greater than the poverty effect. This supports Young (2006) in his study on HIV/AIDS impact in South Africa using a Ramsay style growth model, but refutes the same conclusion when an overlapping generation model is used (Bell et al, 2003). One weakness of the postulated macroeconomic impacts is the assumed loss in total factor productivity growth. As this, together with the slowdown in the growth of the labour force, is the assumption driving the growth impacts it is crucial to apply the

- 37 -
best available estimates of the impacts on TFP growth. This is similar to the size of the TFP losses identified in other macroeconomic studies for South Africa and other countries (see Arndt and Lewis, 2001; BIDPA, 2000; and Thurlow, 2006). This approach is problematic, as the quoted studies also simply assume what they would consider a plausible drop in TFP, thus mapping an assumed plausible change in TFP into an assumed plausible change in economic growth (also incorporating some additional, quantitatively less important variables). For the validity of the estimates, parameter choices are the “best available” rule of thumb. To understand how HIV/AIDS affects poverty, it is crucial to understand how the assumptions regarding HIV prevalence and related morbidity and mortality interplay with the economy and the structure of households. Salinas and Haacker (2006), for example, building on earlier work by (2004) or Greener and others (2000), identify the induced increase in volatility in incomes as a primary driver of increasing poverty. Other critical assumptions regard co-infection within households, and the distribution of HIV/AIDS across income-earning and other household members, and any adjustment to poverty lines to reflect the medical needs arising from HIV/AIDS. 4.2 Conclusion This study has examined the impact of HIV/AIDS on KZN. Drawing on a new survey of HIV prevalence amongst workers in KZN firms, we developed a population/demographic model to capture the effects AIDS on workers across different occupations. The results from the population/demographic model were then linked to a CGE-microsimulation model. The results from this economic model indicate a significant decline in both GDP and per capita GDP as a result of HIV/AIDS. By 2025, the KZN economy will be 43% smaller than it could have been were it not for HIV/AIDS. Similarly, the rest of the country’s economy will be 37% smaller by 2025. The results also indicate that while the detrimental growth-effect is large, the impact of HIV/AIDS on regional poverty headcounts is relatively small and that inequality would be higher in the absence of HIV/AIDS. In fact, the absolute number of poor people in KZN would be higher by 662,000 people in 2025. However, the population/demographic model also predicts that 11.8 million people will die of HIV/AIDS in South Africa during 2002-2025, of which over 3 million will be in KZN. Furthermore, the incentive to mitigate the effects of HIV/AIDS lies not only with poorer households and those with infected members, but also with the uninfected and higher-income households, who stand to benefit from faster economic growth and rising incomes.

- 38 -
REFERENCES Altman M. et al (2002) KwaZulu-Natal Economic Review. Employment Growth &
Development Initiative, Human Sciences Research Council (HSRC), Pretoria, South Africa.
Arndt C. & Lewis J. (2001) The HIV/AIDS Pandemic in South Africa: Sectoral
Impact and Unemployment. Journal of International Development, 13:427-449. AusAID (2003) Baseline Study Guidelines. Australian Government Printer,
Canberra, Australia. Bell C., Shantayanan Devarajan S. & Gersbach, H. (2003) The Long-run Economic
Costs of AIDS: Theory and an Application to South Africa. World Bank, Washington, USA.
BIDPA (2000) Macroeconomic Impact of the HIV/AIDS Epidemic in Botswana.
Botswana Institute for Development Policy Analysis, Gaborone, Botswana. Bureau for Economic Research (2001) The Macro-Economic Impact of HIV/AIDS in
South Africa. Economic Research Note. No.10. University of Stellenbosch, Stellenbosch, South Africa.
Bureau for Economic Research (2004) The Economic Impact of HIV/AIDS on
Business in South Africa, 2003. SA Business Coalition on HIV/AIDS and BER, Johannesburg and Stellenbosch, South Africa.
Casale D. and Posel D. (2004) A Review of the Labour Market in KwaZulu-Natal,
1995-2003. School of Economics, University of KwaZulu-Natal, Durban, South Africa.
Casale M. and Whiteside A. (2006) The Impact of HIV/AIDS on Poverty, Inequality
and Economic Growth. Health Economics and HIV/AIDS Research Division, University of KwaZulu-Natal, Durban, South Africa.
Coetzee C. (2006) Economic and Business Report – Durban and Ethekwini
Metropolitan Area. School of Economics and Finance, University of KwaZulu-Natal, Pietermaritzburg, South Africa.
Dervis K., de Melo J., and Robinson S. (1982) General Equilibrium Models for
Development Policy. Cambridge University Press, New York, USA. Department of Traditional and Local Government Affairs (2004) Municipal Status
Report. Pietermaritzburg, South Africa. Freire S. (2002) Impact of HIV/AIDS on Saving Behaviour in South Africa, TEAM,
Sorbonne University, Paris, France.
- 39 -
Gow J. and Desmond C. (2002) Household Impacts of HIV/AIDS in Chapter 6 in “The HIV/AIDS Epidemic and South African Children: Social and Economic Impacts” University of Natal Press, Pietermaritzburg, South Africa.
Graham Muller Associates (2006) KwaZulu-Natal Economic Review 2005. KZN
Department of Economic Development, Bishopsgate, South Africa. Greener R. (2002) AIDS and Macroeconomic Impact. in State of the Art: AIDS and
Economics. (editor) Forsythe S. The Policy Project, Glastonbury, USA. Greener R. (2004) “Impact of HIV/AIDS on Poverty and Inequality,” in: Haacker,
Markus (ed.), The Macroeconomics of HIV/AIDS International Monetary Fund, Washington DC, USA.
Greener R., Jeffries K. and Siphambe H. (2000) The Impact of HIV/AIDS on Poverty
and Inequality in Botswana. South African Journal of Economics, 68(5):888-915. HEARD (2003) The Macro-economic Impact of HIV/AIDS: Threats and
Opportunities. Report prepared for KZN Office of the Premier, Pietermaritzburg, South Africa.
Kavese K. and Seedat E. (2004) Regional Economic Analysis with Supply and Use
Tables: A Model for KwaZulu-Natal. KZN Dept. of Treasury, Pietermaritzburg, South Africa.
McPherson M. (2003) Macroeconomic Models of the Impact of HIV/AIDS. Center
for Business and Government, Harvard University, Boston, USA. Roe T. and Smith R. (forthcoming) Disease Dynamics and Economic Growth.
Journal of Policy Modeling Quantec Statistics (2007) [online] Available from URL: http://www.quantec.co.za
Quattek K. (2000) The economic impact of AIDS on South Africa: a dark cloud on
the horizon. ING Barings, Johannesburg, South Africa. Salinas G. and Haacker M. (2006) HIV/AIDS: The Impact on Poverty and
Inequality,” IMF Working Paper No. 06/126 International Monetary Fund, Washington DC, USA.
Smit B, Ellis L. & Laubscher P. (2006) The macroeconomic impact of HIV/AIDS
under alternative intervention scenarios (with specific reference to ART) on the South African economy. Bureau for Economic Research, University of Stellenbosch, Stellenbosch, South Africa.
Statistics South Africa (2007) Labour Force Survey 2006. Statistics South Africa,
Pretoria, South Africa.
- 40 -
Thurlow J. (2006) Is HIV/AIDS Undermining Botswana’s ‘Success Story’?, Discussion Paper, International Food Policy Research Institute, Washington D.C., USA.
Townsend F. (2007) KwaZulu-Natal Review 2003-04. Info-Biz, Durban, South
Africa. UNAIDS (2006) Report on the Global HIV/AIDS Epidemic, December 2005.
http://www.unaids.org/epidemic_update/report/index.html van den Heever A. (2003) Evaluation of the Sectoral Impact of HIV/AIDS in South
Africa: A Methodological Review. Human Sciences Research Council (HSRC), Pretoria, South Africa.
Vass J. (2005) A Review of Labour Markets in South Africa: The Impact of
HIV/AIDS on the Labour Market. Employment Growth & Development Initiative, Human Sciences Research Council (HSRC), Pretoria, South Africa.
WFA Pty Ltd and Graham Muller Associates (2006) Economic Baseline Study for
Ten Nominated Districts in KwaZulu-Natal. Department of Economic Development, Durban, South Africa.
Young (2006) The Gift of the Dying: The Tragedy of AIDS and the Welfare of Future
African Generations. The Quarterly Journal of Economics 120(2):423-466.

- 41 -
APPENDIX Mathematical specification of the CGE model Table A1. CGE Model’s sets, parameters, and variables
Symbol Explanation Symbol Explanation Sets a A∈ Activities ( )c CEN C∈ ⊂ Commodities not in CE
( )a ALEO A∈ ⊂ Activities with a Leontief function at the top of the technology nest
( )c CM C∈ ⊂ Aggregate imported commodities
c C∈ Commodities ( )c CMN C∈ ⊂ Commodities not in CM
( )c CD C∈ ⊂ Commodities with domestic sales of domestic output ( )c CX C∈ ⊂ Commodities with
domestic production ( )c CDN C∈ ⊂ Commodities not in CD f F∈ Factors
( )c CE C∈ ⊂ Exported commodities ( )h H INSDNG∈ ⊂ Households Equation parameters
cpi Consumer price index imps01
0-1 parameter with 1 for institutions with potentially flexed direct tax rates
ccwts Weight of commodity c in the CPI cpwe
Export price (foreign currency)
caica Quantity of c as intermediate input per unit of activity a ifshif
Share for domestic institution i in income of factor f
'ccicd Quantity of commodity c as trade input per unit of c’ produced and sold domestically
'iishii Share of net income of i’ to i (i’ ∈ INSDNG’; i ∈ INSDNG)
'ccice Quantity of commodity c as trade input per exported unit of c’
ata Tax rate for activity a
'ccicm Quantity of commodity c as trade input per imported unit of c’
itins Exogenous direct tax rate for domestic institution i
ainta Quantity of aggregate intermediate input per activity unit
itins01
0-1 parameter with 1 for institutions with potentially flexed direct tax rates
aiva
Quantity of aggregate intermediate input per activity unit
ctm Import tariff rate
imps Base savings rate for domestic institution i ctq Rate of sales tax

- 42 -
Table A1 continued. CGE Model’s sets, parameters, and variables
Symbol Explanation Symbol Explanation Equation parameters, continued
aaα Efficiency parameter in the CES
activity function tcrδ CET function share parameter
vaaα Efficiency parameter in the CES
value-added function vafaδ CES value-added function share
parameter for factor f in activity a
accα Shift parameter for domestic
commodity aggregation function mchγ
Subsistence consumption of marketed commodity c for household h
qcα Armington function shift
parameter acθ Yield of output c per unit of activity a
tcα CET function shift parameter a
aρ CES production function exponent aβ Capital sectoral mobility factor va
aρ CES value-added function exponent
mchβ
Marginal share of consumption spending on marketed commodity c for household h
accρ Domestic commodity aggregation
function exponent
aaδ CES activity function share
parameter qcρ Armington function exponent
acacδ Share parameter for domestic
commodity aggregation function tcρ CET function exponent
qcrδ Armington function share
parameter afatη Sector share of new capital
fυ Capital depreciation rate
Exogenous Variables
fsav Foreign savings (FCU) cqg Government consumption demand for commodity
imps Marginal propensity to save for domestic non-government institution (exogenous variable)
cqinv Base-year quantity of private investment demand
cpwm Import price (foreign currency) i ftrnsfr Transfer from factor f to institution i
cqdst Quantity of stock change fawfdist Wage distortion factor for factor f in activity a
fqfs Quantity supplied of factor
Endogenous Variables aftAWF
Average capital rental rate in time period t aQINTA Quantity of aggregate intermediate
input
IADJ Investment adjustment factor caQINT Quantity of commodity c as intermediate input to activity a
EG Government expenditures cQINV Quantity of investment demand for commodity
hEH Consumption spending for household crQM Quantity of imports of commodity
c
EXR Exchange rate (LCU per unit of FCU) aPA Activity price (unit gross revenue)
GSAV Government savings cPD Demand price for commodity produced and sold domestically
faQF Quantity demanded of factor f from activity a crPE Supply price for commodity
produced and sold domestically
chQH Quantity consumed of commodity c by household h aPINTA Export price (domestic currency)
achQHA Quantity of household home consumption of commodity c from activity a for household h
ftPK Aggregate intermediate input price for activity a
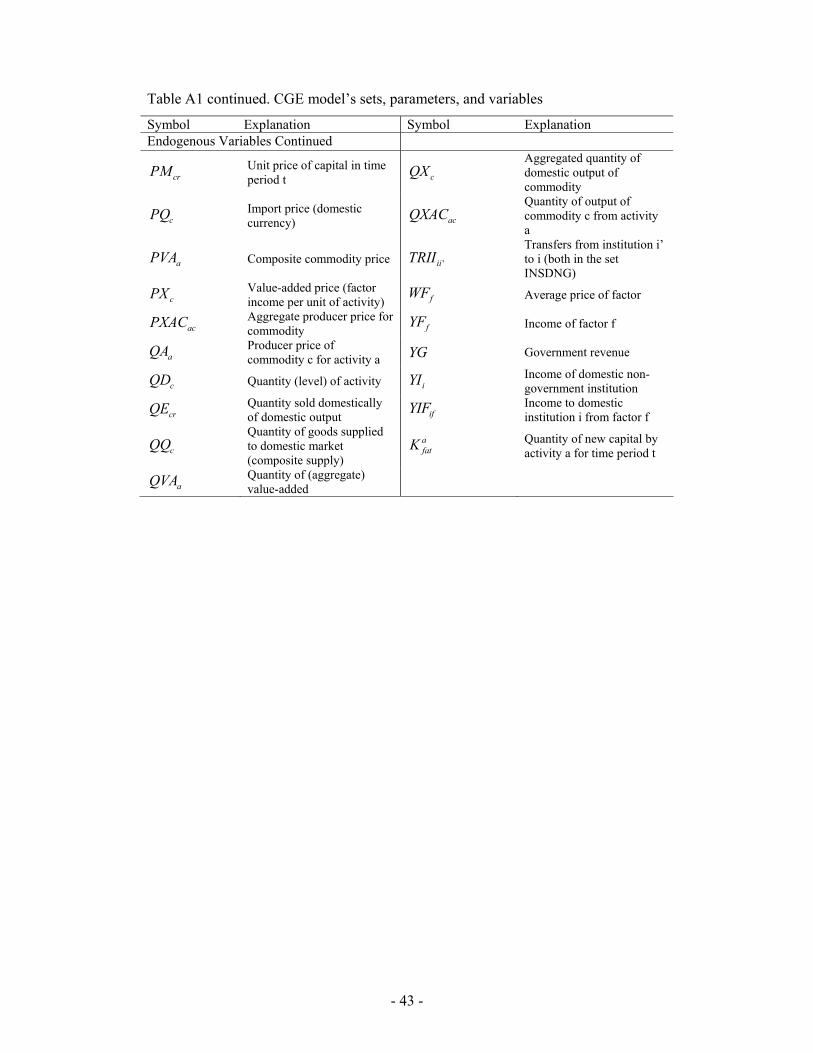
- 43 -
Table A1 continued. CGE model’s sets, parameters, and variables
Symbol Explanation Symbol Explanation Endogenous Variables Continued
crPM Unit price of capital in time period t cQX
Aggregated quantity of domestic output of commodity
cPQ Import price (domestic currency) acQXAC
Quantity of output of commodity c from activity a
aPVA Composite commodity price 'iiTRII Transfers from institution i’ to i (both in the set INSDNG)
cPX Value-added price (factor income per unit of activity) fWF Average price of factor
acPXAC Aggregate producer price for commodity fYF Income of factor f
aQA Producer price of commodity c for activity a YG Government revenue
cQD Quantity (level) of activity iYI Income of domestic non-government institution
crQE Quantity sold domestically of domestic output ifYIF Income to domestic
institution i from factor f
cQQ Quantity of goods supplied to domestic market (composite supply)
afatK Quantity of new capital by
activity a for time period t
aQVA Quantity of (aggregate) value-added

- 44 -
Table A2. CGE model equations
Production and Price Equations
c a ca aQINT ica QINTA= ⋅ (1)
a c cac C
PINTA PQ ica∈
= ⋅∑ (2)
( )vava aa
1-
va va vafa a f a f a f a
f F
QVA QFρρ
α δ α−
∈
⎛ ⎞= ⋅ ⋅ ⋅⎜ ⎟
⎝ ⎠∑ (3)
( ) ( )1
1
'
( )va vavaa aava vaf va vaf
faf a a f a f a f a f a f a f af F
W WFDIST PVA QVA QF QFρ ρρδ α δ α
−− − −−
∈
⎛ ⎞⋅ = ⋅ ⋅ ⋅ ⋅ ⋅ ⋅ ⋅⎜ ⎟
⎝ ⎠∑ (4)
a a aQVA iva QA= ⋅ (5)
a a aQINTA inta QA= ⋅ (6)
(1 )a a a a a a aPA ta QA PVA QVA PINTA QINTA⋅ − ⋅ = ⋅ + ⋅ (7)
a c a c aQXAC QAθ= ⋅ (8)
a ac acc C
PA PXAC θ∈
= ⋅∑ (9)
11ac
caccac ac
c c a c a ca A
QX QXACρ
ρα δ−
−−
∈
⎛ ⎞= ⋅ ⋅⎜ ⎟
⎝ ⎠∑ (10)
1
1
'
ac acc cac ac
ca c c a c a c a c a ca A
PXAC = QX QXAC QXACPX ρ ρδ δ−
− − −
∈
⎛ ⎞⋅ ⋅ ⋅ ⋅⎜ ⎟⎜ ⎟
⎝ ⎠∑ (11)
''
cr cr c c cc CT
PE pwe EXR PQ ice∈
= ⋅ − ⋅∑ (12)
1tct t
c ct t tc cr crc cr c
r r = + (1- )QX QE QD
ρρ ρα δ δ⎛ ⎞⋅ ⋅ ⋅⎜ ⎟
⎝ ⎠∑ ∑ (13)
11t
ctcr
crcr rt
c cc
1 - QE PE = QD PD
ρδ
δ
−⎛ ⎞⎜ ⎟⋅⎜ ⎟⎜ ⎟⎝ ⎠
∑ (14)
c crcr
= QD QEQX +∑ (15)
c c c c cr crr
PX QX PD QD PE QE⋅ = ⋅ + ⋅∑ (16)
( ) ' ''
1cr cr cr c c cc CT
PM pwm tm EXR PQ icm∈
= ⋅ + ⋅ + ⋅∑ (17)

- 45 -
Table A2. CGE Model Equations (continued, a)
qq q cc c
1-- -q q q
c cr crc cr cr r
= + (1- )QQ QM QDρρ ρα δ δ⎛ ⎞
⋅ ⋅ ⋅⎜ ⎟⎝ ⎠∑ ∑ (18)
qc
11+
qccr c
qc crc
r
QM PD =1 - QD PM
ρδ
δ
⎛ ⎞⎜ ⎟⋅⎜ ⎟⎜ ⎟⎝ ⎠
∑ (19)
c c crr
= QQ QD QM+∑ (20)
( )1c c c c c cr crr
PQ tq QQ PD QD PM QM⋅ − ⋅ = ⋅ + ⋅∑ (21)
c cc C
cpi PQ cwts∈
= ⋅∑ (22)
Institutional Incomes and Domestic Demand Equations
f f f a f aa A
YF = WF wfdist QF∈
⋅ ⋅∑ (23)
i f i f fYIF = shif YF⋅ (24)
'' '
i i f i i i gov i rowf F i INSDNG
YI = YIF TRII trnsfr cpi trnsfr EXR∈ ∈
+ + ⋅ + ⋅∑ ∑ (25)
' ' ' ' 'i i i i i i iTRII = shii (1- mps ) (1- tins ) YI⋅ ⋅ ⋅ (26)
( )1 1h i h h h hi INSDNG
EH = shii mps (1- tins ) YI∈
⎛ ⎞− ⋅ − ⋅ ⋅⎜ ⎟
⎝ ⎠∑ (27)
' ''
m m mc c h c ch ch h c c h
c CPQ QH = PQ EH PQγ β γ
∈
⎛ ⎞⋅ ⋅ + ⋅ − ⋅⎜ ⎟
⎝ ⎠∑ (28)
c cQINV = IADJ qinv⋅ (29)
c c i govc C i INSDNG
EG PQ qg trnsfr cpi∈ ∈
= ⋅ + ⋅∑ ∑ (30)
i i c c c cc ci INSDNG c CMNR c C
gov f gov rowf F
YG tins YI tm EXR tq PQ QQpwm QM
YF trnsfr EXR∈ ∈ ∈
∈
= ⋅ + ⋅ ⋅ + ⋅ ⋅⋅
+ + ⋅
∑ ∑ ∑
∑ (31)
System Constraints and Macroeconomic Closures
c c a c h c c ca A h H
QQ QINT QH qg QINV qdst∈ ∈
= + + + +∑ ∑ (32)
f a fa A
QF QFS∈
=∑ (33)
YG EG GSAV= + (34)

- 46 -
Table A2. CGE Model Equations (continued, b)
cr cr cr cr i rowr c CMNR r c CENR i INSD
pwm QM pwe QE trnsfr fsav∈ ∈ ∈
⋅ = ⋅ + +∑ ∑ ∑ (35)
( )1 ii i c c c ci INSDNG c C c C
mps tins YI GSAV EXR fsav PQ QINV PQ qdst∈ ∈ ∈
⋅ − ⋅ + + ⋅ = ⋅ + ⋅∑ ∑ ∑ (36)
Factor Accumulation and Allocation Equations (Applies to Capital only)
'
f a taf t f t f a t
a f a' ta
QFAWF WF wfdist
QF
⎡ ⎤⎛ ⎞⎢ ⎥⎜ ⎟= ⋅ ⋅⎢ ⎥⎜ ⎟⎜ ⎟⎢ ⎥⎝ ⎠⎣ ⎦
∑ ∑ (37)
,
'
1 1f a t f t f a ta af a t a
f a' t f ta
QF WF wfdistQF AWF
η β⎛ ⎞ ⎛ ⎞⎛ ⎞⋅⎜ ⎟= ⋅ ⋅ − +⎜ ⎟⎜ ⎟⎜ ⎟ ⎜ ⎟⎜ ⎟⎜ ⎟ ⎝ ⎠⎝ ⎠⎝ ⎠∑
(38)
c t c ta a cf a t f a t
f t
PQ qinvK
PKη
⎛ ⎞⋅⎜ ⎟∆ = ⋅⎜ ⎟⎜ ⎟⎝ ⎠
∑ (39)
'
c tf t c t
c c' tc
qinvPK PQqinv
= ⋅∑ ∑ (40)
1af a t
f a t+1 f a t ff a t
KQF QF
QFυ
⎛ ⎞∆= ⋅ + −⎜ ⎟⎜ ⎟
⎝ ⎠ (41)
1 1f a t
af t f t f
f t
KQFS QFS
QFSυ+
⎛ ⎞⎜ ⎟= ⋅ + −⎜ ⎟⎜ ⎟⎝ ⎠
∑ (42)