An Econometric Analysis Of California Raisin Export … · An Econometric Analysis ... an...
39
RAISIN ADMINISTRATIVE COMMITTEE Submitted to the Agricultural Marketing Service, USDA to fulfill an evaluation requirement of the Federal Agricultural Improvement Reform Act of 1996. December 2015 An Econometric Analysis Of California Raisin Export Promotion by Dr. Harry Kaiser Cornel University
Transcript of An Econometric Analysis Of California Raisin Export … · An Econometric Analysis ... an...
RAISIN ADMINISTRATIVE COMMITTEE
Submitted to the Agricultural Marketing Service, USDA to fulfill an evaluation requirement of the Federal Agricultural Improvement Reform Act of 1996. December 2015
An Econometric Analysis Of California Raisin Export Promotion by Dr. Harry Kaiser Cornel University
An Economic Analysis of California Raisin Export Promotion Programs
Dr. Harry M. Kaiser Cornell University
December 7, 2015
Executive Summary
The California Raisin Administrative Committee (RAC) uses a variety of programs to stimulate sales of California raisins to export destinations, including (1) MAP (Market Access Program), (2) MIP (Merchandise Incentive Program), and General RAC Funds. Until 2011, the RAC also operated two other major programs to promote California raisins: (1) Export Replacement Offer (ERO) and (2) Industry Marketing Promotion Fund (IMPF). Under the last U.S. Farm Bill, all federal marketing orders operating promotion programs are required to have economic evaluations conducted to ascertain the extent of their impact on the market. The purpose of this study is to measure the return on investment of raisin export promotion programs operated by the RAC. More specifically, this study measures the effectiveness of each of the five programs as well as the sum of all programs on enhancing California raisin exports. In order to assess the effectiveness of the export promotion activities, an econometric modeling approach is used. The econometric approach quantifies economic relationships using economic theory and statistical procedures with data. This framework enables us to simultaneously account for the impact of a variety of factors that influence raisin import demand of the foreign market in question, including the price of California Raisins, the price of competing supplier’s raisins, exchange rates, population, consumer income, consumer tastes and preferences, and the California Raisin industry’s export promotion expenditures. By casting the evaluation in this type of framework, we can filter out the effect of other factors and, hence, quantify directly the net impact of California export promotion activities on raisin import demand of the foreign consumers. This study provides answers to three key questions regarding the effectiveness of California Raisin export promotion:
1. What is the responsiveness of the demand for California Raisins in importing countries and overall with respect to California export promotion?
2. What would exports of California Raisins been in the importing countries and in total had
there not been any California export promotion? 3. How does the gain in export revenue due to California export promotion compare to the
costs of the promotion in the 13 importing countries and in total?
To address these questions, import demand equations for California raisins are econometrically estimated using data over the time period 2000-2014 for the 13 importing countries/regions.
2
Unlike previous research, this study obtains a separate measure of the “export promotion elasticity” for each of the 12 countries/regions and each of the five programs being evaluated. The export promotion elasticity measures the percentage increase in imports of California raisins into each country given a 1% change in export promotion expenditures, while taking into consideration other factors that affect raisin demand in the foreign market. In all countries, the estimated export promotion elasticities are found to be positive and statistically different from zero for at least one or more programs operating in the market. This means that the statistical evidence overwhelmingly supports the notion that California export promotion programs have the effect of increasing the demand for its raisins in the major importing countries. The overall average promotion elasticity across all programs and all countries is 0.02, meaning a 10% increase in promotion expenditures leads to a 0.2% increase in California raisin imports holding all other demand factors constant. On an individual program basis, the highest export promotion elasticities are for ERO because it had the highest funding levels, but all four other programs also have positive statistically significant impacts on raisin imports. The above estimation results indicate that the answer to the first question of this study is affirmative: The California raisin industry’s export promotion is having a positive and significant effect on its exports to foreign destinations. The estimated import demand equations are simulated to address the remaining questions posed in this study. Two scenarios are entertained in the simulation for each country and each program: 1. Baseline Scenario - export promotion programs are in effect.
2. No-Export-Promotion Scenario –export promotion program in question is not in effect. The difference between the above two scenarios gives the total impact of the export promotion on California raisin export quantity. The model is simulated over the time period, 2010-2014. Over this period, California raisin export promotion resulted in a total incremental increase in imports of California raisins of 50,093 metric tons. In other words, had there been no California raisin export promotion in these countries over this period, annual California raisin imports would have averaged 10,019 metric tons less than they actual were. In percentage terms, this means that had there not been any export promotion programs run by the RAC, California raisin imports would have been 9.9% lower than they actually were.
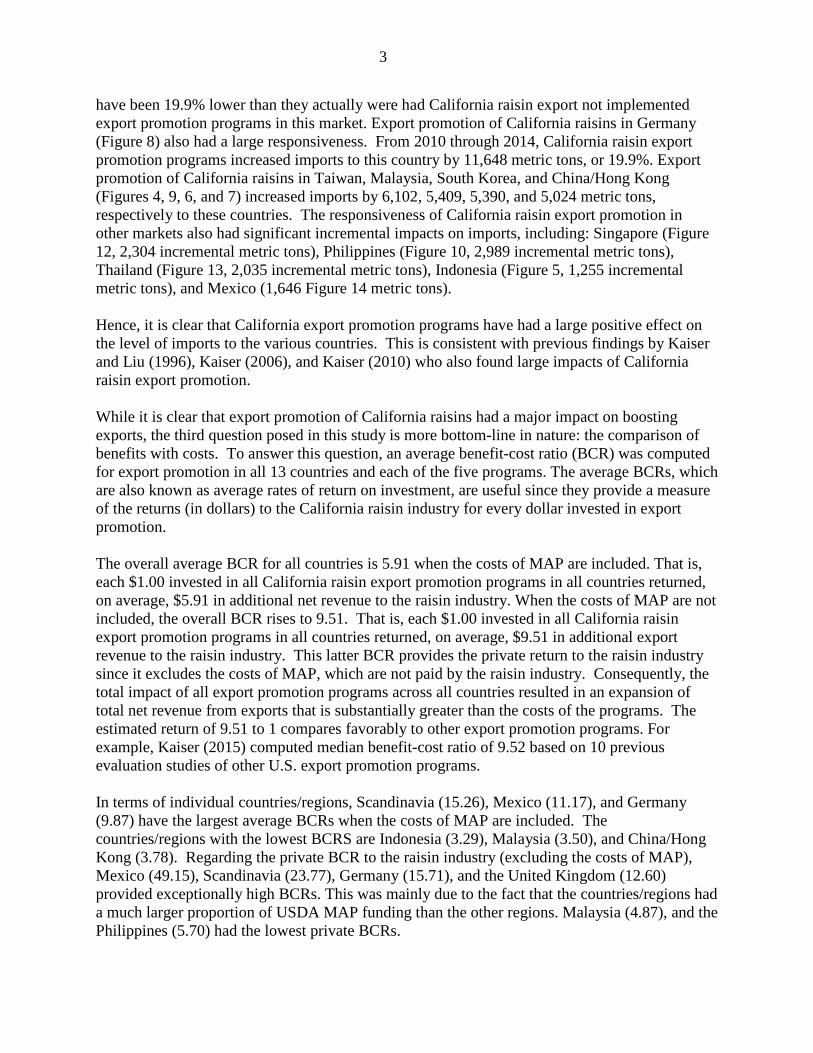
In terms of the various country’s responsiveness to California raisin export promotion, the largest markets for incremental California raisins sales due to California raisin export promotion are Japan and the United Kingdom. Over the period 2010-2014, California raisin export promotion had the impact of adding 31,562 and 17,232 additional metric tons of California raisins, respectively in the United Kingdom and Japan (Figures 2 and 3). In other words, had there been no California raisin export promotion in Japan and the United Kingdom, imports would have been 26.9% and 19.9% lower, respectively, over this period. Scandinavia (Figure 11) is the third most important market for California raisins in terms of the impact of California raisin export promotions. Over this period, California raisin export added an additional 12,829 metric tons of California raisin imports to Scandinavia. On a percentage basis, imports to Scandinavia would
3
have been 19.9% lower than they actually were had California raisin export not implemented export promotion programs in this market. Export promotion of California raisins in Germany (Figure 8) also had a large responsiveness. From 2010 through 2014, California raisin export promotion programs increased imports to this country by 11,648 metric tons, or 19.9%. Export promotion of California raisins in Taiwan, Malaysia, South Korea, and China/Hong Kong (Figures 4, 9, 6, and 7) increased imports by 6,102, 5,409, 5,390, and 5,024 metric tons, respectively to these countries. The responsiveness of California raisin export promotion in other markets also had significant incremental impacts on imports, including: Singapore (Figure 12, 2,304 incremental metric tons), Philippines (Figure 10, 2,989 incremental metric tons), Thailand (Figure 13, 2,035 incremental metric tons), Indonesia (Figure 5, 1,255 incremental metric tons), and Mexico (1,646 Figure 14 metric tons). Hence, it is clear that California export promotion programs have had a large positive effect on the level of imports to the various countries. This is consistent with previous findings by Kaiser and Liu (1996), Kaiser (2006), and Kaiser (2010) who also found large impacts of California raisin export promotion. While it is clear that export promotion of California raisins had a major impact on boosting exports, the third question posed in this study is more bottom-line in nature: the comparison of benefits with costs. To answer this question, an average benefit-cost ratio (BCR) was computed for export promotion in all 13 countries and each of the five programs. The average BCRs, which are also known as average rates of return on investment, are useful since they provide a measure of the returns (in dollars) to the California raisin industry for every dollar invested in export promotion. The overall average BCR for all countries is 5.91 when the costs of MAP are included. That is, each $1.00 invested in all California raisin export promotion programs in all countries returned, on average, $5.91 in additional net revenue to the raisin industry. When the costs of MAP are not included, the overall BCR rises to 9.51. That is, each $1.00 invested in all California raisin export promotion programs in all countries returned, on average, $9.51 in additional export revenue to the raisin industry. This latter BCR provides the private return to the raisin industry since it excludes the costs of MAP, which are not paid by the raisin industry. Consequently, the total impact of all export promotion programs across all countries resulted in an expansion of total net revenue from exports that is substantially greater than the costs of the programs. The estimated return of 9.51 to 1 compares favorably to other export promotion programs. For example, Kaiser (2015) computed median benefit-cost ratio of 9.52 based on 10 previous evaluation studies of other U.S. export promotion programs. In terms of individual countries/regions, Scandinavia (15.26), Mexico (11.17), and Germany (9.87) have the largest average BCRs when the costs of MAP are included. The countries/regions with the lowest BCRS are Indonesia (3.29), Malaysia (3.50), and China/Hong Kong (3.78). Regarding the private BCR to the raisin industry (excluding the costs of MAP), Mexico (49.15), Scandinavia (23.77), Germany (15.71), and the United Kingdom (12.60) provided exceptionally high BCRs. This was mainly due to the fact that the countries/regions had a much larger proportion of USDA MAP funding than the other regions. Malaysia (4.87), and the Philippines (5.70) had the lowest private BCRs.
4
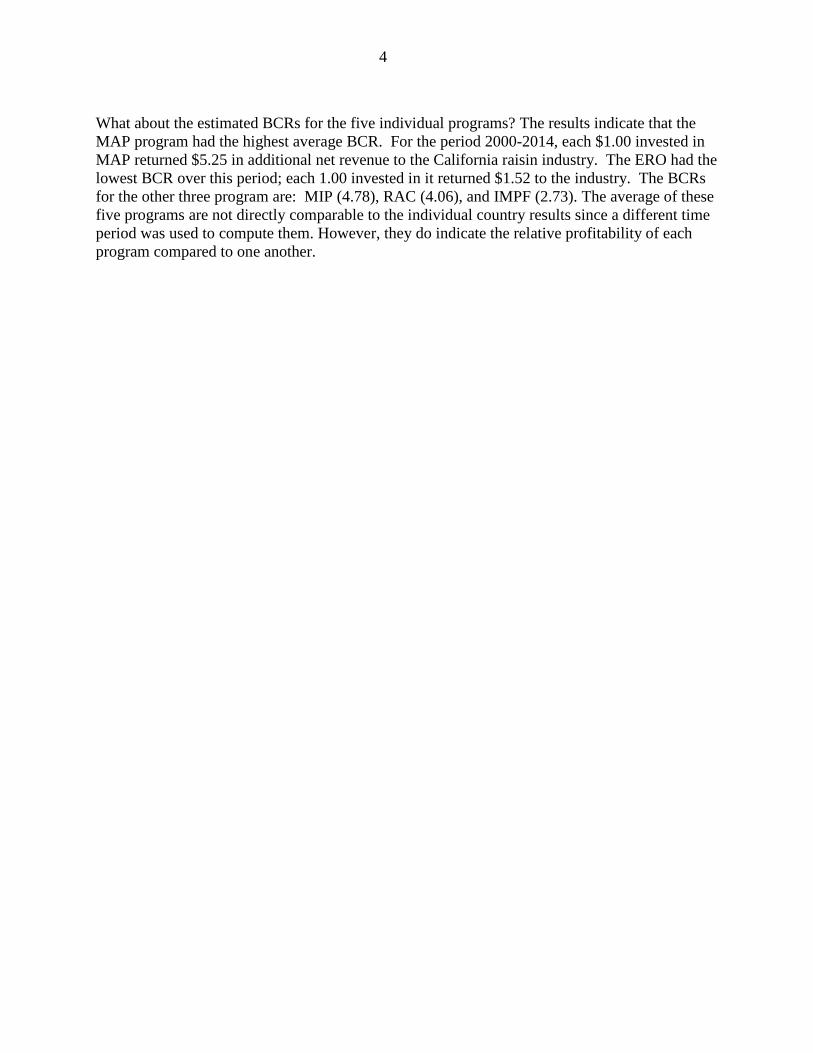
What about the estimated BCRs for the five individual programs? The results indicate that the MAP program had the highest average BCR. For the period 2000-2014, each $1.00 invested in MAP returned $5.25 in additional net revenue to the California raisin industry. The ERO had the lowest BCR over this period; each 1.00 invested in it returned $1.52 to the industry. The BCRs for the other three program are: MIP (4.78), RAC (4.06), and IMPF (2.73). The average of these five programs are not directly comparable to the individual country results since a different time period was used to compute them. However, they do indicate the relative profitability of each program compared to one another.
5
An Economic Analysis of California Raisin Export Promotion Programs
Dr. Harry M. Kaiser Cornell University
The Raisin Administrative Committee (RAC) was established, in part, to administer the
Federal Raisin Marketing Order 989. One of the many functions of the RAC is to conduct export
promotion activities in other countries to increase California Raisin exports. Currently RAC uses
three programs to stimulate sales of raisins to export destinations, including: (1) MAP (Market
Access Program), (2) MIP (Merchandise Incentive Program), and General RAC Funds. Until
2011, the RAC also operated two other major programs to promote California raisins: (1) Export
Replacement Offer (ERO) and (2) Industry Marketing Promotion Fund (IMPF). The ERO began
in the early 1980s as an in-kind program that allowed U.S. raisin exporters to purchase raisins at
a lower than domestic price. The IMPF was a grower-paid advertising and promotion program
for buyers/importers on a per-ton dollar basis. This program involved Asian markets only and
was used as a portion of the matching funds for the MAP. However, the RAC ceased using the
ERO after the 2010-11 marketing year, and the IMPF ended with accruals through 2010/2011,
but was spent into 2011/2012. Even though they are no longer in operation, both of these
programs are included in this analysis since they existed in the past five years, which is the time
frame for the benefit-cost evaluation.
Under the last U.S. Farm Bill, all federal marketing orders operating promotion programs
are required to have economic evaluations conducted to ascertain the extent of their impact on
the market. The purpose of this study is to measure the return on investment (also called benefit-
cost analysis) of raisin export promotion programs operated by the RAC. More specifically, this
6
study measures the effectiveness of each of the five programs as well as the sum of all programs
on enhancing California raisin exports.
In three previous studies, Kaiser (2010), Kaiser (2006), and Kaiser and Liu (1996) found
California Raisin export promotion to be highly effective. In this study, the economic analysis is
extended to the 13 countries/regions that import California raisins: Japan, China/Hong Kong,
South Korea, Taiwan, Singapore, Thailand, Indonesia, Malaysia, Philippines, United Kingdom,
Germany, Scandinavia (Denmark, Finland, Norway, and Sweden), and Mexico. While the RAC
also has a small program in Viet Nam, this country is omitted from the analysis due to data
availability.
In order to assess the effectiveness of the export promotion activities, an econometric
modeling approach is used. The econometric approach quantifies economic relationships using
economic theory and statistical procedures with data. This framework enables us to
simultaneously account for the impact of a variety of factors that influence raisin import demand of
the foreign market in question, including the price of California Raisins, the price of competing
supplier’s raisins, exchange rates, population, consumer income, consumer tastes and preferences,
and the California Raisin industry’s export promotion expenditures. By casting the evaluation in
this type of framework, we can filter out the effect of other factors and, hence, quantify directly the
net impact of California export promotion activities on raisin import demand of the foreign
consumers.
This study provides answers to three key questions regarding the effectiveness of
California Raisin export promotion:
1. What is the responsiveness of the demand for California Raisins in importing countries and overall with respect to California export promotion?
7
2. What would exports of California Raisins been in the importing countries and in total had there not been any California export promotion?
3. How does the gain in export revenue due to California export promotion compare to the
costs of the promotion in the 13 importing countries and in total?
California Raisin Administrative Committee Export Promotion Programs
The export promotion programs examined in this study include the MIP, MAP, general
promotion funds from the RAC, ERO, and the IMPF. Collectively, these programs have had an
average total annual budget of $6 million since 2010 with $1.3 million for MIP, $3 million for
MAP, and $1.7 million for RAC.
The MIP is a cash-incentive program based upon minimum tonnage, and in some
instances, market share of California raisins established by the Committee. The criteria is
established each program year and applies to Natural Seedless raisins exported from February 1
through January 31. The cash incentive is earned by the importer when the program criteria has
been met. The MIP is for Asian markets only.
On an annual basis, the Foreign Agricultural Service (FAS) of the U.S. Department of
Agriculture (USDA) announces promotional funds from their Market Access Program will be
available to industries that desire funding to promote agriculture commodities and agree to
follow the requirements provided by FAS. MAP utilizes the industry’s marketing plan that
contains information about the Raisin industry, analysis of U.S. and world market situation,
shipment history, as well as shipment goals in granting federal funds. A broad activity plan and
proposed budget is included for each country. The RAC establishes performance goals for each
market, and at the end of our year, measures the results and then reports back to FAS the
8
findings. The Reserve Sales and Marketing Subcommittee, with approval from the Committee,
assigns a country budget and implementation begins. The raisin industry has participated and
received federal funding to promote California raisins in selected export markets. MAP funds are
used for both generic and branded activities. Additionally, the raisin industry contributes 120%
of that amount in either cash or services to support the government funds received.
Other advertising and promotional activities are supported in various countries by RAC
funds not delegated to the other three programs. Two specific examples of RAC’s promotion
activities in Japan are the New Product Development Contest and the California Raisin Sticker
program. Each year RAC conducts new product development contests for the bakery and
confectionery trade, and both have become very popular in Japan, as demonstrated by the
increasing number of entries RAC receives each year. The goal is to roll out as many new raisin
products for consumers as possible. More than one hundred products that are currently on store
shelves in Japan have come from these contests. RAC’s California Raisin Sticker program is also
a promotional contest for Japanese consumers, who are encouraged to purchase raisin products
with a special California Raisin sticker that they can pull off and send in for a chance to win a
variety of prizes. The tie-in between the trade and consumers is that the trade must first sign on
to the promotion and put the sticker on its raisin products. Increases in both number of products
and company participation are deemed essential for increasing consumption of California raisins
among Japanese consumers. RAC Japan continues to promote raisin-containing recipe usage in
salads, breads and pastries, entrees and desserts with nearly one hundred articles resulting per
month in consumer & trade publications. Japan also had averaged nearly twenty-five television
cooking show appearances for California raisins per year.
The RAC also used two other programs prior to 2011: Export Replacement Offer and
9
Industry Marketing Promotion Fund. The ERO is designed to make California raisins more price
competitive in export markets. This program began in the early 1980s as an in-kind program that
allowed U.S. raisin exporters to purchase raisins at a lower than domestic price. In 1994, ERO
was half raisin-back and half cash-back and it changed in 1996 to a “cash-back” program,
whereby exporting handlers could qualify for cash reimbursements from the reserve pool for
their export shipments. The ERO has been a cash-back program in all years since then, except for
2000, 2001, and a portion of 2002, 2008, and 2009. During 2000 and 2001 a raisin-back program
was used and during 2002, 2008, and 2009 both “cash-back” and “raisin-back” programs were
implemented. Assets for financing the cash-back program largely accrue from the 10 plus 10
sales of reserve raisins. Since 2005, an average of $60.6 million of reserve pool assets (cash and
raisins) have been used to support exports of about 115,000 packed tons of raisins annually in
both cash-back and raisin-back programs. The IMPF was a grower-paid advertising and
promotion program for buyers/importers on a per-ton dollar basis. This program involved Asian
markets only and was used as a portion of the matching funds for the MAP. However, in these
countries the promotional funds earned by each importer were required to be used to
advertise/promote the California raisin brand they import.
Econometric Methodology
To answer the three questions posed previously, this study quantifies the relationship
between the export promotion effort of the California Raisin industry and the imports of
California Raisins from the 13 foreign markets. The model is based on the economic theory of
consumer demand. In theory, one expects that the export promotion activities are beneficial to
California Raisin growers because the promotion increases the demand of foreign consumers for
10
California Raisins, which results in higher export sales and revenues. However, there are also other
factors that affect import demand. In order to distinguish the impact of the five export promotion
programs on import demand for California Raisins from the impacts of other factors, an
econometric framework is adopted. The econometric approach quantifies economic relationships
using economic theory and statistical procedures with data. It enables one to simultaneously
account for the impact of a variety of factors affecting raisin import demand in the foreign market in
question. These import-demand-determining factors (called “determinants”) include the price of
California Raisins in the importing country, the price of competing supplier’s raisins in the
importing country, consumer income, exchange rates, and the raisin export promotion expenditures
for each of the five programs pertaining to the importing country in question. By casting the export
promotion evaluation in this type of framework, we can filter out the effect of other factors and,
hence, quantify directly the net impact of California export promotion activities on raisin import
demand of foreign consumers.
The raisin import demand models to be developed in this study uses annual time series
data for the 13 countries for the period of 2000-2014. The models assesses how strongly various
California raisin import demand determinants are correlated with the import demand in the
importing country in question. For example, with the model we are able to determine how
important a change in California raisin prices is relative to a change in the MAP promotion
expenditures regarding their impacts on import demand for California raisins.
The following factors are included in the import demand equation for each country to
ascertain the extent, if any, of their impact on annual import demand for California raisins.
1. Imports in the previous year: This variable represents habit formation on the part of
importing countries. Import levels last year should be positively correlated with import
11
levels in the current year. Hence, imports lagged one year is included as an explanatory
variable in the model. Inclusion of imports lagged by one year enables calculation of
short-run and long-run (one year) elasticities for all the other import demand
determinants.
2. Price of California raisins in each importing country: The correlation (or elasticity)
between this variable and the import demand for California raisins is expected to be
negative. That is, an increase in the price of California raisins should be associated with
a decrease in the import demand for California raisins in each importing country. As the
price increases, California raisins become less price-competitive with raisin exports from
other countries, holding all other factors constant. The source for this variable is Global
Atlas, Inc., and it is constructed as a unit value, i.e., total expenditures by the country on
California raisins divided by total U.S. quantity imported.
3. Price of competing exporting countries raisins in each importing country: Since
various countries compete with California exporters (e.g., Turkey, Australia, South
Africa, and Greece), their prices should be positively associated with the import demand
for California raisins. That is, an increase in say Turkish raisin prices should be
associated with an increase in import demand for California raisins since they (California
raisins) are now relatively less expensive. The source for this variable is Global Atlas,
Inc., and it is constructed as a unit value, i.e., total expenditures by the country on rest-of-
the-world (ROW, not including California) raisins divided by total ROW quantity
imported.
4. Gross Domestic Product in each importing country: We expect this variable to be
positively associated with the import demand for California raisins, as the Gross
12
Domestic Product reflects the purchasing power of the importing consumers. The source
for this variable is USDA/ERS.
5. Exchange rates: The value of the U.S. dollar relative to importing country’s currencies
has an important impact on U.S. imports into that country. If the value of the dollar
strengthens relative to the importing country’s currencies, that makes U.S. imports more
expensive, and causes a negative effect on import demand. To account for this impact,
the exchange rate of each of the 13 countries relative to the U.S. dollar is included. The
source for this variable is USDA/ERS.
6. California raisin export promotion expenditures in each importing country: The
export promotion effort is measured as the combined expenditures on the five programs
(MAP, MIP, RAC, IMPF, and ERO). This is the key variable under investigation and
one of the research goals is to conduct statistical tests to ascertain whether or not the
coefficient associated with export promotion is positive and statistically different from
zero. The source for this data is the RAC.
To compare the relative importance of each factor on raisin demand, the results from the
statistical (econometric) model are converted into demand “elasticities.” A demand elasticity
measures the percentage change in raisin demand given a 1% change in a specific demand factor,
holding all other factors constant. For example, the computed price elasticity measures the
percentage change in raisin demand given a 1% change in price. The computed MAP promotion
elasticity measures the percentage change in raisin demand given a 1% change in MAP export
promotion expenditures, and so on. Since demand elasticities are calculated for each demand
factor listed above, one can compare them to determine which factors have the largest impact on
raisin demand in each of the 13 importing countries.
13
Econometric Results
Two versions of the raisin demand model are estimated using panel data with 13
countries/regions and annual time series 2000-01 through 2013-14 are used to estimate the
demand equation. First, the demand model is estimated with the export promotion expenditures
for the five programs combined as one variable. This model is used to examine the overall
effectiveness of California raisin export promotion in increasing raisin demand. The second
demand model is estimated with the export promotion expenditures for the five programs (MAP,
MIP, RAC, IMPF, and ERO) included as five separate variables. This model is used to examine
the effectiveness of each of the five individual programs in increasing raisin demand.
Econometric Results for Model 1
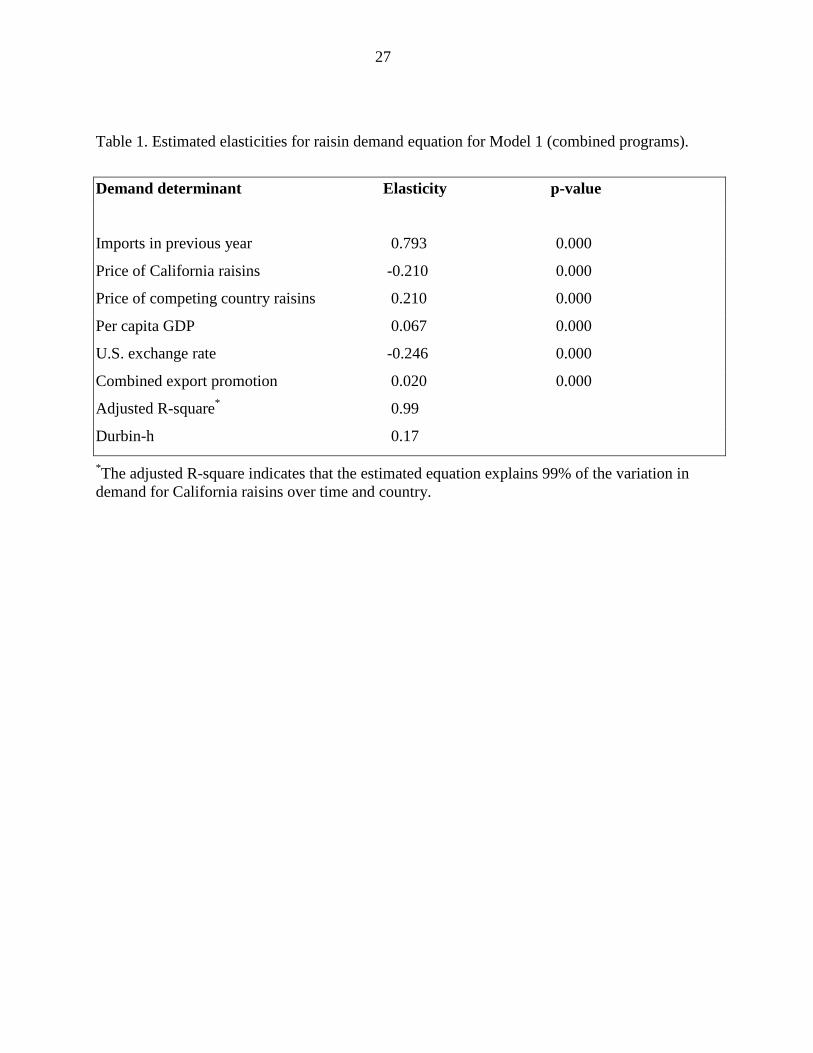
The estimated demand equation for the first model (all five programs combined) is
reported in Table 1. The equation is specified in double-logarithmic form, which has the
convenient feature that each of the estimated coefficients has the interpretation of elasticity that
measures the percent change in the demand for California raisins given a 1% change in the
demand determinant in question, holding constant all other variables.1
1 The double-logarithmic model was selected for four reasons. First, it provides a convenient nonlinear approximation of the function in question without requiring introduction of numerous additional parameters into the model. Second, the double-logarithmic specification is popular in the advertising and promotion literature because the functional form allows for the desired property of diminishing returns to promotion. Third, the estimated marketing coefficient has the convenient interpretation of being the marketing elasticity. Finally, two alternative functional forms (linear and square root) were explored in the estimation but yielded less satisfactory results. Specifically, the goodness-of-fit was similar among the three functional forms. However, the significance level of the estimated parameters suggested that the double-logarithmic model performed better.
To account for the effects
of inflation, prices and GDP are deflated by the consumer price index for each importing country
in the sample. Raisin export promotion expenditures were multiplied by the exchange rate index
14
for the U.S. dollar relative to each country’s currency and then this product is deflated by the
consumer price index. Including exchange rates in this deflation technique ensures that the
purchasing power of the U.S. dollar is adjusted when exchange rates change over time. For
instance, a devalued dollar will have the effect of lowering the impact of export promotion
expenditures, and hence this should be reflected in the export promotion expenditures. Because
export promotion has been shown to have a carry-over effect (i.e., past promotion impacts
current and future exports), the model was estimated using lagged as well as current export
promotion expenditures. The final model featured some lagged as well as current promotion
variables.
To address the potential problem of price endogeneity, an instrumental variable regression
approach is used in which the California raisin import price is regressed on a set of variables,
which includes all exogenous variables from the demand equation. Hence, the model consists of
two equations: (a) a price equation used as an instrumental variable for the endogenous
California raisin import price; and (b) an import demand equation for California raisins, which
includes the predicted California raisin import price from the price equation as one of the
exogenous (instrumental) variables.
An auto-regressive (AR1) process is used to estimate the model. The Durbin-h statistic
reported in the table indicates that the resulting estimated equation is free from serial correlation
problems. Further, the equation fits the data extremely well; the adjusted R-square indicates that
the demand equation explains 99% of the variations in demand for California raisins. The
demand equation has elasticity signs that are consistent with economic theory, and the estimated
15
coefficients are all statistically significant at the p-value < 0.0012
The estimated coefficient on the lagged dependent variable is 0.793. This coefficient
enables the computation of long-run elasticities for the other demand factors. Specifically, the
estimated short-run elasticities can be transformed into long run elasticities by multiplying them
by:
or better. No multicollinearity
was detected.
1/(1 – 0.793) = 4.83.
In other words, the long run elasticities for all demand factors are 4.83 times larger than the short
run elasticities.
The estimated demand model suggests that prices of California and competing countries
raisins are significant determinants explaining variations in raisin import demand in each
country. The model was estimated with the price of California raisins divided by the price of
competing countries raisins since importers look at relative prices in making import decisions.
The estimated short run own-price elasticity is –0.21, indicating that a 1% increase (decrease) in
the California raisin import price relative to the competing countries raisin price would result in a
0.21% decrease (increase) in the quantity demanded for California raisins in the short-run (i.e.,
less than one-year), holding all other demand factors constant. (All elasticities are based on
mean values for the period 2000-2014.) The long run price elasticity is -1.02. That is, a 1%
increase (decrease) in the California raisin import price relative to competing countries raisin
price would result in a 1.02% decrease (increase) in the quantity demanded for California raisins
in the long-run (more than one year), holding all other demand factors constant. Clearly the
relative import price for raisins is an important determinant of its import demand.
2 The p-value gives an measure of how statistical significant from zero the elasticity is and the closer the p-value is to zero, the more statistically significant the elasticity; generally p-values less than 0.100 are considered statistically significant.
16
Another important factor impacting the import demand for California raisins is per capita
GDP. The short-run GDP elasticity is estimated to be 0.067, indicating a 1% increase in per
capita income results in a 0.067% increase in raisin demand, holding all other demand factors
constant. California raisins are therefore considered what economists refer to as a “normal
good,” as demand increases with increases in income. The long-run GDP elasticity is estimated
to be 0.323.
The most important factor impacting the import demand for California raisins is the value
of the dollar, measured as the value of the U.S. dollar relative to the local currency of each
country in the data set. The short-run exchange rate elasticity is -0.246 indicating a 1% increase
in the value of the dollar relative to the importing country currency results in a 0.246% decrease
in California raisin imports, holding all other demand factors constant. The long-run elasticity
for this demand determinant is -1.188. As the value of the dollar rises, it is more expensive for
importers to purchase California raisins as they need to exchange their local currency for dollars
to make such purchases.
Finally, and most importantly to this analysis, the elasticity associated with California
raisin export promotion programs is positive and statistically different from zero.
This means
that the statistical evidence supports the notion that the export promotion efforts of the RAC
have the effect of increasing the import demand for California raisins in the 13 countries/regions.
The estimated short-run export promotion elasticity is 0.020, which means that a 1% increase in
combined raisin export promotion results in a 0.02% increase in import demand for California
raisins, holding all other demand determinants constant. The long-run export promotion
elasticity for the five programs combined is 0.097.
17
Econometric Results for Model 2
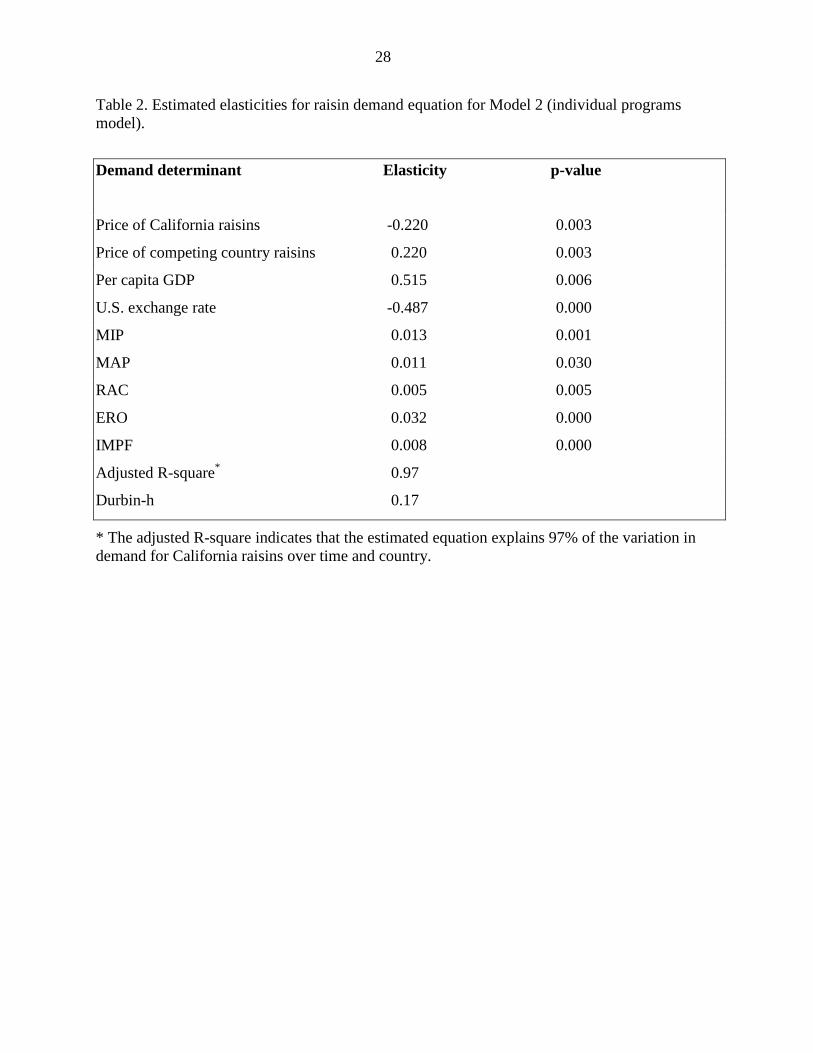
The results of the second model are presented in Table 2. This model is virtually
identical to Model 1, except rather than combining the five export programs as one variable each
are now included as five separate variables in the model. As was the case before, the model fits
the data extremely well; the adjusted R-square indicates that the demand equation explains over
97% of the variations in demand for California raisins. The demand equation has elasticity signs
that are consistent with economic theory, and the estimated coefficients for all the variables are
statistically significant at the 5% level or better. The estimated price, GDP, and exchange rate
elasticities are similar to the previous model, so the attention here is on the export promotion
elasticities.
The estimated promotion elasticities for MIP, MAP, RAC, IMPF, and ERO are all
positive and statistically significant at the 5% level or better. Similar to the last study conducted
by Kaiser (2010), the largest elasticity is for the ERO expenditures, which has an estimated
elasticity of 0.032. That is, a 1% increase in ERO expenditures increased California raisin
exports by 0.032%, holding constant the other import demand factors. The main reason the ERO
had the highest promotion elasticity is that it was the largest program when it was in operation.
The MIP and MAP program had the next highest elasticities. Holding constant all other demand
determinants, a 1% increase in MIP expenditures increased California raisin imports by 0.013%,
while a 1% increase in MAP expenditures increased California raisin imports by 0.011%. The
RAC and IMPF programs also had positive and statistically significant elasticities. Holding
constant all other demand determinants, a 1% increase in IMPF expenditures increased
California raisin imports by 0.008%, while a 1% increase in MAP expenditures increased
California raisin imports by 0.005%.
18
Impact of Combined California Export Promotion Programs on Raisin Exports
Based on the estimated import demand equations, it is clear that California raisin export
promotions have had a positive and significant effect on its exports to all importing countries.
But what about the actual incremental effects on imports to each country and in total, which is
the second research question posed in this study? To examine this question, the estimated import
demand equation is simulated under two scenarios to determine the impact of all export
promotion programs combined on total California raisin exports:
1. Baseline Scenario – All export promotion programs are in effect.
2. No-Export-Promotion Scenario – Same as Baseline Scenario, except export promotion
expenditures for all five programs combined are set to zero.
In the second scenario, all demand determinants except export promotion expenditures are set
equal to historic levels. However, the export promotion variables are set to zero and the
corresponding import demand is simulated over time for each country.3
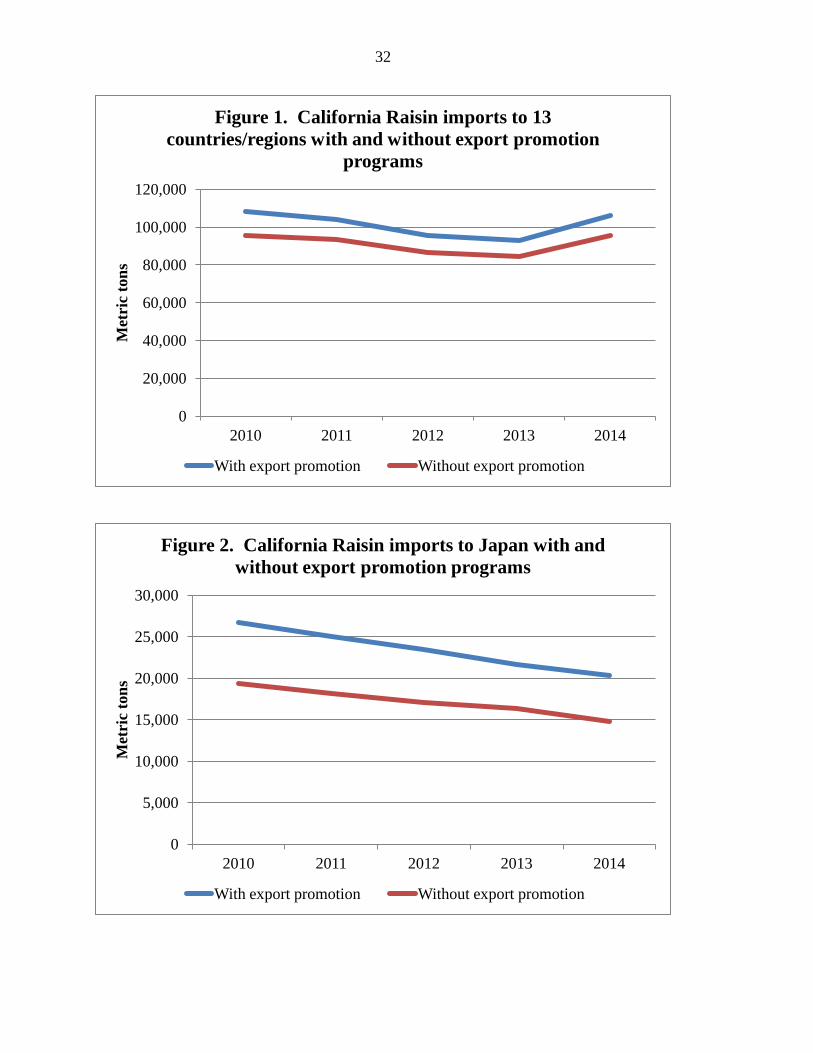
The model is simulated over the most recent five-year period, 2010-2014, for each
country. Figure 1 displays simulated California raisins exports with and without export
promotion to the 13 regions (combined) over this time period. Over this period, California raisin
export promotion resulted in a total incremental increase in imports of California raisins of
50,093 metric tons. In other words, had there been no California raisin export promotion in these
The difference between
the two scenarios gives the impact of California raisin combined export promotion on imports of
California raisins in the foreign markets in question.
3 Because of the logarithmic functional form, export promotion expenditures in all countries are set to a very small fraction (0.5%) of historical levels in this scenario since the log of zero is undefined.
19
countries over this period, annual California raisin imports would have averaged 10,019 metric
tons less than they actual were. In percentage terms, this means that had there not been any
export promotion programs run by the RAC, California raisin imports would have been 9.9%
lower than they actually were.
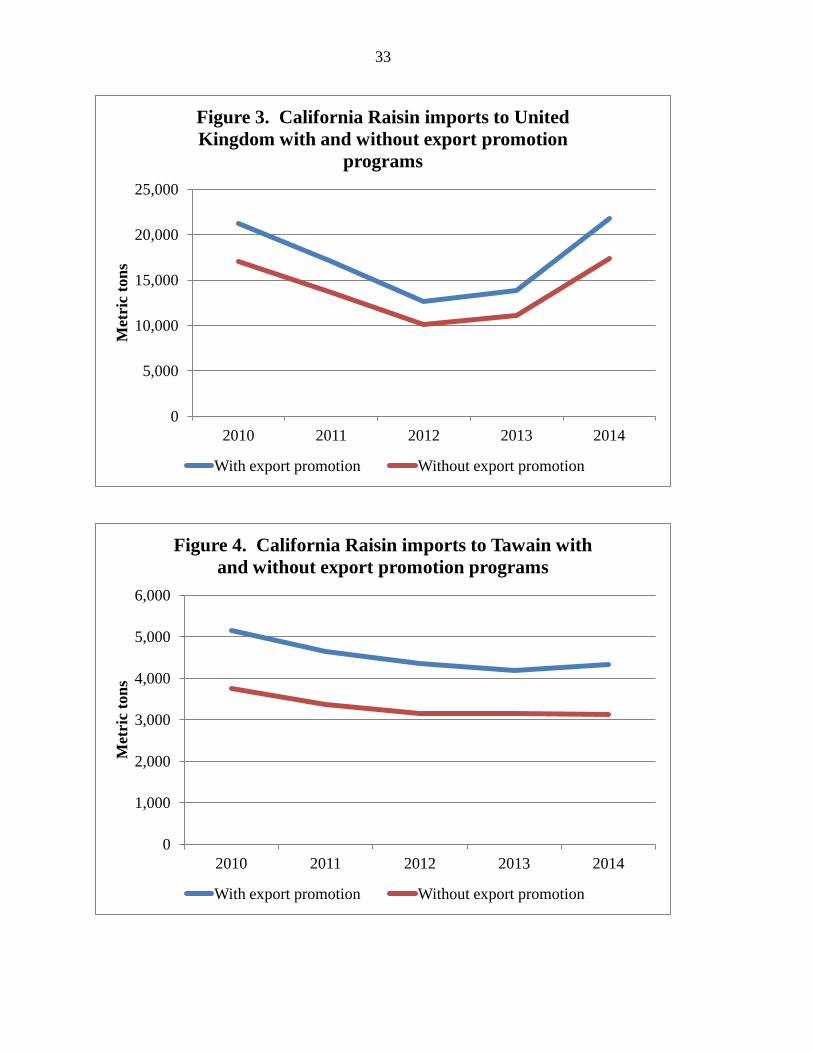
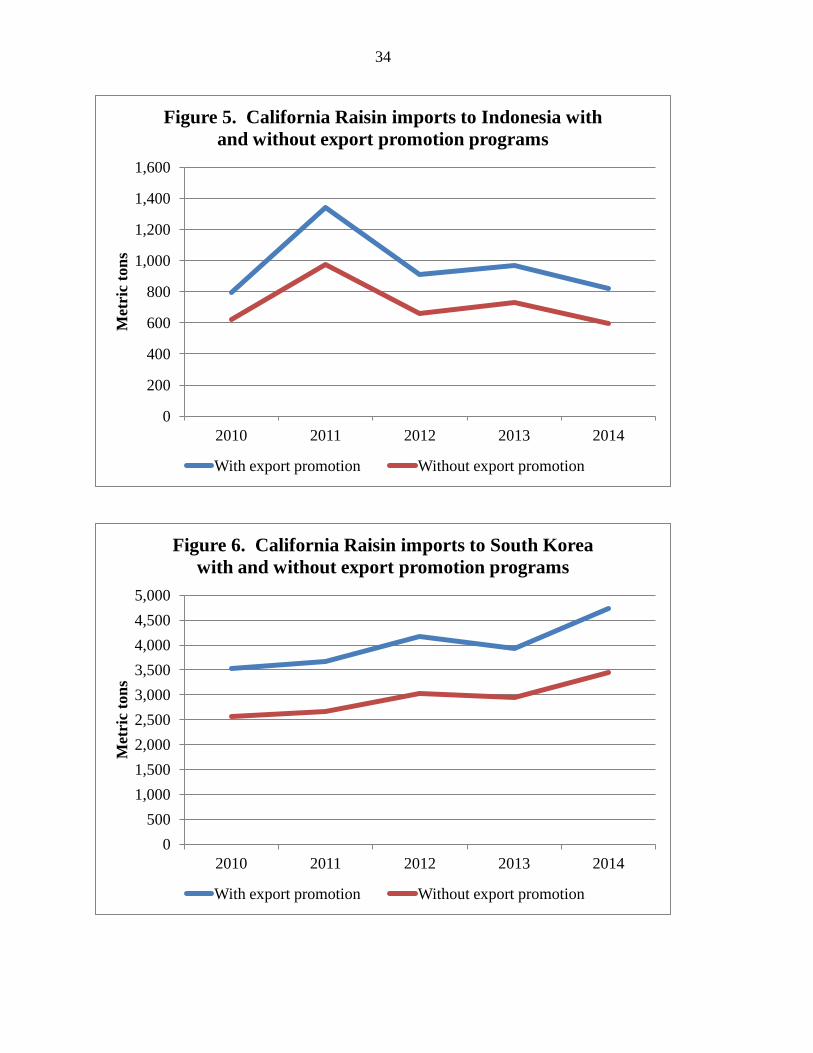
The model is also simulated for this period for each country. Figures 2-14 illustrate the
simulation results on the quantity of imports for each country. These figures strikingly shows the
impact of California raisin export promotion programs on raisin imports. In terms of the various
country’s responsiveness to California raisin export promotion, the largest markets for
incremental California raisins sales due to California raisin export promotion are Japan and the
United Kingdom. Over the period 2010-2014, California raisin export promotion had the impact
of adding 31,562 and 17,232 additional metric tons of California raisins, respectively in the
United Kingdom and Japan (Figures 2 and 3). In other words, had there been no California
raisin export promotion in Japan and the United Kingdom, imports would have been 26.9% and
19.9% lower, respectively, over this period.
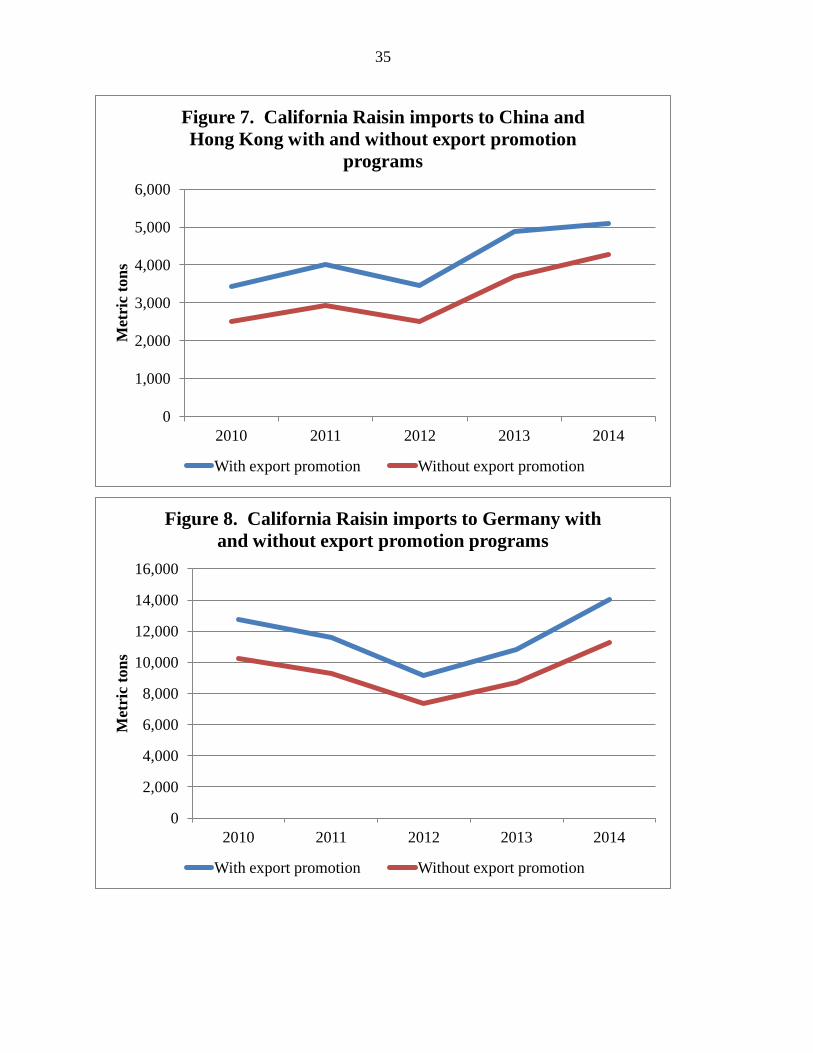
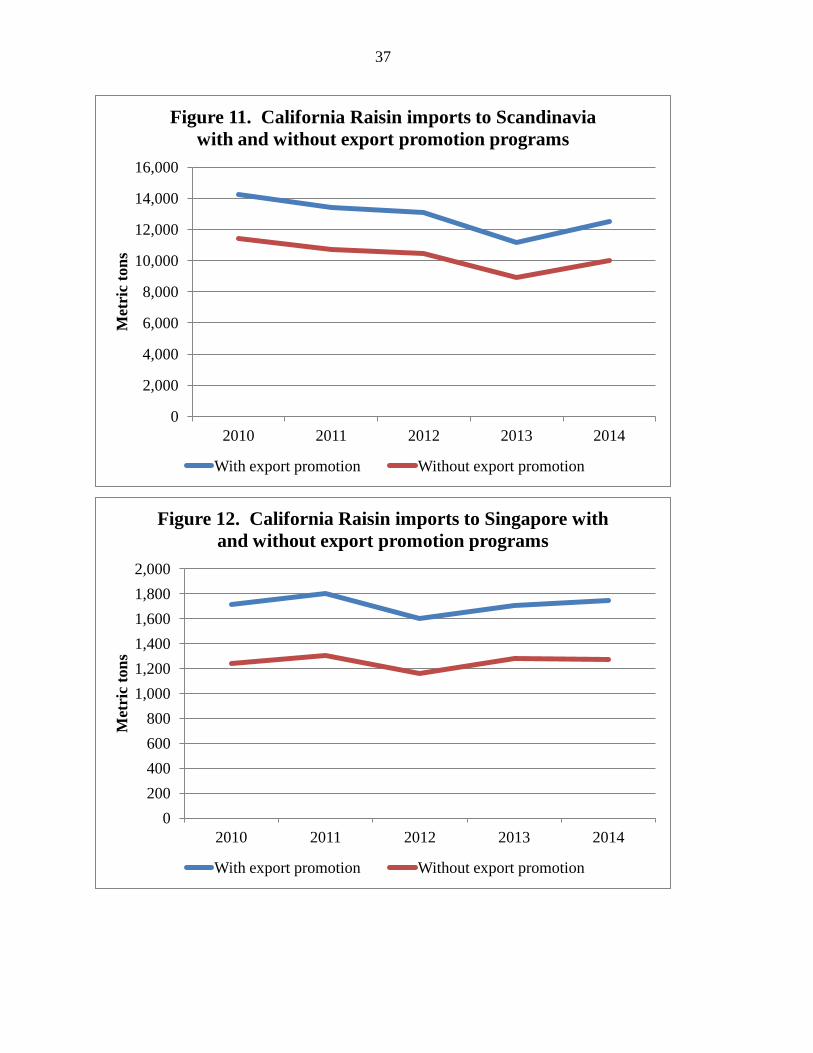
Scandinavia (Figure 11) is the third most important market for California raisins in terms
of the impact of California raisin export promotions. Over this period, California raisin export
added an additional 12,829 metric tons of California raisin imports to Scandinavia. On a
percentage basis, imports to Scandinavia would have been 19.9% lower than they actually were
had California raisin export not implemented export promotion programs in this market. Export
promotion of California raisins in Germany (Figure 8) also had a large responsiveness. From
2010 through 2014, California raisin export promotion programs increased imports to this
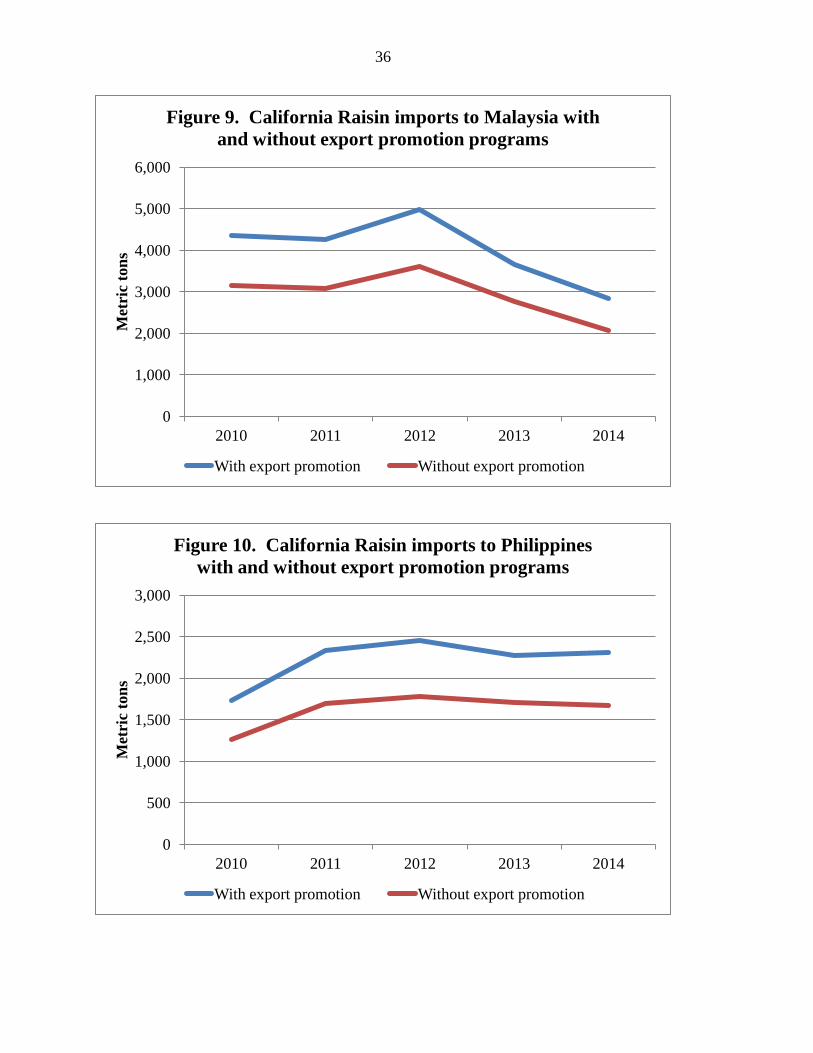
country by 11,648 metric tons, or 19.9%. Export promotion of California raisins in Taiwan,
Malaysia, South Korea, and China/Hong Kong (Figures 4, 9, 6, and 7) increased imports by
20
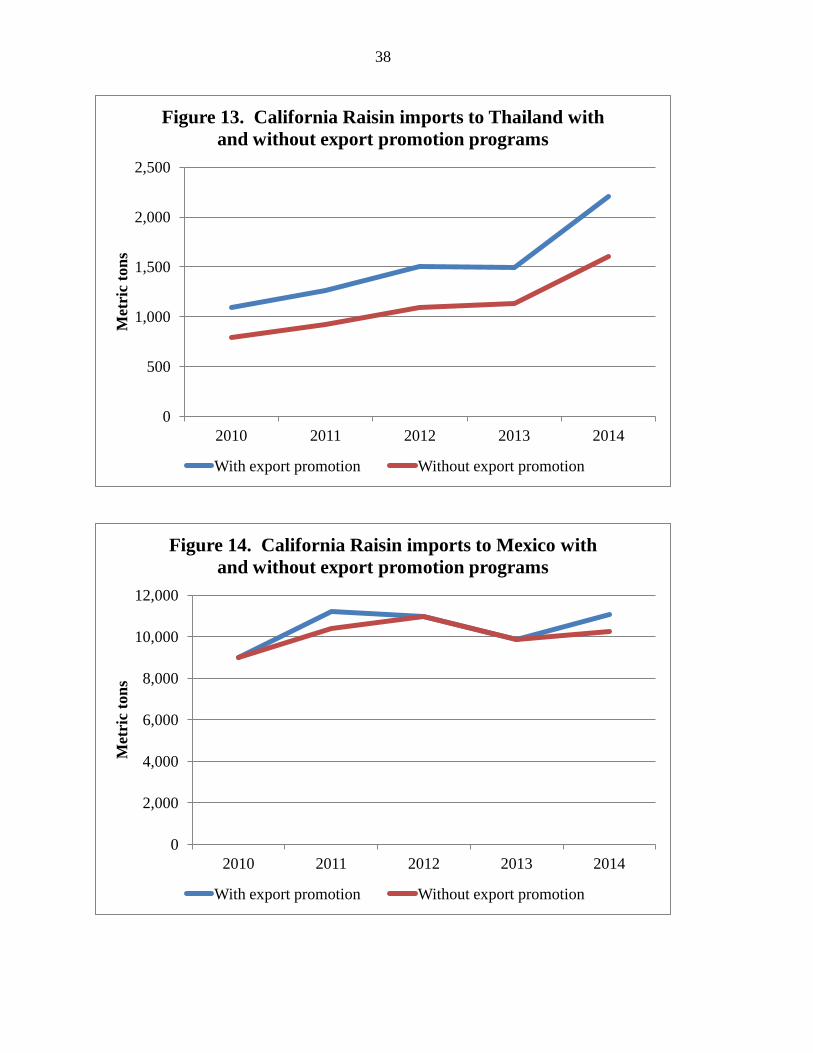
6,102, 5,409, 5,390, and 5,024 metric tons, respectively to these countries. The responsiveness
of California raisin export promotion in other markets also had significant incremental impacts
on imports, including: Singapore (Figure 12, 2,304 incremental metric tons), Philippines (Figure
10, 2,989 incremental metric tons), Thailand (Figure 13, 2,035 incremental metric tons),
Indonesia (Figure 5, 1,255 incremental metric tons), and Mexico (1,646 Figure 14 metric tons).
Hence, it is clear that California export promotion programs have had a large positive effect on
the level of imports to the various countries.
Average Benefit Cost Analysis
While it is clear that export promotion of California raisins had a major impact on
boosting exports, the third research question posed is more bottom-line in nature: how does the
benefits of California raisin export promotion compare with their costs? To address this question,
an average benefit-cost ratio (BCR) is computed for export promotion in each country, as well as
all countries and programs combined. The average benefit-cost ratios, also known as average
rates of return on investment, are useful since they provided a measure of returns (in dollars) to
the California raisin industry for every dollar invested in export promotion.
The increase in California raisin imports due to the RAC’s export promotion programs
described above assumed that all other demand determinants, including price, remained constant.
However, generally an increase in demand will cause price to increase as well. Hence, in order
to evaluate the full effect of the RAC’s export promotion programs on imports and price, one
needs to incorporate the supply response of California raisin exporters into the model. To do
this, an estimate of the export supply response is necessary.
21
Previous econometric studies of fruit commodities have indicated that it is often
problematic to obtain a reliable estimate of supply response to price. This is due to the long time
lag between plantings and harvest. Consequently, harvest in any particular year is generally a
function of yield, which is influenced by weather conditions and is largely unaffected by price.
This makes it difficult to statistically determine any positive correlation between fruit production
and price. Therefore, an econometric supply model is not developed in this study. Instead, an
approach similar to that in previous studies by Alston et al. (1996), Crespi and Sexton, Kaiser,
and Schmit and Kaiser is followed. In this approach, the supply response is incorporated using a
constant elasticity form, and sensitivity analysis is conducted on a range of assumed own-price
supply elasticities.4
Given the lack of previous estimates of own-price elasticity of California raisin export
supply, ε is assumed to be equal to 1.0, which seems plausible. The model is then solved with a
supply elasticity value of 2.0 to gauge how sensitive the BCR is to the assumed value.
Given the simulation procedures described above, the change in net economic benefits
due to the RAC export promotion effort is computed for each year from 2010 to 2014 as the
difference in producer surplus (∆PS) between the two scenarios (baseline and no export
promotion scenarios) outlined above, which mathematically is equal to the following:
∆PSt = (P′t Q′t – Pt Qt
where P′
)/(1 + ε),
tQ′t represents gross export revenue for the baseline scenario and PtQt
represents gross
export revenue for the no export promotion scenario. Producer surplus is a measure of net
revenue for the California raisin industry. The average benefit-cost ratio is equal to ∆PS divided
4 An “own-price elasticity of supply” measures the percentage change in quantity supplied given a 1% change in the price of the commodity.
22
by the costs of the RAC export promotion programs. The average benefit-cost ratio measures the
average increase in producer surplus (measured in dollars) given each one-dollar investment in
RAC export promotion. For example, a benefit-cost ratio (BCR) of 2.0 would imply that
California raisin growers receive $2 in additional net revenue (producer surplus) for every dollar
invested in raisin export promotion. In other words, in this case the benefits would exceed the
cost by twofold.
Two BCRs are computed. The first includes the costs of all five programs. This gives the
total return on investment to export promotion. The second excludes the cost of the MAP
program, which is funded entirely from FAS/USDA. This can therefore be interpreted as a
private return to just raisin grower funds.
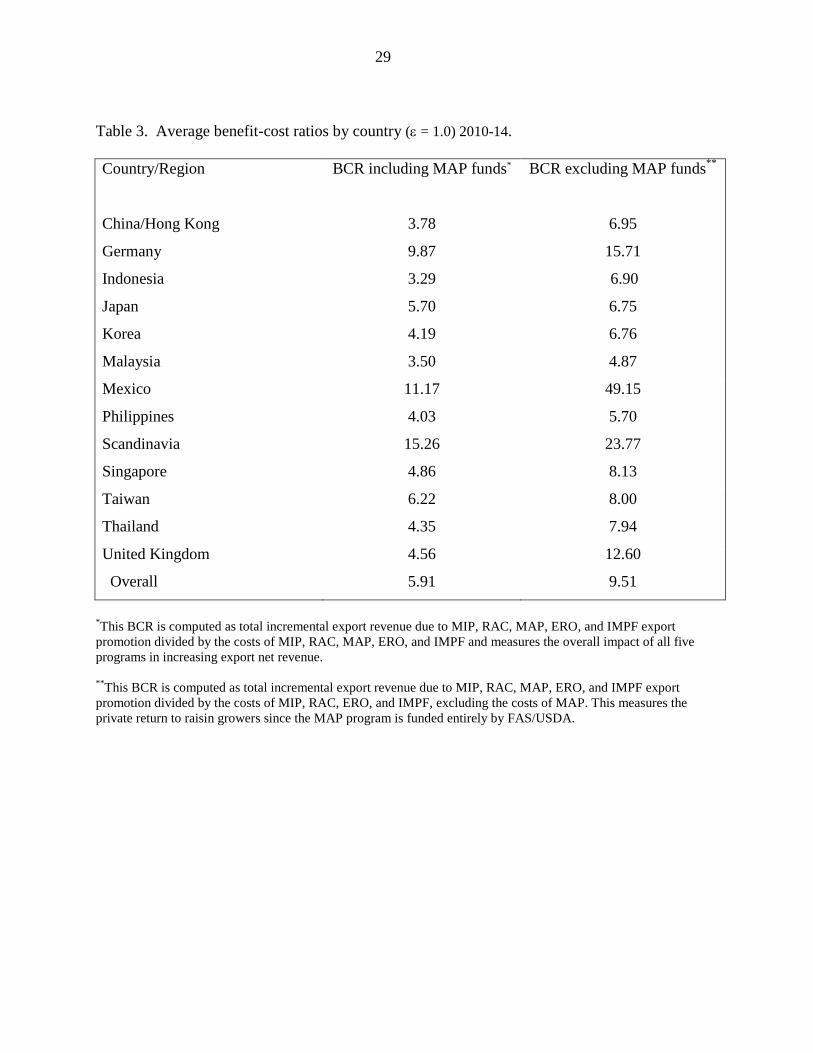
Table 3 presents the average benefit-cost ratios (BCRs) by country5
5 The econometric results from Model 2 were used in this simulation to derive the average BCR by country.
. These results use the
assumed export supply elasticity equal to 1.0. The overall average BCR for all countries is 5.91
when the costs of MAP are included. That is, each $1.00 invested in all California raisin export
promotion programs in all countries returned, on average, $5.91 in additional net revenue to the
raisin industry. When the costs of MAP are not included, the overall BCR rises to 9.51. That is,
each $1.00 invested in all California raisin export promotion programs in all countries returned,
on average, $9.51 in additional export revenue to the raisin industry. This latter BCR provides
the private return to the raisin industry since it excludes the costs of MAP, which are not paid by
the raisin industry. Consequently, the total impact of all export promotion programs across all
countries resulted in an expansion of total net revenue from exports that is substantially greater
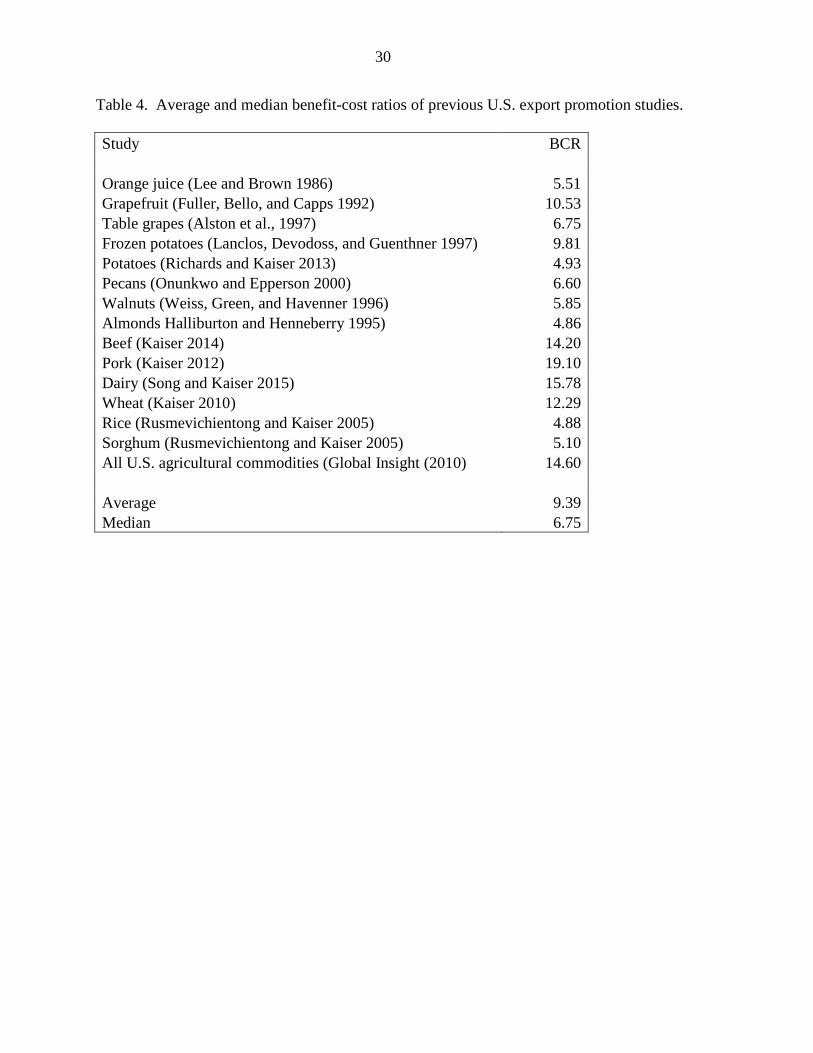
than the costs of the programs. The estimated return of 9.51 to 1 compares favorably to other
export promotion programs. For example, Table 4 lists the estimated BCR of 15 previous studies
23
of various U.S. export promotion programs. The average BCR from these studies is 9.39 and the
median is 6.75.
In terms of individual countries/regions, Scandinavia (15.26), Mexico (11.17), and
Germany (9.87) have the largest average BCRs when the costs of MAP are included. The
countries/regions with the lowest BCRS are Indonesia (3.29), Malaysia (3.50), and China/Hong
Kong (3.78). Regarding the private BCR to the raisin industry (excluding the costs of MAP),
Mexico (49.15), Scandinavia (23.77), Germany (15.71), and the United Kingdom (12.60)
provided exceptionally high BCRs. This was mainly due to the fact that the countries/regions had
a much larger proportion of USDA MAP funding than the other regions. Malaysia (4.87), and the
Philippines (5.70) had the lowest private BCRs.
To see how sensitive these results are to the assumed export supply elasticity for
California raisins, Model 2 was re-solved by doubling the export elasticity value from 1.0 to 2.0.
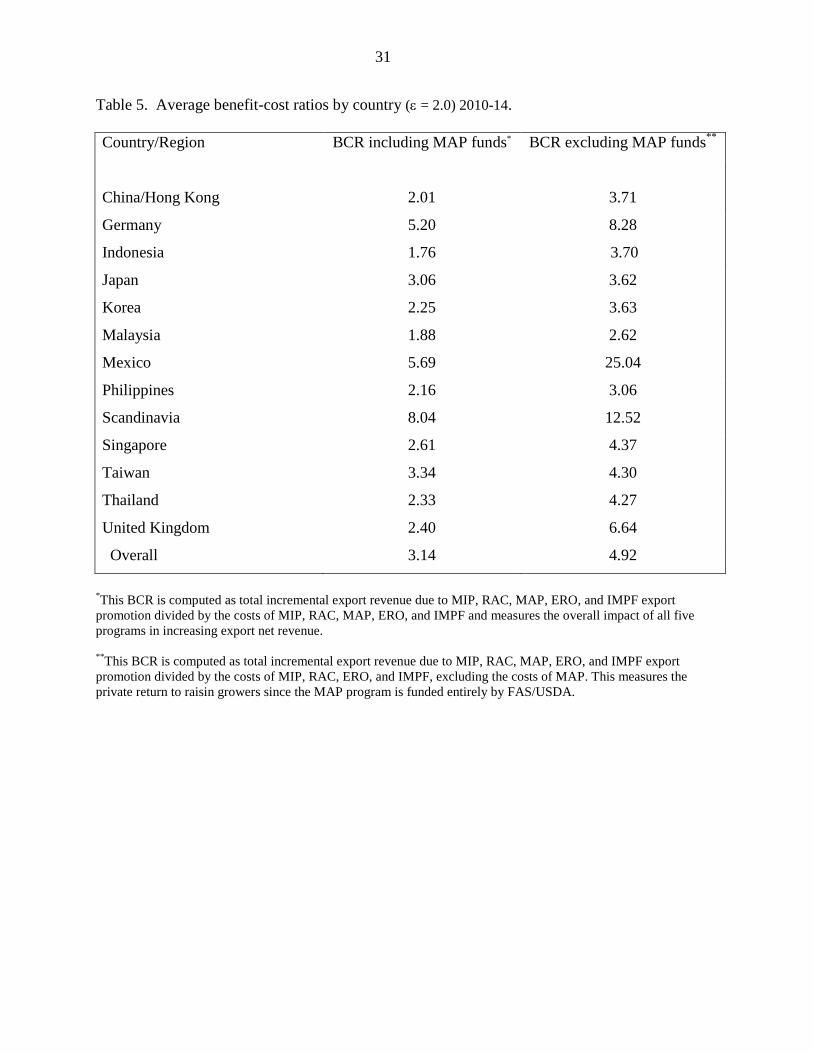
The results for this simulation are presented in Table 5. Naturally, the BCRs decline under this
scenario since there is a greater supply response to any price increases caused by California
raisin export promotion in the importing countries. The overall average BCR for all countries is
3.14 when the costs of MAP are included. That is, each $1.00 invested in all California raisin
export promotion programs in all countries returned, on average, $3.14 in additional net revenue
to the raisin industry. When the costs of MAP are not included, the overall BCR is 4.92 for ε=2.
That is, each $1.00 invested in all California raisin export promotion programs in all countries
returned, on average, $4.92 in additional export revenue to the raisin industry. For all countries
the estimated BCRs are still well above 1.0 indicating that the net benefits from California raisin
export promotion are positive even under a very high assumed export supply elasticity.
24
What about the estimated BCRs for the five individual programs? To examine this,
Model 2 was simulated for each individual program. Because the ERO and IMPF were not in
effect since 2011, a longer time period (2000-2014) was used to simulate the impacts of the five
programs. The assumed export supply elasticity for this simulation is 1.0. The results indicate
that the MAP program had the highest average BCR. For the period 2000-2014, each $1.00
invested in MAP returned $5.25 in additional net revenue to the California raisin industry. The
ERO had the lowest BCR over this period; each 1.00 invested in it returned $1.52 to the industry.
The BCRs for the other three program are: MIP (4.78), RAC (4.06), and IMPF (2.73). The
average of these five programs are not directly comparable to the individual country results since
a different time period was used to compute them. However, they do indicate the relative
profitability of each program compared to one another.
25
References Alston, J.M. James A. Chalfant, Jason E. Christian, Erika Meng, and Nicholas Piggott. “The California Table Grape Commission’s Promotion Program: An Evaluation.” Giannini Foundation of Agricultural Economics Monograph Series (University of California, University of California), 1997. Fuller, S., H. Bello, and O. Capps. “Import Demand for U.S. Fresh Grapefruit: Effect of U.S. Promotion Programs and Trade Policies of Importing Nations.” Southern Journal of Agricultural Economics July (1992): 251-260. Halliburton, K. and S.R. Henneberry. “The Effectiveness of U.S. Nonprice Promotion of Almonds in the Pacific Rim.” Journal of Agricultural and Resource Economics 20(1995): 108-121. Kaiser, H.M. “An Economic Analysis of California Raisin Export Promotion.” Report to the Raisin Adminsitrative Committee. 2010. Kaiser, H.M. “An Economic Analysis of the National Pork Board Checkoff Program.” Report to the National Pork Board. 2012. Kaiser, H.M. “An Economic Analysis of the Cattlemen’s Beef Promotion and Research Board Demand-Enhancing Programs.” Report to the Cattleman’s Beef Promotion and Research Board. 2014. Lanclos, D., S. Devadoss, and J. Guenthner. “Impacts of Foreign Direct Investment and Advertising on the Export Demand for U.S. Frozen Potatoes.” Agribusiness 13(1997): 273-284. Lee, J.Y. and M.G. Brown. “Economic Effectiveness of Brand Advertising Programs for U.S. Orange Juice in the European Market: An Error Component Analysis.” Journal of Agricultural Economics. 37(1986):385. Onunkwo, I.M. and J.E. Epperson. “Export Demand for U.S. Pecans: Impacts of U.S. Export Promotion Programs.” Agribusiness: An International Journal 16(2000): 253-266. Richards, T. and H.M. Kaiser. “Evaluation of Grower-Funded Marketing Activities by the United States Potato Board.” Report to the U.S. Potato Board. 2012.
Rusmevichientong, Pimbucha and Harry M. Kaiser. “Are There Halo Effects of U.S. Grain Export Promotion?” Applied Economics. 43(2011):1435-46.
Song, Liang and Harry M. Kaiser. “An Economic Evaluation of Market Development Programs for U.S. Dairy Products.” Applied Economics, forthcoming 2015.
Weiss, K.R., R.D. Green, and A.M. Havenner. “Walnuts in Japan: A Case Study of Generic Promotion Under the USDA’s Market Promotion Program.” In Agricultural Commodity
26
Promotion Policies and Programs in the Global Agri-Food System, Proceedings of NEC-63 Conference, NICPRE, Cornell University, May 1996: 47-80.
27
Table 1. Estimated elasticities for raisin demand equation for Model 1 (combined programs).
Demand determinant Elasticity p-value
Imports in previous year 0.793 0.000
Price of California raisins -0.210 0.000
Price of competing country raisins 0.210 0.000
Per capita GDP 0.067 0.000
U.S. exchange rate -0.246 0.000
Combined export promotion 0.020 0.000
Adjusted R-square*
Durbin-h 0.17
0.99
*
The adjusted R-square indicates that the estimated equation explains 99% of the variation in demand for California raisins over time and country.
28
Table 2. Estimated elasticities for raisin demand equation for Model 2 (individual programs model).
Demand determinant Elasticity p-value
Price of California raisins -0.220 0.003
Price of competing country raisins 0.220 0.003
Per capita GDP 0.515 0.006
U.S. exchange rate -0.487 0.000
MIP 0.013 0.001
MAP 0.011 0.030
RAC 0.005 0.005
ERO 0.032 0.000
IMPF 0.008 0.000
Adjusted R-square*
Durbin-h 0.17
0.97
* The adjusted R-square indicates that the estimated equation explains 97% of the variation in demand for California raisins over time and country.
29
Table 3. Average benefit-cost ratios by country (ε = 1.0) 2010-14.
Country/Region BCR including MAP funds BCR excluding MAP funds* **
China/Hong Kong 3.78 6.95
Germany 9.87 15.71
Indonesia 3.29 6.90
Japan 5.70 6.75
Korea 4.19 6.76
Malaysia 3.50 4.87
Mexico 11.17 49.15
Philippines 4.03 5.70
Scandinavia 15.26 23.77
Singapore 4.86 8.13
Taiwan 6.22 8.00
Thailand 4.35 7.94
United Kingdom 4.56 12.60
Overall 5.91 9.51
*
This BCR is computed as total incremental export revenue due to MIP, RAC, MAP, ERO, and IMPF export promotion divided by the costs of MIP, RAC, MAP, ERO, and IMPF and measures the overall impact of all five programs in increasing export net revenue.
**
This BCR is computed as total incremental export revenue due to MIP, RAC, MAP, ERO, and IMPF export promotion divided by the costs of MIP, RAC, ERO, and IMPF, excluding the costs of MAP. This measures the private return to raisin growers since the MAP program is funded entirely by FAS/USDA.
30
Table 4. Average and median benefit-cost ratios of previous U.S. export promotion studies. Study BCR Orange juice (Lee and Brown 1986) 5.51 Grapefruit (Fuller, Bello, and Capps 1992) 10.53 Table grapes (Alston et al., 1997) 6.75 Frozen potatoes (Lanclos, Devodoss, and Guenthner 1997) 9.81 Potatoes (Richards and Kaiser 2013) 4.93 Pecans (Onunkwo and Epperson 2000) 6.60 Walnuts (Weiss, Green, and Havenner 1996) 5.85 Almonds Halliburton and Henneberry 1995) 4.86 Beef (Kaiser 2014) 14.20 Pork (Kaiser 2012) 19.10 Dairy (Song and Kaiser 2015) 15.78 Wheat (Kaiser 2010) 12.29 Rice (Rusmevichientong and Kaiser 2005) 4.88 Sorghum (Rusmevichientong and Kaiser 2005) 5.10 All U.S. agricultural commodities (Global Insight (2010) 14.60 Average 9.39 Median 6.75
31
Table 5. Average benefit-cost ratios by country (ε = 2.0) 2010-14.
Country/Region BCR including MAP funds BCR excluding MAP funds* **
China/Hong Kong 2.01 3.71
Germany 5.20 8.28
Indonesia 1.76 3.70
Japan 3.06 3.62
Korea 2.25 3.63
Malaysia 1.88 2.62
Mexico 5.69 25.04
Philippines 2.16 3.06
Scandinavia 8.04 12.52
Singapore 2.61 4.37
Taiwan 3.34 4.30
Thailand 2.33 4.27
United Kingdom 2.40 6.64
Overall 3.14 4.92
*
This BCR is computed as total incremental export revenue due to MIP, RAC, MAP, ERO, and IMPF export promotion divided by the costs of MIP, RAC, MAP, ERO, and IMPF and measures the overall impact of all five programs in increasing export net revenue.
**This BCR is computed as total incremental export revenue due to MIP, RAC, MAP, ERO, and IMPF export promotion divided by the costs of MIP, RAC, ERO, and IMPF, excluding the costs of MAP. This measures the private return to raisin growers since the MAP program is funded entirely by FAS/USDA.
32
0
20,000
40,000
60,000
80,000
100,000
120,000
2010 2011 2012 2013 2014
Met
ric
tons
Figure 1. California Raisin imports to 13
countries/regions with and without export promotion programs
With export promotion Without export promotion
0
5,000
10,000
15,000
20,000
25,000
30,000
2010 2011 2012 2013 2014
Met
ric
tons
Figure 2. California Raisin imports to Japan with and without export promotion programs
With export promotion Without export promotion
33
0
5,000
10,000
15,000
20,000
25,000
2010 2011 2012 2013 2014
Met
ric
tons
Figure 3. California Raisin imports to United Kingdom with and without export promotion
programs
With export promotion Without export promotion
0
1,000
2,000
3,000
4,000
5,000
6,000
2010 2011 2012 2013 2014
Met
ric
tons
Figure 4. California Raisin imports to Tawain with and without export promotion programs
With export promotion Without export promotion
34
0
200
400
600
800
1,000
1,200
1,400
1,600
2010 2011 2012 2013 2014
Met
ric
tons
Figure 5. California Raisin imports to Indonesia with
and without export promotion programs
With export promotion Without export promotion
0 500
1,000 1,500 2,000 2,500 3,000 3,500 4,000 4,500 5,000
2010 2011 2012 2013 2014
Met
ric
tons
Figure 6. California Raisin imports to South Korea with and without export promotion programs
With export promotion Without export promotion
35
0
1,000
2,000
3,000
4,000
5,000
6,000
2010 2011 2012 2013 2014
Met
ric
tons
Figure 7. California Raisin imports to China and Hong Kong with and without export promotion
programs
With export promotion Without export promotion
0
2,000
4,000
6,000
8,000
10,000
12,000
14,000
16,000
2010 2011 2012 2013 2014
Met
ric
tons
Figure 8. California Raisin imports to Germany with and without export promotion programs
With export promotion Without export promotion
36
0
1,000
2,000
3,000
4,000
5,000
6,000
2010 2011 2012 2013 2014
Met
ric
tons
Figure 9. California Raisin imports to Malaysia with
and without export promotion programs
With export promotion Without export promotion
0
500
1,000
1,500
2,000
2,500
3,000
2010 2011 2012 2013 2014
Met
ric
tons
Figure 10. California Raisin imports to Philippines with and without export promotion programs
With export promotion Without export promotion
37
0
2,000
4,000
6,000
8,000
10,000
12,000
14,000
16,000
2010 2011 2012 2013 2014
Met
ric
tons
Figure 11. California Raisin imports to Scandinavia
with and without export promotion programs
With export promotion Without export promotion
0 200 400 600 800
1,000 1,200 1,400 1,600 1,800 2,000
2010 2011 2012 2013 2014
Met
ric
tons
Figure 12. California Raisin imports to Singapore with and without export promotion programs
With export promotion Without export promotion
38
0
500
1,000
1,500
2,000
2,500
2010 2011 2012 2013 2014
Met
ric
tons
Figure 13. California Raisin imports to Thailand with
and without export promotion programs
With export promotion Without export promotion
0
2,000
4,000
6,000
8,000
10,000
12,000
2010 2011 2012 2013 2014
Met
ric
tons
Figure 14. California Raisin imports to Mexico with and without export promotion programs
With export promotion Without export promotion