
An ECG Telemetry System
44
EE3 Group Project 2004/05 An ECG Telemetry System Part 2: Design Martin Jackson Shyam Patel Ramanan Rajaraman Amrit Sharma Mark Thomas Ashwin Thurairajah
Transcript of An ECG Telemetry System
EE3 Group Project 2004/05
An ECG Telemetry SystemPart 2: Design
Martin Jackson Shyam Patel
Ramanan Rajaraman Amrit Sharma Mark Thomas
Ashwin Thurairajah

EE3 Group Project – ECG Telemetry System
i
Executive Summary
It was established in the Project Inception Report that there is a huge demand for portable ECG equipment which can record a patient's heart activity continuously over a long period of time, while allowing the patient to live a relatively normal life at home and not have to stay in a hospital ward.
Our solution is a complete system, purchased by a hospital or clinic. When a patient has a heart problem which cannot be immediately diagnosed:
• The patient will be given a portable ECG device to wear which monitors his heart.
• The patient can upload the data recorded by the device to the hospital via the internet, and is prompted to do so at regular intervals.
• This data is stored on a central computer in the department, and automatically analysed for irregularities.
• When irregularities are found in the patient’s data, his / her doctor is sent an email.
• The doctor can then review the ECG data easily and quickly to decide upon a further course of action.
The portable ECG device can record up to a full 12-lead ECG. The data is stored to a Compact Flash card, which can be removed and read by a PC, which is used to send the information back to the hospital. By having a large memory, the patient can wear the equipment for the whole day or longer, living an unrestricted life, and just uploading data a couple of times a day. The device has an LCD display and shows the patient’s heart rate in real time. An Atmel Atmega128 processor and an Altera Flex 10K FPGA device have been chosen as the basis of this design.
The software product is designed for a Local Area Network in a hospital department. Data being uploaded by a patient is received by a central server in the department, and is automatically analysed and stored to a database. This way, there is minimal risk of ECG data being lost or accidentally deleted.
The ECG data collected is processed to try and find irregularities, which can help the doctor to make a diagnosis. The data is processed in two stages. First, the standard ECG parameters such as beat rate, S-T interval and QRS duration are calculated using signal processing techniques. This parameter data is then searched to find heart beats which show combinations of irregularities indicative of certain heart conditions.
Once the doctor responsible for a patient has been warned that irregularities have been found, he can use any PC within the departmental or hospital network to view the ECG data and make a diagnosis.
This solution has been designed to be flexible to further development, and has the potential to be an extremely successful product.
2004-5 EE3 Group Project: An ECG Telemetry Device Part 2: Design
Martin Jackson, Shyam Patel, Ramanan Rajaraman, Amrit Sharma, Mark Thomas & Ashwin Thurairajah

ii
EE3 Group Project – ECG Telemetry System
1
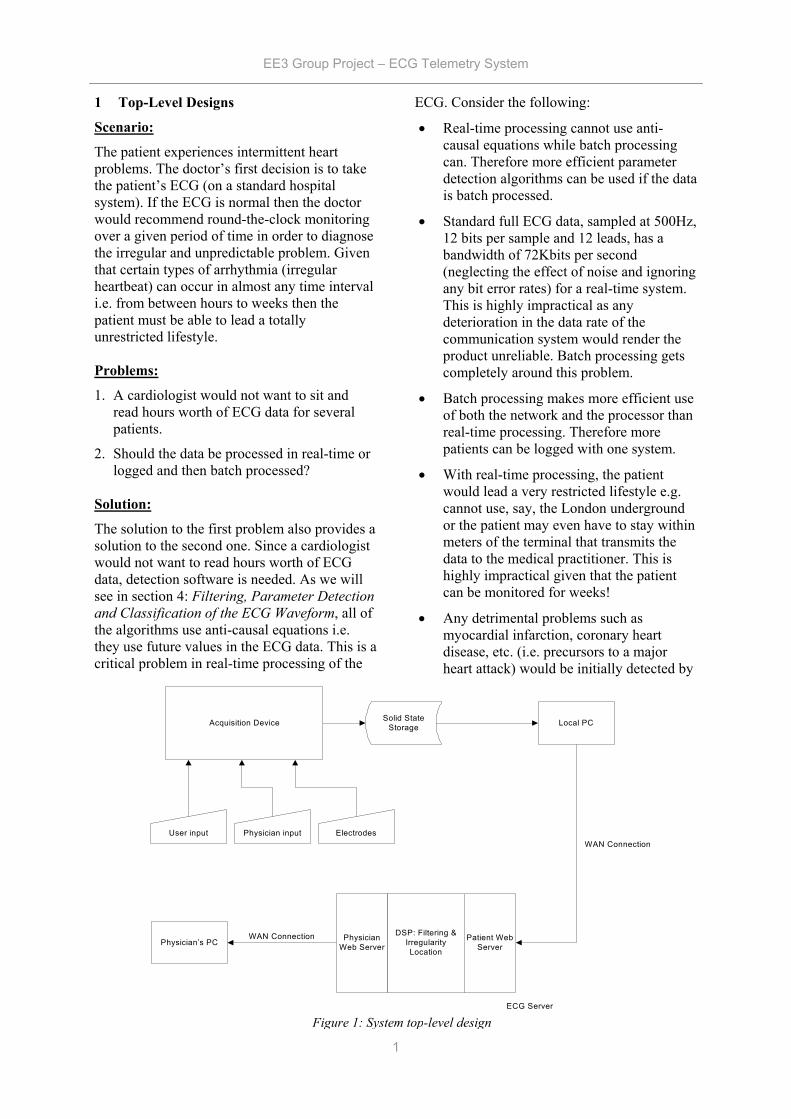
1 Top-Level Designs
Scenario:
The patient experiences intermittent heart problems. The doctor’s first decision is to take the patient’s ECG (on a standard hospital system). If the ECG is normal then the doctor would recommend round-the-clock monitoring over a given period of time in order to diagnose the irregular and unpredictable problem. Given that certain types of arrhythmia (irregular heartbeat) can occur in almost any time interval i.e. from between hours to weeks then the patient must be able to lead a totally unrestricted lifestyle. Problems:
1. A cardiologist would not want to sit and read hours worth of ECG data for several patients.
2. Should the data be processed in real-time or logged and then batch processed?
Solution:
The solution to the first problem also provides a solution to the second one. Since a cardiologist would not want to read hours worth of ECG data, detection software is needed. As we will see in section 4: Filtering, Parameter Detection and Classification of the ECG Waveform, all of the algorithms use anti-causal equations i.e. they use future values in the ECG data. This is a critical problem in real-time processing of the
ECG. Consider the following:
• Real-time processing cannot use anti-causal equations while batch processing can. Therefore more efficient parameter detection algorithms can be used if the data is batch processed.
• Standard full ECG data, sampled at 500Hz, 12 bits per sample and 12 leads, has a bandwidth of 72Kbits per second (neglecting the effect of noise and ignoring any bit error rates) for a real-time system. This is highly impractical as any deterioration in the data rate of the communication system would render the product unreliable. Batch processing gets completely around this problem.
• Batch processing makes more efficient use of both the network and the processor than real-time processing. Therefore more patients can be logged with one system.
• With real-time processing, the patient would lead a very restricted lifestyle e.g. cannot use, say, the London underground or the patient may even have to stay within meters of the terminal that transmits the data to the medical practitioner. This is highly impractical given that the patient can be monitored for weeks!
• Any detrimental problems such as myocardial infarction, coronary heart disease, etc. (i.e. precursors to a major heart attack) would be initially detected by
Solid StateStorage Local PC
Physician’s PCWAN Connection Physician
Web Server
DSP: Filtering &IrregularityLocation
Patient WebServer
WAN Connection
ECG Server
Acquisition Device
User input ElectrodesPhysician input
Figure 1: System top-level design
EE3 Group Project – ECG Telemetry System
2
the doctor. Therefore we’re mainly concerned with diagnosing diseases that cannot be detected by a conventional ECG i.e. irregular heart conditions that are usually treated over a period of time. Hence real-time data transfer poses no advantage over data logging.
Conclusion:
There is no real advantage in sending an ECG in real time for the types heart condition this project is aimed towards. Since most irregular problems such as tachycardia, bradhycardia, atrial fibrillation, etc. do not require emergency attention i.e. the patient can be treated over the course of a few days/weeks. However it would be useful for the patient to know when his/her heart beat is reaching a dangerous level (note that proper diagnosis requires full ECG data). Therefore the proposal is a real-time heart beat monitor, that simply tells the patient when his/her heart-rate exceeds an acceptable limit, coupled with a batch processing ECG system with diagnostic tools to aid the doctor in specifically determining the disease. In this way the patient would know if, say, he/she may have had a minor heart attack or an arrhythmia while the doctor would have the proper ECG data to diagnose the patient.
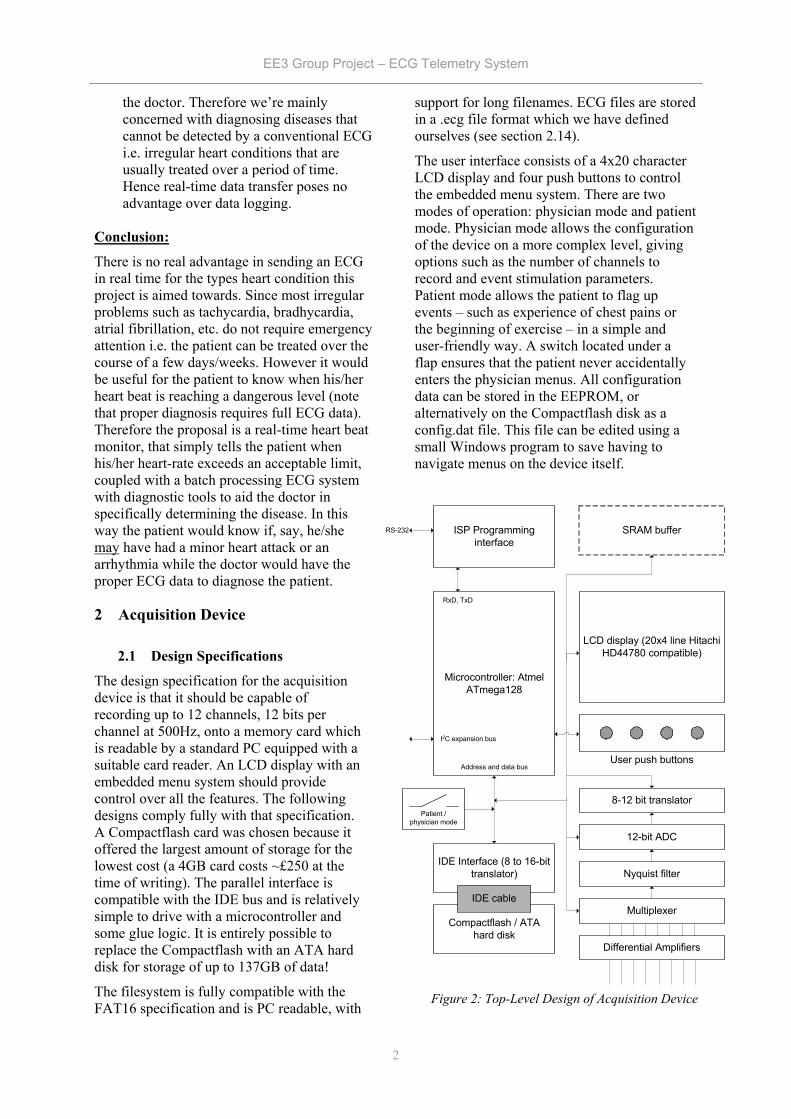
2 Acquisition Device
2.1 Design Specifications
The design specification for the acquisition device is that it should be capable of recording up to 12 channels, 12 bits per channel at 500Hz, onto a memory card which is readable by a standard PC equipped with a suitable card reader. An LCD display with an embedded menu system should provide control over all the features. The following designs comply fully with that specification. A Compactflash card was chosen because it offered the largest amount of storage for the lowest cost (a 4GB card costs ~£250 at the time of writing). The parallel interface is compatible with the IDE bus and is relatively simple to drive with a microcontroller and some glue logic. It is entirely possible to replace the Compactflash with an ATA hard disk for storage of up to 137GB of data!
The filesystem is fully compatible with the FAT16 specification and is PC readable, with
support for long filenames. ECG files are stored in a .ecg file format which we have defined ourselves (see section 2.14).
The user interface consists of a 4x20 character LCD display and four push buttons to control the embedded menu system. There are two modes of operation: physician mode and patient mode. Physician mode allows the configuration of the device on a more complex level, giving options such as the number of channels to record and event stimulation parameters. Patient mode allows the patient to flag up events – such as experience of chest pains or the beginning of exercise – in a simple and user-friendly way. A switch located under a flap ensures that the patient never accidentally enters the physician menus. All configuration data can be stored in the EEPROM, or alternatively on the Compactflash disk as a config.dat file. This file can be edited using a small Windows program to save having to navigate menus on the device itself.
Figure 2: Top-Level Design of Acquisition Device
ISP Programminginterface
Microcontroller: AtmelATmega128
LCD display (20x4 line HitachiHD44780 compatible)
RxD, TxD
RS-232
Address and data bus
IDE Interface (8 to 16-bittranslator)
Compactflash / ATAhard disk
IDE cable
User push buttons
Nyquist filter
12-bit ADC
8-12 bit translator
Multiplexer
SRAM buffer
Differential Amplifiers
I2C expansion bus
Patient /physician mode
EE3 Group Project – ECG Telemetry System
3
2.2 Power Supply
This device is entirely self-contained and battery-powered, with no external supply present during normal operation. Care has been taken to keep power consumption low, helped largely by running the entire system from a single regulated 3.3V supply. The battery itself has not yet been chosen, but the Linear Technology LT1300 switched-mode power supply can regulate a 3.3V supply with input voltages from 1.8-10V, allowing for a wide range of batteries to be used.
Care has also been taken to decouple the supply rail at the input of the devices. Each device has three parallel capacitors: 10µF, 10nF and 910pF; three are used because the inductive reactance of high-value devices increases with frequency, so a 10µF capacitor alone would be insufficient to fully decouple the supply. Analogue components also use an HF70 ferrite choke to provide further supply noise suppression.
The high-gain analogue components should be encased in a screened aluminium enclosure. The system itself can be placed in a plastic box as the digital circuitry would not be significantly affected by ambient noise. The design of these enclosures has not yet taken place since decisions cannot be made until a PCB has been designed.
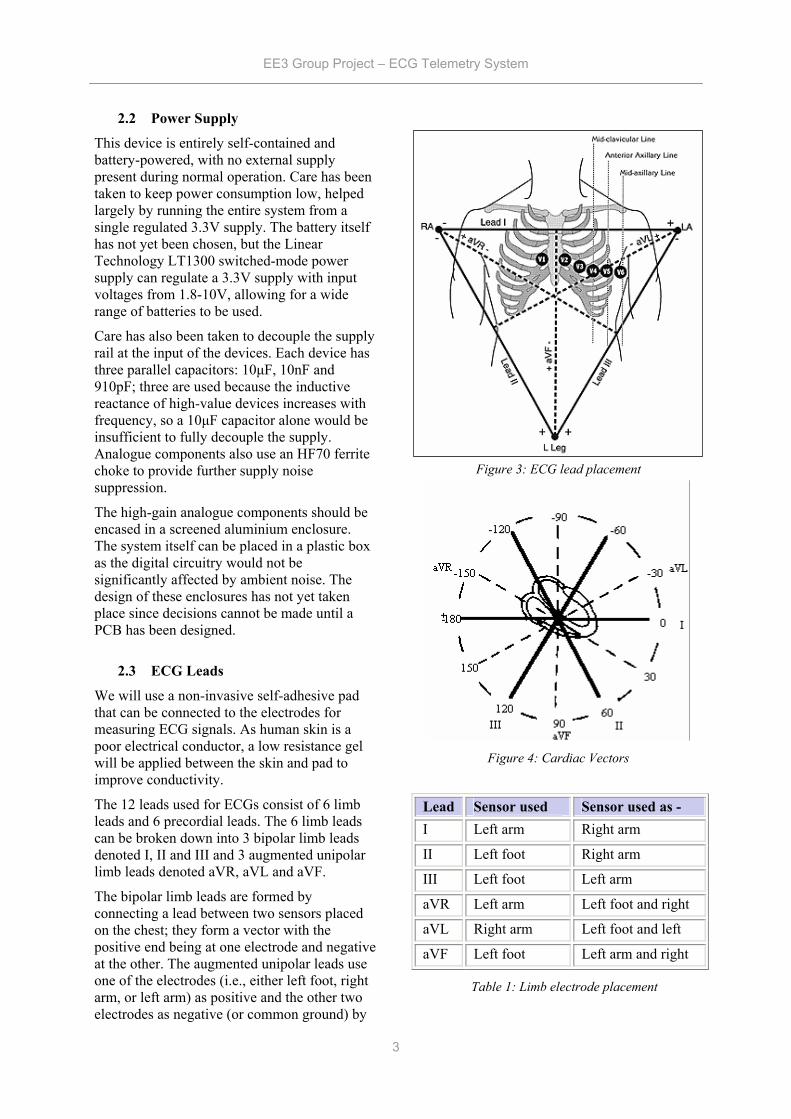
2.3 ECG Leads
We will use a non-invasive self-adhesive pad that can be connected to the electrodes for measuring ECG signals. As human skin is a poor electrical conductor, a low resistance gel will be applied between the skin and pad to improve conductivity.
The 12 leads used for ECGs consist of 6 limb leads and 6 precordial leads. The 6 limb leads can be broken down into 3 bipolar limb leads denoted I, II and III and 3 augmented unipolar limb leads denoted aVR, aVL and aVF.
The bipolar limb leads are formed by connecting a lead between two sensors placed on the chest; they form a vector with the positive end being at one electrode and negative at the other. The augmented unipolar leads use one of the electrodes (i.e., either left foot, right arm, or left arm) as positive and the other two electrodes as negative (or common ground) by
Lead Sensor used Sensor used as - I Left arm Right arm
II Left foot Right arm
III Left foot Left arm
aVR Left arm Left foot and right
aVL Right arm Left foot and left
aVF Left foot Left arm and right
Figure 3: ECG lead placement
Table 1: Limb electrode placement
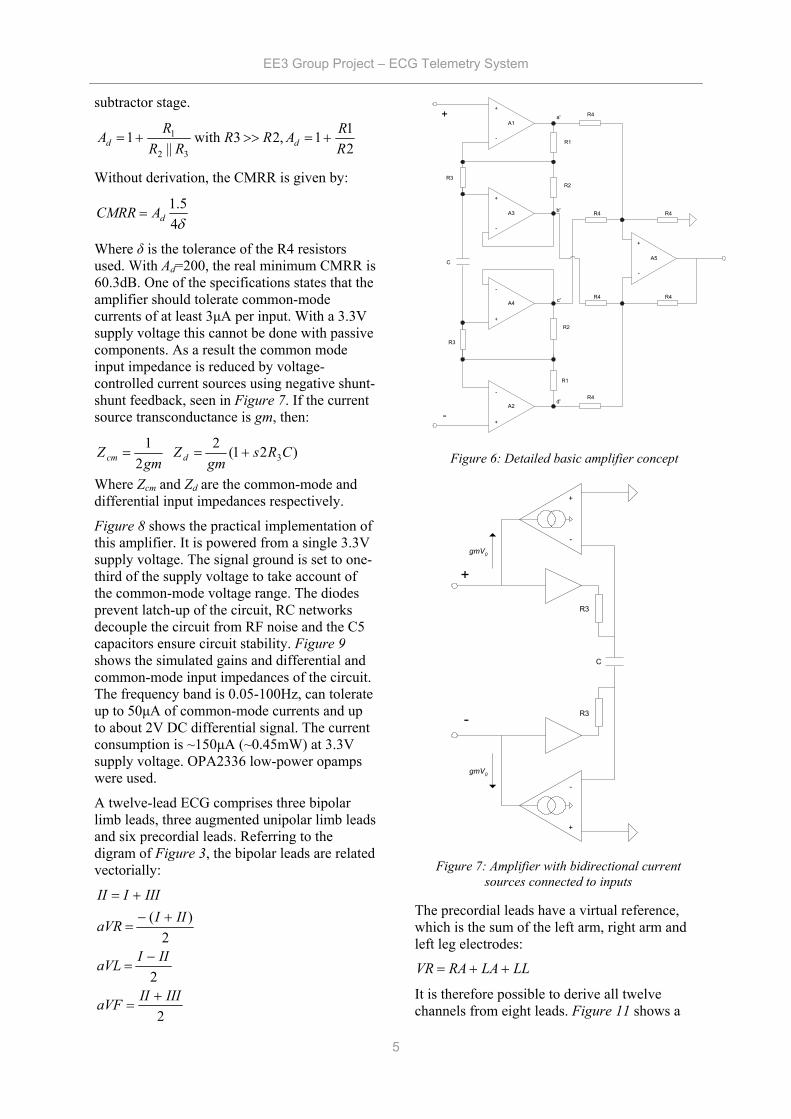
Figure 4: Cardiac Vectors

EE3 Group Project – ECG Telemetry System
4
connecting them together. Table 1 illustrates all the inter-connections for limb leads:
The precordial leads are denoted V1, V2, V3, V4, V5 and V6. They measure the amplitude of the cardiac current in an anterior-posterior form as opposed to the limb leads that measure signals in a horizontal fashion. The positioning of the leads is described in Table 2.
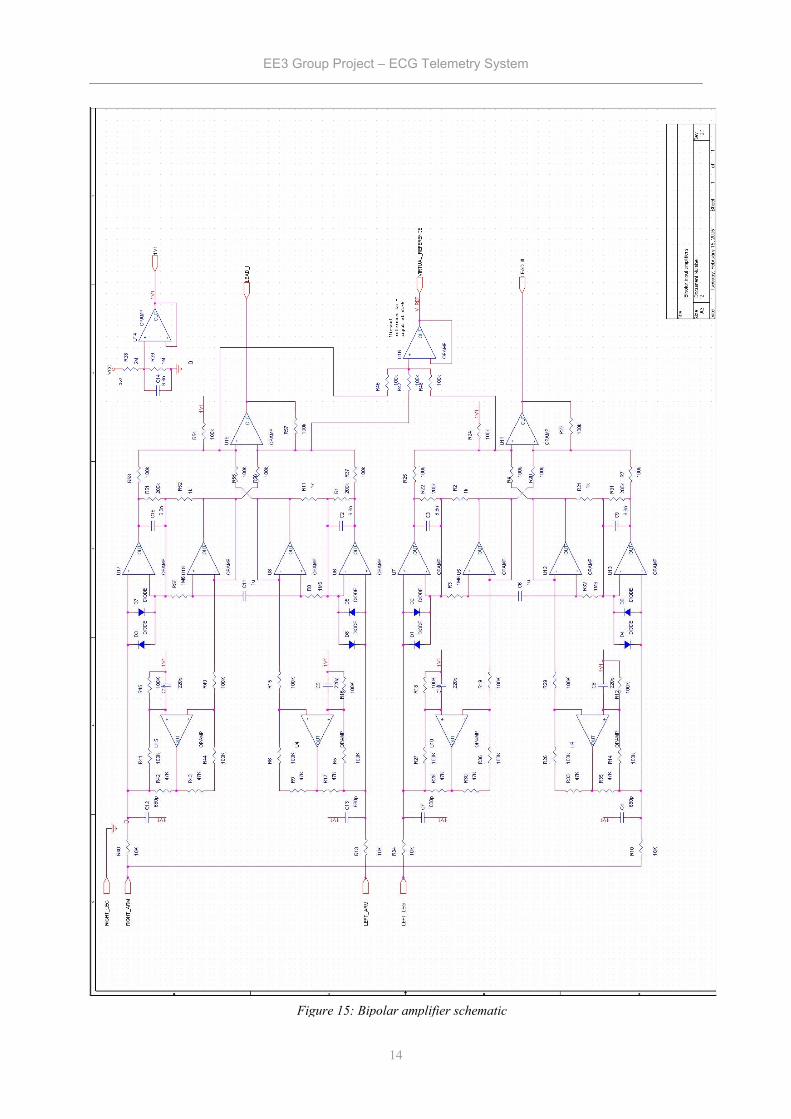
2.4 Amplifiers
The signal from the electrodes consists of a small AC signal voltage (up to 5mV), a large AC common-mode component (up to 1.5 V) and a large variable DC component (up to 300 mV). The main performance characteristics of ECG amplifiers for this application can be summarised as follows:
• -3dB points at 0.05 and 100Hz • Tolerance of DC input voltage (of level
depending on the type of electrode) without input stage saturation.
• Overall gain in the range 200-1000 (40-60dB), with a maximum input signal of about ±5mV in without output stage saturation.
• Differential input impedance >5MΩ in the entire frequency band
• Common-mode rejection ratio (CMRR) >60dB
• For a two-electrode amplifier, the inputs should tolerate at least 3µA common mode current per input, without saturation of the input stage
• Low power consumption (<1mW)
The design, based upon a technical note in Medical & Biological Engineering & Computingi, exceeds these specifications and runs on a single-ended 3.3V supply. The design would be considerably simpler and cheaper if
higher-voltage, double-ended supplies were available (±10V or so). However, battery life in this system is key, so the number of regulated supplies must be kept to a minimum since no regulator is 100% efficient. The supply voltage of the digital components cannot be anything other than 3.3V, so the more flexible analogue circuitry has had to work around this. The following is a brief explanation to its operation; consult the reference for more detail.
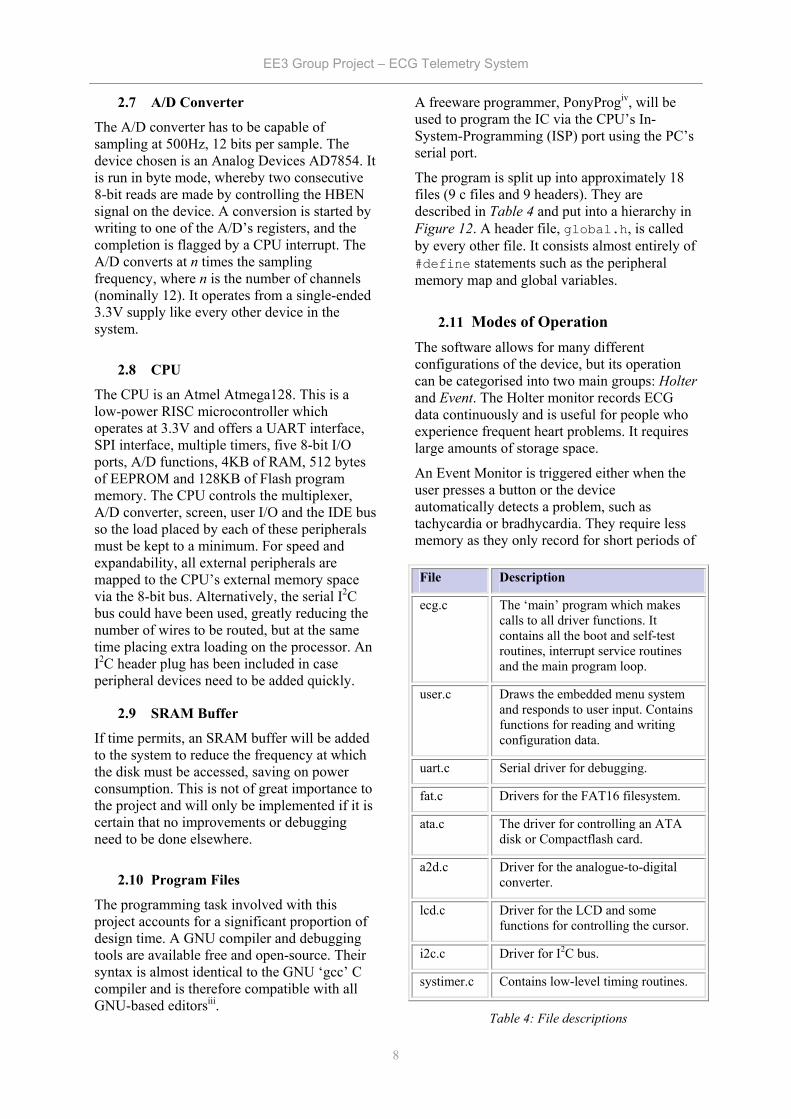
Figure 5 shows the simplified amplifier circuit. Each of the differential inputs is buffered and AC decoupled by capacitor C and resistors R3, much like an instrumentation amplifier. The differential amplifiers which follow each amplify half the differential input signal and their outputs are added to form the amplified, single-ended signal referenced to a 0V supply rail.
Mathematically,
)(21
2
)(
3
3inNinPd
dcbadout
VVCRs
CRsA
VVVVAV
−+
=
−+−=
The high-pass cutoff frequency is defined by 2R3C. Figure 6 shows a more detailed circuit. A1-4 form the input stage; A1 and A2 are the main gain stages and A3 an A4 are unity gain buffers. R3 and R4 are virtually in parallel as the A3 and A4 input voltages equal their output voltages, so:
32
3321
2
3
3
2
1 RRRR
R
R
IRRIII
RR
II
+=+=
=
The A1 and A2 amplifiers take one-half the differential AC signal each. The DC component is filtered by C and appears at the A3 and A4 outputs. The second stage is a four-input adder /
Lead Placement
V1 Right 4th intercostal space
V2 Left 4th intercostal space
V3 Halfway between V2 and V4
V4 Left 5th intercostal space, mid-clavicular line
V5 Horizontal to V4, anterior axillary line
V6 Horizontal to V5, mid-axillary line
Ad
+
-
+
+
-
AdR3
R3
C
a
b
c
d
+
-
Figure 5: basic amplifier circuit concept
Table 2: Precordial electrode placement
EE3 Group Project – ECG Telemetry System
5
subtractor stage.
211,23 with
||1
32
1
RRARR
RRRA dd +=>>+=
Without derivation, the CMRR is given by:
δ45.1
dACMRR =
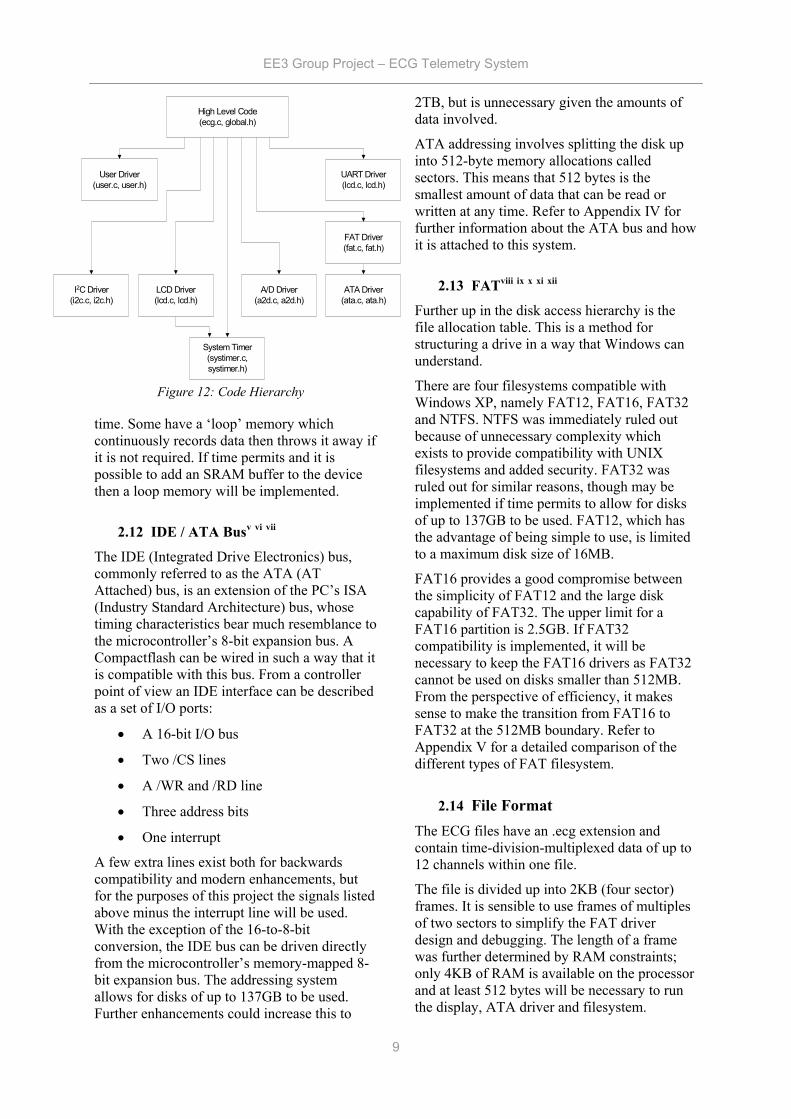
Where δ is the tolerance of the R4 resistors used. With Ad=200, the real minimum CMRR is 60.3dB. One of the specifications states that the amplifier should tolerate common-mode currents of at least 3µA per input. With a 3.3V supply voltage this cannot be done with passive components. As a result the common mode input impedance is reduced by voltage-controlled current sources using negative shunt-shunt feedback, seen in Figure 7. If the current source transconductance is gm, then:
)21(2 2
13CRs
gmZ
gmZ dcm +==
Where Zcm and Zd are the common-mode and differential input impedances respectively.
Figure 8 shows the practical implementation of this amplifier. It is powered from a single 3.3V supply voltage. The signal ground is set to one-third of the supply voltage to take account of the common-mode voltage range. The diodes prevent latch-up of the circuit, RC networks decouple the circuit from RF noise and the C5 capacitors ensure circuit stability. Figure 9 shows the simulated gains and differential and common-mode input impedances of the circuit. The frequency band is 0.05-100Hz, can tolerate up to 50µA of common-mode currents and up to about 2V DC differential signal. The current consumption is ~150µA (~0.45mW) at 3.3V supply voltage. OPA2336 low-power opamps were used.
A twelve-lead ECG comprises three bipolar limb leads, three augmented unipolar limb leads and six precordial leads. Referring to the digram of Figure 3, the bipolar leads are related vectorially:
2
2
2)(
IIIIIaVF
IIIaVL
IIIaVR
IIIIII
+=
−=
+−=
+=
The precordial leads have a virtual reference, which is the sum of the left arm, right arm and left leg electrodes:
LLLARAVR ++=
It is therefore possible to derive all twelve channels from eight leads. Figure 11 shows a
+
-
A1
+
-
A3
+
-
A4
+
-
A2
A5
+
-
R3
R3
R4
R4
R4
R4 R4
R4
C
a'
b'
c'
d'
+
-
Figure 6: Detailed basic amplifier concept
+
-
+
-
gmV0
gmV0
R3
R3
C
+
-
Figure 7: Amplifier with bidirectional current sources connected to inputs
R1
R1
R2
R2

EE3 Group Project – ECG Telemetry System
6
macromodel for the eight amplifiers (where each amplifier is the circuit of Figure 8), from which the extra four channels may be derived in software.
The virtual reference adder is a unity-gain buffer with three inputs connected together via 100K resistors, referred to in ECG circles as a Wilson Terminalii.
+
-
100K
100K
100K
Figure 10: Virtual reference circuit
Figure 8: Practical amplifier circuit
Figure 9: Simulated gain, differential impedance and common-mode impedance
Figure 11: Input amplifier macromodel

EE3 Group Project – ECG Telemetry System
7
2.5 Multiplexers
The analogue inputs are time-division multiplexed so only one Nyquist filter and A/D converter need be used. An Analog Devices ADG708 is used to multiplex the eight channels into one.
2.6 Nyquist Filter
A 12-bit signed system like this one has a range of -2048 to +2047, so in order to ensure that the signal is sufficiently attenuated to prevent spectral leakage after sampling, a filter with gain 1/4096 (1/2 LSB or -72dB) at 250Hz is required. Signals up to 100Hz need to be preserved, so the transition band must be between 100 and 250Hz.
There are several different approaches to implementing the filter stage. Table 3 demonstrates the arguments for and against the various approaches.
Given that cost was our primary consideration with product size and development time being secondary we decided to design the filter from scratch.
The first step of the design process involved selecting the filter type. The following is a brief discussion of the common filter implementations:
Butterworth Very flat pass band and good roll-off. Good phase response.
Chebyshev Ripples in pass band with excellent roll-off. Good phase response.
Elliptic Very flat pass band with excellent roll-off. Poor phase response.
Bessel Flat pass band with poor roll-off. Excellent phase response.
The Nyquist filter is an 11th-order Butterworth design and attenuates the signal by 88dB at 250Hz and has a passband gain overshoot of less than 0.5dB.
Based on the design specifications, the best implementation was the Butterworth filter. Calculations showed that an 11th order active filter was necessary for the specifications to be met. Refer to Appendices I and II for full calculations and simulation results. The filter was implemented by cascading second order sections in a Sallen Key configuration. This enabled a steep attenuation curve with a sharp knee to be obtained.
The op-amps used in the active filter had to have a gain bandwidth product of at least 100 times the cut-off frequency and low noise. In order to reduce the component inventory and keep power consumption, the OPA2336 opamps used in the input amplification stage will be used for the Nyquist filter. Standard plastic film capacitors will be used due to their low cost.
Type Description Pros Cons
Switched-capacitor filters
Enables implementation of various filter orders
Small size permits miniaturization of product
Requires a pre-filter at the input for accurate performance
Linear active filter chips
Standard chips that can be customized to implement any filter type or order
Reduced development time & highly flexible as changes can be implemented quickly.
High cost
Custom-built Construction of filter from rudimentary components
Low cost Inflexible: changes would require recalculation of component values. Lengthy development time.
Table 3: Filter types
EE3 Group Project – ECG Telemetry System
8
2.7 A/D Converter
The A/D converter has to be capable of sampling at 500Hz, 12 bits per sample. The device chosen is an Analog Devices AD7854. It is run in byte mode, whereby two consecutive 8-bit reads are made by controlling the HBEN signal on the device. A conversion is started by writing to one of the A/D’s registers, and the completion is flagged by a CPU interrupt. The A/D converts at n times the sampling frequency, where n is the number of channels (nominally 12). It operates from a single-ended 3.3V supply like every other device in the system.
2.8 CPU
The CPU is an Atmel Atmega128. This is a low-power RISC microcontroller which operates at 3.3V and offers a UART interface, SPI interface, multiple timers, five 8-bit I/O ports, A/D functions, 4KB of RAM, 512 bytes of EEPROM and 128KB of Flash program memory. The CPU controls the multiplexer, A/D converter, screen, user I/O and the IDE bus so the load placed by each of these peripherals must be kept to a minimum. For speed and expandability, all external peripherals are mapped to the CPU’s external memory space via the 8-bit bus. Alternatively, the serial I2C bus could have been used, greatly reducing the number of wires to be routed, but at the same time placing extra loading on the processor. An I2C header plug has been included in case peripheral devices need to be added quickly.
2.9 SRAM Buffer
If time permits, an SRAM buffer will be added to the system to reduce the frequency at which the disk must be accessed, saving on power consumption. This is not of great importance to the project and will only be implemented if it is certain that no improvements or debugging need to be done elsewhere.
2.10 Program Files
The programming task involved with this project accounts for a significant proportion of design time. A GNU compiler and debugging tools are available free and open-source. Their syntax is almost identical to the GNU ‘gcc’ C compiler and is therefore compatible with all GNU-based editorsiii.
A freeware programmer, PonyProgiv, will be used to program the IC via the CPU’s In-System-Programming (ISP) port using the PC’s serial port.
The program is split up into approximately 18 files (9 c files and 9 headers). They are described in Table 4 and put into a hierarchy in Figure 12. A header file, global.h, is called by every other file. It consists almost entirely of #define statements such as the peripheral memory map and global variables.
2.11 Modes of Operation The software allows for many different configurations of the device, but its operation can be categorised into two main groups: Holter and Event. The Holter monitor records ECG data continuously and is useful for people who experience frequent heart problems. It requires large amounts of storage space.
An Event Monitor is triggered either when the user presses a button or the device automatically detects a problem, such as tachycardia or bradhycardia. They require less memory as they only record for short periods of
File Description
ecg.c The ‘main’ program which makes calls to all driver functions. It contains all the boot and self-test routines, interrupt service routines and the main program loop.
user.c Draws the embedded menu system and responds to user input. Contains functions for reading and writing configuration data.
uart.c Serial driver for debugging.
fat.c Drivers for the FAT16 filesystem.
ata.c The driver for controlling an ATA disk or Compactflash card.
a2d.c Driver for the analogue-to-digital converter.
lcd.c Driver for the LCD and some functions for controlling the cursor.
i2c.c Driver for I2C bus.
systimer.c Contains low-level timing routines.
Table 4: File descriptions
EE3 Group Project – ECG Telemetry System
9
High Level Code(ecg.c, global.h)
System Timer(systimer.c,systimer.h)
LCD Driver(lcd.c, lcd.h)
A/D Driver(a2d.c, a2d.h)
User Driver(user.c, user.h)
I2C Driver(i2c.c, i2c.h)
UART Driver(lcd.c, lcd.h)
FAT Driver(fat.c, fat.h)
ATA Driver(ata.c, ata.h)
Figure 12: Code Hierarchy
time. Some have a ‘loop’ memory which continuously records data then throws it away if it is not required. If time permits and it is possible to add an SRAM buffer to the device then a loop memory will be implemented.
2.12 IDE / ATA Busv vi vii
The IDE (Integrated Drive Electronics) bus, commonly referred to as the ATA (AT Attached) bus, is an extension of the PC’s ISA (Industry Standard Architecture) bus, whose timing characteristics bear much resemblance to the microcontroller’s 8-bit expansion bus. A Compactflash can be wired in such a way that it is compatible with this bus. From a controller point of view an IDE interface can be described as a set of I/O ports:
• A 16-bit I/O bus
• Two /CS lines
• A /WR and /RD line
• Three address bits
• One interrupt
A few extra lines exist both for backwards compatibility and modern enhancements, but for the purposes of this project the signals listed above minus the interrupt line will be used. With the exception of the 16-to-8-bit conversion, the IDE bus can be driven directly from the microcontroller’s memory-mapped 8-bit expansion bus. The addressing system allows for disks of up to 137GB to be used. Further enhancements could increase this to
2TB, but is unnecessary given the amounts of data involved.
ATA addressing involves splitting the disk up into 512-byte memory allocations called sectors. This means that 512 bytes is the smallest amount of data that can be read or written at any time. Refer to Appendix IV for further information about the ATA bus and how it is attached to this system.
2.13 FATviii ix x xi xii
Further up in the disk access hierarchy is the file allocation table. This is a method for structuring a drive in a way that Windows can understand.
There are four filesystems compatible with Windows XP, namely FAT12, FAT16, FAT32 and NTFS. NTFS was immediately ruled out because of unnecessary complexity which exists to provide compatibility with UNIX filesystems and added security. FAT32 was ruled out for similar reasons, though may be implemented if time permits to allow for disks of up to 137GB to be used. FAT12, which has the advantage of being simple to use, is limited to a maximum disk size of 16MB.
FAT16 provides a good compromise between the simplicity of FAT12 and the large disk capability of FAT32. The upper limit for a FAT16 partition is 2.5GB. If FAT32 compatibility is implemented, it will be necessary to keep the FAT16 drivers as FAT32 cannot be used on disks smaller than 512MB. From the perspective of efficiency, it makes sense to make the transition from FAT16 to FAT32 at the 512MB boundary. Refer to Appendix V for a detailed comparison of the different types of FAT filesystem.
2.14 File Format The ECG files have an .ecg extension and contain time-division-multiplexed data of up to 12 channels within one file.
The file is divided up into 2KB (four sector) frames. It is sensible to use frames of multiples of two sectors to simplify the FAT driver design and debugging. The length of a frame was further determined by RAM constraints; only 4KB of RAM is available on the processor and at least 512 bytes will be necessary to run the display, ATA driver and filesystem.
EE3 Group Project – ECG Telemetry System
10
The following is the definition of the ECG frame. The lengths assume a 12-bit, 8-channel recording (the other four would be derived later in software), where 168 sets of samples fit into 2KB with a 32-byte header. Syntax Length ecg_frame 2048
frame_sync; // ‘ECGD’ 4 version; // Firmware version 1 device_id; // ASCII text 15 event; // Enumerated 1 mode; // Enumerated 1 time; // ms since 01/01/1970 8 n_samples; // Nominal 168 1 channels; // 8-bit field 1 for (i=0; i<n_samples; i++) 2016
for(j=0; j<channels; j++) 8
channel_sample[i][j]; 1.5
padding; X
Frame sync A signal ‘ECGD’ (ASCII encoded). Should be rare enough to act as a framing signal.
Version Number indicating firmware version.
Device ID Text field identifying the name of the acquisition device
Event Enumerated type of events e.g. tachycardia. Types yet to be defined.
Mode Enumerated type defining holter / event or whatever other type we define. Types yet to be defined.
Time No of milliseconds after 1st January 1970. This is a standard for measuring absolute time, in particular with the Java time and date library. Absolute timing is useful if the files are to be truncated. With relative timing this would be much more difficult and would require on-the fly calculation to determine the absolute time code.
Samples per frame Number of samples contained within the ECG frame (168 for 12 channels @ 12 bits)
Channels 8 bits stating which channels have been used.
(MSB) bbbb bbbb (LSB)
Where b is 0 on channel not recorded, 1 on
channel recorded. x is ignored. Order is V6, V5, V4, V3, V2, V1, III, I, where I corresponds to LSB.
Padding Pads out to fill 2K. None required in this example case.
Using this coding scheme, a 12-lead ECG, stored as eight discrete channels + header, sampled at 500Hz requires a bandwidth of 73.142KBits/sec, resulting in file sizes of 31.14MB per hour, 771MB per day and 5.27GB per week.
2.15 Connectivity
2.15.1 LCD Display
The LCD display is a 20x4 line, alphanumeric, memory-mapped device, communicating with the CPU through the 8-bit data bus. A set of registers defines the type of operation (left-to-right, right-to-left, flashing cursor etc), and the cursor (pointer) position. The driver complies with the Hitachi HD44780 character-mapped LCD specification, with the exception that a 3.3V device must be used due to power supply constraints.
As an aside, OLED screens with HD44780 compatibility are being manufactured. However, an emissive display is not feasible due to excessive power consumption; a reflective display with optional backlight would be a better option.
2.15.2 User I/O
In order to use the minimum number of push buttons (for design simplicity and ease of use), four buttons, aligned with the bottom line of the display, are used to navigate the menus. The text on the bottom line describes the functionality of the buttons for each menu.
The four pushbuttons are de-bounced in logic. Further logic triggers an interrupt on the CPU and an Interrupt Service Routine (ISR) queries the state of the buttons and executes the corresponding code.
2.15.3 Debugging
An In-System Programming (ISP) interface, connected to a PC via an RS-232 port, allows flash ROM programming, register
EE3 Group Project – ECG Telemetry System
11
interrogation, break points and many other features common to serial debugging ports. An RS-232 UART provides a second serial interface through which higher-level functions may be called, such as remote menus.
2.16 Logic The peripheral devices are connected to the processor via a common data bus, so address decoding is required to ensure that the output enables for each device are asserted at the correct time. Logic is also required as a bridge between buses of different width (IDE and A/D). This could normally be achieved with discrete logic devices such as the 74LS138 address decoder and the 74LS573 latch, but for the purposes of prototyping it is much easier to use a programmable logic device such as an FPGA or CPLD. The surplus logic capability can also be used to carry out the repetitive task of heart rate detection and reduce loading on the processor, explained in section 2.17. The device chosen is an Altera Flex10K (EPF10K10LC84-10).
2.16.1 Peripheral Addresses
Bits [15:4] of the address bus form the peripheral chip select signals. The bottom three bits are address inputs for peripherals which require further addresses, such as the ATA device.
Chip Select Function Subaddresses
CS0 (0x0000 to 0x000F) IDE NCS0 8 IDE regs
CS1 (0x0010 to 0x001F) IDE NCS1 2 IDE regs
CS2 (0x0020 to 0x002F)
IDE high byte write None
CS3 (0x0030 to 0x003F) Multiplexer None
CS4 (0x0040 to 0x004F) LCD Control reg,
data reg.
CS5 (0x0050 to 0x005F)
BPM
BPM detector low threshold, high threshold, result
CS6 (0x0060 to 0x006F) ADC None
CS7 (0x0070 to 0x007F) Unused None
2.17 Heart Rate Detection
Heart rates are calculated real-time as part of on-screen user information and to trigger events (such as tachycardia).
The heart rate should be updated at most every two seconds in order for the rate to be displayed on the ECG and account for heart rates at 30 BPM. In addition, the detector must record heart rates between 30 to 285 BPM (8 bit encoding, where 0x00 corresponds to 30BPM and 0xFF is 285).
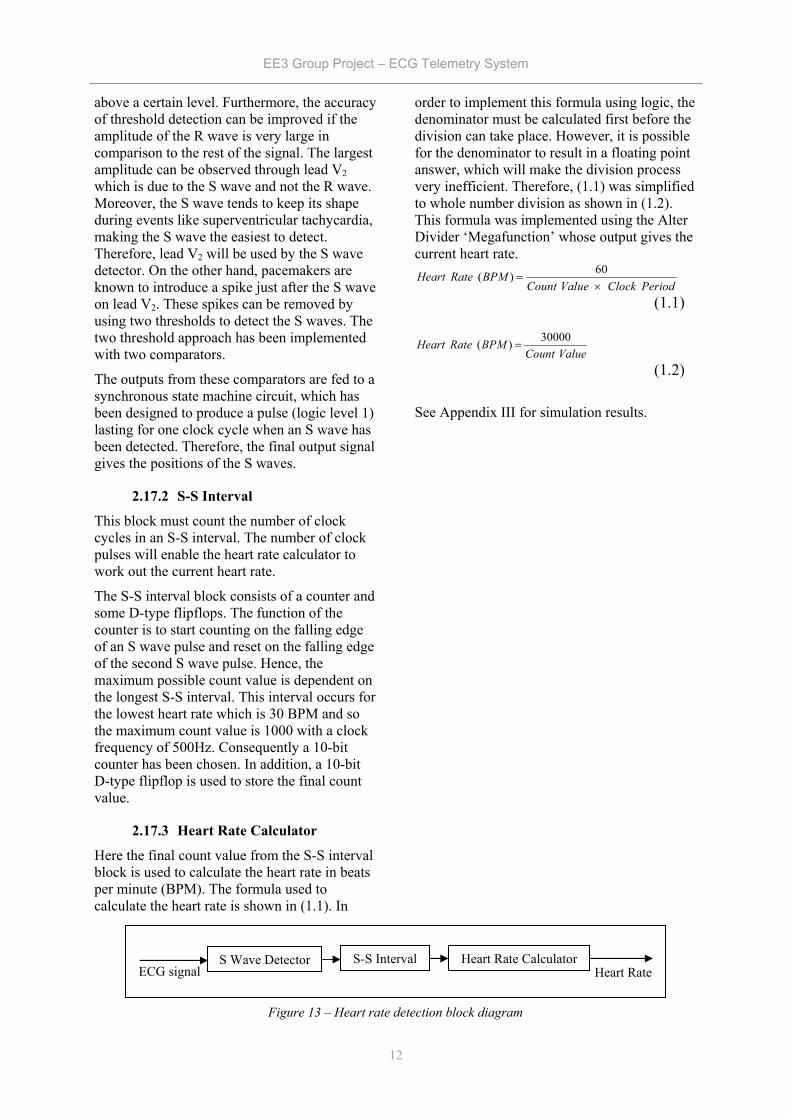
There are two possible ways of calculating the heart rate form an ECG signal. One method involves measuring the time interval between the heart beats, while the other method involves counting the number of heart beats in a given time interval. The latter method must ensure that at least two heart beats fall into the time interval in order to calculate the heart rate. Furthermore, to increase the update rate using this method would involve dynamically changing the time interval with heart rate and making sure whole number of heart beat periods fall into the time interval. This restriction does not apply to the first method and so the update rate will increase with heart rate. Therefore, the block diagram for heart rate detection shown in Figure 13 is based on measuring the time interval between two consecutive heart beats. The corresponding circuit diagram is shown in Figure 18.
2.17.1 S-Wave Detection
The S wave detector must convert the discrete ECG signal (sampled at 500Hz) into a series of pulses where each pulse represents a heart beat. This output signal can be created using threshold detection and a state machine.
The R-R interval is commonly used by physicians to calculate the heart rate. Hence, the ECG signal must be filtered so that only the R waves remain. This process can be carried out using threshold detection, whereby an R wave would be detected if the ECG signal went
Table 5: Peripheral addresses
EE3 Group Project – ECG Telemetry System
12
above a certain level. Furthermore, the accuracy of threshold detection can be improved if the amplitude of the R wave is very large in comparison to the rest of the signal. The largest amplitude can be observed through lead V2 which is due to the S wave and not the R wave. Moreover, the S wave tends to keep its shape during events like superventricular tachycardia, making the S wave the easiest to detect. Therefore, lead V2 will be used by the S wave detector. On the other hand, pacemakers are known to introduce a spike just after the S wave on lead V2. These spikes can be removed by using two thresholds to detect the S waves. The two threshold approach has been implemented with two comparators.
The outputs from these comparators are fed to a synchronous state machine circuit, which has been designed to produce a pulse (logic level 1) lasting for one clock cycle when an S wave has been detected. Therefore, the final output signal gives the positions of the S waves.
2.17.2 S-S Interval
This block must count the number of clock cycles in an S-S interval. The number of clock pulses will enable the heart rate calculator to work out the current heart rate.
The S-S interval block consists of a counter and some D-type flipflops. The function of the counter is to start counting on the falling edge of an S wave pulse and reset on the falling edge of the second S wave pulse. Hence, the maximum possible count value is dependent on the longest S-S interval. This interval occurs for the lowest heart rate which is 30 BPM and so the maximum count value is 1000 with a clock frequency of 500Hz. Consequently a 10-bit counter has been chosen. In addition, a 10-bit D-type flipflop is used to store the final count value.
2.17.3 Heart Rate Calculator
Here the final count value from the S-S interval block is used to calculate the heart rate in beats per minute (BPM). The formula used to calculate the heart rate is shown in (1.1). In
order to implement this formula using logic, the denominator must be calculated first before the division can take place. However, it is possible for the denominator to result in a floating point answer, which will make the division process very inefficient. Therefore, (1.1) was simplified to whole number division as shown in (1.2). This formula was implemented using the Alter Divider ‘Megafunction’ whose output gives the current heart rate.
60( )Heart Rate BPMCount Value Clock Period
=×
(1.1)
30000( )Heart Rate BPMCount Value
=
(1.2)
See Appendix III for simulation results.
Heart Rate ECG signal S Wave Detector S-S Interval Heart Rate Calculator
Figure 13 – Heart rate detection block diagram

EE3 Group Project – ECG Telemetry System
13
Figure 14: Main schematic diagram
EE3 Group Project – ECG Telemetry System
14
Figure 15: Bipolar amplifier schematic
EE3 Group Project – ECG Telemetry System
15
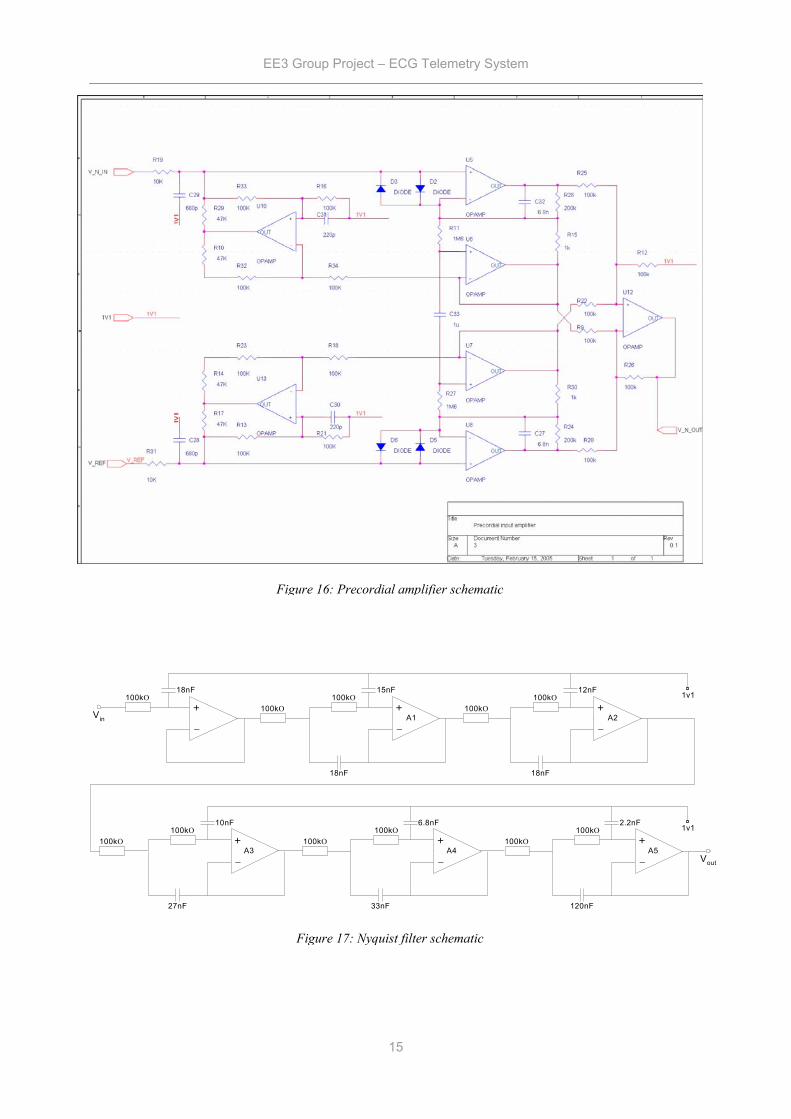
Figure 16: Precordial amplifier schematic
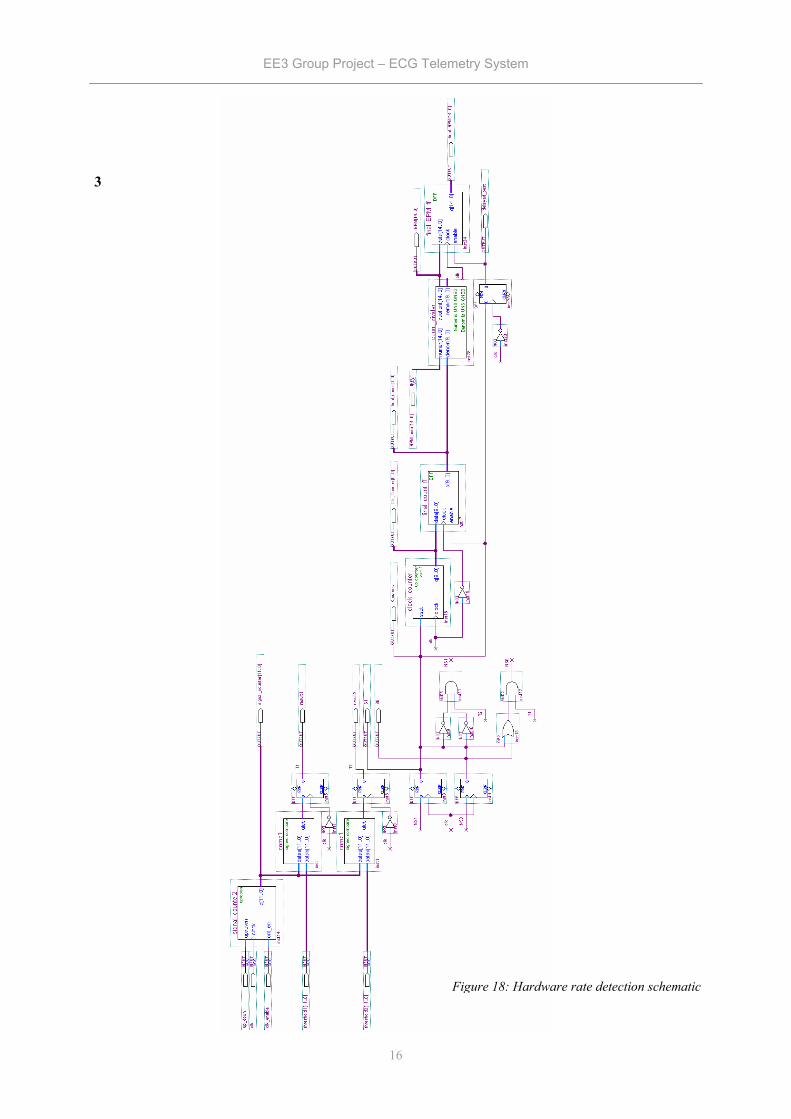
Figure 17: Nyquist filter schematic
_
+
_
+
_
+100kO
100kO100kO
100kO100kO
Vin
18nF 15nF 12nF
18nF 18nF
_
+
_
+100kO
100kO100kO
100kO
6.8nF 2.2nF
33nF 120nF
_
+100kO
100kO
10nF
27nF
Vout
A1 A2
A3 A4 A5
1v1
1v1
EE3 Group Project – ECG Telemetry System
16
3
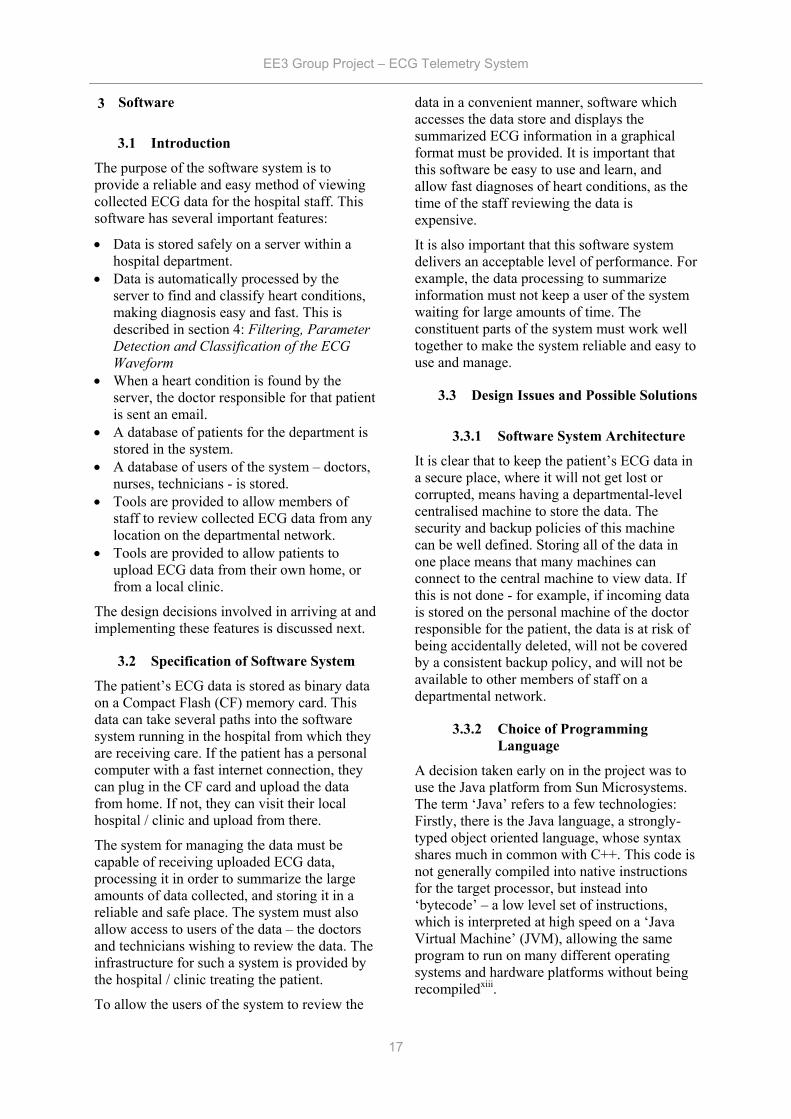
Figure 18: Hardware rate detection schematic
EE3 Group Project – ECG Telemetry System
17
Software
3.1 Introduction
The purpose of the software system is to provide a reliable and easy method of viewing collected ECG data for the hospital staff. This software has several important features:
• Data is stored safely on a server within a hospital department.
• Data is automatically processed by the server to find and classify heart conditions, making diagnosis easy and fast. This is described in section 4: Filtering, Parameter Detection and Classification of the ECG Waveform
• When a heart condition is found by the server, the doctor responsible for that patient is sent an email.
• A database of patients for the department is stored in the system.
• A database of users of the system – doctors, nurses, technicians - is stored.
• Tools are provided to allow members of staff to review collected ECG data from any location on the departmental network.
• Tools are provided to allow patients to upload ECG data from their own home, or from a local clinic.
The design decisions involved in arriving at and implementing these features is discussed next.
3.2 Specification of Software System
The patient’s ECG data is stored as binary data on a Compact Flash (CF) memory card. This data can take several paths into the software system running in the hospital from which they are receiving care. If the patient has a personal computer with a fast internet connection, they can plug in the CF card and upload the data from home. If not, they can visit their local hospital / clinic and upload from there.
The system for managing the data must be capable of receiving uploaded ECG data, processing it in order to summarize the large amounts of data collected, and storing it in a reliable and safe place. The system must also allow access to users of the data – the doctors and technicians wishing to review the data. The infrastructure for such a system is provided by the hospital / clinic treating the patient.
To allow the users of the system to review the
data in a convenient manner, software which accesses the data store and displays the summarized ECG information in a graphical format must be provided. It is important that this software be easy to use and learn, and allow fast diagnoses of heart conditions, as the time of the staff reviewing the data is expensive.
It is also important that this software system delivers an acceptable level of performance. For example, the data processing to summarize information must not keep a user of the system waiting for large amounts of time. The constituent parts of the system must work well together to make the system reliable and easy to use and manage.
3.3 Design Issues and Possible Solutions
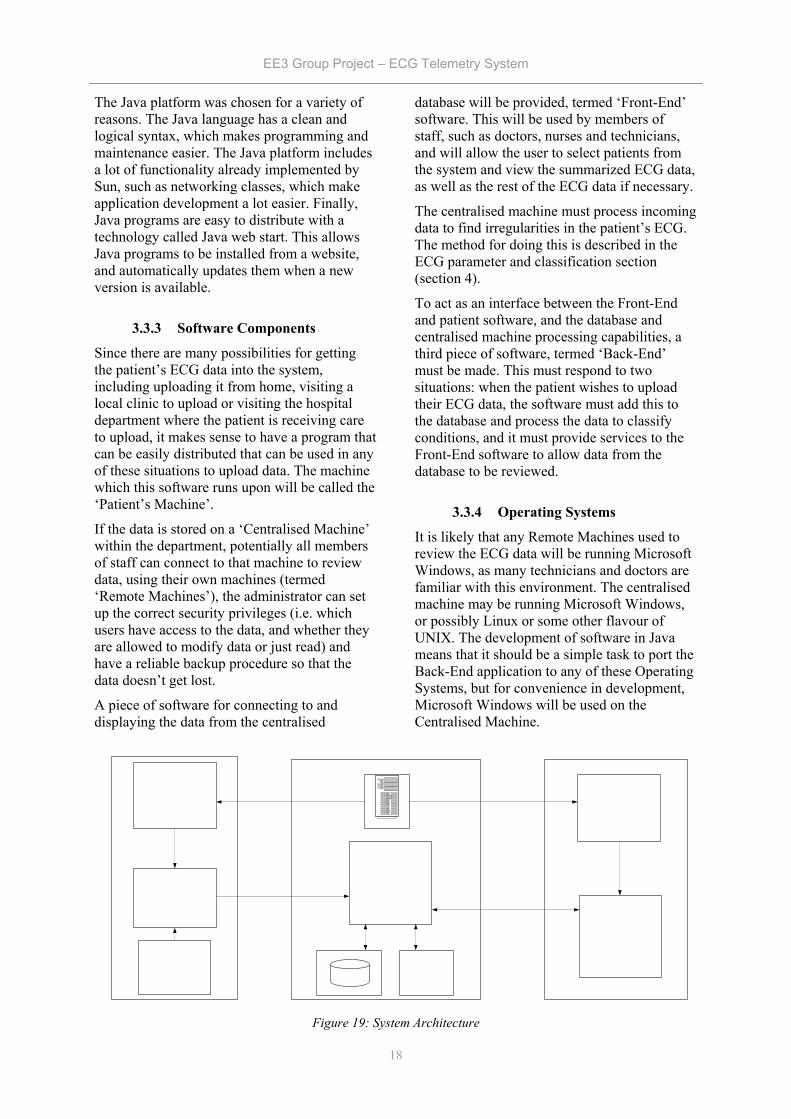
3.3.1 Software System Architecture
It is clear that to keep the patient’s ECG data in a secure place, where it will not get lost or corrupted, means having a departmental-level centralised machine to store the data. The security and backup policies of this machine can be well defined. Storing all of the data in one place means that many machines can connect to the central machine to view data. If this is not done - for example, if incoming data is stored on the personal machine of the doctor responsible for the patient, the data is at risk of being accidentally deleted, will not be covered by a consistent backup policy, and will not be available to other members of staff on a departmental network.
3.3.2 Choice of Programming Language
A decision taken early on in the project was to use the Java platform from Sun Microsystems. The term ‘Java’ refers to a few technologies: Firstly, there is the Java language, a strongly-typed object oriented language, whose syntax shares much in common with C++. This code is not generally compiled into native instructions for the target processor, but instead into ‘bytecode’ – a low level set of instructions, which is interpreted at high speed on a ‘Java Virtual Machine’ (JVM), allowing the same program to run on many different operating systems and hardware platforms without being recompiledxiii.
3
EE3 Group Project – ECG Telemetry System
18
The Java platform was chosen for a variety of reasons. The Java language has a clean and logical syntax, which makes programming and maintenance easier. The Java platform includes a lot of functionality already implemented by Sun, such as networking classes, which make application development a lot easier. Finally, Java programs are easy to distribute with a technology called Java web start. This allows Java programs to be installed from a website, and automatically updates them when a new version is available.
3.3.3 Software Components
Since there are many possibilities for getting the patient’s ECG data into the system, including uploading it from home, visiting a local clinic to upload or visiting the hospital department where the patient is receiving care to upload, it makes sense to have a program that can be easily distributed that can be used in any of these situations to upload data. The machine which this software runs upon will be called the ‘Patient’s Machine’.
If the data is stored on a ‘Centralised Machine’ within the department, potentially all members of staff can connect to that machine to review data, using their own machines (termed ‘Remote Machines’), the administrator can set up the correct security privileges (i.e. which users have access to the data, and whether they are allowed to modify data or just read) and have a reliable backup procedure so that the data doesn’t get lost.
A piece of software for connecting to and displaying the data from the centralised
database will be provided, termed ‘Front-End’ software. This will be used by members of staff, such as doctors, nurses and technicians, and will allow the user to select patients from the system and view the summarized ECG data, as well as the rest of the ECG data if necessary.
The centralised machine must process incoming data to find irregularities in the patient’s ECG. The method for doing this is described in the ECG parameter and classification section (section 4).
To act as an interface between the Front-End and patient software, and the database and centralised machine processing capabilities, a third piece of software, termed ‘Back-End’ must be made. This must respond to two situations: when the patient wishes to upload their ECG data, the software must add this to the database and process the data to classify conditions, and it must provide services to the Front-End software to allow data from the database to be reviewed.
3.3.4 Operating Systems
It is likely that any Remote Machines used to review the ECG data will be running Microsoft Windows, as many technicians and doctors are familiar with this environment. The centralised machine may be running Microsoft Windows, or possibly Linux or some other flavour of UNIX. The development of software in Java means that it should be a simple task to port the Back-End application to any of these Operating Systems, but for convenience in development, Microsoft Windows will be used on the Centralised Machine.
Figure 19: System Architecture

EE3 Group Project – ECG Telemetry System
19
3.4 Data Modelling
The system inherently deals with a lot of data. The ECG data alone generated each time a patient uses the device may be in the order of hundreds of megabytes, and the system also has to keep track of which patients are being monitored, which members of staff are responsible for them, when the patients have used the device and so forth.
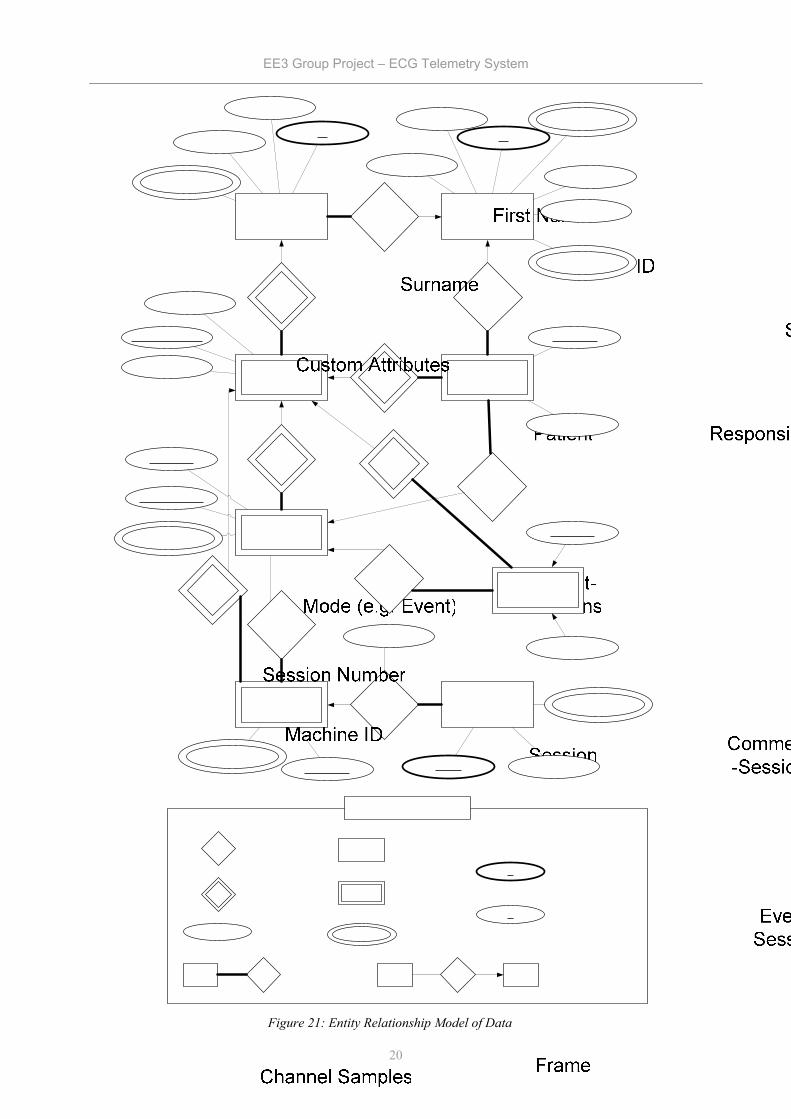
In short, the system deals with a complex data system, which must be systematically modelled. The high level ‘Entity-Relationship’ model, shown in Figure 21, will be implemented as a relational database.
The Entity-Relationship data model is based on set theory, and is discussed in Appendix VI. This model can be synthesised using a relational database. Relational databases are a simple and common form of database, and consist of many linked tables of data. The method used is straightforward, and described in Silberschatz-Korth-Sudarshanxiv, 2.9 Reduction of an E-R Schema to Tables (p62).
3.4.1 Explanation of High-Level Data Model
The explanation of the data model is as follows. In the system there are patients to be monitored, with various attributes that are needed such as their name and ID (e.g. NHS number), and custom attributes which can be defined by the system administrator, probably including address, G.P name and so forth.
There are also members of staff who will be using the system. The most important attributes are the log-in name and password. For simplicity, a full security system will not be implemented, so the password is simply stored as plain text in the database. In reality, a more robust verification system would have to be implemented.
Every patient is related (hence full participation of the patient entity set) to a responsible member of staff. Members of staff may have several or even no patients for whom they are responsible.
Every time a patient uses the portable ECG, a new ‘session’ is created in the database, with attributes to identify which piece of equipment was used, and the operating mode of the equipment (event mode/ continuous mode).
Each new session of a patient has a unique integer identifier beginning at 1.
The ECG data of these sessions is stored as ‘frames’ (Note that this is not the same as a frame stored by the hardware). Each frame has a fixed length of 1 second of ECG waveform data. The date/time and channel name (e.g. aVR, III etc.) are used to identify individual frames, and the fixed amount of data containing the waveform samples is stored as binary data.
An alternative way of storing the waveform data is to identify individual cycles between beats, and treat these as entities. This is a bad idea, however: the algorithm to identify cycles may need to be applied to the data more than once with different arguments, and it is therefore best to store the original data.
Alongside these frames, the ‘parameters’ of the ECG waveform – e.g. heart rate, ST interval etc. – are stored, with the associated date/time of the measurement. Every measurement occurs during a particular frame, and this is reflected in the Parameter-Frame relationship. However, the identifying entity set of the parameters entity set is still the ‘session’ entity set.
A set of classifications of heart conditions exists, and is represented by the entity set ‘Condition’. This has a description and a multi-valued attribute representing the default arguments used to classify the condition. The name of the condition acts as primary key for the entity set, as this uniquely identifies every entity.
When processing to classify cardiac cycles which have parameters falling out of certain bounds is carried out, as described in section 4, a cardiac cycle may be associated with a certain condition via the “Conditions Classified” relationship set. This flags up that there is something that the responsible member of staff must check in the data.
Two other mechanisms for flagging data occur: comments added by members of staff, and conditions detected by the ECG device, such as the patient pressing the event button. These are covered by the comment and event entity sets respectively. These entities are all associated with a particular session and identified by the date/time at which they occurred, and are thus related to the session entity set via an identifying relationship. They are also associated with frames of ECG waveform data
EE3 Group Project – ECG Telemetry System
20
Figure 21: Entity Relationship Model of Data

EE3 Group Project – ECG Telemetry System
21
corresponding to the time at which they are recorded. They could also be associated with a particular cardiac cycle: this is not however a relationship that would be exploited by the software, and so these relationships have been omitted.
3.4.2 Implementation of Data Model
Once the data model has been implemented as a relational database, it can be accessed using by the Back End application using Open Database Connectivity (ODBC). ODBC is a layer of software between an application and a database which allows the application to manipulate the database using the widely used Structured Query Language (SQL)xv. ODBC uses a database driver, which translates the SQL commands to the native commands of the database. What this means in practice is that the administrator can set up the database as an ODBC source, and the application can use SQL commands with the database, theoretically without even knowing which database technology is being used. It is therefore an almost trivial matter to adapt the application to use a different database technology.
For development, the Microsoft Access database (MDB) technology will be used. This
allows easy manipulation of data using the Microsoft Access program, and the Access ODBC driver is included with the Microsoft Windows platform being used for development, cutting down cost. For the production implementation of the system, it may be better to use a higher performance database technology, but this may also be more expensive.
3.5 Patient Upload Software
The ECG data file has to be collected from the patient’s machine. The best way of doing this is to make a user-friendly wizard, of the format shown below. This wizard should tell the user what is going to happen, let the user know how much progress has been made in uploading the file, and let the user know when the process has finished.
Both a Java application and a Java applet are capable of doing what is required, in terms of the user interface. The difference between a Java application and a Java applet is that an applet is loads in a web browser, and is therefore extremely easy to distribute. However, applets have limiting security policies and cannot access files on the patient’s machine, for example.
ECG Upload
< Back Next > Cancel
Welcome to the ECG UploadWizardThis wizards helps you submit your ECG fordiagnosis.
To continue, click Next.
ECG Upload
< Back Finish Cancel
Completing the ECG UploadWizardYou have successfully completed the ECG Uploadwizard.
You specified the following settings:
First Name: JohnMiddle Name: -Last Name: SmithDate: 10/02/2005
To close this wizard, click Finish.
ECG Upload
Personal Details
Enter Your Details
< Back Next > Cancel
John
Smith
10/02/2005
C://ECG/file.ecg
First Name
Middle Name
Last Name
Date
ECG File
ECG Upload
Uploading…….
< Back Next > Cancel
Figure 20: Patient upload software
EE3 Group Project – ECG Telemetry System
22
Now the issue of distribution in Java applications can be resolved using Java Web Start technology. Java Web Start is a technology that allows Java applications to be launched, deployed, and updated from a standard web server, and is therefore well suited to the requirementsxvi. All that the patient has to do is connect to a webpage run by the hospital department, and click a link to launch the upload program.
Upon execution, this Java application will try to find and cache the ECG data file on the CF card to a temporary location on the hard disk, allowing the patient to unplug the CF card and carry on using the portable ECG device. The patient will simply have to fill out their details to successfully upload the ECG data file.
The volume of data the application would be expected to transmit would be in the hundreds of megabytes range. This data file is sent using simple networking ‘sockets’xvii – the patient upload software sends data over the internet, using the TCP/IP protocol, to a particular ‘port’ (an opening for data) on the centralised machine. The Back End software can read data from this port as if it were a file on disk.
The use of Transmission Control Protocol / Internet Protocol (TCP/IP) guarantees that the data arrives at the centralised machine reliably and in the correct order. On the Centralised Machine, a socket has been ‘bound’ to a predefined port, and the Back End software is continually ‘listening’ for any incoming data. When the ECG data is ready to be transmitted, a new socket is created on the patient’s machine. This socket is connected to the ‘listening port’ on the centralised machine. The patient’s details are first sent with any necessary authentication information, and then the ECG data follows.
3.6 Back End Software
The Back-End software, running on the centralised machine is used only by the patient software and the Front-End software. The Back-End is mainly responsible for managing the database: it has to respond to a patient wishing to upload their ECG data, and to a user running the Front-End software from a network location.
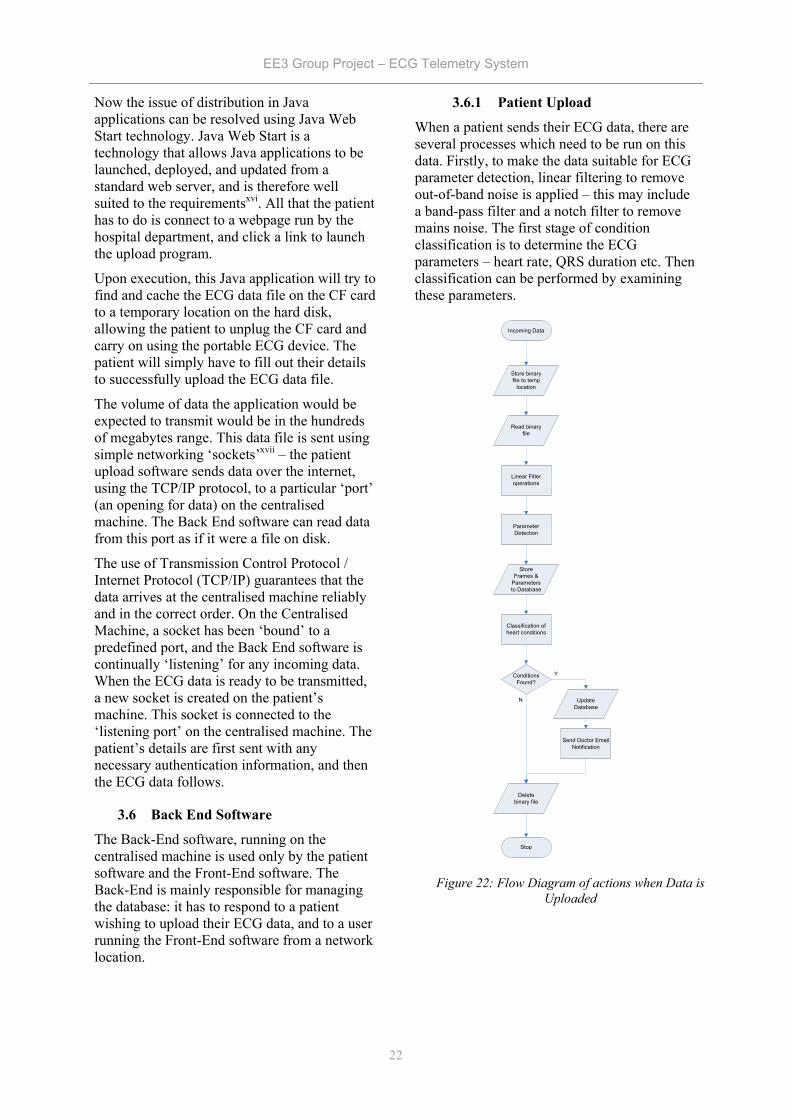
3.6.1 Patient Upload
When a patient sends their ECG data, there are several processes which need to be run on this data. Firstly, to make the data suitable for ECG parameter detection, linear filtering to remove out-of-band noise is applied – this may include a band-pass filter and a notch filter to remove mains noise. The first stage of condition classification is to determine the ECG parameters – heart rate, QRS duration etc. Then classification can be performed by examining these parameters.
Incoming Data
Store binary file to temp
location
Read binary file
Linear Filter operations
Parameter Detection
Store Frames &
Parameters to Database
Classification of heart conditions
Conditions Found?
Update Database
Stop
Y
N
Delete binary file
Send Doctor Email Notification
Figure 22: Flow Diagram of actions when Data is Uploaded
EE3 Group Project – ECG Telemetry System
23
When incoming data is accepted, the exact binary file produced by the ECG device is stored to a temporary location on the centralised machine, and once the data has been successfully stored into the database, this is deleted. The database is then opened, and the data enclosed is filtered. A certain amount of this filtered data is kept in memory and used in the parameter detection process, to save the time penalty of having to access data from the hard disk. The filtered data is split into chunks of data called ‘frames’ and stored to the database, and the detected parameters are also stored in the database. Further explanation of these processes is in section 4.
Classification of heart conditions is then attempted by searching the database, and any conditions found are stored. If conditions are found, the member of staff responsible for that patient will be sent a notification email, so that they can check the data. This should be easy to implement, as classes for Simple Mail Transfer Protocol (SMTP) are already implemented for Java, and distributed freelyxviii.
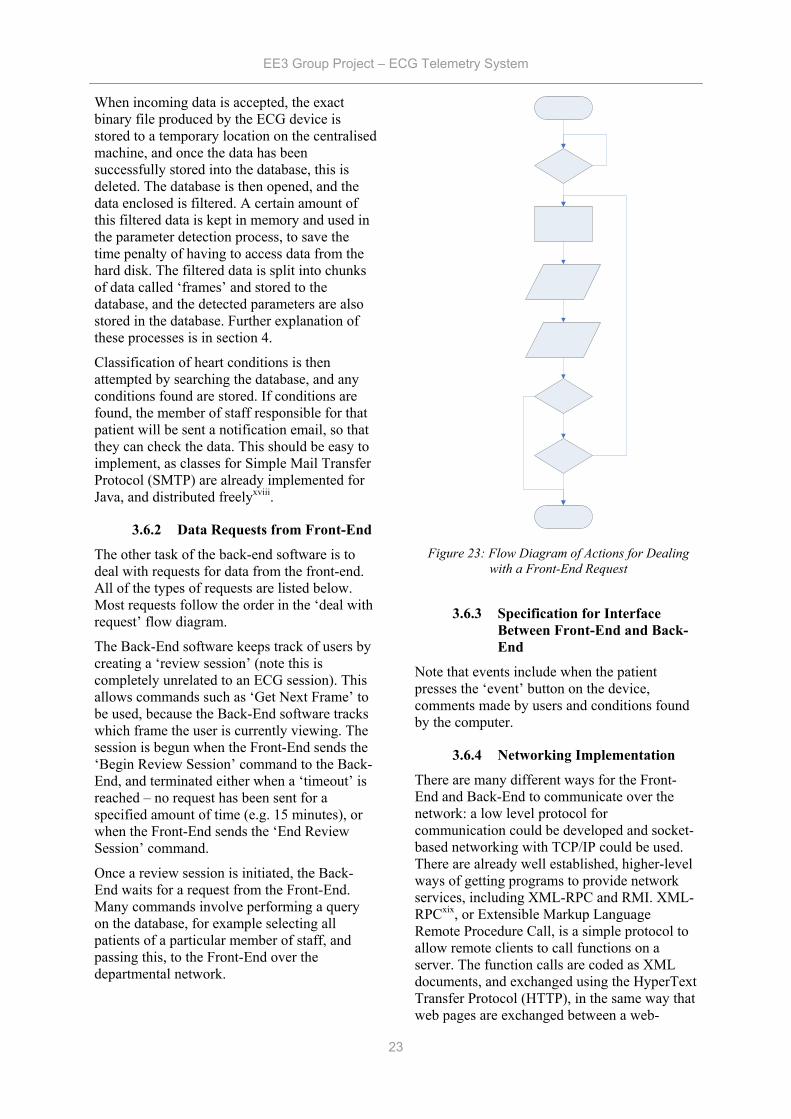
3.6.2 Data Requests from Front-End
The other task of the back-end software is to deal with requests for data from the front-end. All of the types of requests are listed below. Most requests follow the order in the ‘deal with request’ flow diagram.
The Back-End software keeps track of users by creating a ‘review session’ (note this is completely unrelated to an ECG session). This allows commands such as ‘Get Next Frame’ to be used, because the Back-End software tracks which frame the user is currently viewing. The session is begun when the Front-End sends the ‘Begin Review Session’ command to the Back-End, and terminated either when a ‘timeout’ is reached – no request has been sent for a specified amount of time (e.g. 15 minutes), or when the Front-End sends the ‘End Review Session’ command.
Once a review session is initiated, the Back-End waits for a request from the Front-End. Many commands involve performing a query on the database, for example selecting all patients of a particular member of staff, and passing this, to the Front-End over the departmental network.
3.6.3 Specification for Interface Between Front-End and Back-End
Note that events include when the patient presses the ‘event’ button on the device, comments made by users and conditions found by the computer.
3.6.4 Networking Implementation
There are many different ways for the Front-End and Back-End to communicate over the network: a low level protocol for communication could be developed and socket-based networking with TCP/IP could be used. There are already well established, higher-level ways of getting programs to provide network services, including XML-RPC and RMI. XML-RPCxix, or Extensible Markup Language Remote Procedure Call, is a simple protocol to allow remote clients to call functions on a server. The function calls are coded as XML documents, and exchanged using the HyperText Transfer Protocol (HTTP), in the same way that web pages are exchanged between a web-
Figure 23: Flow Diagram of Actions for Dealing with a Front-End Request
EE3 Group Project – ECG Telemetry System
24
browser and a web-server. This is useful because it is simple and implementations already exist for the Java environment. There is also the Remote Method Invocationxx technology, which is already implemented in the Java Class Library. This allows objects sharing common methods and variables to be passed between server and client (or Back-End and Front-End in this case), using TCP/IP
networking. This has been chosen as the best technology to use: RMI is native to Java and is therefore logically integrated with the language, and objects are used, so the Object Oriented design approach can be continued with this part of the program, as opposed to mixing procedural and object oriented programming techniques as is necessary with XML-RPC.
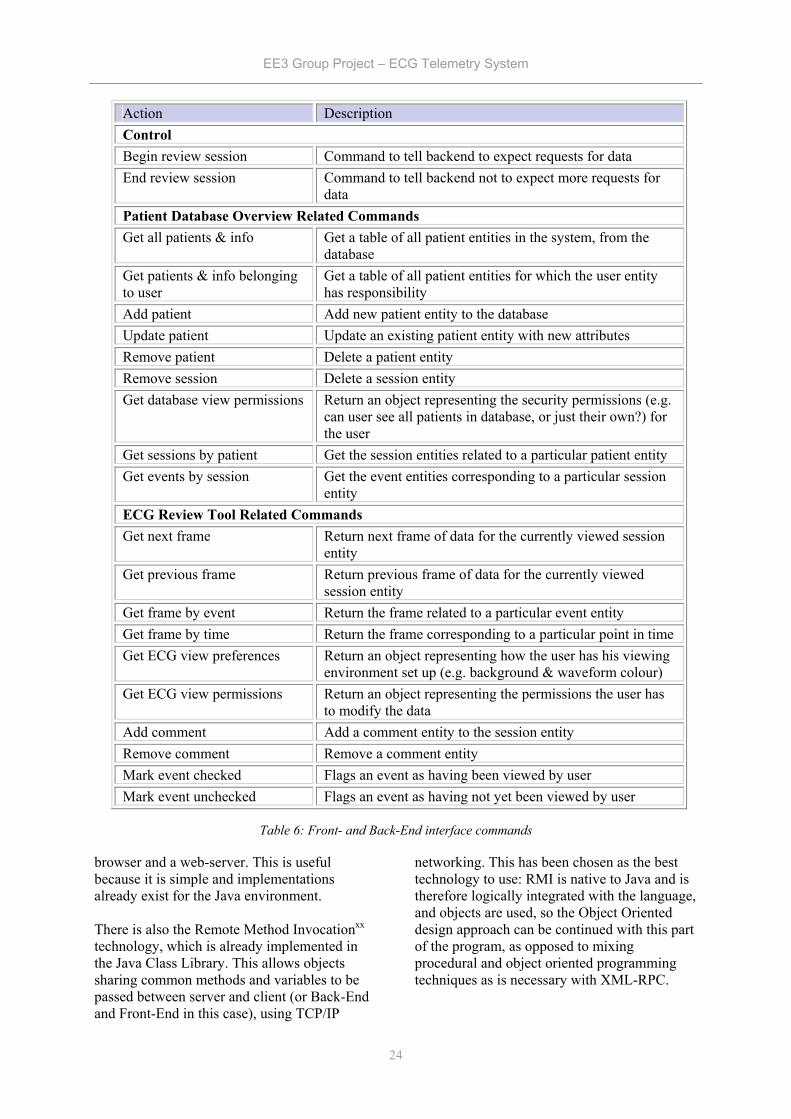
Action Description Control Begin review session Command to tell backend to expect requests for data End review session Command to tell backend not to expect more requests for
data Patient Database Overview Related Commands Get all patients & info Get a table of all patient entities in the system, from the
database Get patients & info belonging to user
Get a table of all patient entities for which the user entity has responsibility
Add patient Add new patient entity to the database Update patient Update an existing patient entity with new attributes Remove patient Delete a patient entity Remove session Delete a session entity Get database view permissions Return an object representing the security permissions (e.g.
can user see all patients in database, or just their own?) for the user
Get sessions by patient Get the session entities related to a particular patient entity Get events by session Get the event entities corresponding to a particular session
entity ECG Review Tool Related Commands Get next frame Return next frame of data for the currently viewed session
entity Get previous frame Return previous frame of data for the currently viewed
session entity Get frame by event Return the frame related to a particular event entity Get frame by time Return the frame corresponding to a particular point in time Get ECG view preferences Return an object representing how the user has his viewing
environment set up (e.g. background & waveform colour) Get ECG view permissions Return an object representing the permissions the user has
to modify the data Add comment Add a comment entity to the session entity Remove comment Remove a comment entity Mark event checked Flags an event as having been viewed by user Mark event unchecked Flags an event as having not yet been viewed by user
Table 6: Front- and Back-End interface commands
EE3 Group Project – ECG Telemetry System
25
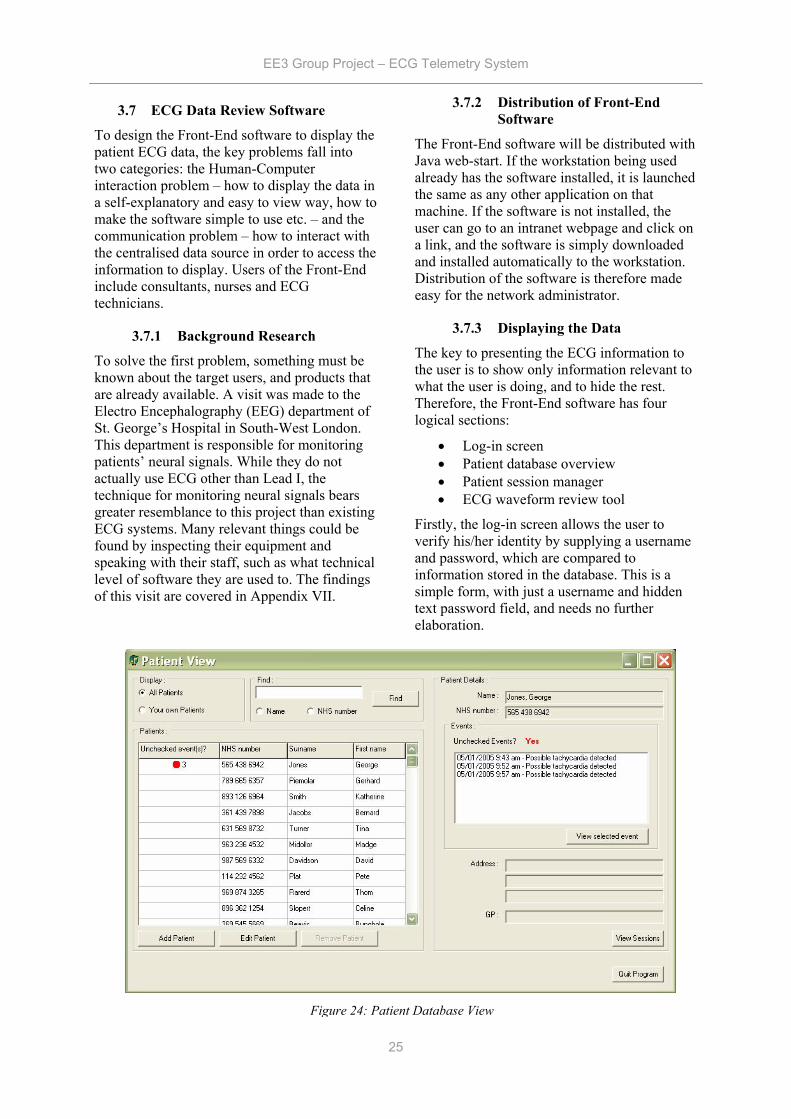
3.7 ECG Data Review Software
To design the Front-End software to display the patient ECG data, the key problems fall into two categories: the Human-Computer interaction problem – how to display the data in a self-explanatory and easy to view way, how to make the software simple to use etc. – and the communication problem – how to interact with the centralised data source in order to access the information to display. Users of the Front-End include consultants, nurses and ECG technicians.
3.7.1 Background Research
To solve the first problem, something must be known about the target users, and products that are already available. A visit was made to the Electro Encephalography (EEG) department of St. George’s Hospital in South-West London. This department is responsible for monitoring patients’ neural signals. While they do not actually use ECG other than Lead I, the technique for monitoring neural signals bears greater resemblance to this project than existing ECG systems. Many relevant things could be found by inspecting their equipment and speaking with their staff, such as what technical level of software they are used to. The findings of this visit are covered in Appendix VII.
3.7.2 Distribution of Front-End Software
The Front-End software will be distributed with Java web-start. If the workstation being used already has the software installed, it is launched the same as any other application on that machine. If the software is not installed, the user can go to an intranet webpage and click on a link, and the software is simply downloaded and installed automatically to the workstation. Distribution of the software is therefore made easy for the network administrator.
3.7.3 Displaying the Data
The key to presenting the ECG information to the user is to show only information relevant to what the user is doing, and to hide the rest. Therefore, the Front-End software has four logical sections:
• Log-in screen • Patient database overview • Patient session manager • ECG waveform review tool
Firstly, the log-in screen allows the user to verify his/her identity by supplying a username and password, which are compared to information stored in the database. This is a simple form, with just a username and hidden text password field, and needs no further elaboration.
Figure 24: Patient Database View
EE3 Group Project – ECG Telemetry System
26
3.7.4 Patient Database Overview
Once the user is logged in, they are presented with information about the patients in the system. The user will be most interested in his own patients, and particularly those who have abnormalities in their ECG data. The user may also wish to see patients who have another member of staff responsible for them, for a second opinion. Therefore it will be useful to hide patients that do not belong to the user, but allow them to see all patients if they wish.
The user must be able to go straight to parts of ECG waveform data corresponding to conditions found or times when the event button has been pressed. It is also important to make events and conditions which have not yet been viewed easiest to see, so that no important data that can be used to make a diagnosis is missed.
It is also important to display enough information about the patients so that the user can easily identify the exact person they wish to check. The user may also wish to carry out basic administration tasks, such as adding a new patient to the database or editing the details of a current patient.
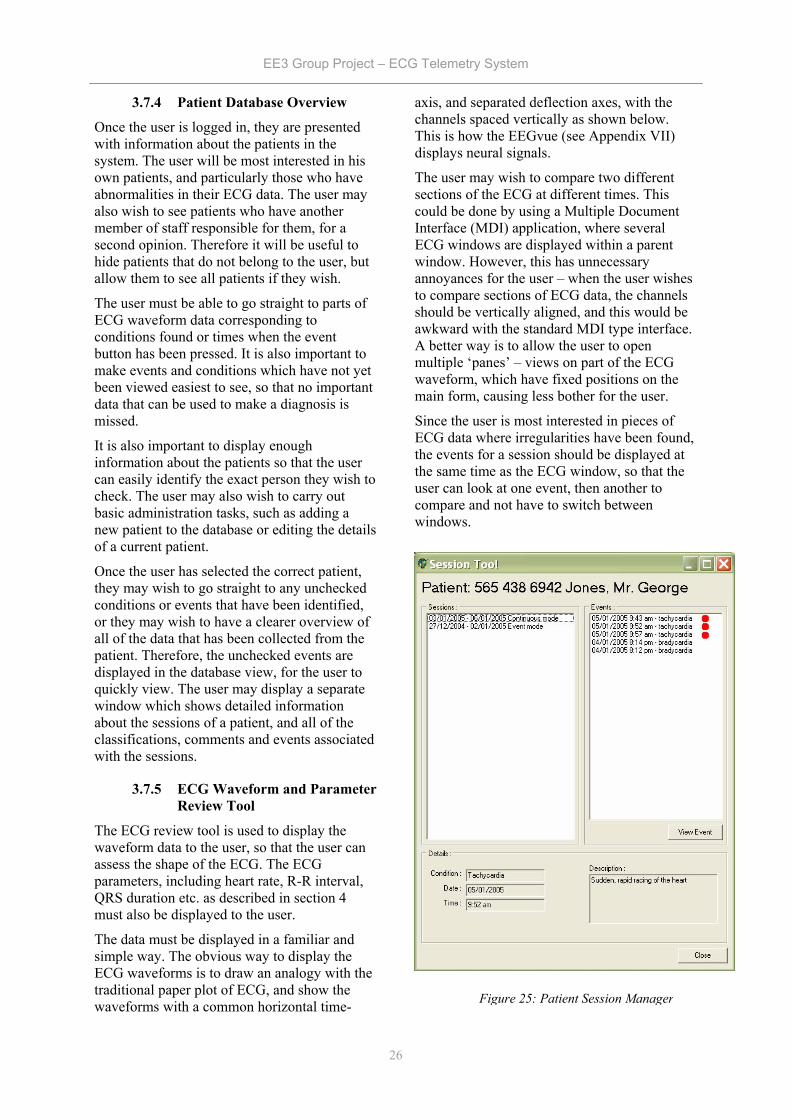
Once the user has selected the correct patient, they may wish to go straight to any unchecked conditions or events that have been identified, or they may wish to have a clearer overview of all of the data that has been collected from the patient. Therefore, the unchecked events are displayed in the database view, for the user to quickly view. The user may display a separate window which shows detailed information about the sessions of a patient, and all of the classifications, comments and events associated with the sessions.
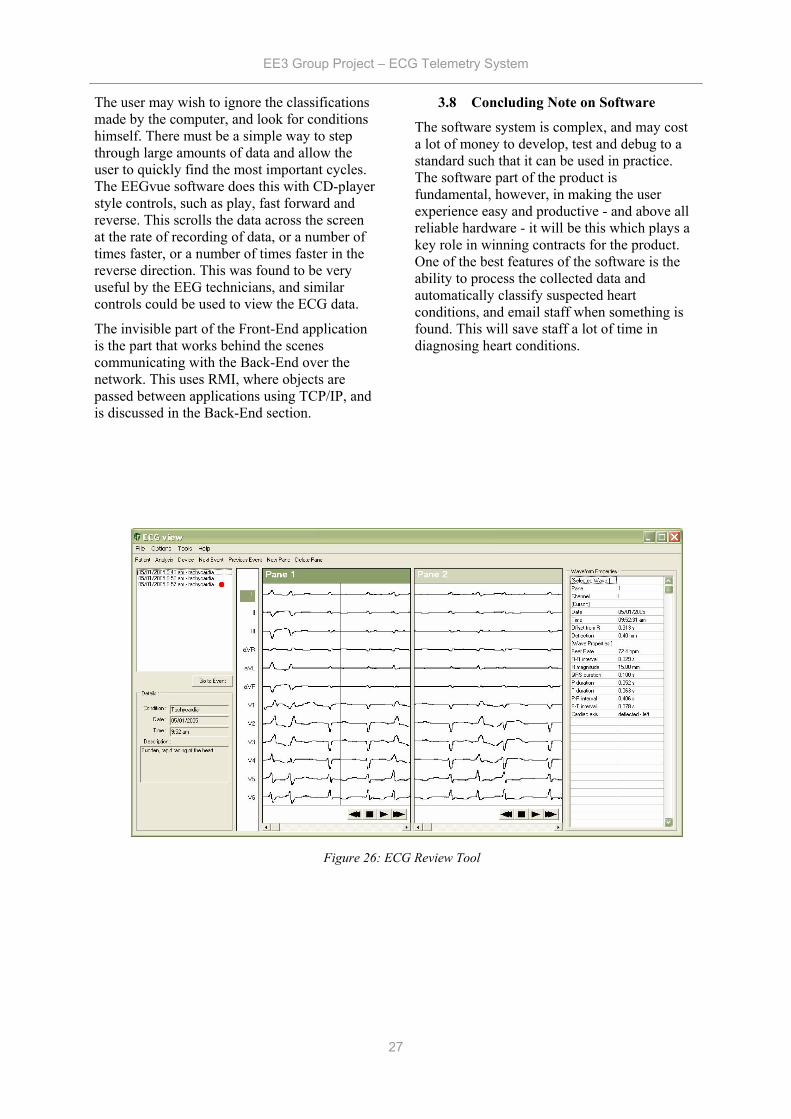
3.7.5 ECG Waveform and Parameter Review Tool
The ECG review tool is used to display the waveform data to the user, so that the user can assess the shape of the ECG. The ECG parameters, including heart rate, R-R interval, QRS duration etc. as described in section 4 must also be displayed to the user.
The data must be displayed in a familiar and simple way. The obvious way to display the ECG waveforms is to draw an analogy with the traditional paper plot of ECG, and show the waveforms with a common horizontal time-
axis, and separated deflection axes, with the channels spaced vertically as shown below. This is how the EEGvue (see Appendix VII) displays neural signals.
The user may wish to compare two different sections of the ECG at different times. This could be done by using a Multiple Document Interface (MDI) application, where several ECG windows are displayed within a parent window. However, this has unnecessary annoyances for the user – when the user wishes to compare sections of ECG data, the channels should be vertically aligned, and this would be awkward with the standard MDI type interface. A better way is to allow the user to open multiple ‘panes’ – views on part of the ECG waveform, which have fixed positions on the main form, causing less bother for the user.
Since the user is most interested in pieces of ECG data where irregularities have been found, the events for a session should be displayed at the same time as the ECG window, so that the user can look at one event, then another to compare and not have to switch between windows.
Figure 25: Patient Session Manager
EE3 Group Project – ECG Telemetry System
27
The user may wish to ignore the classifications made by the computer, and look for conditions himself. There must be a simple way to step through large amounts of data and allow the user to quickly find the most important cycles. The EEGvue software does this with CD-player style controls, such as play, fast forward and reverse. This scrolls the data across the screen at the rate of recording of data, or a number of times faster, or a number of times faster in the reverse direction. This was found to be very useful by the EEG technicians, and similar controls could be used to view the ECG data.
The invisible part of the Front-End application is the part that works behind the scenes communicating with the Back-End over the network. This uses RMI, where objects are passed between applications using TCP/IP, and is discussed in the Back-End section.
3.8 Concluding Note on Software
The software system is complex, and may cost a lot of money to develop, test and debug to a standard such that it can be used in practice. The software part of the product is fundamental, however, in making the user experience easy and productive - and above all reliable hardware - it will be this which plays a key role in winning contracts for the product. One of the best features of the software is the ability to process the collected data and automatically classify suspected heart conditions, and email staff when something is found. This will save staff a lot of time in diagnosing heart conditions.
Figure 26: ECG Review Tool
EE3 Group Project – ECG Telemetry System
28
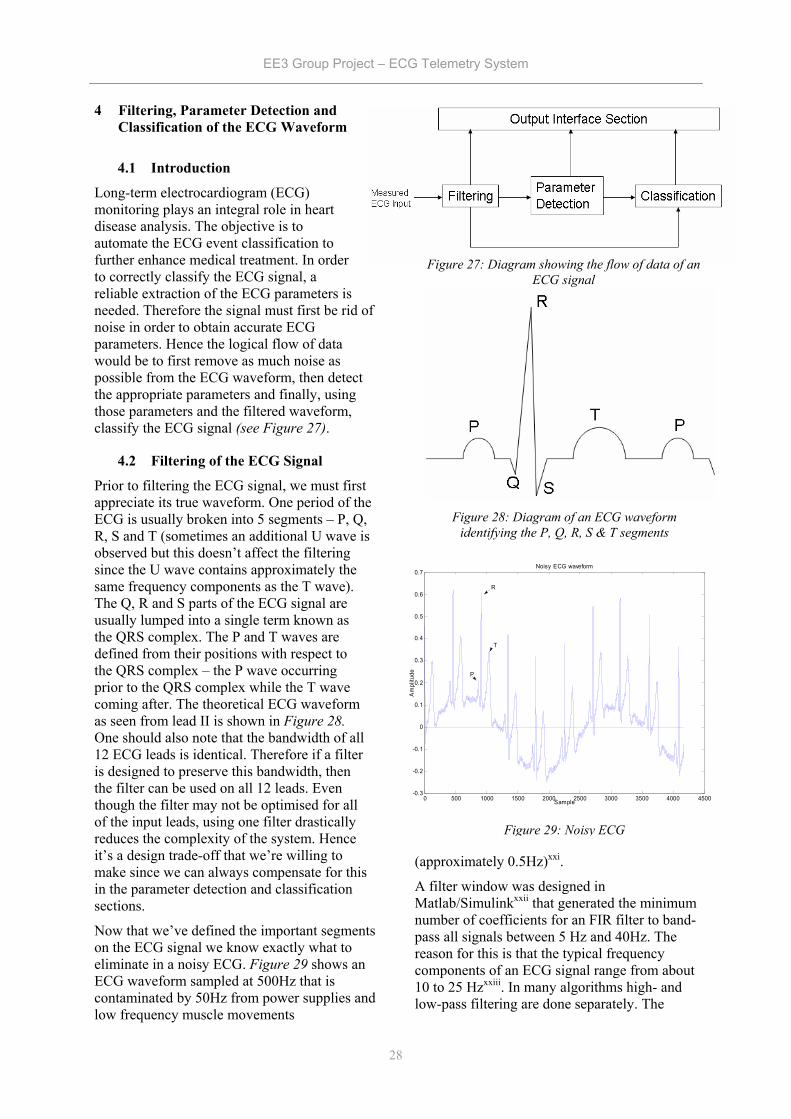
4 Filtering, Parameter Detection and Classification of the ECG Waveform
4.1 Introduction
Long-term electrocardiogram (ECG) monitoring plays an integral role in heart disease analysis. The objective is to automate the ECG event classification to further enhance medical treatment. In order to correctly classify the ECG signal, a reliable extraction of the ECG parameters is needed. Therefore the signal must first be rid of noise in order to obtain accurate ECG parameters. Hence the logical flow of data would be to first remove as much noise as possible from the ECG waveform, then detect the appropriate parameters and finally, using those parameters and the filtered waveform, classify the ECG signal (see Figure 27).
4.2 Filtering of the ECG Signal
Prior to filtering the ECG signal, we must first appreciate its true waveform. One period of the ECG is usually broken into 5 segments – P, Q, R, S and T (sometimes an additional U wave is observed but this doesn’t affect the filtering since the U wave contains approximately the same frequency components as the T wave). The Q, R and S parts of the ECG signal are usually lumped into a single term known as the QRS complex. The P and T waves are defined from their positions with respect to the QRS complex – the P wave occurring prior to the QRS complex while the T wave coming after. The theoretical ECG waveform as seen from lead II is shown in Figure 28. One should also note that the bandwidth of all 12 ECG leads is identical. Therefore if a filter is designed to preserve this bandwidth, then the filter can be used on all 12 leads. Even though the filter may not be optimised for all of the input leads, using one filter drastically reduces the complexity of the system. Hence it’s a design trade-off that we’re willing to make since we can always compensate for this in the parameter detection and classification sections.
Now that we’ve defined the important segments on the ECG signal we know exactly what to eliminate in a noisy ECG. Figure 29 shows an ECG waveform sampled at 500Hz that is contaminated by 50Hz from power supplies and low frequency muscle movements
(approximately 0.5Hz)xxi.
A filter window was designed in Matlab/Simulinkxxii that generated the minimum number of coefficients for an FIR filter to band-pass all signals between 5 Hz and 40Hz. The reason for this is that the typical frequency components of an ECG signal range from about 10 to 25 Hzxxiii. In many algorithms high- and low-pass filtering are done separately. The
Figure 27: Diagram showing the flow of data of an ECG signal
Figure 28: Diagram of an ECG waveform identifying the P, Q, R, S & T segments
0 500 1000 1500 2000 2500 3000 3500 4000 4500-0.3
-0.2
-0.1
0
0.1
0.2
0.3
0.4
0.5
0.6
0.7Noisy ECG waveform
Sample
Am
plitu
de
R
T
P
Figure 29: Noisy ECG
EE3 Group Project – ECG Telemetry System
29
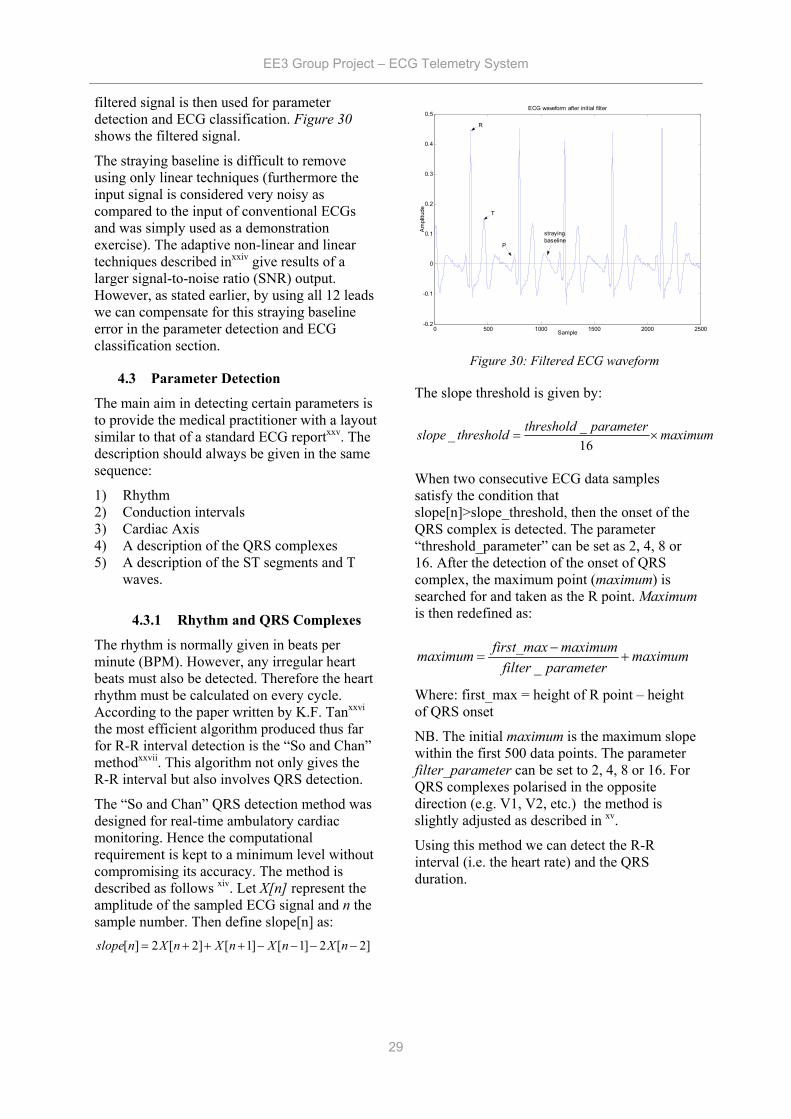
filtered signal is then used for parameter detection and ECG classification. Figure 30 shows the filtered signal.
The straying baseline is difficult to remove using only linear techniques (furthermore the input signal is considered very noisy as compared to the input of conventional ECGs and was simply used as a demonstration exercise). The adaptive non-linear and linear techniques described inxxiv give results of a larger signal-to-noise ratio (SNR) output. However, as stated earlier, by using all 12 leads we can compensate for this straying baseline error in the parameter detection and ECG classification section.
4.3 Parameter Detection
The main aim in detecting certain parameters is to provide the medical practitioner with a layout similar to that of a standard ECG reportxxv. The description should always be given in the same sequence:
1) Rhythm 2) Conduction intervals 3) Cardiac Axis 4) A description of the QRS complexes 5) A description of the ST segments and T
waves.
4.3.1 Rhythm and QRS Complexes
The rhythm is normally given in beats per minute (BPM). However, any irregular heart beats must also be detected. Therefore the heart rhythm must be calculated on every cycle. According to the paper written by K.F. Tanxxvi the most efficient algorithm produced thus far for R-R interval detection is the “So and Chan” methodxxvii. This algorithm not only gives the R-R interval but also involves QRS detection.
The “So and Chan” QRS detection method was designed for real-time ambulatory cardiac monitoring. Hence the computational requirement is kept to a minimum level without compromising its accuracy. The method is described as follows xiv. Let X[n] represent the amplitude of the sampled ECG signal and n the sample number. Then define slope[n] as:
[ ] 2 [ 2] [ 1] [ 1] 2 [ 2]slope n X n X n X n X n= + + + − − − −
The slope threshold is given by:
__16
threshold parameterslope threshold maximum= ×
When two consecutive ECG data samples satisfy the condition that slope[n]>slope_threshold, then the onset of the QRS complex is detected. The parameter “threshold_parameter” can be set as 2, 4, 8 or 16. After the detection of the onset of QRS complex, the maximum point (maximum) is searched for and taken as the R point. Maximum is then redefined as:
_first_max maximummaximum maximum
filter parameter−
= +
Where: first_max = height of R point – height of QRS onset
NB. The initial maximum is the maximum slope within the first 500 data points. The parameter filter_parameter can be set to 2, 4, 8 or 16. For QRS complexes polarised in the opposite direction (e.g. V1, V2, etc.) the method is slightly adjusted as described in xv.
Using this method we can detect the R-R interval (i.e. the heart rate) and the QRS duration.
0 500 1000 1500 2000 2500-0.2
-0.1
0
0.1
0.2
0.3
0.4
0.5ECG waveform after initial filter
Sample
Am
plitu
de
R
T
P
straying baseline
Figure 30: Filtered ECG waveform

EE3 Group Project – ECG Telemetry System
30
4.3.2 T- and P-Wave Detection (used to obtain the ST segment and the conduction intervals)
The method described by Joeng algorithmxxviii will be used to detect T and P waves. Firstly a significant point set is constructed by applying a 9-point derivative to the ECG signal X[n]:
4
4
1( ) . [ ]60 i
F n i X n i=−
= +∑
(Where n is the sample number)
The consequence of constructing this significant point set is quite useful (see Figure 31).
From the graph one can clearly recognise that the straying baseline is removed. Furthermore whenever there is a drastic change in slope (i.e. P and T wave onset and offset and QRS complex) the output of the Significant Point Set shows up as a turning point. Thus our problem is now reduced to evaluating turning points on a far less noisy signal. The question now is differentiating the turning points. This is quite easily solved since we know that the P wave occurs before the QRS complex and the T wave occurs after. Furthermore the “So and Chan” algorithm tells us the location of the QRS.
The T-wave is expected within a specific time window. The start and duration of the window depends on the R-R intervalxxix. If the RR-interval > 0.7s TwaveWindowBegin = 0.08s after QRS end TwaveWindowEnd = 0.44s If the RR-interval < 0.7s TwaveWindowBegin = 0.04s after QRS end TwaveWindowEnd = (0.7 RR-interval – 0.06)s
Within this window, the minimum, maximum and order of the slopes of the derived function are important for detecting the T-wave. The slope needs to be at least 0.006 mV/s for a T-wave to be detected.
The P-wave is located between the end of the T-wave and the beginning of the QRS complex. The detection rule for a P-wave is a positive slope followed by a negative slope. The magnitude of both slopes must be greater than 0.004 mV /s. The algorithm searches for this combination until the start of the QRS complex. To ensure that a U-wave is not falsely detected
as a P-wave, the last detected wave before the QRS complex is the P-wave.
4.4 Cardiac Axis
Determining whether the cardiac axis is normal or there is left/right axis deviation is quite straightforward. For this we would simply use leads I, II and III xii. For a normal ECG the maximum amplitude of the signal is positive (predominantly upward) in all three leads with the deflection greater in II than in I or III. For right axis deflection the maximum amplitude of lead I is negative (predominantly downward) and the deflection in III would become more positive than II. Finally for left axis deflection the maximum amplitude in III is negative and in severe cases the maximum amplitude in II is also negative. Therefore, given an ECG signal, it’s quite straightforward to write an algorithm to describe the cardiac axis since one would simply evaluate the maximum deviation from the baseline for leads I, II and III.
4.5 Classification
There are several examples of ECG classifiers. Acharya et al (2004)xxx outlined a myriad of classifiers using neural network techniques, spectral entropy, Poincare plot geometry, Lypunov exponent and fuzzy algorithms. Our aim in this section, however, is not to diagnose any diseases but to simply flag any irregularities that occur in the ECG and possibly suggest some likely diseases. The final diagnosis is solely dependent on the medical practitioner. This not only reduces computational complexity but prevents
0 100 200 300 400 500 600 700-1
-0.5
0
0.5
1
1.5
Samples
Am
plitu
de
Magnified 9-point Derivative Plot
ECG
9-pointDerivative
Figure 31: Graph Showing ECG superimposed with the Significant Point Set
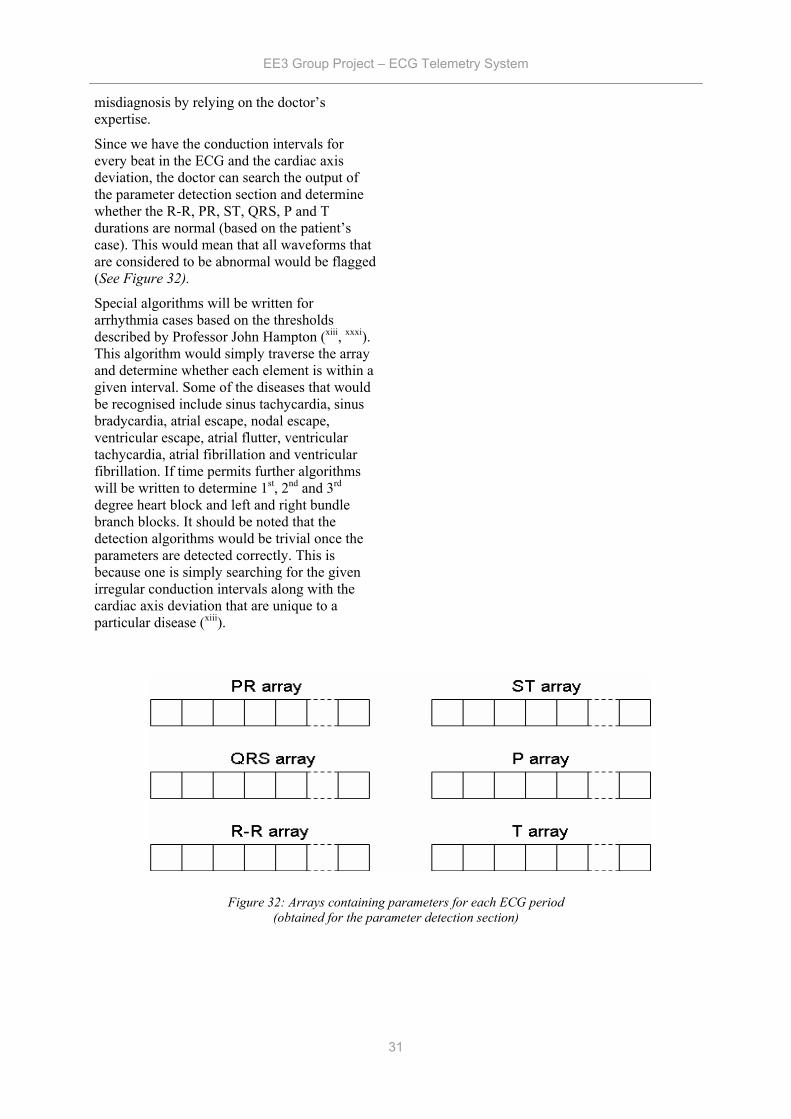
EE3 Group Project – ECG Telemetry System
31
misdiagnosis by relying on the doctor’s expertise.
Since we have the conduction intervals for every beat in the ECG and the cardiac axis deviation, the doctor can search the output of the parameter detection section and determine whether the R-R, PR, ST, QRS, P and T durations are normal (based on the patient’s case). This would mean that all waveforms that are considered to be abnormal would be flagged (See Figure 32).
Special algorithms will be written for arrhythmia cases based on the thresholds described by Professor John Hampton (xiii, xxxi). This algorithm would simply traverse the array and determine whether each element is within a given interval. Some of the diseases that would be recognised include sinus tachycardia, sinus bradycardia, atrial escape, nodal escape, ventricular escape, atrial flutter, ventricular tachycardia, atrial fibrillation and ventricular fibrillation. If time permits further algorithms will be written to determine 1st, 2nd and 3rd degree heart block and left and right bundle branch blocks. It should be noted that the detection algorithms would be trivial once the parameters are detected correctly. This is because one is simply searching for the given irregular conduction intervals along with the cardiac axis deviation that are unique to a particular disease (xiii).
Figure 32: Arrays containing parameters for each ECG period (obtained for the parameter detection section)

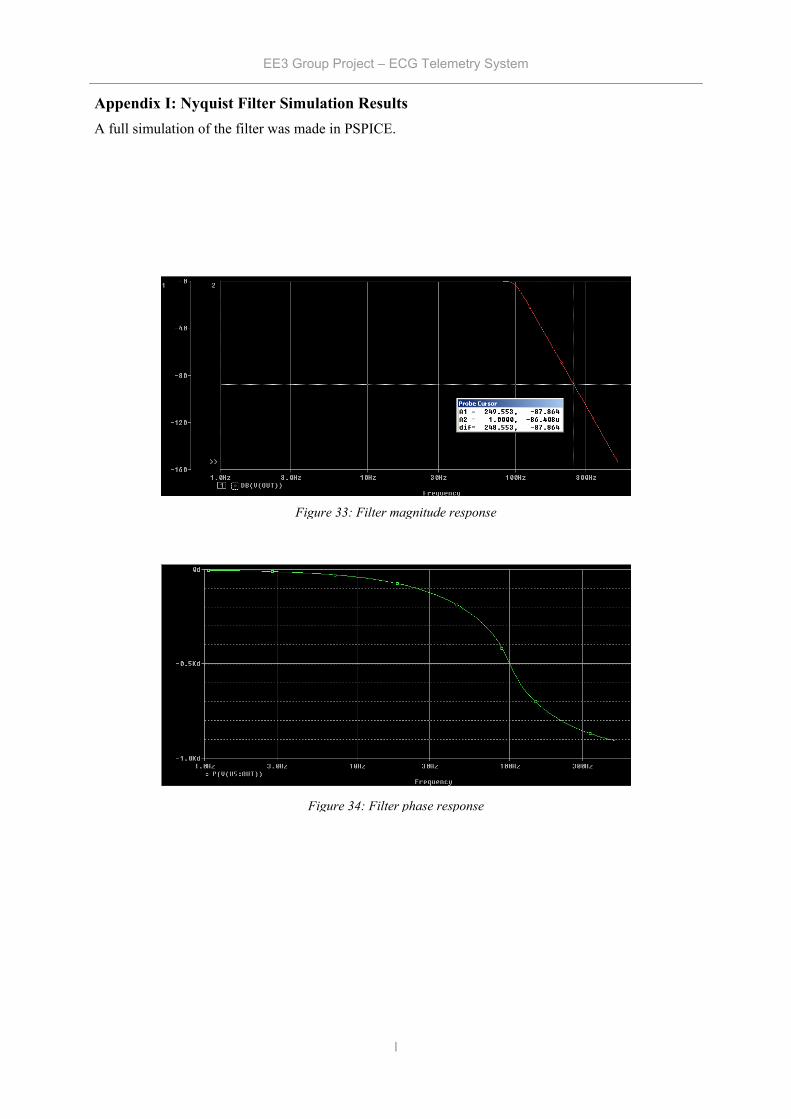
EE3 Group Project – ECG Telemetry System
I
Appendix I: Nyquist Filter Simulation Results A full simulation of the filter was made in PSPICE.
Figure 33: Filter magnitude response
Figure 34: Filter phase response
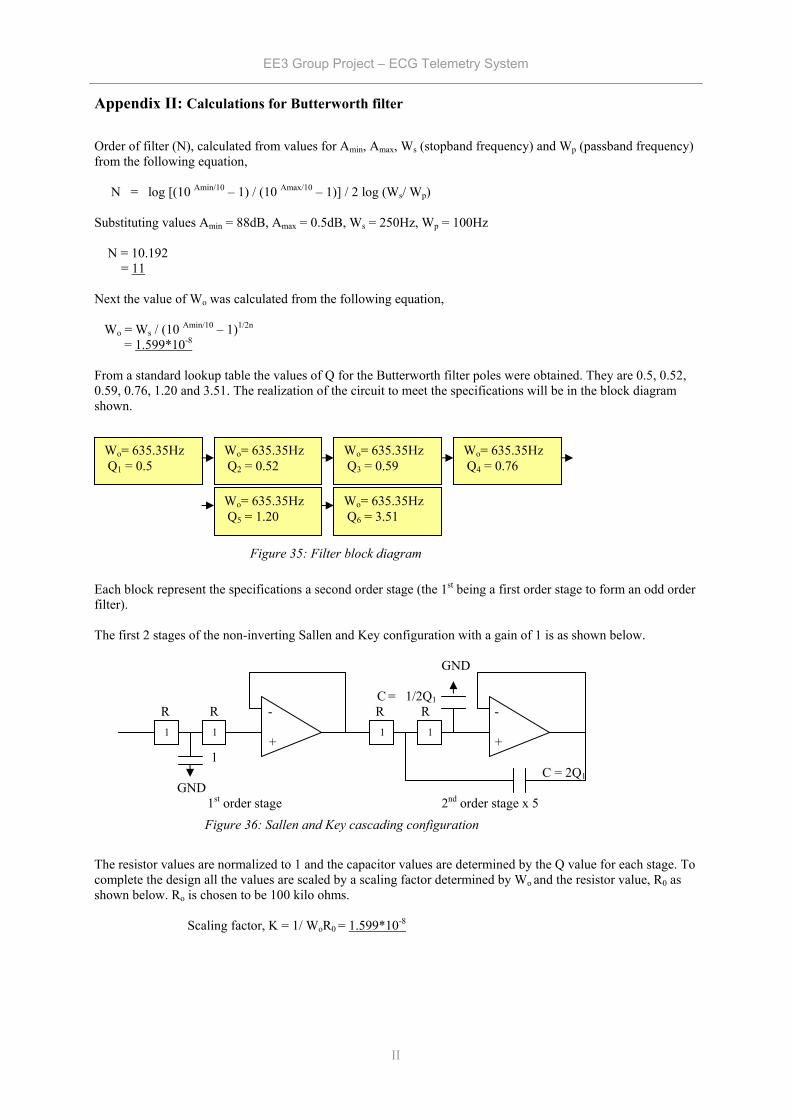
EE3 Group Project – ECG Telemetry System
II
Appendix II: Calculations for Butterworth filter
Order of filter (N), calculated from values for Amin, Amax, Ws (stopband frequency) and Wp (passband frequency) from the following equation, N = log [(10 Amin/10 – 1) / (10 Amax/10 – 1)] / 2 log (Ws/ Wp) Substituting values Amin = 88dB, Amax = 0.5dB, Ws = 250Hz, Wp = 100Hz N = 10.192 = 11 Next the value of Wo was calculated from the following equation, Wo = Ws / (10 Amin/10 – 1)1/2n = 1.599*10-8
From a standard lookup table the values of Q for the Butterworth filter poles were obtained. They are 0.5, 0.52, 0.59, 0.76, 1.20 and 3.51. The realization of the circuit to meet the specifications will be in the block diagram shown.
Each block represent the specifications a second order stage (the 1st being a first order stage to form an odd order filter). The first 2 stages of the non-inverting Sallen and Key configuration with a gain of 1 is as shown below. GND C = 1/2Q1 R R - R R - + + 1 C = 2Q1 GND 1st order stage 2nd order stage x 5 The resistor values are normalized to 1 and the capacitor values are determined by the Q value for each stage. To complete the design all the values are scaled by a scaling factor determined by Wo and the resistor value, R0 as shown below. Ro is chosen to be 100 kilo ohms. Scaling factor, K = 1/ WoR0 = 1.599*10-8
1 1 1 1
Figure 36: Sallen and Key cascading configuration
Wo= 635.35Hz
Q1 = 0.5 Wo= 635.35Hz
Q2 = 0.52 Wo= 635.35Hz Q3 = 0.59
Wo= 635.35Hz Q4 = 0.76
Wo= 635.35Hz
Q5 = 1.20 Wo= 635.35Hz Q6 = 3.51
Figure 35: Filter block diagram
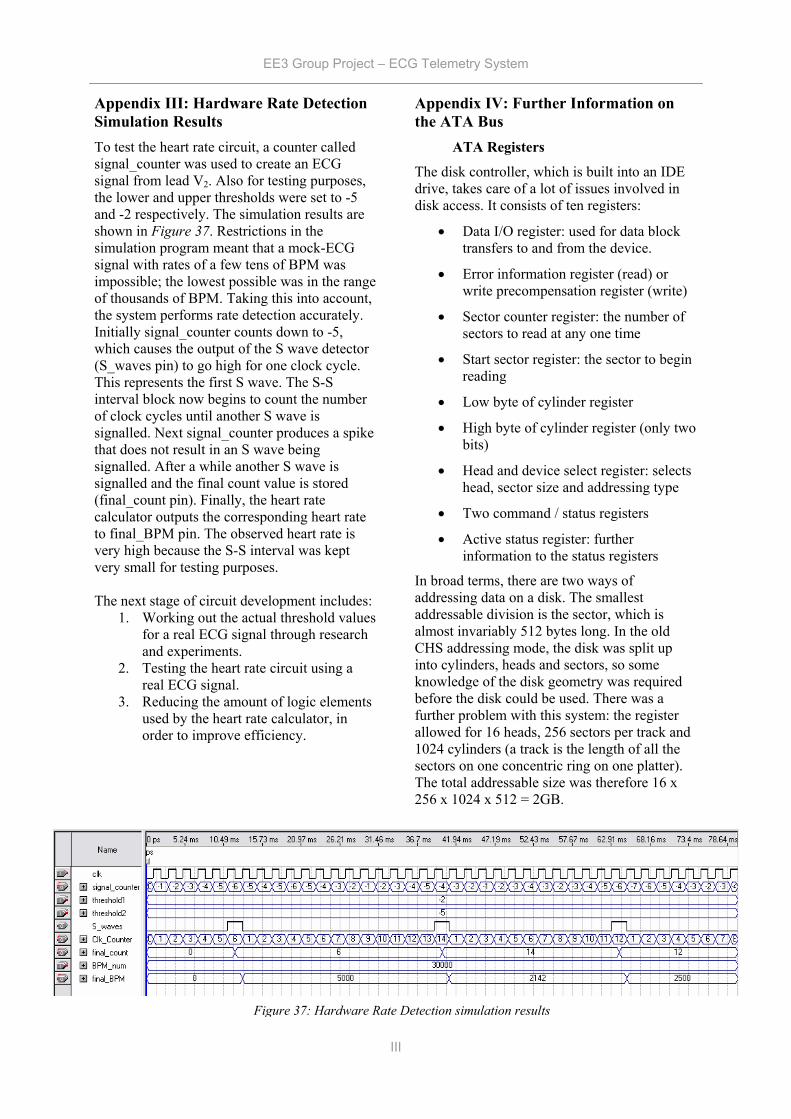
EE3 Group Project – ECG Telemetry System
III
Appendix III: Hardware Rate Detection Simulation Results To test the heart rate circuit, a counter called signal_counter was used to create an ECG signal from lead V2. Also for testing purposes, the lower and upper thresholds were set to -5 and -2 respectively. The simulation results are shown in Figure 37. Restrictions in the simulation program meant that a mock-ECG signal with rates of a few tens of BPM was impossible; the lowest possible was in the range of thousands of BPM. Taking this into account, the system performs rate detection accurately. Initially signal_counter counts down to -5, which causes the output of the S wave detector (S_waves pin) to go high for one clock cycle. This represents the first S wave. The S-S interval block now begins to count the number of clock cycles until another S wave is signalled. Next signal_counter produces a spike that does not result in an S wave being signalled. After a while another S wave is signalled and the final count value is stored (final_count pin). Finally, the heart rate calculator outputs the corresponding heart rate to final_BPM pin. The observed heart rate is very high because the S-S interval was kept very small for testing purposes. The next stage of circuit development includes:
1. Working out the actual threshold values for a real ECG signal through research and experiments.
2. Testing the heart rate circuit using a real ECG signal.
3. Reducing the amount of logic elements used by the heart rate calculator, in order to improve efficiency.
Appendix IV: Further Information on the ATA Bus
ATA Registers
The disk controller, which is built into an IDE drive, takes care of a lot of issues involved in disk access. It consists of ten registers:
• Data I/O register: used for data block transfers to and from the device.
• Error information register (read) or write precompensation register (write)
• Sector counter register: the number of sectors to read at any one time
• Start sector register: the sector to begin reading
• Low byte of cylinder register
• High byte of cylinder register (only two bits)
• Head and device select register: selects head, sector size and addressing type
• Two command / status registers
• Active status register: further information to the status registers
In broad terms, there are two ways of addressing data on a disk. The smallest addressable division is the sector, which is almost invariably 512 bytes long. In the old CHS addressing mode, the disk was split up into cylinders, heads and sectors, so some knowledge of the disk geometry was required before the disk could be used. There was a further problem with this system: the register allowed for 16 heads, 256 sectors per track and 1024 cylinders (a track is the length of all the sectors on one concentric ring on one platter). The total addressable size was therefore 16 x 256 x 1024 x 512 = 2GB.
Figure 37: Hardware Rate Detection simulation results
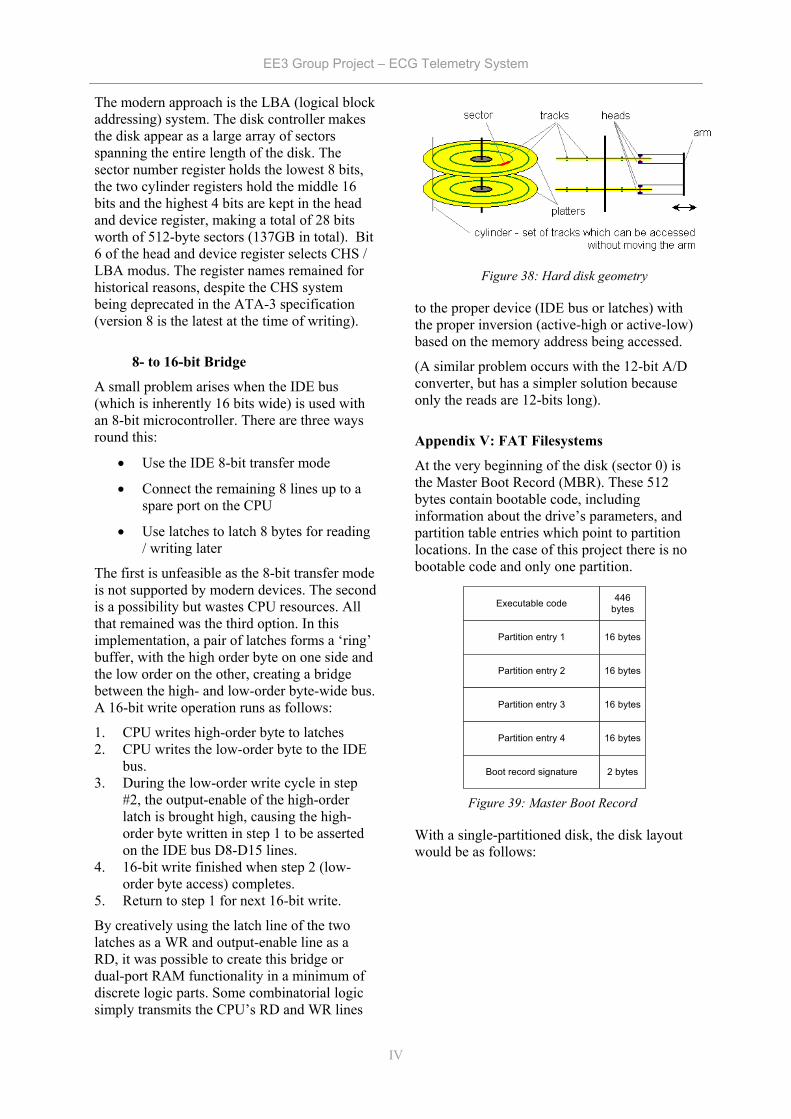
EE3 Group Project – ECG Telemetry System
IV
The modern approach is the LBA (logical block addressing) system. The disk controller makes the disk appear as a large array of sectors spanning the entire length of the disk. The sector number register holds the lowest 8 bits, the two cylinder registers hold the middle 16 bits and the highest 4 bits are kept in the head and device register, making a total of 28 bits worth of 512-byte sectors (137GB in total). Bit 6 of the head and device register selects CHS / LBA modus. The register names remained for historical reasons, despite the CHS system being deprecated in the ATA-3 specification (version 8 is the latest at the time of writing).
8- to 16-bit Bridge
A small problem arises when the IDE bus (which is inherently 16 bits wide) is used with an 8-bit microcontroller. There are three ways round this:
• Use the IDE 8-bit transfer mode
• Connect the remaining 8 lines up to a spare port on the CPU
• Use latches to latch 8 bytes for reading / writing later
The first is unfeasible as the 8-bit transfer mode is not supported by modern devices. The second is a possibility but wastes CPU resources. All that remained was the third option. In this implementation, a pair of latches forms a ‘ring’ buffer, with the high order byte on one side and the low order on the other, creating a bridge between the high- and low-order byte-wide bus. A 16-bit write operation runs as follows:
1. CPU writes high-order byte to latches 2. CPU writes the low-order byte to the IDE
bus. 3. During the low-order write cycle in step
#2, the output-enable of the high-order latch is brought high, causing the high-order byte written in step 1 to be asserted on the IDE bus D8-D15 lines.
4. 16-bit write finished when step 2 (low-order byte access) completes.
5. Return to step 1 for next 16-bit write.
By creatively using the latch line of the two latches as a WR and output-enable line as a RD, it was possible to create this bridge or dual-port RAM functionality in a minimum of discrete logic parts. Some combinatorial logic simply transmits the CPU’s RD and WR lines
to the proper device (IDE bus or latches) with the proper inversion (active-high or active-low) based on the memory address being accessed.
(A similar problem occurs with the 12-bit A/D converter, but has a simpler solution because only the reads are 12-bits long).
Appendix V: FAT Filesystems
At the very beginning of the disk (sector 0) is the Master Boot Record (MBR). These 512 bytes contain bootable code, including information about the drive’s parameters, and partition table entries which point to partition locations. In the case of this project there is no bootable code and only one partition.
With a single-partitioned disk, the disk layout would be as follows:
Figure 38: Hard disk geometry
Executable code
Partition entry 1
Partition entry 2
Partition entry 3
Partition entry 4
Boot record signature
446bytes
16 bytes
16 bytes
16 bytes
16 bytes
2 bytes
Figure 39: Master Boot Record
EE3 Group Project – ECG Telemetry System
V
At the beginning of a partition, after the FAT boot record, is the FAT table. In FAT partitions, the disk is divided up more coarsely into units called clusters. These vary in length depending upon the size of the disk and the type of FAT used (12, 16 or 32 bit), but are typically 2K-32K in size. The FAT table is essentially a large singly-linked list which maps out every cluster and where files spanning more than one cluster are located on the disk. The following codes are allowed in a FAT entry:
FAT Code Range Meaning
0000h Available Cluster
0002h-FFEFh Used, Next Cluster in File
FFF0h-FFF6h Reserved Cluster
FFF7h BAD Cluster
FFF8h-FFFF Used, Last Cluster in File
Take the example of a 17KB file, which would span 5 clusters at 4KB/cluster, despite the fifth cluster only containing 1KB of data – remember that a cluster is the smallest addressable unit. Assume it is fragmented and using the FAT16 system so that it occurs in clusters 0x0010, 0x0011, 0xC152, 0xC153 and 0xF25C. The corresponding FAT table entries would be:
There are limitations to the different types of FAT used. FAT12 is limited to a maximum disk size of 16MB and is far too restrictive for our purposes. FAT16 is easier to use than FAT32, but requires large cluster sizes to make use of large disks. This can lead to inefficiency for the reasons outlined in the previous example. The following table describes the efficiency for different cluster sizes in the FAT16 system when the disk is filled with 3K files:
FAT32 uses 4-byte rather than 2-byte partition entries, allowing for many more clusters to be addressed. This reduces the cluster size for any given disk and increases efficiency. The following table makes a comparison with FAT32 efficiency:
FAT entry Points to
0x0010 0x0011
0x0011 0xC152
… …
0xC152 0xC153
0xC153 0xF25C
… …
0xF25C 0xFFFF (EOF)
Cluster Size Efficiency Disk Size
2K 98.4% 0-127 MB
4K 96.6% 128-255 MB
8K 92.9% 256-511 MB
16K 85.8% 512-1023 MB
32K 73.8% 1024-2047 MB
64K 56.6% >2047 MB
Table 8: Example FAT entries
Table 9: Storage efficiency in FAT16 systems for 3K files
Master Boot Record
FAT Boot Record
FAT Tables
Root Directory
Data
Figure 40: Disk Layout
Table 7: FAT codes
EE3 Group Project – ECG Telemetry System
VI
Disk Size Cluster Size Efficiency
>260MB 4K 98.4%
>8GB 8K 96.6%
>60GB 16K 92.9%
>2TB 32K 85.8%
As mentioned earlier, the differences between FAT16 and FAT32 are far greater than just different sized FAT entries. FAT32 allows for greater compatibility with other filesystems, greater flexibility with the location of root directories and many other features which are useful on a PC, but would be redundant in this project. There is also a lower limit of 512MB for FAT32 disks. The inefficiency of FAT16 for large disks is largely immaterial when large files are stored on it, since wasted space only occurs at the very end of the file. The ECG device will write generally large files so it was decided that a FAT16 filesystem would be used initially. Support for fragmented files will be limited at first and if time becomes restricted then perhaps only contiguous (i.e. non-fragmented data) may be written. If further time permits then a FAT32 driver will be written, allowing for partitions above the FAT16 2.5GB limit to be used.
Appendix VI: Entity Relationship Data Model
The Entity-Relationship data model is described thoroughly in Silberschatz-Korth-Sudarshan xiv, “Entity-Relationship Model”, chapter 2, p27, and is summarised here. The key concepts are ‘entities’ – real world objects – which have ‘attributes’, and ‘relationships’ with other entities. Similar entities with different valued attributes are contained in ‘entity sets’, and the entities contained have common relationships with others, contained in ‘relationship sets’. For example, there are two entity sets patient and staff in the system. The patient entity set contains patient entities, with attributes such as name and NHS number, while the staff entity set contains staff entities with attributes such as log-in name and real name. These entity sets are related by the relationship set “Responsibility”,
which is a one-to-many relationship from patient to staff, showing which member of staff is responsible for which patient. The relationship is one-to-many, because each member of staff may be responsible for many patients, but each patient has exactly one member of staff who is responsible for them.
Patient and staff are examples of strong entity sets – either an attribute or combination of attributes can uniquely identify each entity, known as the primary key of the entity set. Here, the ID attribute (e.g. NHS number) serves to identify each patient individually. An entity set without a primary key is known as a weak entity set. All entity sets must therefore have an ‘identifying relationship’ with a strong entity set whereby the union of the primary key with some attributes, known as discriminating attributes, of the weak entity set uniquely defines every entity in the weak entity set.
For example, the session entity set is a weak entity set because there exists no combination of its attributes which can uniquely identify each of its entities. Two patients may have used the same device twice and in the same mode, for example. In this case, each session cannot be uniquely identified, so the patient ID has to be taken with the session number to uniquely identify each session entity.
Appendix VII: EEG Department Visit
The software system for Electro Encephalography (EEG) department of St. Georges Hospital in South-West London was evaluated.
The software used to view EEG signals is EEGvue and NicVue, from Nicolet Biomedicalxxxii, part of a Viasys Healthcare, a large international medical equipment company. The users of the software include EEG technicians, nurses and doctors. The NicVue software is a patient database. The scope of the database is limited to the department, so all of the department’s patients appear in the database, but patients from other hospitals around the country do not.
The main function of the EEGvue software is to view the neural signals while they are being captured from a piece of hardware attached to the patient. Typically a patient will be monitored, and a technician will be operating a workstation allowing them to view the patient’s electrical neural signals in real-time. The
Table 10: Storage efficiency in FAT32 systems with 3K files
EE3 Group Project – ECG Telemetry System
VII
software allows the signals to be captured and reviewed at a later time.
Before this system was computerised, technicians would review a pen plot of the signals on a piece of paper. To remain familiar, EEGvue displays the signals almost exactly as they would have been displayed on paper. All of the signals are displayed over the same period of time. This method of displaying the signals makes them instantly recognizable by a technician or doctor studying them.
The EEGvue software contains other useful features. The technician can add comments, and use basic filters such as lowpass and notch, to remove high frequency and mains noise respectively.
One of the most useful features included in the software, according to the technicians interviewed, is the ability to use video-style controls to view the EEG signals: there is a play button, which advances the time of the signal displayed at a real-time rate, as well as a fast-forward and reverse button. This allows the experienced technician to quickly step through data spanning a large amount of time, and diagnose conditions within minutes.
Overall, the technicians are very happy with the software: because the whole data acquisition and review software system fits together very well, and the software is simple yet powerful enough, the users can accomplish tasks such as diagnosis very quickly.
The visit to St. George’s Hospital was made on Friday 17th December 2004. The member of staff consulted was Pat Moore, Senior Chief Technician of the EEG dept.
EE3 Group Project – ECG Telemetry System
VIII
References i D.Dobrev. Two Electrode low supply voltage electrocardiogram signal amplifier http://www.iee.org/Publish/Journals/ProfJourn/MBEC/20043858.pdf ii Continuous 12-lead ECG using WT100C Wilson Terminal http://www.biopac.com/AppNotes/ah206/wilson.htm iii WinAVR GNU-based AVR compiler http://sourceforge.net/projects/winavr iv The Ponyprog page http://www.lancos.com/prog.html v T13 Technical Committee – AT Attachment http://www.t13.org/ vi Paul’s 8051 Code Library, IDE Interface http://www.pjrc.com/tech/8051/ide/ vii Wesley’s PIC Pages – IDE Controller http://www.pjrc.com/tech/8051/ide/wesley.html viii Procyon AVRlib file index http://hubbard.engr.scu.edu/embedded/avr/avrlib/docs/html/files.html ix The FAT32 Reference Page http://www.project9.com/fat32/ x Dobiash FAT Info http://home.teleport.com/~brainy/ xi The FAT Filesystem http://www.win.tue.nl/~aeb/linux/fs/fat/fat.html xii Long Filename Specification http://home.teleport.com/~brainy/lfn.htm xiii Campione-Walrath. Java Platform Overview. Sun Microsystems website. http://java.sun.com/docs/books/tutorial/getStarted/intro/definition.html. xiv Silberschatz-Korth-Sudarshan. Database System Concepts 4th ed. McGraw Hill 2002. xv ODBC Overview. Microsoft Developer Network. http://msdn.microsoft.com/library/default.asp?url=/library/en-us/odbc/htm/odbcintroduction_to_odbc.asp xvi Java Web-Start FAQ. Sun Microsystems website. http://java.sun.com/j2se/1.5.0/docs/guide/javaws/developersguide/faq.html xvii Cadenhead-Lemay. Teach Yourself Java 2 in 21 Days 4th ed. SAMS publishing 2004. “Sockets”, ch17, p475. xviii Javamail API FAQ. Sun Microsystems website. http://java.sun.com/products/javamail/FAQ.html xix Cadenhead-Lemay. “Creating Web Services with XML-RPC”, Appendix F, p721. xx Cadenhead-Lemay. “Serializing and Examining Objects”, ch16, p457. xxi Technical University of Denmark, Department of Electrical and Electronic Engineering, http://www.oersted.dtu.dk/31610/?exercises/exercise4.html xxii The MathWorks, Inc., http://www.mathworks.com xxiii B. Kohler, C. Hennig and R. Orglmeister, “The Principles of Software QRS detection”, IEEE Engineering in Medicine and Biology, January/February 2002 xxiv A. Yilmaz, M.J English, “Adaptive non-linear filtering of ECG signals: dynamic neural network approach”, Artificial Intelligence Methods for Biomedical Data Processing, IEE Colloquium, pages 1-6, 26 Apr 1996 xxv John R. Hampton, “The ECG made Easy”,5th Edition, Churchill Livingstone xxvi K. F. Tan, K. L. Chan and K. Choi, “Detection of the QRS complex, P wave and T wave in electrocardiogram”, IEEE Engineering in Medicine and Biology. xxvii H.H. So, K. L. Chan “Development of QRS detection method for real-time ambulatory cardiac monitor”, Proc 19th Annual International Conference IEEE EMBS, Chicago, USA, pages 289-292, 1997 xxviii H. K. Joeng, K. K Kim, S. C. Hwang and M. H. Lee, “A new algorithm for P-wave detection in the ECG signal”, Proceedings of the Annual International Conference of t he IEEE Engineering in Medicine and Biology Society, Vol. 1 , pages 42-43, 1989 xxix P. Laguna, et al., “New Algorithm for QT Interval Analysis in 24-hour Holter ECG: Performance and Applications”, Medicine and Biology in Engineering and Computing, Vol. 28, pages 67-73, 1990. xxx R. Acharya, A. Kumar, P. S. Bhat, C. M. Lim, S. S. Iyengar, N. Kannathal, S. M. Krishnan, “Classification of cardiac abnormalities using heart rate signals”, Medicine and Biology in Engineering and Computing, pages 288-293, 2004. xxxi John R. Hampton, “150 ECG Problems”, 2nd Edition, Churchill Livingstone. xxxii Nicolet Biomedical - http://www.nicoletbiomedical.com/