An Assessment of the Relations hip Between Frontal Impact ...
62
An Assessment of the Relations hip Between Frontal Impact Speed 4 and Fatalities Joseph C. Marsh IV Barbara C. Brown October 1975 Highway Safety Research Institute/University of ~idriian
Transcript of An Assessment of the Relations hip Between Frontal Impact ...

An Assessment of the Relations hip Between Frontal Impact Speed
4 and Fatalities
Joseph C. Marsh IV
Barbara C. Brown
October 1975
Highway Safety Research Institute/University of ~ idr i ian

The research reported herein was conducted under general research funds contributed by the Motor Vehicle Manufacturers Association. The opinions, findings, and conclusions expressed in this publication are those of the authors and not necessarily those of the MVMA.
2. Covemmmt Accession No. 3. Recip~cnl 's Catalog No.
UM-HSRI-SA-75-8 I 4. T i t le and Sublitla
1 5. Rep011 Date
An Assessment of the Relationship Between Frontal Impact Speed and
Highway Safety Research Institute The University of Michigan
October 1975 6. P u f o m i n g O ~ ~ o n i r a t i o n Code
- -
Fatalities 7. Author's)
Joseph C. Marsh IV, Barbara C. Brown 9. Perloming Orgmizotion N a e m d Address
361122 11. Contract or Grant No.
8. Performing Orgonizotion Report NO.
UM-HSRI-SA-75-8 10. Work Unit No. (TRAIS)
320 New Center Building Detroit, Michigan 48202
Ann Arbox, ~ichigan 48105 4
12. Sponsoring Agency None m d Address
Motor Vehicle Manufacturers Association
14. Sponsoring Agency Code +---+ 13. Type 01 Report and Period Covered
Technical Report
15. Supplemmtmy Notes
16 Abstract
An assessment was made of the cumulative distributions of fatalities and injuries as a function of crash severity (Equivalent Barrier Speed and TAD damage extent) using the in- depth Collision Performance and Injury Report (CPIR) data and Texas police-reported data. The exact forms of the cumulative distributions are dependent upon the set of data used and upon the set of analytical techniques used. It was also demonstra- ted that fatalities are associated with other factors than speed alone. Further, the probability of being killed is the product of the risk of fatality for each set of crash factors times the chance that each combination of crash factors will occur. Consequently, vehicle safety design chdnges or a shift away from single-vehicle rural collisions can alter the distributions of fatalities.
Existing accident data are inadequate for the preparation of an accurate and representative fatality distribution by speed (or severity). CPIR data are detailed but unrepresenta- tive and TAD lack sufficient resolution, An up-to-date national sample with sufficient data for preparation of a rep-
, resentatlve cumulative fatality curve by speed (or severity)
Impacts, Fatality Distributions, Unlimited Impact Speed, Equivalent Barrier Speed 1
t is needed. 17. Key Words
Traffic Fatalities, Frontal 18. Distribution S t o t m m t
I 19 Socursty Clessil. (af this 1-1)
Unclassified - - - - -
m. k w r i t y Clessif. (of chis p w )
Unclassified -- - --
Reproduction of corgletud page authorized


CONTENTS
1 . INTRODUCTION ...................................... 1 ...................................... 1.1 Summary 1
1.2 Conclusions and Recommendations . . . . . . . . . . . . . . 3
............. 2 . CUMULATIVE FATALITY CURVE . CPIR DATA 9
3 . CUMULATIVE FATALITY CURVE . TEXAS DATA ........... 17 3.1 EBS Derived From TAQ Vehicle ................................ Damage Scale 17
. . . . . . . . . . . . . . . . . . . 3.2 Cumulative Fatality Curve 19
4 . TEMPORAL CHANGES IN THE PROBABILITY OF ....................................... FATALITY 21
5 . ROLE OF OTHER CRASH FACTORS IN PREDICTING . . . . . . . . . . . . . . . . . . . . . . . . . . . . . . . . . . . . . . . FATALITIES 31
...................... 5.1 Analysis of Texas Data 31
5 . 2 Analysis of CPIR Data ....................... 35 ............... 6 . DISTRIBUTION OF INJURY PROBABILITY 4 3
6.1 The Approach . . . . . . . . . . . . . . . . . . . . . . . . . . . . . . . . 43 ........................ 6.2 Injury Distributions 45
REFERENCES ........................................... 49

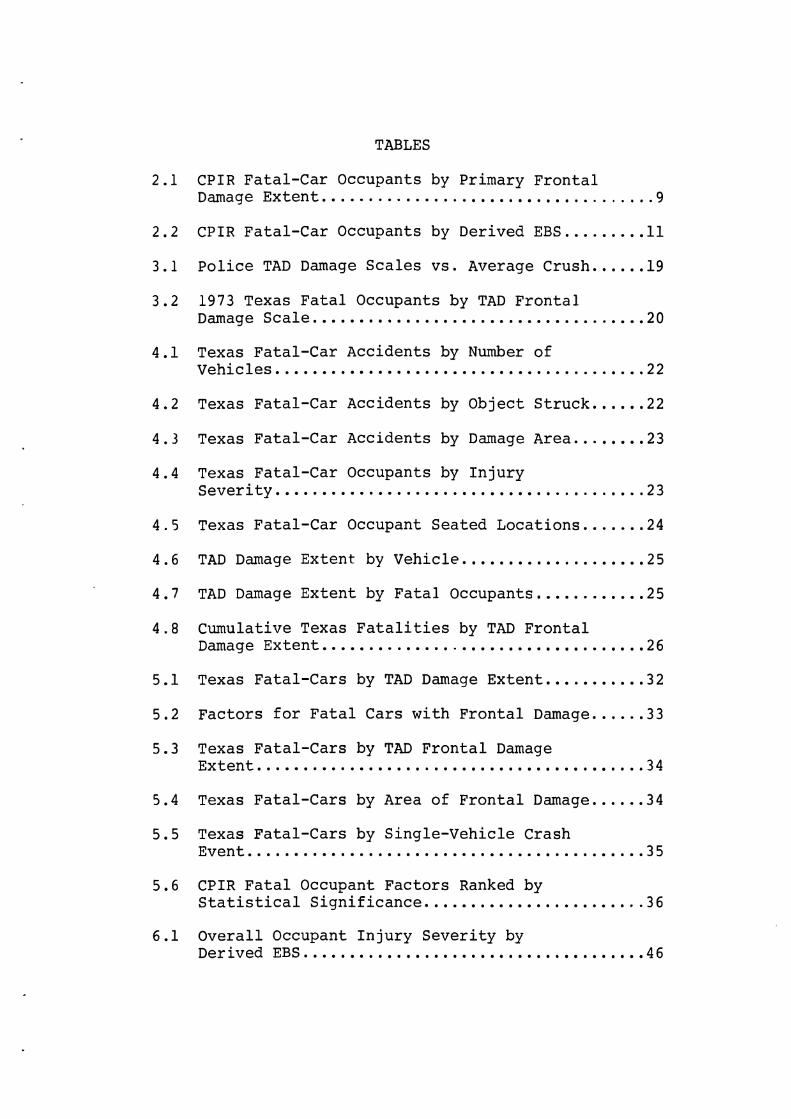
TABLES
2 . 1 C P I R Fa ta l -Car Occupants by Pr imary F r o n t a l ........ Damage E x t e n t ............................ 9
2 . 2 C P I R F a t a l - C a r Occupants by Der ived EBS ......... 11
3.1 P o l i c e TAD Damage S c a l e s v s . Average Crush ...... 19
3.2 1973 Texas F a t a l Occupants by TAD F r o n t a l Damage S c a l e .................................... 20
4.1 Texas Fa ta l -Car Acc iden t s by Number o f V e h i c l e s ........................................ 2 2
4 .2 Texas Fa ta l -Car Acc iden t s by O b j e c t S t r u c k ...... 2 2
4.3 Texas Fa ta l -Car Acc iden t s by Damage Area ........ 2 3
4.4 Texas Fa ta l -Car Occupants by I n j u r y S e v e r i t y ........................................ 23
4 . 5 Texas Fa ta l -Car Occupant S e a t e d L o c a t i o n s ....... 24
.................... 4.6 TAD Damage Ex ten t by V e h i c l e 25
............ 4.7 TAD Damage E x t e n t by F a t a l Occupants 25
4 .8 Cumulat ive Texas F a t a l i t i e s by TAD F r o n t a l Damage E x t e n t ................................... 26
5.1 Texas F a t a l - C a r s by TAD Damage E x t e n t ........... 32
F a c t o r s f o r F a t a l C a r s w i t h F r o n t a l Damage ...... 33
5.3 Texas F a t a l - C a r s by TAD F r o n t a l Damage .......................................... E x t e n t 34
5.4 Texas F a t a l - C a r s by Area o f F r o n t a l Damage ...... 34
5.5 Texas F a t a l - C a r s by S ing le -Veh ic l e Crash Event ........................................... 35
5.6 CPIR F a t a l Occupant F a c t o r s Ranked by ........................ S t a t i s t i c a l S i g n i f i c a n c e 36
6 . 1 O v e r a l l Occupant I n j u r y S e v e r i t y by Der ived EBS ..................................... 46

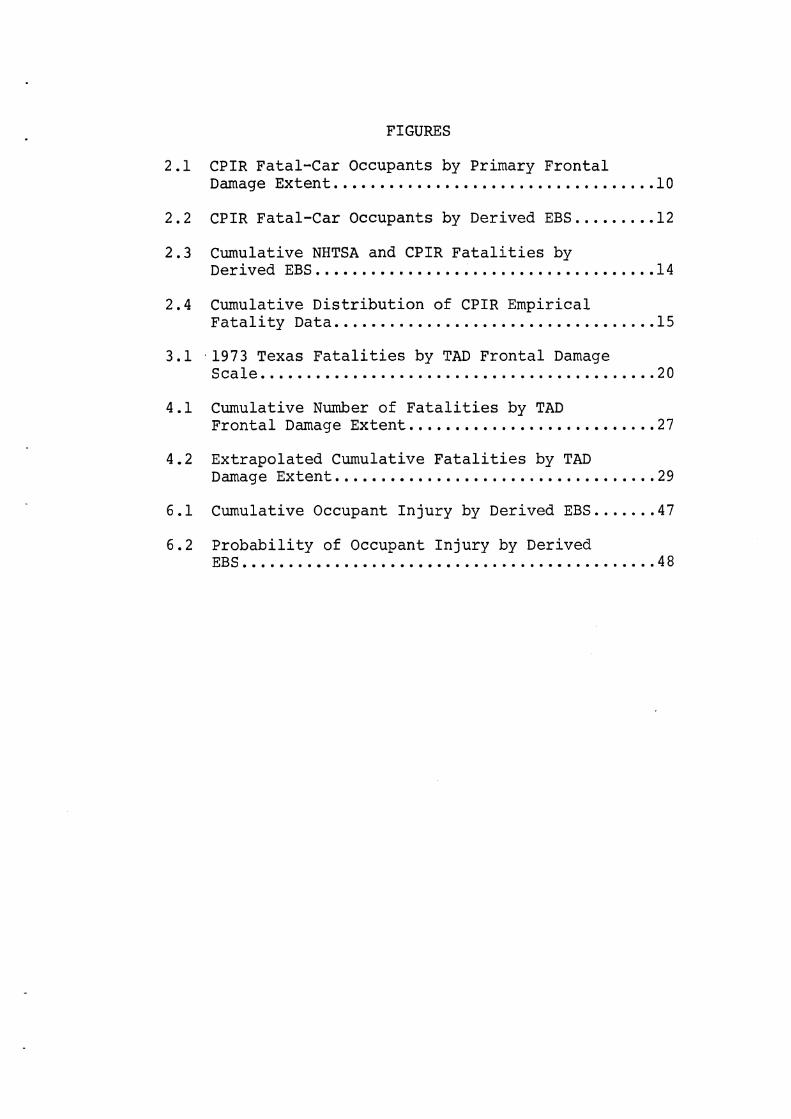
FIGURES
2.1 CPIR Fatal-Car Occupants by Primary Frontal Damage Extent...................................lO
2.2 CPIR Fatal-Car Occupants by Derived EBS.........12
2.3 Cumulative NHTSA and CPIR Fatalities by ............................... ~erived EBS...... 14
2.4 Cumulative ~istribution of CPIR Empirical ................................... Fatality Data 15
3.1 ,1973 Texas ~atalities by TAD Frontal Damage Scale.... ....................................... 20
4.1 Cumulative Number of Fatalities by TAD Frontal Damage Extent..................,........27
4.2 Extrapolated Cumulative Fatalities by TAD Damage Extent...................................29
6.1 Cumulative Occupant Injury by Derived EBS.......47
6.2 Probability of Occupant Injury by Derived EBS.............................. ............... 48


1. INTRODUCTION
Several previous efforts to relate crash severity
to injuries have resulted in cumulative distributions of
fatalities--most of them in terms of speed. While the
precise definition of speed of collision in the various
analyses varies, it has generally been thought of as an
equivalent barrier impact speed. In addition, these
previously published curves have resulted from several
different fatal accident populations, and it has not
been clear how closely these represent the true popula-
tion of fatal crashes in the nation.
This report presents information on those distribu-
tions from updated or new sources--one based on in-depth
accident investigations, and one based on police-
reported accidents. Finally, the cumulative distribu-
tions of injury (by abbreviated injury severity) from
the on-going restraint systems evaluation study are
given as an example of what might be expected from a
more carefully controlled sample of accidents.
Particular attention in this report has been given
to (a) the variations due to the source of the data,
(b) factors other than speed which associate with fatal-
ity production, and (c) changes in time which will
affect the form of the desired distribution.
1.1 Summary
Two efforts were made to prepare cumulative fatal-
ity curves as a function of derived Equivalent Barrier
Speed (EBS), the first using the Collision Performance
and Injury Report (CPIR) (I)* data (Section 2) and the
*Numbers in parentheses designate references at end of paper.

second using the Texas police-reported accident data
(Section 3) . The CPIR file provides specific and relatively ac-
curate impact data (compared to that reported by police),
but with a relatively strong bias toward severe colli-
sions (2). A derived EBS was computed and plotted from
inches of front crush for each case. The distributions
derived from the CPIR data differ from, for example, the
presently published DOT curves, in that the 50 percent
fatality point is about five mph higher in the CPIR data
than in the NHTSA-published curves ( 3 , 4 ) .
To provide a better sample of the real-world acci-
dent situation, police-reported Texas accident data were
used. While police-reported accident data are less spe-
cific, they are more representative of the total acci-
dent population than the CPIR file. The Texas data were
selected because they contain police-reported TAD
(Traffic Accident Data) vehicle damage severity codes
(5). The intent was to use the average number of
inches of frontal crush for each TAD severity code (1 to
7) and to convert crush into EBS. Unfortunately,
approximately two-thirds of the fatal cases were coded
as TAD 7 e , everything beyond TAD 6), so there was
not sufficient resolution to plot a meaningful distribu-
tion in the region of most interest.
While the Texas data yield a cumulative distribu-
tion of uncertain structure at the upper end (because of
the dominance of the level 7 crashes), the data do
provide an opportunity to observe a change in the dis-
tribution over two time periods with markedly different
traffic fatality characteristics. It is shown that,
although calendar year 1974 exhibits a smaller total
number of in-car fatalities, the proportion of
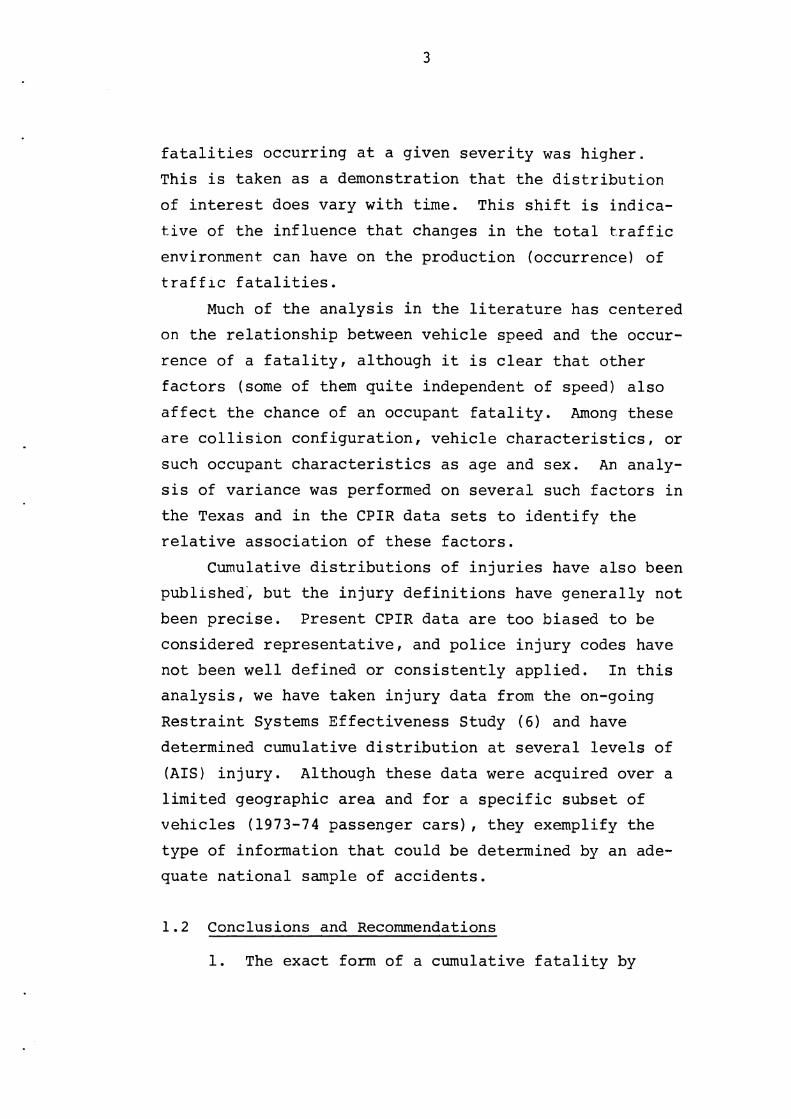
fatalities occurring at a given severity was higher.
This is taken as a demonstration that the distribution
of interest does vary with time. This shift is indica-
tive of the influence that changes in the total traffic
environment can have on the production (occurrence) of
trafflc fatalities.
Much of the analysis in the literature has centered
on the relationship between vehicle speed and the occur-
rence of a fatality, although it is clear that other
factors (some of them quite independent of speed) also
affect the chance of an occupant fatality. Among these
are collision configuration, vehicle characteristics, or
such occupant characteristics as age and sex. An analy-
sis of variance was performed on several such factors in
the Texas and in the CPIR data sets to identify the
relative association of these factors.
Cumulative distributions of injuries have also been
published., but the injury definitions have generally not
been precise. Present CPIR data are too biased to be
considered representative, and police injury codes have
not been well defined or consistently applied. In this
analysis, we have taken injury data from the on-going
Restraint Systems Effectiveness Study ( 6 ) and have
determined cumulative distribution at several levels of
(AIS) injury. Although these data were acquired over a
limited geographic area and for a specific subset of
vehicles (1973-74 passenger cars), they exemplify the
type of information that could be determined by an ade-
quate national sample of accidents.
1.2 Conclusions and Recommendations
1. The exact form of a cumulative fatality by
impact speed distribution for frontal impacts is depen-
dent upon the particular set of data used as well as on
the methods used to determine speed. Further, the dis-
tribution varies with time when other factors are held
constant.
The CPIR fatal distribution was significantly dif-
ferent from the earlier NHTSA distribution, evidently
due to different biases in the data sets used and to
different analytic techniques. A time dependence was
also demonstrated in a comparison of 1973 and 1974 fatal
accidents in Texas (Section 4) . 2. Fatalities are associated with many factors
other than speed alone. A distribution of fatalities by
impact speed cannot be interpreted as if speed were the
sole causative factor of death. The fact that many
crash factors other than just impact speed affect fatal-
ity production can be seen in both the police-reported
and the in-depth data (Section 5 ) . Thirty-six CPIR
crash factors were found to be significant, and these
fell into seven general groupings (ranked by statistical
significance) :
1. Passenger Compartment Performance.
3. Type of Collision (e.g., severe impact with solid object) .
4. Driver Pre-Crash Condition (e.g., alcohol, stress).
5. Secondary Impacts.
6. Single-Vehicle, Ran-Off-Roadway, Rural Col- lisions.
7. Physical Characteristics of Occupant.
While these factors are not necessarily independent
of speed, each plays a significant role in predicting

f a t a l i t i e s . The p o i n t i s t h a t speed a l o n e i s no t t h e
s o l e p r e d i c t o r of f a t a l i t i e s . I n s t e a d , it i s t h e s p e c i -
f i c s e t of a l l c r a s h f a c t o r s i n a c o l l i s i o n t h a t p r e d i c t s
a f a t a l i t y . C l e a r l y , most of t h e c r a s h f a c t o r s t h a t do
i n f l u e n c e t h e f a t a l i t y r a t e a r e n o t under t h e c o n t r o l of
t h e d e s i g n e r o r rulemaker. On t h e o t h e r hand, t h e l is t
of r e l a t e d c r a s h f a c t o r s s u g g e s t s some p o s s i b i l i t i e s -
f o r example, i n t h e a r e a of passenger compartment p e r f o r -
mance. Note t h a t t h e i n t e r 3 c t i o n of speed and compart-
ment performance has n o t been analyzed ( s e e i t e m 4 be low) .
3 . F a t a l i t y p r o b a b i l i t i e s a r e a f u n c t i o n of t h e
c a u s a l f a c t o r s and t h e occurrence of t h e s e f a c t o r s .
Given a c r a s h , t h e p r o b a b i l i t y of be ing k i l l e d [P(F)] is
determined by t h e r i s k of f a t a l i t y f o r each set of c r a s h
f a c t o r s [P (F I C ) 1 times t h e chance t h a t each combination F
of c r a s h f a c t o r s w i l l occur [P (CF) I , o r :
where t h e sum i s over a l l p o s s i b l e s e t s CF of c r a s h f a c -
t o r s . The CF a r e mutual ly e x c l u s i v e .
Consequently, both improved v e h i c l e s a f e t y des igns
[P (F / C F ) I and a s h i f t away from s i n g l e - v e h i c l e r u r a l
c o l l i s i o n s [ P ( C F ) ] , f o r example, can a f f e c t t h e d i s t r i -
bu t ion of f a t a l i t i e s . Qui te a p a r t from s a f e t y improve-
ments a p p l i e d t o s p e c i f i c c r a s h f a c t o r s , changes i n t h e
o v e r a l l mix o r combinations of c r a s h f a c t o r s a l s o a f f e c t
t h e p r o b a b i l i t y of f a t a l i t i e s . For example, a change i n
t h e p ropor t ion of t ime dur ing which p a r t i c u l a r combina-
t i o n s of c r a s h f a c t o r s occur produced a s h i f t i n t h e
d i s t r i b u t i o n s of f a t a l i t i e s f o r 1973 and 1974 i n Texas
(Sec t ion 4 ) .

4 . The i n t e r a c t i o n s between t h e many c r a s h f a c t o r s
t h a t c o n t r i b u t e t o t h e f a t a l i t y r a t e were n o t determined
i n t h i s a n a l y s i s . Some of t h e f a c t o r s may p r e d i c t speed
( e . g . , v e h i c l e damage e x t e n t ) . Some f a c t o r s ( e . g . , d r i -
v e r age) may both p r e d i c t speed (young d r i v e r s ) and con-
t r i b u t e t o f a t a l i t i e s ( o l d d r i v e r s ) . This s u g g e s t s a
need f o r a more complex model t h a t would h e l p i n d e t e r -
mining t h e i n t e r a c t i o n s between c r a s h f a c t o r s .
5. E x i s t i n g a c c i d e n t d a t a (known t o HSRI), a r e
inadequa te f o r t h e p r e p a r a t i o n of an a c c u r a t e and repre -
s e n t a t i v e f a t a l i t y d i s t r i b u t i o n by impact speed. An
up-to-date n a t i o n a l sample of c o l l i s i o n s w i t h s u f f i -
c i e n t l y a c c u r a t e and d e t a i l e d d a t a t o p r o p e r l y p r e p a r e a
d e f e n s i b l e cumula t ive f a t a l i t y cu rve by impact speed i s
needed. The CPIR d a t a set c o n t a i n s d e t a i l b u t l a c k s
r e p r e s e n t a t i v e n e s s . The TAD v e h i c l e damage s c a l e i s of
l i t t l e u t i l i t y i n d e r i v i n g a f a t a l d i s t r i b u t i o n , s i n c e
one-half t o two- th i rds of t h e c a s e s f a l l i n t o t h e open-
ended TAD 7 ca tegory . The methods of de termining impact
speeds used i n t h i s paper and i n previous e f f o r t s need
improvement. A s more s o p h i s t i c a t e d a n a l y t i c a l tech-
n iques a r e developed, they should be a p p l i e d i n f u t u r e
e f f o r t s t o de termine f a t a l i t y d i s t r i b u t i o n s .
6. The MVMA-sponsored R e s t r a i n t System Eva lua t ion
Study (RSES) p re l iminary d a t a exemplify what can be
accomplished-high q u a l i t y , good d e t a i l , and r e p r e s e n t a -
t i v e c o l l i s i o n d a t a . While t h e RSES d a t a a r e n o t a s
d e t a i l e d and comprehensive a s t h e C P I R d a t a , they a r e
more r e p r e s e n t a t i v e of t h e geograph ica l a r e a s where they
were c o l l e c t e d . The fami ly of cumula t ive i n j u r y curves
( S e c t i o n 6 ) s e r v e s t o demonst ra te t h e t y p e of r e s u l t s
t h a t could be provided by a n a t i o n a l sample. Such a s e t
of n a t i o n a l d a t a would provide cumulative d i s t r i b u t i o n s
by l e v e l of i n j u r y (AIS) and would permit t r end analyses
f o r o the r c rash f a c t o r s ( e . g , , model yea r , c a r s i z e ) .


2 . CUMULATIVE FATALITY CURVE - C P I R DATA
Of t h e 862 f a t a l occupants r e p o r t e d by in-depth
a c c i d e n t i n v e s t i g a t i o n teams i n t h e CPIR ( C o l l i s i o n P e r -
formance and I n j u r y Report Revision 3) d a t a f i l e ( 7 ) , 360 were k i l l e d i n passenger c a r s t h a t s u s t a i n e d a p r i -
mary f r o n t a l impact. Damage f o r each c a s e v e h i c l e was
recorded by t h e CDC/VDI ( C o l l i s i o n Deformation C l a s s i f i -
c a t i o n ) ( 8 ) and by t h e inches of r e s i d u a l f r o n t c rush .
The d i s t r i b u t i o n of f a t a l occupants by t h e CDC/'rDI
damage e x t e n t zone code i s d i sp layed i n Table 2,1* and
F igure 2.1. The d i s t r i b u t i o n i s r e s t r i c t e d t o 281
u n r e s t r a i n e d f r o n t - s e a t , a d u l t (age 15 t o 98 y e a r s )
f a t a l i t i e s i n passenger c a r s s u s t a i n i n g primary f r o n t a l
impacts . This s u b s e t of f a t a l s is more comparable t o
t h e previous NHTSA r e s u l t s . Note t h a t f a t a l i t i e s occur
even i n c a r s t h a t s u s t a i n e d very l i t t l e damage ( C D C - l ) ,
probably because of an occupan t ' s s t a t e of h e a l t h and
o t h e r c r a s h f a c t o r s (e.g., f i r e ) .
Table 2 . 1 - CPIR Fatal-Car Occupants by Primary F r o n t a l Damage Extent
F r o n t a l Damage Unres t ra ined , F ron t S e a t Extent Adults (ages 15-98 y e a r s )
1 % ( N 1
*Due t o rounding, a l l t a b l e percentages may n o t sum t o e x a c t l y 100.0 p e r c e n t .

CDC Damage E x t e n t Zone
Figure 2.1 - CPIR Fatal-Car Occupants by Primary Frontal Damage Extent
The CPIR data file also contains the inches of
residual front crush as a measure of damage severity for
213 of the 281 cases. Half of the remaining 68 cases of
unknown crush inches had major CDC extent codes of 6-9,
with many of these being underrides or overhanging struc-
tures for whlch crush measurements have little meaning.
The other half of the unknown crush cases were distribu-
ted between 1 and 5 extent codes.
Campbell (9) has developed an energy basis for col-
lision severity that permits the interpretation of
residual crush damage in terms of energy, which, in
turn, can be expressed, in its simplest terms, as a lin-
ear equation of the form
EBS = A + B Crush (inches)

This relationship was developed for recent-model
General Motors standard, intermediate, and compact/sub-
compact cars in frontal collisions. The relationship
for intermediate cars
EBS = 7.5 + 0.90 Crush (inches)
was used to approximate the mix of CPIR vehicles used in
this analysis. The specific transformation used inches
of front crush bracketed into five-mile-per-hour incre-
ments of derived EBS.* The resultant distribution of
fatal occupants is shown in Table 2.2 and Figure 2.2.
This approximation does not specifically account for
variations in vehicle size, crush characteristics, damage
patterns (e.g., narrow/wide) or crash configurations.
Table 2.2 - CPIR Fatal-Car Occupants by Derived EBS
Derived Fatal Occupants EB S Derived Fatal Occupants EBS Cum %
1.9% 5.2 11.8 21.2 28.2 39 .5 50.3 59.2 70.5
Known
Unknown ( 68)
Cum %
75.2% 82.2 86.4 89.7 92.0 96.7 98.6 100%

I I I I 1 I 1 I I I I I 1
lb 1'5 d0 2b $0 3'5 4'0 4k 510 515 d0 615 ?0 715 8 0 815 $0
DERIVED E B S - M'PH
Figure 2 . 2 - CPIR Fatal-Car Occupants by Derived EBS
While the distribution in Figure 2 . 2 is not smooth,
it does bear a rough resemblence to a bell-shaped normal
probability distribution. A goodness of fit test with
the normal distribution resulted in a chi-square of 33.3
(mean = 44.6 mph, standard deviation = 18.95 mph) which
indicates that Figure 2 . 2 is statistically different
than the normal distribution at the five percent level.
In order to be comparable to the NHTSA normal cumulative
fatality curve, the cumulative distribution of CPIR
fatalities by derived EBS (Table 2 . 2 ) was graphically
fitted to a normal distribution* to produce a cumulative
"Equivalent to graphically computing mean (z) and stan- dard deviation (SD) to produce plot.
percen tage of f a t a l i t i e s by EBS ["CPIR (Normal) " d i s t r i -
b u t i o n i n F igure 2.31. Note t h a t t h e i n t e r c e p t a t zero
mi les p e r hour i s 1 . 3 p e r c e n t , an a r t i f a c t of extrapo-
l a t i n g t h e normal p r o b a b i l i t y curve from t h e de r ived d a t a
i n Table 2.2. When a smooth curve ( n o t a normal proba-
b i l i t y ) i s f i t t e d t o t h e cumulat ive d a t a , t h e "CPIR
(Smooth)'' d i s t r i b u t i o n i s produced. The NHTSA a l s o f i t -
t e d t h e i r f a t a l d a t a t o a normal p r o b a b i l i t y cu rve , and
t h e "NHTSA (Normal)" d i s t r i b u t i o n i s r e p l i c a t e d i n F igure
2 . 3 .
The observed d i f f e r e n c e between t h e NHTSA and CPIR
curves seems t o imply t h a t t h e C P I R c a r s a r e " s a f e r . "
For example, up t o 50 mph, only 6 4 p e r c e n t of t h e C P I R
f a t a l i t i e s occur red , a s compared t o 9 4 p e r c e n t of t h e
NHTSA f a t a l i t i e s . Th i s d i f f e r e n c e could be due t o a
newer, and hence s t i f f e r , s e t of c a r s i n t h e C P I R f i l e ,
o r due t o a b i a s i n t h e C P I R c a s e s e l e c t i o n towards
f a t a l - c a r a c c i d e n t s wi th a h i g h e r damage s e v e r i t y than
t h e average f a t a l a c c i d e n t . The d i f f e r e n c e i n t h e curves
might a l s o be expla ined by d i f f e r e n c e s i n t h e assumptions
and t r ans fo rmat ions used i n d e r i v i n g t h e curves . I n par-
t i c u l a r , t h e t r ans fo rmat ion from c rush t o EBS assumed a
uniform c rush d i s t r i b u t i o n . Thus, any narrow c rush d i s -
t r i b u t i o n s were t r e a t e d a s i f they were h i g h e r - s e v e r i t y
uniform c rush d i s t r i b u t i o n s wi th t h e same inches of
c r u s h . Consequently, t h e t r ans fo rmat ion b iased t h e d i s -
t r i b u t i o n towards h i g h e r - s e v e r i t y c o l l i s i o n s . The p o i n t
t o b e made i s t h a t t h e d i s t r i b u t i o n i s s e n s i t i v e t o t h e
set ( o r sample) of f a t a l a c c i d e n t s analyzed and t h e
a n a l y t i c procedures used .
The apparent d i f f e r e n c e between t h e NHTSA curve and
t h e C P I R e m p i r i c a l d a t a (F igure 2 . 4 ) may be t e s t e d f o r

DERIVED EBS - MPH
Figure 2.3 - Cumulative NHTSA and CPIR Fatalities by Derived EBS

DERIVED EBS - MPH
Figure 2.4 - Cumulative Distribution of CPIR Empirical Fatality Data

s t a t i s t i c a l s i g n i f i c a n c e by t h e u s e of t h e Kolmogorov-
Smirnov test (K-S t e s t ) . We assume t h a t t h e NHTSA curve
i s a known cumula t ive d i s t r i b u t i o n f u n c t i o n , and t h a t
t h e d a t a used t o c o n s t r u c t t h e C P I R cu rve a r e a random
sample from some o t h e r p o p u l a t i o n . The t es t i s then
based on t h e maximum v e r t i c a l d i s t a n c e between t h e two
c u r v e s , r e j e c t i n g i f t h i s d i s t a n c e exceeds a c r i t i c a l
v a l u e which i s dependent upon t h e s i g n i f i c a n c e l e v e l and
t h e sample size f o r t h e CPIR curve .
The maximum d e v i a t i o n i s 0.29, which occurs a t 45
mph. For a sample s i z e of 213, and an a = 0.05, t h e
c r i t i c a l v a l u e i s 0.093. Hence t h e hypo thes i s t h a t t h e
two curves came from t h e same popu la t ion ( a r e e q u a l ) i s
r e j e c t e d .
I n s p e c t i o n of t h e two curves r e v e a l s t h a t they a r e
q u i t e s i m i l a r f o r speeds of 25 mph o r l e s s . I f one c a l -
c u l a t e s a j o i n t 95 p e r c e n t conf idence band from t h e CPIR
c u r v e , t h e n t h i s band no longer i n c l u d e s t h e NHTSA
curve , beginning a t 30 mph. Thus t h e two may b e viewed
as s i m i l a r up t o 30 mph and d i f f e r e n t t h e r e a f t e r . The
conf idence band a g a i n beg ins t o i n c l u d e t h e NHTSA curve
f o r speeds above 70 mph, because bo th curves approach
1 .0 a t h igh speeds .

3. CUMULATIVE FATALITY CURVE - TEXAS DATA To gain a more representative sample of fatalities,
an attempt was made to derive the cumulative fatality
distribution from Texas police-reported traffic fatali-
ties. While impact speeds and inches of crush are not
recorded, the Texas data do provide the TAD Vehicle Dam-
age Scale (3) as a rough measure of damage severity.
The first portion of this section provides a deriv-
ation of impact speeds from the TAD vehicle damage scale
codes (1-7). In the second portion, a cumulative dis-
tribution of the 828 Texas passenger car frontal-impact
fatalities reported in 1973 are plotted. Due to the fact
that the majority of the fatalities fell into TAD cate-
gory 7 (i.e., anything over TAD 6) and an uncertain TAD
to EBS derivation, no representative cumulative fatality
curve could be plotted from the Texas police-reported
data. The same problems exist for any fatal accident
base using the TAD scale.
3.1 EBS Derived From TAD Vehicle Damage Scale
The derivation of EBS from Texas police-reported TAD
vehicle damage scale codes involves two separate opera-
tions. First, the relationship of inches of frontal
crush is developed for each frontal TAD damage scale
code; and second, this indirect crush measurement is used
to determine the corresponding EBS by the linear approxi-
mation used in Section 2. Fortunately, the Southwest
Research Institute (SwRI) has completed a special study
of police-reported TAD and SwRI-investigated TAD, VDI,
and inches of crush.*
*"MDAI, Volume 3, Special Studies," SwRI, August 1974, DOT-HS-801182.

The Southwest Research I n s t i t u t e (SwRI) s t u d i e d
5 ,481 t r a f f i c a c c i d e n t s (10 ,371 v e h i c l e s ) i n t h e San
Antonio (Bexar County) a r e a from December 1, 1972 through
May 1973 ( s i x months) . The s t u d y inc luded a l l a c c i d e n t s
t h a t had a p o l i c e TAD s e v e r i t y r a t i n g of t h r e e o r h i g h e r
o r one of i t s occupants had been i n j u r e d o r k i l l e d . of
t h e 10 ,371 a c c i d e n t v e h i c l e s , 3,436 were i n s p e c t e d by
SwRI i n v e s t i g a t o r s and coded w i t h SwRI-determined V D I and
TAD damage r a t i n g s . T h e r e f o r e , on ly one- th i rd of t h e
s t u d y v e h i c l e s have SwRI TAD and V D I r a t i n g s .
Of t h e 3,436 c a s e s i n s p e c t e d by bo th t h e p o l i c e and
SwRI, 62.40 p e r c e n t were r e p o r t e d a s having i d e n t i c a l TAD
a l p h a b e t i c c h a r a c t e r s ( a r e a o f damage). A c l o s e r look a t
t h e o r i g i n a l s t u d y d a t a by HSRI r e v e a l e d t h a t t h e p o l i c e
and SwRI agreed on t h e occur rence of primary f r o n t a l dam-
age 90 p e r c e n t of t h e time f o r passenger c a r s when on ly
t h e f i r s t TAD l e t t e r (F) was used f o r comparison. I n an
a d d i t i o n a l two p e r c e n t of t h e c a s e s of pol ice-coded p r i -
mary f r o n t a l TAD damage l o c a t i o n , SwRI coded f r o n t a l dam-
age , b u t a s secondary , n o t pr imary . Thus, t h e r e was
c o n s i s t e n c y between t h e p o l i c e and SwRI TAD i n t h e iden-
t i f i c a t i o n of f r o n t a l impacts .
Of t h o s e 90 p e r c e n t of t h e c a s e s where t h e p o l i c e
and SwRI a g r e e t h a t t h e primary c a r damage was f r o n t a l ,
t h e TAD damage codes were i d e n t i c a l 45 p e r c e n t of t h e
t ime and were w i t h i n one code 8 4 p e r c e n t of t h e time.
Thus, t h e r e does seem t o be s u f f i c i e n t agreement on t h e
g e n e r a l a r e a damaged and e x t e n t of damage t o pe rmi t t h e
fo l lowing a n a l y s i s of p o l i c e - r e p o r t e d TAD damage s c a l e
codes and SwRI-invest igated i n c h e s of c r u s h f o r c a r s
w i t h f r o n t a l damage.
The mean inches of primary f r o n t a l c r u s h was
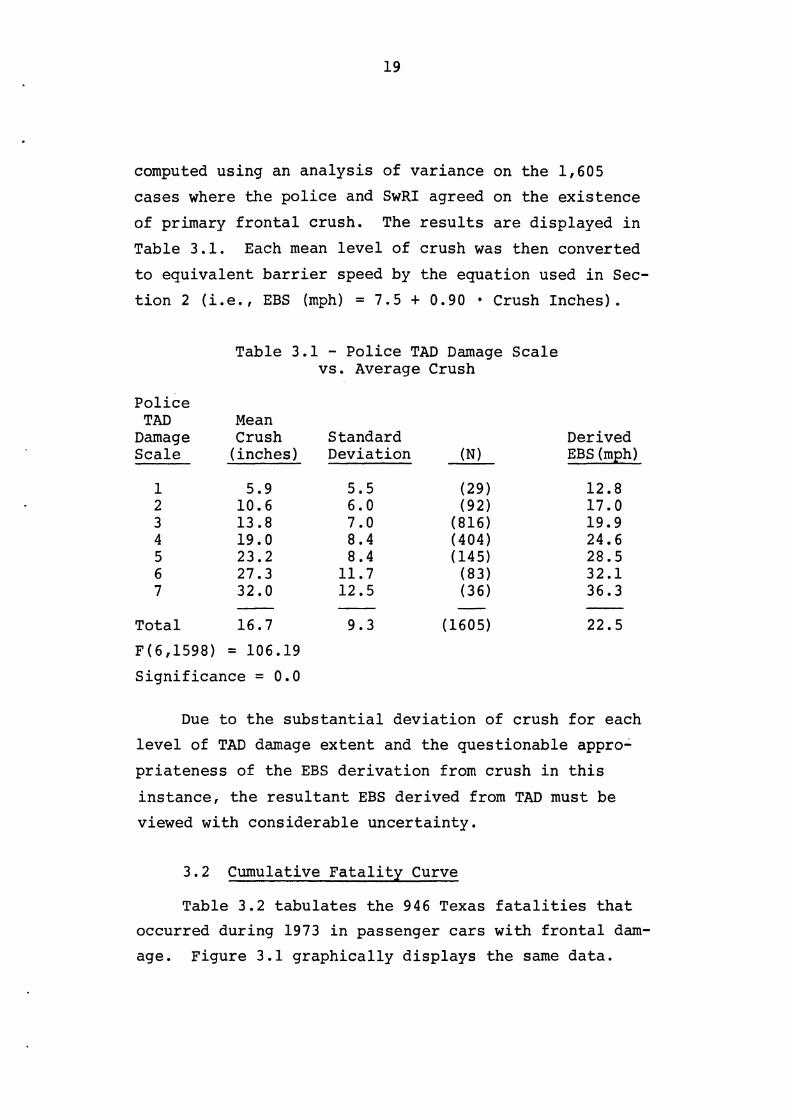
computed us ing an a n a l y s i s of v a r i a n c e on t h e 1,605
c a s e s where the p o l i c e and SwRI agreed on t h e e x i s t e n c e
of primary f r o n t a l c rush . The r e s u l t s a r e d i sp layed i n
Table 3.1. Each mean l e v e l of c rush was then converted
t o e q u i v a l e n t b a r r i e r speed by t h e equa t ion used i n Sec-
t i o n 2 ( i . e . , EBS (mph) = 7 . 5 + 0.90 Crush I n c h e s ) .
Table 3 . 1 - P o l i c e TAD Damage S c a l e v s . Average Crush
P o l i c e TAD Mean
Damage Crush Standard Derived S c a l e ( i n c h e s ) Devia t ion (N) EBS (mph)
T o t a l 16.7
S i g n i f i c a n c e = 0.0
Due t o t h e s u b s t a n t i a l d e v i a t i o n of c rush f o r each
l e v e l of TAD damage e x t e n t and t h e q u e s t i o n a b l e appro-
p r i a t e n e s s of t h e EBS d e r i v a t i o n from c rush i n t h i s
i n s t a n c e , t h e r e s u l t a n t EBS d e r i v e d from TAD must be
viewed wi th c o n s i d e r a b l e u n c e r t a i n t y .
3.2 Cumulative F a t a l i t y Curve
Table 3.2 t a b u l a t e s t h e 946 Texas f a t a l i t i e s t h a t
occurred dur ing 1973 i n passenger c a r s wi th f r o n t a l dam-
age. F igure 3 .1 g r a p h i c a l l y d i s p l a y s t h e same d a t a .
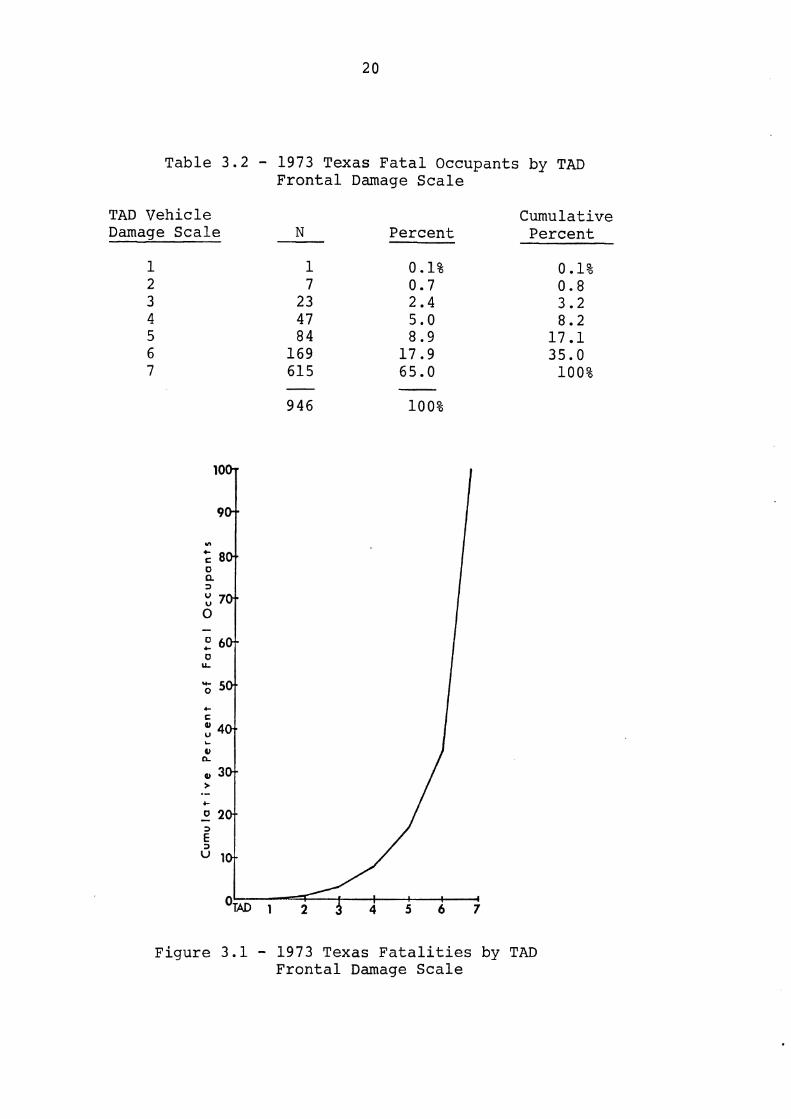
T a b l e 3.2 - 1973 Texas F a t a l Occupants by TAD F r o n t a l Damage S c a l e
TAD V e h i c l e Cumulat ive Damage S c a l e N P e r c e n t P e r c e n t
F i g u r e 3 . 1 - 1973 Texas F a t a l i t i e s by TAD F r o n t a l Damage S c a l e

4. TEMPORAL CHANGES IN THE PROBABILITY OF FATALITY
A data file containing all 2,697 Texas fatal acci-
dents from the first half of 1973 and the first half of
1974 was analyzed by Golomb and O'Day (10) to detect
"before" and "during1' energy crisis factors. Lowered
speed limits and intensified interest in fuel conserva-
tion were followed by a noticeable reduction in traffic
accidents, injuries, and fatalities in late 1973 and
early 1974.
Such noticeable changes in traffic patterns could
have a significant effect on the distribution of speeds
at which fatalities occur, and, consequently, on the
benefits (in lives saved) derived from the distribution
of cumulative fatalities by speed. For example, a
reduction in traffic volume (miles traveled) might be
expected to reduce all accidents, and might produce a
disproportionate reduction in multi-vehicle collisions
by lessening the average traffic density. Conversely,
a reduction in speed without a reduction in total
mileage (that is, a possible increase in total hours of
travel), could increase traffic density and thus tend
to increase multi-vehicle collisions. (10)
In order to review changes in accident patterns,'a
data file containing the first six months of both 1973
and 1974 Texas fatal accident data was used. This
Texas comparison file contains 1,505 passenger cars
with at least one fatal occupant. Of these, 58 percent
(871) were involved in 1973 accidents and 42 percent
(634) were involved in 1974 accidents. The number of
fatal passenger cars dropped 27 percent between the two
six-month periods. The temporal changes were analy-
zed in terms of accident type, occupancy rate, damage
extent, and cumulative fatalities.

Accident Type
~ultiple-vehicle accident involvement dropped 41
percent (219/529) for early 1974 Texas fatal-cars (pas-
senger cars with one or more fatal occupants), while the
number of single-vehicle involvements remained about the
same (Table 4.1). In other words, there was a shift from a 2-to-3 ratio to a 1-to-1 ratio of single- to mul-
tiple-vehicle accidents.
Table 4.1 - Texas Fatal-Car Accidents by Number of Vehicles
First Half 1973 First Half 1974
Single-Vehicle 39% (342) 51% (324) Multiple-Vehicle 61% (529) 49%
- - (310)
100% (871) 100% (634)
There also was a shift in 1974 accident types from
collisions-with-other-motor-vehicles to ran-off-the-
roadway and other noncollision accidents (Table 4.2).
While the frequency of fixed-object collisions was lower
in 1974, the proportion of fixed-object collisions
remained the same (18 percent).
Table 4.2 - Texas Fatal-Car Accidents by Object Struck First Half 1973
Accident Type - % N
Other Motor Vehicle 59% (512) Fixed-Object 18% (157) Other Collisions 5% (49 Ran-Off-Road 15% (131) Other Noncollisions 3% - (22)
100% (871)
First Half 1974
N

While t h e number of c a r s w i t h occupant f a t a l i t i e s
dropped, t h e p r o p o r t i o n of c a r s w i t h f r o n t a l damage
remained a t about 40 p e r c e n t (Table 4 . 3 ) .
Table 4.3 - Texas F a t a l Car Accidents by Damage Area
F r o n t a l Other Unknown
F i r s t Half 1973 F i r s t Half 1974
% - N
43% (277) 52% (328)
5% - (29)
100% (634)
Occupancy
While a h i g h e r occupancy r a t e p e r v e h i c l e might
have been expected dur ing t h e e a r l y 1974 energy c r i s i s ,
t h e pe rcen tage of c a r s w i t h m u l t i p l e f a t a l i t i e s dropped
4 1 p e r c e n t (53/130) from 1973 t o 1974. The p r o p o r t i o n
of m u l t i p l e c a s u a l t i e s ( f a t a l s and i n j u r e d ) i n t h i s set
of " f a t a l c a r s " dropped from 51 p e r c e n t t o 47 p e r c e n t
i n 1974 (Table 4 . 4 ) . Thus, t h e e a r l y 1974 Texas f a t a l
c a r a c c i d e n t s tend t o i n v o l v e fewer m u l t i p l e i n - c a r
f a t a l i t i e s and i n j u r i e s .
Table 4 . 4 - Texas Fata l -Car Occupants by I n j u r y S e v e r i t y
F i r s t Half 1973 F i r s t Half 1974
S i n g l e ~ u l t i p l e S i n g l e M u l t i p l e
F a t a l ( K ) 85% (741) 15% (130) 88% (557) 12% ( 77) I n j u r y ( A t B t C ) 58% (504) 4 2 % (367) 60% (383) 40% (251) F a t a l + I n j u r y 49% (430) 51% ( 4 4 1 ) 53% (338) 47% (296)
(K+A+B+c)
Texas p o l i c e a c c i d e n t r e p o r t s do n o t r o u t i n e l y
r e c o r d a l l t h e non- in jured occupants i n each v e h i c l e .
Consequently, t h e r e i s no d i r e c t measure of occupancy
r a t e i n acc iden t - invo lved c a r s . A s an approximat ion ,
one can assume t h a t i f one c a r occupant i s k i l l e d t h a t
t h e o t h e r occupants of t h e f a t a l c a r w i l l s u s t a i n a t
l e a s t a "C" i n j u r y and t h e r e f o r e be r e p o r t e d . Using t h e
number of K+A+B+C occupants a s a measure of occupancy it
looks a s i f t h e r e were fewer occupants p e r " f a t a l c a r "
i n e a r l y 1974 (Table 4 . 4 ) ,
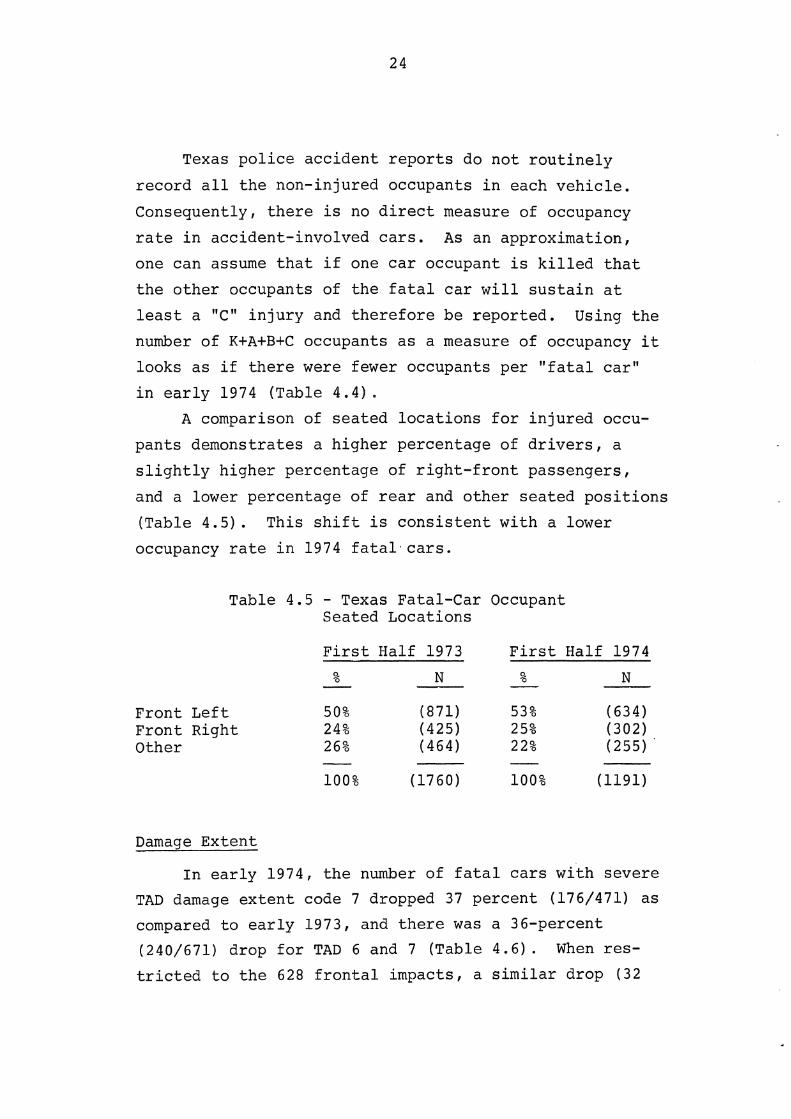
A comparison of s e a t e d l o c a t i o n s f o r i n j u r e d occu-
p a n t s demonst ra tes a h i g h e r pe rcen tage of d r i v e r s , a
s l i g h t l y h i g h e r pe rcen tage of r i g h t - f r o n t p a s s e n g e r s ,
and a lower pe rcen tage of r e a r and o t h e r s e a t e d p o s i t i o n s
(Tab le 4 . 5 ) . Th i s s h i f t i s c o n s i s t e n t w i t h a lower
occupancy r a t e i n 1974 f a t a 1 , c a r s .
Table 4.5 - Texas Fatal-Car Occupant Seated Locat ions
F i r s t Half 1973 F i r s t Half 1974
F r o n t L e f t F r o n t R igh t Other
Damage E x t e n t
I n e a r l y 1974, t h e number of f a t a l c a r s w i t h s e v e r e
TAD damage e x t e n t code 7 dropped 37 p e r c e n t (176/471) a s
compared t o e a r l y 1973, and t h e r e was a 36-percent
(240/671) d rop f o r TAD 6 and 7 (Tab le 4 . 6 ) . When res-
t r i c t e d t o t h e 628 f r o n t a l impacts , a s i m i l a r drop ( 3 2

p e r c e n t ) i n s e v e r e damage e x t e n t s i s observed. This
one- th i rd reduc t ion of severe c o l l i s i o n s can be reason-
ab ly expla ined by t h e e f f e c t of t h e reduc t ion of vehi -
c l e s speed dur ing t h e energy c r i s i s months.
Table 4.6 - TAD Damage Extent by Vehicle
A l l Car F a t a l s
F i r s t Half o f : 1973 1974
TAD - % ( N ) % ( N ---- 7 56% (471) 49% (295) 6 2 4 (200) 22 (136)
1-5 20 (171) 29 (174) Unk -- (29) -- (29
Fron t F a t a l s Only
F i r s t Half o f : 1973 1974
% ( N ) % (N) ---- 61% (215) 53% (146) 2 1 (74) 22 (60) 18 (62) 25 -- -- (71)
The same r e s u l t s a r e r epea ted i n Table 4.7, except
t h a t t h i s t ime t h e number of f a t a l i t i e s i s t a b u l a t e d .
Table 4.7 - TAD Damage Extent by F a t a l Occupants
A l l Car F a t a l s
F i r s t Half o f : 1973 1974
TAD - % ( N ) % ( N ) ---- 7 60% (626) 53% (370) 6 2 1 (218) 2 1 (151)
1-5 19 (194) 26 (180) Unk -- (33) -- (33)
Front F a t a l s Only
F i r s t Half o f : 1973 1974 .
% ( N ) % ( N ) 7 - - -
66% (294) 59% (193) 19 (82) 19 (63 15 (68) 2 2 (72)
When t h e p ropor t ion of f a t a l - c a r occupants a r e
cons idered , an even more dramat ic s h i f t towards less
severe (TAD 1-5) f a t a l c a r a c c i d e n t s i s seen. While t h e

t o t a l number of f a t a l a c c i d e n t s and even t h e number of
less s e v e r e f a t a l a c c i d e n t s dropped ( e . g . , 194 t o 1 8 0 ) ,
t h e p r o p o r t i o n of less s e v e r e f a t a l a c c i d e n t s i n c r e a s e d
( e . g . , 19 p e r c e n t t o 26 p e r c e n t ) . Converse ly , t h e pro-
p o r t i o n of more s e v e r e c a s e s d e c r e a s e d . There was an
a b s o l u t e d rop i n TAD 7 o r 4 1 p e r c e n t (256/626) f o r a l l
a c c i d e n t s and 34 p e r c e n t (101/294) when o n l y f r o n t a l
c a r impac ts were c o n s i d e r e d .
Cumulat ive F a t a l i t i e s
To obse rve t h e s h i f t i n t h e cumula t ive f a t a l i t y
d i s t r i b u t i o n due t o changes i n t h e t r a f f i c environment
and , hence , exposure t o t h e r i s k of f a t a l i t y , cumula-
t i v e d i s t r i b u t i o n s f o r e a r l y 1973 and 1974 d a t a were
d e r i v e d and d i s p l a y e d i n Ta5 le 4.8 and F i g u r e 4 . 1 . A l l
pa s senge r -ca r occupant f a t a l i t i e s i nvo lved i n f r o n t a l
impac ts d u r i n g t h e two six-month p e r i o d s a r e i n c l u d e d .
I t i s c l e a r t h a t t h e cumula t ive number of f a t a l i t i e s i n
1974 was lower f o r TAD e x t e n t s 6 and 7 , w h i l e t h e d i s -
t r i b u t i o n a c r o s s TAD 1-5 i s s i m i l a r f o r b o t h p e r i o d s .
Tab le 4.8 - Cumulative Texas F a t a l i t i e s by TAD F r o n t a l Damage E x t e n t
TAD F i r s t Half 1973 F i r s t Half 1974
E x t e n t - N Cum.N C u m . % N Cum. N Cum. % -
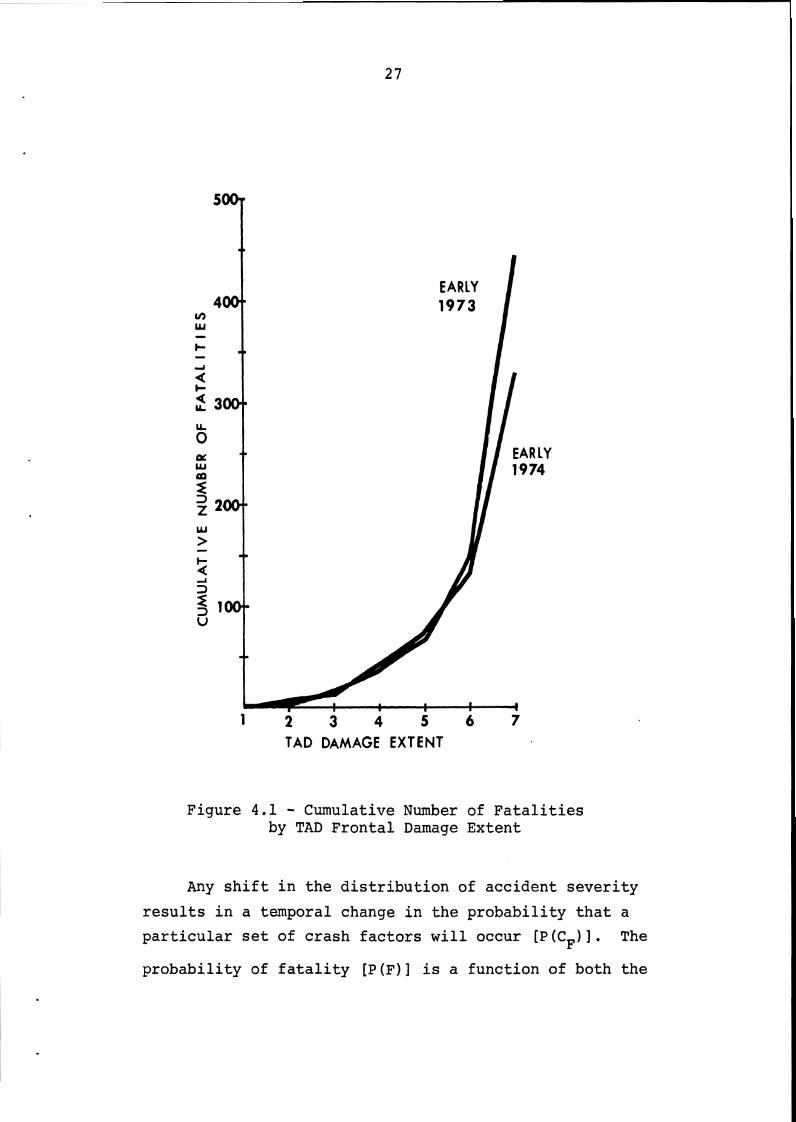
TAD DAMAGE EXTENT
Figure 4.1 - Cumulative Number of Fatalities by TAD Frontal Damage Extent
Any shift in the distribution of accident severity
results in a temporal change in the probability that a
particular set of crash factors will occur [P(CF)I. The
probability of fatality [P(F)] is a function of both the

risk of fatality for each set of crash factors [P (FIC ) 1 F
and the chance that each combination of factors will
occur [P (CF) I , or:
summed over all possible sets CF of crash factors. Con-
sequently, any change in P(CF) will alter the distribu-
tion 0.f P (F) without any change in P (F / CF) . Figure 4.2 demonstrates the sensitivity of the
cumulative fatality distribution to shifts in the mix of
crash factors, particularly the mix or distribution of
crash severities. These curves were developed from the
early 1973 and 1974 cumulative percentage distributions
by frontal TAD damage extent in Table 4.1. For purposes
of comparison both years of data were assumed to have a
normal probability distribution. This approach permit-
ted extrapolating the TAD 1 through TAD 6 data over the
remainder of the probability distribution. TAD 7 data
was not used because TAD 7 is an open-ended category
(i.e., everything over TAD 6) as discussed in Section
3.2.
Obviously, such a rough extrapolation may not rep-
resent the true distribution of fatalities. It does
serve to demonstrate an observable temporal shift.
Since it is unlikely that there was a given set of crash
factors in a crash [P (I? I CF) ] this shift can reasonably
be attributed to a shift in the probability that certain
combinations of crash factors occur in a crash [p(CF) I .
In other words, the reduction in fatalities is more
likely due to a change in the mix of crash factors

F i g u r e 4 .2 - E x t r a p o l a t e d Cumulat ive F a t a l i t i e s by TAD Damage E x t e n t
90-
80.-
7&.
r 60.- z s 3
1 , so-. < C
, ,s8~" '
,e' as8 8 2
m - * * 5 r. .. .. .. .. . . ::
:; .. .. 0. .. : ;
EARLY :: EARLY 1974 :; 1973
:; :: . ::
d B 5 4e- ,* t, k! W 0
w L C < 4
i a V
2@-
I&-
- ACTUAL EXTRAPOLATE-
6 (7) (8) ( 0 ) (lb) (1'1) (I!!) T A D DAMAGE EXTENT
( e . g . , less high-speed i m p a c t s ) , r a t h e r t h a n t o a reduc-
t i o n i n f a t a l i t y r i s k f o r any c r a s h f a c t o r s ( e . g . , fewer
f a t a l i t i e s i n i d e n t i c a l 30 mph i m p a c t s ) .
Note t h a t t h e e a r l y 1974 curve s h i f t e d t o t h e l e f t
of t h e e a r l y 1973 curve . The s h i f t i s a r e f l e c t i o n of
t h e lower o v e r a l l c o l l i s i o n s e v e r i t y and speeds . S ince
a l l f a t a l i t i e s a r e r e p r e s e n t e d i n a cumula t ive d i s t r i b u -
t i o n , a l a r g e r p r o p o r t i o n of f a t a l i t i e s occur a t lower
speeds . For example t h e r e was a 53 p e r c e n t ( 8 p e r c e n t /
15 p e r c e n t ) i n c r e a s e i n t h e cumula t ive pe rcen tage o f
f a t a l i t i e s a t TAD 5 . The rise was from 1 5 p e r c e n t i n
e a r l y 1973 t o 2 2 p e r c e n t i n e a r l y 1974. C l e a r l y , such
rea l -wor ld s h i f t s can s i g n i f i c a n t l y i n f l u e n c e t h e
expected b e n e f i t s of any occupant p r o t e c t i o n s a f e t y mea-
s u r e s .

5. ROLE OF OTHER CRASH FACTORS IN PREDICTING FATALITIES
Fatality is not solely a function of impact speed,
although that assumption is usually made in interpreting
or reading cumulative fatality curves like Figure 2.3.
Other factors also determine whether an occupant is
killed. No one safety measure (e,g,, restraint system)
can prevent all the fatalities up to a certaln speed
(e.g., 50 mph-EBS) . As noted by General Motors (11) in
their comments on the NHTSA August MVSS208 analysis ( 3 ) ,
"whether a person becomes fatal in a crash is a function
of EBS, direction of impact, height, weight, sex, physi-
cal condition, presence of external object intrusion,
geometry of struck object, ejection, seating position,
presence of other occupants, restraint usage, etc."
To test this hypothesis, several analysis of vari-
ance tests were made on Texas accident data and the CPIR
file. While the Texas data are more representative,
they lack sufficient detail. The CPIR data, on the
other hand, have the detail but lack representativeness.
Consequently, the following should not be construed
quantitatively but should be considered as a demonstra-
tion that other accident factors play a significant role
in fatality causation.
5.1 Analysis of Texas Data
For consistency with the previous Section 4, the
same set of Texas accident data from the first half of
1973 and 1974 was used for this analysis. Two sets of
data from these periods were combined. The first set
contained 1,505 passenger cars with at least one occu-
pant fatality (fatal-cars). To test for differences
between fatal-car accidents and nonfatal-car accidents,

a systematic 0.5 percent sample was created, containing
2,789 cars in which no occupants were killed (nonfatal-
cars). The set of all fatal cars and the sample set of
nonfatal cars were combined into one file to permit an
analysis of variance of collision factors that may be
related to fatalities.
Because a half-percent sample of nonfatal cars was
used, the "Percent of Fatal-Cars" column has been
reconstructed for each code level. For example, Table
5.1 displays for each Damage Scale code the reconstructed
"percentage of fatal cars" that results from inserting
the half-percent sample ratio. The number of fatal cars
is noted as "(Fatal N)" after each percentage. Thus, in
the first six months of 1973 and 1974, 0.3 percent
(3,844) of the passenger cars in reported traffic acci-
dents involved at least one bccupant fatality.
Table 5.1 - Texas Fatal-Cars by TAD Damage Extent Damage Scale
Percentage of Fatal-Cars
0.00% 0.00% 0.01% 0.05% 0.45% 1.50% 4.46% 14.28%
0.30%
The remaining tables in this section are restricted
to the 1,607 cars that sustained frontal damage. Table
5.2 contains a list of factors that demonstrated a
strong statistical relationship with fatal cars (cars
that had at least one fatal occupant). The factors have

all been restricted to one degree of freedom [F(l,m)]
and ranked by the F-ratio.*
Table 5.2 - Factors for Fatal-Cars with Frontal Damaqe Percentaae of Fatal Cars
Rank - 1
Factor
Rural--under 10,000 (vs. Urban)
Car-Fixed Object (vs . Car-Car)
Driver Age Over 39 Driver Sex, Male Old Cars, Pre-1967 Unlicensed Driver
Present Absent (Non-)
Clearly, several factors, other than just speed,
play a significant role in the probability of fatality,
such as location of accident, collision type, driver
characteristics, and vehicle characteristics.
A few factors, not limited to one degree of freedom,
are presented separately. The most important of these
is the TAD damage scale presented in Table 5.3, which is
similar to Table 5.1 except that the case selection was
restricted to frontal damage for comparability to the
other results in this section.
The risk of fatality is somewhat less in front-left
or right-corner impacts relative to front-center and
front-distributed damage (Table 5.4). Thus, the distri-
bution and area of frontal damage is also an important
fatality factor.
-. -
*Equivalent to chi-square statistic as dichotomous vari- able was used (fatal=l, non-fatal=O) . (12)
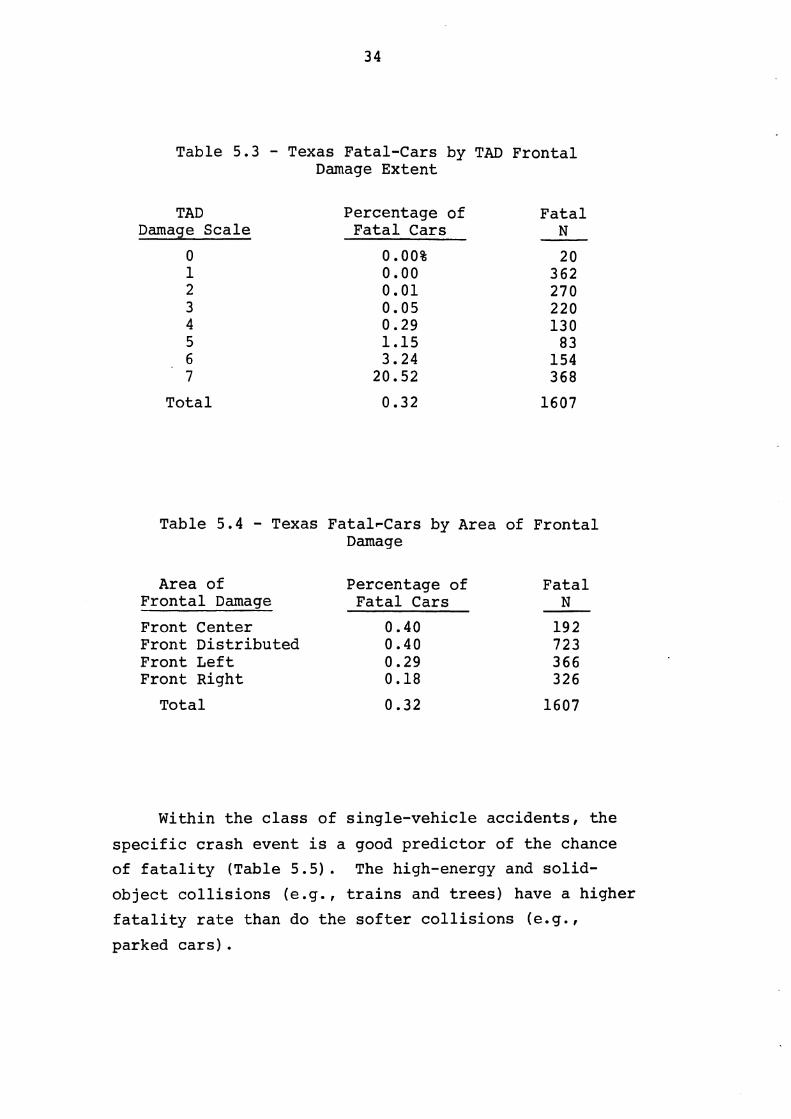
Table 5.3 - Texas Fatal-Cars by TAD F ron ta l Damage Extent
TAD Damage Sca l e
0 1 2 3 4 5
, 6 7
Percentage of F a t a l Cars
F a t a l N
20 362 270 220 130
83 154 368
To ta l 0.32 1607
Table 5.4 - Texas Fa t a l rCa r s by Area of F ron ta l Damage
Area of Percentage of F a t a l F ron ta l Damage F a t a l Cars N
Front Center 0.40 192 Front D i s t r i bu t ed 0 . 4 0 723 Front L e f t 0.29 366 Front Right 0.18 326
Tota l 0.32 1607
Within t h e c l a s s of s ing le -veh ic le acc iden t s , t h e
s p e c i f i c c r a sh event i s a good p r e d i c t o r of t h e chance
of f a t a l i t y (Table 5 . 5 ) . The high-energy and s o l i d -
o b j e c t c o l l i s i o n s ( e . g . , t r a i n s and t r e e s ) have a higher
f a t a l i t y r a t e than do t h e s o f t e r c o l l i s i o n s ( e .g . ,
parked c a r s ) .

Table 5.5 - Texas Fatal-Cars by Single-Vehicle Crash Event
Crash Event Percentage of Fatal Fatal Cars N
Car-Non-Traffic Vehicle 0.37% e.g., Parked car
Car-Sign, Signal, Pole 0.42
Ro 1 lover 0.99
Car-Culvert, Guard Rail 2.71 Tree, Abutment, Pier
Car-Train
TOTAL
5.2 Analysis of CPIR Data
The analysis of variance technique* was also used
to review the more detailed CPIR collision data. While
the case sampling biases result in an overrepresentation
of serious and fatal accidents, analysis of the CPIR
data elements does provide some insight into fatality
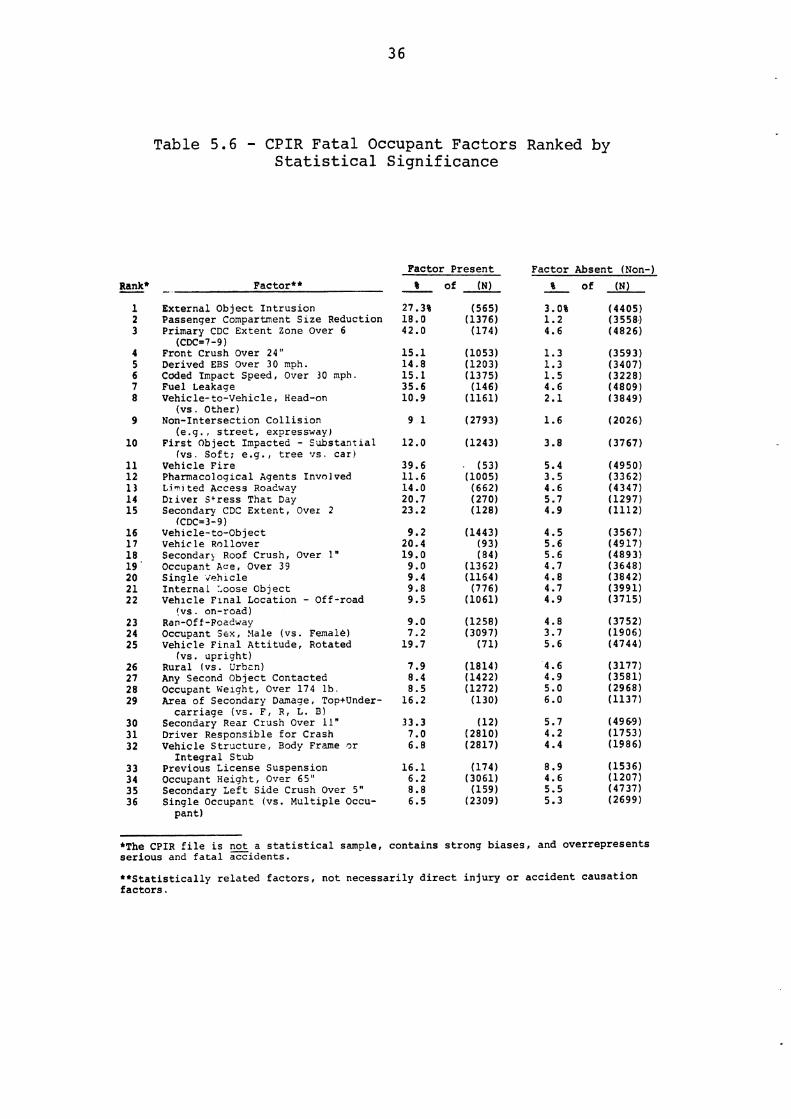
causation factors. While the overall ranking of factors
(Table 5.6) may be instructive, it must be recognized
that the specific ranking of any one factor and the
quantitative percentages of fatal occupants are strictly
representative of the CPIR file and are not a represen-
tative national accident profile.
Several of these factors are obviously related to
impact speed--either as predictors of speed ( e . g . , urban/
rural, street/expressway) or as consequences of speed
(e.g., vehicle deformation factors). Some of the driver
physiological factors ( e . g . , license suspensions, stress
that day) may also tend to predict impact speed.
Rank* - 1 2 3
4 5 6 7 8
9
10
11 12 13 1 4 15
16 17 18 19 ' 2 0 2 1 2 2
2 3 24 2 5
Table 5.6 - CPIR Fatal Occupant Factors Ranked by Statistical Significance
- Factor**
External Object Intrusion Passenger Compartment S ~ z e Reduction Primary CDC Extent Zone Over 6
(CDC=7-9 ) Front Crush Over 24" Derived EBS Over 30 mph. Coded Impact Speed, Over 30 mph. Fuel Leakage Vehicle-to-Vehicle, Head-on
(VS. Other) Non-Intersection Collision
(e.g., street, expressway) First Object Impacted - SLLbstanrlal
fvs. Soft; e.g., tree vs, car) Vehicle Fire Pharnacologlcal Agents Involved Limited Access Roalway Dziver Stress That Day Secondary CDC Extent, Over 2
fCDC=3-9) Vehicle-to-Object Vehicle Rollover Secondarb Roof Crush, Over 1" Occupant Ace, Over 39 Single iohlcle Internal Loose Oblect Vehlcle Frnal Location - Off-road
fvs. on-road) Ran-Off-Foadway Occupant S i x , Yale (vs. Fenale) Vehicle Final Attitude, Rotated
(VS. upright) Rural Ivs. Urb2n) Any Second Object Contacted Occupant Welght, Over 174 lb. Area of Secondary Damage. ToptUnder- carriage (vs. F, R, L. B)
Secondary Rear Crush Over 11" Driver Responsible for Crash Vehicle Structure, Body Frame ,r Integral Stub
Previous License Suspension Occupant Height, Over 65" Secondary Left Side Crush Over 5 " Single Occupant (vs. Multiple Occu-
Factor Present
8 of (N) - 27.3% (565) 18.0 (1376) 42.0 (174)
Factor Absent (Non-)
% of (N) - 3.0% (4405) 1.2 (3558.) 4.6 (4 8 2 6)
1.3 (3593) 1.3 (3407) 1.5 (3228) 4.6 (4809) 2.1 (3849)
1.6 (2026)
3.8 (3767)
5.4 (4950) 3.5 (3362) 4.6 (4347) 5.7 (1297) 4.9 (11121
4.5 (3567) 5.6 (4917) 5.6 (4 8 9 3) 4.7 (3648) 4.8 (3842) 4.7 (3991) 4.9 (3715)
4.8 (3752) 3.7 (1906) 5.6 (4744)
pant)
*The CPIR file is not a statistical sample, contains strong biases, and overrepresents serious and fatal accidents.
**Statistically related factors, not necessarily direct injury or accident causation factors.

On t h e o t h e r hand, each of t h e s e f a c t o r s may be
an important f a t a l i t y causa t ion f a c t o r i n i t s own
r i g h t . Consequently, each f a c t o r was permi t ted t o
"s tand on i t s own" i n p r e d i c t i n g t h e f a t a l i t i e s i n C P I R
passenger c a r impacts . F a c t o r s wi th t h e h i g h e s t
F - r a t i o a r e ranked f i r s t . ( A l l f a c t o r s have one degree
nf freedom i n t h e numerator and most have l a r g e denomi-
n a t o r s , s o F - r a t i o s can be compared.) The F - r a t i o i s
only an i n d i c a t o r of s t a t i s t i c a l s i g n i f i c a n c e . I t i s
no t a measure of t h e a b s o l u t e s t r e n g t h o r importance of
any one f a c t o r , nor does it provide any i n d i c a t i o n . o f
how much h i g h e r , f o r example, f a c t o r 1 i s over f a c t o r 2 .
Note t h a t t h e f a t a l percentages a r e based on a count of
t h e number of f a t a l occupants ( n o t v e h i c l e s ) . For
example, t h e 7 . 9 pe rcen t of f a t a l i t i e s f o r r u r a l acc i -
d e n t s (Rank 2 6 , Table 5.6) i n d i c a t e s t h a t 7 . 9 pe rcen t
of t h e 1,814 C P I R case v e h i c l e occupants i n r u r a l col -
l i s i o n s a r e f a t a l i t i e s .
The t h r e e highest-ranked f a c t o r s (Table 5.6) a r e
d i r e c t l y r e l a t e d t o v e h i c l e passenger compartment dam-
age. The f i r s t two f a c t o r s a r e d i r e c t measures of t h e
l o s s of passenger compartment i n t e g r i t y . A primary
CDC/VDI damage e x t e n t zone (Rank 3 ) l a r g e r than 6 a l s o
records d i r e c t passenger compartment s i z e r educ t ion .
Thus, t h e p r o b a b i l i t y of f a t a l i t y i s s i g n i f i c a n t l y
increased wi th d i r e c t damage t o t h e passenger compart-
ment.
The next t h r e e f a c t o r s (Rank 4-6) a r e r e l a t e d t o
speed and/or c rush . The EBS (Rank 5) was a n a l y t i c a l l y
der ived from inches of c r u s h , and t h e de terminat ion of
t h e f ield-coded impact speeds (Rank 6) i s , t o a l a r g e
e x t e n t , dependent on c rush . Consequently, t h e s e t h r e e

speed/crush factors can generally be interpreted as
impact speed indicators. The presence of fuel leakage
(Rank 7) might also be considered as an indicator of
the extent of crush, and therefore, be included in the
general class of speed/crush factors. While the
speed/crush factors ranked high (Rank 4 - 7 ) , they were
secondary to passenger-compartment direct-damage fac-
tors (Rank 1-3) . The next three factors (Rank 8-10) are related to
the type of collision. When only vehicle-to-vehicle
collisions were included (Rank 8), the fatality rate
for head-on collisions was significantly higher than
other vehicle-to-vehicle configurations (i.e., front-
to-rear, front-to-side, sideswipe, and other), probably
because, of these configurations, head-on's involve a
higher level of energy dissipation. Intersection col-
lisions (Rank 9) had a lower fatality rate than other
accident locations (e.g., streets, expressway), proba-
bly for the same reason, i.e.,, less energy involved.
Similar reasoning could also be applied to the higher
fatality rate for limited-access roadway factors in
Rank 13 and the vehicle-to-object factor in Rank 16.
The list of first objects contacted (Rank 10) was
reclassified as either soft and small (e.g., other car,
pedestrian, motorcycle, ground-ditch, embankment, and
breakaway fixtures) or as solid and substantial (e.g.,
guardrail, bridge rail, pole, tree, trunk, train, pier,
pillar, abutment). The "soft" objects tend to dissi-
pate the impact energies over a longer time period than
do the "substantial" objects. As expected, the "sub-
stantial" objects did indeed demonstrate a higher
fatality rate than the "soft" objects.
The g e n e r a l c l a s s of c o l l i s i o n type (Rank 8-10,
13 , 16) ranked t h i r d i n importance, j u s t behind t h e
speed/crush f a c t o r s . Consequently, any changes o r
s h i f t s i n t h e mix of c o l l i s i o n types (due t o an energy
r r i s i s , f o r example) could have a major impact on t h e
d i s t r i b u t i o n of f a t a l i t i e s .
The occurrence of f i r e i n t h e c a s e v e h i c l e (Rank
11) inc reased t h e chance f o r f a t a l i t i e s .
The importance of d r i v e r p rec rash f a c t o r s i s
apparent i n Ranks 1 2 and 1 4 , "pharmacological agents
involved" and " d r i v e r s t r e s s t h a t day." The lower-
ranked f a c t o r s " d r i v e r r e s p o n s i b l e f o r c r a s h " (Rank 31)
and "any previous l i c e n s e suspens ions" (Rank 3 3 ) could
a l s o be included i n t h i s genera l c l a s s . These f a c t o r s
may tend t o p r e d i c t higher-speed c o l l i s i o n s , and,
hence, a h igher f a t a l i t y r a t e . Changes i n d r i v e r pre-
c r a s h f a c t o r s due t o s o c i o l o g i c a l s h i f t s could indeed
in f luence t h e d i s t r i b u t i o n of f a t a l i t i e s .
The r o l e of secondary impacts i s revealed by t h e
ranking of secondary CDC/VDI e x t e n t over 2 (Rank 1 5 ) ,
v e h i c l e r o l l o v e r and secondary roof crush (Rank 17, 1 8 ) ,
any second o b j e c t contac ted (Rank 2 7 ) , a r e a of second-
a ry damage (Rank 2 9 ) , and secondary r e a r c rush over 11
inches (Rank 3 0 ) . The secondary CDC/VDI damage e x t e n t
zone of 3 t o 9 (Rank 15) may be t o any reg ion of t h e
c a r , and i s p r i m a r i l y an i n d i c a t o r of a s i g n i f i c a n t
secondary impact-something beyond a minor d e n t . The
ro l lover / roof c rush f a c t o r s ranked a t 17 and 18 a r e
probably synonymous and i n d i c a t i v e of t h e importance of
ro l lover / roof crush i n primary f r o n t a l impacts. Fac-
t o r s 27, 29, and 30, whi le r e c e i v i n g a lower rank ing ,
s t i l l belong i n t h i s g e n e r a l c l a s s . Secondary damage

(~ank 29) to the top, undercarriage, or entire vehicle
incurred a higher fatality rate than other secondary
damage to the front, side, or rear of the car.
The effectiveness of occupant-protection measures
in frontal impacts is clearly diluted by the extent to which secondary impacts play a fatality-causation role.
Consequently, the distribution of fatalities by impact
speed should not be interpreted as if there were only
one impact per accident.
Collision factors show up again in the factors
ranked as 20, 22, 23, 25, and 26. The general group
is typified by the single-vehicle (Rank 20), ran-off-
roadway (Rank 22, 23), rural (Rank 26) accident. While
these factors are not as directly related to collision
severity or energy as the earlier group-collision-type
factors, these factors are usually indicative of higher
severity collisions. Thus, a change in the proportion
of any of these factors could also affect the overall
fatality distribution.
The physical characteristics of the front-seat
occupants played a lesser but significant role in pre-
dicting fatality rates. Occupant age over 39 (Rank 19),'
male sex (Rank 24), weight over 174 pounds (Rank 28),
and height over 65 inches (Rank 34) were all statisti-
cally significant factors. Whether these factors are
speed predictors (e.g., short young males) or fatality
contributors (e.g., thin old males) is not clear. It
is clear that occupant physical characteristics do play
a significant role in the production of fatalities.
The remaining factors (Rank 32, 35, 36) are of
minor, if any, importance. Cars with body and frame,
or integral-stub structures, demonstrated a higher

fatality rate than unitized and other structures.
This difference could be due to biases in the selection
of cases (e.g., oversampling of body and frame cars)
and not a real effect. On the other hand, recall that
the performance of the passenger compartment structure
rated as the most important group of factors (Rank 1-3).
The last two factors (Rank 35, 36) were significant at
the 0.14 and 0.18 level respectively. Secondary side
crush (Rank 35) is similar to other secondary damage in
pointing to multiple-impact collisions. The single-
occupant vehicle factor (Rank 36) may be a speed pre-
dictor of possibly an indication that drivers are less
likely to kill themselves with other passengers in the
car.
In summary, each of 36 CPIR factors was tested
independently as a predictor of occupant fatalities.
The positions or rankings of individual factors may be
t.he result of CPIR case sampling biases. The broad
grouping of factors does provide an overview of major
fatality factors. Seven general factor groupings were
identified:
1. Passenger Compartment Performance Factors
2. Speed/Crush Factors
3 . Type of Collision le.g., severe impact with solid objects)
4. Driver Precrash Factors (e.g., pharmacological agents, driver stress)
5 . Secondary Impact Factors
6. Single-vehicle, Ran-off-roadway, Rural Colli- sions
7 . Physical Characteristics of Occupant Factors
Again, each of these factors is not independent of
speed. Some may predict speed ( e . g . , driver stress)
and others may be the consequences of speed (e.g.,
vehicle damage). The point is that speed alone is not
the sole predictor of fatalities.

6 . DISTRIBUTION OF I N J U R Y PROBABILITY
The d e r i v a t i o n of i n j u r y d i s t r i b u t i o n curves i s
f r a u g h t wi th t h e same problems of c a u s a l i t y ( e .g . ,
speed v s , c rush environment o r occupant phys ica l condi-
t i o n ) and proper sampling a s t h e d e r i v a t i o n of a cumu-
l a t i v e f a t a l i t y curve . Because t h e th resho ld of "What
i s an i n j u r y ? " i s no t c l e a r , t h e s e problems a r e g r e a t l y
magnif ied. Consequently, it i s d i f f i c u l t t o d e r i v e a
cumulat ive i n j u r y curve t h a t i s wel l -def ined, represen-
t a t i v e , and u s e f u l f o r decision-making and comparison
wi th o t h e r r e s u l t s .
6 . 1 The Approach
The approach taken he re is r e l a t i v e l y well-defined
and r e p r e s e n t a t i v e of t h e a r e a and acc iden t s sampled.
On t h e o t h e r hand, t h e r e s u l t s may n o t be d i r e c t l y
a p p l i c a b l e t o t h e na t ion because of t h e r e s t r i c t e d set
of a c c i d e n t s sampled, o r may no t be d i r e c t l y comparable
wi th e a r l i e r r e s u l t s because of d i f f e r e n c e s i n d e f i n i -
t i o n s ( e . g . , EBS d e r i v a t i o n ) and sampling. The r e s u l t s
i n t h i s s e c t i o n , t h e n , a r e only exemplary of what might
be obta ined from a p roper ly def ined and sampled s e t of
n a t i o n a l acc iden t d a t a . This approach could be even
more va luab le i f r e p r e s e n t a t i v e c o s t f i g u r e s were
determined f o r each l e v e l of i n j u r y .
During 1974 and 1975, t h e Motor Vehicle Manufac-
t u r e r s Associa t ion has sponsored a R e s t r a i n t System
Ef fec t iveness Study (RSES) of 1973 and 1974 model year
American-manufactured passenger c a r s . Three teams (Calspan, Highway S a f e t y Research I n s t i t u t e , and South-
west Research I n s t i t u t e ) have been i n v e s t i g a t i n g and

reporting on a proper statistical sample of tow-aways.
Scott and O'Day have documented the sample design else-
where (6). While each team uses a slightly different
sampling protocol, the resultant data set is a repre-
sentation of the towed 1973 and 1974 cars in each area,
from data available to date.
Each team will transmit data collected through
August, 1975 in digital form to HSRI for construction
of statistical analysis files. The analysis presented
here is based on twelve months of data from each team
starting with March, 1974 for HSRI, and April, 1974 for
both Calspan and SwRI, Investigations conducted during
this period included a total of 5,465 outboard front
seat occupants (2,151 Calspan, 1,464 HSRI, 1,850 SwRI).
This sample represents a total population of approxima-
tely 7,700 occupants of 1973 and 1974 American passen-
ger cars towed from the scene of an accident. This
total population was estimated by weighting on the
inverse of the respective sampling fractions.
6.2 Injury Distributions
To provide some comparability to the December
NHTSA cumulative injury distribution curve ( 4 ) , the
inches of front crush were used to plot equivalent bar-
rier speed (EBS) according to the transformation
7.5 + 0.9 crush (in.) used in Section 2. Clearly,
this transformation is a rough approximation, as it
does not, specifically, take into account the vehicle
mix or different damage patterns (e.g., narrow/wide) or
crash configurations. Since distributed damage is
assumed, the resultant derived EBS tends to be high.
The distribution of each AIS level (13) across
derived EBS is displayed in Table 6.1. The cumulative
injury distribution by EBS is displayed in Figure 6.1
with curves for occupants with AIS-1 or more, 2 or
more, 3 or more, and 4 or more. A cumulative curve for
all occupants (AIS-0 or more) is also displayed.
Note that the cumulative injury curves are - not
probability of injury curves. They are based upon the
total number of occupants at-and-above each AIS cate-
gory. The cumulative distribution of each injury class
is displayed by derived EBS. Thus, for example, 60
percent of the AIS-4t occupant injuries occurred
between the derived EBS speeds of 0 and 45 mph. The
probability of an AIS-4t injury is not 60 percent at
45 mph.
The probability of injury at-or-above each injury
level is displayed in Figure 6.2. These curves are
based upon the total number of occupants at each level
of derived EBS (10, 15, 20, etc.). Of all the occu-
pants in 40 mph derived EBS crashes, 17 percent sus-
tained an injury severity of AIS-3 or more. Thus, the
(computed) probability of an AIS-3t injury at a derived
EBS of 40 mph is 0.17.
As with fatalities, these distributions should not
be interpreted as if speed were the only cause of
injury. Also, recall that these distributions were
derived from recent-model American passenger car "tow-
aways." Consequently, there is a smaller percentage
of injury accidents. This is demonstrated by the small
difference in the distribution of all occupants
(AIS-0+) in Figure 6 .l.
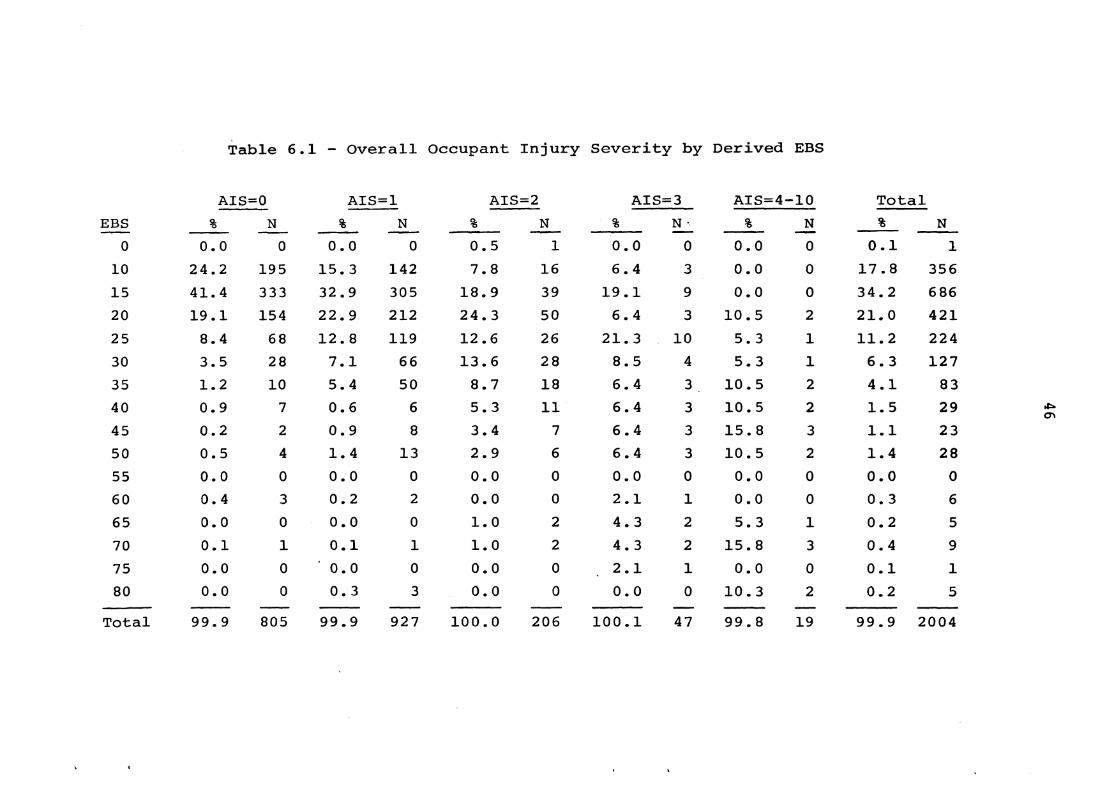
Table 6.1 - Overall Occupant Injury Severity by Derived EBS
Total
EBS - 0
10
15
20
25
30
35
40
45
50
55
60
65
70
75
80
Total

DERIVED E B S -MPH
Figure 6.1 - Cumulative Occupant Injury by Derived EBS

DERIVED E B S - MPH
Figure 6.2 - Probability of Occupant Injury by Derived EBS

REFERENCES
1. Collision Performance and Injury Report, Long Form, Revision 3, General Motors Corporation, form number GM-PG-2070, 1969.
2. OIDav, et al., Statistical Inference From Multidis- ciplinary ~ccident Investigation, Highway Safety Research Institute, The University of Michigan, - Ann Arbor, June 1973.
ger Car Vehicle
s of Effects Requirements
1 Programs, Na
of Proposed Changes to Passen- of MVSS208. Prepared by Motor
.tional Highway Traffic Safety
4. Amendment to Reference 3, December, 1974.
5. Vehicle Damage Scale for Traffic Accident Investi- gators, TAD Project Technical Bulletin, Number 1, Traffic Accident Data Project, National Safety Council, Chicago, 1971.
6. Scott, R.E. and OIDay, J., A Sampling Program for E v a l u a t i o n o f SAE Paper 750188, presented at the 1975 Automobile Engineering Congress and Exposition, February 24-28, 1975. Cobo Hall, Detroit.
7. Marsh, J.C., Multidisciplinary Accident Investiga- tion Data File, 1974 Final Report, Highway Safety Research Institute. Report Number UM-HSRI-SA-75-6, Contract Number DOT-HS-4-00898, 133 pages. March, 1975.
8. Collision Deformation Classification, SAE Recom- mended Practice, SAE Technical Report J224a, Revi- sion of February, 1972.
9. K.L. Campbell, Energy Basis for Collision Severity, SAE Paper 740565, Third International Conference on Occupant Protection, Troy, Michigan, July, 1974.

10. Golomb, D . H . and OIDay, J . , An Aid Analys is of Texas T r a f f i c Accident Data Before and During t h e Energy Crisis. Highway S a f e t y Research I n s t i t u t e . H I T Lab Repor ts , Volume 5 , Number 7 , March, 1975.
11. "The Use of t h e Cumulative F a t a l i t y Curve," Appendix C of Comments of General Motors w i t h r e s ~ e c t t o t h e NHTSA r e p o r t e n t i t l e d - Analys is of ~ f f & t s of Pro- posed Changes t o Passenger Car Requirements of MVSS208. USG1172. October , 1974.
S c h u l t z , S . and OtDay, J . , Analys is of Variance w i t h Dichotomous Dependent V a r i a b l e s : A Tool f o r Gaining I n s i a h t From T r a f f i c Accident Data. Hishwav S a f e t y ~ e s e a r c h I n s t i t u t e , H I T Lab Repor ts , ~ o i u m e * 3 , ~ u m - b e r 3 , November, 1972.
13. S t a t e s , J . D . , Huelke, D.F., Hames, L . N . , 1974 AMA- SAE-AAAM Revision of t h e Abbreviated I n j u r y S c a l e (AIS) , Proceedings of t h e 1 8 t h Conference of t h e 7 Amerlcan Assoc ia t ion f o r Automotive Medicine, September 12-14, 1974.


![Appendix 1 HIP Male and Female - University of East Anglia · App14.1!HIP!v3.2_02_05_2012!!!!!Health’Improvement’Profile[HIP]’ ’’’’’’’’’’’’’’’’’’’’’’’’’’’’(HIP)–’Male](https://static.fdocuments.net/doc/165x107/5f0af26b7e708231d42e1f1c/appendix-1-hip-male-and-female-university-of-east-anglia-app141hipv3202052012healthaimprovementaprofilehipa.jpg)