An assessment of entrepreneurial orientation at a pipeline ...
108
i An assessment of entrepreneurial orientation at a pipeline gas company HL Mokgoto 22566945 Mini-dissertation submitted in partial fulfillment of the requirements for the degree Magister in Business Administration at the Potchefstroom Campus of the North-West University Supervisor: Dr HM Lotz November 2013
Transcript of An assessment of entrepreneurial orientation at a pipeline ...

i
An assessment of entrepreneurial
orientation at a pipeline gas company
HL Mokgoto
22566945
Mini-dissertation submitted in partial fulfillment of the
requirements for the degree Magister in Business Administration
at the Potchefstroom Campus of the North-West University
Supervisor: Dr HM Lotz
November 2013

ii
DECLARATION
I declare that, apart from the assistance acknowledged, the research contained in
the dissertation is my own unaided work. It is being submitted in partial fulfilment of
the requirements for the degree Master in Business Administration at the Potchefstroom
Campus of the North-West University. It has not been submitted before for
any degree or examination to any other University.
Nobody, including Dr H. Lotz (Supervisor), but myself is responsible
for the final version of this dissertation.
Signature..................................................................................

iii
ABSTRACT
Title: Assessment of entrepreneurial orientation at a pipeline gas company
Key terms: Autonomy, innovativeness, risk-taking, pro-activeness, competitive
aggressiveness, business growth, business development and improvement, pipeline
gas company.
The general aim of the study was to determine the influence of entrepreneurial
orientation on the perceived success of the pipeline gas company. This type of study
has not been conducted previously for such a pipeline gas company and as such, a
valuable contribution could be made to a more effective entrepreneurial orientation in
the business environment.
Two questionnaires were administered, which focused on entrepreneurial orientation
and perceived success of business respectively. A response rate of 87.63% was
obtained from a sample of 97 employees at management level in the pipeline gas
company concerned.
The results showed a statistically significant positive relationship between
entrepreneurial orientation and business development as variable of business success.
The data also revealed correlations among the dimensions of entrepreneurial
orientation, some with significant differences for various demographic groups and their
level of entrepreneurial skills. Limitations within the study were discussed and
recommendations were made for future research.

iv
ACKNOWLEDGEMENTS
I would like to thank the following people who supported me to complete this
dissertation and were influential during my studies. My appreciation goes to:
My wife, Lorraine, the pillar of my strength for support and patience, for taking
care of the children during my absence and making sure that I get that coffee.
My boys Katlego and Tshegofatso for understanding and accepting their absent
father.
My Supervisor, Dr Henry Lotz, for his guidance, wisdom, patience and many
hours of dedication towards this dissertation.
All other family, in laws and friends for their support and interest shown over this
period.
My colleagues and all the employees that have spent time on completing the
questionnaires.
Mostly I would like to thank God for the spiritual guidance, talent and
opportunities He gave me throughout my life.
The Statistical Consultation services of the North-West University,
Potchefstroom, for their guidance, especially Sibusiso Ndzukuma.

v
Table of Contents
DECLARATION ……………………………………………………………………………….. ii
ABSTRACT …………………………………………………………………………………… iii
ACKNOWLEDGEMENT …………………………………………………………………….. iv
1 CHAPTER 1: THE NATURE AND SCOPE OF THE STUDY ................................... 1
1.1 INTRODUCTION ................................................................................................ 1
1.2 PROBLEM STATEMENT .................................................................................. 2
1.3 OBJECTIVES OF THE STUDY ......................................................................... 3
1.3.1 Primary objective ....................................................................................... 3
1.3.2 Secondary objectives ................................................................................ 4
1.4 SCOPE OF THE STUDY ................................................................................... 4
1.4.1 Field of the study ....................................................................................... 4
1.5 RESEARCH METHODOLOGY .......................................................................... 4
1.5.1 Literature review ........................................................................................ 5
1.5.2 Empirical study .......................................................................................... 6
1.5.3 Participants ................................................................................................ 6
1.5.4 Measuring instruments ............................................................................. 7
1.5.5 Statistical analysis .................................................................................... 8
1.6 STUDY LIMITATIONS ....................................................................................... 8
1.7 LAYOUT OF THE STUDY ................................................................................. 9
1.8 SUMMARY....................................................................................................... 11
2 CHAPTER 2: LITERATURE STUDY ON ENTREPRENEURSHIP ........................ 12
2.1 INTRODUCTION .............................................................................................. 12
2.2 DEFINITION OF BASIC TERMS ..................................................................... 13

vi
2.2.1 Entrepreneurship ..................................................................................... 13
2.3 ENTREPRENEURIAL CHARACTERISTICS................................................... 16
2.4 ENTREPRENEURIAL ORIENTATION ............................................................ 18
2.4.1 Risk-taking ............................................................................................... 22
2.4.2 Competitive aggressiveness .................................................................. 23
2.4.3 Pro-activeness ......................................................................................... 24
2.4.4 Autonomy ................................................................................................. 26
2.4.5 Innovativeness and creativity ................................................................. 27
2.5 PERCEIVED SUCCESS OF THE ORGANISATION ....................................... 28
2.6 Business growth ............................................................................................ 29
2.6.1 Business development and improvement ............................................. 30
2.7 SUMMARY....................................................................................................... 31
3 CHAPTER 3: EMPIRICAL RESEARCH METHODOLOGY ................................... 33
3.1 INTRODUCTION .............................................................................................. 33
3.2 RESEARCH APPROACH................................................................................ 33
3.3 RESEARCH METHOD .................................................................................... 34
3.3.1 Measuring instrument ............................................................................. 34
3.3.2 Participants .............................................................................................. 35
3.4 PROCEDURE .................................................................................................. 37
3.4.1 Preliminary arrangements ...................................................................... 37
3.4.2 Ethical aspects ........................................................................................ 37
3.4.3 Data capturing and feedback .................................................................. 37
3.5 STATISTICAL ANALYSIS ............................................................................... 37
3.6 SUMMARY...........................................................................................................
4 CHAPTER 4: EMPIRICAL RESEARCH ................................................................ 40

vii
4.1 INTRODUCTION .............................................................................................. 40
4.2 GATHERING OF DATA ................................................................................... 41
4.2.1 Development and construction of questionnaires ............................... 41
4.2.2 Data collection ......................................................................................... 42
4.3 RESPONSES ................................................................................................... 43
4.4 BIOGRAPHICAL ............................................................................................. 43
4.4.1 Age group of participants ....................................................................... 43
4.4.2 Gender classification of participants ..................................................... 44
4.4.3 Race classification of participants ......................................................... 45
4.4.4 Academic qualification obtained by participants ................................. 46
4.4.5 Post levels of participants ...................................................................... 47
4.4.6 Departments where the participants are working ................................. 48
4.5 THE RELIABILITY OF THE QUESTIONNAIRE .............................................. 49
4.6 AN ASSESSMENT OF THE ENTREPRENEURIAL ORIENTATION .............. 50
4.6.1 Autonomy ................................................................................................. 52
4.6.2 Innovativeness ......................................................................................... 53
4.6.3 Risk-taking ............................................................................................... 55
4.6.4 Pro-activeness ......................................................................................... 56
4.6.5 Competitive aggressiveness .................................................................. 57
4.7 ASSESSMENT OF PERCEIVED SUCCESS OF THE BUSINESS ................. 58
4.7.1 Business growth ...................................................................................... 59
4.7.2 Business development and improvement ............................................. 60
4.8 FACTOR ANALYSIS ....................................................................................... 61
4.8.1 Independent variables ............................................................................. 61
4.8.2 Dependent variable ................................................................................. 65

viii
4.9 DEPENDENT VARIABLE – INDEPENDENT VARIABLE CORRELATIONS . 68
4.10 T-TEST ............................................................................................................ 69
4.10.1 Gender ...................................................................................................... 69
4.10.2 Age group ................................................................................................. 70
4.11 SUMMARY....................................................................................................... 72
5 CHAPTER 5: CONCLUSION AND RECCOMENDATIONS................................... 73
5.1 INTRODUCTION .............................................................................................. 73
5.2 CONCLUSIONS ............................................................................................... 73
5.2.1 Conclusions on the biographical data of participants ......................... 73
5.2.2 Conclusions on the reliability of the questionnaire.............................. 74
5.2.3 Conclusions on entrepreneurial orientation ......................................... 75
5.2.4 Conclusions on perceived success ....................................................... 77
5.2.5 Conclusions on the correlation between variables of entrepreneurial
orientation and those of perceived success ...................................................... 78
5.3 RECOMMENDATIONS .................................................................................... 79
5.4 ACHIEVEMENT OF THE OBJECTIVES ......................................................... 80
5.4.1 Primary objective ..................................................................................... 80
5.4.2 Secondary objectives .............................................................................. 80
5.5 SUGGESTIONS FOR FURTHER RESEARCH ............................................... 81
5.6 SUMMARY....................................................................................................... 82
6 BIBLIOGRAPHY .................................................................................................... 83
7 APPENDIX: A: ....................................................................................................... 93
8 APPENDIX: B......................................................................................................... 98

ix
LIST OF TABLES
Table 2.1: Characteristics of entrepreneurs 80
Table: 2.2: Dimensions of entrepreneurial orientation 80
Table 4.1: Age group classification of participants 45
Table 4.2: Gender classification of participants 45
Table 4.4: Academic qualification of participants 46
Table 4.5: Position of participants 58
Table 4.6: Department of participants 48
Table 4.7: Cronbach’s alpha coefficient and internal consistency 49
Table 4.8: Cronbach’s alpha coefficients for the questionnaire 50
Table 4.9: Results of the entrepreneurial orientation survey 51
Table 4.10: Autonomy of participants 53
Table 4.11: Results of innovativeness 54
Table 4.12: Results of innovativeness 55
Table 4.13: Results of pro-activeness 56
Table 4.14: Results of competitive aggressiveness 57
Table 4.15: The result regarding business growth 59
Table 4.16: Results of business development and improvement 60
Table 4.17: Oblimin rotated factor matrix: entrepreneurial orientation 62
Table 4.18: Oblimin rotated factor matrix: Perceived success 66

x
Table 4.19: Correlation coefficients between perceived success and dimensions of
entrepreneurial orientation 68
Table 4.20: Results of the T-test for gender 69
Table 4.21: Result of the T-test for age group 71
LIST OF FIGURES
Figure 2.1: The five dimensions of the entrepreneurial orientation concept 19
Figure4.1: Entrepreneurial orientation analysis 52

1
1 CHAPTER 1
THE NATURE AND SCOPE OF THE STUDY
1.1 INTRODUCTION
In today’s business environment role-players have to cope with increasing customer
demand, fast changing technologies and increasing levels of extreme global competition
(Ireland and Webb, 2009: 1). The result is that businesses have to manage continuous
change. Most businesses need to compete in the global market place and stay ahead of
the pack. Therefore they need to be innovative to keep surviving in this environment.
Agrawal and Srivastava (2010: 163) mention that there exist different categories of
research conducted on entrepreneurship. These include research on individuals who
act as intrapreneurs and implement innovations in the firms that employ them. Most
Companies are forced to cut their operational costs and have to lay off employees in
order to survive. Some Businesses will go even further by cutting the training budget
due to financial difficulties. Ramachandran, Devarajan and Ray (2006: 86) support this
finding. They indicate that as a result, businesses that do not continually indorse an
innovative way of thinking may be making an unintentional strategic decision to be out
of business within a few years.
An entrepreneurial orientation characterises the practices, processes and activities
related to decision-making which lead to the improvement and delivery of new products,
services or processes (Chan, Chan and Chen, 2007: 999). This orientation is the key
success of higher performance in businesses as is suggested consistently in the
literature (e.g. Yamada and Eshima, 2009: 1). Competition is rife in most of industries in
South Africa, which include sectors such as mining, pipeline gas, clothing, banking,
retail and manufacturing. Most companies in these fields need new technology to
survive and compete in the international economical arena.
2
The following dimensions of entrepreneurial orientation have been identified and are
used consistently in the literature: innovativeness, pro-activeness and risk-taking
(Rauch, Wiklund, Lumpkin and Frese, 2009: 763). Lumpkin and Dess (1996: 136),
included the other two dimensions of entrepreneurial orientation, namely autonomy and
competitive aggressiveness. For the purpose of this study, all five dimensions of
entrepreneurial orientation will be the centre of the research.
Pipeline gas industries contribute to the South Africa economy. However, these
industries are also affected by the changing world economic environment, which are
affected by external factors, such as the actions of the activist organisation Green
Peace, as well as political pressures flowing from political economy.
This chapter explains the problem statement on which this assessment study was
based, and provides the objectives of the study. The scope of the study is outlined by
providing a summary of the research methodology, lifting out some the limitations of the
study and describing the chapter layout. This study will examine managers’ perceived
success within the pipeline gas company.
1.2 PROBLEM STATEMENT
Pipeline gas industries play a major role in the energy, manufacturing and development
sector in South Africa. Therefore innovation and new technology are needed to
generate ideas that will sustain these companies’ existence and profitability to avoid
closing the businesses and possibly retrenching employees. Scheepers, Hough and
Bloom (2008: 50) support the statement that enterprises with well-developed
entrepreneurial capabilities are able to sustain growth and innovation which help them
compete in an unstable economic environment.
Research has shown that entrepreneurial orientation is a process intended to create
value in a business. This can be achieved through five dimensions of entrepreneurial

3
orientation. Bhardwaj, Sushil and Momaya (2007: 131) contend that new value creation
can only be developed with a high level of entrepreneurial activity. Scheepers, Bloom
and Hough (2008: 17) concurs by stating that an innovative environment is
strengthened by the capabilities of human development, and social structures within the
enterprise. Madsen (2007: 188) indicated that orientation towards entrepreneurial
activities is likely to have positive implications for business performance. This is based
on the implicit assumption that companies, who take the lead, are rewarded in a
marketplace.
Pipeline gas companies as businesses are facing regulation challenges which can also
evoke more competition. Therefore the company must be prepared to face the
challenges and the employees should show enough of an entrepreneurial orientation to
suggest innovative strategies for sustaining the current profit. An assessment of
employees’ entrepreneurial orientation was never done at the pipeline gas company on
which this study focuses. Therefore it is an appropriate time to measure and improve
the entrepreneurial orientation where necessary. The focus of this study is on the
entrepreneurial orientation at the pipeline gas company and the managers’ perceived
success (or failure) of the business.
1.3 OBJECTIVES OF THE STUDY
The objectives of this study are divided into a primary objective and secondary
objectives derived from it.
1.3.1 Primary objective
The primary objective of the study is to investigate the relationship between the
entrepreneurial orientation of such a pipeline gas company and the managers’
perceived success of the business. The aim of the study will be to suggest ways to
improve the entrepreneurial orientation, to enhance the innovation and gain a
competitive edge in the market.

4
1.3.2 Secondary objectives
The secondary objectives in support of the primary objective of this research are
formulated as follows:
Gain insight into entrepreneurship by conducting a literature study.
Study the concept of entrepreneurial orientation.
Use statistical analysis to determine the reliability of the questionnaire.
Determine the correlation between entrepreneurial orientation and perceived
success of the business.
Measure the current entrepreneurial orientation in the pipeline gas company by
means of questionnaires.
Determine the demographic differences in terms of age, gender, race,
qualification and department, as well as the constructs by measuring the
entrepreneurial orientation.
Determine the perception of managers to the success of the business.
Make recommendations for future research and practice.
1.4 SCOPE OF THE STUDY
1.4.1 Field of the study
The field of the study falls within the subject-field of entrepreneurship, with special
reference to entrepreneurial orientation. The research will focus primarily on a specific
pipeline gas company in South Africa, examining its unique challenges, which are
significant for its survival.
1.5 RESEARCH METHODOLOGY
The researches based on the specific objective were done in two phases:

5
Firstly, an in depth literature review to gain a clear understand of entrepreneurial
orientation and secondly, an empirical study. Secondly, the research design and
research instrument to be used will also be outlined. Issues of data collection and
analysis in relation to this study will be examined.
1.5.1 Literature review
The literature review in phase one will be a comprehensive review on intrapreneurship.
The following sources will be consulted:
Books related to the topic
Published journals
Credible Internet sources
Dissertations that dealt with the topic
The literature review will be discussed in chapter two and chapter three.
Chapter two
This chapter contains the literature study. The aim is to provide a comprehensive
literature review on the definition of entrepreneurship and entrepreneurial orientation, by
focusing on the five dimensions or constructs, namely:
Innovativeness
Autonomy
Risk-taking
Pro-activeness and
Competitive Aggressiveness
The term “perceived success of businesses” will be explored in detail in this chapter.

6
Chapter three
This chapter will focus on findings from the research method employed to achieve the
goals of the research project. The research will consist of the following aspects: the
research approach, measuring instruments to gather data, the reliability of the
questionnaires and methods of data analysis.
1.5.2 Empirical study
The empirical investigation to achieve the objectives of this study is based on the
descriptive research approach. According to Malhotra (2007: 82), this type of
investigation or research is used when there is a clear need for a problem statement
and for detailed information. The present study therefore identified this type of research
design as relevant in the study of entrepreneurial orientation and of the perceived
success in the Pipeline Gas Company.
The research methods that are used in this type of research design are structured and
quantitative in nature (Tustin, Lightelm, Martins and Van Wyk 2005: 86). Quantitative
research aims to measure data, in contrast to qualitative research that is unstructured
and exploratory and based on samples taken from a specified population (Malhotra,
2007: 143). According to Cameron and Price (2009: 213), the use of data presents
substantial practical advantages for a quantitative design, as it allows the drawing of
conclusions related to a wider group of data and such data can also be analysed
statistically. For the purpose of this study the quantitative approach was selected as the
most suitable design to investigate entrepreneurial orientation.
1.5.3 Participants
Participants in this case are defined as an available sample of employees who are
working for the pipeline gas company. A random population sample is targeted of
managers who are employees for the pipeline gas company concerned. The
respondents are also assured of the confidentiality in the use of their answers, also that

7
their participation is voluntary and that they are free to withdraw from the research at
any stage if they want to.
1.5.4 Measuring instruments
1.5.4.1 Reliability and validity
Two key components should be considered when evaluating particular instruments:
validity and reliability. According to Bless and Higson-Smith (2000), reliability is
concerned with consistency of the instrument, and an instrument is considered highly
reliable if it can reach an accurate and consistent dimension of unchanging value.
According to Whitelaw (2001: 108), validity refers to how well an instrument measures
the particular concept it is supposed to measure. He further points out that an
instrument must be reliable before it can be validated, to be reproduced consistently.
Thereafter the instrument can be scrutinised to evaluate whether this instrument is what
it purports to be.
According to Schmitt (1996: 350), Cronbach’s alpha coefficient measures the reliability
of the instruments, which is based on the average correlation of variables within the test
material. This alpha coefficient always should exceed 0.7, for data to be considered
reliable and consistent. Generally, Cronbach’s alpha value of 0.7 and higher is
acceptable, although Field (2005: 668) states that, when attitudes and not abilities are
tested, a Cronbach’s alpha score of up to 0.6 could be still acceptable.
1.5.4.2 Instruments
This section consists of the research design, the questionnaire used in the study, the
population sample, gathered data and the statistical analysis. Two standardised
questionnaires are used in the empirical study. A questionnaire on frequency variables
is also included in the measuring sequence. This questionnaire focuses on participants’
age, gender, race, education, position and the departments in which they are employed.

8
The first questionnaire examines the dimensions of entrepreneurial orientation which
can be used to measure the level of entrepreneurial orientation amongst the
participants. This instrument was adopted from Lotz and van der Merwe (2013).
Lumpkin and Dess (1996) outline five dimensions, namely; autonomy, pro-activeness,
innovativeness, risk-taking and competitive aggressiveness. For the purpose of this
study, 27 statements will be posed in the first questionnaire to measure the five
dimensions of entrepreneurial orientation amongst the targeted population.
The second questionnaire is based on managers’ perceived success of the business.
This instrument was adopted from Lotz and van der Merwe (2013). The questionnaire
comprising 11 statements examined two factors by which to measure perceived
success in business, namely business development and improvement, and business
growth. The overall values of Cronbach’s alpha for dependent and independent
variables were found above 0.7, which means the construct were reliable (Nobrega,
2012; Lotz and van der Merwe 2013). A five point Likert-scale was used as a measuring
system throughout, with the following scores: “strongly disagree” (1), “disagree” (2),
“neither agree nor disagree” (3), “agree” (4) and “strongly agree” (5). The use of the
interval scaling method enables the correct use of methods for statistical analyses.
1.5.5 Statistical analysis
In the present study the data is recorded and analysed by using the SPSS and
STATISTICA statistical programs (SPSS Inc, 2012; StatSoft, Inc, 2012), with the
assistance of the North-West University Statistical Consulting Services.
1.6 STUDY LIMITATIONS
This study’s contribution will be to gauge the extent of managers’ entrepreneurial
orientation, and to point out the possible link between entrepreneurial orientation and
the impact it has on the perceived success of the pipeline gas company’s business. This

9
type of study was never conducted within this particular gas environment in South
Africa. Therefore a valuable contribution could be made as such to a more effective
entrepreneurial orientation within this context.
The use of questionnaires in the current research creates a limitation. At best, these
relationships could only be analysed and described, but no causativeness established.
Therefore, the establishment of relationships in the present study serves only to
discover certain patterns. These patterns can be compared with previous theoretical
research findings on the chronological relationship between the different variables for
dimensions of entrepreneurial orientation and the perceived success of the business
enterprise that is investigated.
A further limitation of the study is that it focuses on a sample of employees working at
management level for this pipeline gas company in South Africa. Therefore it might not
represent the pipeline transportation as a whole.
1.7 LAYOUT OF THE STUDY
The structure of the present study is divided into five chapters, with a more detailed
explanation of the contents of each chapter discussed below.
Chapter one
This chapter introduced the content of the topic and explained why this topic was
chosen for the research. It contains the problem statement, research objectives, scope
of the study, the research methodology and the study’s limitations.
The research methodology showed that the research was done both by means of an
empirical research and a literature study.

10
Chapter two
The Literature review will focus on corporate entrepreneurship as a main objective or
basis of this research. It will aim to provide a definition of entrepreneurship to further
understanding of entrepreneurial orientation and as well as insight into dimensions and
characteristics of entrepreneurial thinking. The chapter furthermore will: explore
characteristics and types of entrepreneurship; define corporate entrepreneurship and
give an overview of the history of entrepreneurial orientation. The conclusion will point
out the barriers to corporate entrepreneurship, as well as factors that can determine
success of the business enterprise.
Chapter three
This chapter describes the research methodology that will be employed to achieve the
goals of the research study. Additional aspects included in the chapter are the research
design and measuring instruments to gather data, as well as a discussion of techniques
to analyse the data.
Chapter four
This chapter presents the results of the study. The demographic information of the
participants for the pipeline gas company is analysed thoroughly. The chapter will also
examine the correlation of entrepreneurial orientation and the perceived success of the
business constructs to the frequency of demographic. The results will then be discussed
by focusing on the implications of these findings.
Chapter five
This chapter concludes with the findings flowing from the preceding chapters. It
presents the conclusion that is reached from the research, as well as recommendations
for future research on the pipeline gas company.

11
1.8 SUMMARY
Chapter one provided the introduction and motivation, as well as a focus on the
research. This includes the problem statement, primary and secondary objectives, the
research methodology, scope of the study, value added by the study, as well as
limitations of the study, and lastly the layout of the study in terms of successive
chapters.

12
2 CHAPTER 2
LITERATURE STUDY ON ENTREPRENEURSHIP
2.1 INTRODUCTION
The purpose of the literature review is mainly to examine key concepts and the related
research relevant to dimensions of entrepreneurial orientation and its effect on the
perceived success of a business enterprise. The following topics are identified as
important: defining entrepreneurship, entrepreneurial characteristics, dimensions of
entrepreneurial orientation as independent variable, and perceived success of a
business as dependent variable. The dimensions of an entrepreneurial orientation are
explored by examining the extent to which the findings from the literature supports the
problem statement.
In today’s business environment the business enterprises are facing risks and a
complex situation. This compels organisations to be more active, and to respond to
changes faster than projects and achievements of the competition. Innovativeness is an
integral part of any business and has become a basic requirement for many businesses
in order to be economically sustainable. Chow (2006: 17) points out the extremely
significant negative correlation that currently exists between the environment and
entrepreneurial orientation. For Chow this confirms that a favourable environment is
necessary to support business entrepreneurs. Success in global business operations
requires resourcefulness and entrepreneurial risk-taking. In light of this, Van Wyk and
Adonisi (2012: 65) urge that businesses continually have to re-examine their market
orientation strategies and adapt flexible policies in serving different stakeholders. Block
and Macmillan (2003: 8) argue that for companies to survive in the current dynamic and
challenging environment, they require a level of innovativeness, speed and flexibility
that were unnoticed a few years ago.

13
Large businesses are not usually entrepreneurial orientated. Therefore these business
enterprises need to promote entrepreneurial behaviours and practices and included it in
their business strategy. Ireland et al. (2009: 27) state that while entrepreneurial
behaviour can be demonstrated through many specific actions, the essence of
entrepreneurial behaviour still centres on identifying and exploiting opportunities. Ireland
also outlines the processes of entrepreneurship. Ireland et al. (2009: 7) concurs with
Kuratko and Morris (2006: 14) that businesses understand the active use of
entrepreneurship as a source of getting a viable advantage and as a route to higher
levels of financial and non-financial performance.
The strategy of any business should include the ability to continue using innovation to
enhance its products and business enterprise, or its financial model to focusing on long-
term success. Hitt et al. (1999: 145) stated that traditionally the design of new products
has been done in a chronological manner. They also point out: those firms that use a
serial process do assign a designers engineering group to develop the initial product
design, which is then transferred to a manufacturing engineering group. Ramachandran
et al. (2006: 85) indicate that most organisations have the talent. It needs to be
discovered and through innovation exploit limited opportunities, as these business
enterprises moves from the entrepreneurial to the growing phase. The key to success in
the highly competitive and vibrant environment, in which most organisations currently
operate, is to retain the ability to keep on being innovative and maintain an
entrepreneurial orientation.
2.2 DEFINITION OF BASIC TERMS
2.2.1 Entrepreneurship
Entrepreneurs are viewed as people who take risks by depriving and taking advantage
of their employees by applying their ideas to make profit. In reality entrepreneurs are
those people who launch and operate a business venture by taking risks and grasping
the opportunities that arise. Longenecker et al. (2000: 3) define an entrepreneur as

14
someone who makes an assessment and shapes the free enterprise economic
environment of the new millennium by determining new market needs and then
introduces new businesses to meet those needs.
Gartner (1990: 15) points out that entrepreneurship means different things to different
people. Schumpeter (1934: 85) defines entrepreneurship as the process when a person
attempts new combinations, which may entail new products, processes, markets,
organizational forms, or sources of supply. According to Spinelli and Adams (2012: 87),
entrepreneurship as a way of thinking, reasoning, and acting that is passionate about
opportunities, holistic in its approach, and balanced with leadership – to create and
capture value.
Entrepreneur is a French word and literally translated, it means: “between-taker” or “go-
between” (Hisrich and Peters, 1998: 7). Morris and Kuratko (2002: 23) comment that
innovation as such is not sufficient, but needs to be a model to change, provide growth
and create value. Hisrich et al. (2005: 520) define entrepreneurship as the process of
assigning effort and time to create something new with value. This is done by taking into
consideration the additional financial, intellectual and social risks and by experiencing
the rewards of financial and personal satisfaction and independence in the process.
Shane et al. (2003: 206) elaborate on this definition by pointing out that the degree of
creativeness involved in entrepreneurial orientation differs across the spectrum of the
types of resources that are recombined. Entrepreneurship also involves human support.
The entrepreneurial process takes place because people act by grasping opportunities.
Agents also differ in their willingness and abilities to act on these opportunities, because
of individual predispositions. It can be noted that entrepreneurship is a process of value
creation that bring together a unique package of resources with which to exploit an
opportunity.
As stated by Govender (2010: 15) the typical definition of entrepreneurship introduces
four important aspects:

15
Entrepreneurship involves a process. Therefore it is manageable, can be broken
down into steps and have no boundaries. It can be applied in any corporation.
It creates value where none existed previously. This value is created within the
organisation and spill over in the market place.
Entrepreneurs put resources together in a unique way. This entails a combination
of money, people procedures, technologies, materials, facilities, packaging,
distribution channels, and other resources.
Entrepreneurship is an opportunity-driven behaviour. It involves pursuing an
opportunity, irrespective of the resources that are controlled at a time.
It is clear now that an entrepreneur is someone who put in order, manages, and
undertakes the risks of a business or enterprise. This enterprise can also be
demonstrative of change in the business environment. Entrepreneurship entails the
process of determining new ways of conjoining resources. When the market value
created by this new grouping of resources exceeds the market value that these
resources can generate elsewhere individually or in another combination, then the
entrepreneur makes a profit.
According to Hisrich and Peters (1998: 19), the skills required by entrepreneurs can be
classified into three main areas: technical skills, business management skills and
personal entrepreneurial skills.
Kuratko and Morris (2002: 23) outline the seven perspectives of an entrepreneur and
his/her orientation as follows:
Creation of wealth– entrepreneurship means to take on the risks associated
with increased production in exchange to profit.
Creation of enterprise – the founding of a new business venture by
entrepreneurship.

16
Creation of innovation – the unique combination of resources that make
existing methods or products outdated.
Creation of change – generating change by adjusting, adapting, and modifying
one’s personal range, approaches, and skills to meet different opportunities that
are available in the environment.
Creation of employment–using, managing and developing the factors of
production and of the labour force by innovative inputs.
Creation of value–creating value for customers by developing opportunities
those previously were untapped.
Creation of growth–a strong and positive orientation towards growth in sale,
income, assets and labour force.
2.3 ENTREPRENEURIAL CHARACTERISTICS
According to Fattal (2003: 14), since 20 years previously, entrepreneurship has become
a much valued element of the world economic fabric. Rao (2004: 35) argues that the
discipline of corporate entrepreneurship implies old models and examples that have
occurred for more than centuries. Wickham (2004: 3) mentions that entrepreneurs are
just managers who make entrepreneurial decisions, which implies that entrepreneurs
are not born but made.
Hebert and Link (2009: 241) stated that the word “entrepreneur” is a French coinage.
Therefore it is appropriate that the investigation in the present study commences by
examining contributions from early French writers on entrepreneurship. Following
Schumpeter’s view, entrepreneurs are the perfect innovators and earn their profits,
however temporary, from successful innovations. In this, according to the authors,
Schumpeter rejected the risk-taking attribute as inherent to entrepreneurs, by assigning
it to a capitalist orientation.

17
Most researchers kept on characterising the special qualities of entrepreneurs, as is
illustrated in the table below.
Table 2.1: Characteristics of entrepreneurs
Date Author Characteristics
1848 Mill Risk bearing
1917 Weber Source of formal authority
1934 Schumpeter Innovation and initiative
1954 Sutton Desire for responsibility
1959 Hartman Source for formal authority
1961 McClelland Risk-taking, need for achievement
1963 Davids Ambition, desire for independence, responsibility and self-confidence
1964 Pickle Drive/mental, human relations, communication ability and technical
knowledge
1971 Palmer Risk measurement
1971 Hornaday &Aboud Achievement needs, autonomy, aggression, power, recognition,
innovative and independent
1973 Winter Need for power
1974 Borland Internal locus of power
1982 Casson Risk, innovation, power and authority
1985 Gartner Change and ambiguity
1987 Begley & Boyd Risk-taking and tolerating ambiguity
1988 Caird Drive
1998 Roper Power of authority
2000 Thomas & Mueller Risk, power, internal locus of control and innovation
2001 Lee & Tsang Internal locus of control
Source: Spinelli and Adams (2012: 36)

18
Based on learning experience, entrepreneurs use their knowledge and acquired skills to
identify a business opportunity and to leverage their resources. Katz and Shepherd
(2003: 241) contend that the value of resources and skills acquired through the
experience of business ownership is in part dependent on the ability of entrepreneurs to
learn from their previous experience. Timmons and Spinelli (2009: 315-316) indicates
that the main roles of a leading entrepreneur is to construct a management team that
combine all the skills that are needed. Raugh and Friese (2007: 355) argue that
entrepreneurial characteristics can be used to predict entrepreneurial behaviour.
The following section will provide some information to help identify individuals who have
some entrepreneurial traits, and to highlight characteristics of a typical entrepreneur. It
will also provide more insight into entrepreneurship and give suggestions on how to
establish an entrepreneurial environment within a pipeline gas company.
2.4 ENTREPRENEURIAL ORIENTATION
The term “entrepreneurial orientation” denotes processes of creating strategies, as well
as styles of companies that execute entrepreneurial activities. Entrepreneurial
orientation is a measure that specifies entrepreneurial activity in a business enterprise.
According to Lumpkin and Dess (1996: 138), business processes take shape, from
which strategic decisions evolve. These processes form patterns or modes that be
characterised and identified across organisations. The dimensions of processes a firm
implements to create strategy, may be viewed as spanning the full range of business
activities. These involve the following aspects: planning, decision-making and strategic
management.
Entrepreneurial orientation is defined as the entrepreneurial strategy-making processes
that key decision-makers use to endorse a business’s purpose, sustain its vision and to
create a competitive edge (Rauch et al., 2009: 6). In this regard, an entrepreneurial
orientation characterises the processes, practices and decision-making activities that

19
lead to the development and delivery of new innovative products, processes and
services (Chang et al., 2007: 999).
Miller (1983: 770) identified the following three dimensions of entrepreneurial
orientation: risk-taking, pro-activeness and innovativeness. Miller (2011: 878) points
out that literature have different findings on the influence of entrepreneurial orientation
on a business performance in general. The three dimensions of entrepreneurial
orientation were later supported by the findings of Morris and Kuratko (2002: 39).
Lumpkin and Dess (1996: 136) added two dimensions of entrepreneurial orientation:
competitive aggressiveness and autonomy. These dimensions provide additional
components for the entrepreneurial construct.
Figure 2.1: The five dimensions of the entrepreneurial orientation concept
Source: adapted from Enslin (2010: 31)
For the purpose of the study five dimensions of entrepreneurial orientation as
independent variables will be used as defined by Dess and Lumpkin (2005: 147).
Autonomy
Innovativeness Pro-activeness
Five dimensions of
entrepreneurial
orientation concept
Risk-taking Competitive aggressiveness

20
Kuratko and Audretsch (2009) elaborated on this construct: it also means taking risks by
trying out new and uncertain products and services, and by acting more pro-active than
competitors in seeking out new marketplace opportunities. This orientation attempts to
investigate the extent to which the dimensions of entrepreneurial alignment are
associated positively with the performance of the organisation.
Although authors differ on the number of dimensions that entrepreneurial orientation
shows, Lumpkin and Dess (1996) state that, no agreements have been reached about
the key aspects of entrepreneurship. Some researchers view these aspects by focusing
on entrepreneurial orientation which is emphasised by characteristics such as pro-
activeness, risk taking autonomy, competitive aggressiveness and innovativeness–
which implies four dimensions. This supports the statement of Schillo (2011: 2) that the
most widely used definition of entrepreneurial orientation in the workplace was
proposed by Miller (1983), developed further by Covin and Slevin (1989), as well as
many others, and augmented by Lumpkin (1996).This conceptualisation has been used
in over 200 studies, which not only focused on entrepreneurship, but also on
management and marketing.
Govender (2010: 27) mentions that scholars agree that a discipline of entrepreneurial
orientation comprises of a number of dimensions as indicated in Table 2.2 below:

21
Table: 2.2: Dimensions of entrepreneurial orientation
Dimensions Researchers
Morris et al.
(2002: 39)
Burns
(2004: 12)
Hisrich et
al.(2005: 44)
Dess et al.
(2005: 147)
Antoncic et
al. (2003:19)
Innovation X X X X X
Risk-taking X X
Pro-active
Pattern
X X X X X
Corporate
venturing
X X X X
Organisation
Self-renewal
X X X
Competitive
aggressiveness
X X
Autonomy X
New
businesses
X
Source: adapted from Antoncic et al. (2003: 19)
Table 2.2 presents the views of various researchers in their interpretation of the
dimensions of entrepreneurial orientation in matrix format. Antoncic and Hisrich (2001:
499-500) classify entrepreneurial orientation into four dimensions: new business
venturing, innovativeness, self-renewal and pro-activeness. But Antoncic et al. (2003:
14-19), argues for eight dimensions as indicated by Table 2.2 above. The additional
dimensions are: risk-taking, corporate venturing and corporate start-ups.

22
Entrepreneurial orientation thus entails the methods, decision making activities and
practices that lead to the new entry. It involves the intents and actions of key performers
who function in a self-motivated procreative process, which is aimed at creating new
projects. The typical dimensions that characterise entrepreneurial orientation should
also include the following: a propensity to act freely (autonomy), willingness to take risks
and to innovate and the tendency to be competitive as well as aggressive and pro-
active regarding opportunities in the market place (Lumpkin and Dess, 1996: 136).
As indicated in the earlier chapter the present study will focus only on five dimensions
namely: autonomy, innovativeness, risk-taking, pro-activeness and competitive
aggressiveness. These dimensions will be discussed and considered as independent
variables that influence the dependant variable which is managers’ perceived success
of the pipeline gas company under investigation.
2.4.1 Risk-taking
Dewett (2004: 258) defines the term “risk” as the extent to which there is ambiguity
about whether disappointing and/or potentially significant outcomes of a decision can be
realised. Risk was traditionally characterised as either the potential to act too quickly on
an uncorroborated opportunity, or the potential to wait too long before taking decisive
action (Mullins and Forlani, 2005: 51).
Morris and Kuratko (2002: 50) indicated that from the onset risk-taking has been viewed
as a fundamental element of entrepreneurial orientation. The true entrepreneur in the
business world is cognisant of the fact that failing to attempt something is a greater
failure than trying and not succeeding. Antoncic and Hisrich (2003: 18) contend that
risk-taking refers to the quick pursuit of opportunities, fast commitment of resources and
courageous actions when in fact, people often don’t even realise that they are taking
risks. What others may judge as a risky situation, entrepreneurs see as an opportunity
for a higher reward. Dess and Lumpkin (2005: 152) stated that risk-taking implies the
willingness of an organisation to capture a venture opportunity even though they are
uncertain whether the venture will be successful or not, but to act with boldness without

23
knowing the end result. Risk in the sense of entrepreneurship includes financial,
personal and business risks.
Lotz and Van der Merwe (2013: 19) argue that there is another aspect of risk-taking
over and beyond the assumption, which is made regularly, that risk-taking and
innovativeness are directly correlated. This would mean increasing innovativeness
implies taking higher risks. Morris et al. (2008: 62), argue by pointing out state that this
relationship between risk-taking and innovativeness is much more complex. They
(Morris et al., 2008: 63) continue to argue: businesses also face high risks when they
search for innovations that provide breakthroughs, which create new entrant markets
and redefine industries. Lotz and Van der Merwe (2013: 19), concludes this argument:
To be successful in future, companies will need to embark on an entrepreneurial
orientation with the ability to sense immediately, act rapidly and mobilise under higher
risk conditions.
In this study, an assessment is mad of risk-taking as a dimension of entrepreneurial
orientation. The researcher will investigate whether study indicates a positive
relationship between the propensity for risk-taking and the perceived success of the
participants from the pipeline gas company. This relationship will be assessed by
applying a five-point Likert scale.
2.4.2 Competitive aggressiveness
According to Lumpkin and Dess (1996: 148) the term “competitive aggressiveness”
refers to a business inclination that intends to challenge to competitors directly and
intensely. Lumpkin and Dess (2001: 434) indicate that competitive aggressiveness is
characterised by a strong offensive posture, which is directed at overcoming
competitors. However, this attitude may also be quite reactive as when a company
defends its market share and position to new market entrants. This tendency
corresponds with the definition by Lumpkin (2001) and Rauch et al. (2007: 7) which
typifies competitive aggressiveness as a company’s effort to outperform its rivals and

24
which is characterised by strong responses and an aggressive counter against
competitive threats.
Competitive aggressiveness in brief thus implies a business’s determination to
outperform its rivals. Businesses with an aggressive orientation are willing to “do battle”
with competitors. They might slash prices and sacrifice profitability to gain in their
market share, or they may spend aggressively to enhance their manufacturing capacity
(Dess and Lumpkin 2005: 151). Govender (2010: 29) points out that some scholars find
it hard to distinguish between competitive assertiveness and pro-activeness. He
proposes that these should be considered as two distinct dimensions of business level
entrepreneurial orientation. Antoncic and Hisrich (2003: 18) draw the differentiation due
to the fact that pro-activeness relates to a pioneering attitude to seize market
opportunities, whereas competitive aggressiveness is associated with an aggressive
organisational relationship to competitors.
In the present study an assessment will be made of competitive aggressiveness as
entrepreneurial orientation dimension. The researcher will ascertain whether the
research findings indicate a positive relationship between the competitive
aggressiveness and the perceived success of participants from the pipeline gas
company. This relationship will be assessed by a five-point Likert scale. The items
measuring competitive aggressiveness in this study includes the inclination to adopt an
extremely competitive posture, viewing the industry as aggressive and intensely
competitive; effectively assuming an aggressive posture to combat external threats to
survival or progress.
2.4.3 Pro-activeness
According to Madsen (2007: 187), the term “pro-activeness” denotes a posture of
anticipating and acting on future wants and needs in the marketplace, thereby creating
a first-mover advantage over against competitors. Pro-activeness involves looking for
new opportunities, the implementation of ideas, taking responsibility and functionalising
concepts (Dafel, 2012: 28). Through pro-activeness entrepreneurs go further; they

25
clearly define and effectively communicate the advantages of an innovation. Thereafter
they ensure that the innovation is implemented and launched (Morris et al., 2008: 66-67).
Pro-activeness thus entails an organisation’s efforts to seize new opportunities. Dess
and Lumpkin (2005: 150) point out that pro-active organisations monitor trends, identify
the future needs of existing customers, and anticipate changes in demand or emerging
problems that can lead to new venture opportunities. To align this definition with the
study field: it is a forward-looking perspective, which is characteristic of an open market
leader who has the anticipation to seize opportunities while expecting future demands.
This dimension of pro-activeness is related to pioneering and taking initiative in pursuing
new opportunities or to entering the open market place.
Apart from innovativeness, Rauch et al. (2009) indicate that pro-activeness is the other
integrating dimension of entrepreneurial orientation that offers a more intense positive
relationship with business performance and success. It was also found that pro-active
companies show greater performance and growth (Moreno, 2010). Lotz and van der
Merwe (2013: 20) state that they are in favour of defending a positive relationship
between business pro-activeness and the ensuing success.
Kropp et al. (2008: 104) mention that activities associated with pro-activeness include
the following: identifying and evaluating new opportunities, identifying and monitoring
market trends and the formation of new venture teams.
In the present study, the entrepreneurial orientation dimension of pro-activeness will be
assessed. This is to determine whether the research findings indicate a positive
relationship between the pro-activeness and the perceived success of the
participants of the pipeline gas company. The statements measuring pro-activeness
will be assessed by a five-point Likert scale.

26
2.4.4 Autonomy
The term “autonomy” refers to the independent actions of an individual or team in
bringing forward an idea or a vision and carrying it through from the initiation to its
completion (Lumpkin and Dess, 1996: 140; Lee and Sukoco, 2007: 551). Lassen et al.
(2006: 361) indicate autonomy as a treasured asset for an organisation to influence its
existing strengths and improve its business practices.
Dess and Lumpkin (2005: 149) mentioned that businesses with an overall
entrepreneurial mission use a “top-down” approach to stimulate entrepreneurial
activities. This means that those organisations need top management support to
compete in the market. However, according to Lumpkin, Cogliser and Schneider (2009:
49) the best ideas for new corporate ventures come from the “bottom-up”. Lumpkin et
al. (2009: 49) stated that the initiation of autonomy from the “bottom-up” requires special
incentives and a supportive organisational structure that will support those initiatives
throughout. Lumpkin et al. (2009: 48) stated that although Lumpkin and Dess in 1996
did propose the inclusion of autonomy as a dimension of entrepreneurial orientation,
very few studies have investigated autonomy as an element of such an orientation.
Govender (2010: 30) argues that an entrepreneurial orientation will be ultimately
encouraged if an organisation allows its employees to make decisions about their work
process and avoid criticising them for making mistakes while applying innovativeness.
In addition, environments that allow autonomous decision making help employees to
feel valued for their contribution to the organisation and helping to attain the
organisation’s goals and objectives.
For the purpose of this study, autonomy will be considered an independent variable and
its impact on the dependable variables will be determined. In addition, with autonomy
as dimension of entrepreneurial orientation, the study indicates a positive relationship
between the autonomy and the perceived success of the participants of the pipeline
gas company. The statements measuring autonomy will be assessed by a five-point
Likert scale.

27
2.4.5 Innovativeness and creativity
“All innovation begins with creative ideas ... we define innovation as the successful
implementation of creative ideas within an organisation. In this view, creativity by
individuals and teams is a starting point for innovation; the first is necessary but not
sufficient condition for the second” (as cited by Amabile et al., 1996: 1).
The importance of innovation to entrepreneurship was first emphasised by Lumpkin and
Dess (1996: 141). They proposed that innovation is the only dimension that has to be
employed by all entrepreneurial businesses. This also is true of the case study for this
research, the pipeline gas company. Gürbüz and Aykol (2009: 323) stated, that it therefore
can be argued that, even in the presence of the other dimensions, if employees do not
explore innovation there exists no entrepreneurship on the business level.
Regarding the two terms “innovation” and “creativity” (Macadam and McClelland, 2002:
88) views creativity as thinking “out of the box” and a right-brain activity that sparks
ideas. On the other hand, innovation is seen as the complete process starting from both
products and services and which is considered to the point where those concepts are
incorporated and implemented in the organisation.
McFadzean et al. (2005: 353) define innovation further as the process of adding value
to the organisation, its providers and consumers. This is done by improving the
methods, procedures, results, products and services. Hornsby et al. (2002: 257)
emphasises that employees must be conscious of the availability of resources for
innovative actions. They should also be provided with a relaxed business environment
that usually encourages experimentation and risk-taking behaviours.
Oosthuizen (2006: 246) contends that organisations should focus on the creativity of all
its employees and their understanding of customer’s needs and competitor’s actions.
This will enhance innovation within the whole organisation. Adams and Spinelli (2009:
65) reiterate that at the core of the entrepreneurial process lies the innovative essence.

28
According to Kuratko and Hodgetts (2004: 120), new ventures often have a collective
creativity that flows from the joint efforts of the originators and personnel, and thereby
produces distinctive goods and services. Wiklund and Shepherd (2003: 1309) mention
that innovative companies can generate an astonishing performance and typically have
been described as the engines of economic growth.
For the purpose of this study, innovativeness as dimension of entrepreneurial
orientation will be assessed. This will be done to ascertain of and whether the research
indicates a positive relationship between the innovativeness and the perceived
success of the participants from the pipeline gas company. All the statements
measuring innovativeness will be assessed by applying a five-point Likert scale.
2.5 PERCEIVED SUCCESS OF THE ORGANISATION
Success in an organisation is difficult to measure. Govender (2010: 47) state that
employees in large corporate businesses measure their success based on their own
perceptions. Dess et al. (1997: 678) posed the following question, “What are
performance indicators for businesses functioning in an entrepreneurial strategy making
approach?” They go on to provide the answer: “On the one hand it appears to be a
strong normative unfairness towards the inherent value in the behaviour of
entrepreneurial and categorical depiction of a positive relationship between behaviour
and desired business outcomes such as sales growth and profit.”
According to Frese et al. (2002: 276), entrepreneurial orientation which refer to the
dimensions of innovativeness, autonomy, competitive aggressiveness and risk-taking,
were positively related to success of business. Frese et al. (2002: 276) focus on
business owners who improve on products, processes and services, who are more self-
directed, take more risks and who challenge their competitors more. They point out that
these managers are more successful than those with a low point of entrepreneurial
orientation. Van der Post (1997: 75) argues that financial measures provide a solid base
from which to draw conclusions on the success and effectiveness of a business. This is

29
because all the efforts and systems are finally aimed at ensuring sustainable financial
returns. Effectiveness and efficiency are measures of business success and are often
related. Are the two measures related and this is shown by business employees who
are able to push up the output (Dess et al., 2003: 370).
According to Hayton (2005: 22), employees are considered as a determining factor,
even overbearing, in developing an entrepreneurial orientation. Employees who are
committed and satisfied also have a positive influence on the entrepreneurial orientation
in any business. Kreitner and Kinicki (2008: 4) state that successful businesses value
human capital as an asset and thus treat their employees with respect and make them
feel important.
For the purpose of this study, perceived business success will be measured by using
two variables, namely: business growth and business development and improvement –
as will be discussed below.
2.5.1 Business growth
A growing business can be seen with growth in turnover and profit, growth in market
share, a competitive position in the business sector, as well as job satisfaction and
motivated employees. This impacts on the morale and build the unique brand of the
business.
According to Wiese (2009: 44), traditionally financial measures were used. However,
these are viewed as short-term measures, which can change between periods and may
not be producing long-term corporate success. Delloitte (2008: 10) state that although
financial measurements received a high rating in helping the business board to make
short-term decisions and in formulating strategy, these data are much less helpful when
making medium- and long-term decisions and in to achieve what team consider as an
appropriate valuation in the capital markets.

30
Teo and king (1996: 312) point out that a business’s financial performance of is
measured by market share, turnover and return on investment. Megginson et al. (2009: 6),
outline the practice of corporate finance in terms of five basic and related functions:
Raising capital to support the corporation’s operations and investment programs.
Managing the company’s exposure to risk, in order to maintain the optimum
trade-off in risk returns and therefore maximize the shareholder value.
Developing a structure for corporate governance that ensures that mangers act
ethically and in the stockholders’ interest.
Selecting the best projects in which to invest the company’s resources, based on
each project’s perceived risk and expected return.
Managing the company’s internal cash flows and its mix of debt and equity
financing to maximize the company’s value and ensure its survival (Megginson et
al., 2009: 6).
Most of the questions to ask in the assessment, concerns the variable of perceived
financial success. This variable indicates whether employees perceive the business to
have experienced growth in the following sectors: its market share, in sales and in
profits (Govender, 2010: 48).
For the purpose of this study, the dependent variable of perceived success as a
construct of business growth will be measured by a five point Likert scale. This will be to
determine whether the business over the past view years has experienced growth in:
turnover, profit or in market share, and thus whether the business’ competitive position
has improved over the past few years.
2.5.2 Business development and improvement
The term “business development” refers to highly committed employees who are
regarded as the most valuable asset of the business. This includes higher satisfaction
among employees, as well as an improved business brand. The focus also is on

31
efficacy and the business’ effectiveness over the previous few years in terms of
continued investment in research development (Lotz, 2009: 19). According to Dess et
al. (2003: 370), the measuring of business success is mostly related to efficiency and
effectiveness according to which employees are able to produce a high output.
According to De Nobrega (2012: 31), performance of a business’s personnel is
determined by the inner organisational environment. Wiklund et al., (2008: 265)
elaborated on this by mentioning that members will perform better when they
demonstrate a positive emotion, passion for work and have a favourable opinion of their
team members in an organisation.
For the purpose of this study, the dependent variable of perceived success, the
construct business development and improvement, will be measured by a five-point
Likert scale. The following indications will be measured in the business concerned:
whether the business viewed its employees as its most valuable assets; whether
employees are highly committed to the business; whether the morale of the
employees has improved over the past few years;
whether the business’s position relative to that of the competitors has grown over
the past few years;
whether the efficacy of the business has improved over the past few years; and
whether innovative projects continue and no significant financial cuts are made.
2.6 SUMMARY
This chapter covered the literature study on entrepreneurship. The central
entrepreneurial characteristics are also defined. Various definitions of entrepreneurship
are provided and these definitions are personalised by focusing on the unique
character.

32
More specifically this chapter covered the five variables of entrepreneurial orientation
and the two variables which measure the perceived success of a business. For the
purpose of this study the five variables of entrepreneurial orientation were outlined and
defined: innovativeness, pro-activeness, risk-taking, autonomy and competitive
aggressiveness.
The effects of entrepreneurial orientation were measured against the perceived success
of an organisation. Variables of perceived success were identified previously as the
following: business growth and business development and improvement.

33
3 CHAPTER 3
EMPIRICAL RESEARCH METHODOLOGY
3.1 INTRODUCTION
This chapter discusses the research approach, method and design with a view to
achieving the stated objectives of this research work which were set out in chapter one.
A thorough examination of the source of data, the methods used in data collection and
data analysis is carried out for the pipeline gas company.
3.2 RESEARCH APPROACH
The study of phenomenology has provided an overarching term for a range of
approaches that reject some of the basic premises of positive knowledge. This includes
the assumption that collective reality is subjective, that humans react to the knowledge
that they are studying, and that it is not possible to gain objective knowledge about
collective phenomena (Denscombe, 2002:18). Researchers who are critical of
positivism argue that rich understandings into this complex world will be lost if such
complexity is reduced entirely to a series of law-like generalisations. The terms most
commonly used to differentiate these patterns in terms of their associated methods and
techniques are those of quantitative and qualitative respectively (Creswell, 1994:43).
The quantitative approach is objective in nature and concentrates on measuring the
occurrence of phenomena. This involves collecting and analysing numerical data and
applying statistical tests. The qualitative, phenomenological, approach is more
subjective in nature and involves investigating and reflecting on views to gain an
understanding of collective and human activities.

34
By quantitative methods researchers mean the following techniques: randomised tests,
quasi-experiments, paper and pencil “objective” tests, multivariate statistical analysis,
sample surveys, et cetera. Cook and Reichardt (1979: 9) point out that, in contrast,
qualitative methods include ethnography, case studies, in-depth interviews and
observation of participants.
Quantitative research determines the quantity or extent of an outcome in term of
numbers and thus provides and exact approach to measurement.
Qualitative research is subjective in nature and leaves much of the measuring
process to the conclusion of the researcher.
The research approach selected for this study was quantitative in nature, since such a
research is used to answer questions about relationships among measured dependent
and independent variables. The main purpose of such an approach is to explain, predict
and control phenomena (Leedy and Omrod, 2005: 95). The data for the present study
was collected by means of structured questionnaires, which were analysed by
conducting an exploratory factor analysis, demographic analysis, and a t-test. The
research approach is considered appropriate to gain information to answer the overall
questions and to give direction to the study’s primary objectives.
3.3 RESEARCH METHOD
The following sections will discuss the research method, starting with the measuring
instrument, followed by the discussion of research participants, the research procedure
and a statistical analysis.
3.3.1 Measuring instrument
Following the findings of Lotz and Van der Merwe (2013: 21) this study investigates the
following dimensions of entrepreneurial orientation, namely autonomy,
innovativeness, risk-taking, pro-activeness and competitive aggressiveness,

35
which is also corroborated in the literature (Morris et al., 2008: 54; Covin and Slevin,
1989: 76; Lumpkin and Dess, 1996: 139-140; Zahra et al., 1999: 50). The present study
compiled statements which measure the dimensions. These statements were based on
the following measuring instruments: entrepreneurial climate (Oosthuizen, 2006),
entrepreneurial orientation statements (Lumpkin and Dess, 2001), the organisational
structure and strategic post scale (Covin and Slevin, 1989), as well as the
entrepreneurship items (Antoncic and Hisrich, 2001).
Participants were asked to indicate to what extent they agree or disagree with each
statement, which is posed by means of a five-point Likert scale, one (1) indicating
“strongly disagree” and five (5) indicating “strongly agree” with the statement.
Biographical information was gathered as a measuring instrument to indicate
correlations with the opinions expressed in the study. Participants were requested to
indicate their age group, gender, race, level of management, qualification and the
department in which they worked, according to predefined categories.
3.3.2 Participants
As described by Trochim (2000), a research population is a group of whom the
researcher wants to take a broad view, and the sample is seen as the section of people
that are selected to be in the study. This definition was supported by Sekaran
(2000:295) who views a sample as a subgroup of the population in question and which
comprises a selection of members from that particular population. The definition of the
sample is of vital importance as the results of a research rely on the quality of the
population. The definition of the sample is of vital importance as the results of a
research are not more trustworthy than the quality of the population or participants that
make up the sample.
The targeted population for this study is the employees at management level of the
pipeline gas company. This company is one of the South Africa’s leading transportation
and operating enterprises of gas pipelines and other products. Its global operations

36
consist of several productions in South Africa, and Mozambique, and boasts of a few
subsidiaries or joint ventures, legal entities and representatives based in both countries.
The target sample is employees at management level who work in South African based
production facilities, which are in Komatipoort, Nelspruit, Secunda, Sasolburg,
Randburg and Durban. The pipeline gas company under investigation currently has a
staff compliment of more than 300 employees of which nine are vacant. The numbers
can be broken down as follows:
Semi-skilled: 68
Skilled: 163
Professional: 128
The statistics above highlights the high competence of managers from the specific
pipeline gas company in the gas industry.
With regard to established staff the departments are broken down as follows:
Operations Finance Regulation SHE/Q Legal Marketing BE HR MD
office
231 (65%) 18 12 14 6 31 27 6 2
Source: Unpublished pipeline gas company’s Human Resources.
Random sampling is used by sending the questionnaires to 97 employees. Leedy
(1997:205) defines randomisation of the probability sample as selecting a sample from
the whole population in such a way that the individualities of each unit of the sample
give an estimate of the characteristics of the sample as a whole. Randomisation in this
study is achieved by the researcher selecting, employees from the name list at random.
The selection is unbiased since managers are not able to select respondents for the study.

37
3.4 PROCEDURE
3.4.1 Preliminary arrangements
The Managing Director of pipeline gas company gave the researcher permission to use
employees of pipeline gas company for the study, see the Appendix B. An e-mail was
sent to all employees at management level requesting their support in the completion of
the questionnaires.
3.4.2 Ethical aspects
Ethical considerations of confidentiality and privacy were addressed. A concerted and
conscious effort was made at all times to uphold this undertaking. A guarantee was
given to the respondents that their names will not be revealed in the research report.
The sampling technique used for this study entailed probability sampling. A list of all the
employees was received from the Sasol Gas HR department of the company. The
objectives and nature of the study were explained, as well as the different constructs in
relation to the value it holds for the person and the business. The questionnaires were
conducted anonymous. This required of the managers to respond either directly by e-
mail or indirectly through fax or by direct hand-to-hand delivery at the researcher’s
office. All the participants were thanked for their involvement.
3.4.3 Data capturing and feedback
After questionnaires were completed, and handed in they were submitted to North-West
university for the Department of Statistics to do a statistical analysis.
3.5 STATISTICAL ANALYSIS
The statistical analysis was carried out with the help of the SPSS and STATISTICA
statistical programs (SPSS Inc, 2012; Statsoft, Inc, 2012). Descriptive statistics and

38
effect sizes were used to decide on the significance of the findings. The results are to
be described and compared by way of mean and standard deviations. In the present
study, the mean measures the central tendency of the results. The standard deviation
presents the average distance of the individual scores from the mean.
Exploratory factor analysis (EFA) is used to examine the constructed equivalence and
to enhance the reliability of the findings on both the entrepreneurial orientation and the
perceived success of the business. The number of factors in the total sample of the
entrepreneurial orientation and the perceived success of the business is determined by
the principal component analysis. Subsequently, components extraction is used to
estimate the number of factors. This is followed by principal axis factoring extraction, by
using a rotation method of direct Oblimin with Kaiser normalisation. This method was
applied to calculate the findings on the entrepreneurial orientation and the perceived
success of the business. Descriptive statistics (means and standard deviations) are
used to analyse the data that was captured. Cronbach’s alpha coefficient is used to
determine the internal consistency of both dimensions: entrepreneurial orientation and
perceived success of the business.
Correlation coefficients are used to specify the relationship between the two variables:
Entrepreneurial orientation (independent variable) and perceived success (dependent
variable). In terms of statistical significance, the correlation is practically at (p ≤ 0.05).
According to Cohen (1988: 15), effect sizes are used to decide the practical significance
of the findings. A cut-off point of 0.3 for medium effect and 0.5 for large effect were set
to gauge the practical significance of the correlation coefficients.
A t-test was performed to determine differences between the groups in the sample. As
proposed by Cohen (1988: 15) and Steyn (1999: 12), effect size was used in addition to
statistical significance. This was to determine the importance of relationships of
frequencies and statements from both the variables entrepreneurial orientation and
perceived success of the business. The effect sizes served to specify whether the
results obtained were practically significant. Furthermore, only the descriptive or

39
statistical research is relevant to the present study and will be employed in the study,
which implies field research, which involves the collection of data.
3.6 SUMMARY
The various aspects of the method used for the empirical study was examined in this
chapter. The following were discussed: the selected participants’ approval to distribute
the questionnaires, measuring instruments, administration and the chosen method of
statistical analysis.

40
4 CHAPTER 4
EMPIRICAL RESEARCH
4.1 INTRODUCTION
The primary objective of this study is to present, discuss and interpret the results
obtained from the empirical study. This study is based on an assessment of the
entrepreneurial orientation and perceived business success at a pipeline gas company.
The empirical study was conducted by means of a self-completion questionnaire which
was distributed to managers within the pipeline gas company. The questionnaires were
distributed in an electronic format by means of e-mail. The questionnaire consisted of a
section capturing demographics of participants and two sections measuring the five
dimension of entrepreneurial orientation and perceived success of a business as
constructed by Lotz (2009). An example of the questionnaire is presented in annexure A.
In this study, the five entrepreneurial orientations constructs will be discussed
independently and cooperatively by referring to the various means and standard
deviations. The two dependent variables of perceived success, namely growth and
development, were discussed independently and collectively. This helped the
researcher to present the results as a whole, in order to provide a clear understanding
of the results and the significance it hold for the business world.
The reliability of the questionnaire and the different variables will be tested by evaluating
Cronbach’s alpha coefficients. The responses to the survey will be evaluated by
investigating the mean value and the standard deviations of all statements and variables.

41
4.2 GATHERING OF DATA
According to Delport (2002: 165), a clear dissimilarity exists between research design
and data collection methods. Research design is the blueprint for the investigation and
provides a recommendation for a selection of data collection methods that will be most
applicable to the researchers’ goal and to the selected design.
4.2.1 Development and construction of questionnaires
The questionnaire used in the study is a standard issue on entrepreneurial orientation
compiled by Lotz (2009: 324). The questionnaire was customised for the employees of
the pipeline gas company. The questionnaire used in the present study is divided into
three sections:
Section A is developed to evaluate the employees’ entrepreneurial orientation at the
specific pipeline gas company. This section consists of 27 statements. Interval
dimensions are used, because the measurement classifies the variables and places
them in ranking order, but it also scores the characteristics of the variables on an
equally spaced scale. The respondents had to select the extent to which they agree or
disagree with each statement. A five-point Likert scale was used, ranging from “strongly
disagree” (1) to “strongly agree” (5). The Likert scale is mostly used to measure
multidimensional attitudes. According to Welman et al. (2011: 157), a scale measuring
summated attitudes consists of a collection of statements about the attitudinal objects.
In respect of each statement the subjects have to indicate the degree to which they
agree or disagree with its content.
Section B is an evaluation of the perceived success of the industry in which participants
operate. The characteristics of perceived success refer specifically to growth and
development. This section consists of 11 statements related to the perceived success of
the pipeline gas company under investigation. A five-point Likert scale was used for this
section, as well, ranging from “strongly disagree” (1) to “strongly agree” (5). The
participants had to indicate whether they agree or disagree with each statement.

42
Section C includes the demographical and educational background of the participants.
The purpose of this section is to provide data for the statistical analysis and the
comparison between various groups. The following answers were required by the
respondents indicating with an X:
Age group
Gender
Race classification
Position level
Highest academic qualification
Department or division.
The questionnaire consisting of the three sections discussed above forms the
quantitative part of the study. The focus of the questionnaire is to investigate the degree
of entrepreneurial orientation and the perceived success of the pipeline gas company in
which the participants operate.
4.2.2 Data collection
The study made use of purposive sampling and the sample was derived from the
managers who are employed by this pipeline gas company in South Africa. A
questionnaire was send electronically by means of email to all identified participants.
The aim was to send or distribute the questionnaires to as many participants as
possible.
The collected data was analysed statistically by using SPSS and the Statistica
programme. The data from the questionnaires was coded and transformed into
descriptive statistics that include frequency tables. The frequency tables were used to
draw a conclusion and make recommendations on the entrepreneurial orientation at
such a pipeline gas company.

43
4.3 RESPONSES
A total of 97 questionnaires were distributed and 85 were completed by participants and
collected. This constitutes a response rate of 87.63%.
4.4 BIOGRAPHICAL
Section C captured the demographic information of participants on the following
aspects: age group, gender, race classification, job level and the highest academic
qualification obtained and their department.
4.4.1 Age group of participants
Purpose of the question
The purpose of question C1 in section C of the questionnaire (refer to Appendix A) was
to establish the age group categories of the participantsto establish the average age
groups and the age group profile of the organization.
Results obtained
The age group of all managers that participated is presented in Table 4.1 below.

44
Table 4.1: Age group classification of participants
Age Frequency Percentage Cumulative percentage
≤29 10 11.76 11.76
30-39 41 48.24 60.00
40-49 21 24.71 84.71
50-59 11 12.94 97.65
60+ 2 2.35 100.0
Total 85 100
Analysis of results
The largest number of participants was between ages 30 and 49 at 72.95%. The
category 50-59 years represented 12.94% of the participants. Only 11.76% were
younger than 29 years, followed by 2.35% participants above 60 years of age.
4.4.2 Gender classification of participants
Purpose of the question
The purpose of question C2 in section C of the questionnaire (refer to appendix A) was:
Determine the gender of participants.
Compare the differences between the demographic variable gender and the
entrepreneurial orientation variables.
Compare the differences between the demographic variable “gender” and the
perceived success of the organisation.
Results obtained
The gender group of all managers who participated is presented in Table 4.2 below.

45
Table 4.2: Gender classification of participants
Gender Frequency Percentage
Female 19 22.35
Male 66 77.65
Total 85 100.00
Analysis of results
The majority of participants are male (77.65%), followed by 22.35% females.
4.4.3 Race classification of participants
Purpose of the question
Question C3 of section C of the questionnaire (refer to Appendix A) was to determine
the race of the participants according to the South African group classification namely,
Black, white, Coloured or Indian. Thereby the researcher could establish the
demographics of the organisation.
Table 4.3: Race of participants
Race Frequency Percentage
Black 48 56.47
Coloured 5 5.88
Indian 8 9.41
White 24 28.24
Total 85 100.00

46
Analysis of results
The majority of the participants (56.47%) were from the Black race group. Only 28.24%
participants were from the White race group. The race group that had the lowest
representation was the Indian and Coloured group with 9.41% and 5.88% respectively.
4.4.4 Academic qualification obtained by participants
Purpose of the question
The purpose of question C4 in section C of the questionnaire (refer to Appendix A) was
to determine the highest qualification of the participantsfor the make-up of the
management staff.
Results obtained
The academic qualification of participants is presented in Table 4.4
Table 4.4: Academic qualification of participants
Qualification Frequency Percentage Cumulative percentage
Grade 12 6 7.06 7.06
National Certificate 6 7.06 14.12
National Diploma 12 14.12 28.24
Three year Degree 29 34.12 62.35
Post graduate 31 36.47 98.82
Missing 1 1.18 100.00
Total 85 100.00

47
Analysis of results
The results indicated that 36.47% of the participants had a post graduate degree, whilst
34.12% are only graduates. Participants with diplomas are only 14.12%, whilst 7.06% of
the participants each have a National certificate and a grade 12 qualification.
4.4.5 Post levels of participants
Participants were requested to indicate their post levels. The post levels indicate the
following managerial positions:
level 8 – lower managers
level 6C-7 – middle managers,
level 5B-4 – senior managers
level 3+ – executive managers.
Purpose of the question
The purpose of question C5 in section C of the questionnaire (refer to Appendix A) was
to determine the capacity in which the participant is employed in their position within the
pipeline gas company. This data is used to:
Compare the differences in means between the position or level of employment
and the entrepreneurial orientation variables.
Compare the differences between the position or level of employment and the
perceived success of the pipeline gas company’s variables.
Results obtained
The position of participants is represented in Table 4.5 below.
Table 4.5: Position of participants

48
Position (level) Frequency Percentage
Level 3+ 4 4.71
Level 5B-4 40 47.06
Level 6C-7 38 44.71
Level 8 3 3.53
Total 85 100.00
Analysis of the results
The results indicated the highest participants at 47.06% as managers at level 5B-4;
managers at level 6C-7 indicates 44.71%,whilst lower level managers at level 8 make
up 3.53%, followed by executive level 3+ indicating4.71%.
4.4.6 Departments where the participants are working
This study focused on 10 departments at a specific pipeline gas company. Table 4.6
below represents the number of participants in terms of departments.
Table 4.6: Department of participants
Department Frequency Percentage
Engineering Planning and Technology 15 17.65
Facility 6 7.06
Finance 7 8.24
Human Resource 3 3.53
Information Management 2 2.35
Legal 5 5.88
Maintenance 11 12.94
Marketing 8 9.41
Production 21 24.71
Supply Chain 4 4.71
Missing 3 3.53
Total 85 100

49
4.5 THE RELIABILITY OF THE QUESTIONNAIRE
Reliability is an important criterion for the validation of the outcomes. The Cronbach’s
alpha coefficients were determined, firstly to assess the internal consistency between
the items of the measuring instrument, and secondly, to assess the internal consistency
of the items measuring the various variables under investigation (Brymann and Bell,
2007: 164).
The value of the outcomes can vary between zero (0), for no reliability and one (1), for
maximum reliability (Kent, 2007: 142). A larger value means a higher internal
consistency and more reliable outcome (Struwig and Stead, 2004: 133). Table 4.7
summarises the Cronbach alpha’s value interpretations, which will be used as a
guideline to assess the outcomes of the survey. Higher values of alpha are most
desirable and as a rule of thumb, a reliability of greater or equal to 0.7 is required.
Table 4.7: Cronbach’s alpha coefficient and internal consistency
Cronbach’s alpha Internal consistency
α ≥ 0.9 Excellent
0.8 ≤ α <0.9 Good
0.7 ≤ α <0.8 Acceptable
0.6 ≤ α <0.7 Questionable
0.5 ≤ α <0.6 Poor
α < 0.5 Unacceptable
Source: Cortina (1993: 98)
The responses of all 85 participants were used to determine the reliability of the
statements. The results are indicated by Table 4.8below.

50
Table 4.8: Cronbach’s alpha coefficients for the questionnaire
Variable Cronbach’s alpha
Autonomy 0.796
Innovativeness 0.762
Risk-taking 0.625
Pro-activeness 0.898
Competitive aggressiveness 0.846
Business growth 0.709
Business development and improvement 0.861
Analysis of results
The reliability of six of the factor was well above 0.7 indicating strong reliability but the
risk-taking variable gave a factor reliability of 0.625 which is also good, an alpha value
below 0.7 is also deemed acceptable in social science (Field, 2009: 675).
4.6 AN ASSESSMENT OF THE ENTREPRENEURIAL ORIENTATION
The purpose of statement A1-A27 in Section A of the questionnaire (refer to Appendix
A) was to determine the entrepreneurial orientation of the participants who are working
as managers at the pipeline gas company. The questions were divided into five themes
according to the constructs which it was to measure. These constructs entail:
autonomy, innovativeness, risk-taking and the additional two, pro-activeness and
competitive aggressiveness. The results are used to determine the influence of these
factors on the perceived success of the pipeline gas company. The average or mean
and standard deviation of each of the 27 items which measure the entrepreneurial
orientation are indicated in Tables 4.10 to 4.14.
Table 4.9 is divided into five constructs, which are discussed All the questions under
each construct are listed and a mean and standard deviation provided for each

51
construct. All the constructs are arranged from highest ranked average (mean) to the
lowest.
Table 4.9: Results of the entrepreneurial orientation survey
Variables mean Standard deviation
Innovativeness 3.30 1.05
Autonomy 3.27 0.94
Competitive aggressiveness 3.14 1.11
Pro-activeness 3.02 1.12
Risk-taking 2.97 1.02
Average 3.14 1.05
A mean value of 3 on the five-point Likert scale indicates a neutral opinion. The average
mean of four for the independent variables of entrepreneurial orientation was (mean)
3.14.This indicates that there is an overall positive perception towards entrepreneurial
orientation, but with room for improvement. Risk-taking scored low with a mean of
2.97. This indicates that there is a lower positive perception towards entrepreneurial
orientation, particularly regarding risk-taking among managers at the pipeline gas
company concerned.
The results of the survey are presented graphically in a column chart that compares the
different variables. The figure 4.1 below presents the results which are sorted from
highest ranking to lower with respect to the mean value.

52
Figure 4.1: Entrepreneurial orientation analysis
4.6.1 Autonomy
Purpose of the question
The purpose of statement A1-A5 in Section A of the questionnaire (refer to Appendix A)
was to determine the level of autonomy that managers experience in a pipeline gas
company. Each participant had to rate the successive statements at 1 to 5, with 1 for
“strongly disagree” and 5 for “strongly agree”. Results obtained in table 4.10 indicates
the results by showing the mean and standard deviation for each item measuring the
variable, ranking the mean from the highest to lowest.
2.80
2.90
3.00
3.10
3.20
3.30
3.40
Innvativeness Autonomy CompetitiveAggressiveness
Pro-activeness Risk-taking
Entrepreneurial orientation analysis (highest to lowest ranking)
Mean

53
Results obtained
Table 4.10: Autonomy of participants
Statement Mean Standard deviation
A1 I have enough autonomy in my job without continual supervision to do my work.
4.13 0.78
A2 Our business allows me to be creative and try different methods to do my job.
3.43 1.09
A4 Employees in our business are encouraged to manage their own work and have flexibility to resolve problems.
3.35 1.00
A3 Employees in our business are allowed to make decisions without going through elaborate justifications and approval procedures
3.13 1.02
A5 I seldom have to follow the same work methods or steps while performing my major tasks from day to day.
2.29 0.83
Average 3.27 0.94
Analysis of results
The average mean of the variable autonomy is equal to 3.27 with a standard deviation
of 0.94, which indicates that on average the participants believe they have some level of
autonomy in their work place. Statement A1 (mean= 4.13) reported the highest average
score for this variable and, A2 and A4 are also above average with a mean of 3.43 and
3.35 respectively. In contrast, statement A3 (mean= 2.29) has reported a slight
disagreement and there might be a feeling that the employees have to go through
approval procedures to get their work done.
4.6.2 Innovativeness
Purpose of the question
The purpose of statement A6-A14 in Section A of the questionnaire (refer to Appendix
A) was to determine the level of innovations that managers experience in a pipeline
gas company. Each participant had to rate the successive statements from 1 to 5, with 1
for “strongly disagree” and 5 for “strongly agree”. Results obtained in table 4.11

54
indicates the results by showing the mean and standard deviation for each item
measuring the variable, ranking the mean from highest to lowest.
Results obtained
Table 4.11: Results of innovativeness
Statement Mean Standard deviation
A12 Our business places a strong emphasis on continuous improvement in products/services delivery process.
3.96 0.96
A9 Our business is continually pursuing new opportunities. 3.79 0.92
A13 Our business has a widely held belief that innovation is an absolute necessity for the business’s future.
3.61 0.99
A7 Our business places a strong emphasis on new and innovative products/service/processes.
3.27 1.08
A6 Our business regularly introduces new services/products/processes.
3.14 1.06
A14 Our leaders seek to maximize value from opportunities without constraints to existing models, structures or resources.
3.12 1.10
A10 Over the past few years, changes in our processes, services and product lines have been quite dramatic.
2.96 1.08
A11 In our business there is a strong relationship between the number of new ideas generated and the number of new ideas successfully implemented.
2.95 1.05
A8 Our business has increased the number of services/products offered during the past two years.
2.87 1.21
Average 3.30 1.05
Analysis of results
The average mean of the variable innovativeness is equal to 3.30 with a standard
deviation of 1.05, which indicates that on average the participants believe they have
some level of innovativeness in their work place. There is a relatively strong feeling that
the business places a strong emphasis on continuous improvement of their products,

55
service delivery and processes. Statement A12 (mean= 3.96 and standard deviation=
0.96) reported the highest average score for this variable. On average the participants
agreed statements A9 (mean= 3.79), A13 (mean= 3.61), A7 (mean= 3.27), A6 (mean=
3.14) and A14 (mean= 3.12). The participants seem to disagree whether in their
business there were quite dramatic changes in processes, services and product lines
A10 (mean= 2.96), as well as a strong relationship between the number of new ideas
generated and successfully implemented: A11(2.95); and that their business has an
increased number of services/products offered:A8 (mean= 2.87) which scored the lowest.
4.6.3 Risk-taking
Purpose of the question
The purpose of statements A15-A19 in Section A of the questionnaire (refer to Appendix
A) was to determine the level of risk-taking that managers experience in a pipeline gas
company. Each participant had to rate the successive statements from 1 to 5, with 1 for
“strongly disagree” and 5 for “strongly agree”. Results obtained table 4.12 indicates the
results by showing the mean and standard deviation for each variable, ranking the
mean from highest to lowest.
Results obtained
Table 4.12: Results of Risk-taking
Statement Mean Standard deviation
A17 Owning the environment, our business believes that bold, wide-ranging acts are necessary to achieve the business objectives.
3.39 0.87
A18 Employees are often encouraged to take calculated risks concerning new ideas.
3.02 1.24
A15 When confronted with uncertain decisions, our business typically adopts a bold posture in order to maximise the probability of exploiting opportunities.
3.01 0.94
A16 In general, our business has a strong inclination 2.96 1.00

56
towards high-risk projects.
A19 The term “risk-taker” is considered a positive attribute for employees in our business.
2.46 1.06
Average 2.97 1.02
Analysis of results
The average mean of the variable risk-taking was found equal to 2.97 with a standard
deviation of 1.02. The highest agreement was with statement A17 (mean= 3.39 and
standard deviation= 0.87). Therefore it seems that the participants believe that bold and
wide-ranging acts are necessary to achieve the business’s objectives. The participants
also agreed with statement A18 (mean= 3.02) and A15 (mean= 3.01). In contrast to the
previous statements the participants seem to disagree with statement A16 (mean= 2.96)
by not considering the term “risk-taker” as positive attribute for employees in the
business A19 (mean= 2.46).
4.6.4 Pro-activeness
Purpose of the question
The purpose of statements A20-A23 in Section A of the questionnaire (refer to Appendix
A) was to determine the level of pro-activeness that managers experience in a pipeline
gas company. Each participant had to rate the successive statements from 1 to 5, with 1
for “strongly disagree” and 5 for “strongly agree”. Table 4.13 indicates the results by
showing the mean and the standard deviation for each variable, ranking the mean from
highest to lowest.
Results obtained
Table 4.13: Results of pro-activeness
Statement Mean Standard deviation
A23 Our business continuously monitors market trends 3.46 1.02

57
and identifies future needs of customers.
A22 Our business continuously seeks out new products/processes/services.
3.01 1.24
A20 Our business is very often the first to introduce new products/processes.
2.86 1.21
A21 Our business typically initiates actions which competitors respond to.
2.75 1.01
Average 3.02 1.12
Analysis of results
The average mean of the variable pro-activeness is equal to 3.02 with a standard
deviation of 1.12. This means that there is an agreement with the variable measured,
where the mean value of the statements, varies from participants agreeing with the
statement A23 (mean= 3.46), by indicating that the business continuously monitors
market trends and identifies future needs of customers, to a slight disagreement with
statement A21 (mean= 2.75),as well as statement A20 (mean= 2.86). It therefore seems
that the participants are uncertain whether the business typically initiates actions which
competitors respond to it. The results indicate a slightly positive agreement with
statement A22 (mean= 3.01).
4.6.5 Competitive aggressiveness
Purpose of the question
The purpose of statements A24-A27 in Section A of the questionnaire (refer to Appendix
A) was to determine the level of competitive aggressiveness that managers
experience in a pipeline gas company. Each participant had to rate the successive
statements from 1 to 5, with 1 for “strongly disagree” and 5 for “strongly agree”.
Table 4.14 indicates the results by showing the mean and the standard deviation for
each variable, ranking the mean from highest to lowest.

58
Table 4.14: Results of competitive aggressiveness
Statement Mean Standard deviation
A27 Our business knows when it is in danger of acting overly aggressive (this could lead to erosion of our business’s reputation or to retaliation by our competitors).
3.43 1.14
A26 Our business effectively assumes and aggressive posture to combat trends that may threaten our survival or competitive position.
3.13 1.21
A25 Our business is very aggressive and intensely competitive.
3.01 1.16
A24 In dealing with competitors our business typically adopts a very competitive “undo-the-competitor” posture.
2.99 0.92
Average 3.14 1.11
Analysis of results
The average mean of the variable competitive aggressiveness is equal to 3.14 with a
standard deviation of 1.11. This implies that on average participants agree that the
business is competitively aggressive, with statement A27 (mean= 3.43) which scores
the highest where participants agree that their business knows when it is danger of
acting overly aggressive. This is followed by statements A26 (mean= 3.13) and A25
(mean= 3.01) where the participants also disagreed slightly with statement A24, in
dealing with competitors, that their business typically adopts a very competitive “undo-
the-competitor” posture (mean=2.99).
4.7 ASSESSMENT OFPERCEIVED SUCCESS OF THE BUSINESS
The results of Section B of the questionnaire (refer to Appendix A) evaluated the
perceived perception of managers in the pipeline gas company regarding two
dependable variables: business growth and business development and
improvement that measure perceived success. Participants were asked to answer the

59
11 statements. They were also requested to indicate their level of agreement or
disagreement on a five-point Likert scale. Each participant had to rate the successive
statements in terms of 1 to 5, with 1 for “strongly disagree” and 5 for “strongly agree”.
4.7.1 Business growth
Purpose of the question
The purpose of statements B1-B4 in Section B of the questionnaire (refer to Appendix
A) was to determine the perceived success of the business, with special reference to
business growth as a measure of success, which managers in a pipeline gas
company perceived. Each participant had to rate the statements from 1 to 5, with 1 for
“strongly disagree” and 5 for “strongly agree”. Table 4.15 indicates the results by
showing the mean and the standard deviation for item measuring the variable, ranking
the mean from highest to lowest.
Table 4.15: The result regarding business growth
Statement Mean Standard deviation
B2 Our business has experienced growth in turnover the past few years.
4.62 0.51
B1 Our business has experienced growth in profit over the past few years.
4.60 0.54
B3 Our business has experienced growth in market share over the past few years.
4.11 0.91
B4 The competitive position of our business has improved over the past few years.
3.69 0.88
Average 4.25 0.71
Analysis of results
Participants agreed with all the statements that measure the variable of business
growth. The participants agreed that the business had experienced a growth in
turnover over recently with B2,experience growth in turnover over the past few years

60
having the highest mean value (mean=4.62) and B1,experienced growth in profit over
the past few years scoring the second highest with a mean value of 4.60. The other two
statements were below average but in agreement with the top two statements. These
entail B3, experience growth in the market share (mean= 4.11) followed by the last
statement B4, the business has improved competitive position over the past few years
(mean= 3.69).
The average mean for the construct of business growth is equal to 4.25 with a
standard deviation of 0.71.
4.7.2 Business development and improvement
Purpose of the question
The purpose of statements B5-B11 in Section B of the questionnaire (refer to Appendix
A) was to determine the perceived success of the business, particularly referring to
business development and improvement as a measure of success, which
managers perceived in a pipeline gas company. Each participant had to rate the
statements from 1 to 5, with 1 for “strongly disagree” and 5 for “strongly agree”. Table
4.16 indicates the results by showing the mean and standard deviation for item
measuring the variable, and ranking the mean from highest to lowest.
Table 4.16: Results of business development and improvement
Statement Mean Standard deviation
B8 Our employees are highly committed to our business. 3.63 0.71
B10 The image (stature) of our business, relative to our competitors, has grown over the past few years.
3.58 0.83
B5 The effectiveness (doing the right things) of our business has improved over the past few years.
3.57 0.95
B9 The moral (job satisfaction) of our employees has improved over the past few years.
3.50 0.82
B6 The efficiency (doing things right) of our business has 3.27 1.14

61
improved over the past few years.
B7 In our business, employees are viewed as the most valuable asset of the business.
3.00 1.10
B11 During difficult economic periods, investments in research and development/innovative projects continue and no significant financial cuts are made.
2.92 1.09
Average 3.35 0.95
Analysis of results
The average mean of business development and improvement is equal to 3.35 with
a standard deviation of 0.95. In relation to this specific variable the strongest agreement
was with statement B8 (mean 3.63) that the employees are highly committed to the
business. Sorted from the largest to smallest mean value (strongest agreement to
weakest or slightly disagreement), the statements ranked in the following order: B10
(mean= 3.58), B5 (mean= 3.57), B9 (mean= 3.50), B6 (mean= 3.27) and lastly, B7
(mean= 3.00). There was one slightly disagreement B11 (mean= 2.92), which indicates
that there may be not significant financial cuts during difficult economic periods.
4.8 FACTOR ANALYSIS
In order to conduct the exploratory factor analysis, the data was divided into two
models: independent variable and dependent variable. In identifying the factors to
extract for each model, the percentage of variance were explained and the individual
factor loadings were considered.
4.8.1 Independent variables
The proposed theoretical dimensions of entrepreneurial orientation had to be confirmed
to meet the research objectives. The matrix pattern is used for a factor analysis of the
entrepreneurial orientation of the participants.

62
KMO test as well as Bartlett’s test of sphericity was conducted to evaluate sampling
adequacy. The KMO accepts results between zero (0) and one (1), with the small
values implying that overall the variables have too little in common to warrant factor
analysis. Results above 0.7 are considered to be acceptable.
The KMO results for the dimensions of entrepreneurial orientation were 0.726.Therefore
the Bartlett’s test of sphericity was significant for this analysis. A number of factor
solutions were investigated. In this investigation guidelines were considered, such as
the Kaizer criterion (Eigen values larger than unity), the screed plot, and the amount of
difference explained by factors, as well as the clarity and size of the factor loadings. The
most important requirement is that the factors should make sense. An analysis was
conducted of the principle-axis factors with direct Oblimin rotation. The factors were
labelled as follows:
Factor one (1): Competitive aggressiveness
Factor two (2): Pro-activeness
Factor three (3): Innovativeness
Factor four (4): Autonomy
Factor five (5): Risk-taking
The results for the participants measuring entrepreneurial orientation as an independent
variable are presented in Table 4.17 below.

63
Table 4.17: Oblimin rotated factor matrix: entrepreneurial orientation
Statement
Factors
Factor 1:Competitive
aggressiveness Factor 2:Pro-
activeness Factor
3:Innovativeness Factor
4:Autonomy
Factor 5:Risk-taking
A26 (Compet)
.792
A18(Risk) .731
A17(Risk) .699
A2(Auto) .570
A27 (Compet)
.531 .327 -.352
A19 (Risk) .513
A15 (Risk) .381
.378
.369
A1(Auto) .360
A23 (Pro-A)
.871
A22 (Pro-A)
.754
A21 (Pro-A)
.753
A10 (Innov)
.691
A20 (Pro-A)
.668
A25 (Compet)
.343 .514
A8(Innov)
.479
A24 (Compet)
.456
.318
A6(Innov)
.643
A13 (Innov) .322
.579 .373
A7(Innov) .381
.578
A12 (Innov)
.823
A4(Auto)
.622 A9 (Innov)
.417 .512
A14 (Innov) .463
.468 A3(Auto)
.421
A11(Innov)
.304
.382 A5(Auto)
.843
A16 (Risk)
.517
Analysis of results
The criterion for factor extraction is that the Eigen-values must be higher than one
(Davies, 2005: 446). Applying this criterion, five factors were extracted in the empirical
factor analysis with which 66.04% of the variance before rotation is explained. After

64
rotation, these factors can be identified as the entrepreneurial orientation’s theoretical
dimensions of competitive aggressiveness, pro-activeness, innovativeness,
autonomy and risk-taking.
Factor one, labelled competitive aggressiveness, consisted of eight statements. Two
statements (A26; A27), that were used to measure the latent variable competitive
aggressiveness, loaded onto factor one. Four statements (A18, A17, A19, A15)
relating to the latent variable risk-taking, were also included. Two statements (A2, A1),
that were used to measure the latent variable autonomy, were also included in factor
one. Participants regarded these statements as related to the factor competitive
aggressiveness. In this regard, competitive aggressiveness refers to the orientation
when an aggressive posture is assumed not only against competitors, but also against
any industry trends that may compromise survival or the company’s competitive
position.
The second factor, labelled pro-activeness, consisted of eight statements. Four of
these statements (A23, A22, A21, A20), that were used to measure the latent variable
pro-activeness, loaded onto factor two as expected. Two statements (A10, A8),
relating to the latent variable innovativeness, were also included. Two statements
(A25, A24), used to measure the latent variable competitive aggressiveness, were
also included in factor two. Participants regarded these statements as related to the
factor pro-activeness. In this regard, pro-activeness refers to the following aspects of
an entrepreneurial orientation: continuous monitoring of market trends and future needs
of customers; opportunities created by these trends and needs that are pursued; the
continually improvement of existing products or services; the on-going provision of new
product or services.
The third factor, labelled innovativeness, consisted of three statements. These three
statements, (A6, A13, A7), that were used to measure the latent variable
innovativeness loaded onto factor three as expected. Participants understood these
statements as relating to the factor innovativeness. For the purpose of this study,

65
innovativeness can be described as follows: the regular introduction of new products,
services or processes; an increased number of services or product offerings during the
past two years; the extent to which these new services, products or processes have
grown within the past few years.
Factor four, labelled autonomy, consisted of six statements. Two statements (A4, A3)
that were used to measure the latent variable autonomy, loaded onto factor four as
expected. Participants did indeed regard these statements as related to the factor
autonomy. Four statements (A12, A9, A14, A11) relating to the latent variable
innovativeness, were also included. For the purpose of this study, autonomy is seen
to refer to the following: employees, managers in particular, who are encouraged to
manage their own work without continuous supervision and who are allowed to be
creative and attempt different methods to perform their tasks efficiently.
Factor five, labelled risk-taking, consisted of two statements. One statement (A16) that
was used to measure the latent variable risk-taking, loaded onto factor five. The other
statement (A5), relating to the latent variable autonomy, was also included. Participants
did indeed understand these statements as related to the factor risk-taking. For the
purpose of this study, risk-taking refers to a positive attribute among employees,
particularly managers; as a consequence, employees are encouraged to take calculated
risks with new ideas without going through elaborate procedures to justify their
orientation or to get approval for these ideas.
4.8.2 Dependent variable
With regard to the second model concerning the dependent variable, an Oblimin oblique
rotation was performed on the principal components of an exploratory factor analysis,
since there was theoretical justification to believe that the factors measuring perceived
success would correlate (Field, 2009: 643).
The Kaiser-Maier-Olkin (KMO) test as well as Bartlett’s test of sphericity was also
conducted in order to evaluate the adequacy of the sampling. KMO accepts results

66
between zero (0) and one (1), with small values meaning that overall the variables have
too little in common to warrant a factor analysis. Results above 0.7 are considered to be
acceptable.
The KMO results for the perceived success were 0.750.Therefore the Bartlett’s test of
sphericity was significant for this analysis. A number of factor solutions were
investigated by considering guidelines such as the Kaizer criterion (Eigen values larger
than unity), the screed plot, and the amount of difference explained by factors, as well
as the clarity and size of the factor loadings. An analysis of principle axis factors was
conducted with a direct Oblimin rotation. The factors were named as follows: business
development and improvement and business growth. The results for the
participants’ perceived success within a pipeline gas company as a dependent variable
are presented in Table 4.18 below.
Table 4.18: Oblimin rotated factor matrix: Perceived success
Factor
Factor 1: Business development and
improvement Factor 2:Business
growth
B7 (Business develop) .926
B6 (Business develop) .783
B9 (Business develop) .728
B10 (Business develop) .661
B5 (Business develop) .600
B4 (Business growth) .590
B11 (Business develop) .586
B8 (Business develop) .436
B2 (Business growth) .935
B1 (Business growth) .900
B3 (Business growth) .329 .381
Analysis of results
The researcher applied the factor extraction criterion according to which the Eigen-
values must be higher than one (Davies, 2005: 446). Thus two factors were extracted in

67
the empirical factor analysis by which to explain 58.43% of the variance before rotation.
After rotation, these factors could be identified as the perceived success of business in
terms of the theoretical variables business development and improvement and
business growth. Table 4.18 above indicates that the statements expected to measure
perceived success divided into two separate factors: business development and
improvement and business growth.
Factor one, labelled business development and improvement, consisted of eight
statements. Seven statements (B7, B6, B9, B10, B5, B11, B8) that were used to
measure the dependent variable business development and improvement loaded
onto factor one as expected. Participants understood these statements as related to the
factor business development and improvement. One statement (B4) relating to the
dependent variable business growth, was also included.
For the purpose of this study, business development and improvement refers to the
following aspects: highly committed employees who are viewed as the most valuable
asset of the business and improved job satisfaction, image of the business, efficiency
and effectiveness over the past few years with continued investments in research and
development or innovative projects, even during difficult economic periods.
The second factor, labelled business growth, consisted of three statements. All three
statements (B2, B1, B3) that were used to measure the dependent variable business
growth, loaded onto factor two as expected. Participants regarded these statements as
related to the factor business growth.
For the purpose of this study, business growth refers to the following variables: growth
in profits, turnover, market share and the competitive position of the business over the
past few years.

68
4.9 DEPENDENT VARIABLE – INDEPENDENT VARIABLE CORRELATIONS
The results of the correlation coefficient between the dependent and independent
variables between the constructs are shown in Table 4.19.
As indicated in the table 4.19, business growth, business development and
improvement as well as dimensions of entrepreneurial orientation were distributed
normally.
Table 4.19: Correlation coefficients between perceived success and dimensions
of entrepreneurial orientation
Competitive aggressiveness
Pro-activeness Innovativeness Autonomy
Risk-taking
Business development
and improvement
Business growth
Competitive aggressiveness 1.000 .609
** .596
** .601
** .161 .751
** .177
Pro-activeness .609
** 1.000 .578
** .627
** .231
* .525
** -.049
Innovativeness .596
** .578
** 1.000 .618
** .250
* .631
** .129
Autonomy .601** .627
** .618
** 1.000 .129 .538
** .039
Risk-taking .161 .231* .250
* .129 1.000 .155 .142
Business development and improvement
.751** .525
** .631
** .538
** .155 1.000 .232
*
Business growth
.177 -.049 .129 .039 .142 .232* 1.000
**. Correlation is significant at the 0.01 level (2-tailed). *. Correlation is significant at the 0.05 level (2-tailed).
As seen in Table 4.19, there is a strong statistically and practically significant correlation
between competitive aggressiveness and pro-activeness, innovativeness and
autonomy as dimensions of entrepreneurial orientation, seeing that the correlation
values are greater than 0.300. There is positive but weak correlation between risk-
taking and competitive aggressiveness, pro-activeness, innovativeness and
autonomy, seeing that the correlation values are less than 0.3 but greater than zero (0).

69
There is a strong statistically and practically significant correlation between business
development and improvement as dependent variable, and competitive
aggressiveness, pro-activeness, innovativeness and autonomy as dimensions of
entrepreneurial orientation and also independent variables, seeing that the correlation
values are greater than 0.300. A weaker correlation can be pointed out between
business development and improvement and risk-taking, seeing that the correlation
values are less than 0.3 but greater than zero (0).The variable business growth shows
no correlation with the dimensions of entrepreneurial orientation: competitive
aggressiveness, pro-activeness, innovativeness, autonomy and risk-taking.
4.10 T-TEST
An independent t-test was used to test for p-values of statistical significance and the d-
values or the effect size between the opinion of the selected frequency variables and
the different variables measuring perceived success of a business, and measuring
entrepreneurial orientation. For the purpose of this study, a conservative approach was
used where the t-test does not assume equal variances (Elliot and Woodward, 2007: 59).
For this research, the following were measured: the relationship between age group and
gender, five independent variables of entrepreneurial orientation and the two dependent
variables of perceived success among managers of a pipeline gas company enterprise.
4.10.1 Gender
A t-test was conducted to ascertain whether males and females responded differently to
the sections. The p-value and d-values (effect sizes) of the t-test are indicated in Table
14.20 below. The questionnaire was completed by 65 males and 19 females.

70
Table 4.20: Results of the t-test for gender
N Mean Std.
Deviation p
value Effect Size
Competitive aggressiveness Male 65 3.343 0.615 0.12 0.39
Female 19 2.947 1.001
Pro-activeness Male 65 3.112 0.764 0.02 0.52
Female 19 2.586 1.004
Innovativeness Male 65 3.397 0.858 0.32 0.26
Female 19 3.175 0.834
Autonomy Male 65 3.305 0.670 0.12 0.38
Female 19 3.026 0.725
Risk-taking Male 65 3.146 0.842 0.05 0.50
Female 19 2.711 0.871
Business development improvement
Male 65 3.479 0.649 0.03 0.52
Female 19 3.106 0.716
Business growth Male 65 4.462 0.502 0.51 0.14
Female 19 4.368 0.656
The results of the t-test for gender, indicates that the p-values for pro-activeness
(0.02), risk-taking (0.05) and business development and improvement (0.03). The
variables are not greater than 0.05, which means that the participants answered the
questions statistically in a significantly different manner. For the other variables, the p-
values are greater than 0.05, which indicates that the participants answered the
questions statistically significantly in a similar manner.
The effect size (d) for the variables pro-activeness (0.52), risk-taking (0.50) and,
business development and implementation (0.52), have d-values that are greater
and equal to 0.5. This indicates medium effect in terms of significant difference between
males and females. For all the other variables no statistical significance difference was
indicated between males and females.
4.10.2 Age group
Table 4.21 indicates the results of the mean values, p-values and effect sizes (d-values)
for the dimensions of entrepreneurial orientation and perceived success of the pipeline
gas company as a function of the age group. The questionnaire was completed by 10

71
participants’ ≤29 age group, 40 participants’ between 30-39 age group, 21 participants
between 40-49 age group and 13 participants older than 50 years.
Table 4.21: Results of the T-test for age group
N Mean Std.
Deviation p value
Effect Size
≤29 with
30 - 39 with
40 - 49 with
Competitive aggressiveness
≤29 10 2.3500 .79451
0.00
30 - 39 40 3.2924 .69712 1.19
40 - 49 21 3.3095 .53124 1.21 0.02
50+ 13 3.7363 .49370 1.74 0.64 0.80
Total 84 3.2532 .73241
Pro-activeness ≤29 10 2.3000 .94502
0.01
30 - 39 40 3.1573 .82752 0.91
40 - 49 21 2.8214 .71433 0.55 0.41
50+ 13 3.2981 .75955 1.06 0.17 0.63
Total 84 2.9931 .84727
Innovativeness ≤29 10 2.7333 .73367
0.06
30 - 39 40 3.3333 .94883 0.63
40 - 49 21 3.4921 .67181 1.03 0.17
50+ 13 3.6282 .71412 1.22 0.31 0.19
Total 84 3.3472 .85267
Autonomy ≤29 10 2.6833 .80297
0.02
30 - 39 40 3.2792 .66387 0.74
40 - 49 21 3.2222 .67769 0.67 0.08
50+ 13 3.5897 .44936 1.13 0.47 0.54
Total 84 3.2421 .68860
Risk-taking ≤29 10 2.5500 .59861
0.04
30 - 39 40 3.2625 .77615 0.92
40 - 49 21 2.7857 .81504 0.29 0.58
50+ 13 3.1923 1.14634 0.56 0.06 0.35
Total 84 3.0476 .86296
Business Development Improvement
≤29 10 2.8143 .58559
0.02
30 - 39 40 3.4063 .68684 0.86
40 - 49 21 3.4617 .56886 1.11 0.08
50+ 13 3.6951 .68642 1.28 0.42 0.34
Total 84 3.3943 .67887
Business Growth
≤29 10 4.5333 .54885
0.44
30 - 39 40 4.5083 .51743 0.05
40 - 49 21 4.2857 .62615 0.40 0.36
50+ 13 4.4103 .43363 0.22 0.19 0.20
Total 84 4.4405 .53813

72
The p-values for innovativeness is higher than 0.05. This indicates that there was no
statistically significant difference in the way participants of the various age groups
responded to the questions. This indicates that there was a statistically significant
difference in the way the different age groups responded to the questions.
The results of the effect sizes indicate that the d-values for all the variables for age
group ≤29 and ≥50 years old had a higher than 0.3 value. This means the effect size
indicated a medium and larger statistically significant difference.
4.11 SUMMARY
In this chapter the results of the empirical research were presented and discussed in
terms of the quantitative results. Two questionnaires were administered, namely the one
measuring entrepreneurial orientation variables and the one measuring the perceived
success amongst managers of a pipeline gas company. Biographical questionnaires
were developed to gather the demographical data of the participants. Five factors were
extracted from the entrepreneurial orientation variable, which accounted or 66.06% of
the total variance. The factors were labelled competitive aggressiveness, pro-
activeness, innovativeness, autonomy and risk-taking. Two factors were extracted
from the perceived success of a business, which accounted for 58.43% of the total
variance.
The internal consistency and reliability of the participants were tested with Cronbach’s
alpha coefficients and only risk-taking was found to be less than 0.7 but higher than
0.6, therefore all variables were included in the study. Cronbach’ alpha coefficients were
found to be acceptable, which shows that a large portion of the variance is explained by
the variables.
Results indicated that the research could accept a correlation between dimensions of
entrepreneurial orientation and one variable of a business’ perceived success,
business development and improvement and business growth.

73
5 CHAPTER 5
CONCLUSION AND RECCOMENDATIONS
5.1 INTRODUCTION
The purpose of this chapter is to provide conclusions for and recommendations on the
results obtained in the empirical study of this research. Conclusions are drawn
regarding study objectives and the limitations that were identified throughout the course
of the study are also discussed. Practical recommendations will be discussed to
improve the entrepreneurial orientation within a business enterprise. Lastly
recommendations will be presented for future research.
5.2 CONCLUSIONS
The objective of the study was to investigate the relationship between the
entrepreneurial orientation of managers within a specific pipeline gas company and their
perceived success of the business. The conclusions and recommendations on the
entrepreneurial orientation are presented in this chapter. This consists of the conclusion
drawn from the biographical data of the participants, the variable of entrepreneurial
orientation and managers’ perceived success of the business. It also measures the
reliability of the questionnaire and the correlation between the entrepreneurial
orientation and perceived success.
5.2.1 Conclusions on the biographical data of participants
Participants’ information was obtained regarding their age, gender, race, position level,
qualification and department. From the demographical information the following
conclusions were drawn:

74
As much as 87.63% of the managers returned the completed questionnaires. Of
these 48.24% were managers within the age group of 30-39 years old. There
was an almost equal split between managers in the ≤ 29 years range (11.76%)
and managers in the 50 to 59 years range (12.94%). The findings were that a
majority of managers at this pipeline gas company are younger than 49 years
(84.71%), and about 60% younger than 39 years. This indicates that young
people are persuaded to follow management careers in this company, which
could impact positively on the dimensions of entrepreneurial orientation within
this business enterprise.
The results of the gender probe suggest that managers at this pipeline gas
company make up a male dominated organisation in which male managers
comprise 77.65%
Most managers, who participated, are from the black race (56.47%), followed by
the white race (28.24%). This indicates that diversity in race could impact
positively on the dimensions of entrepreneurial orientation.
The largest group (36.47%) of the participants has a post-graduate qualification
and 34.12% have a three year degree, which is indicative of the company’s
requirements.
The largest group (47.06%) of participants are from the senior Level (5B-4) of
management, followed by middle (7-6C) management (44.71%). This indicates
that managers implement strategies for the company to succeed.
The company that was researched has 10 departments, of which Production
(24.71%) is the largest one. This indicates that the production team delivers the
services or product to the customers and hence can impact positively on the
company’s success.
5.2.2 Conclusions on the reliability of the questionnaire
Cronbach’s alpha coefficients were measured to determine the questionnaire’s
reliability. It was found that only one variable, risk-taking, has a Cronbach-alpha
coefficient lower than 0.7, but within the range of 0.6 to 0.7. Therefore this variable was
included in the study.

75
The results suggest that the measuring instrument of Cronbach’s alpha coefficients,
which was used to measure perceived success and entrepreneurial orientation at the
pipeline gas company was reliable. Only three variables scored higher than 0.8
Cronbach-alpha coefficients, which imply that the internal consistency of the
questionnaire is good.
5.2.3 Conclusions on entrepreneurial orientation
The Conclusions will be categorised in accordance with the individual variables or
dimensions of entrepreneurial orientation.
5.2.3.1 Innovativeness
The variable innovativeness has the highest rating and obtained a mean value of
(mean=3.30), the statements A12, A9 and A13 scored the highest. This indicates a
strong emphasis on continuous improvement of products, services and processes, the
business is continually pursuing new opportunities, and that innovation is considered to
be a necessity for the future of the business. Although innovativeness obtained the
highest mean value, there are still room for improvement.
According to Lotz (2009: 284), the result of a successful innovative management
programme will be that innovative projects will develop from ideas and needs into
concepts which the business launches. An innovative management programme needs
to be launched in order for the pipeline gas company to improve the innovativeness in
their business.
5.2.3.2 Autonomy
The variable autonomy obtained the second highest rating of mean values
(mean=3.27) and the lowest standard deviation value of 0.94.This indicates that
autonomy is also has the strongest effect on entrepreneurial orientation particularly in
this pipeline gas company. Standard deviation indicates that participants’ views are
relatively less spread and some participants did experience autonomy in the

76
workplace. Regarding the statement A1 (mean=4.13), managers agrees that individuals
have enough autonomy in their job without continual supervision to do their work.
In contrast to autonomy the participants view statement A5 (mean=2.29) in a positive
light. This indicates that most managers are still following the same work methods or
steps while performing their day to day task. Attention has to be given to routine work,
seeing that autonomy can also impede the development of an entrepreneurial
orientation in the business.
5.2.3.3 Competitive aggressiveness
The variable competitive aggressiveness (mean=3.14) obtained the third ranking with
respect to entrepreneurial orientation with a mean value of above average. The mean
values of the different statements that measure competitive aggressiveness range
from 2.99 to 3.43, which all indicate a positive agreement with the statements. This is in
line with study by Dafel (2012), who found Competitive aggressiveness not to have any
significant influence on the perceived success of an agri-business. It also disagrees with
the study done by Lotz and Van der Merwe (2013), Lumpkin and Dess (2001) as well as
by Lumpkin et al. (2010), who determined that no relationship exists between the
variable competitive aggressiveness and the dependant variables of perceived
success.
5.2.3.4 Pro-activeness
The variable pro-activeness had a mean value (mean=3.02) and obtained the fourth
ranking, which is second lowest for the participants. Participants were in disagreement
with statements A20 and A21. This implies that this pipeline gas company is not the first
to introduce new products or processes, and the managers in question does not
typically initiates actions which competitors respond to.
Pro-activeness it can create a first-move advantage whereby a business can obtain a
favourable market-share standing, which will be hard for other companies to duplicate,
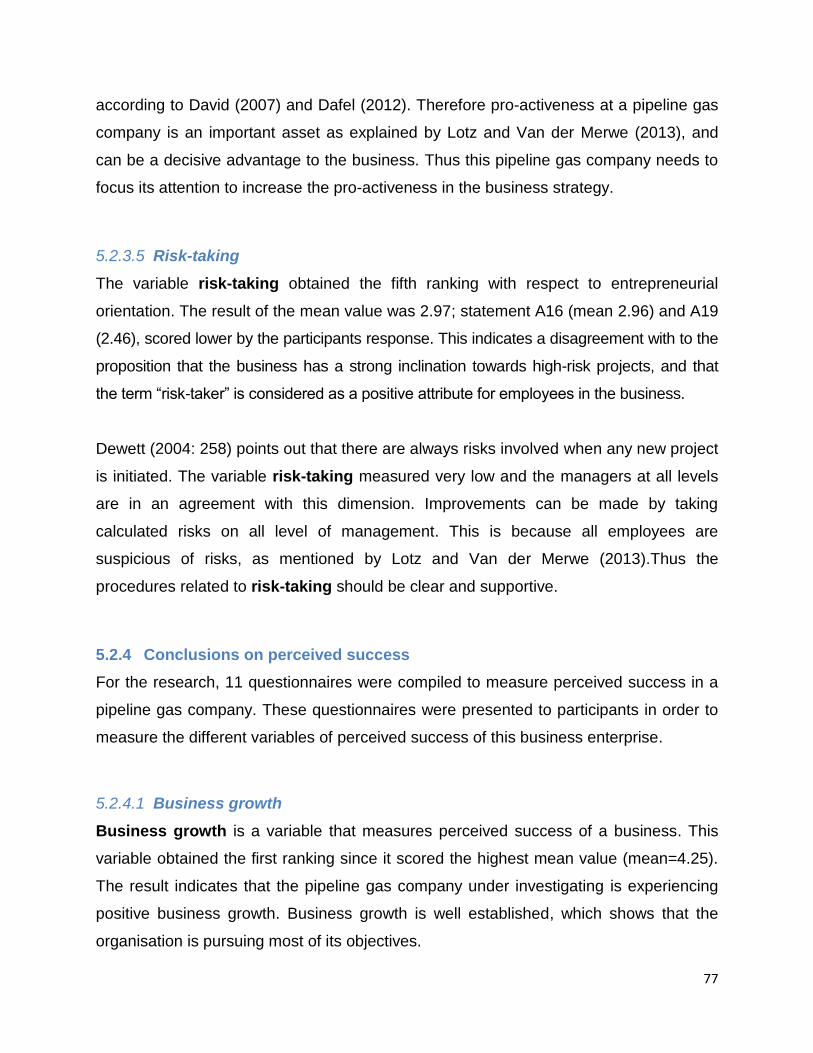
77
according to David (2007) and Dafel (2012). Therefore pro-activeness at a pipeline gas
company is an important asset as explained by Lotz and Van der Merwe (2013), and
can be a decisive advantage to the business. Thus this pipeline gas company needs to
focus its attention to increase the pro-activeness in the business strategy.
5.2.3.5 Risk-taking
The variable risk-taking obtained the fifth ranking with respect to entrepreneurial
orientation. The result of the mean value was 2.97; statement A16 (mean 2.96) and A19
(2.46), scored lower by the participants response. This indicates a disagreement with to the
proposition that the business has a strong inclination towards high-risk projects, and that
the term “risk-taker” is considered as a positive attribute for employees in the business.
Dewett (2004: 258) points out that there are always risks involved when any new project
is initiated. The variable risk-taking measured very low and the managers at all levels
are in an agreement with this dimension. Improvements can be made by taking
calculated risks on all level of management. This is because all employees are
suspicious of risks, as mentioned by Lotz and Van der Merwe (2013).Thus the
procedures related to risk-taking should be clear and supportive.
5.2.4 Conclusions on perceived success
For the research, 11 questionnaires were compiled to measure perceived success in a
pipeline gas company. These questionnaires were presented to participants in order to
measure the different variables of perceived success of this business enterprise.
5.2.4.1 Business growth
Business growth is a variable that measures perceived success of a business. This
variable obtained the first ranking since it scored the highest mean value (mean=4.25).
The result indicates that the pipeline gas company under investigating is experiencing
positive business growth. Business growth is well established, which shows that the
organisation is pursuing most of its objectives.

78
5.2.4.2 Business development and improvement
The variable business development and improvement has obtained a second
ranking for the perceived success of the business, by scoring the mean value of 3.35.
The statements used to measure the variable business development and
improvement indicated a mean value ranging from 2.92 to 3.63.
The statements B7 (mean=3.00) and B11 (mean=2.92), scored close to neutral value.
This indicates disagreement that employees are viewed as the most valuable asset of
the business and that investments in research and development projects continue, with
no financial cuts during difficult economic periods. This is an important challenge that
this pipeline gas company needs to rectify, to ensure the commitment of the employees
towards the objectives of the business.
5.2.5 Conclusions on the correlation between variables of entrepreneurial
orientation and those of perceived success
One of the objectives of the present study was to determine the relationship between
entrepreneurial orientation and the managers’ perceived success of the business.
Overall the result indicates that business development and improvement has a
positive and effective relationship with entrepreneurial orientation variables, seeing that
the results are above 0.3 (the value set for practical significance)., These findings are
supported by Lotz and Van der Merwe (2013), who found that positive relationships
exist between the entrepreneurial orientation factors and business development and
improvement.
The results thus show that managers in the participating business perceived the
following factors of entrepreneurial orientation to influence business development and
improvement: i.e. pro-activeness, autonomy, innovativeness and competitive
aggressiveness.

79
The pipeline gas company is a business that monitors market trends and future needs
of customers; is pursuing opportunities created by these trends and needs to improve
its services, encouraging its employees to manage their own work without continual
supervision and allow them to be creative and flexible. Therefore this company is more
likely to experience an increased efficiency and effectiveness of the business, an
improved company image and highly committed employees, which means increased job
satisfaction.
The variable business growth shows a positive but weaker relationship with all the
variables of entrepreneurial orientation, of which all the correlation values are less than 0.3.
5.3 RECOMMENDATIONS
To enhance the entrepreneurial orientation within the pipeline gas company under
investigation, the following recommendations are put forward:
Entrepreneurial orientation has its roots in the business strategy. Therefore it is
recommended that this company makes entrepreneurship the strategic way of
thinking and include this orientation in the formulation of the values or vision of
the company.
Managers should focus their efforts on initiatives to become more pro-active.
They should understand and utilise the strong positive relationship between
business development and improvement and pro-activeness.
Managers must also improve their level of innovativeness, competitive
aggressiveness and autonomy. The strong correlation between the variables
autonomy, competitive aggressiveness and innovativeness and business
development and improvement should be kept in mind and utilised.
The risk-taking behaviour for this company needs to be encouraged. This can
be done by conveying to employees that risk-taking behaviour is acceptable,
even if it evokes the image of failure. Initially the employees will be sceptical and
it is necessary to set up rules to encourage risk-taking, they are afraid of failure

80
and to be reprimanded by management. If a risk fails someone has to take the
blame. This seems to be the way corporative management works.
New ideas and opportunities need to be turned into new products, services or
processes by setting goals and objectives. This will results in incremental as well
as intemperate innovations.
Finally the pipeline gas company must create opportunities for an entrepreneurial
orientation to inform the bottom line of the business. This can be achieved by focusing
on linking business growth to entrepreneurship and by analysing the trends for each
innovation that is created. There is a perception that some employees do not feel they
are a valuable asset to the business. The management in this pipeline gas company
needs to rectify this view throughout the organisation, by giving preference to the
entrepreneurial orientation.
5.4 ACHIEVEMENT OF THE OBJECTIVES
The measuring of the present study’s success is based on the achievement of the
primary and secondary objectives, as indicated in section 1.3 of this study.
5.4.1 Primary objective
The primary objective of the study was to investigate the relationship between the
entrepreneurial orientation of the pipeline gas company and the managers’ perceived
success of the business. The research was done with the aim of providing suggestions
on improving the entrepreneurial orientation, upturning the innovation and to be more
competitive. This objective was achieved as attested by chapter four, in which the
results were analysed and by realising the secondary objectives of the study.
5.4.2 Secondary objectives
The secondary objectives in support of the primary objective of this research are
formulated as follows:

81
To gain insight into entrepreneurship through conducting a literature study.
Evaluation: achieved in chapter two.
To study the concept of entrepreneurial orientation.
Evaluation: achieved in chapter two.
Use statistical analysis to determine the reliability of the questionnaire.
Evaluation: achieved in chapter four.
To determine the correlation between entrepreneurial orientation and the
perceived success of business.
Evaluation: achieved in chapter four.
To measure the current entrepreneurial orientation in the pipeline gas company
by means of a questionnaire.
Evaluation: achieved in chapter four.
To determine the demographic differences in terms of age, gender, race,
qualification and department, as well as the constructs measuring the
entrepreneurial orientation.
Evaluation: achieved in chapter four.
To determine the perceived success of the business.
Evaluation: achieved in chapter four.
To make recommendations for future research and practice.
Evaluation: achieved in chapter five.
5.5 SUGGESTIONS FOR FURTHER RESEARCH
Only managers of the pipeline gas company participated in the research by answering
the questionnaires. The study was limited to South Africa, and only managers employed
by a single company were participating. The challenges for other companies working in

82
the pipeline-gas sector might be completely different, therefore the results of this study
cannot be generalised to all the exponents of a pipeline gas company.
A suggestion for further study would be to conduct similar studies in other exponents of
such a pipeline gas company. It would also widen the scope to include employees at
shop floor level, other than management and its view. Or the view of both levels can be
researched and the outcomes compared.
5.6 SUMMARY
This chapter provided conclusions, on the various aspects that were investigated in this
study. These include: the biographical data of the participants, the reliability of the
questionnaires, the variables of entrepreneurial orientation and perceived success, as
well as the correlation between them. The limitations of the research were pointed out
and recommendations were made for the pipeline gas company to follow up, as well as
suggestions for future research in this business sector. To sum up: All the theoretical
and empirical objectives that were formulated for this research have been attained.

83
6 BIBLIOGRAPHY
Agrawal, A. & Srivastava, N. 2010. Factors supporting corporate
entrepreneurship: An exploratory study. The Journal of Business Perspective,
14(3): 163-171.
Amabile, T.M., Conti, R., Coon, H., Lazenby, J. & Herron, M. 1996. Assessing
the work environment for creativity. Academy of Management Journal, 39(5):
1154-1185.
Antoncic, B. & Hisrich, R.D. 2003. Clarifying the intrapreneurship concept.
Journal of Small Business Enterprise Development, 10(1): 7-24.
Antoncic, B. & Hisrich, R.D. 2001. Entrepreneurship: Construct refinement and
cross-cultural validation. Journal of Business Venturing, 16(15): 496-502.
Bhardwaj, B.R., Sushil & Momaya, K. 2007. Corporate Entrepreneurship Model:
A source of competitiveness, Indian Management Review: Indian Institute of
Management Bangalore Journal, 131-145.
Bless, C. & Higson-Smith, C. 2000. Fundamentals of social research. Methods:
an African perspective. 3rd ed. Cape Town: Juta.
Block, Z. & Macmillan, I.C. 2003. Corporate venturing, creating new business
within the firm. Washington, DC: Beard books.
Cameron, S. & Price, D. 2009. Business research methods: A practical
approach. London: Chartered Institute of Personnel and Development.
Chang, S.C., Lin, R.J., Chang, F.J. & Chen, R.H. 2007. Achieving manufacturing
flexibility through entrepreneurial orientation, Industrial Management and Data
Systems, 107(7): 997-1017.
Chow, I.H. 2006. The relationship between entrepreneurial orientation and
performance in China, SAM Advanced Management Journal, 71(3): 11-20.

84
Cohen, J. 1988. Statistical power analysis for the behavioral science. 2nd ed.
Lawrence Erlbaum Associates.
Cohen, A.R. 2004. Building a company of leaders. Leader to Leader, 34(90):
1-5.
Cook, T.D. & Reichardt, C.S. 1979. Qualitative and quantitative methods in
evaluation research. Beverly Hills, CA: Sage Publication.
Covin, J.G. & Slevin, D.P. 1989. Strategic management of small firms in a
hostile and benign environment, Strategic Management Journal, 10(1): 75-87.
Creswell, J.W. 1994. Research Design: Qualitative, quantitative and mixed
methods approaches. Thousand Oaks, CA: Sage Publication.
Dafel, F.P. 2012. An assessment of entrepreneurial orientation in an agri-
business. Potchefstroom: North-West University. Unpublished Master’s
dissertation.
David, F.R. 2007. Strategic management: Concepts and cases. 11th ed. Upper
Saddle River, NJ: Prentice Hall.
Davies, D. 2005. Business research for decision making. 6th ed. Belmont,
CA: Thomson Learning.
Deloittes, 2008. In the Dark: Deloitte studies non-financial metrics in measuring
company performance.
De Nobrega, C. 2012. An assessment of the entrepreneurial orientation of
pharmacists in Gauteng, Potchefstroom: North-West University. Unpublished
Master’s dissertation.
Denscombe, M. 2002. Ground rules for good research: A 10 point guide for
social researchers. Buckingham: Open University Press.

85
Dess, G.G., Ireland, R.D., Zahra, S.A., Floyd, S.W., Janney, J.J. & Lane, P.J.
2003. Emerging issues in corporate entrepreneurship, Journal of Management,
29(3): 351-378.
Dess, G.G., & Lumpkin, G.T. 2005. The role of entrepreneurial orientation in
stimulating effective corporate entrepreneurship. Academy of Management
Executive, 19(1): 147-156.
Dess, G., Lumpkin, G. & Covin, J.G. 1997. Entrepreneurial strategy making and
firm performance: Test of contingency and configurational models. Strategic
management Journal, 18(9): 677-695.
Dewett, T. 2004. Employee creativity and role of risk. European Journal of
Innovation Management, 7(4): 257-266.
Elliot, A.C. & Woodward, W.A. 2007. Statistical analysis quick reference
guidebook with SPSS example. London: sage.
Fattal, T. 2003. Intrapreneurship at work: Championing projects to push
innovation in your company. CMA Magazine, 14 Nov.
Field, A. 2009. Discovering statistics using SPPS. London: SAGE Publications.
Field, A. 2005. Discovering statistics using SPPS (Introducing the statistical
method). London: SAGE Publications.
Frese, M., Brantjes, A. & Hoorn, R. 2002. Psychological success factors of small
scale business in Namibia: The roles of strategy process, entrepreneurial
orientation and the environment. Journal of Development Entrepreneurship,
7(3): 259-282.
Gartner, W.B. 1990. What are we talking about when we talk about
entrepreneurship? Journal of Business Venturing, 5: 15-28.

86
Govender, D. 2010. An assessment of corporate entrepreneurship in a
petrochemical company. Potchefstroom: North West University.
Gürbüz, G. & Aykol, S. 2009. Entrepreneurial management, entrepreneurial
orientation and Turkish small firm growth. Management Research News, 32(4):
321-336.
Hamel, G. & Prahalad, C.K. 2002. Computing for the future. New Delhi: Tata
McGraw Hill.
Hayton, J.C. 2005. Promoting corporate entrepreneurship through human
resources management practices: A review of empirical research, Human
Resource Management Review, 15(10): 21-41.
Hebert, R.F & Link, A.N. 2009. A history of entrepreneurship. International
Journal of Business and Social Science, 2(9): 241-242.
Hisrich, R. D. & Peters, M. P. 1998. Entrepreneurship, 4th edition. Boston, MA:
Irwin McGraw-Hill.
Hisrich, R., Peters, M. & Sherpherd 2005. Entrepreneurship, Boston, MA: Irwin
McGraw-Hill, 591.
Hitt, M.A., Nixon, R.D., Hoskisson, R.E. & Kochhar, R. 1999. Entrepreneurship
Theory and Practise, 23(3): 145-167, Spring.
Hornsby, J.S., Kuratko, D.F. & Zahra, S.A. 2002. Middle managers perception of
the internal environment for corporate entrepreneurship: assessing a
measurement scale. Journal of Business Venturing, 17(3): 253-273.
Ireland, R.D., Covin, J.G & Kuratko, D.F. 2009. Conceptualizing corporate
entrepreneurship strategy. Entrepreneurship Theory and Practice, 33(1): 19-46.
Ireland, R.D., Kuratko, D.F. & Morris, M.H. 2006. A health audit for corporate
entrepreneurship: Innovation at all levels. Part I, Journal of Business Strategy,
27(1): 10-17.

87
Ireland, R.D. & Webb, J.W. 2009. Crossing the great divide of strategic
entrepreneurship: Transitioning between exploration and exploitation, Business
Horizons, 52(5): 469-479.
Katz, A. & Shepherd, D.A. 2003. Cognitive approaches to entrepreneurship
research: Advances in entrepreneurship, firm emergence and growth. Oxford:
JAI Press. Volume 6: 315-372.
Kent, R. 2007. Marketing research: Approaches, methods, and applications in
Europe. London: Thomson Learning.
Kreitner, R. & Kinicki, A. 2007. Organisational behaviour. 7thed. New York, NY:
McGraw-Hill.
Kropp, F., Lindsay, N.J. & Shoham, A. 2008. Entrepreneurial orientation and
international entrepreneurial business venture start-up, International Journal of
Entrepreneurial Behaviour and Research, 14(2): 102-117.
Kuratko, D.F. & Audretsch, D.B. 2009. Strategic entrepreneurship: Exploring
different perspectives of an emerging concept. Entrepreneurship Theory and
Practice, 33(1): 1-17, January.
Kuratko, D.F. & Hodgetts, R.M. 2004. Entrepreneurship: Theory, process and
practice.6th ed. Mason, OH: Thompson South-Western.
Lassen, A.H., Gertsen, F. & Riss, J.O. 2006. The nexus of corporate
entrepreneurship and radical innovation. Creativity and Innovation Management,
15(4): 359-372.
Leedy, P.D. 1997. Practical research planning and design. 6th ed. Upper Saddle
River, NJ: Prentice Hall.
Leedy, P.D. & Ormrod, J.E. 2005. Practical research: Planning and design.
8th ed. Upper Saddle River, NJ: Prentice Hall.

88
Longenecker, J.G., Moore, C.W. & Petty, J.W. 2000. Small business
management: An entrepreneurial emphasis. 11th
ed. Mason, OH: Thomson
South-Western.
Lotz, H.M. 2009. An assessment of determinants of corporate entrepreneurship
in agricultural businesses: An integrated framework. Unpublished Doctoral
thesis, North-West University, Potchefstroom.
Lotz, H.M. & Van der Merwe, S.P. 2013. An investigation of the influence of
entrepreneurial orientation on the perceived success of agri-business in South
Africa. South African Journal of Business Management, 44(1): 15-32.
Lumpkin, G. T., & G. G. Dess. 1996. Clarifying the entrepreneurial orientation
construct and linking it to performance. Academy of Management Review, 21(1):
135-172.
Lumpkin, G. T., & G. G. Dess. 2001. Linking two dimensions of entrepreneurial
orientation to firm performance: The moderating role of environment and
industry life cycle, Journal of Business Venturing,16(1): 429-451.
Lumpkin, G.T., Cogliser, C.C. & Schneider, D.R. 2009. Understanding and
measuring autonomy: An entrepreneurial orientation perspective.
Entrepreneurship Theory and Practice, 33(1): 44-69
Madsen, E.L. 2007. The significance of sustained entrepreneurial orientation on
performance of firms – a longitudinal analysis. Entrepreneurship and Regional
Development, 19(3): 185-204.
Malhotra, N.K. 2007. Marketing research: An applied orientation. 5th ed. Upper
Saddle River, NJ: Pearson Education.

89
McAdam, R. & McClelland, J. 2002. Individual and team-based idea generation
within innovation management: Organisational and research agendas.
European Journal of Innovation Management, 5(2): 86-97.
McFadzean, E., O’Loughlin, A. & Shaw, E. 2005. Corporate entrepreneurship
and innovation part 1: The missing link. European Journal of Innovation
Management, 8(3): 350-372.
Megginson, W.L., Smart, S.B. & Graham, J.R. 2009. Financial management.
3rd ed. Mason, OH: Thompson South-Western. CENGAGE learning.
Miller, D. 1983. The correlates of entrepreneurship in three types of firms,
Management Science, 29(7): 770-791.
Miller, D. 2011. A reflection of EO, research and some suggestions for the
future, Entrepreneurship Theory and Practice, 35(5): 873-894.
Morena, A.M. & Casillas, J.C. 2008. Entrepreneurial orientation and growth of
SME’s: A casual model, Entrepreneurship Theory Practice, 32(30): 507-528.
Morris, M.H., Kuratko, D.F & Covin, J.G. 2008. Corporate entrepreneurs and
innovation: Entrepreneurial development within organisations. 2nd ed. Mason,
OH: South-Western.
Morris, M.H. & Kuratko, D.F. 2002. Corporate entrepreneurship. Orlando, FL:
Harcourt College Publishers.
Mullins, J.W. & Forlani, D. 2005. Missing the boat or sinking the boat: A study of
new venture decision making, Journal of Business Venturing, 20(1): 47-69.
Oosthuizen, J.H. 2006. An integrated framework to improve the entrepreneurial
climate in the South African mining industry. Potchefstroom: North West
University. Unpublished Doctoral thesis.

90
Ramachandran, K., Devarajan, T.P. & Ray, S. 2006. Corporate
entrepreneurship: How? The Journal for Decision-makers,31(1): 85-97.
Rao, J. 2004. The discipline of corporate entrepreneurship. Boston, MA: Babson
College.
Rauch, A., Wiklund, J., Lumpkin, G.T. & Frese, M. 2009. Entrepreneurial
orientation and business performance: An assessment of past research and
suggestions for the future, Entrepreneurship Theory and Practice, 33(3): 761-
787.
Raugh, A. & Friese, M. 2007. Let’s put the person back into entrepreneurship
research: A meta-analysis on the relationship between business owner’s
personality traits, business creation and success. European Journal of Work and
Organizational Psychology, 16(4): 352-285.
Scheepers, M.J., Bloom, J.Z. & Hough, J. 2008. Development of an instrument
to assess the enacted environment for corporate entrepreneurship in South
Africa. Management Dynamics; 17(4): 2-17.
Scheepers, M.J., Hough, J. & Bloom, J.Z. 2008. Nurturing the corporate
entrepreneurship capability. Southern African Business Review, 12(3): 50-75.
Schillo, S. 2011. Entrepreneurial orientation and company performance: Can the
academic literature guide managers?, Technology Innovation Management
Review, 2011: 20-25.
Schumpeter, J.A. 1934. The theory of economic development. New Brunswick,
NJ: Transaction Publishers.
Schmitt, N. 1996. Uses and abuses of coefficient alpha. Psychological
Assessment, (4): 50-53.

91
Sekaran, U. 2000. Research methods for business: A skill building approach.
3rded. New York, NY: John Wiley.
Shane, S., Locke, E.A. & Collins, C.J. 2003. Entrepreneurial motivation. Human
Resource Management Review, 13: 257-279.
Spinelli, S. & Adams, R. 2012. New venture creation: Entrepreneurship for the
21st century. Int. ed. New York, N.Y: McGraw-Hill.
SPSS Inc 2007. SPSS 16.0 for Windows, release 16.0.0, Copyright by SPPS
Inc., Chicago, Illinois. www.spss.com.
Statistics South Africa. 2009. Mid-year population estimates. Statistics South
Africa. p.17.
Steyn, H.S. 1999. Praktiese betekenisvolheid: Die gebruik van affekgrottes.
Wetenskaplike bydraes reeks B: Natuurwetenskappe Nr.117. Potchefstroom:
NWU.
Struwig, F.W. & Stead, G.B. 2004. Planning, designing and reporting research.
Cape Town: Pearson Education.
Teo, T.S.H. & King, W.R. 1996. Assessing the impact of integrating business
planning and Information system planning. Information and Management, 30(6):
309-321.
Timmons, J.A. & Spinelli, S. 2009. New venture creation: Entrepreneurship for
the 21st century. 8th ed. New York, N.Y: McGraw-Hill.
Trochim, W.M. 2000. The research methods’ knowledge base.
http://www.socialresearchmethods.net/kb/ Date of access: 28 Jun.2013
Tustin, D.H., Lightelm, A.A, Martins, J.H. & Van Wyk, J. 2005. Marketing
research in practice. Pretoria: University of South Africa Press.

92
Van der Merwe, S.P. & Oosthuizen, J.H. 2008. An entrepreneurial climate in the
South African mining industry: Middle management perspective. North- West
University, Potchefstroom. Unpublished article.
Van der post, W.Z. 1997. The relationship between organisational culture and
financial performance among industrial organisations listed on the JSE.
Unpublished DBA-dissertation, University of Stellenbosch, Graduate Business
school, Bellville.
Van Wyk, R. & Adonisi, M. 2012. Antecedents of corporate entrepreneurship.
South African Journal of Management, 43(3): 65-78.
Welman, C., Kruger, F. & Mitchell, B. 2005. Research methodology 3rd ed. Cape
Town: Oxford University Press.
Wiese, J.W. 2009. An assessment of corporate entrepreneurship in the risk and
insurance sector. Potchefstroom: North-West University.
Wiklund, J. & Sherperd, D. 2003. Knowledge-based resources, entrepreneurial
orientation and performance of small and medium-sized business, Strategic
Management Journal, 24(13): 1307-1314.
Whitelaw, P.A. 2001. Reliability and validity: The terrible twins of good research.
MLQ Network newsletter, November: 108-110.
Yamada, K. & Eshima, Y. 2009. Impact of entrepreneurial orientation:
Longitudinal analysis of small technology firms in Japan, Academy of
Management Proceedings.
Zahra, S.A., Jennings, D.F. & Kuratko, D.F. 1999. The antecedents and
consequences of firm-level entrepreneurship: The state of the field,
Entrepreneurship Theory and Practice, 24(2): 45-65.

93
7 APPENDIX: A
SECTION A: ENTREPRENEURIAL ORIENTATION QUESTIONNAIRE
Str
on
gly
dis
ag
ree
Dis
ag
ree
Ne
ith
er
Ag
ree
no
r
dis
ag
ree
Ag
ree
Str
on
gly
Ag
ree
A01 I have enough autonomy in my job without continual
supervision to do my work.
1 2 3 4 5
A02 Our business allows me to be creative and try different
methods to do my job.
1 2 3 4 5
A03 Employees in our business are allowed to make decisions
without going through elaborate justifications and approval
procedures.
1 2 3 4 5
A04 Employees in our business are encouraged to manage
their own work and have flexibility to resolve problems.
1 2 3 4 5
A05 I seldom have to follow the same work methods or steps
while performing my major tasks from day to day.
1 2 3 4 5
A06 Our business regularly introduces new services or/and
products or/and processes.
1 2 3 4 5
A07 Our business places a strong emphasis on new and
innovative products or/and services or/and processes.
1 2 3 4 5
A08 Our business has increased the number of products or
services offered during the past two years.
1 2 3 4 5
A09 Our business is continually pursuing new opportunities. 1 2 3 4 5
A10 Over the past few years, changes, in our processes,
services and product lines have been quite dramatic.
1 2 3 4 5
A11 In our business there is a strong relationship between the
number of new ideas generated and the number of new
ideas successfully implemented.
1 2 3 4 5
A12 Our business places a strong emphasis on continuous 1 2 3 4 5
This section consists of 27 statements. Please indicate to what extent you agree or disagree with each
statement. Please mark the applicable block with a cross (X).

94
improvement in products/services delivery/ processes.
A13 Our business has a widely held belief that innovation is an
absolute necessity for the business’s future.
1 2 3 4 5
A14 Our leaders seek to maximize value from opportunities
without constraints to existing models, structures or
resources.
1 2 3 4 5
A15 When confronted with uncertain decisions, our business
typically adopts a bold posture in order to maximize the
probability of exploiting opportunities.
1 2 3 4 5
A16 In general, our business has a strong inclination towards
high-risks projects.
1 2 3 4 5
A17 Owing the environment, our business believes that bold,
wide-ranging acts are necessary to achieve the business’s
objectives.
1 2 3 4 5
A18 Employees are often encouraged to take calculated risks
concerning new ideas.
1 2 3 4 5
A19 The term “risk-taker” is considered a positive attribute for
employees in our business.
1 2 3 4 5
A20 Our business is very often the first to introduce new
products/services/processes.
1 2 3 4 5
A21 Our business typically initiates actions which competitors
respond to.
1 2 3 4 5
A22 Our business continuously seeks out new
products/processes/services.
1 2 3 4 5
A23 Our business continuously monitors market trends and
identifies future needs of customers.
1 2 3 4 5
A24 In dealing with competitors our business typically adopts a
very competitive undo-the-competitor “posture.
1 2 3 4 5
A25 Our business is very aggressive and intensely competitive. 1 2 3 4 5
A26 Our business effectively assumes an aggressive posture to
combat trends that may threaten our survival or
competitive position.
1 2 3 4 5
A27 Our business knows when it is in danger of acting overly
aggressive (this could lead to erosion of our business’s
reputation or to retaliation by our competitors).
1 2 3 4 5

95
4 SECTION B: PERCEIVED SUCCESS OF THE ORGAINISATION
Str
on
gly
Dis
ag
ree
Dis
ag
ree
Ne
ith
er
ag
ree
no
r
dis
ag
ree
Ag
ree
Str
on
gly
Ag
ree
B01 Our business has experienced growth in turnover over the past few years.
1 2 3 4 5
B02 Our business has experienced growth in profit over the past few years.
1 2 3 4 5
B03 Our business has experienced growth in market share over the past few years.
1 2 3 4 5
B04 The competitive position of our business has improved over the past few years.
1 2 3 4 5
B05 The efficiency (doing things right) of our business has improved over the past few years.
1 2 3 4 5
B06 In our business, employees are viewed as the most valuable asset of the organisation.
1 2 3 4 5
B07 The morale (job satisfaction) of our employees has improved over the past few years.
1 2 3 4 5
B08 Our employees are highly committed to our business. 1 2 3 4 5
B09 The effectiveness (doing the right things) of our business has improved over the past few years.
1 2 3 4 5
B10 The image (stature) of our business, relative to our competitors, has grown over the past few years.
1 2 3 4 5
B11 During difficult economic periods, investments in research and development/innovative projects continue and no significant financial cuts are made.
1 2 3 4 5
.This section consists of 11 statements, related to the perceived success of the organization. Please
indicate to what extent you agree or disagree with each statement. Please mark the applicable
block.with a cross (X)

96
5 SECTION C: BACKGROUND INFORMATION
C01 Indicate your age group ≤ 29 30 – 39 40 -49 50 – 59 60+
C02 Indicate your gender Male Female
C03 Indicate your race African White Coloured Indian
Other:(Specify):
C04 Indicate your highest academic qualification
Lower than Grade 12
Grade 12
National certificate
National Diploma
3-year degree
Post graduate qualification
C05 Indicate your level Level 3+ Level 5B – 4 Level 6C - 7
Level 8 & above
Other: (Specify
C06 Indicate your department
Production Maintenance Facility Executive Finance
Human
Resources
Information
Management
Legal Engineering, Planning
and Technology
Supply Chain
The following information is needed to help with the statistical analysis of data for comparisons among different
interest groups. All your responses will be treated confidentially. Your assistance in providing this important
information is appreciated. Please mark the applicable block with a cross (X).

97
Marketing
THANK YOU VERY MUCH FOR YOUR VALUED INPUT.

98
8 APPENDIX: B