AN APPROACH TOWARDS OVERALL SUPPLY CHAIN EFFICIENCY …
128
Logistics and Transport Management Masters Thesis No. 2002:29 AN APPROACH TOWARDS OVERALL SUPPLY CHAIN EFFICIENCY - A FUTURE ORIENTED SOLUTION AND ANALYSIS IN INBOUND PROCESS Hai Lu & Yirong Su
Transcript of AN APPROACH TOWARDS OVERALL SUPPLY CHAIN EFFICIENCY …
Logistics and Transport Management
Masters Thesis No. 2002:29
AN APPROACH TOWARDS OVERALL SUPPLY CHAIN EFFICIENCY
- A FUTURE ORIENTED SOLUTION AND ANALYSIS IN INBOUND PROCESS
Hai Lu & Yirong Su

Graduate Business School
School of Economics and Commercial Law
Göteborg University
ISSN 1403-851X
Printed by Elanders Novum AB
III
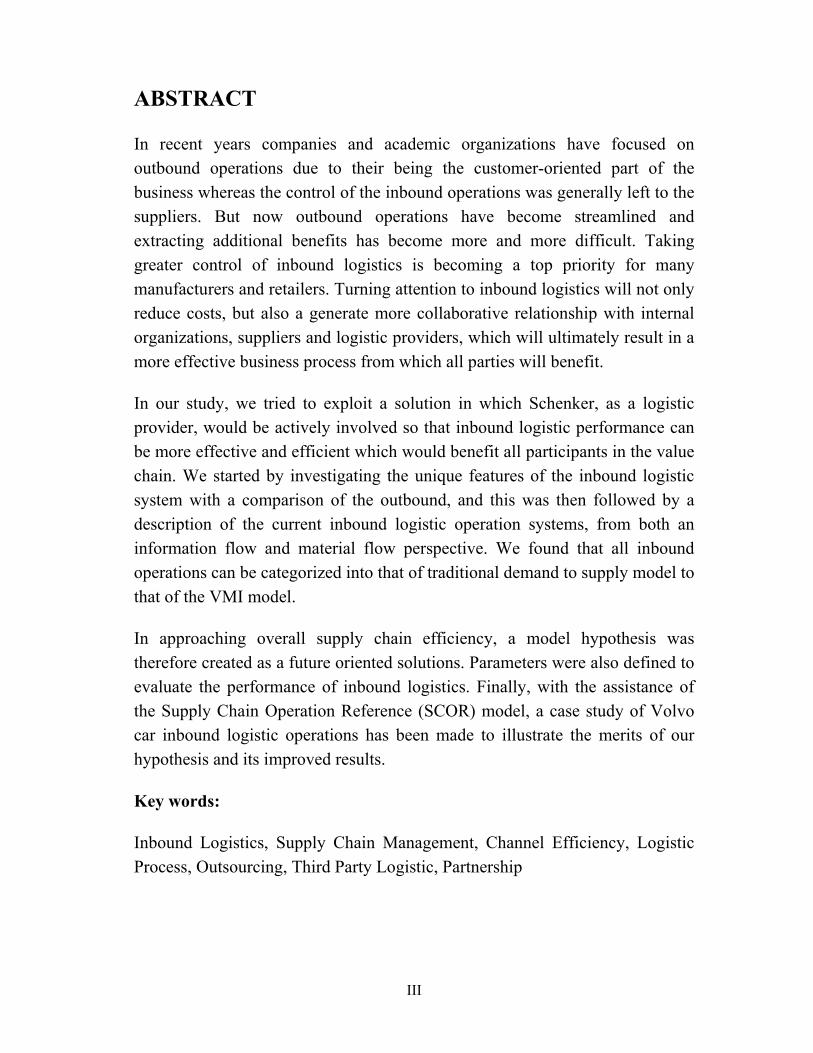
ABSTRACT
In recent years companies and academic organizations have focused on outbound operations due to their being the customer-oriented part of the business whereas the control of the inbound operations was generally left to the suppliers. But now outbound operations have become streamlined and extracting additional benefits has become more and more difficult. Taking greater control of inbound logistics is becoming a top priority for many manufacturers and retailers. Turning attention to inbound logistics will not only reduce costs, but also a generate more collaborative relationship with internal organizations, suppliers and logistic providers, which will ultimately result in a more effective business process from which all parties will benefit.
In our study, we tried to exploit a solution in which Schenker, as a logistic provider, would be actively involved so that inbound logistic performance can be more effective and efficient which would benefit all participants in the value chain. We started by investigating the unique features of the inbound logistic system with a comparison of the outbound, and this was then followed by a description of the current inbound logistic operation systems, from both an information flow and material flow perspective. We found that all inbound operations can be categorized into that of traditional demand to supply model to that of the VMI model.
In approaching overall supply chain efficiency, a model hypothesis was therefore created as a future oriented solutions. Parameters were also defined to evaluate the performance of inbound logistics. Finally, with the assistance of the Supply Chain Operation Reference (SCOR) model, a case study of Volvo car inbound logistic operations has been made to illustrate the merits of our hypothesis and its improved results.
Key words:
Inbound Logistics, Supply Chain Management, Channel Efficiency, Logistic Process, Outsourcing, Third Party Logistic, Partnership
IV
ACKNOWLEDGEMENT
This Master Thesis represents the essence of our achievements during the one-and-a-half years of study in the Logistics and Transport Management Programme at Graduate Business School, Göteborg University. During this period there have been many people who have inspired and guided us through the work with the thesis.
We would first like to thank our tutor Dr. Peter Rosén from the Business Management Department at the School of Economics and Commercial Law, Göteborg University, and our supervisor Ms. Yurina Sedano in Schenker 4 Rooms, for their precious guidance and everlasting enthusiastic support.
We would like to thank Mr. Jan Nordh, Managing Director of Schenker 4 Rooms, for his cheerful encouragement, inspiration, and for his help in giving us such a positive working climate.
We would also like to give special thanks to Professor Kenth Lumsden, at Chalmers University of Technology, who helped us to break down the barriers and discover logistics in theory and practice. We truly appreciate his recommendation writing this thesis in co-operation with Schenker 4 Rooms.
Here, we would also like to express our admiration for Professor Arne Jensen, at Graduate Business School, Göteborg University. We are proud to be his students, and to have been influenced by his academic attitudes.
We are also grateful to all the lovely ladies at 4 Rooms. They are Eva-Britt Nilsson, Kulli Keskula, and Gunilla Jönsson, who accompanied us during our work, and made this time memorable.
There are also many others at Schenker who have helped us in our study visits by sharing their valuable experience to us. They are Bertil Karlsson, Fredrik Söderström, Stesan Magnusson, Patrik Lind, Magnus Strand, Karl Björklund, Linda Arvidsson. Also, Mikael Warvne at Alps Nordic AB; Annika Bratt at Volvo Logistics; Jan-Olov Olausson, Martin Folin, David Stenberg in Volvo Car; Associate Professor Gunnar Stefansson in Chalmers University who help us with the SCOR model. We hereby express our gratitude to all of them.

V
Thanks to our families and friends for their love and understanding during our studies in Sweden, wherever we are, you are always with us.
VI
Table of Contents PREFACE.............................................................................................................................IX
CHAPTER 1. INTRODUCTION ......................................................................................... 1
1.1 BACKGROUND................................................................................................................. 1 1.1.1 Logistic Industry...................................................................................................... 1 1.1.2 Schenker AG............................................................................................................ 3 1.1.3 Schenker 4ROOMS.................................................................................................. 4
1.2 RESEARCH PROBLEMS..................................................................................................... 5 1.3 PURPOSE OF THE THESIS WORK ...................................................................................... 6 1.4 SCOPE & LIMITATIONS.................................................................................................... 6 1.5 WORKING MODEL (GENERAL OUTLINE OF THE THESIS) .................................................. 9
CHAPTER 2. METHODOLOGY ...................................................................................... 11
2.1 RESEARCH STRATEGY................................................................................................... 11 2.2 CASE STUDY ................................................................................................................. 11 2.3 METHOD FOR COLLECTING DATA ................................................................................. 12
2.3.1 Primary Data ........................................................................................................ 12 2.3.2 Secondary Data ..................................................................................................... 14
2.4 RELIABILITY & VALIDITY............................................................................................. 14 2.4.1 Validity .................................................................................................................. 14 2.4.2 Reliability .............................................................................................................. 15
CHAPTER 3. THEORETICAL FRAME OF REFERENCE.......................................... 17
3.1 THE LOGISTICS PLAYERS- FROM 1PL TO 5PL .............................................................. 17 3.1.1 What Does the Numbers Mean?............................................................................ 17 3.1.2 2PLs - Capacity Providers .................................................................................... 18 3.1.3 3PLs - Outsourced Logistics Service .................................................................... 19 3.1.4 4PLs - Integrated Logistics Service ...................................................................... 19 3.1.5 5PLs - The Real Sense Supply Chain Management .............................................. 20
3.2 SUPPLY CHAIN MANAGEMENT...................................................................................... 21 3.2.1 SCM Definition...................................................................................................... 21 3.2.2 Implementing Effective SCM Strategies................................................................ 22 3.2.3 SCM - A Framework for Analysis ......................................................................... 24 3.2.4 The Supply Chain Objectives and Principles ....................................................... 26
3.3 SUPPLY CHANNEL IN INBOUND LOGISTICS PROCESS..................................................... 31 3.3.1 Inbound Logistics – What Is It? ............................................................................ 31 3.3.2 Characteristics of Inbound Logistics .................................................................... 32 3.3.3 Inbound Logistics- A Catalyst for Supplier Collaboration ................................... 33
3.4 CHANNEL RELATIONSHIP MANAGEMENT IN INBOUND LOGISTICS ................................ 34 3.4.1 Channel Structure in Inbound Logistics................................................................ 34
VII
3.4.2 Understanding Channel Conflicts ......................................................................... 36 3.4.3 Channel Relationship Management ...................................................................... 37
3.5 THE LOGISTICAL MEASUREMENTS ................................................................................ 38 3.5.1 Logistical Service .................................................................................................. 40 3.5.2 Tied-up Capitals .................................................................................................... 42 3.5.3 Logistical Cost....................................................................................................... 42
3.6 SUPPLY-CHAIN OPERATIONS REFERENCE (SCOR) MODEL .......................................... 43 3.6.1 Background ........................................................................................................... 44 3.6.2 Introduction of the SCOR ...................................................................................... 44
CHAPTER 4. MODEL HYPOTHESES ............................................................................ 53
4.1 TRADITIONAL “DEMAND TO SUPPLY” MODEL .............................................................. 53 4.2 IMPROVED SUPPLY DEMAND MODEL ............................................................................ 55
4.2.1 Vendor Managed Inventory in Inbound Process................................................... 55 4.2.2 Relationship Management in VMI......................................................................... 57 4.2.3 The Case of Volvo Car Corporation Engine ......................................................... 59
4.3 HYPOTHESES MODEL .................................................................................................... 61 4.3.1 Comparison to Different Solutions........................................................................ 61 4.3.2 Model Hypothesis - Why It Comes? ...................................................................... 65 4.3.3 How Does It Work? ............................................................................................... 66 4.3.4 The Case of Lindex- Schenker ............................................................................... 70
4.4 PARAMETERS RELATED TO INBOUND ANALYSIS ........................................................... 72
CHAPTER 5. A CASE STUDY: ALPS-SCHENKER-VOLVO ...................................... 77
5.1 SCHENKER INTERNATIONAL AB.................................................................................... 77 5.2 LOGISTICS SOLUTION .................................................................................................... 78 5.3 SCORING THE INBOUND PROCESS............................................................................... 82
5.3.1 Process Mapping ................................................................................................... 82 5.3.2 Linkage Evaluation Matrix with Processes........................................................... 85 5.3.3 Supply Chain SCOR Card & Gap Analysis........................................................... 88 5.3.4 Performance Measurement ................................................................................... 89 5.3.5 SCORING the Model Hypotheses.......................................................................... 92
5.4 CONFIRMATION OF THE MODEL ..................................................................................... 97
CHAPTER 6. CONCLUSION & RECOMMENDATIONS ............................................ 99
6.1 CONCLUSION ................................................................................................................. 99 6.2 RECOMMENDATIONS ................................................................................................... 100
REFERENCE ..................................................................................................................... 103
ABBREVIATIONS ............................................................................................................ 109
APPENDIXES .................................................................................................................... 111
Appendix I: Interview Proposals .................................................................................. 111 Appendix II A: The Store-in Process of Schenker International Warehouse ............... 114

VIII
Appendix II B: The Store-out Process of Schenker ...................................................... 115 Appendix IIIA: Decompose the “Source to Stock” Activities in Schenker W/H .......... 117 Appendix IIIB: Decompose the “Delivery to Order” Activities in Schenker W/H . 118
IX
Preface
From the outside, Vasagatan 46 in central Gothenburg looks like it always has - a solid bourgeois apartment block for the city’s solid bourgeoisie. But do not be fooled by the conservative facade, it is a center of innovative business, wherein lies the heart of Schenker’s logistics. Behind old brick walls and wood paneling, an idea has been taking shape: 4 ROOMS – four rooms which can change your view of Schenker along with your view of logistics. Also, in this lovely old town house close by Handelshögskolan, Gothenburg University, every time when we knock on its heavy wooden door, we had a special feeling that Schenker 4Rooms had already strongly confirmed our decision for choosing logistics as a future career.
In every corner of the house, overlooking the elegant lanes, we nicknamed our study room the 5th Room, where fresh ideas originated in the quiet and isolated atmosphere. In this room, beginning with a logistics company, our intention is to position the logistics company in participating in the whole supply chain integration. Since logistics service providers focus on developing specific IT solutions to link their own systems with their clients, they can achieve full control and coordination of their product flows. Developing integrated logistics solutions is becoming a unique methodology for logistics companies such as Schenker for achieving success in a fiercely competitive market. The study proposes three improved models with existing case studies applied to support each analysis. We defined several key parameters, which affect the efficiency of information exchange under different scenarios. In facilitating the evaluation, we also introduced the Supply Chain Operation Reference (SCOR) model for displaying comparative solutions. Encouragingly, this research result will facilitate Schenker in improving their Supply Chain Modeler Simulation System, and will also contribute to its SCOR model development for its inbound research.
We believe that a supply-chain oriented ideology is something for the future, especially for a logistics service provider who is always dedicated to achieving excellence. Information technologies we adopted are catalysts that help to support and upgrade the whole process of supply chain solutions offered to

X
clients. With this dedication, clients will have easy access to efficient supply chain management, favorable business records and a competitive edge with their rivals.
Gaining from our education at the Graduate Business School, School of Economics and Commercial Law, Göteborg University and our thesis work for Schenker 4 Rooms, we are proud of our studies which have helped us find the best solutions, ideas and visions, pride and confidence. At the end of the day you will agree to us - an integrated logistics solution is a wonderful thing.
Lu Hai & Su Yirong
December 9th,2002
Göteborg, Sweden
______________________________________________________
1
School of Economics and Commercial Law Göteborg University
Chapter 1. Introduction
This first chapter will give the reader a general view of our thesis. We started with the research background, which is composed of two parts, logistic industry reality and the company profile. We then approach the main problem of this research and its purpose. This is followed by the scope of our study.
1.1 Background
1.1.1 Logistic Industry
Under the era of globalized economy, the intensified competition pushes companies to contract out logistics operations and cut costs in an effort to concentrate on core competences. The logistic industry began to transform from the traditional transportation industry and this is continuing at a rapid rate.
Logistics deals with the flow and storage of goods and related information, as defined by the Council of Logistics Management. All the processes of planning, implementing and controlling the efficient, cost-effective flow and storage of raw materials, in-process inventory, finished goods, and related information from point-of-origin to point-of-consumption are for the purpose of conforming to customer requirements. Logistics, previously viewed as a classical function, which involves adversarial relationships among suppliers, customers and transportation providers, is emerging as a key source of competitive advantage and a leading reason for strategic alliance relationship between companies and their logistics providers.
According to Ross, logistics can be seen as evolution through four distinct areas: warehousing and transportation management, total cost management, integrated logistic management and supply management.1 The development of the logistic industry began by merely providing tactical transportation and warehouses services to more centralized logistic functions aimed at cost control and customer services. The role of logistician then continued to expand from total cost management to the integrated logistic solution providers or so called
1 Ross 1997, p.78
Chapter 1 Introduction ______________________________________________________
2
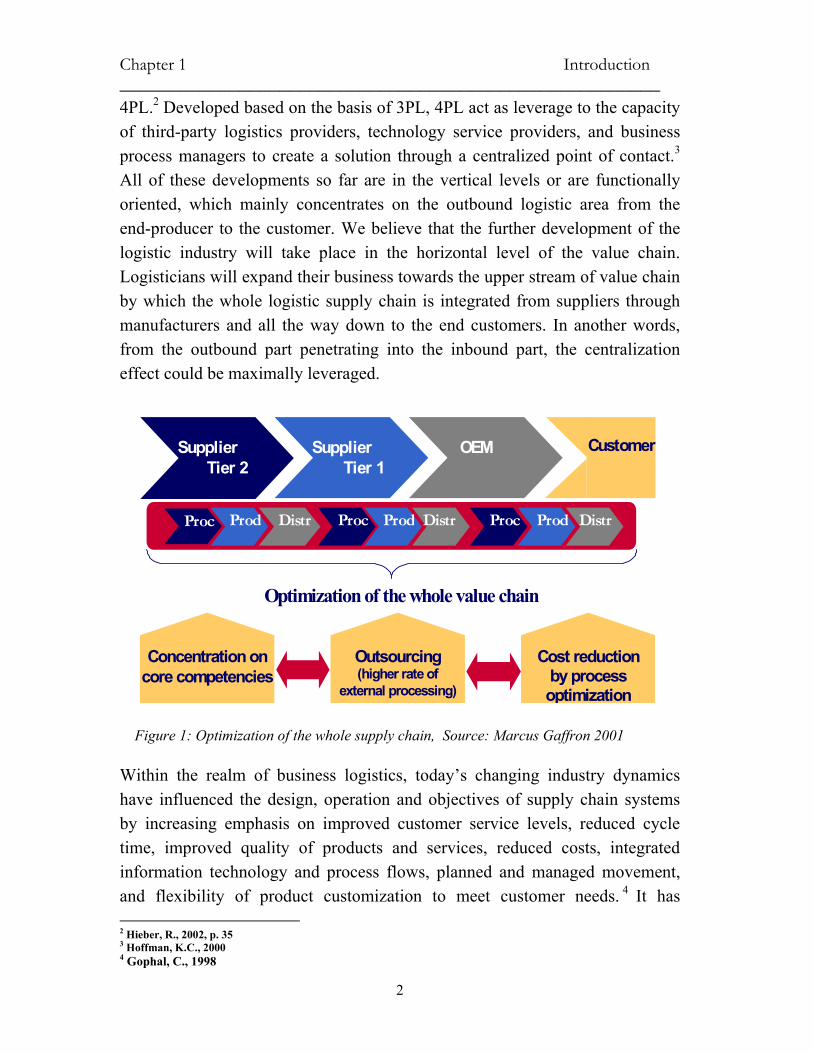
4PL.2 Developed based on the basis of 3PL, 4PL act as leverage to the capacity of third-party logistics providers, technology service providers, and business process managers to create a solution through a centralized point of contact.3 All of these developments so far are in the vertical levels or are functionally oriented, which mainly concentrates on the outbound logistic area from the end-producer to the customer. We believe that the further development of the logistic industry will take place in the horizontal level of the value chain. Logisticians will expand their business towards the upper stream of value chain by which the whole logistic supply chain is integrated from suppliers through manufacturers and all the way down to the end customers. In another words, from the outbound part penetrating into the inbound part, the centralization effect could be maximally leveraged.
Figure 1: Optimization of the whole supply chain, Source: Marcus Gaffron 2001
Within the realm of business logistics, today’s changing industry dynamics have influenced the design, operation and objectives of supply chain systems by increasing emphasis on improved customer service levels, reduced cycle time, improved quality of products and services, reduced costs, integrated information technology and process flows, planned and managed movement, and flexibility of product customization to meet customer needs. 4 It has 2 Hieber, R., 2002, p. 35 3 Hoffman, K.C., 2000 4 Gophal, C., 1998
Supplier
Tier 2 Supplier Tier 1
OEM
Customer
Proc Prod Distr Proc Prod Distr Proc Prod Distr
Concentration on
core competencies Outsourcing (higher rate of
external processing)
Cost reduction
by process optimization
Optimization of the whole value chain
______________________________________________________
3
School of Economics and Commercial Law Göteborg University
certainly also put logistics firms to the test: Outsourcing of supply chain management provides demonstrable advantages, but in many cases the supply chain itself has to be restructured if substantial savings are to be achieved. Thus, there is an increasing demand for experts capable of overseeing such restructuring.
In the name of efficiency, information technology has been adopted to support logistics for many years. Recent developments in technology have brought information to the forefront of resources from which forward-thinking firms can cultivate genuine competitive advantage. The major technology behind improved information flow was the advent of electronic data interchange (EDI). It offers greatly improved information flows and is an extremely important aspect within leading organizations in the fight to decrease lead-times. Today, the information flow has been shown to be the backbone of the logistic system. How to optimize the information flow to leverage the effectiveness and efficiency of the whole logistic system is one of the most important areas in which the logistic providers are competing with each other in.
1.1.2 Schenker AG
Established more than 125 years ago, Schenker is one of the leading international providers of integrated logistics and freight forwarding services. Today Schenker is a Stinnes Group company. It supports the global exchange of goods between industrial and trading companies by offering worldwide air and sea freight and associated logistics services. As a company specializing in land transport on road and rail within Europe, its closely woven network of regularly scheduled routes connects the principal economic regions in over thirty European countries. Schenker's customers receive all of the most important services from a single source - a business concept that has proven its convenience.
With advanced traffic and information systems, high quality requirements, environmental expertise and functional logistics centers at ten locations around Sweden, Schenker AB and its subsidiaries take an active part in making our customers more competitive. In Scandinavia the head office is situated in Gothenburg.
Chapter 1 Introduction ______________________________________________________
4
Schenker AB has a turnover of more than SEK 9 billion and is part of one of the largest European networks for land transport. They have a well-developed network of subsidiaries and associated companies in Sweden and sister companies in the rest of Europe.
Facing the intensive competition in the logistic industry, in order to keep competitive, Schenker must go in the front of providing their customers with better logistic service but lower cost. Information, known as the backbone of the logistic operation, plays a central role in exploring more effective and efficient logistic solutions.
1.1.3 Schenker 4ROOMS
4ROOMS was launched in Gothenburg, where the core expertise in logistics, demand and supply chain management was developed in partnership with Chalmers University of Technology, one of Europe’s most prestigious universities in logistics and SCM.
Originally, 4ROOMS was set up as an R&D function within former BTL, to which the company's existing and prospective clients were also invited to discuss possible improvements and future development of their business processes. Over the years, 4ROOMS' academic and executive network has been developed globally. Today, it is a network of leading experts and academicians in the field of demand and supply chain management, whose expertise has been brought together with the aim of helping clients improve the value of their businesses.5
The Supply Chain Modelator is a highly powerful visual design simulation tool created by 4ROOMS. It is an intelligent simulation system for the solution of complex global logistic projects and supply chains - in the presence of the customer, simulation of current logistics processes and picturing of possible future processes. The Supply Chain Modelator is based on modern “nodes and links” logistic concept6 with powerful calculation functions that can be used to calculate economic ordering quantities, capital tied up optimised location platform, etc. For each of the specific simulation cases, the user can place a set
5 Sources provided by Schenker 4ROOMS 6 Fundamental of logistics, Lumsden,K.R, 1998
______________________________________________________
5
School of Economics and Commercial Law Göteborg University
of symbols consisting of supplier, production sites, and warehouse/cross docking terminals, nodes and market places as well as their corresponding links according to the real situation on the geographic maps. Then the initial values can later be entered and used on calculation for the whole case. It is a great tool with supply chain modeling functionality, user friendly and fast in obtaining results.
1.2 Research Problems
The whole supply chain of a manufacturing company from the manufacturer’s point of view can be generally divided into two parts, inbound logistics which is from the supplier to manufacture plant and outbound logistics which is from manufacturer to customers or even to end consumers. In the past few years, a lot of studies have been made on the outbound logistic area. Since the outbound operations have been streamlined and extracting extra benefit has become more and more difficult, companies are turning their attention to inbound operations. In the following study, we are going to focus on the inbound logistic area and expect to explore something new in this field.
Logistics systems theoretically consist of two parts, the information flow and the physical material flow. The information flow includes production plan, material requirements, and delivery schedules, etc. The smoother the information flow, the earlier information can be reached. Thus the logistic providers can fulfill quick response according to customer requirements. Finally, the negative lead-time (lead time without any value-added) can be reduced as well as the total logistic cost. But the level of information sharing is, to a great extent, determined by the relationship among companies. Schenker, as the European leading third-party-logistic provider, is actively developing relationships with its key accounts to improve its service level with streamlined information flow. Our task is to map an ideal inbound logistic system with which the integrated effectiveness and efficiency can be reached so that all the participants in the supply chain can benefit.
In order to solve the main problem of how to improve the effectiveness and efficiency in the inbound logistic system, several sub-problems need to be solved step by step. Firstly, the unique features of the inbound logistic system are going to be studied. This will provide us with a better understanding of the
Chapter 1 Introduction ______________________________________________________
6
inbound logistic systems. Secondly, the parameters that can be used to evaluate the effectiveness and efficiency of the logistic system need to be selected. Thus, the potential logistic solutions could be compared with each other and the improvement of potential solutions could be measured as well. Thirdly, it is necessary to make case studies on mapping how the inbound logistic system looks like in practice, which will promise the practicability of this study. Finally, to realize the end target of optimizing the process of inbound logistics, constrictive suggestions and an optimized solution will be illustrated as our donation to Schenker’s simulation system.
Generally, our main research problem and the sub-problems can be summarized as follows:
Main problem:
How to improve the effectiveness and efficiency in the inbound logistic system?
Sub-problems:
1. How is the process of current inbound logistic system? 2. What parameters are going to be used to measure the effectiveness and
efficiency of the logistic system? 3. What kind of improvement can be made on the inbound logistic system
and how will it be after improvement?
1.3 Purpose of the Thesis Work
The purpose of our study is to explore a solution in the inbound logistic area that may improve efficiency and effectiveness of inbound logistic system on both information flow and physical flow where Schenker could be more actively involved in the future. Our research result together with part of the outbound logistics section will later be combined in upgrading Schenker’s Simulation Program in 4ROOMS.
1.4 Scope & Limitations
The scope of our thesis work is to focus on in inbound logistics process of
______________________________________________________
7
School of Economics and Commercial Law Göteborg University
manufacturing industries, from the supply chain management’s point of view, in reducing overall cost with efficient information exchange. We are considering mapping an ideal inbound logistic information flow and physical flow for key clients we shall study, which is what we are looking for in this project. In order to give the reader a better view or a more comprehensive understanding, other relative knowledge will be involved, including for example, relationship management etc., which could be used in future studies but is not included within the scope of our study.
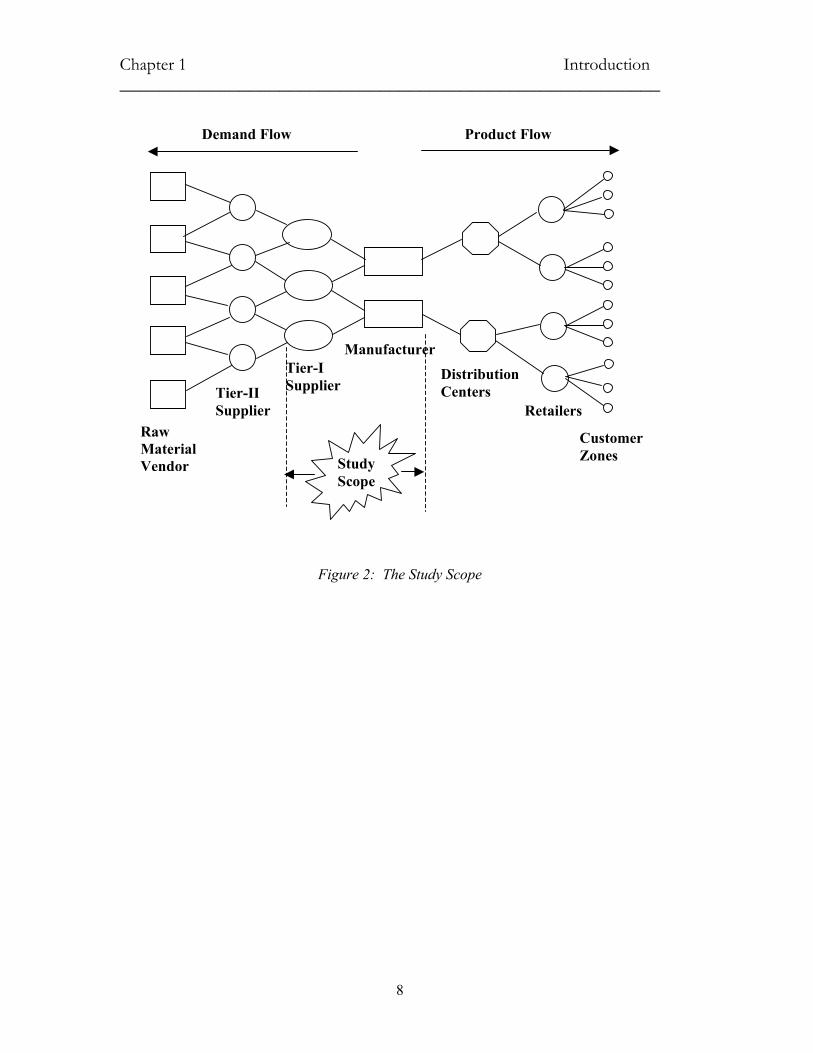
The inbound logistic of manufacturing industry, which comes from the suppliers to Original Equipment Manufacturers (OEM), is a complicated system which includes tires of suppliers and transaction of multiple semi-finished-products. The level of complexity varies among different industries. The mobile industry, for instance, consists of at least five or six level of suppliers and hundreds of sub suppliers. The whole value chain is very much like a network as showed in the Figure 2. To facilitate our research, we limit our study to a one-tire relationship, from the tire-I suppliers to end-product manufacturer.
Chapter 1 Introduction ______________________________________________________
8
Figure 2: The Study Scope
Raw Material Vendor
Tier-I Supplier
Manufacturer
Distribution Centers
Retailers
Customer Zones
Tier-II Supplier
Study Scope
Demand Flow Product Flow
______________________________________________________
9
School of Economics and Commercial Law Göteborg University
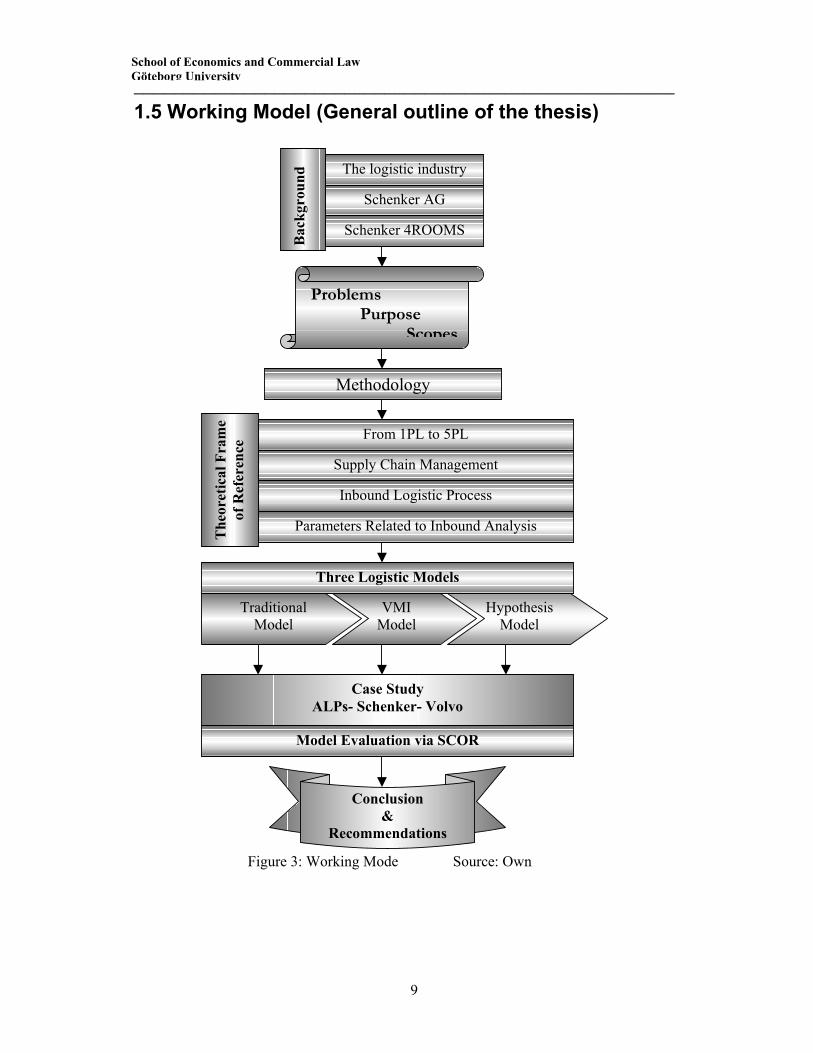
1.5 Working Model (General outline of the thesis)
Figure 3: Working Mode Source: Own
Bac
kgro
und The logistic industry
Schenker AG
Schenker 4ROOMS
Problems Purpose
Scopes
Methodology
The
oret
ical
Fra
me
of R
efer
ence
From 1PL to 5PL
Supply Chain Management
Inbound Logistic Process
Parameters Related to Inbound Analysis
Three Logistic Models
Traditional Model
VMI Model
Hypothesis Model
Case Study ALPs- Schenker- Volvo
Model Evaluation via SCOR
Conclusion &
Recommendations

______________________________________________________
11
School of Economics and Commercial Law Göteborg University
Chapter 2. Methodology
There are various research methods for different research problems. Choosing one or several suitable methods is very important to get a persuasive research result. In this chapter we discuss methodological issues related to the identified problem.
2.1 Research Strategy
In deciding a research strategy, there are two approaches for a research work, i.e., a theoretical or an empirical one. Theoretical research requires intensive textual investigation while empirical research in business and management studies requires extensive interaction with people. The aim of our work is to try to make this thesis work as a practical case based on theoretical studies. In this thesis, we will focus on the empirical approach. Simultaneously, a good theoretical background is a prerequisite. First we will review the literature, documents regarding logistics and information systems as much as possible, trying to define a theoretical foundation. Based on this academic foundation, we focus on taking the empirical approach to make a description of how companies operate in practice when they deal with the issues of information systems and operations of inbound logistics. Together with this approach, we will make several interviews with persons in both Schenker and some of their key account customers.
2.2 Case Study
The philosophy behind the case study is that sometimes only by looking carefully at a practical real-life instance can a full picture be obtained of the actual interaction of variables or events. In research the case study has two distinct features. Firstly, the case study can be used in establishing valid and reliable evidence. Secondly, the case study can be used as a vehicle for creating a story or narrative descriptions of the situation being studied, in such a way that the resulting narrative represents a research finding in its own right and thus can be said to have added something of value to the body of knowledge. 7
7 Remeny, et al, 1999
Chapter 2 Methodology _______________________________________________________
12
In this context, we find that the case study is a good approach for our research. As our study field of inbound logistics system is relatively new, most companies explored their own solution for the question of HOW to streamline their inbound information flow to increase the efficiency of inbound logistic system. We selected one typical case of inbound logistics in the manufacturing industry in which Schenker is involved in order to map the current inbound logistic operation and identify weak points. We then applied our model hypothesis to the case study , and are going to use this to illustrate the merit of our findings.
2.3 Method for Collecting Data
Data collection can rely on many sources of evidence. According to Yin, there are six important sources, these are documentation archival records, interviews, direct observation, participant-observation, and physical artifacts.8 There are two types of data generally: primary data and secondary data. Reconcept of primary data implicates the collection of information through direct observation, personal interviews, and conducting conversation. Reconcept of secondary data means the study of document; biographies, web-sites and other historical and documentary records relevant for the studied issue.9 We will have both types of data collection in our thesis.
2.3.1 Primary Data
The capturing of our primary data was conducted through both personal interviews and our observations. As we spent most of our time working at Schenker 4ROOMs, the R&D center, this gave us the opportunity to ask questions as they arose. We have also been going through an introduction of the company background, the organizational structure and the Simulation Modular, from which we got a clear picture of their originations structures and general information of different business processes. In all, being situated in the R&D environment offers us a great advantage in acquiring first hand information.
8 Yin,K.R 1994 9 Remeny, et al, 1999
______________________________________________________
13
School of Economics and Commercial Law Göteborg University
2.3.1.1 Personal Interviews
Due to the size of the Schenker Company and the complexity of the Logistic operational process, It is very difficult to find an accumulated information resource for all Schenker’s operations. We decided the personal interview would be preferable in our study area, as we can talk face to face with the person who is in charge of the business we are interested in and instantly follow up the questions. It helped us to acquire the just-in-point information and precise pictures of what and how the business works.
Personal interviews can be done in different ways. The main two are structured interview and unstructured interview. In case of unstructured interview, there is no schedule. Our unstructured interviews are mainly with R&D specialists in Schenker 4ROOMS, and usually occurred in a relaxed environment such as coffee breaks when people were relaxed. In our structured interviews, we prepared a particular order of questioning before the interviews, this then meant that we could be flexible with regard to questions raised in relation to our research problems. Some of our interviews, such as those with Lindex and Schenker International AB, had to be done along with site visits where what we heard was instantly confirmed by what we observed.
Our interviewees are logistic professionals and field specialists. All of our Schenker and Volvo interviewees have been working in the company for years, some have been with the company all their working life. Such experienced persons provide and in-depth knowledge.
2.3.1.2 Observations (Site visits)
Theoretically, observations can be both qualitative and quantitative. In observations, it is important to avoid taking part of the things observed.10 Since we are in the process of mapping their work process, all of our observations are qualitative. And when being careful and listening to people with respect to their knowledge, it can be useful to participate in the observations. The participating observations are unstructured, and we shifted from looking, listening, asking questions, and acting.
10 Svenning, C., 1996
Chapter 2 Methodology _______________________________________________________
14
2.3.2 Secondary Data
The secondary data consists of textbooks, journals, research papers, articles and company files and reports. They are collected from the library, target companies and through Internet. They comprised the Chapter 3 of theoretical framework. They were applied in identifying evaluation parameters, classifying inbound logistic characters and analyzing logistic solutions.
To provide an up-to-date picture, most of the literature that we used was published during the late nineties or later. The library in Schenker 4ROOMS and the database from the Economic Library in Gothenburg University are frequently used when searching for the most recent articles in journals.
2.4 Reliability & Validity
In order to inform the readers of how trustworthy our result is, we discuss the issue of validity and reliability in this section.
2.4.1 Validity
Validity describes the extent to which the results correspond with reality. The validity consists of two parts, internal and external part. The internal validity deals with the study itself and the direct connection between the theoretical framework and the empirical studies. That is, the interviews shall be performed with relevant people and the experiment shall have enough samples to answer the questions.11 During our thesis writing, all our interviewees were logistic specialists who had extensive experience of the field. In order to find a perfect case for our models, we made a pre-study on many of Schenker’s businesses, and selected the most relevant case that could be used in order to gain an in-depth knowledge.
The external validity concerns the study with all its contents in a wider perspective, that is, if it is possible to generalize from the study.12 Our study of the inbound logistics is on the strategical level. Today’s leading logistic providers like Schenker AB is our targeting group. Starting from current
11 Svenning, C., 1996 12 Svenning, C., 1996
______________________________________________________
15
School of Economics and Commercial Law Göteborg University
business environment study, supported by theoretical fruits and the real case comparison, we believe our thesis conclusion could be valuable for our targeting groups in making strategical decisions.
2.4.2 Reliability
The reliability concerns whether or not a future investigation follows the exact same procedure as described by previous researchers, and that the same case study is repeated in the same way resulting in the same findings and conclusions. 13 Reliability depends on the accuracy of the measuring instruments or techniques. Things that can make the reliability low are, for example, wrong samples, problem with standardization in the interviews and problem in interpretations, etc.
To provide a high reliable finding and decrease the negative effect caused by misunderstandings in oral conversation, we recorded the interviews and the information from interviews is sorted again after re-listening to the tape.
Our interviewees are specialists who have an extensive knowledge of the logistic field. Before our interviews, we sent e-mail information to our interviewees to inform them of the purpose of our study, as well as the result we expected from the interviews. All these efforts increased the effectiveness of our interviews and reduced the chance of interview questions being misunderstood.
13 Yin,K.R 1994

______________________________________________________
17
School of Economics and Commercial Law Göteborg University
Chapter 3. Theoretical Frame of Reference
3.1 The Logistics Players- From 1PL to 5PL
Before we begin our theoretical frame of reference, we would like to clarify some important definitions in assisting a better understanding our research.
As shown in Morgan Stanley’s report we will use the definitions about logistics concept, which defines logistics as the part of the supply chain process that plans, implements and controls the efficient, effective flow and storage of goods, services and related information from the point of origin to the point of consumption to meet customer’s requirement.14
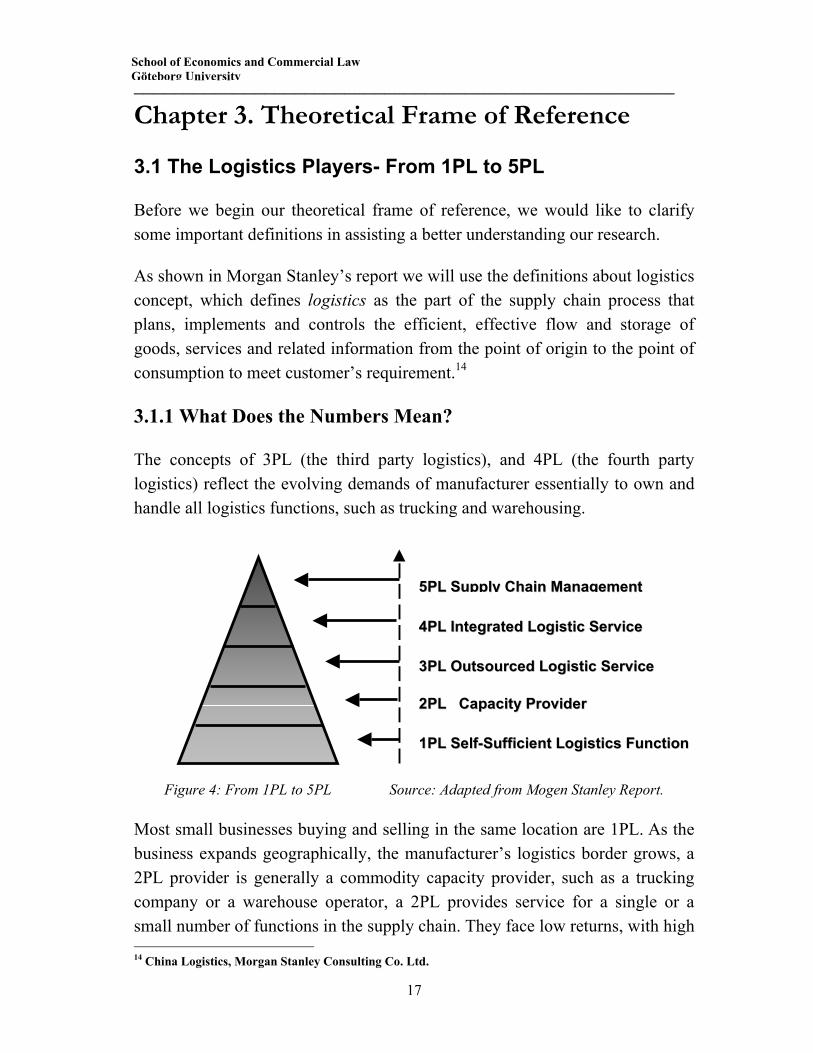
3.1.1 What Does the Numbers Mean?
The concepts of 3PL (the third party logistics), and 4PL (the fourth party logistics) reflect the evolving demands of manufacturer essentially to own and handle all logistics functions, such as trucking and warehousing.
Figure 4: From 1PL to 5PL Source: Adapted from Mogen Stanley Report.
Most small businesses buying and selling in the same location are 1PL. As the business expands geographically, the manufacturer’s logistics border grows, a 2PL provider is generally a commodity capacity provider, such as a trucking company or a warehouse operator, a 2PL provides service for a single or a small number of functions in the supply chain. They face low returns, with high 14 China Logistics, Morgan Stanley Consulting Co. Ltd.
55PPLL SSuuppppllyy CChhaaiinn MMaannaaggeemmeenntt
44PPLL IInntteeggrraatteedd LLooggiissttiicc SSeerrvviiccee
33PPLL OOuuttssoouurrcceedd LLooggiissttiicc SSeerrvviiccee
22PPLL CCaappaacciittyy PPrroovviiddeerr
11PPLL SSeellff--SSuuffffiicciieenntt LLooggiissttiiccss FFuunnccttiioonn
Chapter 3 Theoretical Frame of Reference _______________________________________________________
18
levels of asset intensity but low barriers of entry. Next come the distributors, who through a dense network or legislative protection have achieved higher returns, albeit on a sizeable cost base. Examples are the express parcel operators that charge premium pricing for timely delivery, and the postal operators.
With the increasing demand for one-stop solutions, many 2PLs have evolved into 3PLs by adding new logistics capabilities and integrating their operations. It may or may not involve asset ownership. 3PL is a broader term that is frequently used to cover businesses in freight forwarding or contract logistics. It performs all or a large portion of a client’s supply chain logistics activities, and its value adding is based on information and knowledge versus a non-differentiated transportations service at the lowest cost. 3PL tends to be asset-light with high returns. The 4PL provider is essentially a logistics integrator or a one-point contact for the manufacturer’s logistics outsourcing requirements. They are responsible for contracting various 2PL and 3PL providers, and for assembling and managing those end-to-end solutions. The 4PL provider, with its complete overview of the supply chain as well as strong logistics and IT capabilities, can also offer high value added advisory services to the manufacturer.
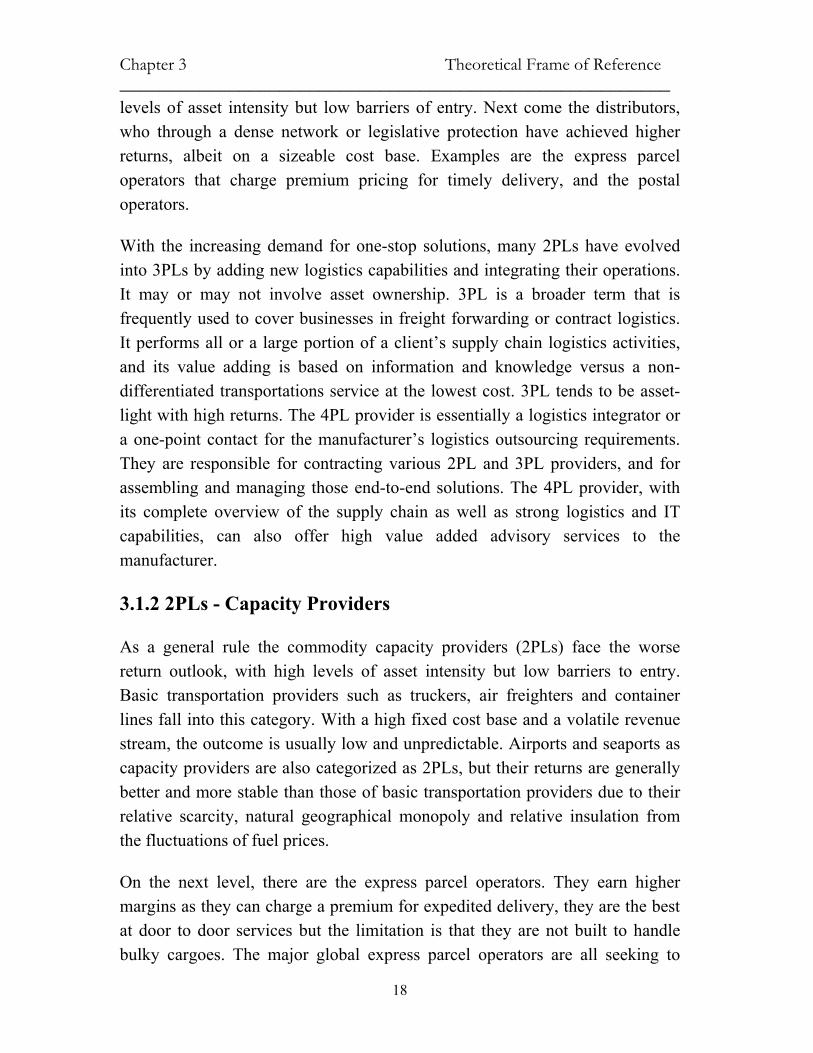
3.1.2 2PLs - Capacity Providers
As a general rule the commodity capacity providers (2PLs) face the worse return outlook, with high levels of asset intensity but low barriers to entry. Basic transportation providers such as truckers, air freighters and container lines fall into this category. With a high fixed cost base and a volatile revenue stream, the outcome is usually low and unpredictable. Airports and seaports as capacity providers are also categorized as 2PLs, but their returns are generally better and more stable than those of basic transportation providers due to their relative scarcity, natural geographical monopoly and relative insulation from the fluctuations of fuel prices.
On the next level, there are the express parcel operators. They earn higher margins as they can charge a premium for expedited delivery, they are the best at door to door services but the limitation is that they are not built to handle bulky cargoes. The major global express parcel operators are all seeking to
______________________________________________________
19
School of Economics and Commercial Law Göteborg University
combine 3PL and express parcel activities to provide integrated whole supply chain logistics.
3.1.3 3PLs - Outsourced Logistics Service
Most 2PLs and express companies strive to become 3PLs for higher returns. While 3PLs do own some assets such as key distribution centers in strategic locations or a small trucking fleet to fill emergency needs, they may outsourced most of their capacity needed by 2PLs. Hence the terms 3PLs focus on logistics solutions and look for the optimal combination of assets available from capacity providers, 3PLs are less asset intensive and are thus nimbler in the operation of assets available from capacity providers, therefore they have higher returns on assets employed. Their logistics management expertise makes them increasingly counter-cyclical - the worse the cycle, the more companies need to optimize their supply chains. Moreover, the more integrated the service of 3PLs, the closer they are to the customer’s operation. This closeness makes 3PLs indispensable to the customer, as the 3PL provider becomes more a partner than a supplier. A customer is more reluctant to change its 3PL provider than a 2PL. There exists therefore higher customer loyalty and revenues stability.
However, 3PLs do not deliver the kind of great margins which many companies are looking for. This is simply because 3PL make money by helping customers save. It offers higher return than traditional transport because of higher growth of demand. Economies of scale are crucial for 3PLs to be profitable, as they need to support extensive logistics networks. Lack of scale is the reason why some logistics players see lower profitability for their 3PL business than that of traditional logistics services.
3.1.4 4PLs - Integrated Logistics Service
The services of 3PL sometimes overlap with the 4PLs. The 4PL segment is more lucrative because these firms charge consulting fees. Currently, 3PL companies are trying to turn themselves into 4PL companies in providing better service satisfaction to their related customers. We can say that 4PL are based on the development of 3PLs and it is an extension of 3PL, it provides value added service such as planning, information technology integration, transport
Chapter 3 Theoretical Frame of Reference _______________________________________________________
20
planning, order tracking and tracing, logistics consulting, application solution, and financial services. But all these functions focus on improving a close linkage to its served customer. From the logistic company to its consigners, as a 3PL company its task is to transport the goods from consigner to consignee, and to be a 4PL provider, 3PLs need to find ways to build strong relations between themselves and their customers, with the above-mentioned supporting function to reach the highest level of service efficiency i.e., 4PL are integrated logistics management.
3.1.5 5PLs - The Real Sense Supply Chain Management
The 5PL solutions focus on providing overall logistics solutions for the entire supply chain. Supply Chain Management (SCM) is the integration of the activities associated with the flow and transformation of goods in the respective logistics networks through improved supply chain relationships based on a common collaborative performance measurement framework for attaining close, collaborative and well coordinated network relationships to achieve a competitive advantage.15
Actually, the supply chain management focuses on building the coordination in product supply demand relation, from origin to destination. Achieving the success will require a truly integrated approach to manage the supply and demand chain, the approach that delivers what consumers want, where and when they want as efficiently as possible. What does this mean in practice?
As the trends in the last decade were to define core competence for each enterprise, the traditional full-scale company has abolished its purchasing or logistics function by outsourcing from the professional company being responsible for it, and just focuses on, for example, production. This is the way to reduce overall capital tied up at some long term investment or inventory, hence reduce the risk. But since companies are becoming more and more specialized, the information exchange is at a particular point; the inventory may overlap because the property of each product is attributed to different companies in various stages. The increased productivity calling for the efficient product life cycle turns over in a faster and faster running loop.
15 Hieber,R 2002
______________________________________________________
21
School of Economics and Commercial Law Göteborg University
Supply chain management is quite likely to cause these separate functional specialists become reunified as before: the goal is shifting from outsourcing to strategic alliance in creating win-win situations for all supply chain members, so that the information can be freely exchanged. As used previously, different functional departments worked under a general management, without any obstacle, the overall productivity can be achieved.
3.2 Supply Chain Management
3.2.1 SCM Definition
There are various definitions about supply chain management. Houlihan (1987) states that SCM strives to balance conflicting activities such as promotion, sales, distribution and production. SCM might be seen as a business philosophy that strives to integrate the dependent activities between firms, e.g. logistics, purchasing, production, and marketing. The Council of Logistics Management16 defines logistics as: Logistics is that part of the supply chain process that plans, implements, and controls the efficient, effective flow and storage of goods, services, and related information from the point of-origin to the point-of-consumption in order to meet customers’ requirements. This definition implies that logistics is a sub-set of SCM.
Supply chain management is a major issue in many industries as firms realize the importance of creating an integrated relationship with their suppliers and customers. Managing the supply chain has become a way of improving competitiveness by reducing uncertainty and enhancing customer service. The role of planning and coordination in complex integrated systems and information technology to synchronize the supply chain is described in a framework that creates the appropriate structure and installs proper controls in the enterprise and other constituents in the chain.
During the past few years, supply chain excellence, optimisation, and integration have become the focus and goal of many organizations worldwide. Strengthening the supply chain management is perceived by many firms as the way to enhancing customer satisfaction and enabling profitable growth (AMR,
16 http://www.clm1.org/aboutUs/aboutUs_policy.asp Date: 2002-09-29
Chapter 3 Theoretical Frame of Reference _______________________________________________________
22
1997).
3.2.2 Implementing Effective SCM Strategies
The primary purpose in establishing supply chains is to minimize the flow of raw materials and finished products at every point in the pipeline in order to enhance productivity and cost savings 17 . Successful supply chain ventures manage some critical elements for parts such as individual business unit in the entire supply chain. The strategy covered in different aspects contributes to the overall performance.
1). Establish supplier relationships
It is important to establish strategic partnerships with suppliers for a successful supply chain. Corporations have started to limit the number of suppliers they do business with by implementing vendor review programs. These programs strive to find suppliers with operational excellence, so the customer can determine which supplier is serving well. The ability to have a closer customer or supplier relationship is very important because these suppliers are easier to work with.
With the evolution toward a sole supplier relationship, firms need information such as financial performance, gain-sharing strategies, and plans for jointly designed work. They may establish a comparable culture and also implement compatible forecasting and information technology systems. This is because their suppliers must be able to link electronically into the customer's system to obtain shipping details, production schedules and any other necessary information.18
Seen from 3PL companies in inbound processes, building relationships to suppliers (actually its customers) plays important roles in providing high quality service in satisfying both supplier and manufacturers.
2). Increase customer responsiveness
To remain competitive, firms focus on improved supply chain efforts to
17 Cohen, 1996; Cooper and Ellram, 1993 18 Copacino, 1996; Coyle et al., 1996; Keller, 1995
______________________________________________________
23
School of Economics and Commercial Law Göteborg University
enhance customer service through increased frequency of reliable product deliveries. Increasing demands on customer service levels are driving partnerships between customers and suppliers. The ability to serve their customers with higher levels of quality service, including speedier delivery of products, is vital efforts. Having a successful relationship with a supplier results in trust and the ability to be customer driven, customer intimate and customer focused19.
3). Build a competitive advantage for the product oriented channel
Achieving and maintaining competitive advantage in an industry is not an easy undertaking for a firm. Many competitive pressures force a firm to remain efficient. Some of the competitive advantage sees supply chain management for firms that employ the resources to implement the process. It also serves to increase the influence on the channel because these firms are recognized as the leading edge and are treated with respect.
A competitive advantage can be supply chain management, which would help firms to implement better processes. Attaining competitive advantage in the channel comes with top management support for decreased costs, waste management, and enhanced profits. Many firms want to push costs back to their supplier and take labour costs out of the system. These cost reducing tactics tend to increase the competitive efficiency of the entire supply chain.
Firms have become more market channel focused. They are observing how the entire channel's activities affect the system operation. In recent times, the channel power has shifted to the retailer. Retailer channel power in the distribution channel is driven by the shift to some large retail firms, such as Wal-Mart, Kmart, and Target. The large size of these retailers allows them the power to dictate exactly how they want their suppliers to do business with them. The uses of point of sales data and increased efficiency of distribution also have been instrumental in improving channel power and competitive advantage20.
19 Willis, 1995 20 Magretta, 1998; Robinson, 1998; Ross, 1996
Chapter 3 Theoretical Frame of Reference _______________________________________________________
24
4). Introduce SCM solutions and enabling information technology
Information is vital to effectively operate the supply chain. The communication capability of an enterprise is enhanced by an information technology system. However, information system compatibility among trading partners can limit the capability to exchange information. An improved information technology system where partners in the channel have access to common databases that are updated in real-time is needed.
3.2.3 SCM - A Framework for Analysis
We will begin with the analysis of the supply chain framework, in order to gain a clear understanding of what a supply chain is about, its basic tenets of linking structural strategies with prescriptive strategies.
Many strategists agree that firms may not be able to rely either on a price leadership role or on a differentiation strategy alone to guarantee sustained market strength. To sustain long-term growth, however, combinations of both strategies are typically needed to operate effectively within constraints imposed by the environment. Such is also the case for a supply chain of products and services offered by a firm. However, since a number of autonomous business entities belong to the supply chain network, it becomes imperative to develop a common mission, goals, and objectives for the group as a whole, while pursuing independent policies at individual members' level. This scenario offers opportunities for design, modelling, and implementation of supply chain networks for maximum effectiveness, efficiency, and productivity in a dynamic environment.
______________________________________________________
25
School of Economics and Commercial Law Göteborg University
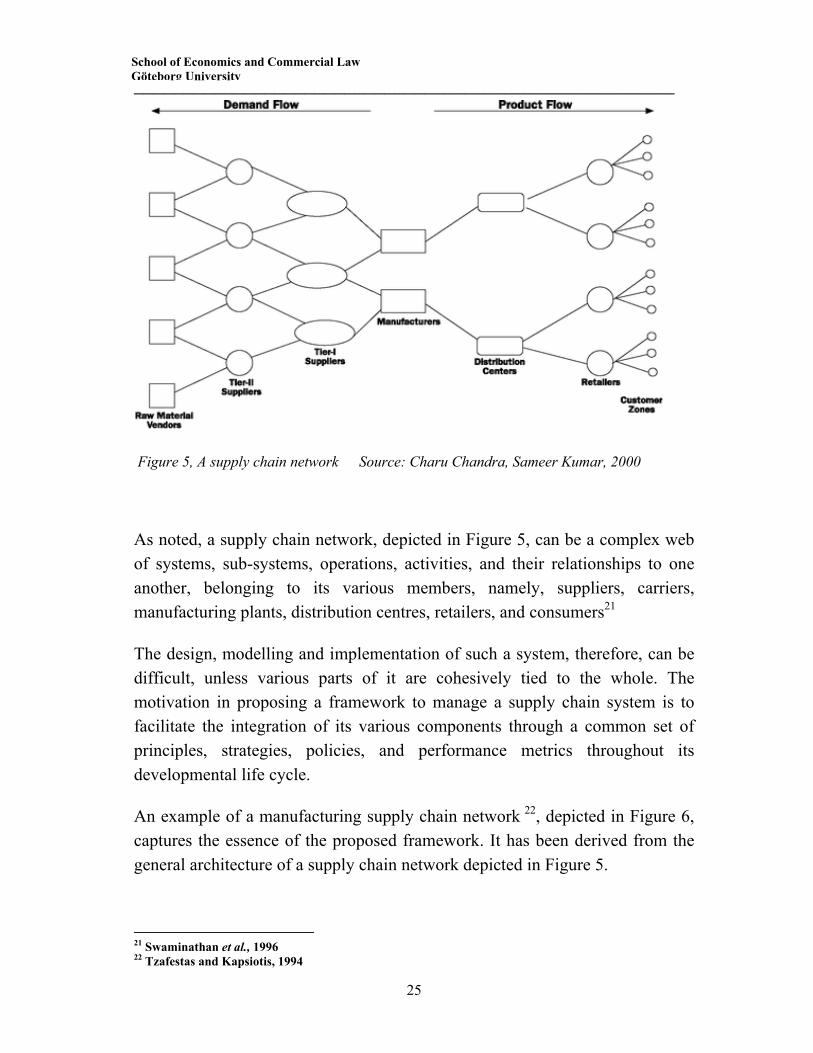
Figure 5, A supply chain network Source: Charu Chandra, Sameer Kumar, 2000
As noted, a supply chain network, depicted in Figure 5, can be a complex web of systems, sub-systems, operations, activities, and their relationships to one another, belonging to its various members, namely, suppliers, carriers, manufacturing plants, distribution centres, retailers, and consumers21
The design, modelling and implementation of such a system, therefore, can be difficult, unless various parts of it are cohesively tied to the whole. The motivation in proposing a framework to manage a supply chain system is to facilitate the integration of its various components through a common set of principles, strategies, policies, and performance metrics throughout its developmental life cycle.
An example of a manufacturing supply chain network 22, depicted in Figure 6, captures the essence of the proposed framework. It has been derived from the general architecture of a supply chain network depicted in Figure 5.
21 Swaminathan et al., 1996 22 Tzafestas and Kapsiotis, 1994
Chapter 3 Theoretical Frame of Reference _______________________________________________________
26
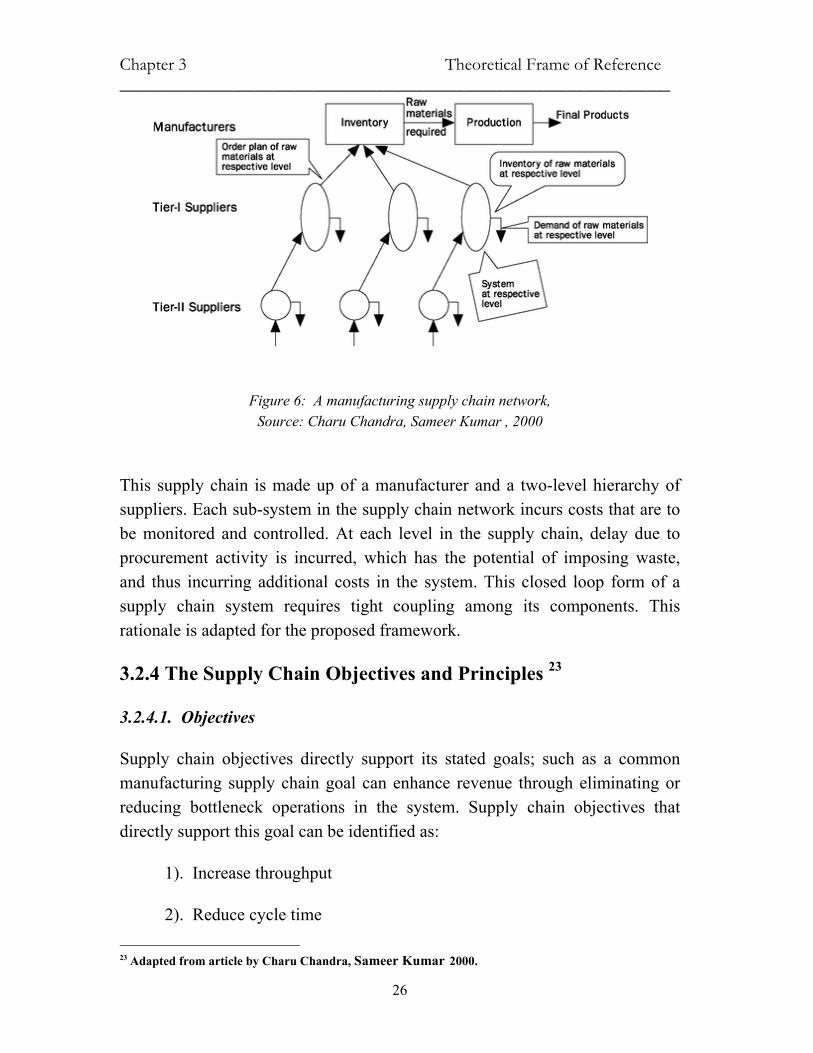
Figure 6: A manufacturing supply chain network,
Source: Charu Chandra, Sameer Kumar , 2000
This supply chain is made up of a manufacturer and a two-level hierarchy of suppliers. Each sub-system in the supply chain network incurs costs that are to be monitored and controlled. At each level in the supply chain, delay due to procurement activity is incurred, which has the potential of imposing waste, and thus incurring additional costs in the system. This closed loop form of a supply chain system requires tight coupling among its components. This rationale is adapted for the proposed framework.
3.2.4 The Supply Chain Objectives and Principles 23
3.2.4.1. Objectives
Supply chain objectives directly support its stated goals; such as a common manufacturing supply chain goal can enhance revenue through eliminating or reducing bottleneck operations in the system. Supply chain objectives that directly support this goal can be identified as:
1). Increase throughput
2). Reduce cycle time
23 Adapted from article by Charu Chandra, Sameer Kumar 2000.
______________________________________________________
27
School of Economics and Commercial Law Göteborg University
3). Reduce inventory at different stages
(Raw materials - work-in-process - finished goods).
4). Reduce overall capital tied up
5). Postponed management
It is easy to realise that these objectives are complementary to each other. For example, a primary objective of increased throughput in the supply chain must be supported by a secondary objective to reduce cycle time. A reduction in processing time and set-up time will allow smaller batches to be processed faster, thereby lessening congestion in the system and registering shorter cycle time. This will also create increased throughput, and consequently, a higher revenue stream in the supply chain. As a result of this improvement in the supply chain, the tertiary objective of reduced inventory at different stages, which supports both the primary and secondary objectives, can be realized, since inventory at different stages will not have to wait for the availability of operations for further processing.
Objectives can be set both at the group level for the supply chain, and at member level for individual members. However, the two sets of objectives ought to be coordinated in order to be effective performance measures for the supply chain. This may require tuning individual objectives of members so that common supply chain objectives can be met.
3.2.4.2. Modeling principles
In general, the principles support objectives for manufacturing the supply chain. By applying these principles, out-of-control processes, inefficient logistics, and inefficiencies that are inherently present in any system, can be developed. These principles are:
1). Reducing the influence of lead time variability in the productive system
The influence of lead-time can be felt in the supply chain at any stages of its life cycle. The transformation of product through various stages in its life cycle brings out various cycle time performances, such as set-up time, process time,
Chapter 3 Theoretical Frame of Reference _______________________________________________________
28
queue time, wait time, and idle time. One of the primary challenges in managing supply chain is to reduce variability of these cycle time elements. This is mainly accomplished by designing coordination mechanisms through sharing information in the form of demand schedules, capacity plans, production schedules, etc.
For example:
• Set-up time can be shortened by ensuring constant demand in the system. • Process time variations can be reduced or eliminated by standardizing
methods and procedures. • Queue time can be eliminated by coordinating schedules between
servers, so elapsed time for service can be minimized and server efficiency can be improved.
• Idle time can be eliminated or shortened by scheduling maintenance of productive resourced.
2). Reducing the influence of inventory variability at different stages and locations in the supply chain
Inventory variability is a serious challenge in the management of a supply chain. This is primarily because the material flow in a supply chain takes on many forms through its life cycle and thus assumes various inventory classifications.
Various types of inventories are created throughout the material transformation. Raw material production is a continuous manufacturing process, where batches are introduced in order to achieve economies of scale and production efficiencies. However, batches of production cause inventory (or cycle stock). Production may impose sequence dependencies between processes, or create goods-in-transit for a multi-echelon assembly line set-up. Decoupling stocks may also be created, if, for example, an end product of one process (unprocessed goods) and a raw material for the next process are warehoused to achieve production economies. Material flow at the next stage required producing following materials. Anticipation inventories may be created. Work-in-process inventories may be created for the following assembly of various components. Finally, consumers' demand patterns, product characteristics, and
______________________________________________________
29
School of Economics and Commercial Law Göteborg University
customer service levels dictate maintaining safety stocks to avoid stock-outs.
3). Reducing the influence of batching effects variability in the productive system
This principle prescribes that the relationship between lot size and lead-time should be closely managed in a manufacturing supply chain. Two types of effects that emerge from this relationship are batching effect, and saturation effect24.
Batch Effect. The rationale behind this effect is that an increase in lot size should also increase lead-time. For example, a batch of one unit can immediately move to the next operation as soon as the processing is complete. However, a batch of five units does not move until all five units are completed. That is, the first unit waits until the other four units are completed before it moves to the next operation. A doubling of the batch size to ten units requires the first unit to wait for the processing of remaining nine units. Large batches will cause longer delays of parts waiting for the rest of the batch to be completed.
Saturation Effect. The principle behind this effect is that saturation effect works conversely to the batching effect. That is, when lot sizes decrease, and set-up is not reduced, lead-time will eventually increase. The reason is that if demand stays the same, as lot sizes are reduced, there will be more lots in the shop. This results in more time spent on set-ups and less time available for processing. As a result, demand becomes a relatively larger proportion of available capacity and congestion increases.
Since the effects of the two phenomena are opposite, the aggregate behaviour of lead-time as a function of lot size assumes a convex or a U-shape. In the final analysis, however, by making the transfer batch smaller than the production batch, production lead-time can be substantially reduced.
4). Reducing the influence of variability due to bottleneck operations in
the supply chain
24 Karmarkar et al., 1985; Graves et al., 1993; Sipper, and Bulfin, 1997
Chapter 3 Theoretical Frame of Reference _______________________________________________________
30
This principle actually means, rather than balancing capacities that the flow of product through the system should be balanced, i.e., the modelling of waste management should be designed to control throughput and work-in-process inventory simultaneously. This will require converting a bottleneck activity to non-bottleneck activity in the supply chain. This can be achieved by creating buffers due to time, inventory, lead-time, etc. so as to allow the bottleneck activity to be synchronized with the succeeding non-bottleneck activity. A bottleneck operation becomes the control point whose production rate controls the pace of the system. This bottleneck enables execution of policies that create a buffer before the control point so that it gets a deviation to synchronize its actions with downstream operations in the supply chain. A rope in the form of feedback of information from the bottleneck operations to upstream operations enables the pipeline to maintain its throughput.
3.2.4.3. Developing coordinated strategies
The supply chain management perspective enables developing interaction between production and marketing policies in the supply process of raw materials and the production of finished products. The element of coordination in developing effective strategies for a manufacturing supply chain is built by incorporating planning and control function as the integration unit.
The coordination of the end product is effected with the help of a common model that performs the planning and controlling functions of the supply chain. In this manner, common policies agreed to among various members of the supply chain are implemented. For example, it may be possible to enforce common quotas for capacities, mutually agreeing to price and cost structures, as well as production schedules, etc.
3.2.4.4. Implementation
Thus, while the focus of the single product supply chain is different, similarities in approaches to design goals and objectives and model various principles should enable the developing of structural solutions to problem solving for diverse industry environments. These principles shall be applied individually.
______________________________________________________
31
School of Economics and Commercial Law Göteborg University
3.3 Supply Channel in Inbound Logistics Process
3.3.1 Inbound Logistics – What Is It?
One convenient way to view the supply chin for a single company is to divide its logistics system into inbound logistics (material management and procurement) and outbound logistics (customer service and channels of distribution).25
Inbound logistics does not have an agreed-upon definition in the industry. Several questions arise when one attempts to define the term, for example: Where is the "in" in inbound? Is outbound the opposite of inbound?
Clearly the definition of inbound logistics is a matter of perspective. If you are the receiver of a shipment, the shipment is inbound to you; if you initiate or send a shipment – as a raw materials supplier, manufacturer or vendor might do – then it is outbound from you.
Seen from the supply chain perspective, it follows that the sequence for the material flow from origin to final consumption, this is a rather complex network, there are some layers of supplier and layers of distributors, this network is centralised in one point, that is the manufacturer, also defined as OEM (Original Equipment Manufacturer). Before OEM, all the material can be seen as an unfinished product, and after it has been changed into a finished product it will have progressed further in the distribution process. According to this production characteristic, we define our inbound process in the material transit flow between product manufacturer and its customer, that is to say, the inbound logistics process is the flow from the raw material supplier to OEM, and the outbound as the finished product from OEM to the end user.
The inbound logistics service company plans shipments for the manufacture "in" to their location, but the material supply comes from many origins. Suddenly the transportation process becomes infinitely complex. With this complexity come more opportunities to reduce transportation costs – if transportation is well managed.
25 Coly. Bardi
Chapter 3 Theoretical Frame of Reference _______________________________________________________
32
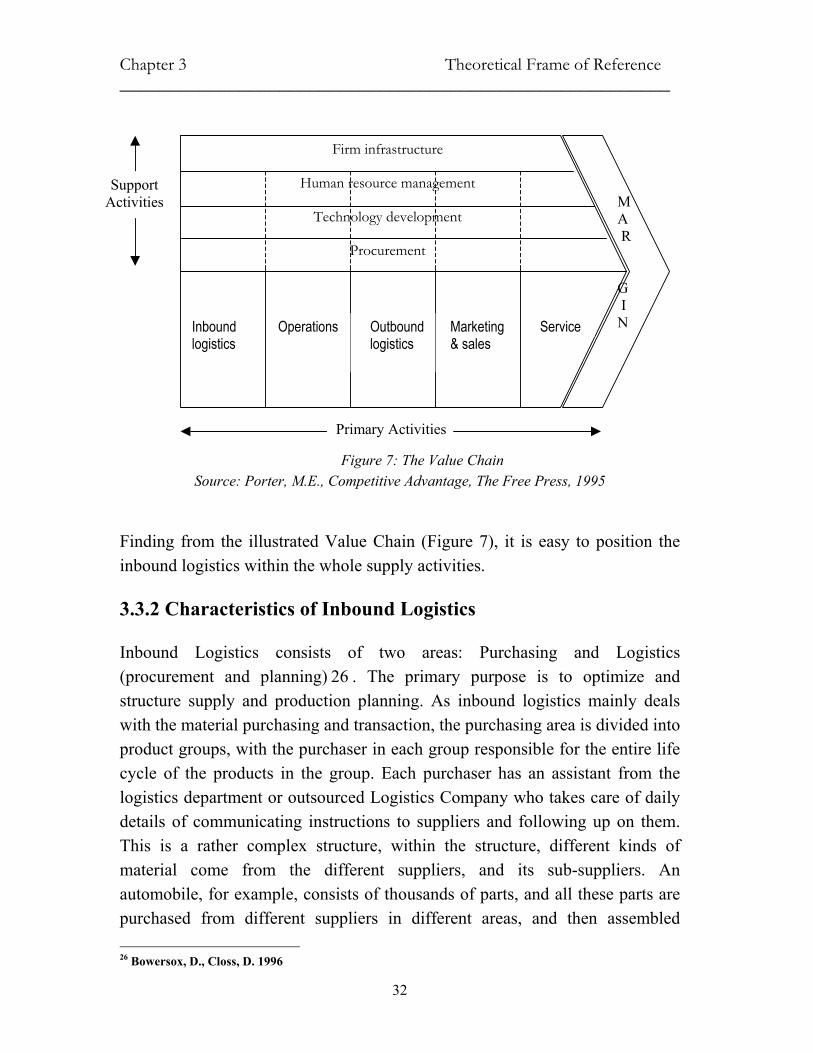
Figure 7: The Value Chain Source: Porter, M.E., Competitive Advantage, The Free Press, 1995
Finding from the illustrated Value Chain (Figure 7), it is easy to position the inbound logistics within the whole supply activities.
3.3.2 Characteristics of Inbound Logistics
Inbound Logistics consists of two areas: Purchasing and Logistics (procurement and planning) 26 . The primary purpose is to optimize and structure supply and production planning. As inbound logistics mainly deals with the material purchasing and transaction, the purchasing area is divided into product groups, with the purchaser in each group responsible for the entire life cycle of the products in the group. Each purchaser has an assistant from the logistics department or outsourced Logistics Company who takes care of daily details of communicating instructions to suppliers and following up on them. This is a rather complex structure, within the structure, different kinds of material come from the different suppliers, and its sub-suppliers. An automobile, for example, consists of thousands of parts, and all these parts are purchased from different suppliers in different areas, and then assembled 26 Bowersox, D., Closs, D. 1996
Firm infrastructure
Human resource management
Technology development
Procurement
M A R G I N Inbound
logistics Outbound logistics
Marketing & sales
Operations Service
Support Activities
Primary Activities
______________________________________________________
33
School of Economics and Commercial Law Göteborg University
together as an finished product, this car can be sold at rather a high price compared to its value of raw materials. The outbound is the process, with higher value created, and inbound process is the process without much value created, normally the value of these components and spare parts are not very costly, but this process asks for high logistics capacity for transaction, to link the complex layers of supplier in reaching to the central manufacturer. Logistics service provides coordination of production planning in order to optimize the production process with respect to both sales and supply of materials.
That means that the inbound logistics process is the part in the supply chain that has a complex procedure, lower value added and higher capital tied up. The planning and utilization of logistics and administration are very effective in reducing the overall cost. This is why we make this research in improving overall efficiency in the inbound process.
3.3.3 Inbound Logistics- A Catalyst for Supplier Collaboration
Taking greater control of inbound logistics has become a top priority for many manufacturers and retailers as they look for cost-improvement opportunities in response to the struggling economy. Companies have historically focused on their outbound operation because it is the customer-side of the business, while control of inbound operations was generally relinquished to suppliers. It is not that outbound operations have been streamlined and extracting additional benefits have become more difficult, companies are turning their attention to inbound to not only reduce costs, but also to forge more collaborative relationships with internal groups, suppliers, and transportation carriers, which ultimately results in ‘smarter’ business processes that benefit all parties27.
The manufacturer serves as the key person in the supply relation, and they have put their emphasis into controlling inbound process. It is obvious the efficient controlling may greatly increase efficiency in the processing flow, reduce inventory tied up by means of accelerating material flow circling around, it will be of mutual benefit between suppliers and manufacturers, because in this relation, the supplier becomes strategic alliance member
27 www.ARCweb.com/ inboundlogistics, July 19,2002
Chapter 3 Theoretical Frame of Reference _______________________________________________________
34
together with manufacturer.
While seen from a logistics service provider’s perspective, controlling inbound logistics process acquires higher logistics capability because in the flow moving, the just in time delivery becomes the key element for just-in-time manufacture. Between the material flow from supplier to manufacturer, the logistics service provider is so-called 3PL who acts as another key person in this relation.
3.4 Channel Relationship Management in Inbound Logistics
3.4.1 Channel Structure in Inbound Logistics
The concept of channels has long been used to analyze and understand the functions of domestic marketing and distribution. The concept is carried further and used as an aid in understanding logistics. Third parties or middlemen frequently appear in channels to facilitate their operations; they are mentioned briefly as are constraints on the smooth, uninterrupted flows through channels.
As we narrowed our channel structure from the broad supply chain network, the channel of the inbound logistics process is illustrated in the following diagram:
______________________________________________________
35
School of Economics and Commercial Law Göteborg University
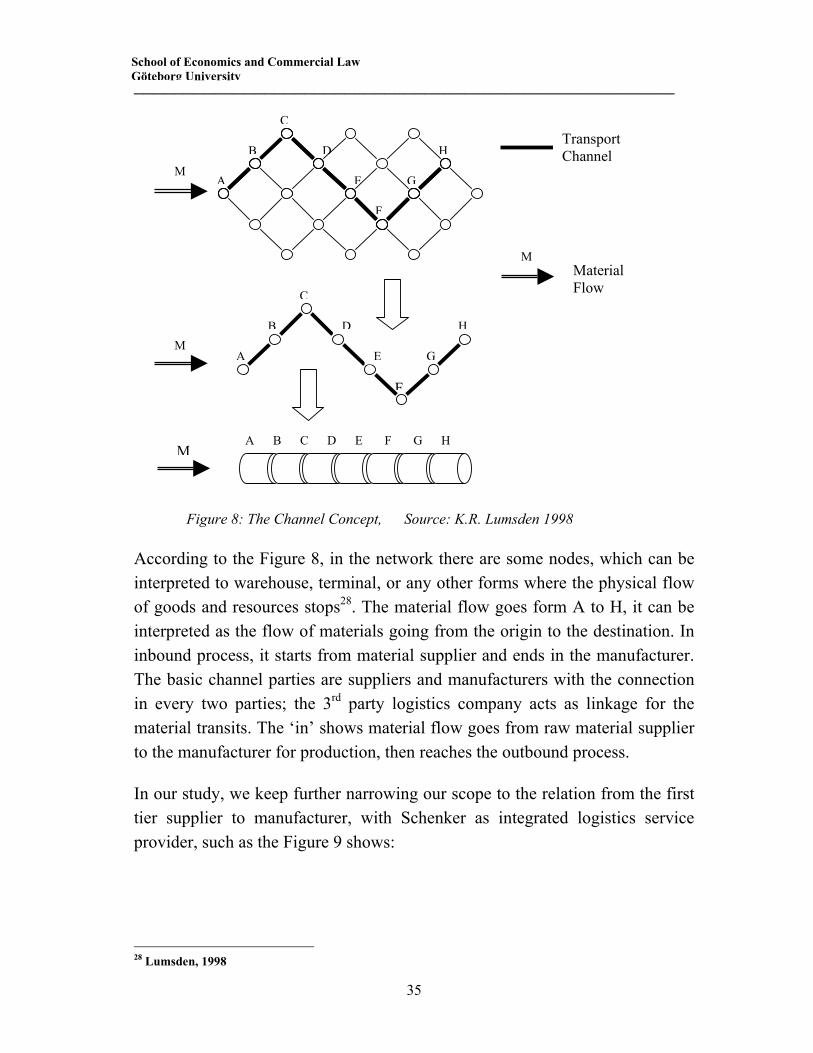
Figure 8: The Channel Concept, Source: K.R. Lumsden 1998
According to the Figure 8, in the network there are some nodes, which can be interpreted to warehouse, terminal, or any other forms where the physical flow of goods and resources stops28. The material flow goes form A to H, it can be interpreted as the flow of materials going from the origin to the destination. In inbound process, it starts from material supplier and ends in the manufacturer. The basic channel parties are suppliers and manufacturers with the connection in every two parties; the 3rd party logistics company acts as linkage for the material transits. The ‘in’ shows material flow goes from raw material supplier to the manufacturer for production, then reaches the outbound process.
In our study, we keep further narrowing our scope to the relation from the first tier supplier to manufacturer, with Schenker as integrated logistics service provider, such as the Figure 9 shows:
28 Lumsden, 1998
M
M
M
C
H
G
F
B
A
D
E
C
H
G
F
B
A
D
E
A B C D E F G H
Transport Channel
MMaterial Flow
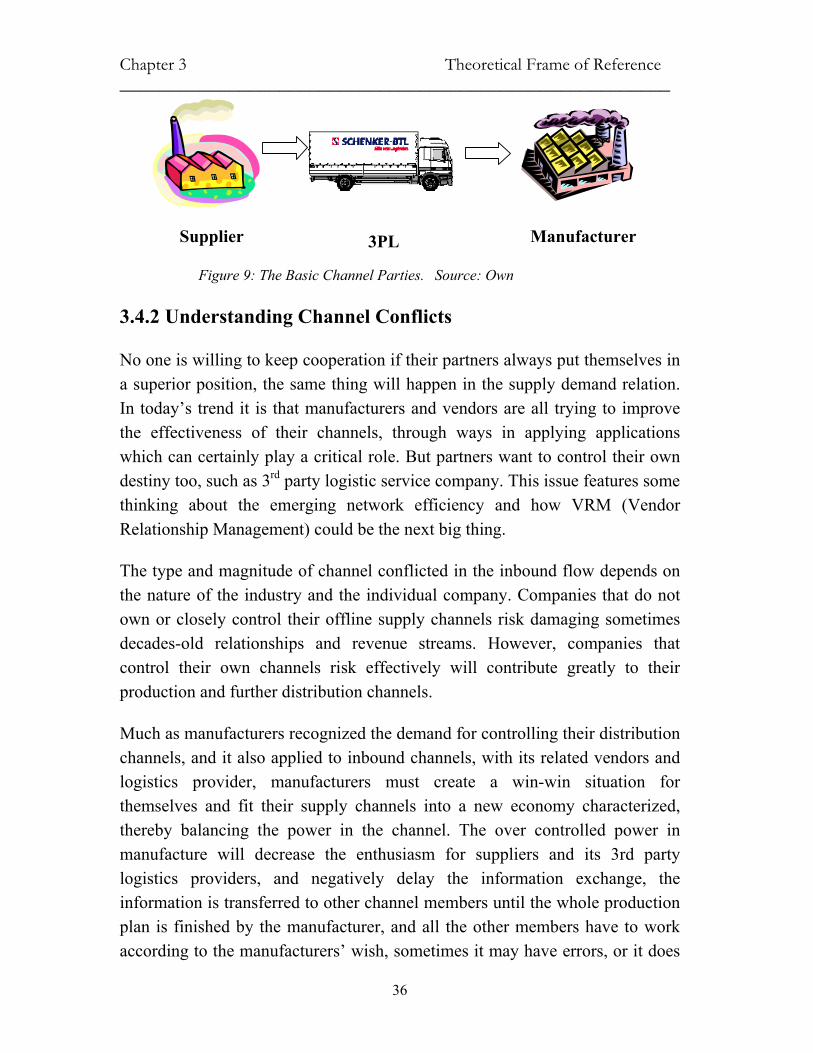
Chapter 3 Theoretical Frame of Reference _______________________________________________________
36
Figure 9: The Basic Channel Parties. Source: Own
3.4.2 Understanding Channel Conflicts
No one is willing to keep cooperation if their partners always put themselves in a superior position, the same thing will happen in the supply demand relation. In today’s trend it is that manufacturers and vendors are all trying to improve the effectiveness of their channels, through ways in applying applications which can certainly play a critical role. But partners want to control their own destiny too, such as 3rd party logistic service company. This issue features some thinking about the emerging network efficiency and how VRM (Vendor Relationship Management) could be the next big thing.
The type and magnitude of channel conflicted in the inbound flow depends on the nature of the industry and the individual company. Companies that do not own or closely control their offline supply channels risk damaging sometimes decades-old relationships and revenue streams. However, companies that control their own channels risk effectively will contribute greatly to their production and further distribution channels.
Much as manufacturers recognized the demand for controlling their distribution channels, and it also applied to inbound channels, with its related vendors and logistics provider, manufacturers must create a win-win situation for themselves and fit their supply channels into a new economy characterized, thereby balancing the power in the channel. The over controlled power in manufacture will decrease the enthusiasm for suppliers and its 3rd party logistics providers, and negatively delay the information exchange, the information is transferred to other channel members until the whole production plan is finished by the manufacturer, and all the other members have to work according to the manufacturers’ wish, sometimes it may have errors, or it does
Supplier Manufacturer 3PL
______________________________________________________
37
School of Economics and Commercial Law Göteborg University
not match all members schedule. Manufacturers and vendors must combine efforts to acquire and satisfy empowered consumers by sharing product demands, production plan, purchasing forecast etc.
One convenient way to view the supply chain for a single company is to divide its logistics system into inbound logistics (material management and procurement) and outbound logistics (customer service and channels of distribution).29
3.4.3 Channel Relationship Management
It is more profitable to retain and grow business with existing customers than to keep on winning new customers. Many businesses sell their products and services to the end user through partners, distributors, dealers, retailers, financial intermediaries, and other similar channels. This process raises some important issues in seeking an effective customer relationship process and systems. In inbound channel, some of the frequently issues raised are:
• Who owns the customer? • Who 'owns' for production purposes? • What is the lifecycle of the product? • What will happen if (when) the relationship with the intermediary
changes? • How do outsourced services fit into the relationship building or
management process?
From the above illustrated channel relation, viewed from the supply chain management perspective, serving as key person in this relation, the manufacturer normally plays the dominate position in between the channel relation, the material demand will be determined according to its real time demands, then the following procurement and supply schedule can be made, and to set up the cooperative relation to its supplier and logistics service is critical to manufacturers in accelerating its product life cycle, in this sense, manufacturers must evaluate the following factors when determining the right level of cooperation or when assessing their channel power:
29 Coly. Bardi
Chapter 3 Theoretical Frame of Reference _______________________________________________________
38
• Partner Involvement: The larger and less frequent a purchase, the more effort and consideration a supplier exerts during the buying process;
• Competitive Intensity: The level of competition within both the retail and manufacturing segments will also be a factor in channel strategy since it is a key determinant of market power (e.g., the more retailers there are then the stronger the manufacturer's position);
• Organizational Capabilities: Internal factors will also shape a channel strategy. Financial position, technological and human resources, organizational structure, fulfillment and marketing capabilities, etc.
• Strategic positioning for channel members: based upon the analysis of the product supply relation, positioning for the channel parties is key to regulate the channel relation and will further contribute to cooperation.
In the demand and supply chain, proper analysis for the channel relation and defining channel conflict will help to find the way for balancing power in the channel, and then devise channel strategies for turning conflict into cooperation.30 This relationship improvement is the starting point for further analysis of our supply chain model hypothesis.
3.5 The Logistical Measurements
The final target, for most of business operations, is to reap profit. Thus as far as it has been established, the logistic of an enterprise is an integrated effort aimed at helping create customer value at the lowest cost level. At a strategic level, logistic managers seek to achieve a previously agreed quality of customer service through state-of-the-art operating competency. The challenge is to balance service expectations and cost expenditure in a manner that achieve business profitability.31 In Figure 10 the traditional Du-Pont model is revised according to logistic operational perspective.
30 http://www.reshare.com/understandingcc.htm, Date 24-08-2002 31 Bowersox. D. & Closs.D. 1996, p8
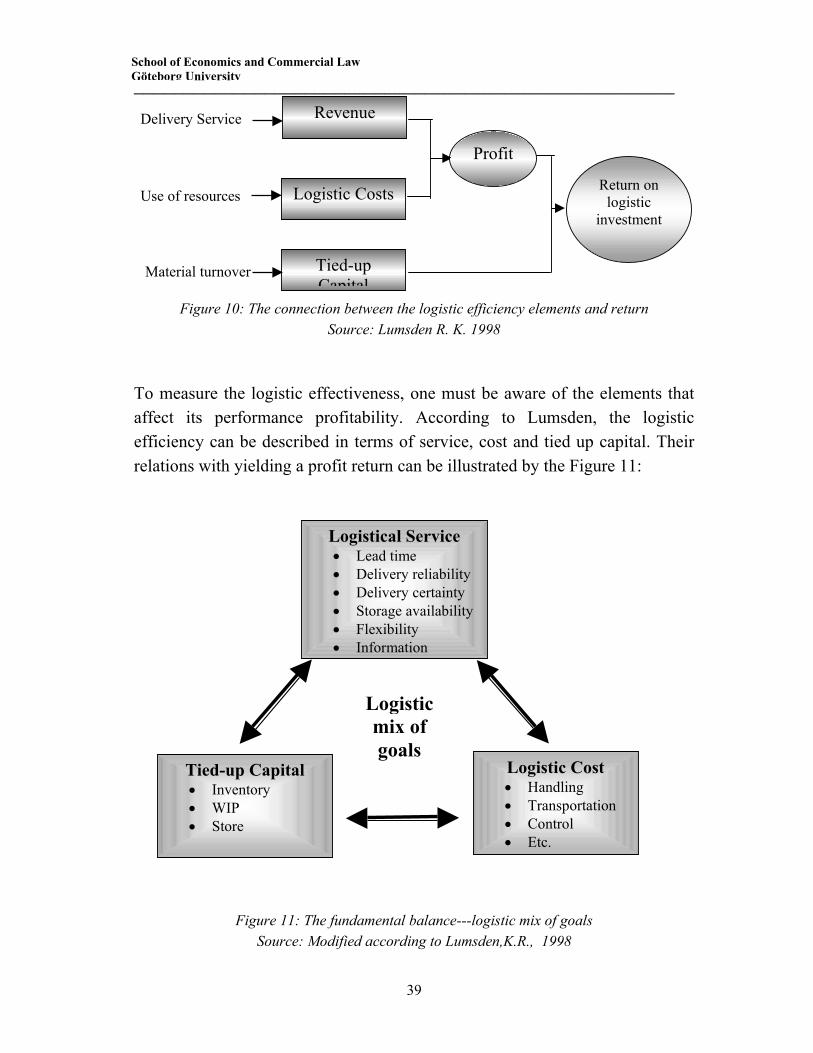
______________________________________________________
39
School of Economics and Commercial Law Göteborg University
Figure 10: The connection between the logistic efficiency elements and return Source: Lumsden R. K. 1998
To measure the logistic effectiveness, one must be aware of the elements that affect its performance profitability. According to Lumsden, the logistic efficiency can be described in terms of service, cost and tied up capital. Their relations with yielding a profit return can be illustrated by the Figure 11:
Figure 11: The fundamental balance---logistic mix of goals Source: Modified according to Lumsden,K.R., 1998
Delivery Service
Use of resources Logistic Costs
Tied-up Capital
Revenue
Material turnover
Profit
Return on logistic
investment
Logistical Service • Lead time • Delivery reliability • Delivery certainty • Storage availability• Flexibility • Information
Logistic Cost • Handling • Transportation • Control • Etc.
Tied-up Capital • Inventory • WIP • Store
Logistic mix of goals
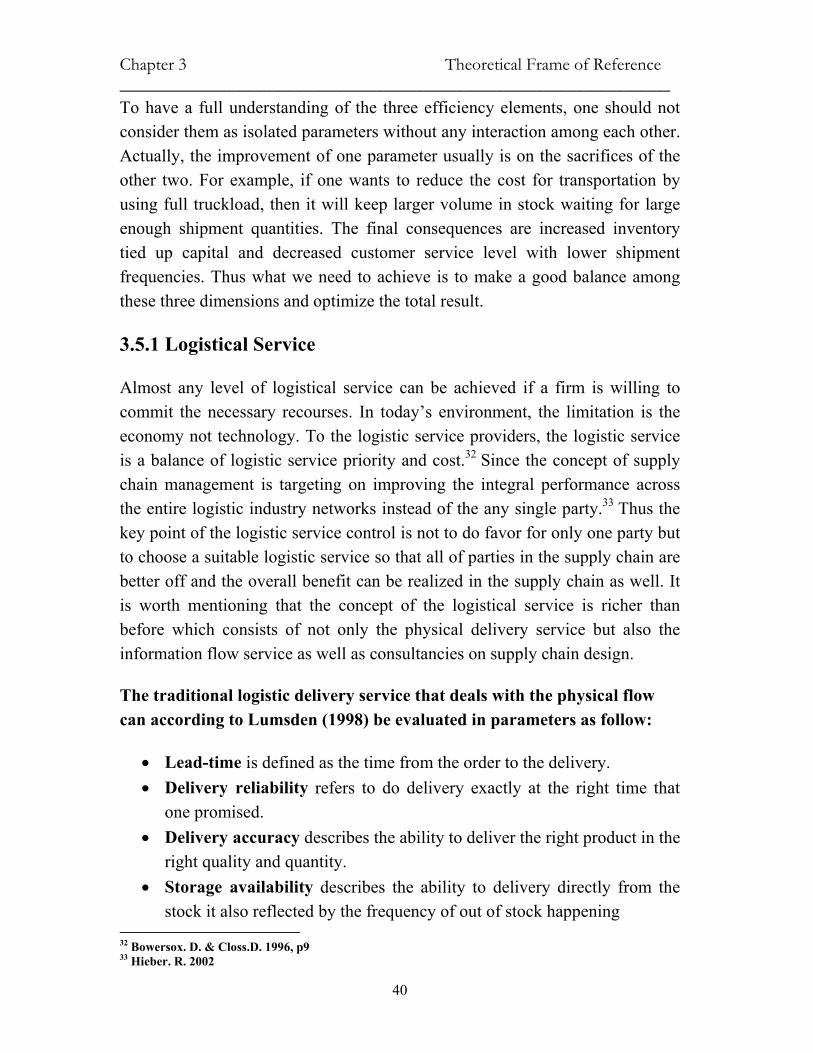
Chapter 3 Theoretical Frame of Reference _______________________________________________________
40
To have a full understanding of the three efficiency elements, one should not consider them as isolated parameters without any interaction among each other. Actually, the improvement of one parameter usually is on the sacrifices of the other two. For example, if one wants to reduce the cost for transportation by using full truckload, then it will keep larger volume in stock waiting for large enough shipment quantities. The final consequences are increased inventory tied up capital and decreased customer service level with lower shipment frequencies. Thus what we need to achieve is to make a good balance among these three dimensions and optimize the total result.
3.5.1 Logistical Service
Almost any level of logistical service can be achieved if a firm is willing to commit the necessary recourses. In today’s environment, the limitation is the economy not technology. To the logistic service providers, the logistic service is a balance of logistic service priority and cost.32 Since the concept of supply chain management is targeting on improving the integral performance across the entire logistic industry networks instead of the any single party.33 Thus the key point of the logistic service control is not to do favor for only one party but to choose a suitable logistic service so that all of parties in the supply chain are better off and the overall benefit can be realized in the supply chain as well. It is worth mentioning that the concept of the logistical service is richer than before which consists of not only the physical delivery service but also the information flow service as well as consultancies on supply chain design.
The traditional logistic delivery service that deals with the physical flow can according to Lumsden (1998) be evaluated in parameters as follow:
• Lead-time is defined as the time from the order to the delivery. • Delivery reliability refers to do delivery exactly at the right time that
one promised. • Delivery accuracy describes the ability to deliver the right product in the
right quality and quantity. • Storage availability describes the ability to delivery directly from the
stock it also reflected by the frequency of out of stock happening 32 Bowersox. D. & Closs.D. 1996, p9 33 Hieber. R. 2002
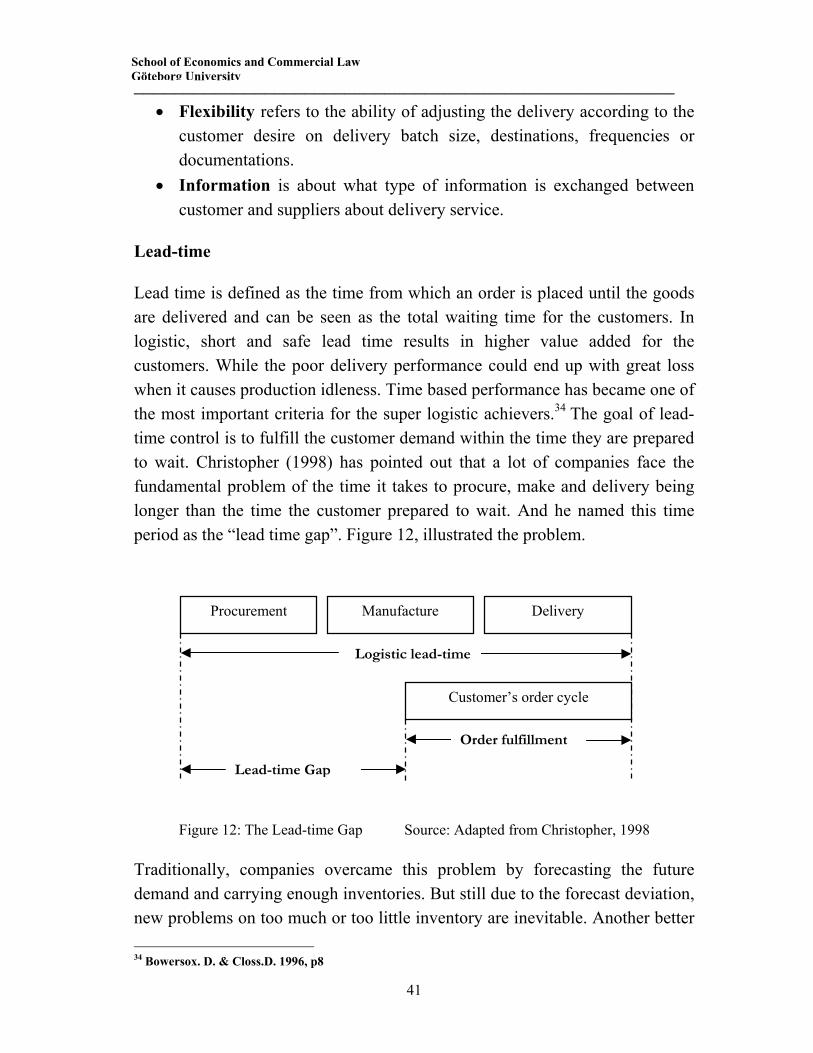
______________________________________________________
41
School of Economics and Commercial Law Göteborg University
• Flexibility refers to the ability of adjusting the delivery according to the customer desire on delivery batch size, destinations, frequencies or documentations.
• Information is about what type of information is exchanged between customer and suppliers about delivery service.
Lead-time
Lead time is defined as the time from which an order is placed until the goods are delivered and can be seen as the total waiting time for the customers. In logistic, short and safe lead time results in higher value added for the customers. While the poor delivery performance could end up with great loss when it causes production idleness. Time based performance has became one of the most important criteria for the super logistic achievers.34 The goal of lead-time control is to fulfill the customer demand within the time they are prepared to wait. Christopher (1998) has pointed out that a lot of companies face the fundamental problem of the time it takes to procure, make and delivery being longer than the time the customer prepared to wait. And he named this time period as the “lead time gap”. Figure 12, illustrated the problem.
Figure 12: The Lead-time Gap Source: Adapted from Christopher, 1998
Traditionally, companies overcame this problem by forecasting the future demand and carrying enough inventories. But still due to the forecast deviation, new problems on too much or too little inventory are inevitable. Another better 34 Bowersox. D. & Closs.D. 1996, p8
Procurement Manufacture Delivery
Logistic lead-time
Customer’s order cycle
Order fulfillment
Lead-time Gap
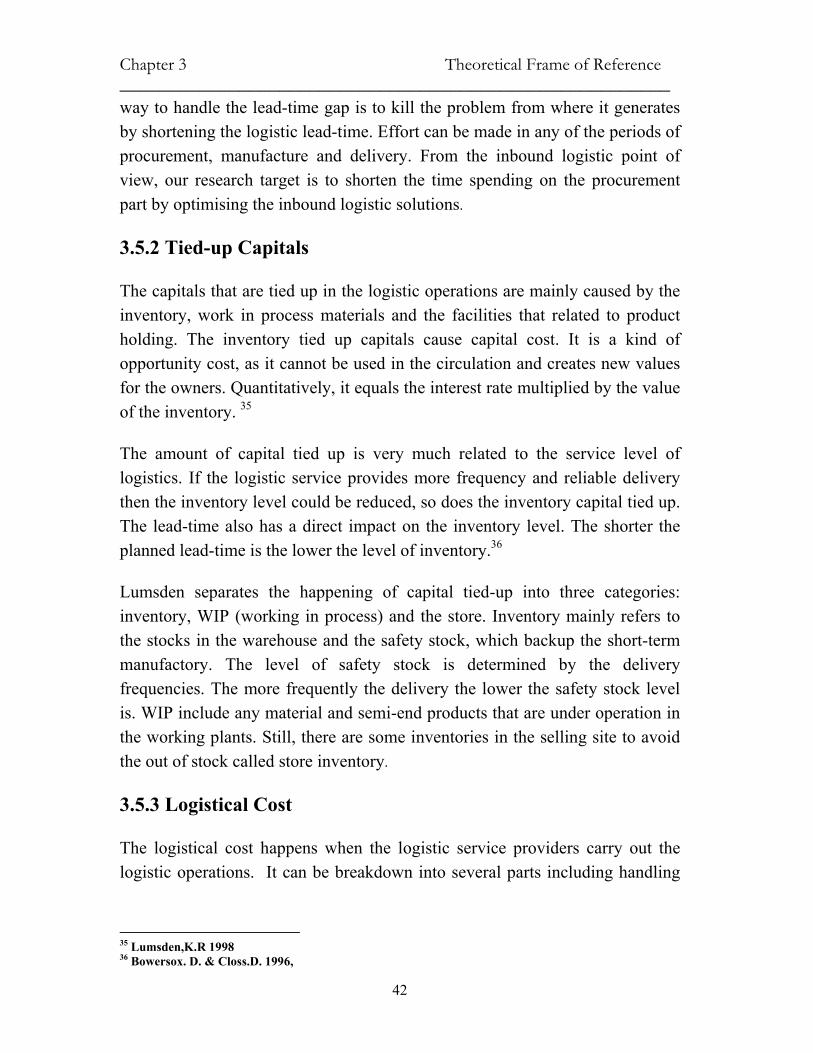
Chapter 3 Theoretical Frame of Reference _______________________________________________________
42
way to handle the lead-time gap is to kill the problem from where it generates by shortening the logistic lead-time. Effort can be made in any of the periods of procurement, manufacture and delivery. From the inbound logistic point of view, our research target is to shorten the time spending on the procurement part by optimising the inbound logistic solutions.
3.5.2 Tied-up Capitals
The capitals that are tied up in the logistic operations are mainly caused by the inventory, work in process materials and the facilities that related to product holding. The inventory tied up capitals cause capital cost. It is a kind of opportunity cost, as it cannot be used in the circulation and creates new values for the owners. Quantitatively, it equals the interest rate multiplied by the value of the inventory. 35
The amount of capital tied up is very much related to the service level of logistics. If the logistic service provides more frequency and reliable delivery then the inventory level could be reduced, so does the inventory capital tied up. The lead-time also has a direct impact on the inventory level. The shorter the planned lead-time is the lower the level of inventory.36
Lumsden separates the happening of capital tied-up into three categories: inventory, WIP (working in process) and the store. Inventory mainly refers to the stocks in the warehouse and the safety stock, which backup the short-term manufactory. The level of safety stock is determined by the delivery frequencies. The more frequently the delivery the lower the safety stock level is. WIP include any material and semi-end products that are under operation in the working plants. Still, there are some inventories in the selling site to avoid the out of stock called store inventory.
3.5.3 Logistical Cost
The logistical cost happens when the logistic service providers carry out the logistic operations. It can be breakdown into several parts including handling
35 Lumsden,K.R 1998 36 Bowersox. D. & Closs.D. 1996,
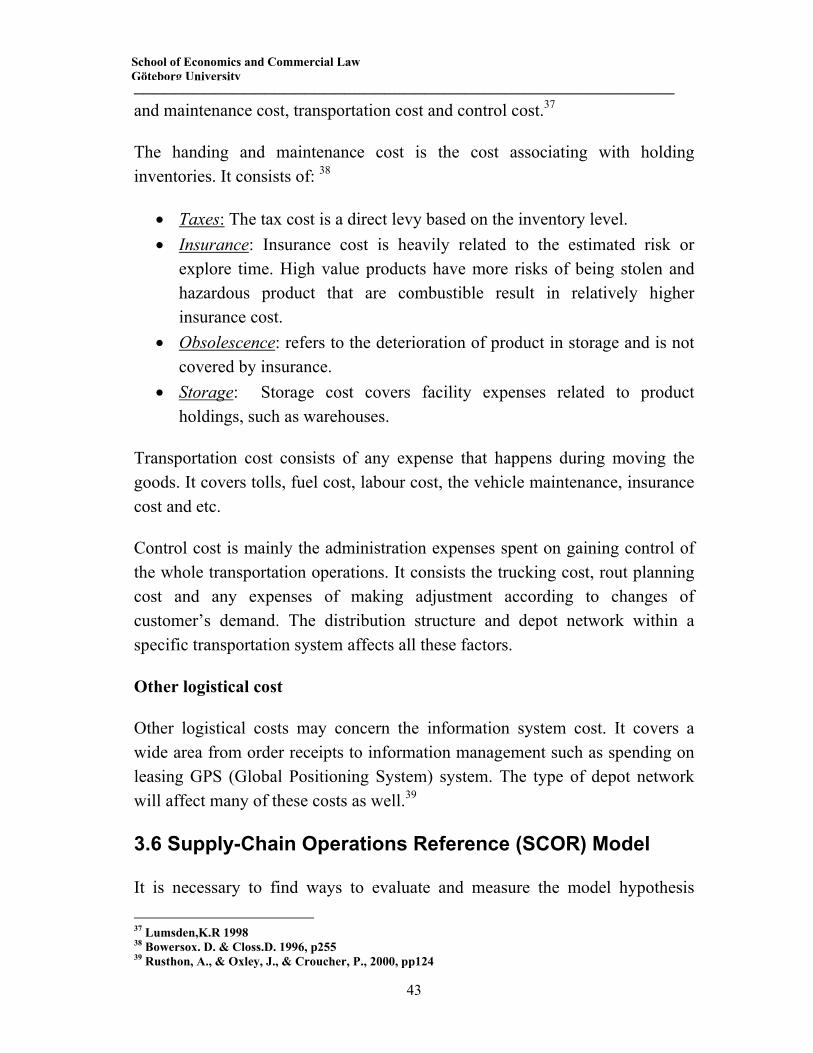
______________________________________________________
43
School of Economics and Commercial Law Göteborg University
and maintenance cost, transportation cost and control cost.37
The handing and maintenance cost is the cost associating with holding inventories. It consists of: 38
• Taxes: The tax cost is a direct levy based on the inventory level. • Insurance: Insurance cost is heavily related to the estimated risk or
explore time. High value products have more risks of being stolen and hazardous product that are combustible result in relatively higher insurance cost.
• Obsolescence: refers to the deterioration of product in storage and is not covered by insurance.
• Storage: Storage cost covers facility expenses related to product holdings, such as warehouses.
Transportation cost consists of any expense that happens during moving the goods. It covers tolls, fuel cost, labour cost, the vehicle maintenance, insurance cost and etc.
Control cost is mainly the administration expenses spent on gaining control of the whole transportation operations. It consists the trucking cost, rout planning cost and any expenses of making adjustment according to changes of customer’s demand. The distribution structure and depot network within a specific transportation system affects all these factors.
Other logistical cost
Other logistical costs may concern the information system cost. It covers a wide area from order receipts to information management such as spending on leasing GPS (Global Positioning System) system. The type of depot network will affect many of these costs as well.39
3.6 Supply-Chain Operations Reference (SCOR) Model
It is necessary to find ways to evaluate and measure the model hypothesis 37 Lumsden,K.R 1998 38 Bowersox. D. & Closs.D. 1996, p255 39 Rusthon, A., & Oxley, J., & Croucher, P., 2000, pp124
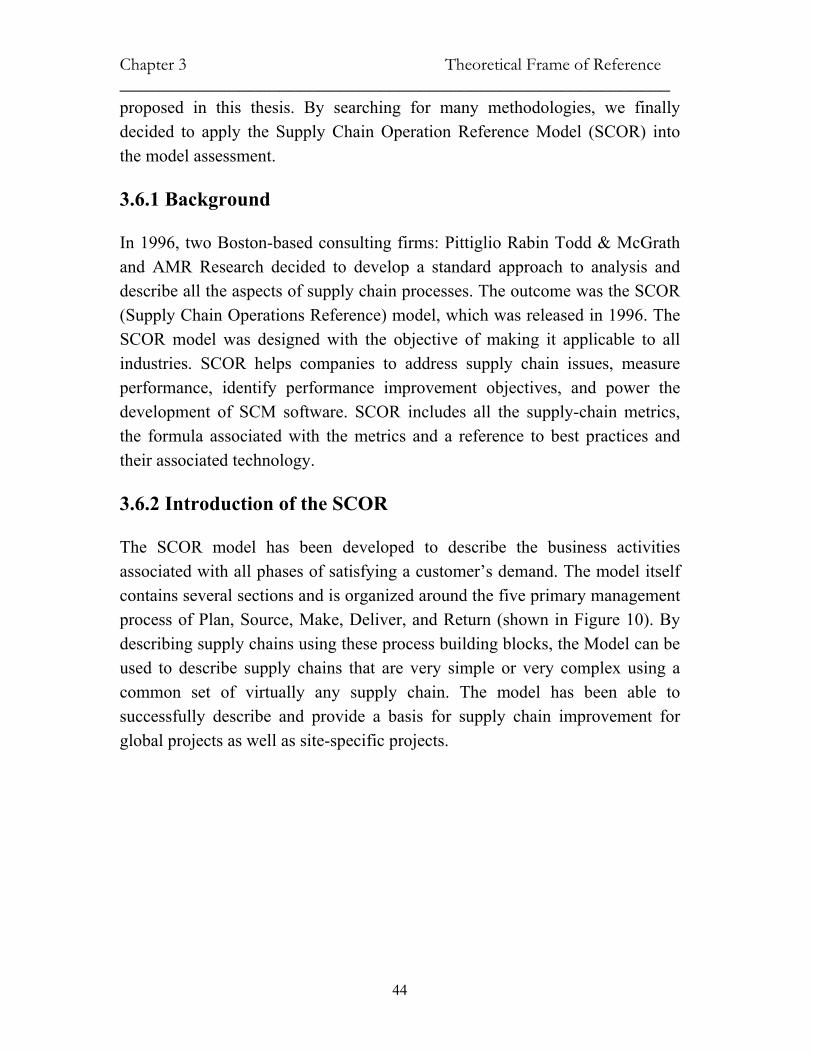
Chapter 3 Theoretical Frame of Reference _______________________________________________________
44
proposed in this thesis. By searching for many methodologies, we finally decided to apply the Supply Chain Operation Reference Model (SCOR) into the model assessment.
3.6.1 Background
In 1996, two Boston-based consulting firms: Pittiglio Rabin Todd & McGrath and AMR Research decided to develop a standard approach to analysis and describe all the aspects of supply chain processes. The outcome was the SCOR (Supply Chain Operations Reference) model, which was released in 1996. The SCOR model was designed with the objective of making it applicable to all industries. SCOR helps companies to address supply chain issues, measure performance, identify performance improvement objectives, and power the development of SCM software. SCOR includes all the supply-chain metrics, the formula associated with the metrics and a reference to best practices and their associated technology.
3.6.2 Introduction of the SCOR
The SCOR model has been developed to describe the business activities associated with all phases of satisfying a customer’s demand. The model itself contains several sections and is organized around the five primary management process of Plan, Source, Make, Deliver, and Return (shown in Figure 10). By describing supply chains using these process building blocks, the Model can be used to describe supply chains that are very simple or very complex using a common set of virtually any supply chain. The model has been able to successfully describe and provide a basis for supply chain improvement for global projects as well as site-specific projects.
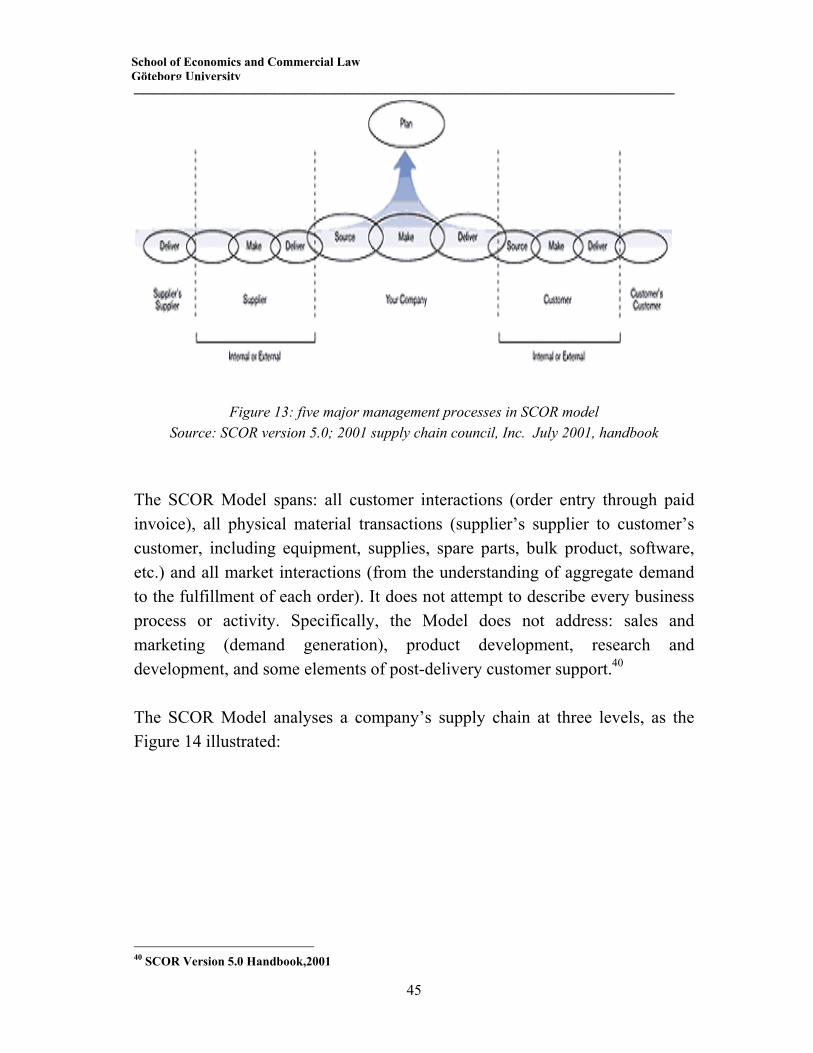
______________________________________________________
45
School of Economics and Commercial Law Göteborg University
Figure 13: five major management processes in SCOR model Source: SCOR version 5.0; 2001 supply chain council, Inc. July 2001, handbook
The SCOR Model spans: all customer interactions (order entry through paid invoice), all physical material transactions (supplier’s supplier to customer’s customer, including equipment, supplies, spare parts, bulk product, software, etc.) and all market interactions (from the understanding of aggregate demand to the fulfillment of each order). It does not attempt to describe every business process or activity. Specifically, the Model does not address: sales and marketing (demand generation), product development, research and development, and some elements of post-delivery customer support.40 The SCOR Model analyses a company’s supply chain at three levels, as the Figure 14 illustrated:
40 SCOR Version 5.0 Handbook,2001
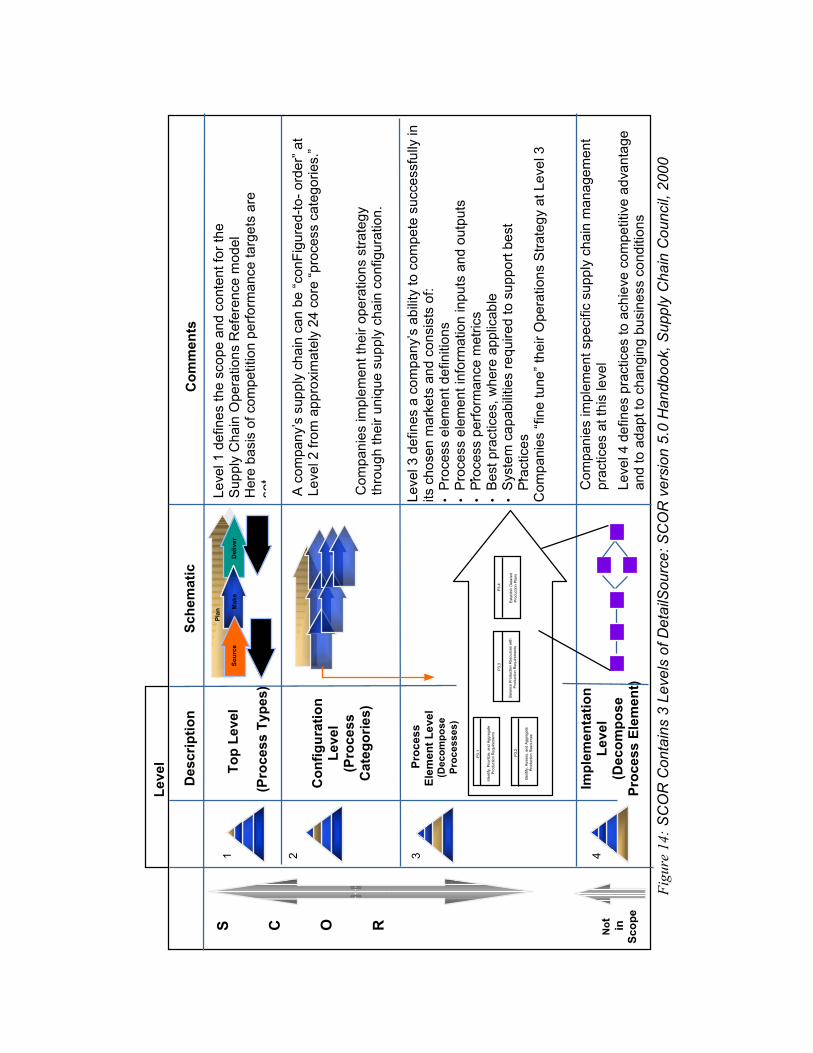
Figu
re 1
4: S
CO
R C
onta
ins
3 Le
vels
of D
etai
lSou
rce:
SC
OR
ver
sion
5.0
Han
dboo
k, S
uppl
y C
hain
Cou
ncil,
200
0
Leve
l Sc
hem
atic
Com
men
ts
1 2 3 4
Con
figur
atio
n Le
vel
(Pro
cess
C
ateg
orie
s)
Proc
ess
Elem
ent L
evel
(Dec
ompo
sePr
oces
ses)
Plan
Del
iver
Mak
eSo
urce
A co
mpa
ny’s
sup
ply
chai
n ca
n be
“con
Figu
red-
to- o
rder
” at
Leve
l 2 fr
om a
ppro
xim
atel
y 24
cor
e “p
roce
ss c
ateg
orie
s.”
Com
pani
es im
plem
ent t
heir
oper
atio
ns s
trate
gy
thro
ugh
thei
r uni
que
supp
ly c
hain
con
figur
atio
n.
Leve
l 3 d
efin
es a
com
pany
’s a
bilit
y to
com
pete
suc
cess
fully
in
its c
hose
n m
arke
ts a
nd c
onsi
sts
of:
• Pr
oces
s el
emen
t def
initi
ons
•
Proc
ess
elem
ent i
nfor
mat
ion
inpu
ts a
nd o
utpu
ts
• Pr
oces
s pe
rform
ance
met
rics
•
Best
pra
ctic
es, w
here
app
licab
le
• Sy
stem
cap
abilit
ies
requ
ired
to s
uppo
rt be
st
Pr
actic
es
Com
pani
es “f
ine
tune
” the
ir O
pera
tions
Stra
tegy
at L
evel
3
• •
Impl
emen
tatio
n Le
vel
(Dec
ompo
se
Proc
ess
Elem
ent)
Com
pani
es im
plem
ent s
peci
fic s
uppl
y ch
ain
man
agem
ent
prac
tices
at t
his
leve
l Le
vel 4
def
ines
pra
ctic
es to
ach
ieve
com
petit
ive
adva
ntag
e an
d to
ada
pt to
cha
ngin
g bu
sine
ss c
ondi
tions
S
C
O
R
Top
Leve
l
(Pro
cess
Typ
es)
Leve
l 1 d
efin
es th
e sc
ope
and
cont
ent f
or th
e Su
pply
Cha
in O
pera
tions
Ref
eren
ce m
odel
H
ere
basi
s of
com
petit
ion
perfo
rman
ce ta
rget
s ar
e se
t
Not
in
Scop
e
Des
crip
tion
Bala
nce
Prod
uctio
n R
esou
rces
with
Prod
uctio
n R
equi
rem
ents
Esta
blis
h D
etai
led
Prod
uctio
n Pl
ans
Iden
tify,
Prio
ritiz
e, a
nd A
ggre
gate
Prod
uctio
n R
equi
rem
ents
Iden
tify,
Ass
ess,
and
Agg
rega
te
Prod
uctio
n R
esou
rces
P3.1
P3.3
P3.4
P3.2
Ret
urn
Ret
urn
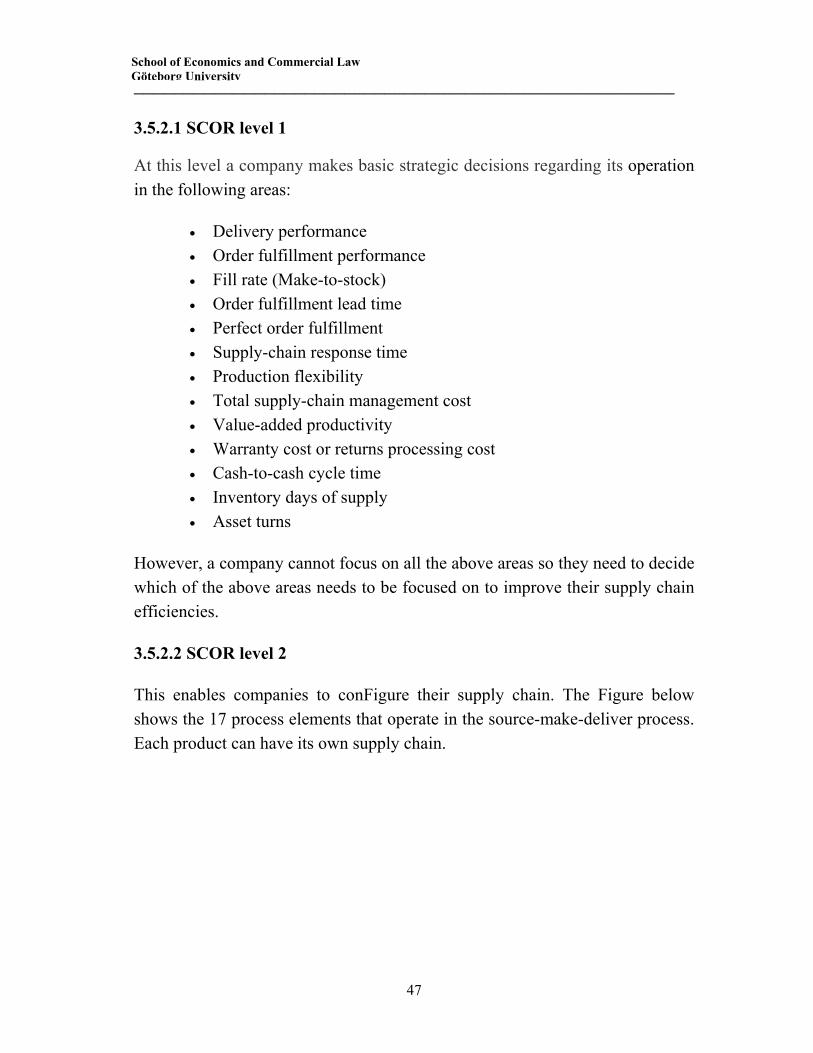
______________________________________________________
47
School of Economics and Commercial Law Göteborg University
3.5.2.1 SCOR level 1
At this level a company makes basic strategic decisions regarding its operation in the following areas:
• Delivery performance • Order fulfillment performance • Fill rate (Make-to-stock) • Order fulfillment lead time • Perfect order fulfillment • Supply-chain response time • Production flexibility • Total supply-chain management cost • Value-added productivity • Warranty cost or returns processing cost • Cash-to-cash cycle time • Inventory days of supply • Asset turns
However, a company cannot focus on all the above areas so they need to decide which of the above areas needs to be focused on to improve their supply chain efficiencies.
3.5.2.2 SCOR level 2
This enables companies to conFigure their supply chain. The Figure below shows the 17 process elements that operate in the source-make-deliver process. Each product can have its own supply chain.
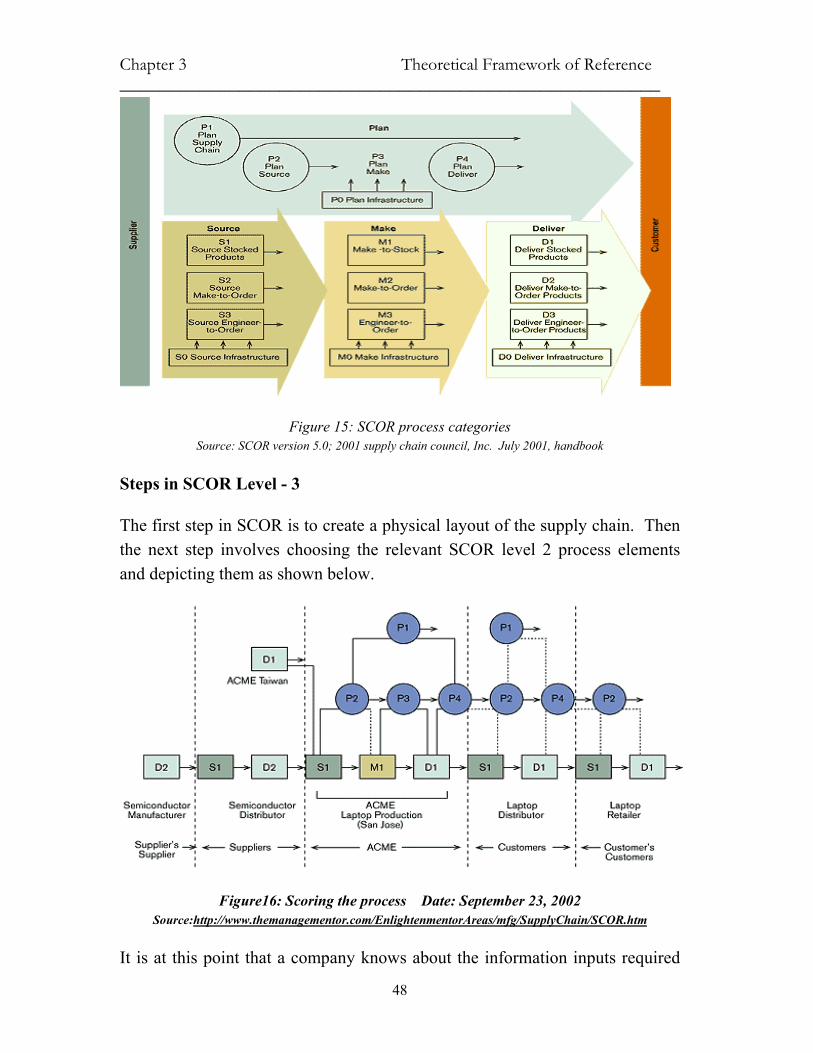
Chapter 3 Theoretical Framework of Reference ______________________________________________________
48
Figure 15: SCOR process categories Source: SCOR version 5.0; 2001 supply chain council, Inc. July 2001, handbook
Steps in SCOR Level - 3
The first step in SCOR is to create a physical layout of the supply chain. Then the next step involves choosing the relevant SCOR level 2 process elements and depicting them as shown below.
Figure16: Scoring the process Date: September 23, 2002 Source:http://www.themanagementor.com/EnlightenmentorAreas/mfg/SupplyChain/SCOR.htm
It is at this point that a company knows about the information inputs required
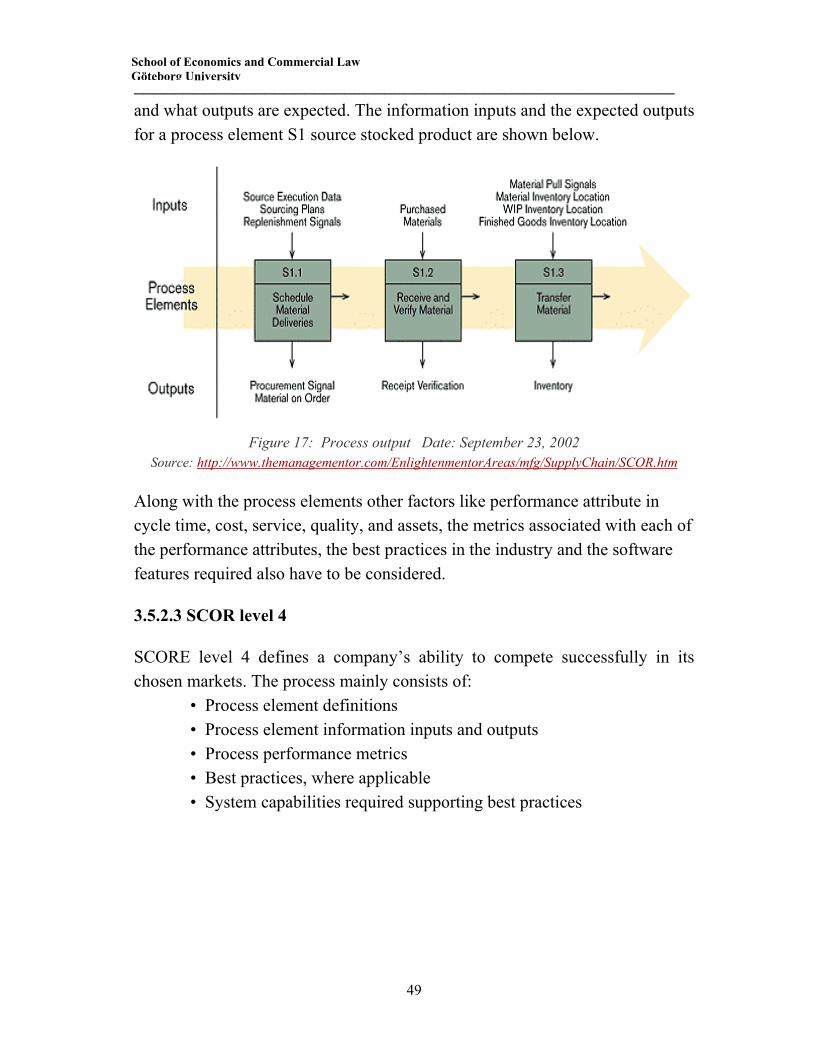
______________________________________________________
49
School of Economics and Commercial Law Göteborg University
and what outputs are expected. The information inputs and the expected outputs for a process element S1 source stocked product are shown below.
Figure 17: Process output Date: September 23, 2002 Source: http://www.themanagementor.com/EnlightenmentorAreas/mfg/SupplyChain/SCOR.htm
Along with the process elements other factors like performance attribute in cycle time, cost, service, quality, and assets, the metrics associated with each of the performance attributes, the best practices in the industry and the software features required also have to be considered.
3.5.2.3 SCOR level 4
SCORE level 4 defines a company’s ability to compete successfully in its chosen markets. The process mainly consists of:
• Process element definitions • Process element information inputs and outputs • Process performance metrics • Best practices, where applicable • System capabilities required supporting best practices
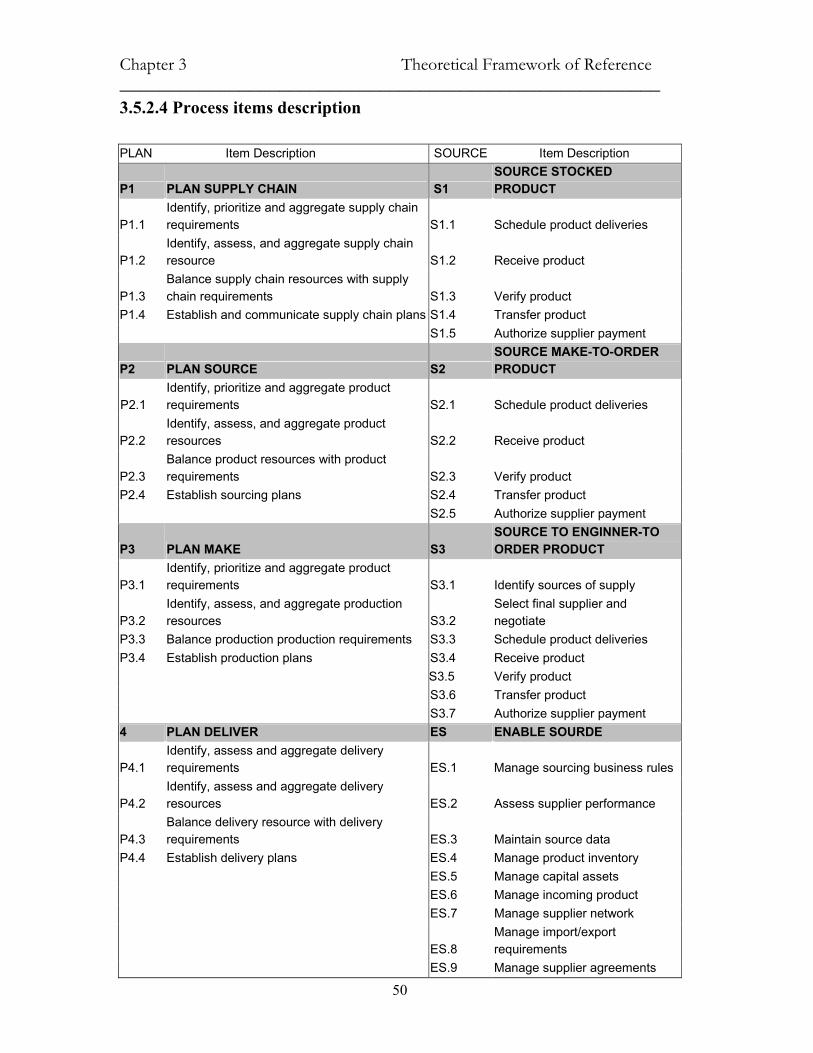
Chapter 3 Theoretical Framework of Reference ______________________________________________________
50
3.5.2.4 Process items description
PLAN Item Description SOURCE Item Description
P1 PLAN SUPPLY CHAIN S1 SOURCE STOCKED PRODUCT
P1.1 Identify, prioritize and aggregate supply chain requirements S1.1 Schedule product deliveries
P1.2 Identify, assess, and aggregate supply chain resource S1.2 Receive product
P1.3 Balance supply chain resources with supply chain requirements S1.3 Verify product
P1.4 Establish and communicate supply chain plans S1.4 Transfer product S1.5 Authorize supplier payment
P2 PLAN SOURCE S2 SOURCE MAKE-TO-ORDER PRODUCT
P2.1 Identify, prioritize and aggregate product requirements S2.1 Schedule product deliveries
P2.2 Identify, assess, and aggregate product resources S2.2 Receive product
P2.3 Balance product resources with product requirements S2.3 Verify product
P2.4 Establish sourcing plans S2.4 Transfer product S2.5 Authorize supplier payment
P3 PLAN MAKE S3 SOURCE TO ENGINNER-TO ORDER PRODUCT
P3.1 Identify, prioritize and aggregate product requirements S3.1 Identify sources of supply
P3.2 Identify, assess, and aggregate production resources S3.2
Select final supplier and negotiate
P3.3 Balance production production requirements S3.3 Schedule product deliveries P3.4 Establish production plans S3.4 Receive product S3.5 Verify product S3.6 Transfer product S3.7 Authorize supplier payment 4 PLAN DELIVER ES ENABLE SOURDE
P4.1 Identify, assess and aggregate delivery requirements ES.1 Manage sourcing business rules
P4.2 Identify, assess and aggregate delivery resources ES.2 Assess supplier performance
P4.3 Balance delivery resource with delivery requirements ES.3 Maintain source data
P4.4 Establish delivery plans ES.4 Manage product inventory ES.5 Manage capital assets ES.6 Manage incoming product ES.7 Manage supplier network
ES.8 Manage import/export requirements
ES.9 Manage supplier agreements
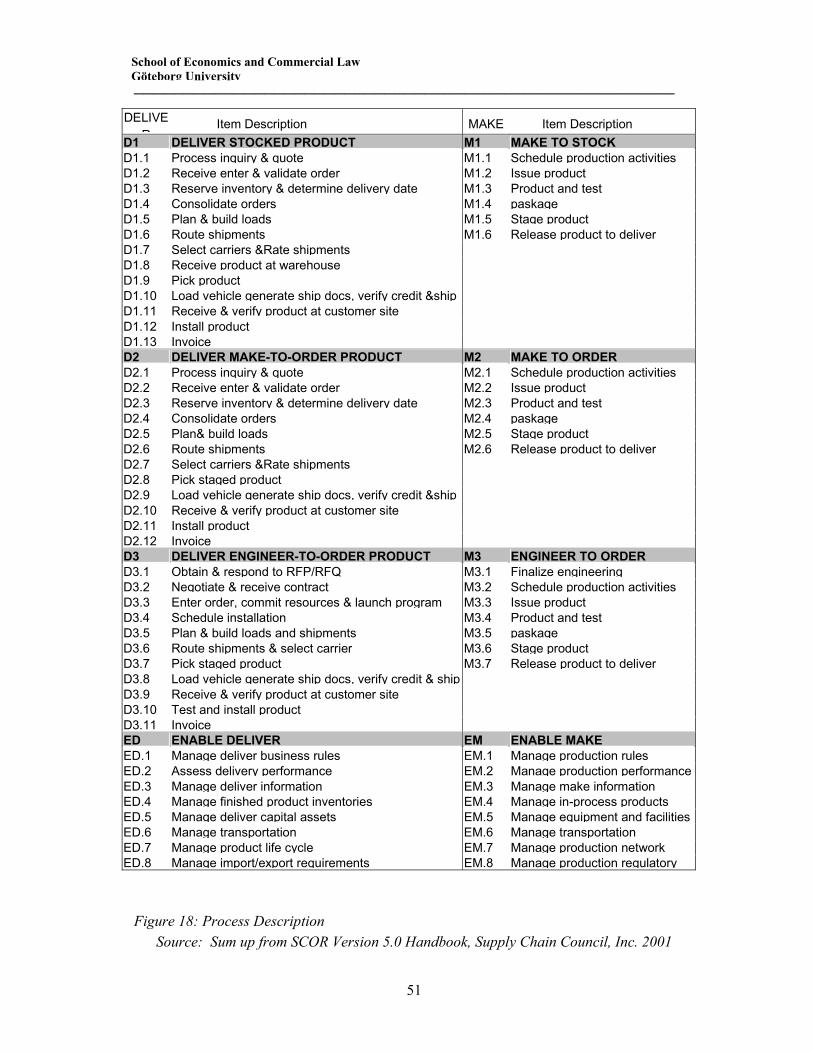
______________________________________________________
51
School of Economics and Commercial Law Göteborg University
Figure 18: Process Description Source: Sum up from SCOR Version 5.0 Handbook, Supply Chain Council, Inc. 2001
DELIVER
Item Description MAKE Item Description D1 DELIVER STOCKED PRODUCT M1 MAKE TO STOCK D1.1 Process inquiry & quote M1.1 Schedule production activitiesD1.2 Receive enter & validate order M1.2 Issue product D1.3 Reserve inventory & determine delivery date M1.3 Product and test D1.4 Consolidate orders M1.4 paskageD1.5 Plan & build loads M1.5 Stage product D1.6 Route shipments M1.6 Release product to deliverD1.7 Select carriers &Rate shipmentsD1.8 Receive product at warehouseD1.9 Pick product D1.10 Load vehicle generate ship docs, verify credit &ship D1.11 Receive & verify product at customer siteD1.12 Install product D1.13 Invoice D2 DELIVER MAKE-TO-ORDER PRODUCT M2 MAKE TO ORDER D2.1 Process inquiry & quote M2.1 Schedule production activitiesD2.2 Receive enter & validate order M2.2 Issue product D2.3 Reserve inventory & determine delivery date M2.3 Product and test D2.4 Consolidate orders M2.4 paskageD2.5 Plan& build loads M2.5 Stage product D2.6 Route shipments M2.6 Release product to deliverD2.7 Select carriers &Rate shipmentsD2.8 Pick staged product D2.9 Load vehicle generate ship docs, verify credit &ship D2.10 Receive & verify product at customer siteD2.11 Install product D2.12 Invoice D3 DELIVER ENGINEER-TO-ORDER PRODUCT M3 ENGINEER TO ORDER D3.1 Obtain & respond to RFP/RFQ M3.1 Finalize engineering D3.2 Negotiate & receive contract M3.2 Schedule production activitiesD3.3 Enter order, commit resources & launch program M3.3 Issue product D3.4 Schedule installation M3.4 Product and test D3.5 Plan & build loads and shipments M3.5 paskageD3.6 Route shipments & select carrier M3.6 Stage product D3.7 Pick staged product M3.7 Release product to deliverD3.8 Load vehicle generate ship docs, verify credit & ship D3.9 Receive & verify product at customer siteD3.10 Test and install product D3.11 Invoice ED ENABLE DELIVER EM ENABLE MAKE ED.1 Manage deliver business rules EM.1 Manage production rules ED.2 Assess delivery performance EM.2 Manage production performanceED.3 Manage deliver information EM.3 Manage make informationED.4 Manage finished product inventories EM.4 Manage in-process productsED.5 Manage deliver capital assets EM.5 Manage equipment and facilitiesED.6 Manage transportation EM.6 Manage transportation ED.7 Manage product life cycle EM.7 Manage production networkED.8 Manage import/export requirements EM.8 Manage production regulatory
Chapter 3 Theoretical Framework of Reference ______________________________________________________
52
Figure 18 is summarized from the SCOR Model. It shows the detailed process description. When mapping the process of a certain case, each operation process can be categorized according to the characteristic of the activities, then goes into further analysis.
3.5.2.4 Implementation (SCOR Level 4)
The implementation level can also be identified as level 4 in the SCOR model. Level 4 defines practices to achieve competitive advantage and to adapt to changing business conditions. Companies will implement specific Supply Chain Management practices at this level.
Companies using SCOR have reported significant improvements in their supply chain efficiencies. SCOR has helped them identify inefficiencies and conFigure the supply chain. After configuring the supply-chain, companies measured their supply chain metrics and worked to achieve the industry’s best practice standards.
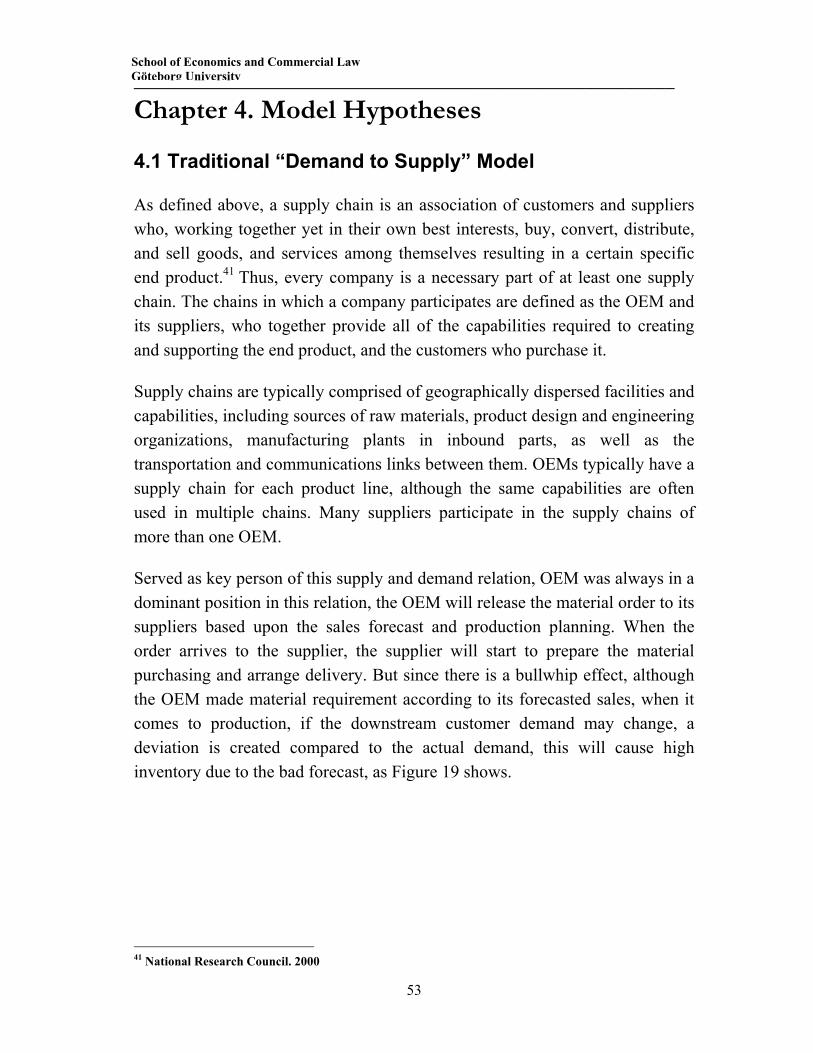
______________________________________________________
53
School of Economics and Commercial Law Göteborg University
Chapter 4. Model Hypotheses
4.1 Traditional “Demand to Supply” Model
As defined above, a supply chain is an association of customers and suppliers who, working together yet in their own best interests, buy, convert, distribute, and sell goods, and services among themselves resulting in a certain specific end product.41 Thus, every company is a necessary part of at least one supply chain. The chains in which a company participates are defined as the OEM and its suppliers, who together provide all of the capabilities required to creating and supporting the end product, and the customers who purchase it.
Supply chains are typically comprised of geographically dispersed facilities and capabilities, including sources of raw materials, product design and engineering organizations, manufacturing plants in inbound parts, as well as the transportation and communications links between them. OEMs typically have a supply chain for each product line, although the same capabilities are often used in multiple chains. Many suppliers participate in the supply chains of more than one OEM.
Served as key person of this supply and demand relation, OEM was always in a dominant position in this relation, the OEM will release the material order to its suppliers based upon the sales forecast and production planning. When the order arrives to the supplier, the supplier will start to prepare the material purchasing and arrange delivery. But since there is a bullwhip effect, although the OEM made material requirement according to its forecasted sales, when it comes to production, if the downstream customer demand may change, a deviation is created compared to the actual demand, this will cause high inventory due to the bad forecast, as Figure 19 shows.
41 National Research Council. 2000
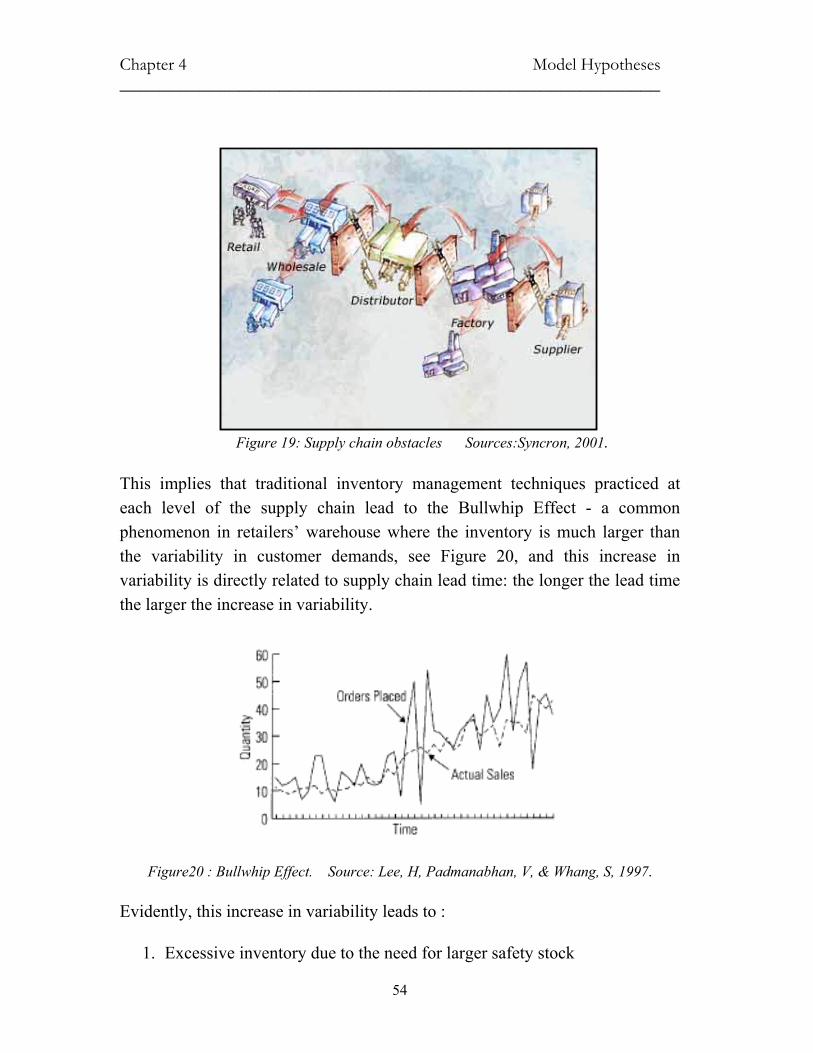
Chapter 4 Model Hypotheses ______________________________________________________
54
Figure 19: Supply chain obstacles Sources:Syncron, 2001.
This implies that traditional inventory management techniques practiced at each level of the supply chain lead to the Bullwhip Effect - a common phenomenon in retailers’ warehouse where the inventory is much larger than the variability in customer demands, see Figure 20, and this increase in variability is directly related to supply chain lead time: the longer the lead time the larger the increase in variability.
Figure20 : Bullwhip Effect. Source: Lee, H, Padmanabhan, V, & Whang, S, 1997.
Evidently, this increase in variability leads to :
1. Excessive inventory due to the need for larger safety stock
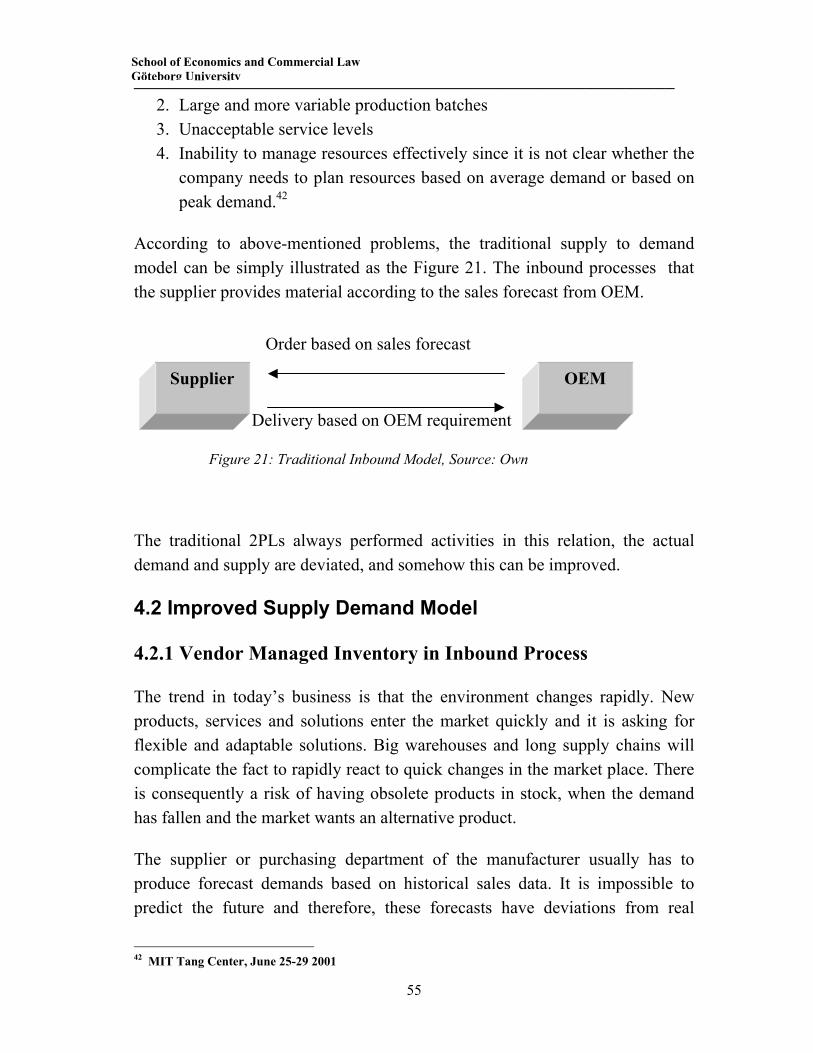
______________________________________________________
55
School of Economics and Commercial Law Göteborg University
2. Large and more variable production batches 3. Unacceptable service levels 4. Inability to manage resources effectively since it is not clear whether the
company needs to plan resources based on average demand or based on peak demand.42
According to above-mentioned problems, the traditional supply to demand model can be simply illustrated as the Figure 21. The inbound processes that the supplier provides material according to the sales forecast from OEM.
Figure 21: Traditional Inbound Model, Source: Own
The traditional 2PLs always performed activities in this relation, the actual demand and supply are deviated, and somehow this can be improved.
4.2 Improved Supply Demand Model
4.2.1 Vendor Managed Inventory in Inbound Process
The trend in today’s business is that the environment changes rapidly. New products, services and solutions enter the market quickly and it is asking for flexible and adaptable solutions. Big warehouses and long supply chains will complicate the fact to rapidly react to quick changes in the market place. There is consequently a risk of having obsolete products in stock, when the demand has fallen and the market wants an alternative product.
The supplier or purchasing department of the manufacturer usually has to produce forecast demands based on historical sales data. It is impossible to predict the future and therefore, these forecasts have deviations from real
42 MIT Tang Center, June 25-29 2001
Supplier OEM
Order based on sales forecast
Delivery based on OEM requirement
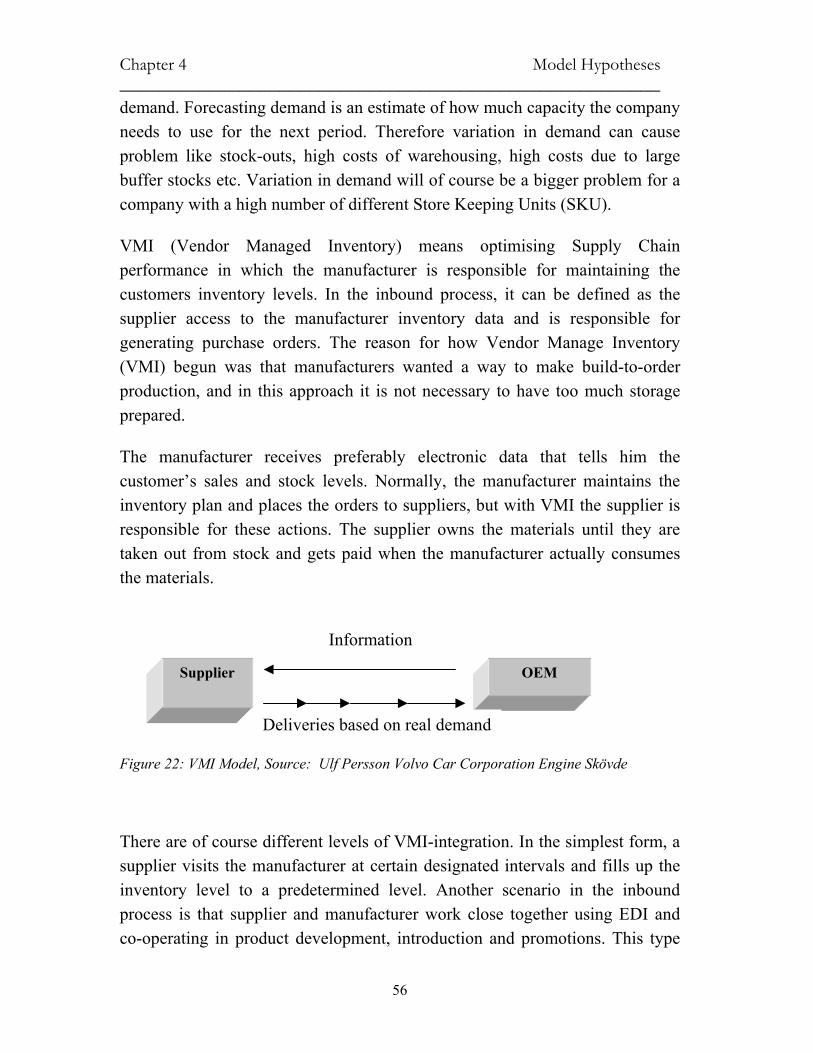
Chapter 4 Model Hypotheses ______________________________________________________
56
demand. Forecasting demand is an estimate of how much capacity the company needs to use for the next period. Therefore variation in demand can cause problem like stock-outs, high costs of warehousing, high costs due to large buffer stocks etc. Variation in demand will of course be a bigger problem for a company with a high number of different Store Keeping Units (SKU).
VMI (Vendor Managed Inventory) means optimising Supply Chain performance in which the manufacturer is responsible for maintaining the customers inventory levels. In the inbound process, it can be defined as the supplier access to the manufacturer inventory data and is responsible for generating purchase orders. The reason for how Vendor Manage Inventory (VMI) begun was that manufacturers wanted a way to make build-to-order production, and in this approach it is not necessary to have too much storage prepared.
The manufacturer receives preferably electronic data that tells him the customer’s sales and stock levels. Normally, the manufacturer maintains the inventory plan and places the orders to suppliers, but with VMI the supplier is responsible for these actions. The supplier owns the materials until they are taken out from stock and gets paid when the manufacturer actually consumes the materials.
Figure 22: VMI Model, Source: Ulf Persson Volvo Car Corporation Engine Skövde
There are of course different levels of VMI-integration. In the simplest form, a supplier visits the manufacturer at certain designated intervals and fills up the inventory level to a predetermined level. Another scenario in the inbound process is that supplier and manufacturer work close together using EDI and co-operating in product development, introduction and promotions. This type
Supplier OEM
Information
Deliveries based on real demand
______________________________________________________
57
School of Economics and Commercial Law Göteborg University
of relationship requires large transaction volumes to be profitable.
The effect on the manufacturer is of course to reduce the inventory costs. And by interchanging data concerning sales and stock levels, the supplier can deliver goods due to hard facts (actual demand) instead of depending on the customers’ demand forecast. Therefore stock-outs and non-profitable service level will seldom occur.
To be able to respond to actual needs instead of simply fulfilling orders, the supplier, however, has to have a way of identifying these needs. To make this possible three main components are required:
• A way of capturing the raw data needed • A way of communicating this data from the manufacturer to the supplier • An inventory management system that turns the collected data into actions
A true partnership is formed between the companies where they work closer together and strengthen their relationship. The main difference compared to traditional inventory planning is that the manufacturer becomes responsible for managing supplies. VMI reduces the number of different people and departments that are involved in the inventory management process, which reduces the risk of mistakes and accidents that can result in for example stock-outs. The new organization structure will enable information to be exchanged faster and more smoothly, which is vital for a successful company of today. Not to forget, one effect of VMI is the improved customer retention. Once a VMI-system is developed and implemented, it will become extremely difficult and costly for an OEM to change suppliers.
4.2.2 Relationship Management in VMI
For the success of a supply chain partnership to succeed, it is critical that its members are able to openly communicate with each other. Supply chain partners have to provide critical and sensitive information to each other. Information such as production schedules, engineering and design specifications, and cost and inventory data are commonly shared between partners in a successful supply chain. If this information is not provided in a timely manner, or is not given accurately because of fear that it may fall into
Chapter 4 Model Hypotheses ______________________________________________________
58
the wrong hands, it will radically compromise the competitiveness of the entire co-operation.
In order to be effective, open communication and co-operation should include several areas like developing new products, invoice and payment systems. To improve the overall effectiveness, both companies need to put a lot of effort in reducing costs and time to market.
Essential to the open communication of such sensitive information as cost data and production schedules between two companies is the explicit understanding that this information will not be shared outside of the immediate relationship without the prior permission of the supply chain partners.
After all, many direct competitors use the same suppliers. In order to openly share sensitive information with a supplier, a company must have assurance that this information will not end up in the hands of a competitor. Therefore, trust is extremely important in an implementation of VMI. To make sure that all this high valuable information stays within the relationship, it might be essential to include a confidential clause in the agreement.
As a company works more closely with its partner, it will become more dependent on their ability to meet their commitments. As for example in VMI, in which a supplier tracks and automatically replenishes manufacturer’s inventory. This can prove disastrous if this supplier turns out to be unreliable and frequently late with deliveries. This is why companies place such a tremendous amount of effort during the development of a supply chain relationship into validating the competence of the supplier’s management team, the financial soundness of the organisation, and long-term ability of the supplier to remain a reliable source.
Once two companies agree to enter a supply chain relationship as partners, they must decide how to most efficiently share information. After all, the sharing of information allows the supplier to eliminate, or at least improve some important aspects as for example forecasting. A forecast is just an estimate of future demand; history has proved that accurately predicting the future is impossible. By replacing the forecast with actual customer data, a supplier can reduce inventory; the manufacturers, now being able to rely on on-time deliveries from
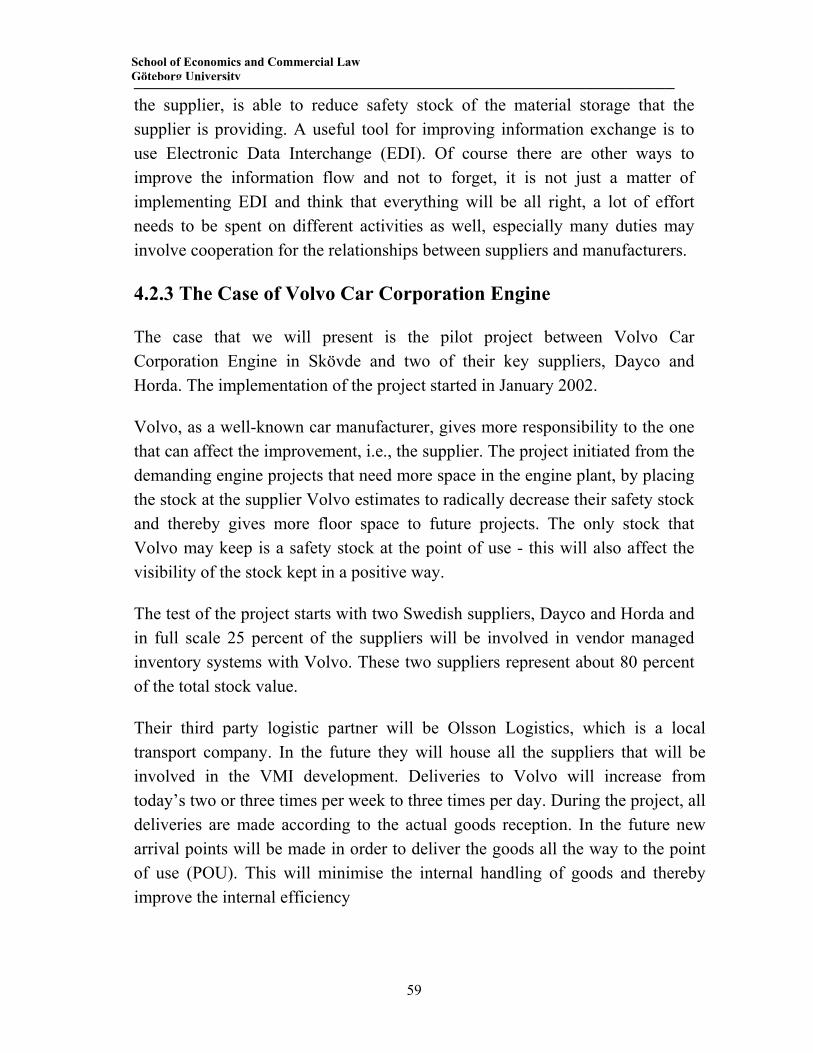
______________________________________________________
59
School of Economics and Commercial Law Göteborg University
the supplier, is able to reduce safety stock of the material storage that the supplier is providing. A useful tool for improving information exchange is to use Electronic Data Interchange (EDI). Of course there are other ways to improve the information flow and not to forget, it is not just a matter of implementing EDI and think that everything will be all right, a lot of effort needs to be spent on different activities as well, especially many duties may involve cooperation for the relationships between suppliers and manufacturers.
4.2.3 The Case of Volvo Car Corporation Engine
The case that we will present is the pilot project between Volvo Car Corporation Engine in Skövde and two of their key suppliers, Dayco and Horda. The implementation of the project started in January 2002.
Volvo, as a well-known car manufacturer, gives more responsibility to the one that can affect the improvement, i.e., the supplier. The project initiated from the demanding engine projects that need more space in the engine plant, by placing the stock at the supplier Volvo estimates to radically decrease their safety stock and thereby gives more floor space to future projects. The only stock that Volvo may keep is a safety stock at the point of use - this will also affect the visibility of the stock kept in a positive way.
The test of the project starts with two Swedish suppliers, Dayco and Horda and in full scale 25 percent of the suppliers will be involved in vendor managed inventory systems with Volvo. These two suppliers represent about 80 percent of the total stock value.
Their third party logistic partner will be Olsson Logistics, which is a local transport company. In the future they will house all the suppliers that will be involved in the VMI development. Deliveries to Volvo will increase from today’s two or three times per week to three times per day. During the project, all deliveries are made according to the actual goods reception. In the future new arrival points will be made in order to deliver the goods all the way to the point of use (POU). This will minimise the internal handling of goods and thereby improve the internal efficiency
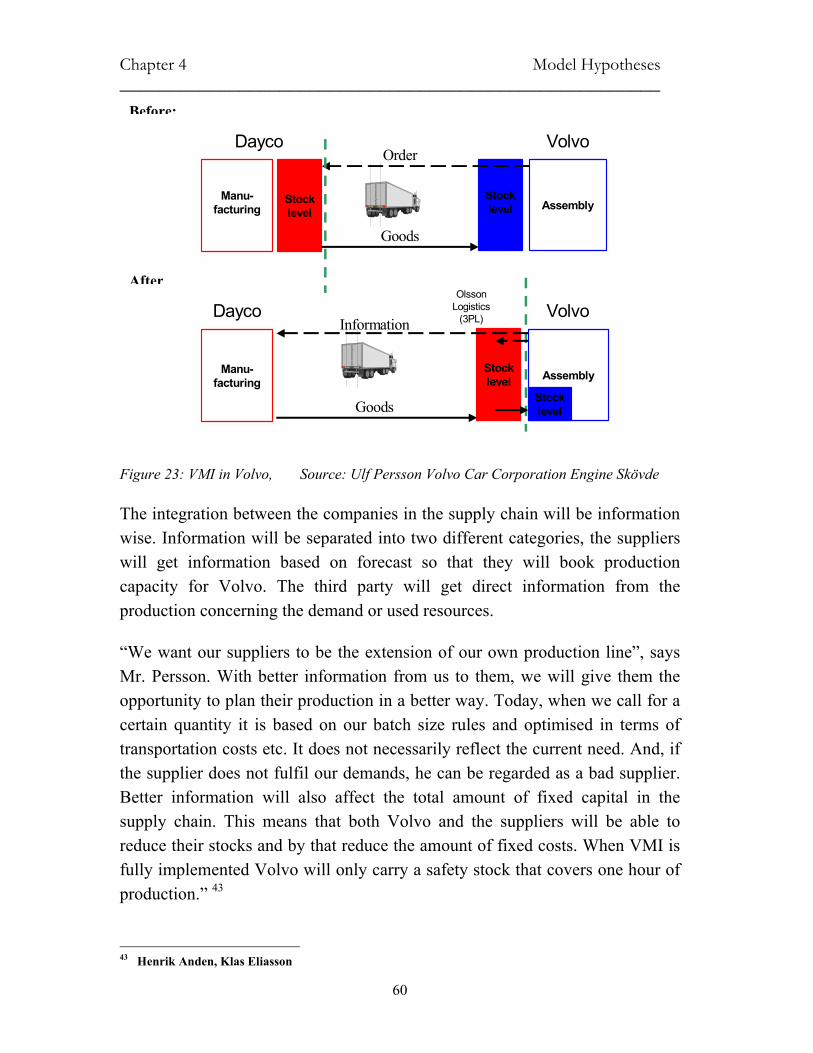
Chapter 4 Model Hypotheses ______________________________________________________
60
Manu-facturing
Stock level
Dayco Volvo
Stock level
Assembly
OlssonLogistics
(3PL)Information
Goods
Manu-facturing
Stock level
Dayco Volvo
Stock level Assembly
Order
Goods
Figure 23: VMI in Volvo, Source: Ulf Persson Volvo Car Corporation Engine Skövde
The integration between the companies in the supply chain will be information wise. Information will be separated into two different categories, the suppliers will get information based on forecast so that they will book production capacity for Volvo. The third party will get direct information from the production concerning the demand or used resources.
“We want our suppliers to be the extension of our own production line”, says Mr. Persson. With better information from us to them, we will give them the opportunity to plan their production in a better way. Today, when we call for a certain quantity it is based on our batch size rules and optimised in terms of transportation costs etc. It does not necessarily reflect the current need. And, if the supplier does not fulfil our demands, he can be regarded as a bad supplier. Better information will also affect the total amount of fixed capital in the supply chain. This means that both Volvo and the suppliers will be able to reduce their stocks and by that reduce the amount of fixed costs. When VMI is fully implemented Volvo will only carry a safety stock that covers one hour of production.” 43
43 Henrik Anden, Klas Eliasson
After
Before:
______________________________________________________
61
School of Economics and Commercial Law Göteborg University
As this VMI model applied in Volvo plan to see if the 3PL can deliver and then assembly modules all the way into the point of use. When parties in a supply chain decide to use a third party one should try to maximise the utilisation of that third party. In Volvos case, the 3PL will handle 80 % of the value of goods, but the question why Volvo does not outsource the rest of the stock to the 3PL as well and let them take care of all material handling, there are still solutions that need to be found out.
4.3 Hypotheses Model
4.3.1 Comparison to Different Solutions
In an inbound relation, OEM with its suppliers have been associated in handling the inventory base on the mutual information exchange. This process demands high efficiency on the logistic service level, especially in transportation capacity.
Generally speaking, in an inbound process, OEM serves as the key entity within the relation. It generates the final product and from this point the characteristics of the products changed from the semi-finished product into finished product. After that, all the inbound activities shall be prepared in working for its production planning according to the material requirements. Known as order which was generated, based on its actual demands, derived from outbound distribution, suppliers for the OEM shall wait for the material requirement from the OEM and then prepare its own purchasing or production from its sub suppliers, when the materials are available, suppliers will transfer the data to its outsourced logistics company for arranging the delivery, then the 3PL produces a delivery schedule. For a single product supply, normally those materials which come from different suppliers will be centralized, consolidated, cross docked, or being used to perform some simple value added services within 3PL terminal, following reach to the OEM site. While it is important to notice that the property of material transferred from supplier to OEM when the materials have been shipped out of the supplier accompanied with purchasing activities.
Chapter 4 Model Hypotheses ______________________________________________________
62
Figure 24: Model I - Traditional model Source: Own
Seen from the Figure 24, the 2PLs model, there is a transportation company in between the supplier and OEM, which is simply performing the delivery function. The information exchange (here refers to replenishment ordering, production planning,) is mutually linked between supplier and OEM, but to the consigned transportation company, it is still in a negative position waiting assignments for supplier or the OEM, then delivering back to the opposite side upon the material has arrived to the appointed site.
To the physical flow, because the supply is provided according to the OEM’s sales forecast, the inventory tied up within this channel consists of 3 parts- one from the suppliers, one at the OEM which was purchased for preparing the incoming production plan, the third part is in the form of work in progress
Physical flow Information flow (Orders, Prod. plan, etc)
Key Features: • Supplier received replenishment orders from OEM side • Supplier arrange delivery schedule to 3PL • Both supplier and OEM keep stock
Business entity Stock Inventory
Supplier’s Stock
Supplier
OEM’s Stock
OEM
On way stock
Forwarder
Inventory belongs to supplier
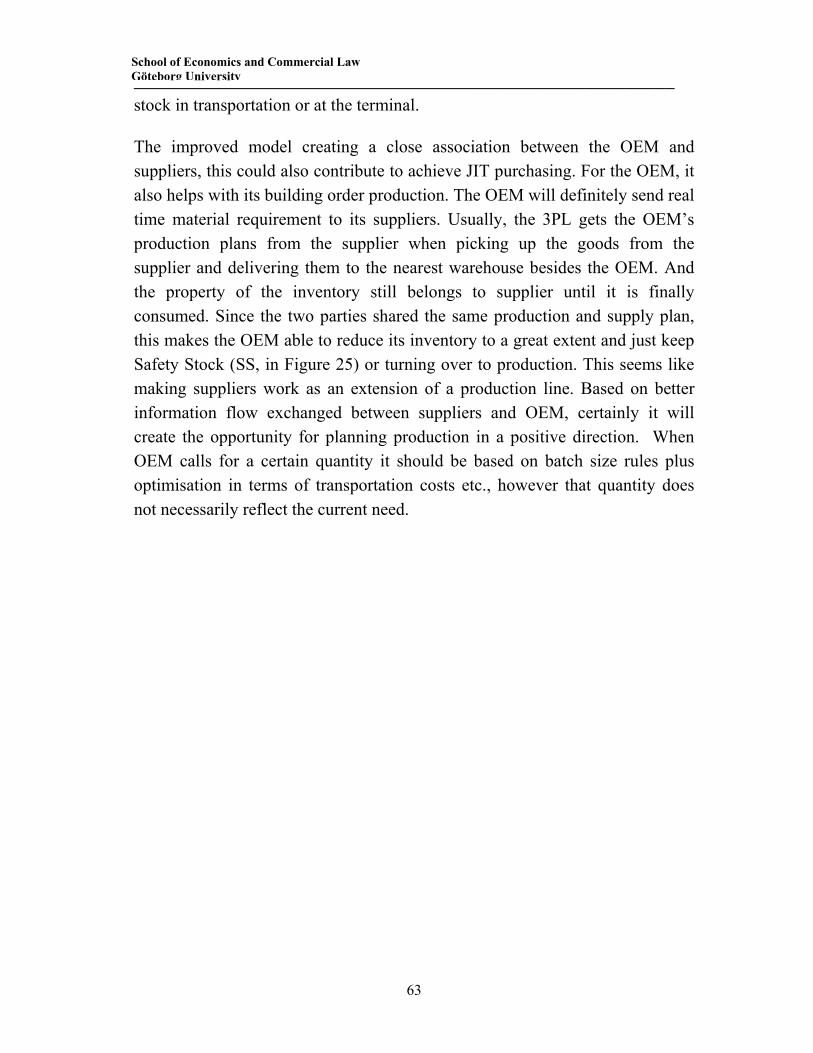
______________________________________________________
63
School of Economics and Commercial Law Göteborg University
stock in transportation or at the terminal.
The improved model creating a close association between the OEM and suppliers, this could also contribute to achieve JIT purchasing. For the OEM, it also helps with its building order production. The OEM will definitely send real time material requirement to its suppliers. Usually, the 3PL gets the OEM’s production plans from the supplier when picking up the goods from the supplier and delivering them to the nearest warehouse besides the OEM. And the property of the inventory still belongs to supplier until it is finally consumed. Since the two parties shared the same production and supply plan, this makes the OEM able to reduce its inventory to a great extent and just keep Safety Stock (SS, in Figure 25) or turning over to production. This seems like making suppliers work as an extension of a production line. Based on better information flow exchanged between suppliers and OEM, certainly it will create the opportunity for planning production in a positive direction. When OEM calls for a certain quantity it should be based on batch size rules plus optimisation in terms of transportation costs etc., however that quantity does not necessarily reflect the current need.
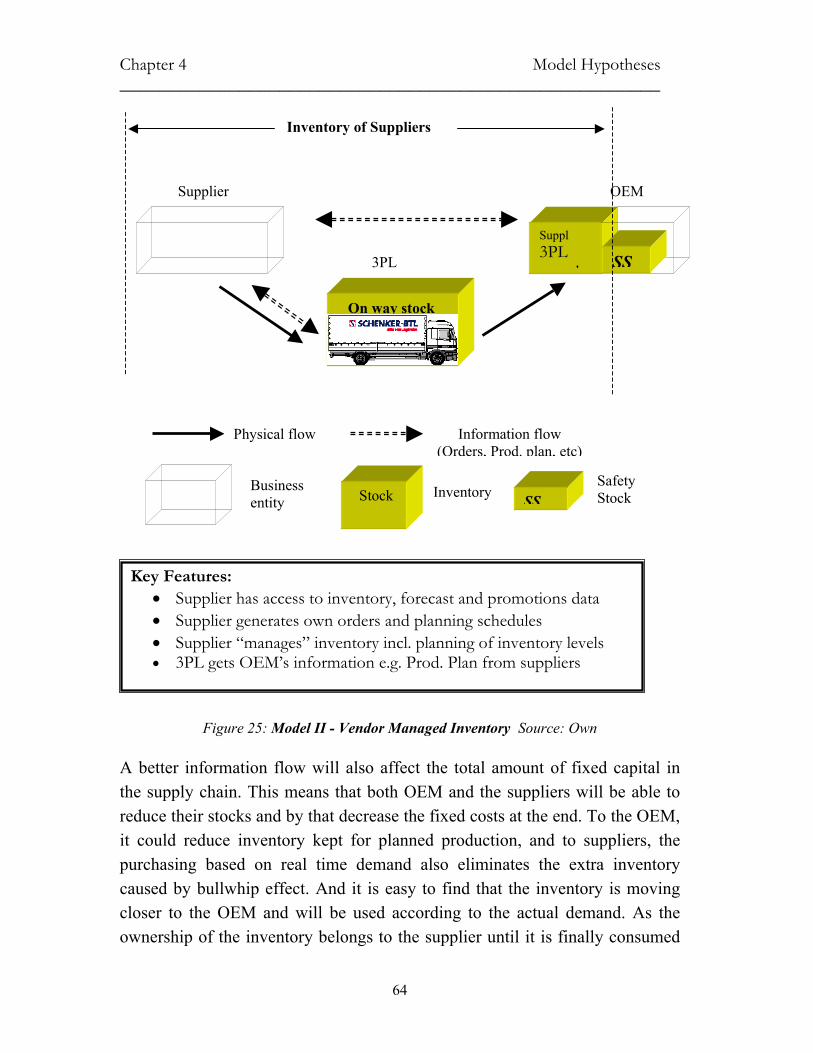
Chapter 4 Model Hypotheses ______________________________________________________
64
Figure 25: Model II - Vendor Managed Inventory Source: Own
A better information flow will also affect the total amount of fixed capital in the supply chain. This means that both OEM and the suppliers will be able to reduce their stocks and by that decrease the fixed costs at the end. To the OEM, it could reduce inventory kept for planned production, and to suppliers, the purchasing based on real time demand also eliminates the extra inventory caused by bullwhip effect. And it is easy to find that the inventory is moving closer to the OEM and will be used according to the actual demand. As the ownership of the inventory belongs to the supplier until it is finally consumed
Key Features: • Supplier has access to inventory, forecast and promotions data • Supplier generates own orders and planning schedules • Supplier “manages” inventory incl. planning of inventory levels • 3PL gets OEM’s information e.g. Prod. Plan from suppliers
Supplier
Suppl3PL
t th
OEM
On way stock
3PL
Inventory of Suppliers
SS
Physical flow Information flow (Orders, Prod. plan, etc)
Business entity Stock Inventory SS
Safety Stock
______________________________________________________
65
School of Economics and Commercial Law Göteborg University
by JIT manufacturing, so that the inventory that was tied up before in the manufacturers’ cost can then be cut off and only safety stock is kept for running production.
4.3.2 Model Hypothesis - Why It Comes?
Here we propose a model hypothesis because we found based on many real cases that the above model always puts the OEM in a dominant position. Instead of creating a win-win solution, the results of most supply chain designs are only benefiting the OEM but on the cost of other members in the value chain. Take the VMI model for example, the processes are designed especially for the highly requirement of OEM’s production demand, once the supplier does not fulfil the OEM demands they can be regarded as a bad supplier. As to the 3PL, the only necessity is to squeeze the lead-time as much as possible; if they failed to deliver JIT they will also be assumed as a bad logistics service provider. In this sense, 3PLs are seeking ways to improve their processing time within the terminal in reducing passive time, such as improve consolidation and cross docking, or they install track and tracing system, route planning, or electronic order management systems to show that they can provide efficient performance to its consigner. This practice, which is regarded as an integrated logistics solution, actually benefits the 3PL and its consigner, between 2 parties. Evidently, in this situation, the 3 main parties are linked two by two, each one works closely to its order consigner, and weakly to the rest one.
Once before, these functions (replenishment, production and logistics) existed in one company, there was a top management centrally controlling the whole organization and all functional departments where working under the same umbrella of information sharing. While trends in recent decades were that each company was trying to define its core competence and outsource the rest in reducing the overall risk as well as capital tied up. It is inflexible to keep a free communication without obstacle because they stand at the different starting points. If the OEM is in the central of the supply chain, the others just could be accessories because the value is created at the OEM spot, so it is ‘reasonable’ to sacrifice the privilege of the other channel members in reducing the OEM cost, but how about the others? Is it good for them for the future cooperation in creating win-win situations? Will the relationship based on sacrificing others
Chapter 4 Model Hypotheses ______________________________________________________
66
last long?
Of course if the 3 functional units cannot get on well with each other, if they are not enrolled in one company, they lack of a powerful controller to organize them working under the same goal. We propose this model hypothesis in calling for a reunified attention, as they normally existed years before, so as to make the information exchanges in a new way between them, it is a multi exchange among the three or above three parties, not merely between either 2 party members.
4.3.3 How Does It Work?
As manufacturers pass more responsibility on to their suppliers, the use of collaboration tools and face-to-face interaction becomes more critical. Here we see two major trends developing:
1. As manufacturers delegate more responsibility to their suppliers, they are asking the first tier suppliers to interface with lower tier suppliers to produce finished systems rather than components.
2. They are asking suppliers to participate in ‘cradle-to-grave’ decisions regarding product design, testing, and part of manufacturing.
As a result, suppliers are expected to perform as virtual operation units of the manufacturer, and are selected on the basis of their skills and innovative and technological expertise, rather than simply in terms of the product they provide.
OEM is giving more responsibility to their suppliers, while at the same time, working with fewer trade partners. In an effort to cut costs and to shortening their time to market, they ask suppliers to produce entire systems, manufacturers are basically telling the first tier suppliers that they want them to handle supply chain management from raw materials to delivery of a final interior system. But that’s not all. Manufacturers are also asking suppliers throughout the supply chain to participate in every aspect of product development, from conceptual designs to manufacturing.
Today OEM expects more from the suppliers, it is not enough to ask the suppliers just to make good components. These trends involve a great deal of
______________________________________________________
67
School of Economics and Commercial Law Göteborg University
communication and the need for opening effective collaboration among customer, supplier, manufacturer, and everyone in between such as 3PLs. While the concept of collaboration is not new, collaboration to this extent is the tool, today’s technology provides faster and more accurate interchanges of information via the web, and this is an evolution.
However, it was not all due to technology. If everything depends entirely on technology you will fail, it is people who get work done. So we call to establish a face-to-face relationship from the start, not just with individual engineers, but also with the entire organization.
With this evolution, manufacturers have less fixed assets tied into the manufacturing, because their suppliers are helping them to remove part of inventory based on the real time demand exchange. While we are thinking about the supplier’s privilege, OEM has transferred a lot of their duties onto the supplier’s, and the supplier’s tied-up assets still haven’t been reduced so much.
Finally, there is still something between the supplier and OEM, which is the outsourced 3PL, and it is time to get them involved. As the inventory tied-up in the demand chain can be divided in 3 parts, one at the OEM, one at the suppliers and one at the 3PL’s terminal for consolidation, then with joint loading transport to the OEM. The close linkage between OEM and supplier has helped to remove some of the OEM’s inventory. In this relationship, to be a qualified supplier also means it should suffer a lot of extra work than before: they get material requirement from OEM, arrange its production or purchasing, notice its delivery plan to 3PLs, even some extra processing in the terminal, such as packaging or paint etc.
The intention of the so-called 4PL is to create a close linkage with 3PL with its consigned customers, perhaps an OEM or suppliers in inbound value chain. What they are doing is to build an efficient means in accelerating coordination merely to its directly bounded customer. But there is still a party standing by in an isolated situation.
Based on our previous analysis and on purpose of stimulates the relation of the members in the inbound supply chain. We suggest that the 3PL get some information directly from the OEM, make automation inventory replenishment
Chapter 4 Model Hypotheses ______________________________________________________
68
directly from 3PL terminal or inventory, hence to improve the efficiency of the overall performance. We mapped the model hypothesis in Figure 26.
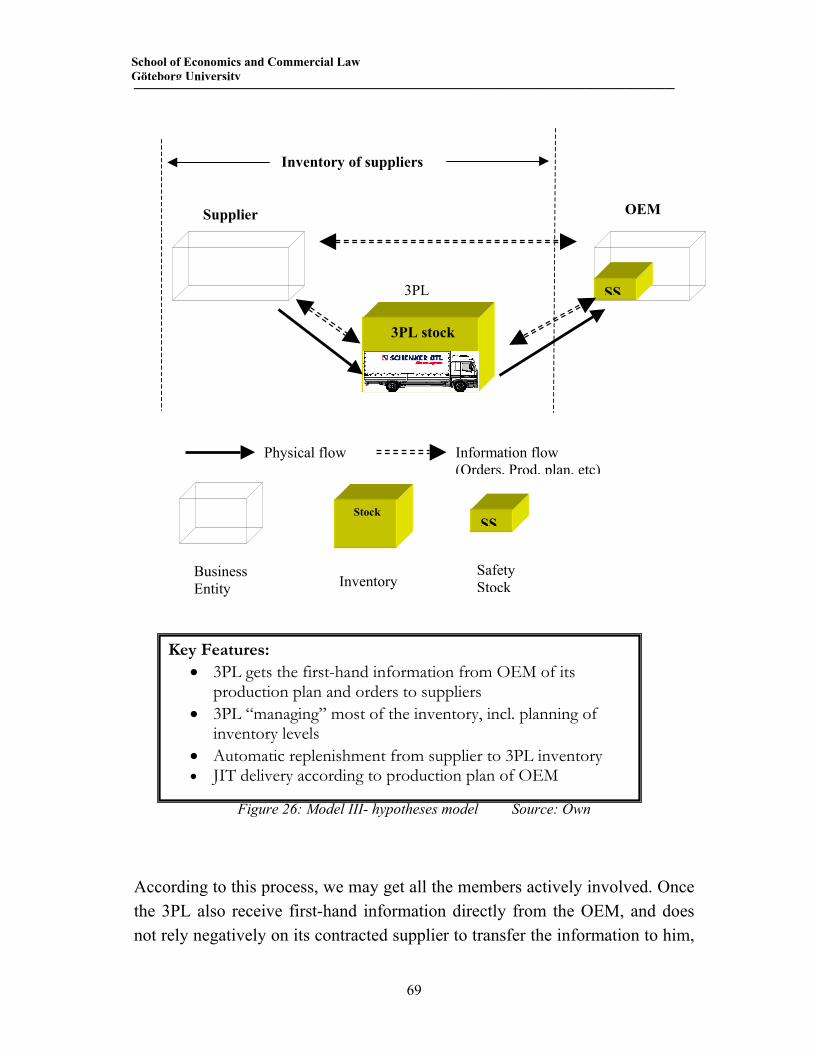
______________________________________________________
69
School of Economics and Commercial Law Göteborg University
Figure 26: Model III- hypotheses model Source: Own
According to this process, we may get all the members actively involved. Once the 3PL also receive first-hand information directly from the OEM, and does not rely negatively on its contracted supplier to transfer the information to him,
Key Features: • 3PL gets the first-hand information from OEM of its
production plan and orders to suppliers • 3PL “managing” most of the inventory, incl. planning of
inventory levels • Automatic replenishment from supplier to 3PL inventory • JIT delivery according to production plan of OEM
Supplier OEM
3PL stock
3PL
Inventory of suppliers
SS
Physical flow Information flow (Orders, Prod. plan, etc)
Business Entity
Stock
Inventory
SS
Safety Stock
Chapter 4 Model Hypotheses ______________________________________________________
70
in this sense, 3PL will work together with the OEM in managing the inventory within the supply chain and perfectly ordering the just in time delivery. Based on this, a part of the supplier’s responsibility could also be reduced so as to put more focus on working with make-to-order replenishment. Things may change into an intellectual capital, it is like everyone is basically sharing the family’s famous secret sauce recipe, they have to trust others as a collaborative partner so that they can go to market together with one product plan, a produce design, a bill of material, delivery schedule etc. The task will not be relying only on suppliers; its 3PL partner will reduce it, so that it creates possibility for whole supply demand chain running in an efficient loop with the information multiple sharing.
4.3.4 The Case of Lindex- Schenker
4.3.4.1 Company Background:
The case of Lindex-Schenker could be a good example of our model hypothesis operating in the wholesaling industry. What interested us most of all in the Lindex-Schenker case is that Lindex has given a free-hand for its logistic and management operations to Schenker. In other words, Schenker is just like a department embedded in Lindex organization performing logistic functions. This shows that today the 3PL is competent enough to takeover the inbound logistic operations from their client. This is fulfilled in the warehouse industry. We believe this could happen in the manufacturing industry as well.
The Swedish company Lindex, with head office in Alingsås, is one of the market-leading companies in the Nordic area within ladies’ and children’s wear as well as lingerie. By 2002, they had 351 shops in Europe. Most of Lindex suppliers are located in Asia, for example China and Bangladesh.44
Schenker has been Lindex logistics partner for a number of years. Schenker handles over 50,000 units per day for Lindex. Lindex AB is a corporate account of the Schenker Group. This means that Schenker has a Global Account Manager who is responsible for total relationship with Lindex. In this case it is
44 http://nova.btl.com , date, 2002-08-02
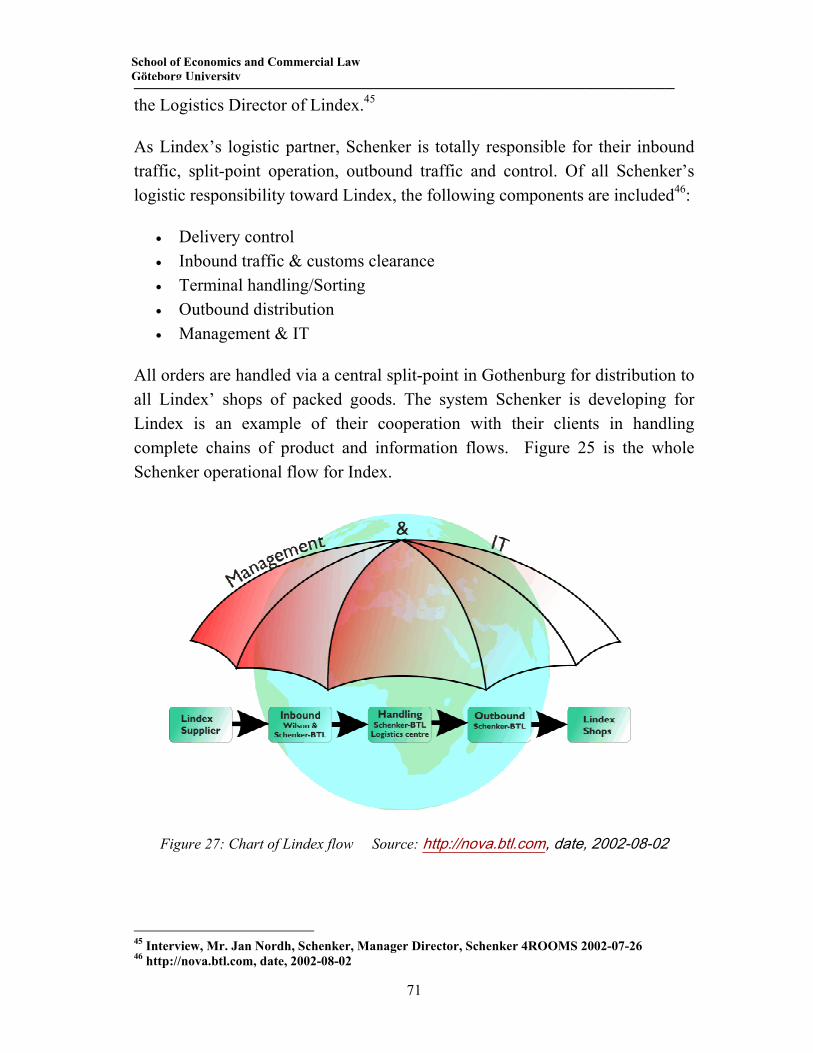
______________________________________________________
71
School of Economics and Commercial Law Göteborg University
the Logistics Director of Lindex.45
As Lindex’s logistic partner, Schenker is totally responsible for their inbound traffic, split-point operation, outbound traffic and control. Of all Schenker’s logistic responsibility toward Lindex, the following components are included46:
• Delivery control • Inbound traffic & customs clearance • Terminal handling/Sorting • Outbound distribution • Management & IT
All orders are handled via a central split-point in Gothenburg for distribution to all Lindex’ shops of packed goods. The system Schenker is developing for Lindex is an example of their cooperation with their clients in handling complete chains of product and information flows. Figure 25 is the whole Schenker operational flow for Index.
Figure 27: Chart of Lindex flow Source: http://nova.btl.com, date, 2002-08-02
45 Interview, Mr. Jan Nordh, Schenker, Manager Director, Schenker 4ROOMS 2002-07-26 46 http://nova.btl.com, date, 2002-08-02
Chapter 4 Model Hypotheses ______________________________________________________
72
4.3.4.2 Inbound delivery control
Schenker is handling the delivery control of all Lindex’ suppliers. Schenker receives information from Lindex when purchasing orders are ready for dispatching. Feedback can then be given to Lindex, e.g. estimated time of arrival and order information can be collected at an early stage. Combining the information of the delivery data requirement from Lindex as well as the transportation and production lead-time from suppliers. Schenker will plan a schedule according to the consequence of the whole transportation procedures. Operation and delivery control will thus be carried out by Schenker against this schedule.47
4.4 Parameters Related to Inbound Analysis
Measuring how well the supply chain performs is as essential in understanding how it operates. To make evaluations of different models, it is necessary for us to set up a standard method to map them as well as to have a cluster of parameters to make an objective assessment.
According to the Supply Chain Council, measurement must link to business objectives, must be repeatable, must provide insight into how to manage the supply chain, and moreover, it must be appropriate for the process activity they are measuring.48 To fulfill all these requirements, we adopt the SCOR Model, created by Supply-Chain Council, to support us in this research. The measuring performance metrics of the SCOR model has a merit of a close linkage with the strategic business objectives from the whole supply chain perspective. This is realized by defining the gaps through benchmarking the ideal performance with what is in reality.
Meanwhile, as we concentrate our studies on the inbound logistic field, it is necessary for us to adapt those given parameters for the sake of inbound and our special cases. The theory “Logic mix of goals”49 which we introduced in the theoretical framework initiated by Lumsden has clearly defined parameters 47 Interview, Mr. Jan Nordh, Schenker, Manager Director, Schenker 4ROOMS 2002-07-26 48 Sum up from SCOR Version 5.0 Handbook, Supply Chain Council, Inc. 2001 49 Lumsden, K.R., 1998
______________________________________________________
73
School of Economics and Commercial Law Göteborg University
from the operational perspective, which could be a helpful complement to the strategical SCOR metrics. We found most parameters in metrics of the SCOR model share great similarity with those defined in Lumsden’s model. In the following part we consulted both of the theories and elected those appropriate parameters and granted them with method of calculations so that they can be applied in our model evaluations.
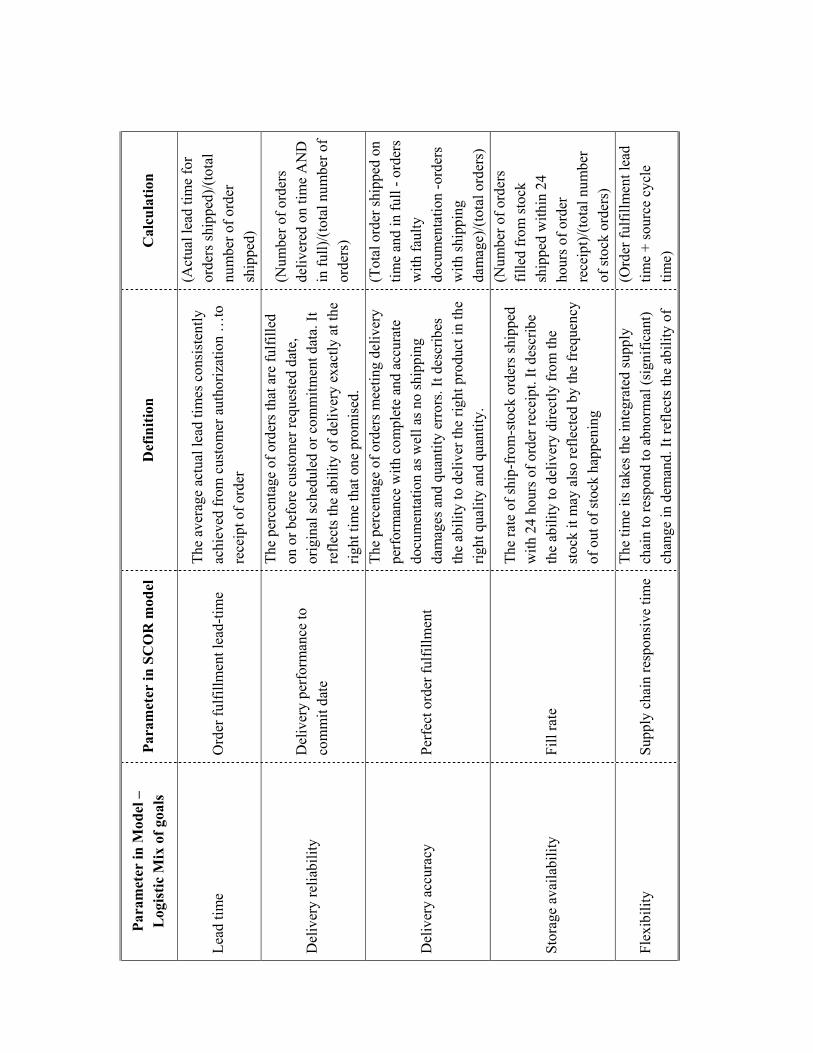
Para
met
er in
Mod
el –
Log
istic
Mix
of g
oals
Pa
ram
eter
in S
CO
R m
odel
D
efin
ition
C
alcu
latio
n
Lead
tim
e O
rder
fulfi
llmen
t lea
d-tim
e Th
e av
erag
e ac
tual
lead
tim
es c
onsi
sten
tly
achi
eved
from
cus
tom
er a
utho
rizat
ion
…to
re
ceip
t of o
rder
(Act
ual l
ead
time
for
orde
rs sh
ippe
d)/(t
otal
nu
mbe
r of o
rder
sh
ippe
d)
Del
iver
y re
liabi
lity
D
eliv
ery
perf
orm
ance
to
com
mit
date
The
perc
enta
ge o
f ord
ers t
hat a
re fu
lfille
d on
or b
efor
e cu
stom
er re
ques
ted
date
, or
igin
al sc
hedu
led
or c
omm
itmen
t dat
a. It
re
flect
s the
abi
lity
of d
eliv
ery
exac
tly a
t the
rig
ht ti
me
that
one
pro
mis
ed.
(Num
ber o
f ord
ers
deliv
ered
on
time
AN
D
in fu
ll)/(t
otal
num
ber o
f or
ders
)
Del
iver
y ac
cura
cy
Perf
ect o
rder
fulfi
llmen
t
The
perc
enta
ge o
f ord
ers m
eetin
g de
liver
y pe
rfor
man
ce w
ith c
ompl
ete
and
accu
rate
do
cum
enta
tion
as w
ell a
s no
ship
ping
da
mag
es a
nd q
uant
ity e
rror
s. It
desc
ribes
th
e ab
ility
to d
eliv
er th
e rig
ht p
rodu
ct in
the
right
qua
lity
and
quan
tity.
(Tot
al o
rder
ship
ped
on
time
and
in fu
ll - o
rder
s w
ith fa
ulty
do
cum
enta
tion
-ord
ers
with
ship
ping
da
mag
e)/(t
otal
ord
ers)
Stor
age
avai
labi
lity
Fill
rate
The
rate
of s
hip-
from
-sto
ck o
rder
s shi
pped
w
ith 2
4 ho
urs o
f ord
er re
ceip
t. It
desc
ribe
the
abili
ty to
del
iver
y di
rect
ly fr
om th
e st
ock
it m
ay a
lso
refle
cted
by
the
freq
uenc
y of
out
of s
tock
hap
peni
ng
(Num
ber o
f ord
ers
fille
d fr
om st
ock
ship
ped
with
in 2
4 ho
urs o
f ord
er
rece
ipt)/
(tota
l num
ber
of st
ock
orde
rs)
Flex
ibili
ty
Supp
ly c
hain
resp
onsi
ve ti
me
The
time
its ta
kes t
he in
tegr
ated
supp
ly
chai
n to
resp
ond
to a
bnor
mal
(sig
nific
ant)
chan
ge in
dem
and.
It re
flect
s the
abi
lity
of
(Ord
er fu
lfillm
ent l
ead
time
+ so
urce
cyc
le
time)
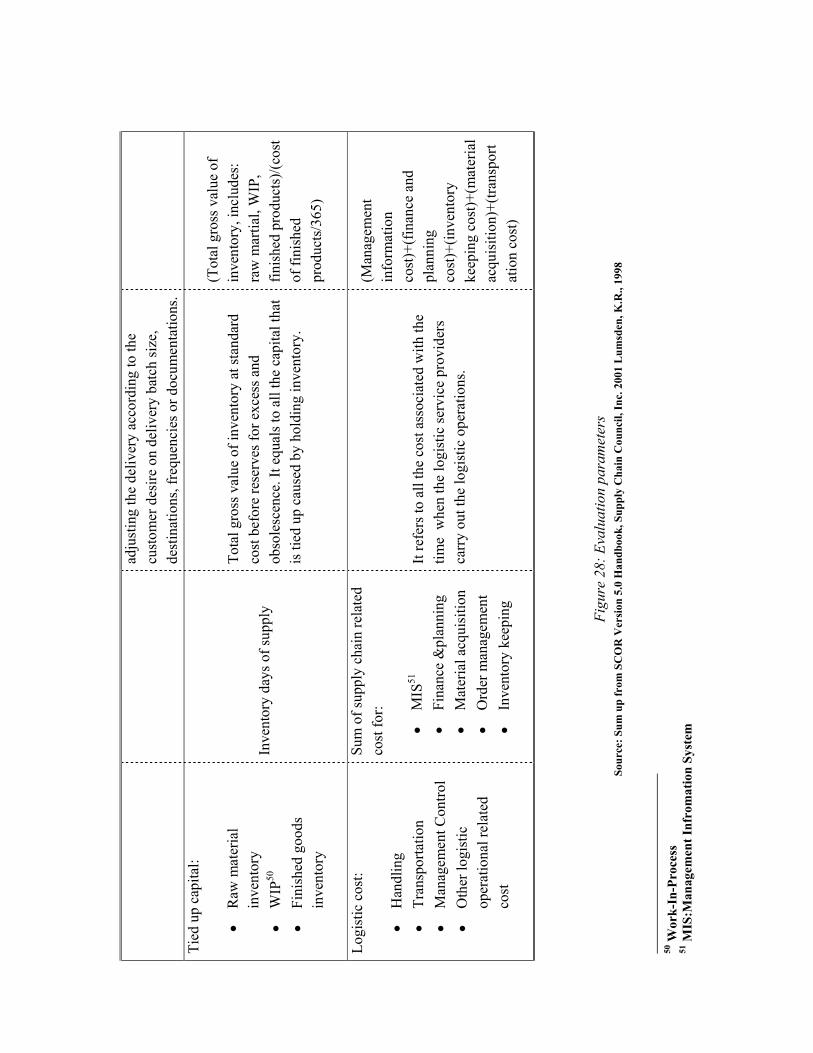
adju
stin
g th
e de
liver
y ac
cord
ing
to th
e cu
stom
er d
esire
on
deliv
ery
batc
h si
ze,
dest
inat
ions
, fre
quen
cies
or d
ocum
enta
tions
.Ti
ed u
p ca
pita
l:
• R
aw m
ater
ial
inve
ntor
y •
WIP
50
• Fi
nish
ed g
oods
in
vent
ory
Inve
ntor
y da
ys o
f sup
ply
Tota
l gro
ss v
alue
of i
nven
tory
at s
tand
ard
cost
bef
ore
rese
rves
for e
xces
s and
ob
sole
scen
ce. I
t equ
als t
o al
l the
cap
ital t
hat
is ti
ed u
p ca
used
by
hold
ing
inve
ntor
y.
(Tot
al g
ross
val
ue o
f in
vent
ory,
incl
udes
: ra
w m
artia
l, W
IP,
finis
hed
prod
ucts
)/(co
st
of fi
nish
ed
prod
ucts
/365
)
Logi
stic
cos
t:
• H
andl
ing
• Tr
ansp
orta
tion
• M
anag
emen
t Con
trol
• O
ther
logi
stic
op
erat
iona
l rel
ated
co
st
Sum
of s
uppl
y ch
ain
rela
ted
cost
for:
• M
IS51
•
Fina
nce
&pl
anni
ng
• M
ater
ial a
cqui
sitio
n •
Ord
er m
anag
emen
t •
Inve
ntor
y ke
epin
g
It re
fers
to a
ll th
e co
st a
ssoc
iate
d w
ith th
e tim
e w
hen
the
logi
stic
serv
ice
prov
ider
s ca
rry
out t
he lo
gist
ic o
pera
tions
.
(Man
agem
ent
info
rmat
ion
cost
)+(f
inan
ce a
nd
plan
ning
co
st)+
(inve
ntor
y ke
epin
g co
st)+
(mat
eria
l ac
quis
ition
)+(tr
ansp
ort
atio
n co
st)
Figu
re 2
8: E
valu
atio
n pa
ram
eter
s So
urce
: Sum
up
from
SC
OR
Ver
sion
5.0
Han
dboo
k, S
uppl
y C
hain
Cou
ncil,
Inc.
200
1 L
umsd
en, K
.R.,
1998
50
Wor
k-In
-Pro
cess
51
MIS
:Man
agem
ent I
nfro
mat
ion
Syst
em

______________________________________________________
77
School of Economics and Commercial Law Göteborg University
Chapter 5. A Case Study: Alps-Schenker-Volvo
In this section we selected one typical case of inbound logistics in manufacture industry to map the current inbound logistic operation and identify weak points. This is an inbound VMI case. The main purpose of the case study is to apply our model hypothesis in this case study and to illustrate the merit of the model.
5.1 Schenker International AB
Schenker International AB in Gothenburg is a global logistics service provider, which performs logistical set-ups, as a neutral partner for suppliers and their customers. The company has been working closely with many of the suppliers in the car manufacturing industry. The business service covers:
• Warehousing, free warehouse and bonded warehouse • Delivery control against delivery plans • Repacking into consignee’s standard packaging • Bar code handling • Marking of goods (ODETTE-standard) • Distribution, under Schenker control, to consignees • Quality controls • Assembly operations • Sequence deliveries • Kanban deliveries
Trollhättan is a car-manufacturing center in Sweden with a 4,000 m2 Schenker warehouse situated in the vicinity of a car manufacturing plant. A modern car needs 3500 parts, what belongs together also has to be brought together, by assisting with logistics activities, it is called automotive logistics. Before the process of building a car can begin, there is a challenging task – the various parts are made in countries all over the world. Schenker brings them together. Schenker will customize logistics concepts to make sure that even the smallest parts are in the right place at the right time. The company are also skilled in coordinating between suppliers and factories in facilitating assemble components in
Chapter 5 A Case Study: Alps-Schenker-Volvo ______________________________________________________
78
the correct sequences.
5.2 Logistics Solution
Schenker International AB is responsible for logistics services for some suppliers of Volvo and Saab in replenishing spare parts dedicated for car manufacturers. The information used in EDI system exchanged along with the whole material supply flow. Although from the appearance, Schenker acted as the logistic middleman between Volvo/Saab and its suppliers, while actually it is the supplier that is the real and the only contract client of Schenker.
The inbound communication process among parties in our case study is illustrated in Figure 29. In this logistic solution, all communication and information are exchanged via suppliers. It is the suppliers that are Schenker’s contracted customers. Thus, Schenker is serving the car manufacturers indirectly and it has no direct information connection with the OEMs.
We select Alps Electronics AB in this case study because it is not only one of the Volvo Cars’ suppliers but also a Schenker’s customer. Alps Nordic AB is a subsidiary of Japanese Alps Electronics Co. responsible for the Nordic market. Alps Electronics Co. provide Volvo Cars’ with multiple electronic components such as switches. Alps has production plants world around, with most of which spread in East Asia.
In the upper stream of the supply chain, Alps sales office in Gothenburg select Carriers & Route Shipment to transport their products from their factories all over the world to Gothenburg. Forwarders such as Maersk and other airlines are often used in this part of transportation.
Downstream to Schenker, Volvo Car and the other Volvo members contract Volvo logistics to pick up the inbound material from multiple Suppliers to different Volvo destinations in Torslanda (Volvo Car, Volvo Truck, etc.). The main reason for using Volvo Logistics in between is that by collecting all Volvo members’ delivery demand together; scale of economy can be achieved with a higher truckload rate. Thus Volvo logistic can bargain a good price from haulier. And Volvo car, which finances this part of delivery, can save expenses in the end.
______________________________________________________
79
School of Economics and Commercial Law Göteborg University
By overlooking the supply chain between the 1st tier supplier and the OEM, there are four logistic companies, sea/air forwarder, Schenker international, Volvo logistics, and some haulier involved in the inbound operation. The operational flow is very much fragmented. The more players in between the more complicated the communication system, the more errors may occur to decrease the efficiency and effectiveness of the whole supply chain.
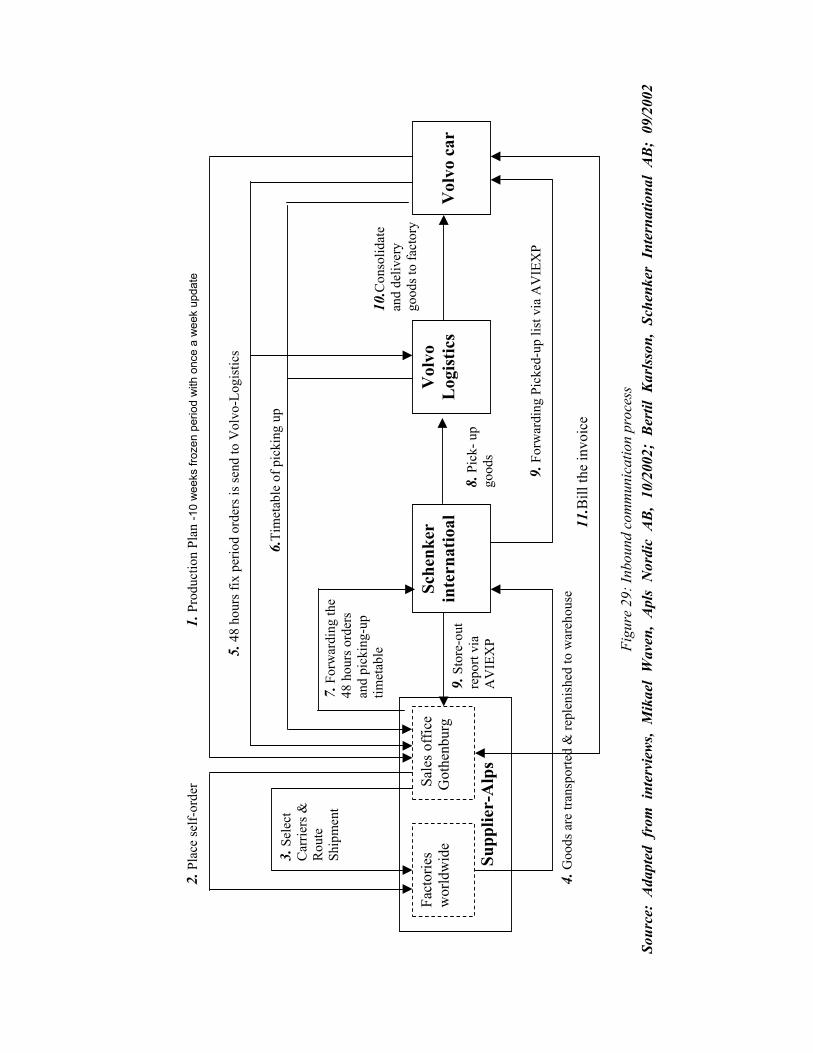
Fi
gure
29:
Inbo
und
com
mun
icat
ion
proc
ess
Sour
ce:
Ada
pted
fro
m i
nter
view
s, M
ikae
l W
aven
, A
pls
Nor
dic
AB
, 10
/200
2; B
ertil
Kar
lsso
n, S
chen
ker
Inte
rnat
iona
l A
B;
09/2
002
Supp
lier-
Alp
s
Sche
nker
inte
rnat
ioal
V
olvo
car
5. 4
8 ho
urs f
ix p
erio
d or
ders
is se
nd to
Vol
vo-L
ogis
tics
9. F
orw
ardi
ng P
icke
d-up
list
via
AV
IEX
P
6.Ti
met
able
of p
icki
ng u
p
9. S
tore
-out
re
port
via
AV
IEX
P
11.B
ill th
e in
voic
e 4.
Goo
ds a
re tr
ansp
orte
d &
repl
enis
hed
to w
areh
ouse
7.Fo
rwar
ding
the
48 h
ours
ord
ers
and
pick
ing-
up
timet
able
1. P
rodu
ctio
n Pl
an -1
0 w
eeks
froz
en p
erio
d w
ith o
nce
a w
eek
upda
te
Sal
es o
ffic
e G
othe
nbur
gFa
ctor
ies
wor
ldw
ide
2. P
lace
self-
orde
r
3. S
elec
t C
arrie
rs &
R
oute
Sh
ipm
ent
Vol
vo
Log
istic
s
10.C
onso
lidat
e an
d de
liver
y go
ods t
o fa
ctor
y
8. P
ick-
up
good
s
____________________________________________________________________________________________________________
81
School of Economics and Commercial Law Göteborg University
Figure 29 illustrates the whole information process of case Alps-Schenker-Volvo in inbound logistic solutions. The order of the numbers in this Figure is following the consequence of the operating process.
1. Once a week, according to the sales forecast, Volvo Car purchasing department sends it a production plan for the next 10 weeks to its suppliers’ local sales representative. In this case, it is Alps’s sales office in Gothenburg. This production plan will be updated once a week.
2. Relying on Volvo Car purchasing office’s 10 weeks forecast, Alps sales office will place the real order immediately to its factories worldwide. Most Alps production plants locate in the Far East such as Japan and Korea. The lead-times from production to goods delivered to Gothenburg are ranging from 5 to 15 weeks.
3. Alps sales office in Gothenburg then selects carriers & route shipment for the orders they placed to factories then transport them from worldwide factories to Gothenburg.
4. Before the goods reach Schenker International warehouse, a Store-In list will be sent from Alps sales office to Schenker, which includes the information of incoming goods about article number, goods quality, and arriving data, etc. When the goods arrive, Schenker will check them against the Store-In list and then put the goods information into the warehouse system.
5. Volvo Car Torslanda plant has an 8 days fixed plan production plan. But only 48 hours before production, Volvo Car production will place a fixed order to the Alps sales office in Gothenburg through Odette information system.
6. Volvo logistics consult with the logistic manager in Torslanda Plant as well as their contracted hauliers about the picking up timetable. Alps sales office will be informed once it has been settled.
7. The 48 hours fixed period order as well as the picking up time table will be directly transferred to Schenker warehouse via EDI from Alps sales office. Schenker will then pick out the goods from the warehouse before the hauler comes to pick them up. If needed, the goods are repackaged and marked as per instruction from Alps according to the request of Volvo car.
Chapter 5 A Case Study: Alps-Schenker-Volvo _______________________________________________________
82
8. The hauler picks up the goods from some suppliers’ warehouse in Gothenburg to the Volvo logistics’ terminal, where all inbound material are cross-docked and reconsolidated arcading to different destinations. For Alps, the hauler picks up twice a week from Schenker warehouse according to the timetable.
9. Once the goods have been picked up, the picked-up information will be sent from Schenker to Volvo Car Torslanda via AVIEXP at proper time for their reception. Almost at the same time, Schenker sends the warehouse store-out information to Alps via AVIEXP.
10. After reloading at Volvo logistic’ terminal, goods which belongs to Volvo Car Torslanda plant will be delivered directly to the production site.
11. When Volvo Car receives the goods, it will bill itself for afterwards payment.
(For a detailed process that happened in Schenker International Warehouse please see Appendix II)
5.3 SCORING the Inbound Process
5.3.1 Process Mapping
We applied the SCOR model to decompose the inbound flow among Alps, Schenker, and Volvo. If we put the complex process into SCOR model categories, it can be clearly defined how each activity contributes in the whole flow.
According to the SCOR model in Level 2, the inbound logistic process elements of Alps-Schenker-Volvo have been depicted in the Figure 30. Classified by the different performing entities, the inbound process was broken down into four parts separately belonging to Alps, Schenker international AB, Volvo Logistic, and Volvo Car. For each of the companies, their operation has been categorized into Source-Make-Deliver.
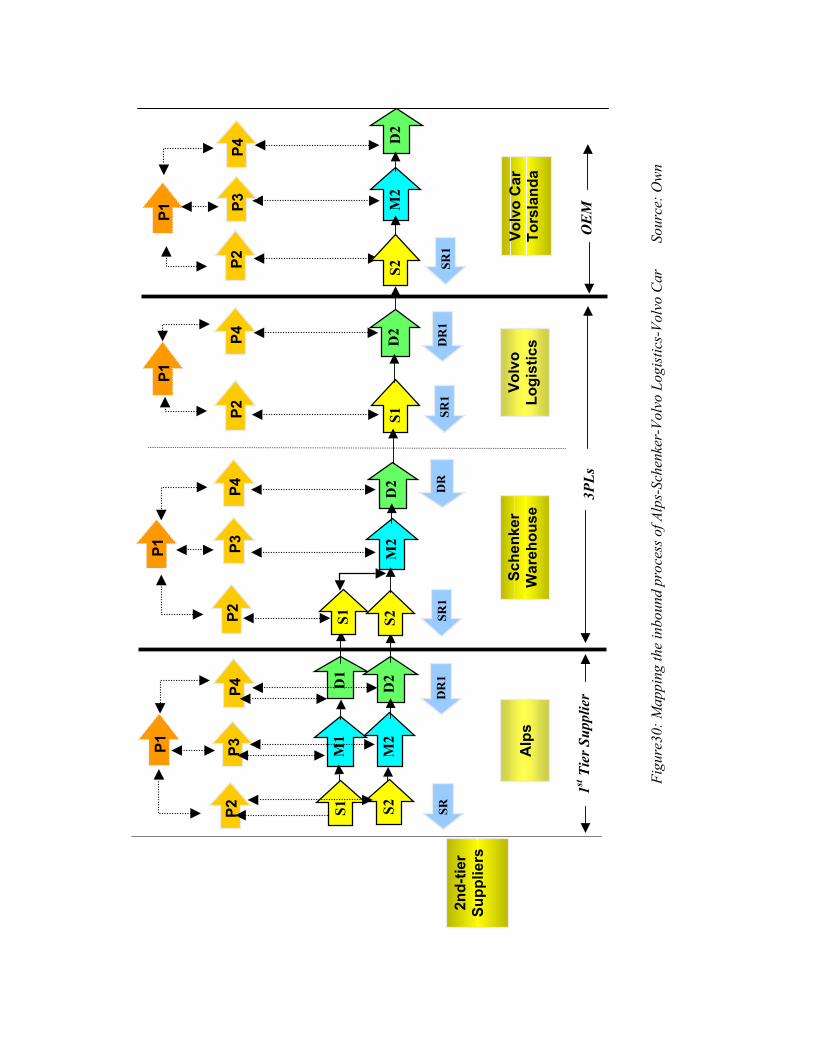
Figu
re30
: Map
ping
the
inbo
und
proc
ess o
f Alp
s-Sc
henk
er-V
olvo
Log
istic
s-Vo
lvo
Car
Sou
rce:
Ow
n
P4P3
P2
P4
P2
P1
P1P1 P3
P2P3
A
lps
D1
M1
2nd-
tier
Supp
liers
Sche
nker
W
areh
ouse
Volv
o C
ar
Tors
land
a
S1
S2
SR1
DR
1SR
D2
M2
Volv
o Lo
gist
ics
D2
3PLs
S1
S2M
2M
2
P4
P1
P2
SR1
D2
S1
DR
DR
1SR
1
1st T
ier S
uppl
ier
OE
M
S2
P4
D2
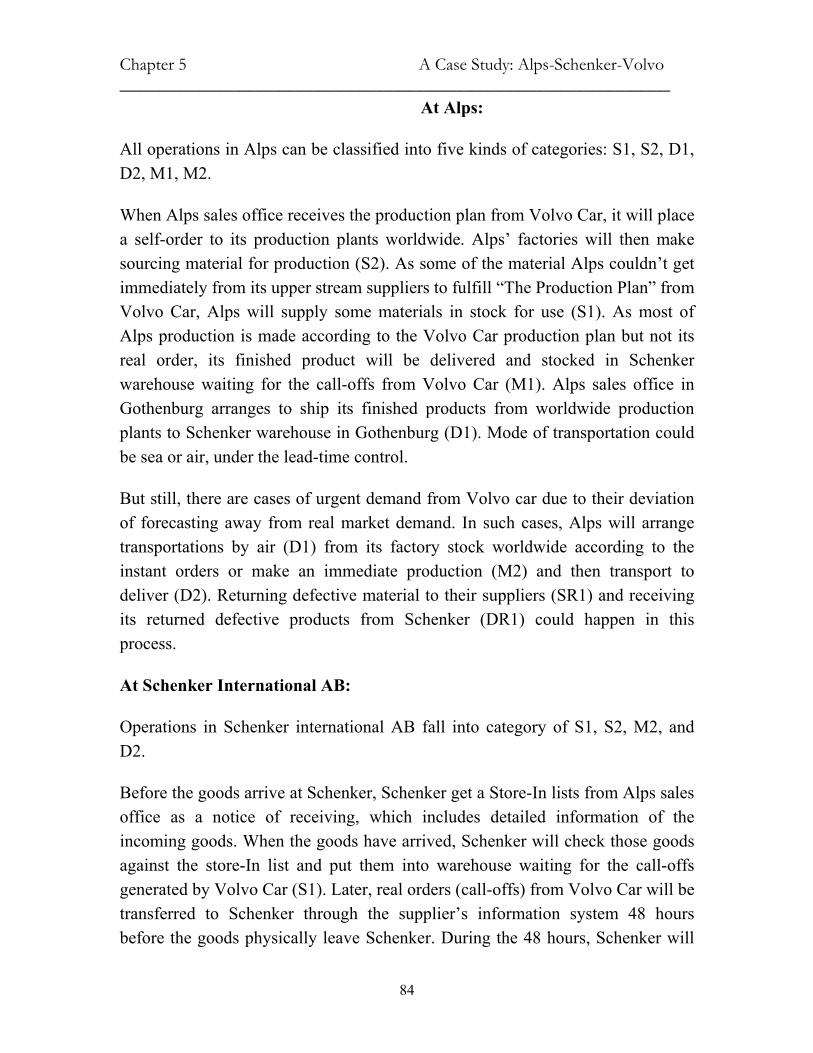
Chapter 5 A Case Study: Alps-Schenker-Volvo _______________________________________________________
84
At Alps:
All operations in Alps can be classified into five kinds of categories: S1, S2, D1, D2, M1, M2.
When Alps sales office receives the production plan from Volvo Car, it will place a self-order to its production plants worldwide. Alps’ factories will then make sourcing material for production (S2). As some of the material Alps couldn’t get immediately from its upper stream suppliers to fulfill “The Production Plan” from Volvo Car, Alps will supply some materials in stock for use (S1). As most of Alps production is made according to the Volvo Car production plan but not its real order, its finished product will be delivered and stocked in Schenker warehouse waiting for the call-offs from Volvo Car (M1). Alps sales office in Gothenburg arranges to ship its finished products from worldwide production plants to Schenker warehouse in Gothenburg (D1). Mode of transportation could be sea or air, under the lead-time control.
But still, there are cases of urgent demand from Volvo car due to their deviation of forecasting away from real market demand. In such cases, Alps will arrange transportations by air (D1) from its factory stock worldwide according to the instant orders or make an immediate production (M2) and then transport to deliver (D2). Returning defective material to their suppliers (SR1) and receiving its returned defective products from Schenker (DR1) could happen in this process.
At Schenker International AB:
Operations in Schenker international AB fall into category of S1, S2, M2, and D2.
Before the goods arrive at Schenker, Schenker get a Store-In lists from Alps sales office as a notice of receiving, which includes detailed information of the incoming goods. When the goods have arrived, Schenker will check those goods against the store-In list and put them into warehouse waiting for the call-offs generated by Volvo Car (S1). Later, real orders (call-offs) from Volvo Car will be transferred to Schenker through the supplier’s information system 48 hours before the goods physically leave Schenker. During the 48 hours, Schenker will
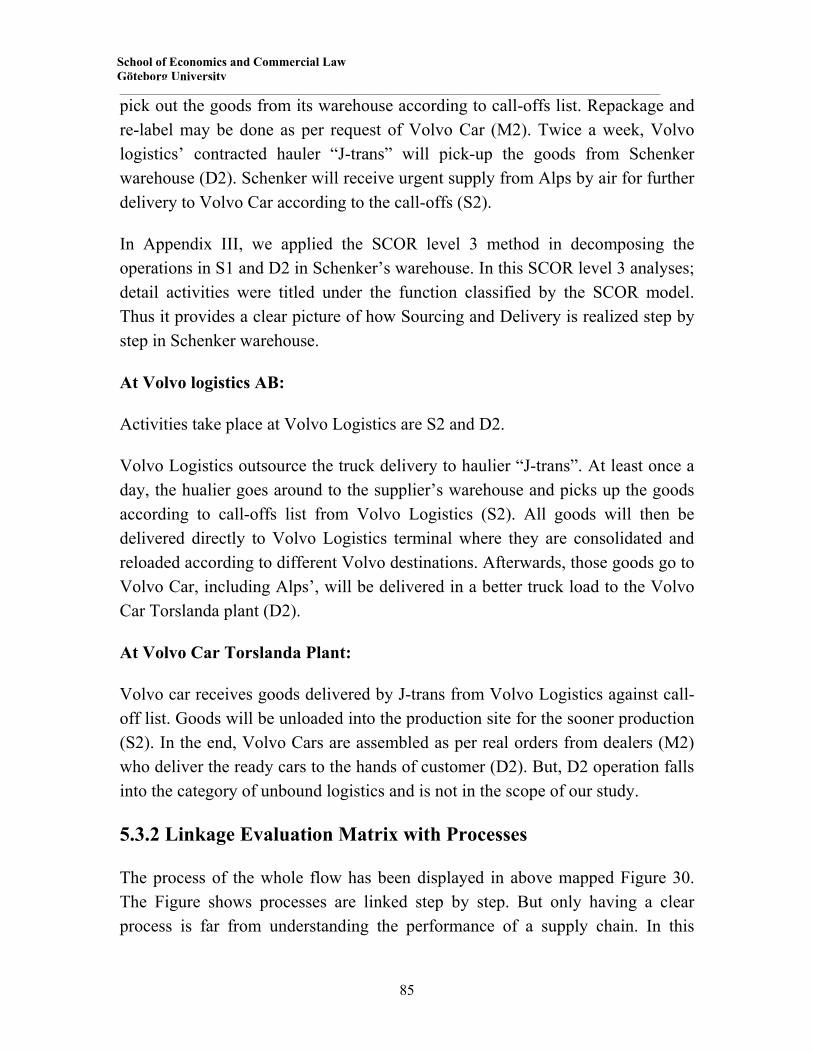
____________________________________________________________________________________________________________
85
School of Economics and Commercial Law Göteborg University
pick out the goods from its warehouse according to call-offs list. Repackage and re-label may be done as per request of Volvo Car (M2). Twice a week, Volvo logistics’ contracted hauler “J-trans” will pick-up the goods from Schenker warehouse (D2). Schenker will receive urgent supply from Alps by air for further delivery to Volvo Car according to the call-offs (S2).
In Appendix III, we applied the SCOR level 3 method in decomposing the operations in S1 and D2 in Schenker’s warehouse. In this SCOR level 3 analyses; detail activities were titled under the function classified by the SCOR model. Thus it provides a clear picture of how Sourcing and Delivery is realized step by step in Schenker warehouse.
At Volvo logistics AB:
Activities take place at Volvo Logistics are S2 and D2.
Volvo Logistics outsource the truck delivery to haulier “J-trans”. At least once a day, the hualier goes around to the supplier’s warehouse and picks up the goods according to call-offs list from Volvo Logistics (S2). All goods will then be delivered directly to Volvo Logistics terminal where they are consolidated and reloaded according to different Volvo destinations. Afterwards, those goods go to Volvo Car, including Alps’, will be delivered in a better truck load to the Volvo Car Torslanda plant (D2).
At Volvo Car Torslanda Plant:
Volvo car receives goods delivered by J-trans from Volvo Logistics against call-off list. Goods will be unloaded into the production site for the sooner production (S2). In the end, Volvo Cars are assembled as per real orders from dealers (M2) who deliver the ready cars to the hands of customer (D2). But, D2 operation falls into the category of unbound logistics and is not in the scope of our study.
5.3.2 Linkage Evaluation Matrix with Processes
The process of the whole flow has been displayed in above mapped Figure 30. The Figure shows processes are linked step by step. But only having a clear process is far from understanding the performance of a supply chain. In this
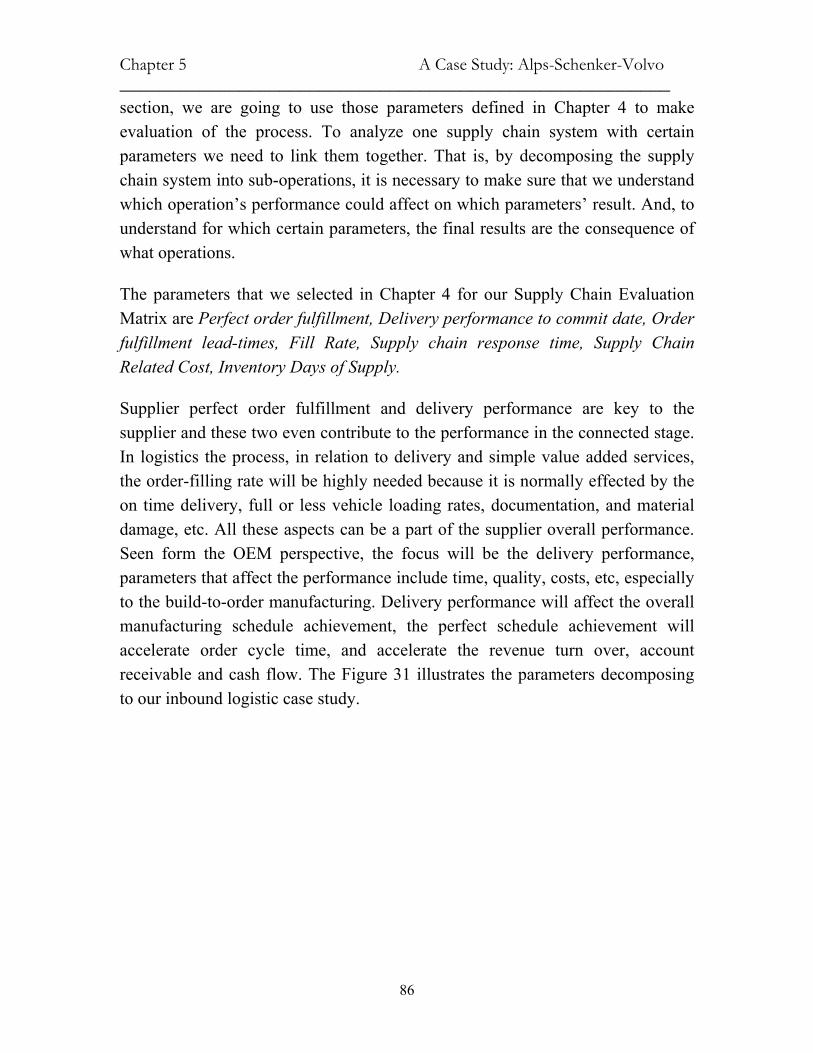
Chapter 5 A Case Study: Alps-Schenker-Volvo _______________________________________________________
86
section, we are going to use those parameters defined in Chapter 4 to make evaluation of the process. To analyze one supply chain system with certain parameters we need to link them together. That is, by decomposing the supply chain system into sub-operations, it is necessary to make sure that we understand which operation’s performance could affect on which parameters’ result. And, to understand for which certain parameters, the final results are the consequence of what operations.
The parameters that we selected in Chapter 4 for our Supply Chain Evaluation Matrix are Perfect order fulfillment, Delivery performance to commit date, Order fulfillment lead-times, Fill Rate, Supply chain response time, Supply Chain Related Cost, Inventory Days of Supply.
Supplier perfect order fulfillment and delivery performance are key to the supplier and these two even contribute to the performance in the connected stage. In logistics the process, in relation to delivery and simple value added services, the order-filling rate will be highly needed because it is normally effected by the on time delivery, full or less vehicle loading rates, documentation, and material damage, etc. All these aspects can be a part of the supplier overall performance. Seen form the OEM perspective, the focus will be the delivery performance, parameters that affect the performance include time, quality, costs, etc, especially to the build-to-order manufacturing. Delivery performance will affect the overall manufacturing schedule achievement, the perfect schedule achievement will accelerate order cycle time, and accelerate the revenue turn over, account receivable and cash flow. The Figure 31 illustrates the parameters decomposing to our inbound logistic case study.
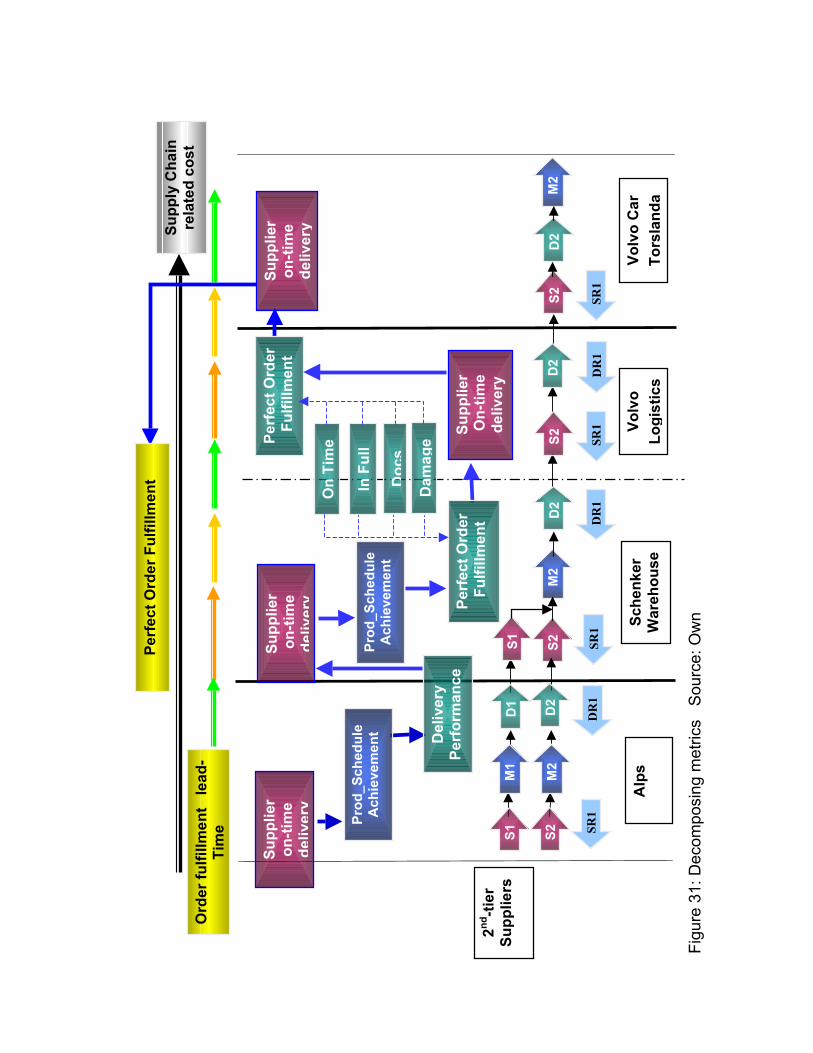
Figu
re 3
1: D
ecom
posi
ng m
etric
s S
ourc
e: O
wn
Supp
lier
on-ti
me
deliv
ery
Alp
s Sc
henk
er
War
ehou
seVo
lvo
Car
To
rsla
nda
SR1
DR
1SR
1
Volv
o Lo
gist
ics
M2
D2
2nd-ti
er
Supp
liers
S2
SR1
DR
1D
R1
SR1
Supp
lier
On-
time
deliv
ery
Perf
ect O
rder
Ful
fillm
ent
On
Tim
e
In F
ull
Doc
s
Dam
age
Perf
ect O
rder
Ful
fillm
ent
Prod
_Sch
edul
eA
chie
vem
ent
Supp
lier
on-
time
deliv
ery
Ord
er fu
lfillm
ent
lead
-Ti
me
Perf
ect O
rder
Ful
fillm
ent
Del
iver
y Pe
rfor
man
ce
Supp
lier
on-ti
me
deliv
ery
Prod
_Sch
edul
eA
chie
vem
ent
S2
S2
S2
S1
S1M
1
M2
M2
D2
D1
D2
D2Su
pply
Cha
in
rela
ted
cost
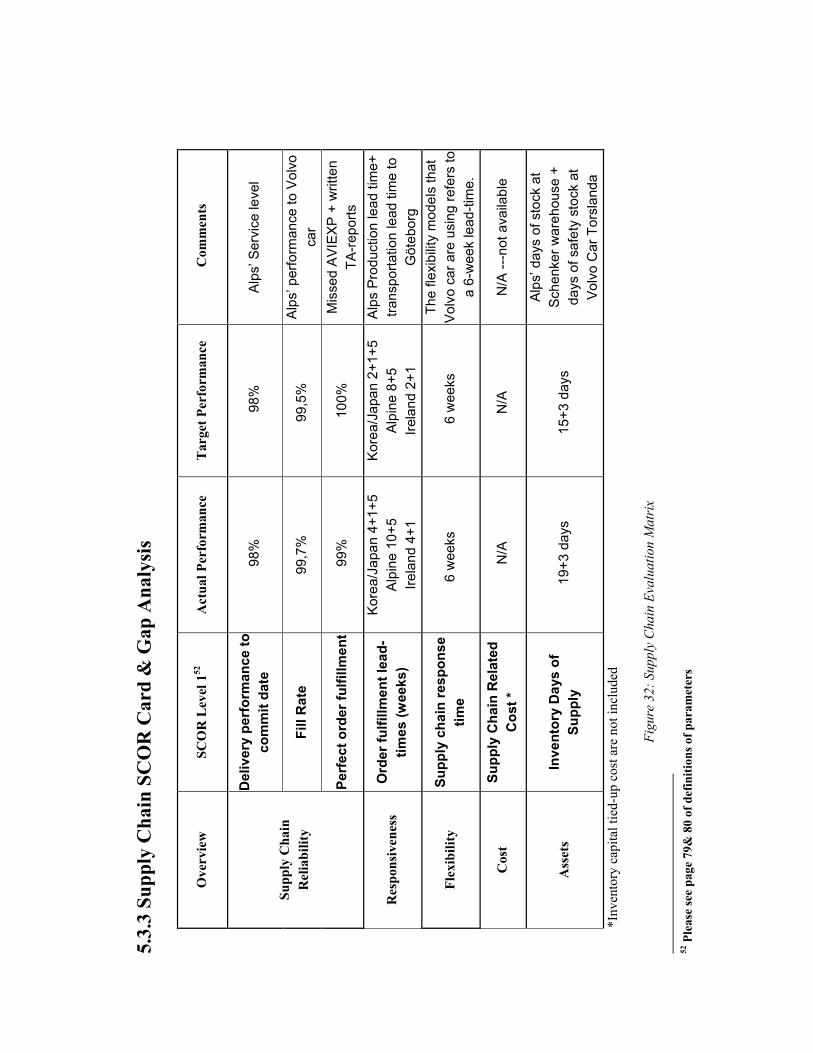
5.3.
3 Su
pply
Cha
in S
CO
R C
ard
& G
ap A
naly
sis
Ove
rvie
w
SCO
R L
evel
152
A
ctua
l Per
form
ance
T
arge
t Per
form
ance
C
omm
ents
Del
iver
y pe
rfor
man
ce to
co
mm
it da
te
98%
9
8%
Alps
’ Ser
vice
leve
l
Fill
Rat
e 99
,7%
99
,5%
Al
ps’ p
erfo
rman
ce to
Vol
vo
car
Supp
ly C
hain
R
elia
bilit
y
Perf
ect o
rder
fulfi
llmen
t 9
9%
100%
M
isse
d AV
IEXP
+ w
ritte
n TA
-repo
rts
Res
pons
iven
ess
Ord
er fu
lfillm
ent l
ead-
times
(wee
ks)
Kore
a/Ja
pan
4+1+
5 Al
pine
10+
5 Ire
land
4+1
Kore
a/Ja
pan
2+1+
5 Al
pine
8+5
Ire
land
2+1
Alps
Pro
duct
ion
lead
tim
e+
trans
porta
tion
lead
tim
e to
G
öteb
org
Flex
ibili
ty
Supp
ly c
hain
resp
onse
tim
e 6
wee
ks
6 w
eeks
Th
e fle
xibi
lity
mod
els
that
Vo
lvo
car a
re u
sing
refe
rs to
a
6-w
eek
lead
-tim
e.
Cos
t Su
pply
Cha
in R
elat
ed
Cos
t *
N/A
N
/A
N/A
---n
ot a
vaila
ble
Ass
ets
Inve
ntor
y D
ays
of
Supp
ly
19+
3 da
ys
15+3
day
s
Alps
’ day
s of
sto
ck a
t Sc
henk
er w
areh
ouse
+
days
of s
afet
y st
ock
at
Volv
o C
ar T
orsl
anda
*I
nven
tory
cap
ital t
ied-
up c
ost a
re n
ot in
clud
ed
F
igur
e 32
: Sup
ply
Cha
in E
valu
atio
n M
atri
x
52 P
leas
e se
e pa
ge 7
9& 8
0 of
def
initi
ons o
f par
amet
ers
____________________________________________________________________________________________________________
89
School of Economics and Commercial Law Göteborg University
According to the Supply chain Council, the scorecard analysis is realized by defining the gaps through benchmarking the ideal performance with the reality. In the matrix we adapt those given parameters from the SCOR model and some of Lumsden’s parameters in tailor of needs from the inbound operational perspective.
Above Figure 32 is the performance of this inbound supply chain. They are summarized from interviews to the head of Volvo Car Torslanda Plant, Schenker international AB, ALPS Nordic AB and Volvo logistics. The result of the performance can be evaluated through gaps between the actual and target performance.
5.3.4 Performance Measurement
In this part, based on our mapped process and identified parameters, we aim to describe weak points in this inbound process for future improvements. From the given Figures, we can see that the performance of Alps is very successful and Volvo Car is quite satisfied.
But still, one conflict exists in these Figures. As the parameter “ Perfect order fulfillment” has higher requirements than “delivery performance to commit date”, quantitatively, “perfect order fulfillment” couldn’t be higher than the “delivery performance to commit date”. But we got 99% perfect order fulfillment with 98% delivery performance to commit date. The reason for this conflict is that the company measures things in a different way and there is Missed AVIEXP information.
Two weak points are very obvious in this inbound process:
1. For Alps, its Stock at Schenker’s warehouse was 19 days, which is worse than target, which should have been max 15 days. There are 4 days inventory gap between actual performance and their target. While on the other hand, Alps’ “fill rate” is over performed, which means, their out-of stock is very rare and always had plenty of good in stock for orders. These two performances are related to different dimensions in the “logistic mix of goals” (theory in Chapter 3), logistic service and tied-up capital. It seems they over-performed the logistic service on the cost of more capital tied-up.
Chapter 5 A Case Study: Alps-Schenker-Volvo _______________________________________________________
90
One of the important reasons from management point of view exists in the unmatched responsibility and capabilities. on one hand, it is the Alps’ sales office who take charge of inventory management and all the delivery planning. On the other hand, it is Schenker International who has the first hand information of Alps’ inventories and prepares stock-out to Volvo Logistics. Obviously, in this relationship, though Schenker is at the first position of operation but is in a very negative role on inventory management and logistic information management. All Schenker does is on behalf of Alps’ sales office command and all information goes through Alps sales office. Schenker at the first line of operations but gets the second hand information. The disruption between operations and management could be another important reason for this unbalance performance.
2. There are on average 2 weeks production lead-time gap in Alps in all over the production plant worldwide. And to fulfill the task of shortening its production lead-time for 2 weeks, It is crucial that Alps streamline its inbound process with their suppliers. This, from OEM point of view, belongs to the upper stream value chain, from the 2nd -tier of suppliers to the 1st -tier suppliers.
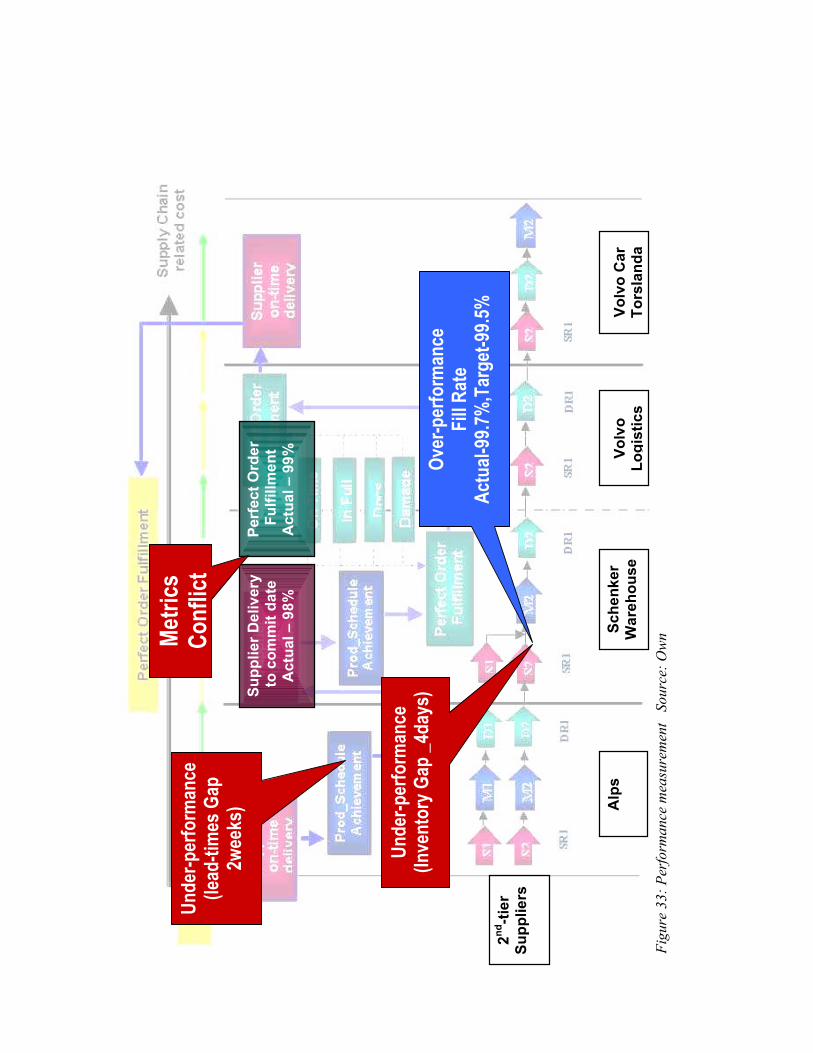
Figu
re 3
3: P
erfo
rman
ce m
easu
rem
ent
Sou
rce:
Ow
n
2nd-ti
er
Supp
liers
Alp
s Sc
henk
er
War
ehou
seVo
lvo
Car
To
rsla
nda
Volv
o Lo
gist
ics
Supp
lier D
eliv
ery
to c
omm
it da
te
Act
ual –
98%
Perf
ect O
rder
F
ulfil
lmen
t A
ctua
l – 9
9%
Metri
cs
Conf
lict
Unde
r-per
form
ance
(In
vent
ory G
ap _4
days
)
Unde
r-per
form
ance
(lead
-tim
es G
ap
2wee
ks)
Over
-per
form
ance
Fi
ll Rat
e
Actu
al-99
.7%,T
arge
t-99.5
%
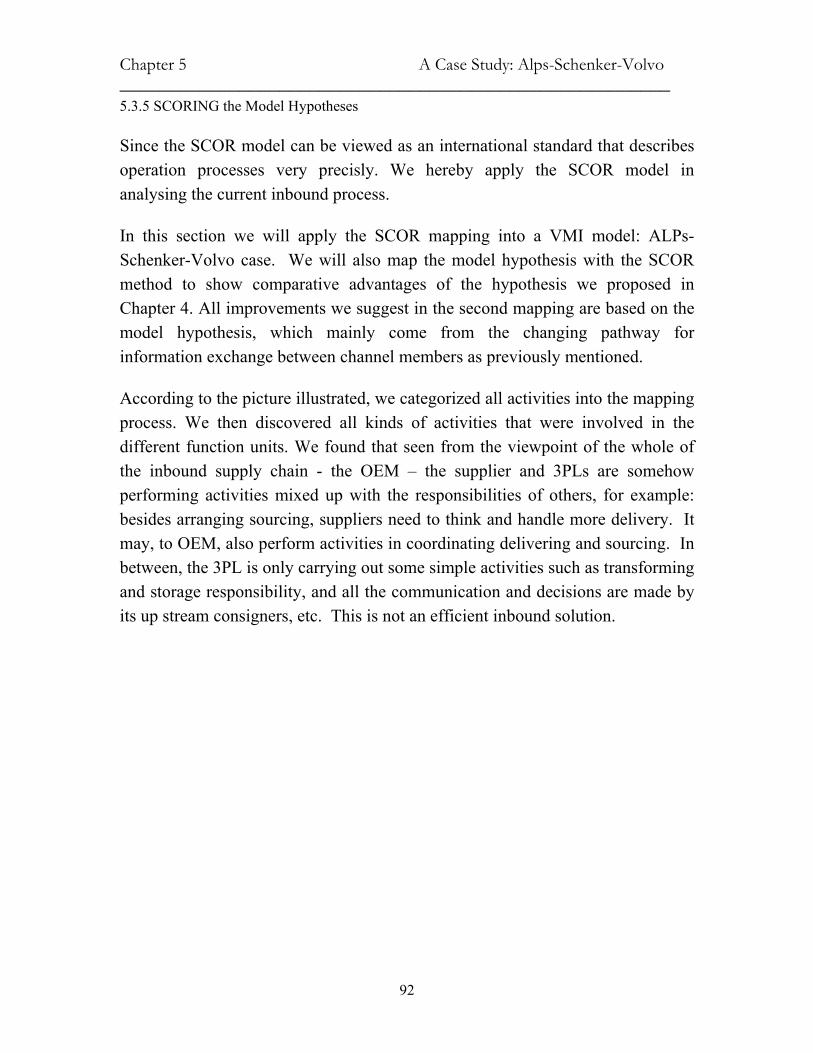
Chapter 5 A Case Study: Alps-Schenker-Volvo _______________________________________________________
92
5.3.5 SCORING the Model Hypotheses
Since the SCOR model can be viewed as an international standard that describes operation processes very precisly. We hereby apply the SCOR model in analysing the current inbound process.
In this section we will apply the SCOR mapping into a VMI model: ALPs-Schenker-Volvo case. We will also map the model hypothesis with the SCOR method to show comparative advantages of the hypothesis we proposed in Chapter 4. All improvements we suggest in the second mapping are based on the model hypothesis, which mainly come from the changing pathway for information exchange between channel members as previously mentioned.
According to the picture illustrated, we categorized all activities into the mapping process. We then discovered all kinds of activities that were involved in the different function units. We found that seen from the viewpoint of the whole of the inbound supply chain - the OEM – the supplier and 3PLs are somehow performing activities mixed up with the responsibilities of others, for example: besides arranging sourcing, suppliers need to think and handle more delivery. It may, to OEM, also perform activities in coordinating delivering and sourcing. In between, the 3PL is only carrying out some simple activities such as transforming and storage responsibility, and all the communication and decisions are made by its up stream consigners, etc. This is not an efficient inbound solution.
Figu
re 3
4: S
cori
ng th
e Al
p-Sc
henk
er-V
olvo
inbo
und
activ
ity.
So
urce
: Ow
n
D1.
1
D1.
2 D
1.3
D
1.4
D1.
5
D1.
7 D
1.11
D1.
12
D1.
13
2nd- t
ier
Supp
liers
Alp
s
D2
D2
S2
D1
M1
Sche
nker
War
ehou
se
Vol
vo C
ar
Tor
slan
da
S1
M2
S2D
2S2
S1
D2
D2.
1
D2.
2 D
2.3
D
2.4
D2.
5
D2.
7
D2.
9
D2.
10
D2.
11 D
2.12
S1.1
S1
.2
S1.3
S1
.4
D2.
2D
2.3
D2.
4D
2.6
D2.
8D
2.9
S2.1
S2
.2S2
.3
S2.4
D2.
1 D
2.2
D2.
4 D
2.5
D2.
6 D
2.7
D2.
9 D
2.12
M2
M2M
2.4
Vol
vo
Log
istic
s
S2
S2.1
S2
.2
S2.3
S2
.4
S2.5
3PLs
1st T
ier S
uppl
ier
OE
M
S2.2
S2.3
S2.4
S2.5
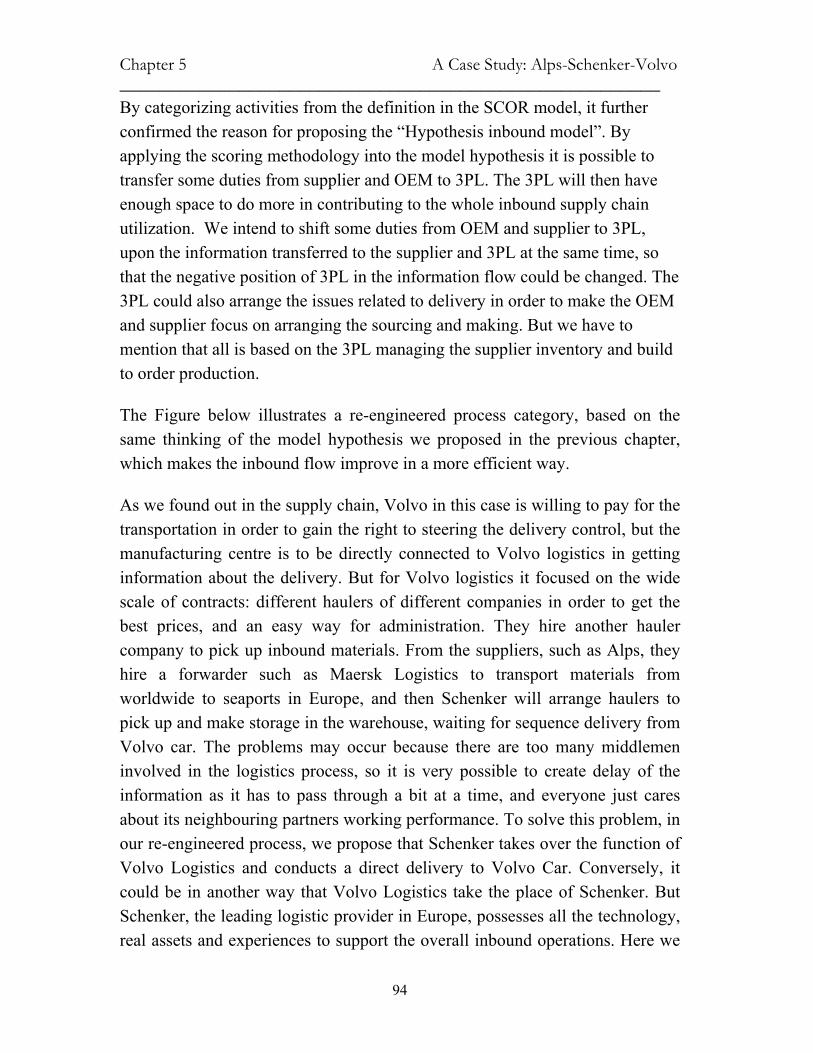
Chapter 5 A Case Study: Alps-Schenker-Volvo ______________________________________________________
94
By categorizing activities from the definition in the SCOR model, it further confirmed the reason for proposing the “Hypothesis inbound model”. By applying the scoring methodology into the model hypothesis it is possible to transfer some duties from supplier and OEM to 3PL. The 3PL will then have enough space to do more in contributing to the whole inbound supply chain utilization. We intend to shift some duties from OEM and supplier to 3PL, upon the information transferred to the supplier and 3PL at the same time, so that the negative position of 3PL in the information flow could be changed. The 3PL could also arrange the issues related to delivery in order to make the OEM and supplier focus on arranging the sourcing and making. But we have to mention that all is based on the 3PL managing the supplier inventory and build to order production.
The Figure below illustrates a re-engineered process category, based on the same thinking of the model hypothesis we proposed in the previous chapter, which makes the inbound flow improve in a more efficient way.
As we found out in the supply chain, Volvo in this case is willing to pay for the transportation in order to gain the right to steering the delivery control, but the manufacturing centre is to be directly connected to Volvo logistics in getting information about the delivery. But for Volvo logistics it focused on the wide scale of contracts: different haulers of different companies in order to get the best prices, and an easy way for administration. They hire another hauler company to pick up inbound materials. From the suppliers, such as Alps, they hire a forwarder such as Maersk Logistics to transport materials from worldwide to seaports in Europe, and then Schenker will arrange haulers to pick up and make storage in the warehouse, waiting for sequence delivery from Volvo car. The problems may occur because there are too many middlemen involved in the logistics process, so it is very possible to create delay of the information as it has to pass through a bit at a time, and everyone just cares about its neighbouring partners working performance. To solve this problem, in our re-engineered process, we propose that Schenker takes over the function of Volvo Logistics and conducts a direct delivery to Volvo Car. Conversely, it could be in another way that Volvo Logistics take the place of Schenker. But Schenker, the leading logistic provider in Europe, possesses all the technology, real assets and experiences to support the overall inbound operations. Here we

____________________________________________________________________________________________________________
95
School of Economics and Commercial Law Göteborg University
assume Schenker as the only 3PL in our re-engineered process.
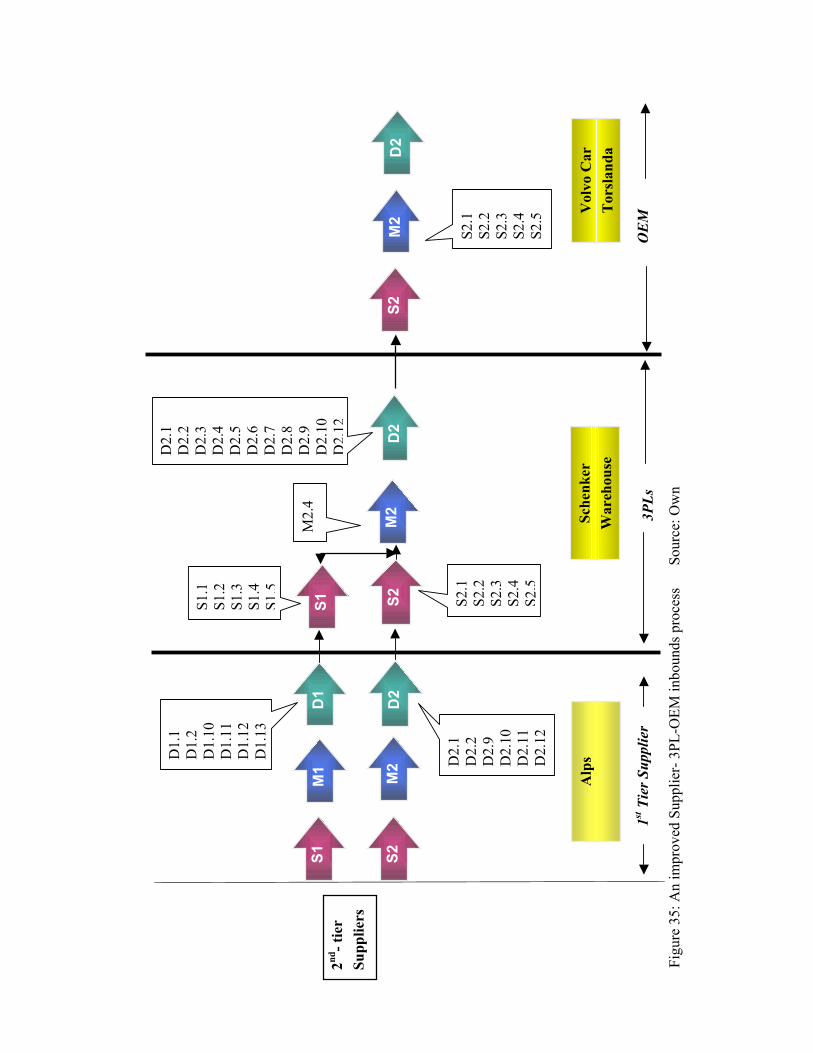
Figu
re 3
5: A
n im
prov
ed S
uppl
ier-
3PL
-OEM
inbo
unds
pro
cess
Sour
ce: O
wn
D1.
1
D1.
2 D
1.10
D
1.11
D
1.12
D
1.13
2nd- t
ier
Supp
liers
Alp
s
D2
D2
D1
M1
Sche
nker
War
ehou
seV
olvo
Car
T
orsl
anda
S1
M2
S2S2
S1
D2
D2.
1
D2.
2 D
2.9
D
2.10
D
2.11
D
2.12
S1.1
S1.2
S1
.3
S1.4
S1
.5
D2.
1 D
2.2
D2.
3 D
2.4
D2.
5 D
2.6
D2.
7 D
2.8
D2.
9 D
2.10
D
2.12
M2
M2
M2.
4
S2
S2.1
S2
.2
S2.3
S2
.4
S2.5
3PLs
1st T
ier S
uppl
ier
OE
M
S2.1
S2.2
S2.3
S2.4
S2.5
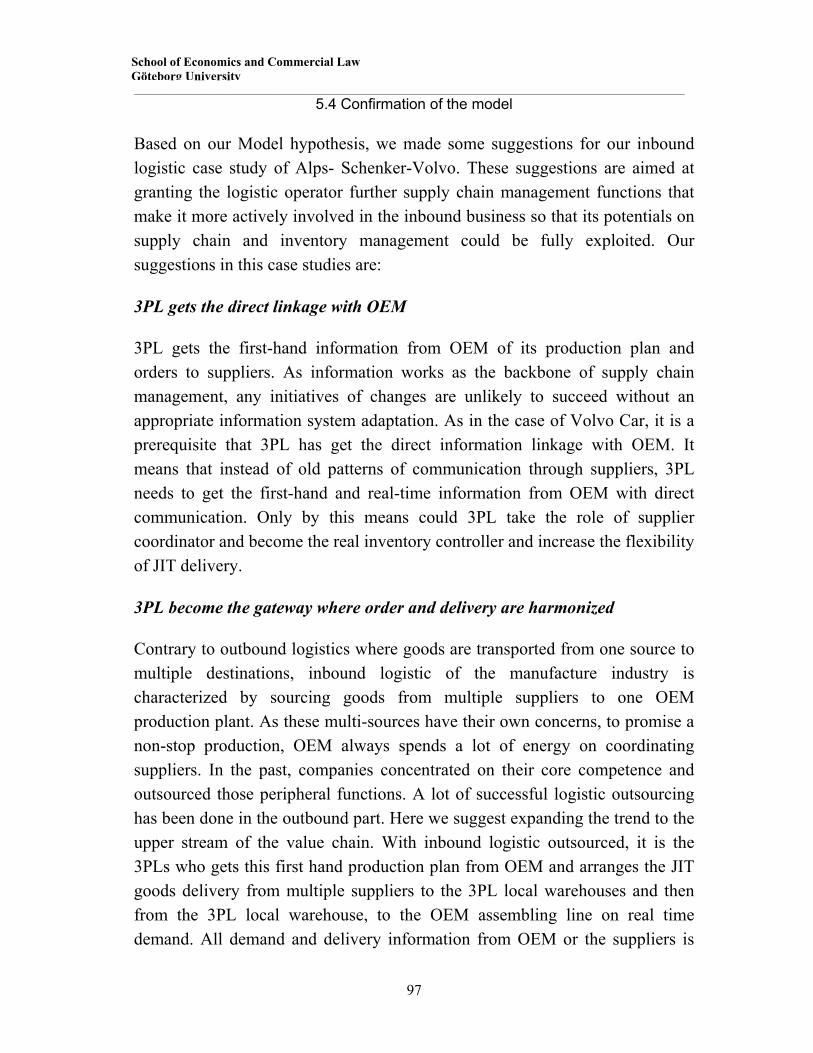
______________________________________________________________________________________________________________
97
School of Economics and Commercial Law Göteborg University
5.4 Confirmation of the model
Based on our Model hypothesis, we made some suggestions for our inbound logistic case study of Alps- Schenker-Volvo. These suggestions are aimed at granting the logistic operator further supply chain management functions that make it more actively involved in the inbound business so that its potentials on supply chain and inventory management could be fully exploited. Our suggestions in this case studies are:
3PL gets the direct linkage with OEM
3PL gets the first-hand information from OEM of its production plan and orders to suppliers. As information works as the backbone of supply chain management, any initiatives of changes are unlikely to succeed without an appropriate information system adaptation. As in the case of Volvo Car, it is a prerequisite that 3PL has get the direct information linkage with OEM. It means that instead of old patterns of communication through suppliers, 3PL needs to get the first-hand and real-time information from OEM with direct communication. Only by this means could 3PL take the role of supplier coordinator and become the real inventory controller and increase the flexibility of JIT delivery.
3PL become the gateway where order and delivery are harmonized
Contrary to outbound logistics where goods are transported from one source to multiple destinations, inbound logistic of the manufacture industry is characterized by sourcing goods from multiple suppliers to one OEM production plant. As these multi-sources have their own concerns, to promise a non-stop production, OEM always spends a lot of energy on coordinating suppliers. In the past, companies concentrated on their core competence and outsourced those peripheral functions. A lot of successful logistic outsourcing has been done in the outbound part. Here we suggest expanding the trend to the upper stream of the value chain. With inbound logistic outsourced, it is the 3PLs who gets this first hand production plan from OEM and arranges the JIT goods delivery from multiple suppliers to the 3PL local warehouses and then from the 3PL local warehouse, to the OEM assembling line on real time demand. All demand and delivery information from OEM or the suppliers is
Chapter 5 A Case Study: Alps-Schenker-Volvo ______________________________________________________
98
centralized at 3PL. In the case of any failure or schedule changes from any party in the supply chain, it is the logistic provider who harmonizes the delivery of all suppliers to postpone or fasten the delivery to the best result.
3PL “managing” inventory, incl. planning of inventory levels
In our case study, currently, the inventory replenishment and inventory level control are made by supplier’s local sales office and the entire inventory is in Schenker local warehouse. However, Schenker has first hand information of suppliers’ local inventory, and also have the professional knowledge and competence to make a better inventory management. With the new logistic solution, when Schenker could get first-hand information from the OEM and arrange the goods delivery from supplier’s distant production plants to local warehouse, the responsibility of inventory control is consequently handed over to 3PL. The property of goods belongs to suppliers until OEM claims of receiving. In case of any failure of delivery or OEM production sudden changes, 3PL would work in the middle coordinating delay delivery or shift it to earlier time for all the suppliers. Due to scale of economy, the more suppliers that 3PL takes charge of, the more obvious are the merits of 3PL being responsible for suppliers inventory management.
All in all, the merits of 3PL managing the inbound supply chain are:
• Improve the delivery performance, decrease the delivery errors • Simplify the communication process of inbound logistics • Increase the flexibility of delivery • Reduce the inventory level and capitals tie-up cost
______________________________________________________________________________________________________________
99
School of Economics and Commercial Law Göteborg University
Chapter 6. Conclusion & Recommendations
The specific recommendations in this report are the true conclusion of this study toward the main problem we defined. This is based on the whole process of solving the three sub-research-problems step by step.
6.1 Conclusion
To answer the first sub-question in the target of this thesis work: How is the process of current inbound logistic system in Chapter 4? We categorized all inbound operations into three models: traditional model, VMI model and a model hypothesis. The fundamental difference of these models is information flow, not technically, but concerning business relationships. As the information has become the backbone of the logistic system, different information flow determines the position of logistic provider in the logistics system. We believe any current inbound logistics system falls into at least one of the models. Meanwhile, the last model hypothesis is more about answering our third sub-problem of what differences there will be in the future when compared to the present.
Secondly, we try to define these parameters, that are acting actively in inbound process, in assisting the logistics company in finding ways for better severing inbound process. Consulting with authoritative theories we introduce seven parameters in Chapter 5 to evaluate the effectiveness and efficiency of the inbound process. These parameters are selected not only from the logistic operational perspective so that the logistic performance can be quantitative measured, but also from the supply chain perspective to assess the final result of the whole chain.
The last sub-problem is what kind of improvement can be made on the inbound logistic system and how it will be after improvement. During our analysis of the current inbound logistic system, it shows that a logistic company has the capability to be an extension of the supplier or OEM. Once all channel members are fully integrated, the overall efficiency and cost reduction will be achieved to a greater extent.
With applying the Supply Chain Operation Reference (SCOR) Model in
Chapter 6 Conclusion & Recommendations ______________________________________________________
100
analyzing and evaluating the existing cases, we found that even the popular VMI method could not avoid the communication obstacles between the logistics provider and OEM. The logistics company is actually bounded to supplier with all communication via them. So we should find better ways in balancing the responsibilities within the supply channel. We summarized all our ideas in our model hypothesis. And, in Chapter 5, we use a case study to illustrate the merits of all the changes.
6.2 Recommendations
Integration of the supply chain has, for many years, been a powerful and compelling enabler across a wide range of industries. As a result, many of the core supply chain concepts and principles have been put into practice in a much more effective way. These concepts include: information sharing, multi-party collaboration, design for supply chain management, postponement for mass customization, outsourcing and partnerships, and extended or joint performance measures. The Iiformation technology has allowed companies to come up with highly innovative solutions that accelerated the adoption of these core supply chain principles.
The recommendation can be defined in all of the different branches of business for the inbound logistics services:
Creating Collaboration and Trust in the Supply Chain
There are challenges in managing supply chain relationships. The problem that greatly hinders the implementation is the relationship between channel members. After carrying out several interviews with suppliers and OEMs, we find that the obstacles are initiated from the OEM because they do not want to be in contact with several people, they just want to talk to one person, or they may find a company responsible for its logistics and supply affairs as a representative for central controlling, so they can talk to this person and then in turn let him talk to different suppliers and logistics companies, so as to simplify its working procedures and focus more on its core competences. For the future success of the inbound supply chain, and for the benefit of all
______________________________________________________________________________________________________________
101
School of Economics and Commercial Law Göteborg University
participants within the channel, calls for developing a trusting relationship with supply chain partners, implementing alliance development in providing a harmonised atmosphere for discussions.
Developing New Technology and The Solution
When developing a Supply Chain strategy, it should begin by evaluating how the links in a supply chain fit together. Supply Chain Management (SCM) does not so much require the employment of a specific technology or solution as it demands an understanding of the business processes that must work together.
Information technology has long been a major factor, new innovation generated day by day with new possibilities provided. E-business, or the Internet computing model, such as the simulation tools which has been developed in Schenker 4 Rooms, have now emerged as perhaps the most enabling supply chain integration tools. Because opening, standards-based and virtually ubiquitous, businesses can gain global visibility across their extended network of trading partners and help them respond quickly to changing business conditions such as customer demand and resource availability.
The scoring model could be another advanced standard in helping companies locating the problems in their supply chain. According to the scoring decomposing, companies can find proper solutions for improving their business process.
Creating Information Visibility.
Most likely, SCM solution will typically include, for example, material sourcing, forecasting, warehousing, inventory planning, transportation, purchasing, and financials. Supply chain integration must be accomplished not only within one enterprise but also within those of its customers and suppliers (and often their customers' and suppliers' systems as well). Processes within all of these organizations must be evaluated and updated or even overhauled to meet efficiency and logistical expectations.
Information visibility will help companies to include more dynamic, collaborative communication networks in their offerings, giving birth to
Chapter 6 Conclusion & Recommendations ______________________________________________________
102
collaborative commerce and helping to improve communication beyond the transactional supply chain.
Sharing Benefits
Sharing benefits is an important success factor for many companies. Although there are a lot of challenges to the implementation, the gains to be realized with the supply chain outweigh the concerns and hence more and more organizations are moving towards automating their supply chain. The benefits should be equally shared within supply chain members, it is not good to sacrifice others benefit for gaining more, and this kind of relationship will not last long.
While supply chain integration is well understood and sought after, we find that the actual level of integration across the supply chain is still lower than expected. In this thesis work we try to propose a model, which will improve overall efficiency and reduce the cost through centralization for inbound supply integration, while it still needs both OEMs and 3PL industries to work hard to improve confidence in their ability to cooperate.
103
Reference
Publications: “Advance Manufacturing Research”, 1995, The Supply Chain Primer, Boston, MA.
Andersen, D.L, Britt, F.E, Favre, D.J., 1997, "The seven principles of supply chain management".
Bowersox, D., Closs, D., 1996 Logistical Management--- the integrated supply chain process, the McGraw-Hill Companies, USA
Charu Chandra; Sameer Kumar.,2000. “Supply chain management in theory and practice: a passing fad or a fundamental change?” Industrial Management &Data Systems 100/3, 2000,pp.100-113
China Logistics, Morgan Stanley Consulting Co. Ltd.
Christopher, M.,1998, “Logistic and supply chain management”, Financial Time Prentice Hall, 2nd ed, Great Britain
Churchill G.A.,1995, Marketing Research Methodological foundations, Orlando, The Dryden Press.
Cohen, O.,1988, "The drum-buffer-rope (DBR) approach to logistics", Rolstadas, A., Computer Aided Production Management, Springer-Verlag, New York, NY.
Cohen, S.,1996, "Supply chain council introduces the supply-chain operations reference model", PRTM Insight, 8, 3.
Coly. Bardi, The Management of Business Logistics, Langley 6th edition, Chapter3.pp.69
Coly. Bardi. Langle.,1997 “The Management of Business Logistics”, 6th edition, Chapter3.pp.69
Cooper, M.C., Ellram, L.M.,1993,"Characteristics of supply chain management and the implications for purchasing and logistics strategy", The International Journal of Logistics Management, 4, 2, 13-24.
Copacino, W.C 1996, “Supply Chain Management: The basic and beyond”, the St. Lucien press.
104
Costanza, J.R, 1998, "The flow revolution", Manufacturing Systems, 10.
Davis, T.,1993, "Effective supply chain management", Sloan Management Review, 35-46.
Fisher, M.L., Hammond, J.H, Obermeyer, W.R, Raman, A.,1994, "Making supply meet demand in an uncertain world", Harvard Business Review.
Francett, B, 1996, "The synchronized supply chain: from connectivity to commerce", Software Magazine, 113-16.
Fraser, J, 1997, "Synchronization: more than a buzzword", APICS - The Performance Advantage, 76.
Fraser, J, 1998, "Demand management works even if the forecast is wrong", Midrange ERP, 58-60.
Gaffron, M., 2001 “Redefining.logistics.com- A true paradigm shift” Schenker AG, Presentation on Oct. 09, 2001
Gophal, C., Tyndall, G., Partsch, W., & Kamauff, J. 1998 Supercharging Supply Chians: New ways to increase value through Global Operational excellence, New York, Johon Wiley & Sons, Inc.
Harlend, D., Scharlacken, J.W, 1997, "Global supply chain planning: synchronizing operations and logistics with the pulse of the international marketplace", 1997 Conference Proceedings, American Production and Control Society.
Harrington, L. 1995 "The Best Offense is a Good Defense," Inbound Logistics, January1995
Henrik Anden, Klas Eliasson, 2001, “Vendor Managed Inventory”, Siminar Project of Logistics Concepts, Mop, Chalmers University, Autumn 2001. Siminariearbete:2001:11 Hieber Ralf.,2002, Supply Chain Management, Zurich, vdf Hochschulverlag AG.
Hoffman, K. C, August 2000, “Just what is a 4PL Anyway?” Global logistic & supply chain strategies
Lambert, D.M., Stock, J.R. and Ellram, L.M., 1998, “Fundamentals of Logistics Management”, Boston, MA: Irwin/McGraw-Hill, Chapter 14
Lee, H, Padmanabhan, V, & Whang, S, 1997, “The Bullwhip Effect in Supply
105
Chains”, Sloan Management Review, spring 1997 pp. 93-102
Lumsden, Kenth R., 1998“Fundamental of logistics,” Sweden, Translate version.
Magretta, J., 1998, "Fast, global, and entrepreneurial: supply chain management, Hong Kong style: an interview with Victor Fung", Harvard Business Review, pp.103-14.
Mayer, J.H, 1996, "Supply chain tools cut inventory fat", Software Magazine, pp.77-80.
MIT Tang Centre, 2001.“Logistics & supply chain management: fundamental and thought leadership”, June 25-29 2001
National Research Council, Surviving Supply Chain Integration – Strategies for Small Manufacturers, National Academy of Science 2000. pp.22
Poirier, C.C, Reiter, S.E, 1996, “Supply Chain Optimization”, Berrett-Koehler Publishers, San Francisco, CA.
Remeny, D., Williams, B., Money, A. & Swarts, E. 1999, “Doing Research in Business And Management, an Introduction to Process and Method”. London, SAGE Publications
Robinson, T, 1998, "Weaving a supply chain Web", Managing Automation, pp.22-8.
Ross, D, 1996, "Meeting the challenge of supply chain management", APICS - The Performance Advantage, pp.38-49.
Rusthon, A., & Oxley, J., & Croucher, P., 2000.”The handbook of logistics and distribution management”, second edition, Kogan Page, 2000
SCOR Version 5.0 Handbook, Supply Chain Council, Inc. 2001
Sevening, C., “Methodboken”, Lorentz Förlag, Staffanstorp 1996
Svensson, G., 2002 “A conceptual framework of vulnerability in firms’ inbound and outbound logistics flows” International Journal of Physical Distribution & Logistics Management, Vol.32 No.2, 2002,pp.110-134
Swaminathan, J.M, Smith, S.F, Sadeh, N.M, 1996, "A multi-agent framework for modeling supply chain dynamics", Proceedings of the Artificial Intelligence and Manufacturing Research Planning Workshop, Albuquerque, NM, 210-18.
106
Tzafestas. S, Papsiotis, G, 1994, "Coordinated control of manufacturing/supply chains using multi-level techniques", Computer Integrated Manufacturing Systems, 7, 3, 206-12.
Willis, A.K, 1995, "Customer delight and demand management: can they be integrated?” 1995 Conference Proceedings, American Production and Inventory Control Society.
Yin R. K,,1994, “Case Study Research-Design and Method”, Beverly Hills, California, Sage, cop.
107
Web Links:
www.anu.edu.au/people/Roger.Clarke/EC/EDIIntro.html
Date: 07-08-2002
www.currentdirections.com/success/mfg-corrigated-materials--vendor-managed-inventory.html
Date: 16-08-2002
www.edifice-ins.com/vmi.htm
Date: 01-10-2002
www.vendormanagedinventory.com
Date: 24-08-2002
www.nova.btl.com/servlet/se.ementor.econgero.servlet.presentation.Main?data.node.id=36&data.language.id=2&data.document.id=4364
Date: 19-10-2002
www.reshare.com/understandingcc.htm
Date: 24-08-2002
www.ARCweb.com/ inboundlogistics
Date : 07-19-2002
108
Interviews:
Ms. Annika Bratt, Contracting Manager, Volvo Logistics AB. Interview date: 2002-11-07
Mr. Bertil Karlsson, General Manager, Schenker International AB. Interview date: 2002-09-03
Mr. David Stenberg, Supply Chain Co-ordinator, Volvo Car Corporation Torslanda. Interview date: 2002-11-11
Mr. Gunnar Stefansson, Associate Professor, Chalmers University of Technology, Dept of Transportation and Logistics Management. Interview date: 2002-9-21
Mr. Jan Nordh, Managing Director, Schenker 4ROOMS Göteborg. Interview date: 2002-07-26
Mr. Jan-Olov Olausson, Senior Purchaser, Volvo Car Corporation. Interview date: 2002-11-07
Mr. Karl Björklund, Controller, Schenker Dedicated Services AB. Interview date: 2002-09-04
Mr. Martin Folin, Supply Chain Manager, Volvo Car Corporation Torslanda. Interview date: 2002-11-11
Mr. Mikael Warvne, Logistics Manager, Automotive, Alps Nordic AB. Interview date: 2002-10-11
Mr. Patrik Lind, Process Developer, Schenker AB at Hus-C Lindex. Interview date: 2002-08-30
Ms. Yurina Sedano, Project Leader, Schenker 4 Rooms. Göteborg. Interview date: 2002-07-21
109
Abbreviations
3PL: Third Party Logistics
EDI: Electronic Data Interchange
GPS: Global Positioning System
JIT: Just in time
OEM: Original equipment manufacturer
SCM: Supply chain management
SCOR Model: Supply Chain Operation Reference Model
SKU: Store Keeping Units
SS: Safety Stock
VMI: Vendor Managed Inventory
VRM: Vendor Relationship Management
WIP: Work In Process

111
Appendixes
Appendix I: Interview Proposals
Interview proposal to Volvo Car
Dear Sir/Madam:
We are students at Göteborg University pursuing thesis research work in Schenker 4ROOMS.
Our research is concerning the inbound logistics in supply chain management, which is from suppliers to OEM. We are trying to Figure out a solution that Schenker, as a logistic middleman, be actively involved in this inbound logistic relationship so that inbound logistic performance can be optimised and all these three parties in supply chain can be better off. Though Schenker are not working directly for Volvo car, several of our clients are Volvo cars' suppliers. We thought it would be very interesting to have the supply chain of Supplier-Schenker-Volvo as our case study.
In the case study, we are going to mapping the inbound process of Volvo’s supplier-Schenker-Volvo. Now we are mapping the purchasing process between Volvo and its suppliers, with both information flow and physical flow. Process of placing orders and scheduling deliveries as well as how Volvo evaluates its suppliers are the fields that we are most interested. (Better with some Figures for your suppliers’ performance measurement.)
We hope you are the right person to contact about this matter. If so, could you kindly accept our interview when you feels convenient.
We are looking forward to hearing from you!
Best Regards!
Su Yirong & Lu Hai
112
From: Su Yirong [[email protected]] Sent: 08 October 2002 15:37 Subject: Thesis Students from Schenker
Interview scope to Mr. Mikeal Warven, Alps Nordic AB:
Our research is concerning the inbound logistics in supply chain management, which is from supplier to manufacturer. We are trying to Figure out a solution that Schenker, as a logistic provider, be involved in this inbound logistic relationship so that inbound logistic performance can be optimized and all these three parties in supply chain can be better off. We thought it would be very interesting to have the supply chain of Alps-Schenker-Volvo as our case study.
In the interview, we would like to get some information about:
1) The purchasing process between Volvo and Apls, something like how to make orders and schedule delivery, etc.
2) The operational and communication process between Alps and Schenker international on arranging delivery.
3) The time spends on making response on communications.
4) Inventory controls, the capital tied-up on inventory and inventory turn over
5) As Volvo is a build-to-order manufacturer, what are Volvo’s requirements for its suppliers on delivery?
113
From: Hai Lu [mailto:[email protected]] Sent: 18 September 2002 16:23 Subject: thesis students in Schenker 4rooms Interview scope to Bertil Karlsson, Schenker International AB:
1. First we need a very detailed process of whole operation flow: form the very beginning (such as order receiving) to the very end. It would be better if we could also get the process starts form your suppliers, for example, what kind of process they had and which kind of information they are processing before and after you, etc.
2. Could you recommend some of your key persons from both your inflow supplier to the downstream Volvo or Saab, whose in charge of the operation related to your daily business? So that we could contact them and get some further information in getting to know the whole flow.
3. Does your company categorize operation according to different product characteristics? (Such as stocked product, or build to order product.) Or you develop your process according to other scenarios? Do you apply different operation process according to them, and what is it?
4. Concerning the information exchange, can you kindly show which kinds of information you worked with in your EDI system, for instance, production planning, material requirement, etc? In your presentation you mentioned about it is AVIEXP/ INVOICE and Oddette, but what it this system precisely covered?
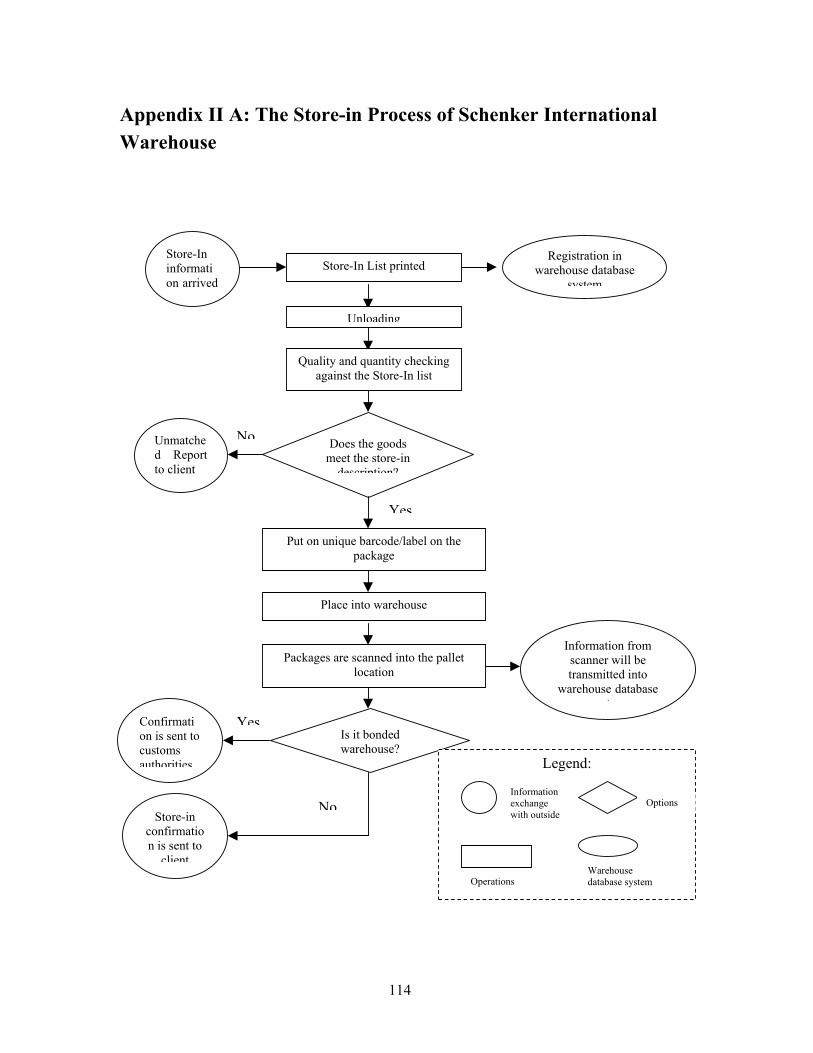
114
Appendix II A: The Store-in Process of Schenker International Warehouse
Store-In information arrived
Store-In List printed Registration in
warehouse database system
Unloading
Quality and quantity checking against the Store-In list
Does the goods meet the store-in
description?
Yes
NoUnmatched Reportto client
Put on unique barcode/label on the package
Place into warehouse
Information from scanner will be transmitted into
warehouse database t
Packages are scanned into the pallet location
Is it bonded warehouse?
YesConfirmation is sent to customs authorities
NoStore-in
confirmation is sent to
client
Legend:
Information exchange with outside
Warehouse database system
Options
Operations
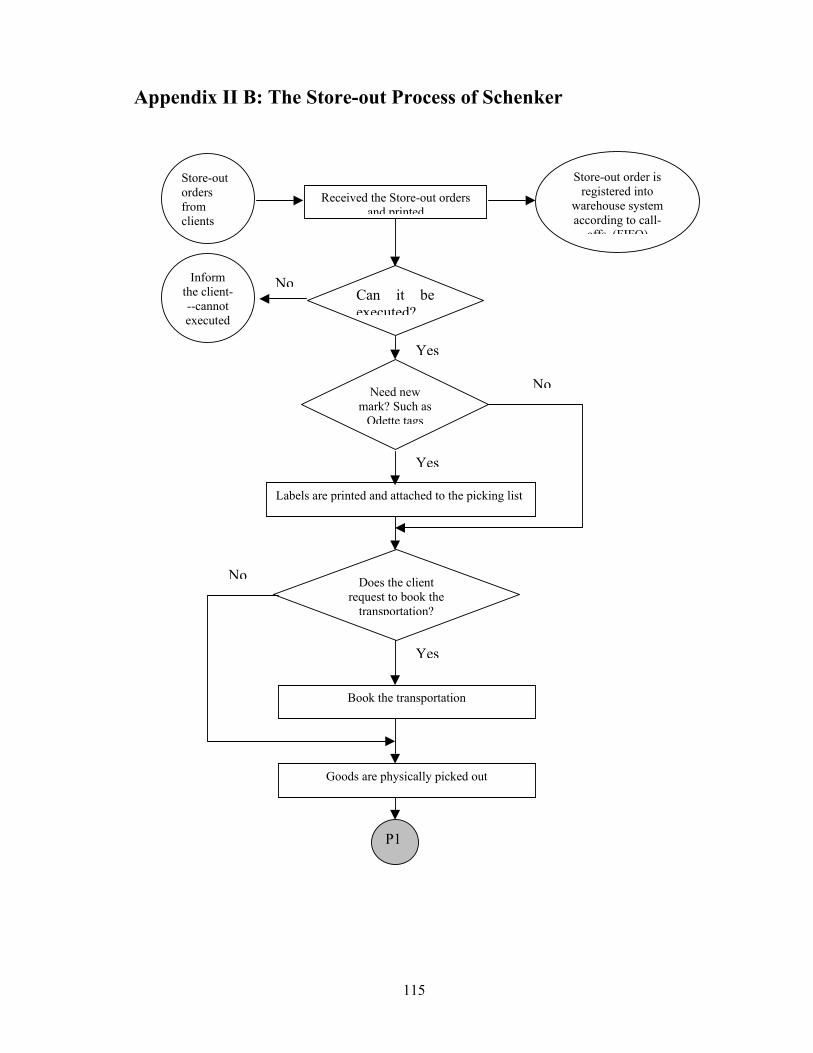
115
Appendix II B: The Store-out Process of Schenker
Can it beexecuted?
Inform the client---cannot executed
No
Yes
Need new mark? Such as
Odette tags
Labels are printed and attached to the picking list
Does the client request to book the
transportation?
Yes
Book the transportation
Goods are physically picked out
P1
Store-out orders from clients
Received the Store-out orders and printed
Store-out order is registered into
warehouse system according to call-
offs (FIFO)
Yes
No
No
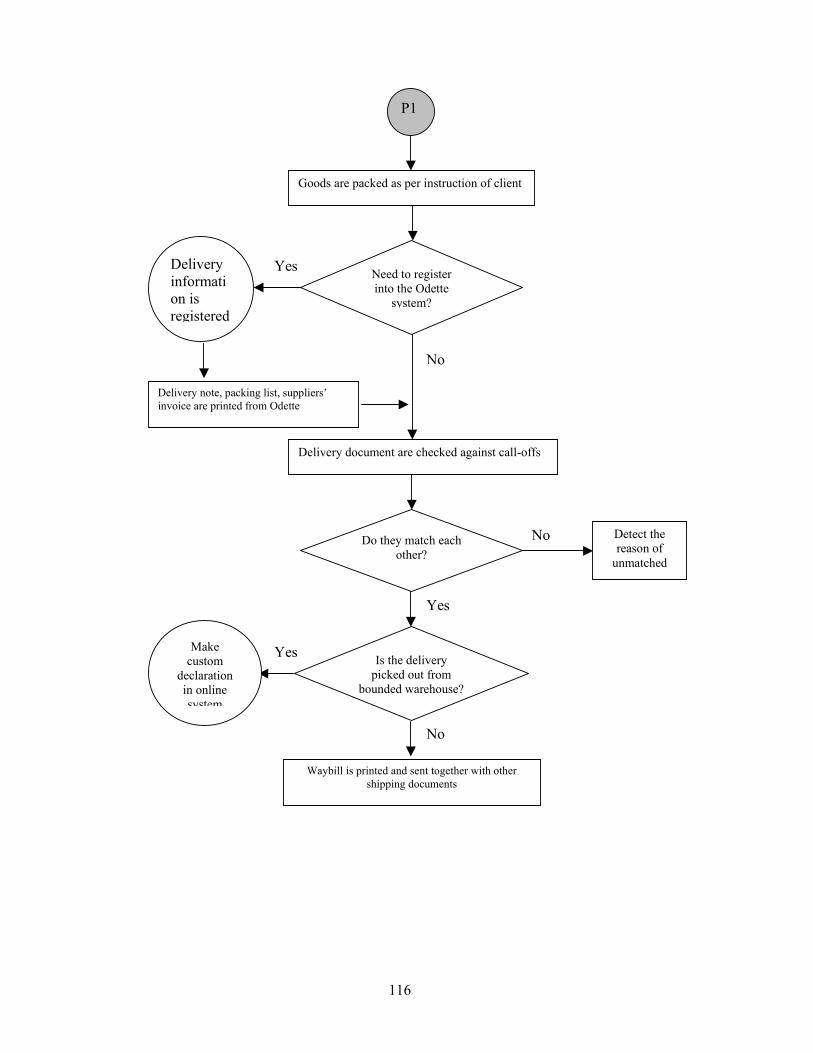
116
Goods are packed as per instruction of client
P1
Need to register into the Odette
system?
Delivery information is registered
Delivery note, packing list, suppliers’ invoice are printed from Odette
Delivery document are checked against call-offs
Yes
No
Do they match each other?
Detect the reason of
unmatched
No
Is the delivery picked out from
bounded warehouse?
Make custom
declaration in online system
Yes
No
Waybill is printed and sent together with other shipping documents
Yes
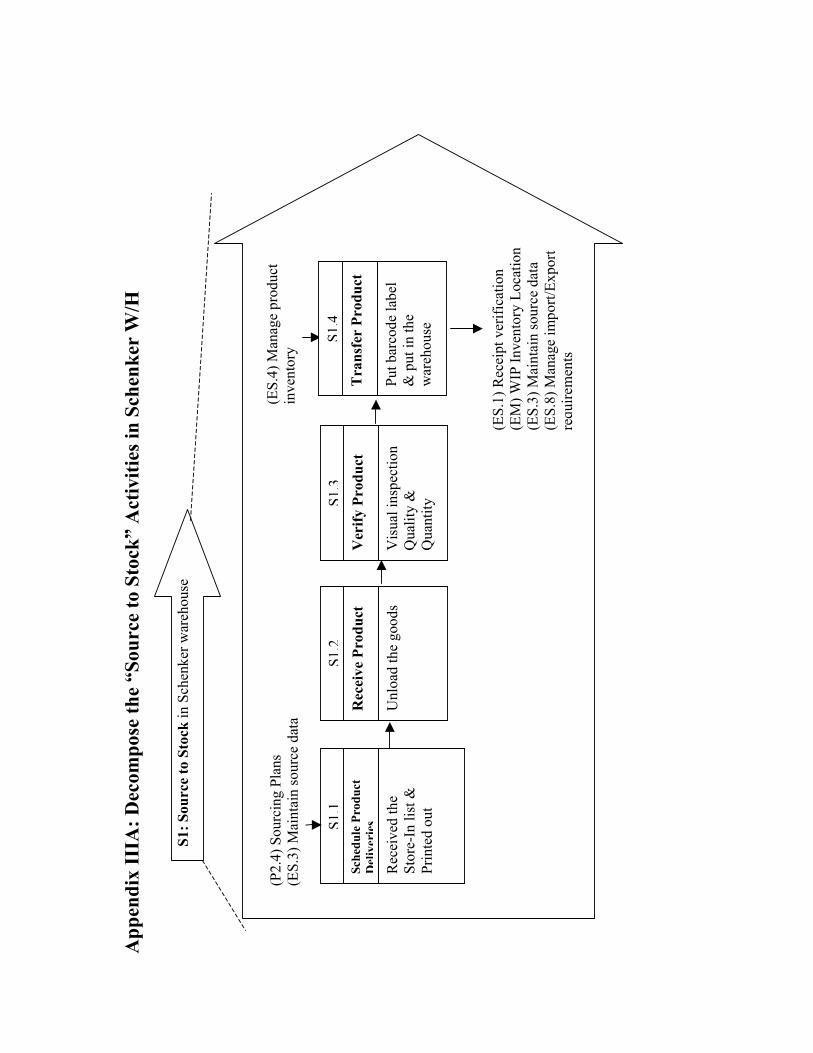
App
endi
x II
IA: D
ecom
pose
the
“Sou
rce
to S
tock
” A
ctiv
ities
in S
chen
ker
W/H
S1:
Sou
rce
to S
tock
in S
chen
ker w
areh
ouse
S1.1
Rec
eive
d th
e St
ore-
In li
st &
Pr
inte
d ou
t
Sche
dule
Pro
duct
D
eliv
erie
s
(P2.
4) S
ourc
ing
Plan
s (E
S.3)
Mai
ntai
n so
urce
dat
a
S1.2
Unl
oad
the
good
s
Rec
eive
Pro
duct
S1
.3
Vis
ual i
nspe
ctio
n Q
ualit
y &
Q
uant
ity
Ver
ify P
rodu
ct
S1.4
Put b
arco
de la
bel
& p
ut in
the
war
ehou
se
Tra
nsfe
r Pr
oduc
t
(ES.
4) M
anag
e pr
oduc
t in
vent
ory
(ES.
1) R
ecei
pt v
erifi
catio
n
(EM
) WIP
Inve
ntor
y Lo
catio
n (E
S.3)
Mai
ntai
n so
urce
dat
a (E
S.8)
Man
age
impo
rt/Ex
port
requ
irem
ents
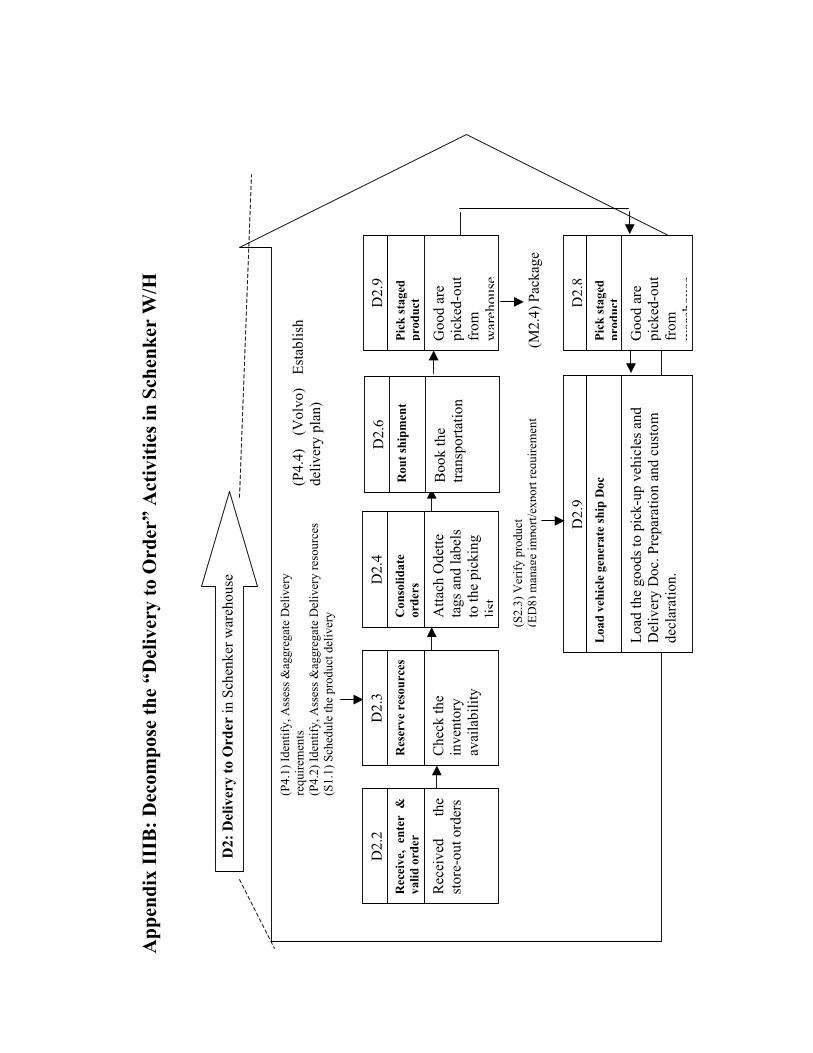
App
endi
x II
IB: D
ecom
pose
the
“Del
iver
y to
Ord
er”
Act
iviti
es in
Sch
enke
r W
/H
(P
4.1)
Iden
tify,
Ass
ess &
aggr
egat
e D
eliv
ery
requ
irem
ents
(P
4.2)
Iden
tify,
Ass
ess &
aggr
egat
e D
eliv
ery
reso
urce
s (S
1.1)
Sch
edul
e th
e pr
oduc
t del
iver
y
D2.
2
Rec
eive
d th
e st
ore-
out o
rder
s
Rec
eive
, en
ter
&
valid
ord
er
D2.
3
Che
ck th
e in
vent
ory
avai
labi
lity
Res
erve
res
ourc
es
D2.
4
Atta
ch O
dette
ta
gs a
nd la
bels
to
the
pick
ing
list
Con
solid
ate
orde
rs
D2.
6
Boo
k th
e tra
nspo
rtatio
n
Rou
t shi
pmen
t
(P4.
4)
(Vol
vo)
Esta
blis
hde
liver
y pl
an)
D2.
9
Goo
d ar
e pi
cked
-out
fr
om
war
ehou
se
Pick
stag
ed
prod
uct D2.
8
Goo
d ar
e pi
cked
-out
fr
om
war
ehou
se
Pick
stag
ed
prod
uct
(M2.
4) P
acka
ge
D2.
9
Load
the
good
s to
pick
-up
vehi
cles
and
D
eliv
ery
Doc
. Pre
para
tion
and
cust
om
decl
arat
ion.
Loa
d ve
hicl
e ge
nera
te sh
ip D
oc
(S2.
3) V
erify
pro
duct
(E
D8)
man
age
impo
rt/ex
port
requ
irem
ent
D2:
Del
iver
y to
Ord
er in
Sch
enke
r war
ehou
se