Triple spark ignition engine comparison with single and twin spark ignition engines.
Upload
afiq-hashimCategory
view
224download
0
8/3/2019 An Analytical Model of Spark Ignition Engine for Performance Prediction
http://slidepdf.com/reader/full/an-analytical-model-of-spark-ignition-engine-for-performance-prediction 1/74
AN ANALYTICAL MODEL OF SPARK IGNITION ENGINE
FOR PERFORMANCE PREDICTION
MR.SITTHICHOK SITTHIRACHA
A THESIS SUBMITTED IN PARTIAL FULFILLMENT OF THE REQUIREMENTS
FOR THE MASTER OF SCIENCE IN AUTOMOTIVE ENGINEERING
SIRINDHORN INTERNATIONAL THAI-GERMAN GRADUATE SCHOOL OF ENGINEERING
(TGGS)
GRADUATE COLLEGE
KING MONGKUT’S INSTITUTE OF TECHNOLOGY NORTH BANGKOK
ACADEMIC YEAR 2006COPYRIGHT OF KING MONGKUT’S INSTITUTE OF TECHNOLOGY NORTH BANGKOK

8/3/2019 An Analytical Model of Spark Ignition Engine for Performance Prediction
http://slidepdf.com/reader/full/an-analytical-model-of-spark-ignition-engine-for-performance-prediction 2/74
Name : Mr. Sitthichok Sitthiracha
Thesis Title : An Analytical Model of Spark Ignition Engine for
Performance Prediction
Major Field : Automotive Engineering
King Mongkut’s Institute of Technology North Bangkok
Thesis Advisors : Assistant Professor Dr.Suthum Patumsawad
Assistant Professor Dr.Saiprasit Koetniyom
Academic Year : 2006
Abstract
The objective of this thesis is to develop a mathematical model of spark ignition
engine based on cylinder-by-cylinder engine model which combines both physical
formulae, e.g. engine geometries, and empirical formulae, e.g. burning duration. The
engine performance, torque and power, can be calculated by integrating the pressure
inside cylinder within one engine cycle. The model is verified by data from 8 engine
models. It can capture torque and power characteristics very well. The overall errors
are in between -6% to 4%.
The model is used for simulating in order to predict the burning duration of the
alternative fuels. Furthermore, the model indicates the effects on η v when using these
alternative fuels too.
(Total 60 pages)
Keywords : Spark ignition engine, Gasoline engine, Engine modeling, Cylinder-by-
cylinder engine model, Engine simulation
______________________________________________________________Advisor
ii

8/3/2019 An Analytical Model of Spark Ignition Engine for Performance Prediction
http://slidepdf.com/reader/full/an-analytical-model-of-spark-ignition-engine-for-performance-prediction 3/74
ชื อ : นายสิทธิโชค สิทธิราชา
ชื อวิทยานิพนธ์ : แบบจําลองวิเคราะห์สําหรับการทาํนายสมรรถนะของเครื องยนต์ จุดระเบิดด้วยประกายไฟ
สาขาวิชา : วิศวกรรมยานยนต์ สถาบนัเทคโนโลยีพระจอมเกลา้พระนครเหนือ
ที ปรึกษาวิทยานิพนธ์ : ผูช้วยศาสตราจารย์ ดร ่ .สุธรรม ปทุมสวสัดิ ผูช้วยศาสตราจารย์ ดร ่ .สายประสทิธิ เกดนิยม ิ
ปีการศึกษา : 2549
บทคัดย่อ วัตถุประสงค์ของวิทยานิพนธ์นีคื อ เพื อพฒันาแบบจําลองทางคณิตศาสตร์ของเครื องยนต์จุด
ระเบิดด้วยประกายไฟบนพืนฐานของ แบบจําลองเครื องยนต์แบบสูบตอสูบ ซึ งรวมเอาทัง ่ ทฤษฎีทางกายภาพ เป็นตน้วา เรขาคณิตของเครื องยนต์ และทฤษฎีที ไดจ้ากการสังเกต เป็นตน้วา ่ ่ระยะเวลาการเผาไหม ้สมรรถนะของเครื องยนต์อันไดแ้ก แรงบิดและกาลัง สามารถคํานวณไดโ้ดย ่ ํการอินทีเกรตความดันในกระบอกสูบภายใตห้นึ งรอบการหมนุของเครื องยนต์ แบบจําลองได้ทดสอบเปรียบเทียบคากบเครื องยนต์ ่ ั 8 รุน พบวา สามารถทาํนายลกัษณะกราฟสมรรถนะของ ่ ่เครื องยนต์ไดเ้ป็นอยางด ีโดยมีคาผดิพลาดโดยรวมอยรูะหวาง ่ ่ ่ ่ -6% ถึง 4%
แบบจําลองนี ได้จําลองสถานการณ์เพื อท ีจะทาํนายระยะเวลาในการเผาไหม้ของเชือเพลิง ทางเลือกตางๆ ่ ยิงกวานัน แบบจําลองยังสามารถท ีจะอธิบายผลกระทบของการใช้เชือเพลิง ่ ทางเลือกที มีตอประสิทธิภาพเชิงปริมาตรไดอ้ีกดว้ย ่
(วิทยานิพนธ์มีจํานวนทงัสิน 60 หน้า)
คาํสาํคัญ : เครื องยนต์จุดระเบิดดว้ยประกายไฟ, เครื องยนต์เบนซิน, แบบจําลองเครื องยนต์,แบบจําลองเครื องยนต์แบบสูบตอสูบ ่ , การจําลองเครื องยนต์
________________________________________________ อาจารยท์ี ปรึกษาวิทยานิพนธ์
iii

8/3/2019 An Analytical Model of Spark Ignition Engine for Performance Prediction
http://slidepdf.com/reader/full/an-analytical-model-of-spark-ignition-engine-for-performance-prediction 4/74
ACKNOWLEDGEMENTS
I would like to express my sincere gratitude to Professor Dr.Gyeung-Ho Choi
of Power Train Laboratory, Keimyung University, Republic of Korea and Assistant
Professor Dr.Noppavan Chananpanich of King Mongkut’s Institute of Technology
North Bangkok who are initiators of this story. My colleague and I had a chance to
have internship in the Power Train Laboratory under their allowance. This laboratory
brought me to the engine technology field. Until Associate Professor Dr.Suwat
Kuntanapreeda and Dr.Boonchai Watjatrakul went to visit us in South Korea. They
advised me to undertake this topic for my thesis. This thesis has been developed since
that point. After I came back to Thailand, this thesis is strengthened by many precious
comments and suggestions from Assistant Professor Dr.Suthum Patumsawad and
Assistant Professor Dr.Saiprasit Koetniyom. Thanks to all persons who are
mentioned here. And also the staffs of the Power Train Laboratory who took care of
us along 4 months of our visit in South Korea.
Sitthichok Sitthiracha
iv

8/3/2019 An Analytical Model of Spark Ignition Engine for Performance Prediction
http://slidepdf.com/reader/full/an-analytical-model-of-spark-ignition-engine-for-performance-prediction 5/74
TABLE OF CONTENTS
Page
Abstract (in English) ii
Abstract (in Thai) iii
Acknowledgement iv
List of Tables viii
List of Figures ix
List of Abbreviations and Symbols xii
Chapter 1 Introduction 1
1.1 Background 11.2 Objectives 1
1.3 Approach 1
1.4 Scope 1
1.5 Assumptions 2
1.6 Impacts or Benefits from Research 2
1.7 Thesis Outline 2
Chapter 2 Literature Review 32.1 Spark Ignition Engine 3
2.2 Modeling 5
2.2.1 Mean Value vs. Cylinder-by-cylinder Models 5
2.2.2 Limit of Physical Properties 5
Chapter 3 The Model 6
3.1 Model Overview 6
3.2 Crank Slider Model 8
3.3 Cylinder Pressure Model 8
3.4 Wiebe Function 9
3.4.1 Burning Duration 9
3.5 Heat Input 10
3.6 Air/Fuel Ratio 10
3.7 Heat Transfer 11
3.7.1 Heat Transfer Coefficient Correlations 11
v

8/3/2019 An Analytical Model of Spark Ignition Engine for Performance Prediction
http://slidepdf.com/reader/full/an-analytical-model-of-spark-ignition-engine-for-performance-prediction 6/74
TABLE OF CONTENTS (CONTINUED)
Page
3.8 Volumetric Efficiency 12
3.8.1 Flow through Valves 15
3.8.2 Valve Lift 16
3.8.3 Discharge Coefficient 17
3.8.4 Frictional Losses 17
3.8.5 Charge Heating 19
3.9 Residual Gas 19
3.10 Friction 21
3.11 Torque & Power 21
3.12 Minimum Spark Advance for Best Torque 21
3.13 Simulation conditions 22
3.14 Alternative Fuels 22
3.14.1 Ethanol-blended Gasoline or Gasohol 23
3.14.2 Ethanol 24
3.14.3 Compressed Natural Gas 24
3.14.4 Liquefied Petroleum Gas 25
Chapter 4 Model Validation and Sensitivity Analysis 26
4.1 Performance Validation 26
4.2 Sensitivity Analysis 31
4.2.1 Burning Duration 31
4.2.2 Discharge Coefficient 32
4.2.3 Frictional Losses 334.2.4 Charge Heating 34
4.2.5 Exhaust Gas Temperature 34
4.3 Combustion Duration of Alternative Fuels 35
4.3.1 Ethanol-blended Gasoline or Gasohol 35
4.3.2 Ethanol 37
4.3.3 Compressed Natural Gas 38
4.3.4 Liquefied Petroleum Gas 39
vi

8/3/2019 An Analytical Model of Spark Ignition Engine for Performance Prediction
http://slidepdf.com/reader/full/an-analytical-model-of-spark-ignition-engine-for-performance-prediction 7/74
TABLE OF CONTENTS (CONTINUED)
Page
Chapter 5 Conclusions and Suggestions 41
5.1 Conclusions 41
5.2 Suggestions 41
References 43
Appendix A Engine Specifications 45
Appendix B Matlab/Simulink Block Diagrams 50
Biography 60
vii
8/3/2019 An Analytical Model of Spark Ignition Engine for Performance Prediction
http://slidepdf.com/reader/full/an-analytical-model-of-spark-ignition-engine-for-performance-prediction 8/74
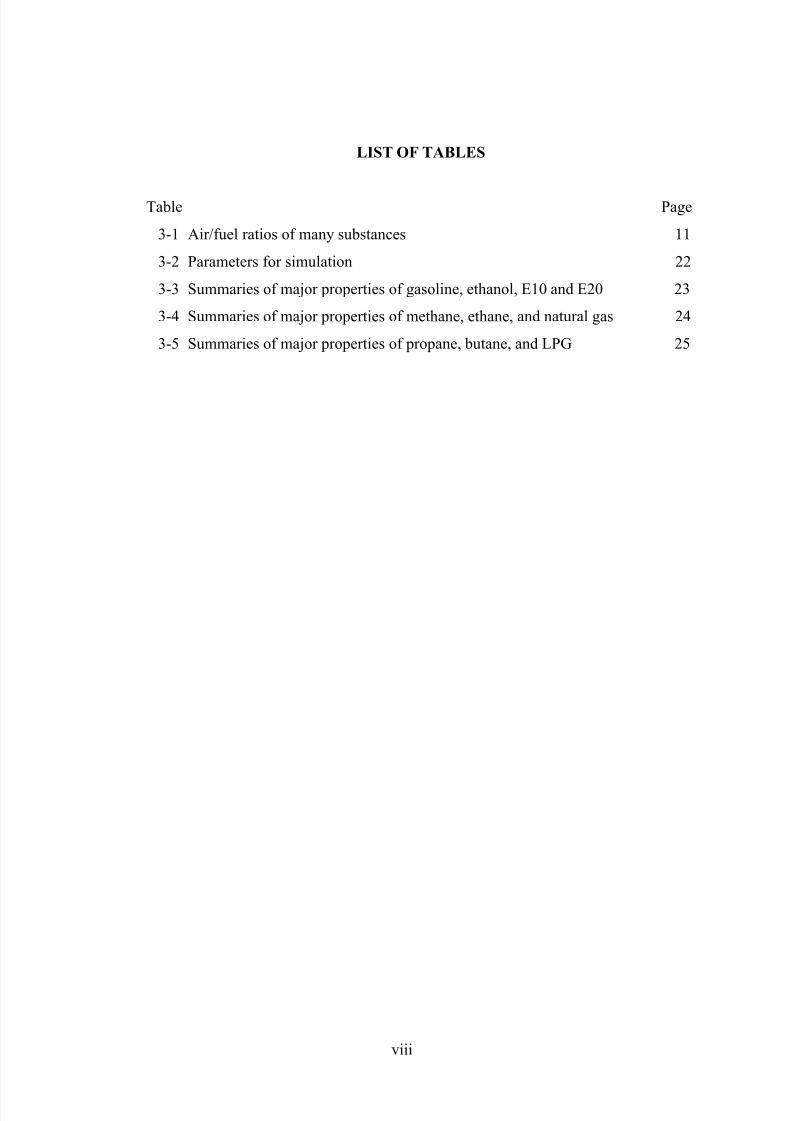
LIST OF TABLES
Table Page
3-1 Air/fuel ratios of many substances 11
3-2 Parameters for simulation 22
3-3 Summaries of major properties of gasoline, ethanol, E10 and E20 23
3-4 Summaries of major properties of methane, ethane, and natural gas 24
3-5 Summaries of major properties of propane, butane, and LPG 25
viii

8/3/2019 An Analytical Model of Spark Ignition Engine for Performance Prediction
http://slidepdf.com/reader/full/an-analytical-model-of-spark-ignition-engine-for-performance-prediction 9/74
LIST OF FIGURES
Figure Page
2-1 Schematic of gasoline engine 6
2-2 Basic four stroke cycle 3
2-3 Pressure-volume diagram of Otto cycle 3
3-1 Model overview 6
3-2 Model overview (continued) 7
3-3 Piston cylinder and geometries 8
3-4 Burned mass fraction characteristic 9
3-5 Effect of engine speed on flame-development angle 10
3-6 Comparison of surface-averaged heat flux variations predicted by CFD
calculations and empirical correlations 12
3-7 Volumetric efficiency versus mean piston speed for a four-cylinder
indirect-injection diesel and a six-cylinder spark-ignition engine 13
3-8 Effect on volumetric efficiency of different phenomena which affect
the air flow rate as a function of speed. Solid line is final volumetric
efficiency versus speed curve 14
3-9 Discharge coefficient of typical inlet poppet valve 17
3-10 Pressure losses in the intake system of a four-stroke cycle spark-ignition
engine determined under steady flow conditions 18
3-11 Assumption of remaining pressure after subtracted by pressure losses 18
3-12 Assumption of temperature inside manifold 19
3-13 Measured cylinder pressure pc, calculated cylinder-gas temperature T c,
exhaust mass flow rate em& , and measured gas temperature at exhaust port
exit T p, for single-cylinder spark ignition engine at speed = 1000 rpm 20
3-14 Assumption of exhaust gas temperature 20
3-15 Cylinder pressure versus crank angle for over-advanced spark timing (50°),
MBT timing (30°), and retarded timing (10°) and Effect of spark advance
on brake torque at constant speed and air/fuel ratio, at wide open throttle 22
4-1 Simulation results of Mercedes-Benz 250SE 26
ix

8/3/2019 An Analytical Model of Spark Ignition Engine for Performance Prediction
http://slidepdf.com/reader/full/an-analytical-model-of-spark-ignition-engine-for-performance-prediction 10/74
LIST OF FIGURES (CONTINUED)
Figure Page
4-2 Simulation results of Mercedes-Benz 250E/8 27
4-3 Simulation results of Mercedes-Benz 250SL 27
4-4 Simulation results of Mercedes-Benz 280SE/8 28
4-5 Simulation results of Mercedes-Benz 280SL/8 28
4-6 Simulation results of Mercedes-Benz 300SEL/8 29
4-7 Simulation results of Mercedes-Benz 300SEL 29
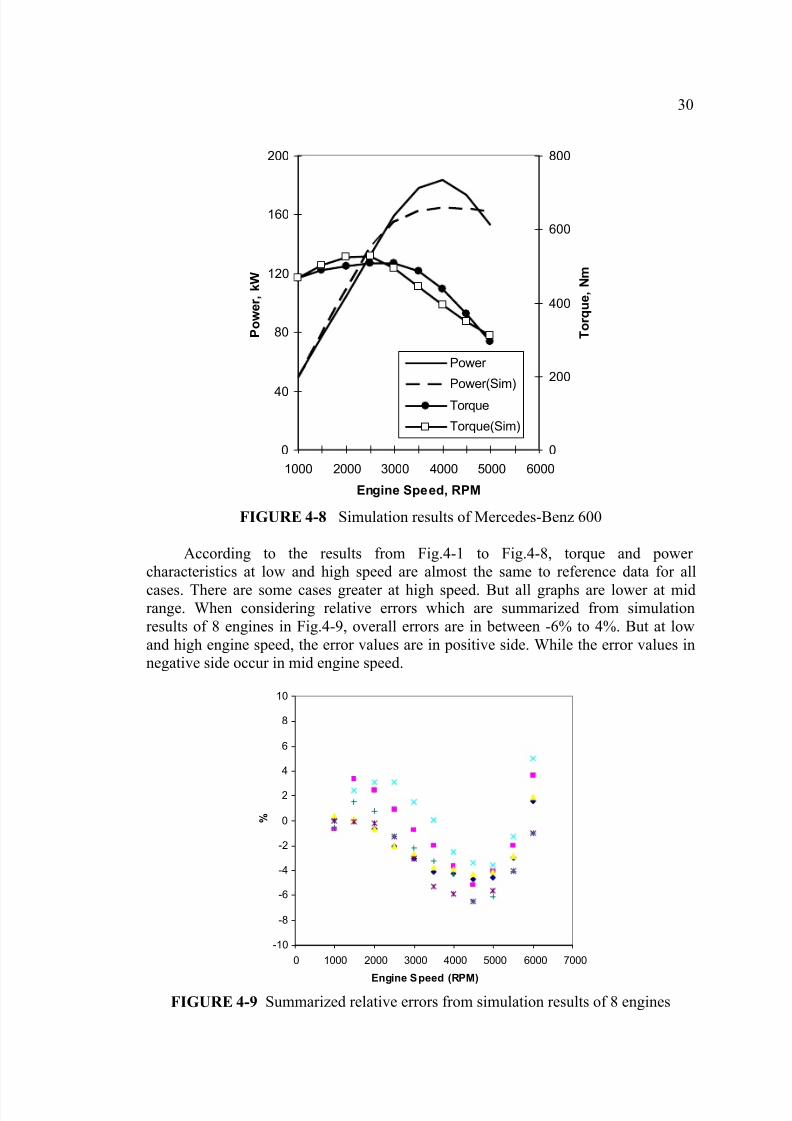
4-8 Simulation results of Mercedes-Benz 600 30
4-9 Summarized relative errors from simulation results of 8 engines 30
4-10 Comparison between gasoline and +/-10 modified combustion range
without spark advanced adjusting 31
4-11 Relative errors of before and after adjusting the spark timing 32
4-12 Comparison between normal C D and +/-10% changing 32
4-13 Comparison between using and non-using C f 33
4-14 Comparison between using and non-using C heat 34
4-15 Comparison between normal and +/-50 K exhaust gas temperature 35
4-16 Effect of ethanol-blended fuel on volumetric efficiency 35
4-17 Combustion duration of gasoline, E10, and E20 29
4-18 Comparison between gasoline, E10, and E20 when using with unmodified
engine 36
4-19 Effect of ethanol as a fuel on volumetric efficiency 37
4-20 Combustion duration of gasoline, E10, E20, and E100 374-21 Effect of ethanol as a fuel on volumetric efficiency 38
4-22 Combustion duration of gasoline and CNG 38
4-23 Effect of ethanol as a fuel on volumetric efficiency 39
4-24 Combustion duration of gasoline and LPG 39
A-1 Performance curve of Mercedes-Benz 250SE 46
A-2 Performance curve of Mercedes-Benz 250SL 46
A-3 Performance curve of Mercedes-Benz 250E/8 47
A-4 Performance curve of Mercedes-Benz 280SE/8 47
x

8/3/2019 An Analytical Model of Spark Ignition Engine for Performance Prediction
http://slidepdf.com/reader/full/an-analytical-model-of-spark-ignition-engine-for-performance-prediction 11/74
LIST OF FIGURES (CONTINUED)
Figure Page
A-5 Performance curve of Mercedes-Benz 280SL/8 48
A-6 Performance curve of Mercedes-Benz 300SEL/8 48
A-7 Performance curve of Mercedes-Benz 300SEL 49
A-8 Performance curve of Mercedes-Benz 600 49
B-1 Main model 51
B-2 Cm block details 52
B-3 Engine geometry block details 52
B-4 Engine geometry/Vd block details 52
B-5 Engine geometry/A(CA) block details 52
B-6 Engine geometry/Crank geometry block details 53
B-7 Engine geometry/V(CA),Vc block details 53
B-8 Wiebe fn block details 53
B-9 Burn duration block details 53
B-10 P block details 54
B-11 P/Pratio block details 55
B-12 P/Lv fn block details 55
B-13 P/Cd block details 55
B-14 P/mdot block details 56
B-15 P/Cheat factor block details 56
B-16 P/Cf factor block details 56
B-17 Mw block details 57B-18 Residual mass block details 57
B-19 T block details 57
B-20 Heat tran block details 57
B-21 h block details 58
B-22 Work&Power block details 58
B-23 Work&Power/Work block details 58
B-24 Work&Power/FMEP block details 59
B-25 Work&Power/Effective power block details 59
xi

8/3/2019 An Analytical Model of Spark Ignition Engine for Performance Prediction
http://slidepdf.com/reader/full/an-analytical-model-of-spark-ignition-engine-for-performance-prediction 12/74
LIST OF ABBREVIATIONS AND SYMBOLS
Abbreviations
BDC Bottom Dead Center
CFD Computational Fluid Dynamic
CNG Compressed Natural Gas
CO Carbon Monoxide
DIN Deutschland Industrial Norm
ECU Engine Control Unit
EGR Exhaust Gas Recirculation
HC Hydrocarbon
HHV High Heating Value
HP Horsepower
LPG Liquefied Petroleum Gas
MBT Maximum Brake Torque
MWF Modified Wall Function
rpm Round per Minute
SAE Society of Automotive Engineers
SWF Standard Wall Function
TDC Top Dead Center
WOT Wide Open Throttle
Symbols
a Crank Radius A Exposed Combustion Chamber Surface Area
A R Reference Area
b Cylinder Bore
C D Discharge Coefficient
C f Frictional Loss Factor
C heat Charge Heating Factor
C m
Mean Piston Speed
xii

8/3/2019 An Analytical Model of Spark Ignition Engine for Performance Prediction
http://slidepdf.com/reader/full/an-analytical-model-of-spark-ignition-engine-for-performance-prediction 13/74
LIST OF ABBREVIATIONS AND SYMBOLS (CONTINUED)
Div Inlet Valve Diameter
Dv Valve Diameter
f Fraction of Heat Added
h Convection Heat Transfer Coefficient
HV Heating Value of Fuel
IVC Inlet Valve Close Angle After BDC
IVO Inlet Valve Open angle Before TDC
k Specific Heat Ratio
l Connecting Rod Length
Liv,max Maximum Inlet Valve Lift
Lv Valve Lift Function
mair,stoich Theoretical Amount of Air Requirement
m& Mass Flow Rate
ma Air Mass
N Engine Speed
p f Friction Mean Effective Pressure
pme Brake Mean Effective Pressure
pmi Indicated Mean Effective Pressure
pT Pressure at Restriction
p0 Upstream Stagnation Pressure
P Pressure Inside Cylinder
P e Effective Power Q Heat Addition
Qin Overall Heat Input
Qloss Heat Transfer
R Gas Constant
s Stroke
T g Temperature of Cylinder Gas
T exh
Exhaust Gas Temperature
T w Cylinder Wall Temperature
xiii
8/3/2019 An Analytical Model of Spark Ignition Engine for Performance Prediction
http://slidepdf.com/reader/full/an-analytical-model-of-spark-ignition-engine-for-performance-prediction 14/74
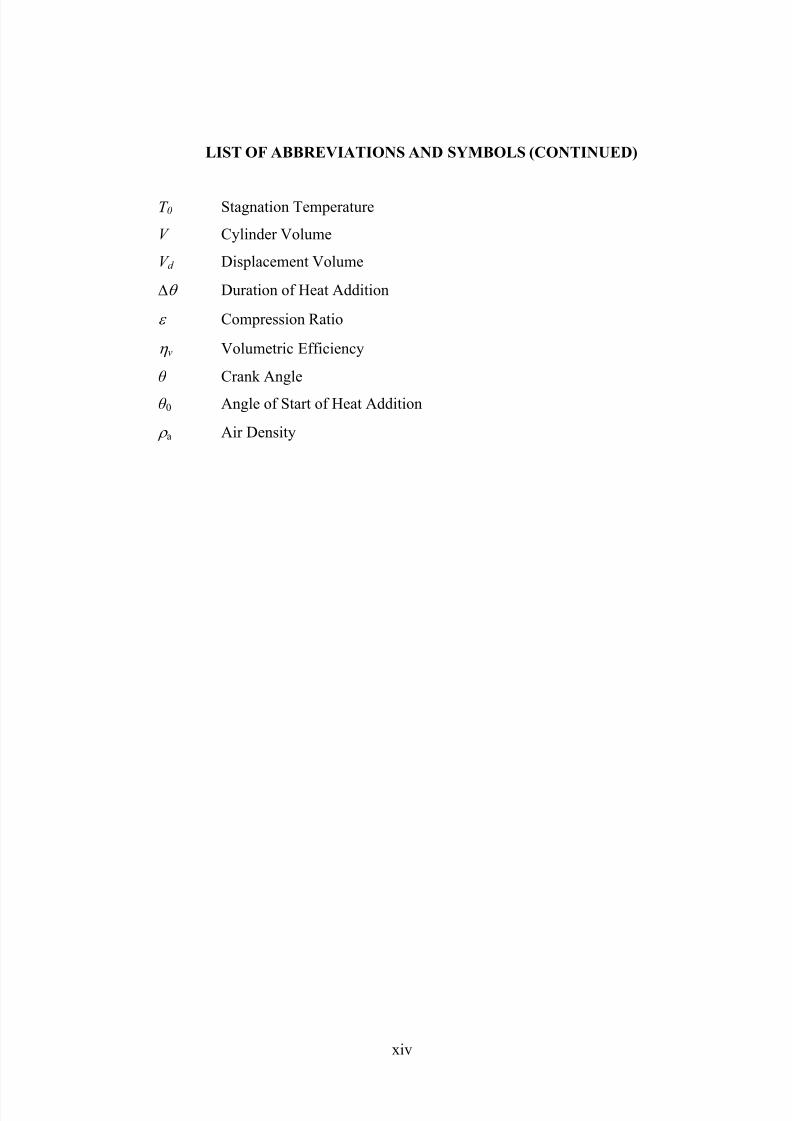
LIST OF ABBREVIATIONS AND SYMBOLS (CONTINUED)
T 0 Stagnation Temperature
V Cylinder Volume
V d Displacement Volume
Δθ Duration of Heat Addition
ε Compression Ratio
η v Volumetric Efficiency
θ Crank Angle
θ 0 Angle of Start of Heat Addition
ρ a Air Density
xiv

8/3/2019 An Analytical Model of Spark Ignition Engine for Performance Prediction
http://slidepdf.com/reader/full/an-analytical-model-of-spark-ignition-engine-for-performance-prediction 15/74
CHAPTER 1
INTRODUCTION
1.1 Background
Four-stroke spark ignition engine was developed by Otto in 1876. This engine
provided power output 3 HP. Since that point, the engine developing has been done
continuously over 100 years. Even now, some engines can provide power output more
than 1,000 HP.
However, developments of spark ignition engine along 100 years has been
conducting very slow due to lots of parameter, such as physical geometries (bore,stroke, crank radius, compression ratio), ignition advanced, valve timing, combustion
characteristic etc., influencing the performances. Many studies on effects of each
parameter were done by experiments. But this approach spent lots of expenses and
time such as building test engine, setting up laboratory, etc. Another approach is simulation method that allows engine designer to change
and test many different parameters without building real parts or even real engines.
The engine model can be used in various ways including designing engine control
system or ECU, designing transmission, etc. Although the computational model is
unable to obtain the exact characteristics because there are no perfect models and
there are many complex phenomena taking place in the engine, it simply estimates the
trend of those characteristics and effects with very low cost and less timeconsumption that is very helpful for speeding up the engine development process
before making real one.
1.2 Objectives
1.2.1 Develop a physically based, cylinder-by-cylinder spark ignition engine
model for predicting torque and power characteristics in order to study effects of
parameters such as engine geometries, fuel properties, valve timing layout, etc.
1.2.2 Predict the burning duration of alternative fuels such as Liquefied
Petroleum Gas (LPG), Compressed Natural Gas (CNG) and gasohol which are needed
information for simulation.
1.3 Approach
The engine model is developed under MatLab/Simulink which describes the
torque and power characteristics of the engine. The parameters, engine geometries
and valve timing layout, from existed gasoline engines are used. The model is
evaluated and compared with test data in order to determine the accuracy.
1.4 Scope
1.4.1 Use Matlab/Simulink for developing the engine model.
1.4.2 Gasoline is used for developing the model.
1.4.3 Outputs of the model are torque and power characteristics under full load
or wide open throttle (WOT) condition. For the alternative fuels, output is burning
durations.

8/3/2019 An Analytical Model of Spark Ignition Engine for Performance Prediction
http://slidepdf.com/reader/full/an-analytical-model-of-spark-ignition-engine-for-performance-prediction 16/74
1.5 Assumptions
1.5.1 The model will be derived from the spark ignition engine without turbo or
super charger and Exhaust Gas Recirculation (EGR) system.1.5.2 The engine uses multi-port injection system for adding fuels.
1.5.3 Fuel evaporates to be gas phase completely.
1.5.4 Fuel and air mix together perfectly.
1.5.5 Fuel-air mixture is assumed to be an ideal gas all the time.
1.5.6 There is no any effect of combustion chamber design.
1.5.7 Combustion chamber wall temperature is set at 400 Kelvin.
1.5.8 There is no effect of throttle body or there is no pressure drop at throttle
body due to WOT condition.
1.5.9 There are no effect of exhaust stroke and exhaust system.
1.6 Impacts or Benefits from Research The model which is developed under this thesis can be used for many purposes.
It can be used as an engineering tool in the development of the spark ignition engines.
The simulation can reduce the time consumption and costly tests needed in laboratory.
And also the model can be used for teaching a tool in the internal combustion engine
course.
1.7 Thesis Outline
The details of this thesis are shown as following
Chapter 1 Introduction
Chapter 2 This chapter explains of fundamental of spark ignition engine
and engine processes, review previous researches and theory of engine modeling
Chapter 3 Focusing on the performance prediction, this chapter describes
the model and theory of each component in details and
explanations of the alternative fuels
Chapter 4 Model validation by comparing to performance data from
vehicle manufacturer, analyze sensitivity when changing
parameters, and find out combustion duration of the alternative
fuels
Chapter 5 Conclusions and suggestions
2

8/3/2019 An Analytical Model of Spark Ignition Engine for Performance Prediction
http://slidepdf.com/reader/full/an-analytical-model-of-spark-ignition-engine-for-performance-prediction 17/74
CHAPTER 2
LITERATURE REVIEW
2.1 Spark Ignition Engine
The spark ignition engines are used in different applications, such as cars, boats
and small power generators. Depending on the field of application, the spark ignition
engine has certain structure and components which may differ from field to field. A
basic spark ignition engine used within the automotive industry has the following
structure and components as shown in Fig.2-1.
FIGURE 2-1 Schematic of gasoline engine [1]
The basic operation of a four stroke engine involves intake, compression,
expansion (or power), and exhaust strokes as shown in Fig.2-2. The piston starts at the
top, the intake valve opens, and the piston moves down to let the engine take in acylinder-full of air and gasoline. This is the intake stroke. Only the tiniest drop of
gasoline needs to be mixed into the air for this to work. Then the piston moves back
up to compress this fuel/air mixture. Compression makes the explosion more
powerful. When the piston reaches almost the top of its stroke, the spark plug emits a
spark to ignite mixture. The power generates from combustion and driving the piston
down. Once the piston hits the bottom of its stroke, the exhaust valve opens and the
exhaust leaves the cylinder to go out the exhaust pipe.

8/3/2019 An Analytical Model of Spark Ignition Engine for Performance Prediction
http://slidepdf.com/reader/full/an-analytical-model-of-spark-ignition-engine-for-performance-prediction 18/74
FIGURE 2-2 Basic four stroke cycle
With models for each of these processes, a simulation of complete engine cycle
can be built up and be analyzed to provide information on engine performances.
These ideal models that describe characteristic of each process are proposed. However
the calculation needs information from each state as shown in Fig.2-3a which
sometime could not obtain from real condition as shown in Fig.2-3b.
(a) (b)
FIGURE 2-3 Pressure-volume diagram of Otto cycle: (a) ideal; (b) real
Overall engine work can be determined by integrating the area under the
pressure-volume diagram. So many previous works concerned mainly prediction the
pressure inside the combustion chamber [2, 3, 4]. But the pressure and volume are
influenced by engine geometries during variation of crank angle. So the pressure and
displacement volume are needed to convert as functions of crank angle. Kuo [3] and
Kirkpatrick [5] proposed the method that can calculate the pressure and volume at anycrank angle. The combustion process can be described by simple correlation, Wiebe
function [6].
The results from Kuo [3] and Zeng et al [4] indicated that heat transfer from
inside the cylinder to engine cooling water had much influences on the pressure inside
the cylinder. So the heat transfer function is needed to take into account in the model.
Many researches reported that the mass of mixture that flows into the cylinder
during intake stroke is a very importance parameter [1, 2, 3], [6] because it affects
amount of fuel which mixes with the air. This mass can be determined by combining
the ideal gas law and volumetric efficiency. However it is very difficult to evaluate
because they are affected by many factors, such as manifold geometries and valve
timing [6]. So Eriksson et al [2] and Kuo [3] assumed that the pressure inside
4

8/3/2019 An Analytical Model of Spark Ignition Engine for Performance Prediction
http://slidepdf.com/reader/full/an-analytical-model-of-spark-ignition-engine-for-performance-prediction 19/74
manifold and inside the cylinder are the same, and neglect effect of volumetric
efficiency. But Kuo [3] used corrective equation from real experiment to compensate
the errors. While Zeng et al [1] took the effect of volumetric efficiency into account.However the data were obtained from the real experiment and stored in a 3-dimension
table by relation between engine speed and intake manifold pressure.
It can say that combining of those methods that are mentioned above can predict
the engine performances precisely only if some testing data are known, mainly the
volumetric efficiency. So this thesis tries to use the one-dimension flow model to
predict the volumetric efficiency in order to reduce the testing data dependence.
2.2 Modeling
There are numerous ways of describing reality through a model [7, 8]. Some are
more complex than others and the different approaches may differ in both structure
and accuracy. Choosing the model depends on the particular situation and especiallythe field of application. The model classifications are summarized follow.
2.2.1 Mean Value vs. Cylinder-by-cylinder Approaches
When considering the cylinder, two main approaches can be found. The most
common use is mean value engine method. The mean value method defines number
of cylinders as one which occupies whole displacement volume. The fluctuating flow
through the inlet port is modeled by average value over a cycle. The dynamics of
speed, engine torque, pressure build-up in the inlet and exhaust manifolds are the
aspects of most interest in this approach.
Another method to the mean method is the cylinder-by-cylinder engine
approach. Unlike the mean method, it describes each cylinder individually and
generates for example a torque signal with each individual combustion pulse present. Normally the mean model is sufficient enough for use in processes such as control
system design. But in engine performance development aspect, the cylinder-by-
cylinder method is better because this method derives from engine geometries, which
is very useful for improving and optimizing the engine in the future.
2.2.2 Limit of Physical Properties
There are a number of approaches available when deciding on the basis of a
model. Physical equation theoretically describing the system is the most common
method since it creates a general model working for many operating areas. Its
drawback is that reality might be difficult to describe correctly in theory.
Another common approach bases on the model entirely on measurements. The
measured data is stored as a table of two or more dimensions in a so called black boxdepending on input signals. This approach often provides an accurate result since it is
based directly on empirical formulation. However it is only defined for a limited
region. A combination of both approaches is commonly used. The main basis of the
model rests on physical equations. And empirical equations are used to model certain
complexities.
5

8/3/2019 An Analytical Model of Spark Ignition Engine for Performance Prediction
http://slidepdf.com/reader/full/an-analytical-model-of-spark-ignition-engine-for-performance-prediction 20/74
CHAPTER 3 THE MODEL
In this chapter the model is described in detail. The engine to be modeled is a
gasoline engine which has no EGR and turbo system. The chosen model bases on the
pressure inside the cylinder prediction. There are two main approaches to consider;
mean value and cylinder-by-cylinder models. Since the objective of this thesis intends
to develop the model which can describe effects of each parameter on the engine
performance, the cylinder-by-cylinder approach is used in order to achieve this goal.
Another consideration for model selection is limited by physical properties.Since there are no perfect equations which can describe phenomena in the engine,
both physical and empirical formulae are used in the model.
3.1 Model Overview
FIGURE 3-1 Model overview
Start
RPM Stroke Bore Conn. Rod Comp.Ratio Spark Angle
Heating ValueA/F RatioConn. RodIVOIVC k
Liv Div Tw No. Cylinder
Find mean
piston speed
Find displacement
volume
Find compression
volume
Find Temperature
of gas in cylinder
Find residual mass
θ = -360
θ = 180 No Yes
A
B
C
End
D
Find cylinder
volume, Eq.3-1
Find exposed combustion
chamber surface area, Eq.3-2
Find exhaust gas
temperature, Eq.3-21
Find total heat
input, Eq.3-7
Wiebe Function,
Eq.3-4
Heat release,
Eq.3-5 Find heat transfer coefficient,
Eq.3-10
Find pressure
increment, Eq.3-3
Find total heat
transfer, Eq.3-8
Find pressure inside
cylinder by integrating

8/3/2019 An Analytical Model of Spark Ignition Engine for Performance Prediction
http://slidepdf.com/reader/full/an-analytical-model-of-spark-ignition-engine-for-performance-prediction 21/74
FIGURE 3-2 (CONTINUED)
θ = θ + 1
A
B
)1/(
0 1
2−
⎥⎦
⎤⎢⎣
⎡
+≥⎟⎟
⎞⎜⎜⎝
⎛ k k
Critic
T
k p
p
0 p
pT =0 p
pT
0 p
pT = )1/(
1
2 −
⎥⎦⎤
⎢⎣⎡
+
k k
k
C
No
Yes
P e
D
Find valve lift
function, Eq.3-16
Find valve curtain
area, Eq.3-14Find discharge
coefficient, Eq.3-18
Find frictional loss
factor, Eq.3-19
Find charge heating
factor, Eq.3-20
Find flow-in mass,
Eq.3-15
Find total flow-in mass
by integrating
Find pressure that belongto flow-in mass
Find friction loss,
Eq.3-22
Find indicated mean
pressure, Eq.3-23
Find effective
pressure, Eq.3-24
Find effective power,
Eq.3-25
7

8/3/2019 An Analytical Model of Spark Ignition Engine for Performance Prediction
http://slidepdf.com/reader/full/an-analytical-model-of-spark-ignition-engine-for-performance-prediction 22/74
Fig.3-1 and Fig.3-2 shows the overview of the model. Engine geometries, such
as bore, stroke, compression ratio, etc., are calculated to obtain physical information
such as displacement volume, area and volume variation as function of crank angle,etc. That information will be used for cylinder pressure prediction with another line of
information about heat input. Heat energy needs data from amount of flow in mass
and burn characteristic which is described by Wiebe function. Predicted pressure will
be used to determine temperature inside cylinder and also heat transfer from cylinder
to wall chamber. Rate of heat loss will be fed back to the pressure prediction function.
Resulted pressure will be converted to indicated mean effective pressure subtracted by
mean friction, then work and power will be known finally. The Matlab/Simulink
block diagrams of the model are shown in Appendix B. The details of each module
are described in following section.
3.2 Crank Slider ModelThe volume of the piston cylinder can be determined as a function of crank
angle from the compression ratio (ε ), the stroke ( s), bore (b) and connecting rod
length (a). The geometric parameters of the piston cylinder can be described by the
crank slider model which is represented in Fig.3-3.
FIGURE 3-3 Piston cylinder and geometries
The equations of volume and area that relate to crank angle are described as
following equation [5]:
])sin(cos1[21
)( 2
1
2
2
θ al θ
al V
ε-V V d d
−⎟ ⎠ ⎞⎜
⎝ ⎛ −−++=θ Eq.3-1
])sin(cos1[22
)( 2
1
2
2
2θ
a
l θ
a
l sπ bb
π A −⎟
⎠
⎞⎜⎝
⎛ +−++=θ Eq.3-2
3.3 Cylinder Pressure Model
This model is derived from the first law of thermodynamics. The pressure is
derived as a function of crank angle also [5].
θ θ θ d dV
V P k Q
d Q
V k
d dP
loss −⎟ ⎠ ⎞⎜
⎝ ⎛ −∂−= 1 Eq.3-3
8

8/3/2019 An Analytical Model of Spark Ignition Engine for Performance Prediction
http://slidepdf.com/reader/full/an-analytical-model-of-spark-ignition-engine-for-performance-prediction 23/74
θ d
dV can be determined from Eq.3-1 by taking derivative with respect to the
crank angle (θ ). The Wiebe function for the burn fraction is used for θ d Q∂ .
3.4 Wiebe Function ( f )
The mass fraction burned profiles as a function of crank angle in each individual
cycle shown in Fig.3-4. It has a characteristic S-Shape. The rate at which fuel-air
mixture burns increases from a low value intermediately following the spark
discharge to a maximum about halfway through the burning process and then
decreases to a close to zero as the combustion process ends.
FIGURE 3-4 Burned mass fraction characteristic
A functional form often used to represent the mass fraction burned versus crank angle curve is the Wiebe function:
⎥⎥⎦
⎤
⎢⎢⎣
⎡⎟
⎠
⎞⎜⎝
⎛
Δ
−−−=
3
05exp1)(θ
θ θ θ f Eq.3-4
The heat release ( Q∂ ) over the crank angle change (Δθ ) is:
θ θ d
df Q
d
Qin=
∂Eq.3-5
Then take the derivative of the heat release function ( f( θ )), with respect to crank
angle, beingθ d
df from Eq.3-4.
3.4.1 Burning Duration (Δθ )Mixture burning rate is influenced by engine speed. It is well established that
the duration of combustion in crank angle degrees only increases slowly with
increasing engine speed. Fig.3-5 shows how intervals of burning characteristics are.
The burning rate throughout the combustion process does not increase linearly as
engine speed. Additionally, increasing in-cylinder gas velocities (e.g. with intake
generated swirl) increases the burning rate. Increasing engine speed and introducingswirl both increase the levels of turbulence in the engine cylinder.
9

8/3/2019 An Analytical Model of Spark Ignition Engine for Performance Prediction
http://slidepdf.com/reader/full/an-analytical-model-of-spark-ignition-engine-for-performance-prediction 24/74
(a) (b)
FIGURE 3-5 Effect of engine speed on flame-development angle
(a) 10% and 90% burn [6] and (b) 100% burn [9]
However, the swirl characteristic is not able to determine easily depending onmanifold geometries and piston head design. Therefore, the results in Fig.3-5a, which
obtained from experiment, are used to estimate the burning duration (Δθ ) for gasoline.
951.39)1000
(886.19)1000
(6189.1 2 ++−=Δ N N
θ for 1000 ≤ N ≤ 6000 Eq.3-6
3.5 Heat InputOverall heat input can be determined by using heating value of fuel and amount
of mass which is drawn into cylinder.
stoichair
IVC
IVOin
m
d m HV
Q,1
)(
+=
∫ θ θ
Eq.3-7
Values of final mass fraction burned usually are in the range 93% to 98% due to
the fact that not all of the fuel is burned [6]. Kuo [3] used 95%. So this value is
applied to Qin.
3.6 Air/Fuel Ratio
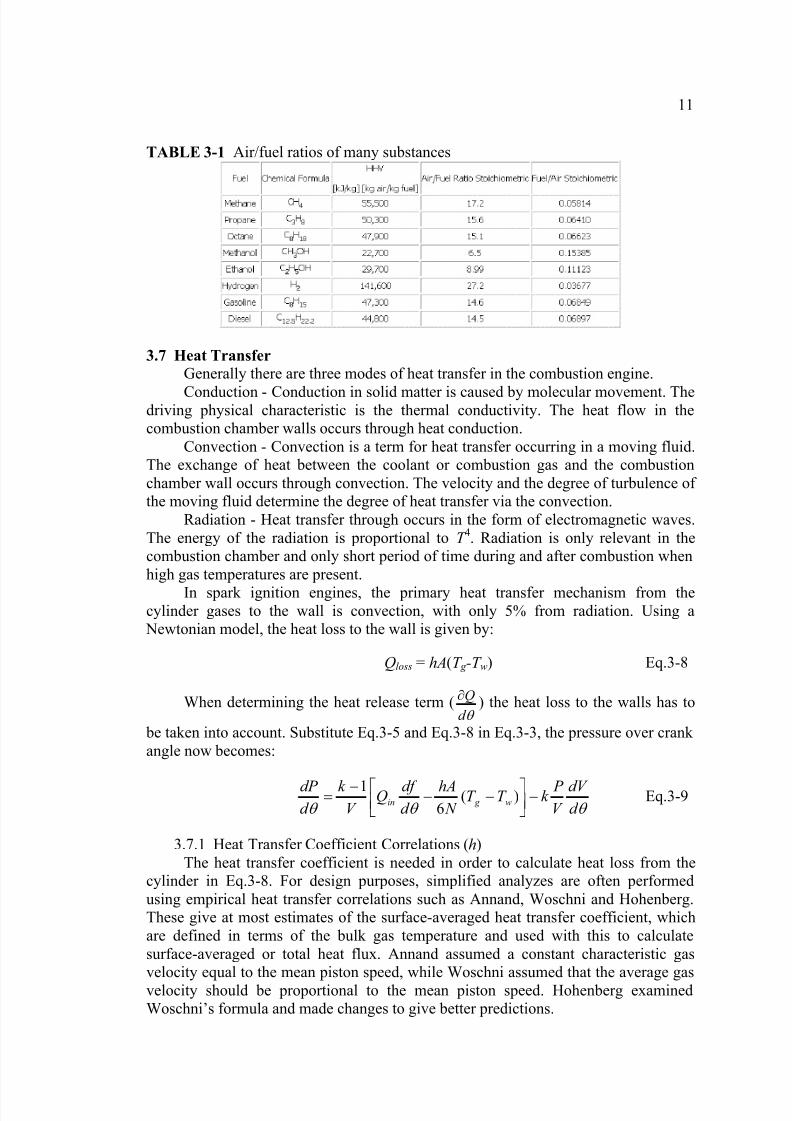
In internal combustion engines, the air-fuel ratio refers to the proportion of air and fuel present during combustion. The chemically optimal point at which this
happens is the stoichiometric ratio. Examples are shown in Table 3-1.
For gasoline fuel, the stoichiometric air/fuel mixture is approximately 14.6
times the mass of air to fuel. This is the mixture that modern engine management
systems employing fuel injection attempt to achieve in light load cruise situations.
Any mixture less than 14.6 to 1 is considered to be a rich mixture, any more than 14.6
to 1 is a lean mixture.
10
M a s s B u r n ( × 1 0 0 ) %
8/3/2019 An Analytical Model of Spark Ignition Engine for Performance Prediction
http://slidepdf.com/reader/full/an-analytical-model-of-spark-ignition-engine-for-performance-prediction 25/74
TABLE 3-1 Air/fuel ratios of many substances
3.7 Heat Transfer
Generally there are three modes of heat transfer in the combustion engine.
Conduction - Conduction in solid matter is caused by molecular movement. Thedriving physical characteristic is the thermal conductivity. The heat flow in the
combustion chamber walls occurs through heat conduction.
Convection - Convection is a term for heat transfer occurring in a moving fluid.
The exchange of heat between the coolant or combustion gas and the combustion
chamber wall occurs through convection. The velocity and the degree of turbulence of
the moving fluid determine the degree of heat transfer via the convection.
Radiation - Heat transfer through occurs in the form of electromagnetic waves.
The energy of the radiation is proportional to T 4. Radiation is only relevant in the
combustion chamber and only short period of time during and after combustion when
high gas temperatures are present.
In spark ignition engines, the primary heat transfer mechanism from thecylinder gases to the wall is convection, with only 5% from radiation. Using a
Newtonian model, the heat loss to the wall is given by:
Qloss = hA(T g -T w) Eq.3-8
When determining the heat release term (θ d
Q∂) the heat loss to the walls has to
be taken into account. Substitute Eq.3-5 and Eq.3-8 in Eq.3-3, the pressure over crank
angle now becomes:
θ θ θ d dV
V P k T T
N hA
d df Q
V k
d dP
w g in −⎥⎦⎤⎢⎣
⎡ −−−= )(6
1 Eq.3-9
3.7.1 Heat Transfer Coefficient Correlations (h)
The heat transfer coefficient is needed in order to calculate heat loss from the
cylinder in Eq.3-8. For design purposes, simplified analyzes are often performed
using empirical heat transfer correlations such as Annand, Woschni and Hohenberg.
These give at most estimates of the surface-averaged heat transfer coefficient, which
are defined in terms of the bulk gas temperature and used with this to calculate
surface-averaged or total heat flux. Annand assumed a constant characteristic gas
velocity equal to the mean piston speed, while Woschni assumed that the average gas
velocity should be proportional to the mean piston speed. Hohenberg examined
Woschni’s formula and made changes to give better predictions.
11

8/3/2019 An Analytical Model of Spark Ignition Engine for Performance Prediction
http://slidepdf.com/reader/full/an-analytical-model-of-spark-ignition-engine-for-performance-prediction 26/74
Kleeman et al [10] compared these empirical correlations with Computational
Fluid Dynamic (CFD) prediction by using Standard Wall Function (SWF) and
Modified Wall Function (MWF) methods. Both SWF and MWF are boundary layer models which have been employed to calculate wall shear and heat transfer in CFD.
SWF derives the near-wall velocity and temperature profiles from a Couette flow
analysis, assuming steady one dimensional flow and ignore the variation within the
layer of the fluid thermophysical properties (e.g. density, viscosity, thermal
conductivity). The use of SWF in CFD calculation of engine heat transfer generally
leads to underprediction of the wall heat flux. So MWF is developed further for using
in engine simulation by taking the fluid thermophysical properties into account. The
results are shown in Fig.3-6.
FIGURE 3-6 Comparison of surface-averaged heat flux variations predicted by CFD
calculations and empirical correlations [10]
The results from [10] showed that the MWF method gave the most accurate
results. So using these simple correlations will introduce some errors. However MWF
can only be obtained from CFD because the CFD program can calculate the
instantaneous local heat fluxes which are not uniform throughout the combustion
chamber, while this thesis assumes the charge are burned completely throughout thecylinder at the same time. According to the results in Fig.3-6, the Hohenberg
correlation is selected because it is closest to MWF and also there is no empirical
form for MWF. The Hohenberg correlation is following equation [4].
8.04.08.006.0 )4.1(130 += −−m g C T P V h Eq.3-10
3.8 Volumetric Efficiency (ηv)
The intake system – the air filter, carburetor, and throttle plate (in a spark
ignition engine), intake manifold, intake port, intake valve – restricts the amount of air
which an engine of given displacement can induct. The parameter used to measure theeffectiveness of an engine’s induction process is the volumetric efficiency (η v).
12

8/3/2019 An Analytical Model of Spark Ignition Engine for Performance Prediction
http://slidepdf.com/reader/full/an-analytical-model-of-spark-ignition-engine-for-performance-prediction 27/74
Volumetric efficiency is only used with four-stroke engines which have distinct
induction process. It is defined as the volume of air which is drawn into the intake
system divided by the volume which is displaced by the piston, Eq.3-11. Typicalmaximum values of volumetric efficiency for naturally aspirated engines are in the
range 80 to 90%. The volumetric efficiency for diesels is somewhat higher than the
spark ignition engines as shown in Fig.3-7.
d a
av
V
m
ρ η = Eq.3-11
FIGURE 3-7 Volumetric efficiency versus mean piston speed for a four-cylinder
indirect-injection diesel and a six-cylinder spark-ignition engine [6]
According to Fig.3-7, there are no such a model can predict the trend of the
volumetric efficiency exactly because it is affected by the following fuel, engine
design and engine operating variables:
1. Fuel type, air/fuel ratio, fraction of fuel vaporized in the intake system, andfuel heat of vaporization
2. Mixture temperature as influenced by heat transfer
3. Ratio of exhaust to inlet manifold pressures
4. Compression ratio
5. Engine speed
6. Intake and exhaust manifold and port design
7. Intake and exhaust valve geometry, size, lift and timings
The manifold and valve geometry design has great effects on the volumetric
efficiency since the designs of each engine model have never been the same. So this
thesis tries to develop the model in order to predict η v caused by the different valve
design.
13

8/3/2019 An Analytical Model of Spark Ignition Engine for Performance Prediction
http://slidepdf.com/reader/full/an-analytical-model-of-spark-ignition-engine-for-performance-prediction 28/74
FIGURE 3-8 Effect on volumetric efficiency of different phenomena which affect
the air flow rate as a function of speed. Solid line is final volumetric
efficiency versus speed curve [6]
The shape of volumetric efficiency can be explained by Fig.3-8. It is affected by
many different phenomena. Non-speed-dependent effects (such as fuel vapor
pressure) drop the volumetric efficiency below 100% (curve A). Charge heating in the
manifold and cylinder drops curve A to curve B. It has greater effect at low enginespeeds due to longer gas residence time. Frictional flow losses increase as the square
of engine speed, and drop curve B to curve C . At higher engine speeds, the flow into
the engine during at least part of intake process becomes choked. Once this occurs,
further increases in speed do not increase the flow rate significantly so volumetric
efficiency decreases sharply (curve C to D). The induction ram effect at higher engine
speeds which occurs from inertia of mixture raises curve D to curve E . Late inlet
valve closing, which allows advantage to be taken of increased charging at higher
speeds, results in a decrease in the volumetric efficiency at low engine speeds due to
backflow (curve C and D to F ). Finally, intake and/or exhaust tuning can increase the
volumetric efficiency (often by substantial amount) over part of the engine speed
range, curve F to G. The terms which appear in Fig.3-8 are described as following.Frictional losses – During the intake stroke, the pressure in the cylinder is less
than atmospheric pressure due to friction in each part of the intake system. This total
pressure drop is the sum of the pressure loss in each component of the intake system:
air filter, carburetor and throttle, manifold, inlet port, and inlet valve.
Ram effect – The pressure in the inlet manifold varies during each cylinder’s
intake process due to the piston velocity variation, valve open area variation, and the
unsteady gas-flow effects that result from geometric variations. At high engine
speeds, the inertia of the gas in the intake system as the intake valve is closing
increases the pressure in the port and continue charging process when the piston slow
down around BDC and starts the compression stroke. This effect becomes
progressively greater as engine speed is increased.
14
8/3/2019 An Analytical Model of Spark Ignition Engine for Performance Prediction
http://slidepdf.com/reader/full/an-analytical-model-of-spark-ignition-engine-for-performance-prediction 29/74
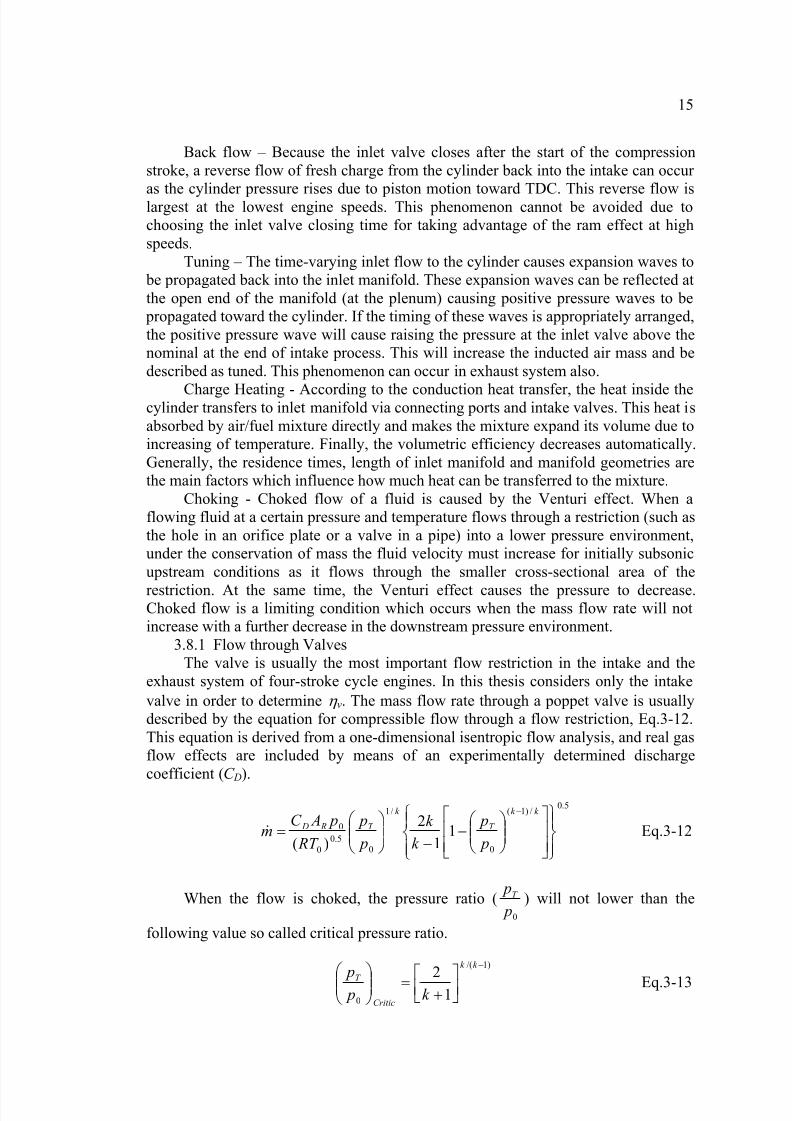
Back flow – Because the inlet valve closes after the start of the compression
stroke, a reverse flow of fresh charge from the cylinder back into the intake can occur
as the cylinder pressure rises due to piston motion toward TDC. This reverse flow islargest at the lowest engine speeds. This phenomenon cannot be avoided due to
choosing the inlet valve closing time for taking advantage of the ram effect at high
speeds.
Tuning – The time-varying inlet flow to the cylinder causes expansion waves to
be propagated back into the inlet manifold. These expansion waves can be reflected at
the open end of the manifold (at the plenum) causing positive pressure waves to be
propagated toward the cylinder. If the timing of these waves is appropriately arranged,
the positive pressure wave will cause raising the pressure at the inlet valve above the
nominal at the end of intake process. This will increase the inducted air mass and be
described as tuned. This phenomenon can occur in exhaust system also.
Charge Heating - According to the conduction heat transfer, the heat inside thecylinder transfers to inlet manifold via connecting ports and intake valves. This heat is
absorbed by air/fuel mixture directly and makes the mixture expand its volume due to
increasing of temperature. Finally, the volumetric efficiency decreases automatically.
Generally, the residence times, length of inlet manifold and manifold geometries are
the main factors which influence how much heat can be transferred to the mixture.
Choking - Choked flow of a fluid is caused by the Venturi effect. When a
flowing fluid at a certain pressure and temperature flows through a restriction (such as
the hole in an orifice plate or a valve in a pipe) into a lower pressure environment,
under the conservation of mass the fluid velocity must increase for initially subsonic
upstream conditions as it flows through the smaller cross-sectional area of the
restriction. At the same time, the Venturi effect causes the pressure to decrease.Choked flow is a limiting condition which occurs when the mass flow rate will not
increase with a further decrease in the downstream pressure environment.
3.8.1 Flow through Valves
The valve is usually the most important flow restriction in the intake and the
exhaust system of four-stroke cycle engines. In this thesis considers only the intake
valve in order to determine η v. The mass flow rate through a poppet valve is usually
described by the equation for compressible flow through a flow restriction, Eq.3-12.
This equation is derived from a one-dimensional isentropic flow analysis, and real gas
flow effects are included by means of an experimentally determined discharge
coefficient (C D).
5.0/)1(
0
/1
05.0
0
0 11
2
)( ⎪⎭
⎪⎬⎫
⎪⎩
⎪⎨⎧
⎥⎥
⎦
⎤
⎢⎢
⎣
⎡
⎟⎟ ⎠
⎞⎜⎜⎝
⎛ −
−⎟⎟ ⎠
⎞⎜⎜⎝
⎛ =
− k k
T
k
T R D
p
p
k
k
p
p
RT
p AC m& Eq.3-12
When the flow is choked, the pressure ratio (0 p
pT ) will not lower than the
following value so called critical pressure ratio.
)1/(
0 1
2−
⎥⎦
⎤⎢⎣
⎡
+=⎟⎟ ⎠
⎞
⎜⎜⎝
⎛ k k
Critic
T
k p
pEq.3-13
15
8/3/2019 An Analytical Model of Spark Ignition Engine for Performance Prediction
http://slidepdf.com/reader/full/an-analytical-model-of-spark-ignition-engine-for-performance-prediction 30/74
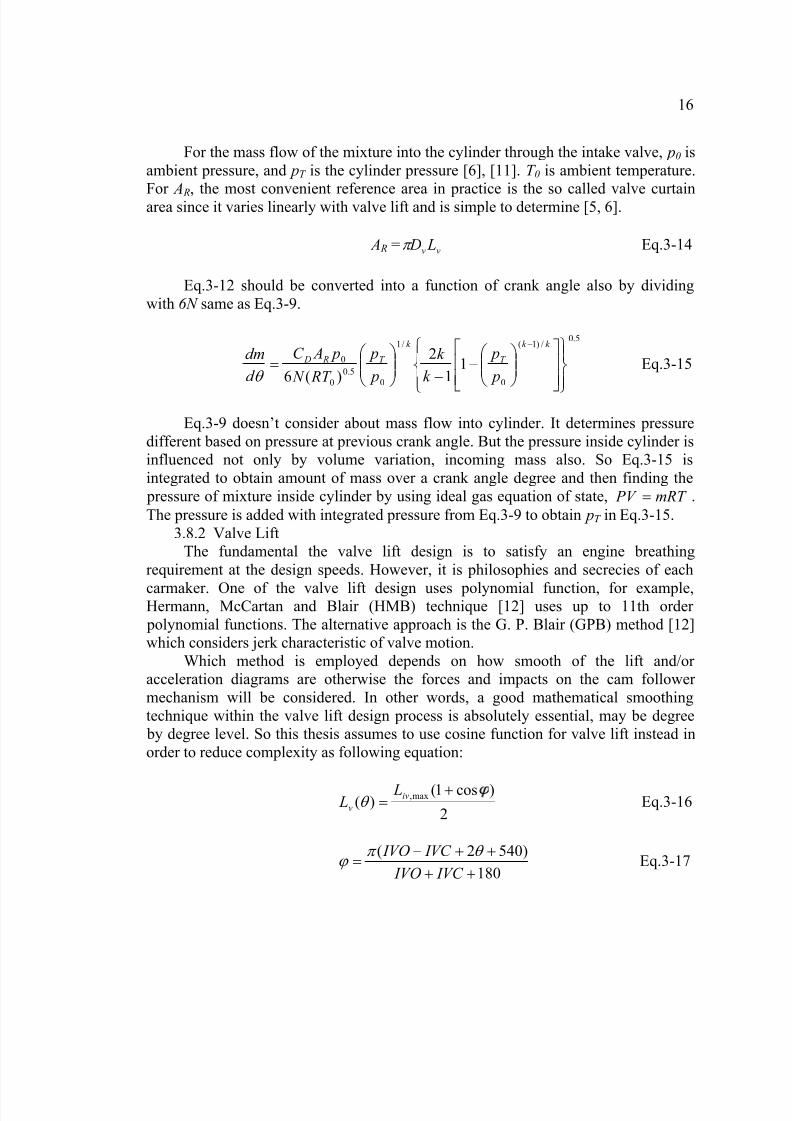
For the mass flow of the mixture into the cylinder through the intake valve, p0 is
ambient pressure, and pT is the cylinder pressure [6], [11]. T 0 is ambient temperature.
For A R, the most convenient reference area in practice is the so called valve curtainarea since it varies linearly with valve lift and is simple to determine [5, 6].
A R = vv L Dπ Eq.3-14
Eq.3-12 should be converted into a function of crank angle also by dividing
with 6N same as Eq.3-9.
5.0/)1(
0
/1
0
5.0
0
0 11
2
)(6 ⎪
⎭
⎪⎬⎫
⎪
⎩
⎪⎨⎧
⎥⎥
⎦
⎤
⎢⎢
⎣
⎡
⎟⎟ ⎠
⎞⎜⎜⎝
⎛ −
−⎟⎟ ⎠
⎞⎜⎜⎝
⎛ =
− k k
T
k
T R D
p
p
k
k
p
p
RT N
p AC
d
dm
θ Eq.3-15
Eq.3-9 doesn’t consider about mass flow into cylinder. It determines pressure
different based on pressure at previous crank angle. But the pressure inside cylinder is
influenced not only by volume variation, incoming mass also. So Eq.3-15 is
integrated to obtain amount of mass over a crank angle degree and then finding the
pressure of mixture inside cylinder by using ideal gas equation of state, mRT PV = .
The pressure is added with integrated pressure from Eq.3-9 to obtain pT in Eq.3-15.
3.8.2 Valve Lift
The fundamental the valve lift design is to satisfy an engine breathing
requirement at the design speeds. However, it is philosophies and secrecies of each
carmaker. One of the valve lift design uses polynomial function, for example,Hermann, McCartan and Blair (HMB) technique [12] uses up to 11th order
polynomial functions. The alternative approach is the G. P. Blair (GPB) method [12]
which considers jerk characteristic of valve motion.
Which method is employed depends on how smooth of the lift and/or
acceleration diagrams are otherwise the forces and impacts on the cam follower
mechanism will be considered. In other words, a good mathematical smoothing
technique within the valve lift design process is absolutely essential, may be degree
by degree level. So this thesis assumes to use cosine function for valve lift instead in
order to reduce complexity as following equation:
2
)cos1()(
max,θ += iv
v
L L Eq.3-16
180
)5402(
++
++−=
IVC IVO
IVC IVO θ π ϕ Eq.3-17
16
8/3/2019 An Analytical Model of Spark Ignition Engine for Performance Prediction
http://slidepdf.com/reader/full/an-analytical-model-of-spark-ignition-engine-for-performance-prediction 31/74
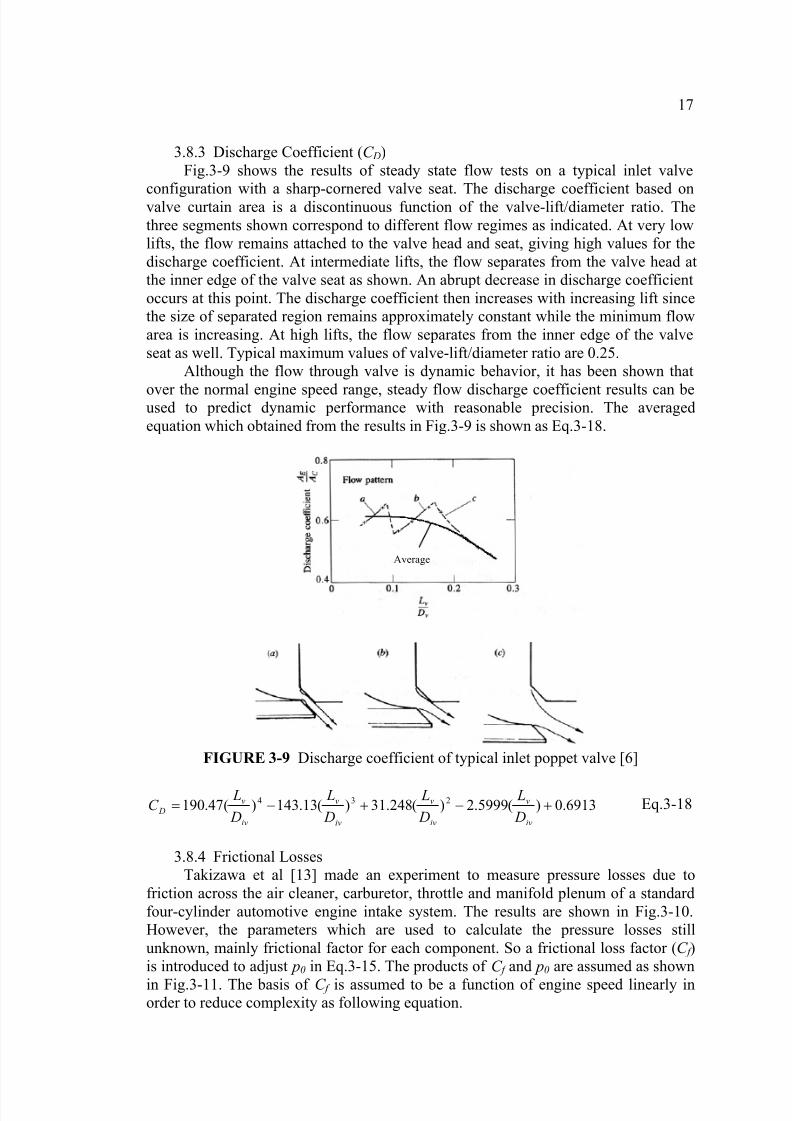
3.8.3 Discharge Coefficient (C D)
Fig.3-9 shows the results of steady state flow tests on a typical inlet valve
configuration with a sharp-cornered valve seat. The discharge coefficient based onvalve curtain area is a discontinuous function of the valve-lift/diameter ratio. The
three segments shown correspond to different flow regimes as indicated. At very low
lifts, the flow remains attached to the valve head and seat, giving high values for the
discharge coefficient. At intermediate lifts, the flow separates from the valve head at
the inner edge of the valve seat as shown. An abrupt decrease in discharge coefficient
occurs at this point. The discharge coefficient then increases with increasing lift since
the size of separated region remains approximately constant while the minimum flow
area is increasing. At high lifts, the flow separates from the inner edge of the valve
seat as well. Typical maximum values of valve-lift/diameter ratio are 0.25.
Although the flow through valve is dynamic behavior, it has been shown that
over the normal engine speed range, steady flow discharge coefficient results can beused to predict dynamic performance with reasonable precision. The averaged
equation which obtained from the results in Fig.3-9 is shown as Eq.3-18.
FIGURE 3-9 Discharge coefficient of typical inlet poppet valve [6]
6913.0)(5999.2)(248.31)(13.143)(47.190 234 +−+−=iv
v
iv
v
iv
v
iv
v D
D
L
D
L
D
L
D
LC Eq.3-18
3.8.4 Frictional Losses
Takizawa et al [13] made an experiment to measure pressure losses due to
friction across the air cleaner, carburetor, throttle and manifold plenum of a standard
four-cylinder automotive engine intake system. The results are shown in Fig.3-10.
However, the parameters which are used to calculate the pressure losses still
unknown, mainly frictional factor for each component. So a frictional loss factor (C f )is introduced to adjust p0 in Eq.3-15. The products of C f and p0 are assumed as shown
in Fig.3-11. The basis of C f is assumed to be a function of engine speed linearly inorder to reduce complexity as following equation.
Average
17

8/3/2019 An Analytical Model of Spark Ignition Engine for Performance Prediction
http://slidepdf.com/reader/full/an-analytical-model-of-spark-ignition-engine-for-performance-prediction 32/74
986923.0)1000
(019738.0 +−= N
C f for 1000 ≤ N ≤ 6000 Eq.3-19
FIGURE 3-10 Pressure losses in the intake system of a four-stroke cycle spark-
ignition engine determined under steady flow conditions [13]
86
88
90
92
94
96
98
100
0 1000 2000 3000 4000 5000 6000 7000
Engine Speed, RPM
R e m a i n i n g P r e s s
u r e ,
k P a
FIGURE 3-11 Assumption of remaining pressure after subtracted by pressure losses
18

8/3/2019 An Analytical Model of Spark Ignition Engine for Performance Prediction
http://slidepdf.com/reader/full/an-analytical-model-of-spark-ignition-engine-for-performance-prediction 33/74
3.8.5 Charge Heating
As mentioned in Sec.3.8, the residence times, length of inlet manifold and
manifold geometries are the main factors which influence how much heat can betransferred to the mixture. However, the length and geometries of manifold cannot be
determined easily and the mixture velocity is dynamic behavior. So a charge heating
factor (C heat ) is introduced to apply with T 0 in Eq.3-15. The assumption is defined that
temperatures inside manifold are in between cylinder wall temperature and ambient
temperature. The products of C heat and T 0 are assumed as shown in Fig.3-12, 373 K at
1000 rpm and 308 K at 6000 rpm. The basis of C heat is assumed to be a function of
engine speed linearly in order to reduce complexity as following.
2953.1)1000
(043624.0 +−= N
C heat for 1000 ≤ N ≤ 6000 Eq.3-20
260
280
300
320
340
360
380
0 1000 2000 3000 4000 5000 6000 7000
Engine Speed, RPM
T e m p e r a t u r e I n s i d e M a n i f o l d , K
FIGURE 3-12 Assumption of temperature inside manifold
3.9 Residual Gas
The residual gas affects volumetric efficiency and engine performance directly,
and efficiency and emissions through its effect on working fluid thermodynamic
properties [6]. The residual gas is primarily a function of inlet and exhaust pressure,
speed, compression ratio, valve timing, and exhaust system dynamics. However, the
equation which can describe the magnitude of residual gas is still unknown. So this
thesis assumes that the amount of residual gas can be determined by using the idealgas equation of state, mRT PV = at TDC which is a function of exhaust pressure,
compressed volume, exhaust gas molecular weight, and exhaust gas temperature. The
exhaust pressure is between 1 and 1.5 atm [3]. So it is selected at 1.5 atm. The exhaust
gas molecular weight is 30.4 g/mol.
Caton and Heywood [14] measured cylinder pressure, calculated cylinder gas
temperature and exhaust mass flow rate, and measured gas temperature at the exhaust
port exit for a single-cylinder spark ignition engine at 1000 rpm. The results of [14]
are shown in Fig.3-13. According to Fig.3-13, the exhaust gas temperature at 1000
rpm can be assumed starting at 900 K. The exhaust temperatures along other engine
speeds are calculated at point 4 in Fig.2-3a under ideal process. The increments of
temperature at point 4 on each engine speed are added to 900 K as shown in Fig.3-14.And the exhaust gas temperature equation is obtained from those results as following.
19

8/3/2019 An Analytical Model of Spark Ignition Engine for Performance Prediction
http://slidepdf.com/reader/full/an-analytical-model-of-spark-ignition-engine-for-performance-prediction 34/74
21.676)1000
(49.279)1000
(9.51)1000
(3955.3 23 ++−= N N N
T exh for 1000 ≤ N ≤ 6000
Eq.3-21
FIGURE 3-13 Measured cylinder pressure pc, calculated cylinder-gas temperature
T c, exhaust mass flow rate em& , and measured gas temperature at
exhaust port exit T p, for single-cylinder spark ignition engine at speed
= 1000 rpm [14]
0
200
400
600
800
1000
1200
1400
0 1 2 3 4 5 6 7
Engine Speed, RPM
E x h a u s t G a s T e m p e r a t u r e , K
FIGURE 3-14 Assumption of temperature inside manifold
20

8/3/2019 An Analytical Model of Spark Ignition Engine for Performance Prediction
http://slidepdf.com/reader/full/an-analytical-model-of-spark-ignition-engine-for-performance-prediction 35/74
3.10 Friction
Friction losses influence the indicated power and useful output, the brake
power. Barnes-Moss [15] tested several four-stroke cycle four cylinder SI engines between 845 and 2000 cm3 displacement at wide-open throttle. The total friction work
per cycle (and thus the friction mean effective pressure) for a given engine geometry
will vary with the engine speed as following equation.
97.0)1000
(15.0)1000
(05.0 2 ++= N N
p f for 1000 ≤ N ≤ 6000 Eq.3-22
3.11 Torque & Power
To determine the overall performance, indicated mean effective pressure is used
[16]. The indicated mean effective pressure represents the work per combustion cycle
normalized by the displacement volume also called specific work. This valueindicates amount of maximum available power that can generate from single cylinder.
d
miV
PdV p
∫= Eq.3-23
The engine has to overcome the friction loss. So the available output becomes:
f mime p p p −= Eq.3-24
Effective power can be determined by following equation.
d mee V p N P ⋅⋅= 5.0 Eq.3-25
Finally, torque can be determined by following relation.
30
NT P e
π = Eq.3-26
3.12 Minimum Spark Advance for Best Torque (MBT)
The charge of the air/fuel is burned by a flame-front beginning at the spark plug.
The flame starts a kernel with a rather slow rate of expansion, but once a small
percentage of the charge is ignited, the combustion process accelerates at a faster rate.
Due to the very slow initial reaction rates, ignition must occur before TDC. This is the
"advance" in ignition and is measured in degrees of crankshaft rotation. The best
advance depends on design and operating conditions. This value is called “Minimum
Spark Advance” which will produce the maximum torque at a given operating
condition of speed and load of a given engine combination. In most cases the spark
advance curve can be advanced several degrees before torque begins to drop off. If
"knock" occurs, advance can be determined. The advance is referred to as "knock
limits". The fuel octane, camshaft profile and/or the compression ratio will need to beaddressed before maximum output can be achieved.
21
8/3/2019 An Analytical Model of Spark Ignition Engine for Performance Prediction
http://slidepdf.com/reader/full/an-analytical-model-of-spark-ignition-engine-for-performance-prediction 36/74
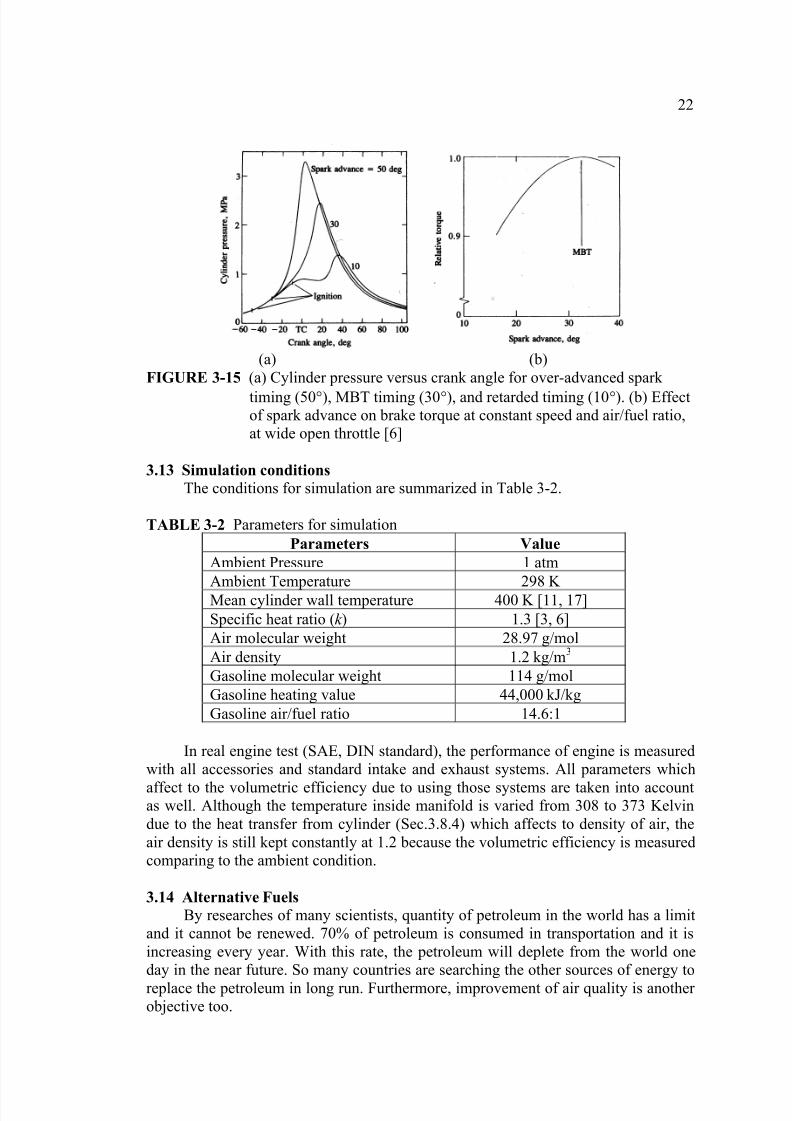
(a) (b)
FIGURE 3-15 (a) Cylinder pressure versus crank angle for over-advanced spark
timing (50°), MBT timing (30°), and retarded timing (10°). (b) Effectof spark advance on brake torque at constant speed and air/fuel ratio,
at wide open throttle [6]
3.13 Simulation conditions
The conditions for simulation are summarized in Table 3-2.
TABLE 3-2 Parameters for simulation
Parameters Value
Ambient Pressure 1 atm
Ambient Temperature 298 K Mean cylinder wall temperature 400 K [11, 17]
Specific heat ratio (k ) 1.3 [3, 6]
Air molecular weight 28.97 g/mol
Air density 1.2 kg/m3
Gasoline molecular weight 114 g/mol
Gasoline heating value 44,000 kJ/kg
Gasoline air/fuel ratio 14.6:1
In real engine test (SAE, DIN standard), the performance of engine is measured
with all accessories and standard intake and exhaust systems. All parameters which
affect to the volumetric efficiency due to using those systems are taken into accountas well. Although the temperature inside manifold is varied from 308 to 373 Kelvin
due to the heat transfer from cylinder (Sec.3.8.4) which affects to density of air, the
air density is still kept constantly at 1.2 because the volumetric efficiency is measured
comparing to the ambient condition.
3.14 Alternative Fuels
By researches of many scientists, quantity of petroleum in the world has a limit
and it cannot be renewed. 70% of petroleum is consumed in transportation and it is
increasing every year. With this rate, the petroleum will deplete from the world one
day in the near future. So many countries are searching the other sources of energy to
replace the petroleum in long run. Furthermore, improvement of air quality is another objective too.
22

8/3/2019 An Analytical Model of Spark Ignition Engine for Performance Prediction
http://slidepdf.com/reader/full/an-analytical-model-of-spark-ignition-engine-for-performance-prediction 37/74
Many road-tests on the alternative fuels are done to prove these potentials.
However, there are a few on analytical studies. So this thesis would like to study the
alternative fuels in analytical aspect. This section is going to mention about thealternative fuels, such as LPG, CNG and alcohol-blended gasoline in details and how
the model is applied to study these fuels.
The model needs lots of parameter which are distinguished as shown in Fig.3-2,
engine geometries, valve geometries, fuel properties, and engine operating condition,
in order to predict the performance. However, the alternative fuel properties in details
are still unknown, mainly the combustion duration. So the studies are set to predict the
combustion range of these alternative fuels by comparing between the output
performances and simulated values which the data are obtained from previous
researches. The model is used to explain the volumetric efficiency in order to
determine effects of using those alternative fuels too.
The previous researches are selected under specific condition. They have tostudy the using both gasoline and one of alternative fuels on the same engine in order
to compare the information. The gasoline engine model which is developed under this
thesis uses parameters of the engine in order to determine the spark advanced angle.
With additional information of specific spark advanced setting on each alternative
fuels, the burning duration can be determined.
3.14.1 Ethanol-blended Gasoline or Gasohol
Ethanol (ethyl alcohol) and methanol (methyl alcohol) are two types of alcohol
fuels. The use of pure alcohols in internal combustion engines is only possible if the
engine is designed or modified for that purpose. However, in their anhydrous or pure
forms, they can be mixed with gasoline in various ratios for use in unmodified
automobile engines. Typically, only ethanol is used widely in this manner, particularly since methanol is toxic.
E10, also frequently called gasohol, is a fuel mixture of 10% ethanol and 90%
gasoline by volume that can be used in the internal combustion engines of most
modern automobiles. However, not enough scientific tests have been done to
determine if E10 is harmful to older cars' fuel systems. It has been introduced
nationwide in Denmark and Thailand, and will replace high octane pure gasoline in
Thailand by 2007.
E20 contains 20% ethanol and 80% gasoline. This fuel is not yet widely used in
the world. Since February 2006, this is the standard ethanol-gasoline mixture sold in
Brazil, where concerns with the alcohol supply resulted in a drop in the ethanol
percentage, previously at 25%. Flexible-fuel cars are set up to run with gasoline insuch concentration range and few will work properly with lower concentrations of
ethanol. The properties of E10 and E20 are compared in Table 3-3.
TABLE 3-3 Summaries of major properties of gasoline, ethanol, E10 and E20 [18]
Properties Gasoline Ethanol E10 E20
Heating value (kJ/kg) 44,000 27,000 41,900 40,000
Stoichiometric air/fuel ratio 14.6 9 14 13.5
23

8/3/2019 An Analytical Model of Spark Ignition Engine for Performance Prediction
http://slidepdf.com/reader/full/an-analytical-model-of-spark-ignition-engine-for-performance-prediction 38/74
Al-Farayedhi et al [19] investigated the effect of using unleaded gasoline–
ethanol blends on typical SI engine performance in order to replace leaded gasoline.
He founded that using of ethanol-blended fuel increase spark timing by average -1degree for E10 and -6 degree for E20 when comparing to gasoline. And also the
engine brake thermal efficiency is improved when compared to the leaded fuel.
3.14.2 Ethanol
Ethanol fuel is an alternative to gasoline. Anhydrous ethanol or ethanol without
water can be blended with gasoline in any concentration up to pure ethanol (E100) to
reduce the consumption of petroleum fuels, as well as to reduce air pollution. In
Brazil, ethanol-powered and flexible-fuel vehicles are manufactured to be capable of
operation by burning hydrated ethanol. In addition, flexible-fuel vehicles can run on
any mixture of hydrated ethanol and gasoline, as long as there is at least 20% of
ethanol. A few flexible-fuel systems, like the Hi-Flex, used by Renault and Fiat, can
also run with pure gasoline.Renault Clio is one of many vehicle models which are sold in Brazil. It is
equipped by Hi-Flex technology which allows using pure ethanol as fuel with full
efficiency due to the automatic adjustment on engine system. The power curve of Clio
increases only 1 horsepower throughout engine speed range when using ethanol. And
also, information from [20] indicates that the proper timing for an ethanol engine is
five to eight degrees advanced from the optimum gasoline setting.
3.14.3 Compressed Natural Gas (CNG)
CNG is a substitute for gasoline or diesel fuel. It is considered to be an
environmentally "clean" alternative to those fuels. It comprises mainly methane (CH4)
and ethane (C2H6). It is stored and distributed in hard containers, usually cylinders,
and keeped under high pressure. In response to high fuel prices and environmentalconcerns, compressed natural gas is starting to be used in light-duty passenger
vehicles and pickup trucks, medium-duty delivery trucks, and in transit and school
buses. The properties of natural gas are shown in Table 3-4
TABLE 3-4 Summaries of major properties of methane, ethane, and natural gas [21]
Properties Methane
(CH4)
Ethane
(C2H6)
Natural Gas
(CH3.76) [20]
Heating value (kJ/kg) 50,100 47,400 49,500
Stoichiometric air/fuel ratio 17.16 16 16.9
Mello et al [21] evaluated the maximum horsepower in many vehicles which
were converted to use both natural gas and gasoline, so called “bi-fuel vehicle”. They
founded that there is substantial drop in horsepower 13-17% when using the natural
gas with electronically lambda control. However, emissions are reduced dramatically.
The drop of power came from using of gas mixer which restricts air flow through
manifold. And also the natural gas is gaseous fuel which occupies a larger volume
than liquid fuel. It causes reduction of η v. Not only that, spark advanced angle is
needed to increase about 21-25 degree in order to obtain the maximum output due to
low burning rate.
24

8/3/2019 An Analytical Model of Spark Ignition Engine for Performance Prediction
http://slidepdf.com/reader/full/an-analytical-model-of-spark-ignition-engine-for-performance-prediction 39/74
3.14.4 Liquefied Petroleum Gas (LPG)
LPG comprises primarily propane (C3H8) and mixed by butane (C4H10). LPG is
mainly used in household, industries and transportation respectively. LPG can be produced from crude oil and natural gas. However, the composition between propane
and butane depends on the sources. The characteristics of LPG are summarized in
Table 3-5.
TABLE 3-5 Summaries of major properties of propane, butane, and LPG [22]
Properties Propane
(C3H8)
Butane
(C4H10)
LPG
(97.6%C3H8) [21]
Heating value (kJ/kg) 46,000 45,400 45,900
Stoichiometric air/fuel ratio 15.6 15.4 15.6
Caton et al [22] developed a dedicated LPG fueled engine from production car.They founded that torque drops about 10-12% when using LPG without any enhanced
modification. The reason of performance reduction came from using the gaseous fuel
which decreases η v. For spark timing, LPG needs an advanced spark timing usually
around +10 degree due to slower burning rate [23].
25
8/3/2019 An Analytical Model of Spark Ignition Engine for Performance Prediction
http://slidepdf.com/reader/full/an-analytical-model-of-spark-ignition-engine-for-performance-prediction 40/74
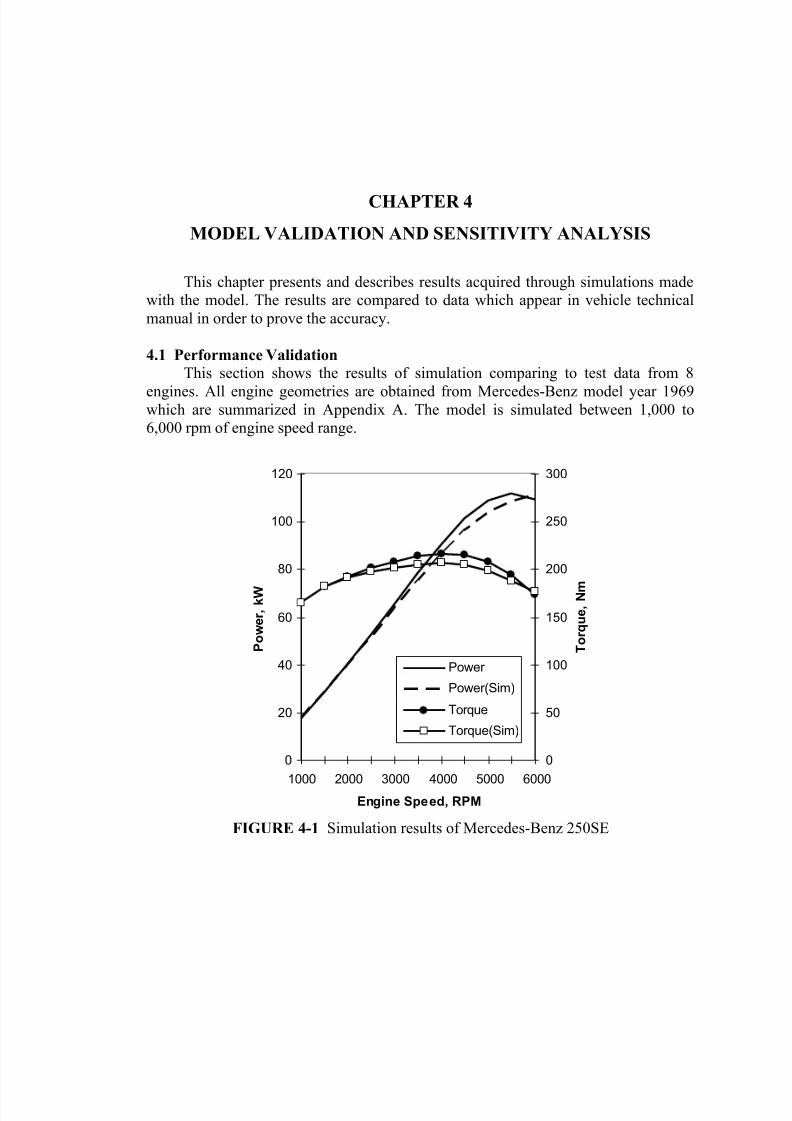
CHAPTER 4
MODEL VALIDATION AND SENSITIVITY ANALYSIS
This chapter presents and describes results acquired through simulations made
with the model. The results are compared to data which appear in vehicle technical
manual in order to prove the accuracy.
4.1 Performance Validation
This section shows the results of simulation comparing to test data from 8
engines. All engine geometries are obtained from Mercedes-Benz model year 1969which are summarized in Appendix A. The model is simulated between 1,000 to
6,000 rpm of engine speed range.
0
20
40
60
80
100
120
1000 2000 3000 4000 5000 6000Engine Speed, RPM
P o w e r , k W
0
50
100
150
200
250
300
T o r q u e , N m
Power
Power(Sim)
Torque
Torque(Sim)
FIGURE 4-1 Simulation results of Mercedes-Benz 250SE

8/3/2019 An Analytical Model of Spark Ignition Engine for Performance Prediction
http://slidepdf.com/reader/full/an-analytical-model-of-spark-ignition-engine-for-performance-prediction 41/74
0
20
40
60
80
100
120
1000 2000 3000 4000 5000 6000
Engine Speed, RPM
P o w e r , k W
0
50
100
150
200
250
300
350
T o r q u e ,
N m
Power
Power(Sim)
Torque
Torque(Sim)
FIGURE 4-2 Simulation results of Mercedes-Benz 250SL
0
20
40
60
80
100
120
1000 2000 3000 4000 5000 6000
Engine Speed, RPM
P o w e r , k W
0
50
100
150
200
250
300
350
400
T o r q u e , N m
Power
Power(Sim)
Torque
Torque(Sim)
FIGURE 4-3 Simulation results of Mercedes-Benz 250E/8
27

8/3/2019 An Analytical Model of Spark Ignition Engine for Performance Prediction
http://slidepdf.com/reader/full/an-analytical-model-of-spark-ignition-engine-for-performance-prediction 42/74
0
20
40
60
80
100
120
140
1000 2000 3000 4000 5000 6000
Engine Speed, RPM
P o w e r , k W
0
50
100
150
200
250
300
350
400
T o r q u e ,
N m
Power
Power(Sim)
Torque
Torque(Sim)
FIGURE 4-4 Simulation results of Mercedes-Benz 280SE/8
0
30
60
90
120
150
1000 2000 3000 4000 5000 6000
Engine Speed, RPM
P o w e r , k W
0
80
160
240
320
400
T o r q u e ,
N m
Power
Power(Sim)
Torque
Torque(Sim)
FIGURE 4-5 Simulation results of Mercedes-Benz 280SL/8
28

8/3/2019 An Analytical Model of Spark Ignition Engine for Performance Prediction
http://slidepdf.com/reader/full/an-analytical-model-of-spark-ignition-engine-for-performance-prediction 43/74
0
30
60
90
120
150
1000 2000 3000 4000 5000 6000
Engine Speed, RPM
P o w e r , k W
0
80
160
240
320
400
T o r q u e ,
N m
Power
Power(Sim)Torque
Torque(Sim)
FIGURE 4-6 Simulation results of Mercedes-Benz 300SEL/8
0
30
60
90
120
150
1000 2000 3000 4000 5000 6000
Engine Speed, RPM
P o w e r , k W
0
80
160
240
320
400
T o r q u e ,
N m
Power Power(Sim)
Torque
Torque(Sim)
FIGURE 4-7 Simulation results of Mercedes-Benz 300SEL
29
8/3/2019 An Analytical Model of Spark Ignition Engine for Performance Prediction
http://slidepdf.com/reader/full/an-analytical-model-of-spark-ignition-engine-for-performance-prediction 44/74
0
40
80
120
160
200
1000 2000 3000 4000 5000 6000
Engine Speed, RPM
P o w e r , k W
0
200
400
600
800
T o r q u e , N m
Power
Power(Sim)
Torque
Torque(Sim)
FIGURE 4-8 Simulation results of Mercedes-Benz 600
According to the results from Fig.4-1 to Fig.4-8, torque and power
characteristics at low and high speed are almost the same to reference data for all
cases. There are some cases greater at high speed. But all graphs are lower at midrange. When considering relative errors which are summarized from simulation
results of 8 engines in Fig.4-9, overall errors are in between -6% to 4%. But at low
and high engine speed, the error values are in positive side. While the error values in
negative side occur in mid engine speed.
-10
-8
-6
-4
-2
0
2
4
6
8
10
0 1000 2000 3000 4000 5000 6000 7000
Engine Speed (RPM)
%
FIGURE 4-9 Summarized relative errors from simulation results of 8 engines
30

8/3/2019 An Analytical Model of Spark Ignition Engine for Performance Prediction
http://slidepdf.com/reader/full/an-analytical-model-of-spark-ignition-engine-for-performance-prediction 45/74
According to the results, the model can interpret the output engine performance
very well. The errors might come from inadequate information which has to be
assumed such as pressure losses in the intake system, temperature inside manifold,exhaust gas temperature, etc. And also some effects which are not included in the
model such as tuning, ram effect, exhaust stroke, and exhaust valve. However, the
next section is going to determine the effects of each parameter in order to find which
parameter has to be studied seriously in the future.
4.2 Sensitivity Analysis
This section is going to determine the sensitivity of the model affected by each
parameter.
4.2.1 Burning Duration
This section is going to determine the effects of changing the gasoline burning
duration from Eq.3-6 by increasing and decreasing 10 degree of burning durationwhile keeping the optimum gasoline spark advanced setting.
0
20
40
60
80
100
120
1000 2000 3000 4000 5000 6000
Engine Speed, RPM
P o w e r , k W
Gasoline
+10 deg-10 deg
-2.5
-2
-1.5
-1
-0.5
0
0.5
1
1.5
1000 2000 3000 4000 5000 6000
Engine Speed, RPM
%+10 deg
-10 deg
(a) (b)
FIGURE 4-10 Comparison between gasoline and +/-10 degree modified combustion
range without spark advanced adjusting (a) output power; (b) relative
power gain
Results from Fig.4-10a indicate that power curves are almost the same when
increasing and decreasing 10 degree of combustion range. When considering the
relative power gain in Fig.4-10b, 10 degree increasing reduces power gradually from
1.4% to 2.0%, while 10 degree decreasing raises power gradually up to 0.9%
maximum except at low speed. These results roughly indicate that shorter combustion
time brings better performance to engine. The wave-liked curves cause from
inappropriate spark advanced timing. So adjusting the spark timing is the next thing to
study.
31

8/3/2019 An Analytical Model of Spark Ignition Engine for Performance Prediction
http://slidepdf.com/reader/full/an-analytical-model-of-spark-ignition-engine-for-performance-prediction 46/74
-2.5
-2
-1.5
-1
-0.5
0
0.5
1
1.5
2
1000 2000 3000 4000 5000 6000Engine Speed, RPM
%
+10 deg
-10 deg
+10 deg optimum
-10 deg optimum
FIGURE 4-11 Relative errors of before and after adjusting the spark timing
According to Fig.4-11, adjusting the optimum spark timing increases power in
both cases. For 10 degree increasing, power shifts up average 0.5% due to more 5
degree advanced adjusting. And 10 degree decreasing case, power shifts up average
0.7% due to less 5 degree advanced adjusting. It can conclude that changing of
combustion duration affects to the output performance. But it does not affect much
and also it has no any effect to η v. Only one thing affected is the spark advanced
angle.
4.2.2 Discharge coefficientThis section is going to determine the effects of changing the discharge
coefficient from Eq.3-18 by increasing and decreasing 10%.
0
20
40
60
80
100
120
140
1000 2000 3000 4000 5000 6000
Engine Spee d, RPM
P o w
e r , k W
Normal
+10% Cd-10% Cd
-10
-8
-6
-4
-2
0
2
4
6
8
10
1000 2000 3000 4000 5000 6000
Engine Speed, RPM
%
+10% Cd
-10% Cd
(a) (b)
FIGURE 4-12 Comparison between normal C D and +/-10% changing
(a) output power; (b) relative power gain
32

8/3/2019 An Analytical Model of Spark Ignition Engine for Performance Prediction
http://slidepdf.com/reader/full/an-analytical-model-of-spark-ignition-engine-for-performance-prediction 47/74
According to Fig.4-12a, output powers do not look different much at low and
mid engine speed. But at high engine speed, less C D value causes lower power than
normal, while greater C D value causes greater power than normal. When consideringrelative power gain in Fig.4-12b, less C D value causes more power a bit at low and
mid engine speed, while greater C D value causes less power. For high engine speed,
the results are explicitly the same as in Fig.4-12a.
When considering Eq.3-15, less C D value causes less pT due to less mass flow
into the cylinder during intake stroke. With this reason, total mass flow in is increased
a bit at the end of intake process. But at high speed, lesser magnitude of pT does not
affect to mass flow rate any more due to choking which limits the mass flow rate. So
less C D value limits mass flow into the cylinder itself. The greater C D value gives
opposite results to the explanations above. However, changing of C D alters the output
performance very much only at high engine speed about +/-10%.
4.2.3 Frictional LossesThis section is going to determine the effect of non-applying frictional loss
factor (C f ) in Eq.3-15. p0 is kept at 1 atm constantly. Changing of p0 affects η v mainly.
So η v graph is considered in order to explain the effect.
0
20
40
60
80
100
120
140
160
1000 2000 3000 4000 5000 6000
Engine Speed, RPM
P o w e r ,
k W
With Cf
Without Cf
50
60
70
80
90
100
110
0 1000 2000 3000 4000 5000 6000 7000
Engine spee d, rpm
n v , %
Without Cf
With Cf
(a) (b)
FIGURE 4-13 Comparison between using and non-using C f
(a) output power; (b) η v
The using of ambient pressure gives the maximum possible power and
maximum η v to the engine. It is clearly that non-applying of the frictional losses
causes more power according to Fig.4-13a. When considering Fig.4-13b, η v curve is
increased also. The difference of η v increases gradually throughout the engine speed
range due to the assumption which defines more pressure drop for more speed.
However, η v increases up to 100.8% which might cause from accumulative sum of
error. The lower values of η v are still under interferences of charge heating, back flow
effect at low speed, and choking effect at high speed. So C f applying in Eq.3-15 is
reasonable.
33

8/3/2019 An Analytical Model of Spark Ignition Engine for Performance Prediction
http://slidepdf.com/reader/full/an-analytical-model-of-spark-ignition-engine-for-performance-prediction 48/74
4.2.4 Charge Heating
This section is going to determine the effect of non-applying charge heating
factor (C heat ) in Eq.3-15. T 0 is kept at 298 K constantly. Changing of T 0 affects η v mainly. So η v graph is considered in order to explain the effect.
0
20
40
60
80
100
120
140
1000 2000 3000 4000 5000 6000
Engine Spee d, RPM
P o w e r , k W
With Cheat
Without Cheat
50
60
70
80
90
100
110
0 1000 2000 3000 4000 5000 6000 7000
Engine speed, rpm
n v , %
Without Cheat
With Cheat
(a) (b)
FIGURE 4-14 Comparison between using and non-using C heat
(a) output power; (b) η v
The using of ambient temperature gives the maximum possible power and
maximum η v to the engine. It is clearly that non-applying of the charge heating causes
more power according to Fig.4-14a. When considering Fig.4-14b, η v curve is
increased also. The difference of η v reduces gradually throughout the engine speed
range due to the assumption which defines less heat transfer for more speed.
However, η v increases up to 101.6% which might cause from accumulative sum of
error. The lower values of η v are still under interferences of frictional losses, back
flow effect at low speed, and choking effect at high speed. So C heat applying in Eq.3-
15 is reasonable.
4.2.5 Exhaust Gas Temperature
The exhaust gas temperature, Eq.3-21, is used to determine the residual masswhich is affected to η v as mentioned in Sec.3.9. This section is going to determine the
effects of changing the exhaust gas temperature (T exh) by increasing and decreasing
temperature 50 K.
34

8/3/2019 An Analytical Model of Spark Ignition Engine for Performance Prediction
http://slidepdf.com/reader/full/an-analytical-model-of-spark-ignition-engine-for-performance-prediction 49/74
0
20
40
60
80
100
120
140
1000 2000 3000 4000 5000 6000Engine Spee d, RPM
P o w e r , k W
Normal
+50 K Texh-50 K Texh
-0.2
-0.15
-0.1
-0.05
0
0.05
0.1
1000 2000 3000 4000 5000 6000
Engine Spee d, RPM
%
+50 K Texh
-50 K Texh
(a) (b)
FIGURE 4-15 Comparison between normal and +/-50 K exhaust gas temperature
(a) output power; (b) relative power gain
According to Fig.4-15a, output powers are almost the same in both cases. When
considering Fig.4-15b, Increasing of T exh raises power up to 0.85%, while reduction of
T exh reduces power up to 0.14%. Increasing of T exh reduces the residual mass
according to ideal gas equation of state, mRT PV = , and increases η v. While
reduction of T exh gives opposite results. These results agree with explanations in [6].
4.3 Combustion Duration of Alternative fuels
This section is going to interpret the results of simulation in order to determine
the combustion duration of the alternative fuels.
4.3.1 Ethanol-blended Gasoline or Gasohol
60
65
70
75
80
85
90
0 1000 2000 3000 4000 5000
Engine speed, rpm
n v , %
Gasoline
E10
E20
FIGURE 4-16 Effect of ethanol-blended fuel on volumetric efficiency
35

8/3/2019 An Analytical Model of Spark Ignition Engine for Performance Prediction
http://slidepdf.com/reader/full/an-analytical-model-of-spark-ignition-engine-for-performance-prediction 50/74
0
20
40
60
80
100
120
0 1000 2000 3000 4000 5000
C o m b u s t i o n D u r a t i o n , d e g
Gasoline
E10
E20
FIGURE 4-17 Combustion duration of gasoline, E10, and E20
Using of ethanol-blended gasoline introduces increasing of η v by average 2.7%for E10 and 4.3% for E20 as results in Fig.4-16. The results agree with [19].
Increasing of η v can compensate reduction of heating value and cause toque and
power gain. However, conditions of air/fuel ratio in [19] are rich mixture in all cases
which increase η v greater than stoich condition due to the excess fuel. So η v might be
lower than simulation results around 0.5-1% at stoich condition.
According to information of spark timing, it’s clear that combustion duration
increases in parallel as percentage of ethanol increase throughout engine speed range
as shown in Fig.4-17. The equations of combustion duration are shown below.
For E10
271.41)1000
(479.20)1000
(6429.1 2 ++−=Δ N N θ for 1000 ≤ N ≤ 6000 Eq.4-1
For E20
343.50)1000
(443.21)1000
(8571.1 2 ++−=Δ N N
θ for 1000 ≤ N ≤ 6000 Eq.4-2
10
20
30
40
50
60
70
80
90
100
110
1000 2000 3000 4000 5000 6000
Engine Speed, RPM
P o w e r , k W
Gasoline
E10
E20
0
0.5
1
1.5
2
2.5
3
1000 2000 3000 4000 5000 6000
Engine Speed, RPM
%
E10
E20
(a) (b)
FIGURE 4-18 Comparison between gasoline, E10, and E20 when using withunmodified engine (a) output power; (b) relative power gain
36

8/3/2019 An Analytical Model of Spark Ignition Engine for Performance Prediction
http://slidepdf.com/reader/full/an-analytical-model-of-spark-ignition-engine-for-performance-prediction 51/74
In Thailand, the gasohol is introduced through nation for a while. However, the
effects of using gasohol are still questioned. So the scenario is set to determine effect
of using E10 and E20 with unmodified spark ignition engine. The results are shown inFig.4-18. According to Fig.4-18a, the output powers seem to be almost the same. But
when considering in details, using gasohol brings more power both E10 and E20 as
shown in Fig.4-18b. The maximum power gains are about 2% for E10 and 2.5% for
E20 at low engine speed and gradually reduce through high engine speed. According
to the results, E10 and E20 can replace gasoline immediately in aspect of
performance. Nevertheless, the maximum efficiency cannot be achieved. However,
real experiments are needed to confirm the simulation results because the condition of
scenario is set to run under stoich condition which the ECU might not handle much
different air/fuel ratio of E20. This effect occurs also in transient driving. Many
drivers may feel that their vehicles have less acceleration when using E10. It causes
from ECU of feedback fuel control system getting “hesitation”. So if the ECU is not
designed to be smart enough, this problem might appear even steady state running.
4.3.2 Ethanol
40
50
60
70
80
90
100
0 1000 2000 3000 4000 5000 6000 7000
Engine speed, rpm
n v , %
Gasoline
E100
FIGURE 4-19 Effect of ethanol as a fuel on volumetric efficiency
0
20
40
60
80
100
120
0 1000 2000 3000 4000 5000
C o m b u s t i o n D u r a t i o n , d e g
Gasoline
E10
E20
E100
FIGURE 4-20 Combustion duration of gasoline, E10, E20, and E100
37

8/3/2019 An Analytical Model of Spark Ignition Engine for Performance Prediction
http://slidepdf.com/reader/full/an-analytical-model-of-spark-ignition-engine-for-performance-prediction 52/74
Using of ethanol as a fuel increases η v by average 7.2% as results in Fig.4-19.
Although increasing of η v can compensate reduction of heating value, the power and
torque do not take advantages much due to very low heating value and lowcombustion rate when comparing to gasoline. According to the results in Fig.4-20, the
combustion duration of ethanol does not much difference to E20. It might conclude
that the combustion lengths of E20 to E100 are almost the same. Only stoichiometric
air/fuel ratio is different which can be controlled by the Flex-fuel technology. The
equation of combustion duration is shown below.
For E100
787.52)1000
(178.21)1000
(6843.1 2 ++−=Δ N N
θ for 1000 ≤ N ≤ 6000 Eq.4-3
4.3.3 Compressed Natural Gas (CNG)
60
65
70
75
80
85
90
2500 3500 4500 5500
Engine speed, rpm
n v , %
Gasoline
CNG
FIGURE 4-21 Effect of CNG as a fuel on volumetric efficiency
0
20
40
60
80
100
120
140
160
0 1000 2000 3000 4000 5000
C o m b u s t i o n D u r a t i o n , d e g
Gasoline
CNG
FIGURE 4-22 Combustion duration of gasoline and CNG
38

8/3/2019 An Analytical Model of Spark Ignition Engine for Performance Prediction
http://slidepdf.com/reader/full/an-analytical-model-of-spark-ignition-engine-for-performance-prediction 53/74
According to Fig.4-21, it’s clear that using of gaseous fuel and gas mixer
introduce η v reduction as mentioned in [21]. It decreases about average 6.9%. Fig.4-
22 shows the combustion duration of CNG comparing to gasoline. The combustionrange of CNG is almost twice time of the gasoline. So when considering to use CNG
in both bi-fuel and dedicated system, spark timing adjusting is recommended. For bi-
fuel system, electronic control box is needed to control the spark timing during using
of CNG. The equation of CNG combustion duration is shown below.
For CNG
405.72)1000
(976.27)1000
(4286.2 2 ++−=Δ N N
θ for 1000 ≤ N ≤ 6000 Eq.4-4
4.3.4 Liquefied Petroleum Gas (LPG)
60
65
70
75
80
85
90
0 1000 2000 3000 4000 5000
Engine spee d, rpm
n v ,
%
Gasoline
LPG
FIGURE 4-23 Effect of ethanol as a fuel on volumetric efficiency
0
20
40
60
80
100
120
140
0 1000 2000 3000 4000 5000
C o m b u s t i o n D u r a t i o n , d e g
Gasoline
LPG
FIGURE 4-24 Combustion duration of gasoline and LPG
39

8/3/2019 An Analytical Model of Spark Ignition Engine for Performance Prediction
http://slidepdf.com/reader/full/an-analytical-model-of-spark-ignition-engine-for-performance-prediction 54/74
The results agree as mentioned in [22] when using gaseous fuel. η v decreases
about 3% average as shown in Fig.4-23. Caton et al [22] used sequential LPG gas
injection system for delivering fuel which sacrifices some performance due to the η v reduction. Combustion duration of LPG is greater than gasoline in Fig.4-24 and still
less than CNG. Nevertheless, using of LPG needs electronic control box in order to
adjust the spark timing as well. The equation of LPG combustion duration is shown
below.
For LPG
571.58)1000
(762.21)1000
(8095.1 2 ++−=Δ N N
θ for 1000 ≤ N ≤ 6000 Eq.4-5
40

8/3/2019 An Analytical Model of Spark Ignition Engine for Performance Prediction
http://slidepdf.com/reader/full/an-analytical-model-of-spark-ignition-engine-for-performance-prediction 55/74
CHAPTER 5
CONCLUSIONS AND SUGGESTIONS
5.1 Conclusions
An analytical model of spark ignition engine has been constructed based on
cylinder-by-cylinder engine model which combines both physical formulae, e.g.
engine geometries, and empirical formulae, e.g. burning duration. The engine
performance, torque and power, can be calculated by integrating the pressure inside
cylinder within one engine cycle.
In engine modeling, the model needs design parameters from real engine. It isthe same as 3-D engine model which needs the perfect 3-D geometry of combustion
chamber, valves, and ports in order to achieve the accuracy. The parameters which are
usually provided by commercial brochures are not enough for engine modeling.
The model is verified by data from 8 engine models. It can capture torque and
power characteristics very well. The overall errors are in between -6% to 4%. But the
error values at low engine speed occur in positive side, while most of error values
occur in negative side at mid and high engine speed. These errors might cause from
calculation itself, many assumptions and unknown phenomena which are not
considered yet such as the tuning, ram effect, exhaust stroke, and exhaust valve, etc.
There are significant changes to the performance curves when changing the
parameters which affect η v, for example, pressure and temperature. So η v affectsdominantly to the performance shapes because it represents how much the fuel is
drawn into the cylinder. But the prediction of η v is still very difficult. It is combined
result from a lot of parameters and many phenomena. If those phenomena can be
realized, the accuracy can be achieved.
The simulations in order to predict the burning duration of the alternative fuels
express many interesting information. All alternative fuels in this thesis have greater
combustion durations when compare to gasoline. Furthermore, the model indicates the
effects on η v when using these alternative fuels. Using of ethanol and ethanol blended
fuel can increase η v due to high latent heat value of ethanol itself. While using LPG
and CNG reduce η v due to gaseous fuels.
5.2 Suggestions
Eq.3-3, which is used for predicting the pressure inside cylinder, is derived from
close cycle. Kirkpatrick [5] made assumptions that compression and power strokes are
close system due to all valves closing and neglecting effects of incoming mixture
which is drawn into cylinder. Only Qin is considered as input for Eq.3-3. But Qin can
be determined only if mixture mass is known. Therefore, 1-D mass flow model, Eq.3-
12, is applied by comparing between ambient pressure and pressure inside cylinder.
Then pressure is determined to by amount of flow-in mass and fed back to pressure
comparing loop. However, the ambient pressure and also the ambient temperature are
influenced by frictional losses and charge heating respectively. So both topics should
be studied more in order to make better assumptions. For residual mass, theassumption should include other parameters as described in [6].

8/3/2019 An Analytical Model of Spark Ignition Engine for Performance Prediction
http://slidepdf.com/reader/full/an-analytical-model-of-spark-ignition-engine-for-performance-prediction 56/74
For part load condition, the throttle body model is needed to integrate into the
engine model. However, the real geometries of the throttle body, e.g. close angle,
maximum angle, inside throttle body diameter, are needed also in order to calculatethe mass flow through the throttle itself.
All equations which describe the combustion range of the alternative fuels
should be verified by experiment in order to prove model prediction accuracy.
However, the results from experiments may deviate from the predictions caused by
proportion of fuel mixture and also testing conditions.
In order to predict the output performance of engines which use the alternative
fuels, the model is needed to be revised due to the different technique of fuel
dispensing system, e.g. gas mixer, gas injector.
42

8/3/2019 An Analytical Model of Spark Ignition Engine for Performance Prediction
http://slidepdf.com/reader/full/an-analytical-model-of-spark-ignition-engine-for-performance-prediction 57/74
REFERENCES
1. Zeng, P. and Assanis, D. N. “The Development of a Computer-Based Teaching
Tool for Internal Combustion Engine Courses.” Proceedings of IMECE
2004. (2004).
2. Eriksson, L. and Andersson, I. “An Analytic Model for Cylinder Pressure in a
Four Stroke SI Engine.” SAE 2002 Transactions Journal of Engines. (2002)
: 726-733.
3. Kuo, P. S. “Cylinder Pressure in a Spark Ignition Engine: A Computational
Model.” Journal of Undergraduate Science. (1996) : 141-145.
4. Zeng, P., et al. “Reconstructing Cylinder Pressure of a Spark-Ignition Engine for
Heat Transfer and Heat Release Analyses.” Proceedings of ASME ICEF
2004. (2004).
5. Kirkpatrick, Allan. Internal Combustion Engine Thermodynamic. Available
from: http://www.engr.colostate.edu/~allan/thermo/page6/page6.html [2005,
November].
6. Heywood, J. B. Internal Combustion Engine Fundamentals. International edition.
Singapore, McGraw-Hill Book Company, c1988.
7. Ramstedt, Magnus. Cylinder-by-Cylinder Diesel Engine Modelling - A Torque-
based Approach. Master thesis, Dept. of Electrical Engineering, Linkopings
universitet, 2004.
8. Silverlind, Daniel. Mean Value Engine Modeling with Modelica. Master thesis,Dept. of Electrical Engineering, Linkopings universitet, 2001.
9. Tatschl, R., Wieser K. and Reitbauer, R. “Multidimensional Simulation of Flow
Evolution, Mixer Preparation and Combustion in a 4-Valve SI Engine.”
Proceedings of COMODIA. (1994) : 139-149.
10. Kleemann, A. P., Gosmany A. D. and Binder, K. B. “Heat Transfer in Diesel
Engines: A CFD Evaluation Study.” Proceedings of COMODIA. (2001) :
123-131.
11. Shaver, G. M., Roelle, M. and Gerdes, J. C. “Modeling Cycle-to-Cycle Coupling
in HCCI Engines Utilizing Variable Valve Actuation.” Proceedings of the
1st IFAC Symposium on Advances in Automotive Control. (2004) : 244-
249.12. Blair, G. P., McCartan, C. and Hermann, H. “The right lift.” Race Engine
Technology Magazine. Issues 009 (2005) : 44-52.
13. Takizawa, M., Uno, T., Oue, T., and Yura, T. “A Study of Gas Exchange Process
Simulation of an Automotive Multi-Cylinder Internal Combustion Engine.”
SAE Transaction. vol. 91 (1982).
14. Caton, J. A., and Heywood, J. B. “An Experiment and Analytical Study of Heat
Transfer in an Engine Exhaust Port.” Int. J. Heat Mass Transfer. vol 24, no.
4 (1981) : 581-595.
15. Barnes-Moss, H. W. “A designer’s viewpoint.” Proceedings of Conference on
Passenger Car Engines. (1975) : 133-147.
16. Pischinger, S. and Backer, H. Internal Combustion Engine Volume I. RWTHAachen, c2002.

8/3/2019 An Analytical Model of Spark Ignition Engine for Performance Prediction
http://slidepdf.com/reader/full/an-analytical-model-of-spark-ignition-engine-for-performance-prediction 58/74
17. Klein, M. and Eriksson, L. “Models, methods and performance when estimating
the compression ratio based on the cylinder pressure.” Proceedings of
CCSSE. (2002). 18. Orbital Engine Company. A literature review based assessment on the impacts of
a 10% and 20% ethanol gasoline fuel blend on non-automotive engines.
Available from:
http://www.deh.gov.au/atmosphere/fuelquality/publications/review-non-
automotive/pubs/review.pdf [2006, November].
19. Al-Farayedhi, A. A., Al-Dawood, A. M. and Gandhidasan, P. “Experimental
investigation of SI engine performance using oxygenated fuel.” Journal of
Engineering for Gas Turbines and Power. Vol. 126 (2004) : 178-191.
20. Converting gasoline engines to run on alcohol. Available from:
http://running_on_alcohol.tripod.com/id26.html [2006, December].
21. Mello, P., et al. “Evaluation of the maximum horsepower of vehicles convertedfor use with natural gas fuel.” Fuel. Vol. 85, Issues 14-15 (2006) : 2180-
2186.
22. Caton, J. A., McDermott, M. and Chona, R. “Development of a dedicated LPG-
fueled spark-ignition engine and vehicle for the 1996 propane vehicle
challenge.” SAE Transactions - Journal of Fuels and Lubricants. Section 4,
Vol. 106 (1998) : 792–805.
23. RPi Engineering Ltd. V8 Rover LPG information. Available from:
http://www.v8dualfuel.com/pdf/LPG_Info_2003.pdf [2006, December]
44

8/3/2019 An Analytical Model of Spark Ignition Engine for Performance Prediction
http://slidepdf.com/reader/full/an-analytical-model-of-spark-ignition-engine-for-performance-prediction 59/74
APPENDIX A
Engine Specifications

8/3/2019 An Analytical Model of Spark Ignition Engine for Performance Prediction
http://slidepdf.com/reader/full/an-analytical-model-of-spark-ignition-engine-for-performance-prediction 60/74
This appendix summarizes all engine specifications which are used for
simulation in this thesis
A.1 Mercedes-Benz 250SE (Model Year 1969) No. of Cylinders : 6
No. of Valves per Cylinder : 2
Displacement (cc.) : 2,500
Bore × Stroke (mm.) : 82 × 78.8
Compression Ratio : 9.3 : 1
Intake Valve Open before TDC (degree) : 11°
Intake Valve Close after BDC (degree) : 53°
Maximum Valve Lift (mm.) : 8
Inlet Valve Diameter (mm.) : 41.2
FIGURE A-1 Performance curve of Mercedes-Benz 250SE
A.2 Mercedes-Benz 250SL (Model Year 1969)
No. of Cylinders : 6
No. of Valves per Cylinder : 2
Displacement (cc.) : 2,500
Bore × Stroke (mm.) : 82 × 78.8
Compression Ratio : 9.5 : 1
Intake Valve Open before TDC (degree) : 11°
Intake Valve Close after BDC (degree) : 53°
Maximum Valve Lift (mm.) : 8
Inlet Valve Diameter (mm.) : 41.2
FIGURE A-2 Performance curve of Mercedes-Benz 250SL
46
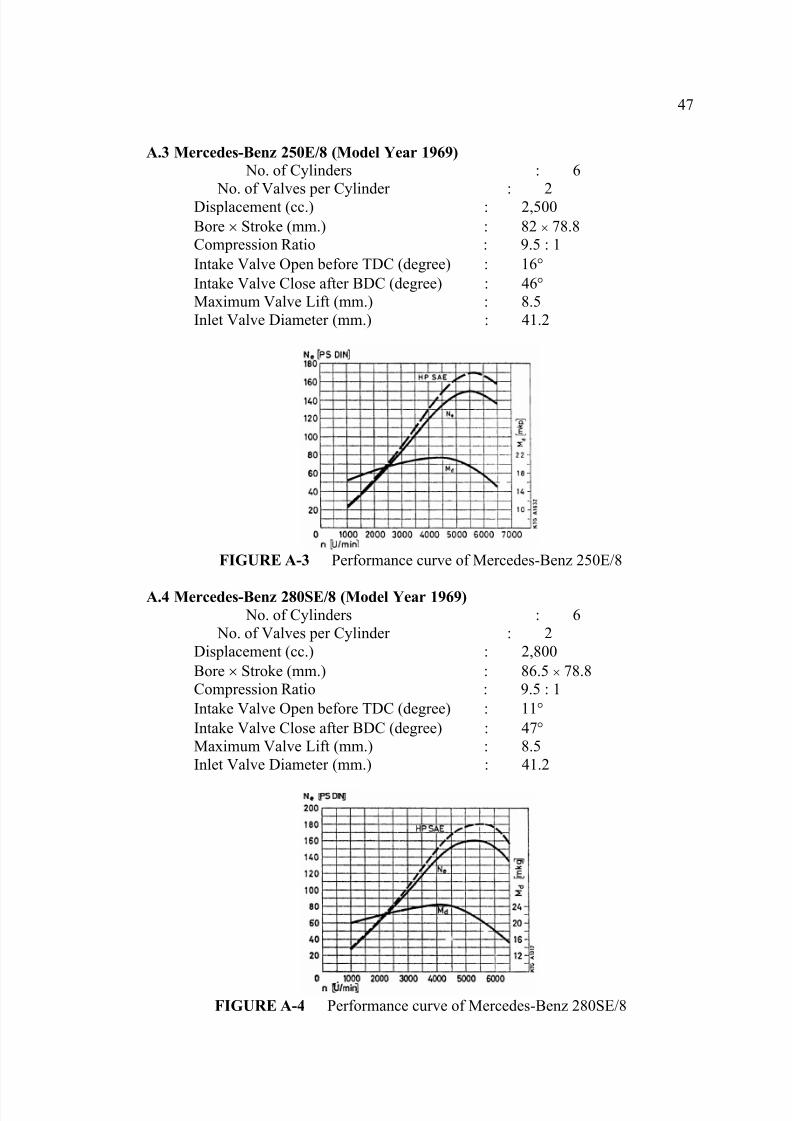
8/3/2019 An Analytical Model of Spark Ignition Engine for Performance Prediction
http://slidepdf.com/reader/full/an-analytical-model-of-spark-ignition-engine-for-performance-prediction 61/74
A.3 Mercedes-Benz 250E/8 (Model Year 1969)
No. of Cylinders : 6
No. of Valves per Cylinder : 2Displacement (cc.) : 2,500
Bore × Stroke (mm.) : 82 × 78.8
Compression Ratio : 9.5 : 1
Intake Valve Open before TDC (degree) : 16°
Intake Valve Close after BDC (degree) : 46°
Maximum Valve Lift (mm.) : 8.5
Inlet Valve Diameter (mm.) : 41.2
FIGURE A-3 Performance curve of Mercedes-Benz 250E/8
A.4 Mercedes-Benz 280SE/8 (Model Year 1969)
No. of Cylinders : 6
No. of Valves per Cylinder : 2
Displacement (cc.) : 2,800
Bore × Stroke (mm.) : 86.5 × 78.8
Compression Ratio : 9.5 : 1
Intake Valve Open before TDC (degree) : 11°
Intake Valve Close after BDC (degree) : 47°
Maximum Valve Lift (mm.) : 8.5
Inlet Valve Diameter (mm.) : 41.2
FIGURE A-4 Performance curve of Mercedes-Benz 280SE/8
47

8/3/2019 An Analytical Model of Spark Ignition Engine for Performance Prediction
http://slidepdf.com/reader/full/an-analytical-model-of-spark-ignition-engine-for-performance-prediction 62/74
A.5 Mercedes-Benz 280SL/8 (Model Year 1969)
No. of Cylinders : 6
No. of Valves per Cylinder : 2Displacement (cc.) : 2,800
Bore × Stroke (mm.) : 86.5 × 78.8
Compression Ratio : 9.5 : 1
Intake Valve Open before TDC (degree) : 12°
Intake Valve Close after BDC (degree) : 56°
Maximum Valve Lift (mm.) : 9
Inlet Valve Diameter (mm.) : 41.2
FIGURE A-5 Performance curve of Mercedes-Benz 280SL/8
A.6 Mercedes-Benz 300SEL/8 (Model Year 1969)
No. of Cylinders : 6
No. of Valves per Cylinder : 2
Displacement (cc.) : 2,800
Bore × Stroke (mm.) : 86.5 × 78.8
Compression Ratio : 9.5 : 1
Intake Valve Open before TDC (degree) : 12°
Intake Valve Close after BDC (degree) : 56°
Maximum Valve Lift (mm.) : 9
Inlet Valve Diameter (mm.) : 41.2
FIGURE A-6 Performance curve of Mercedes-Benz 300SEL/8
48
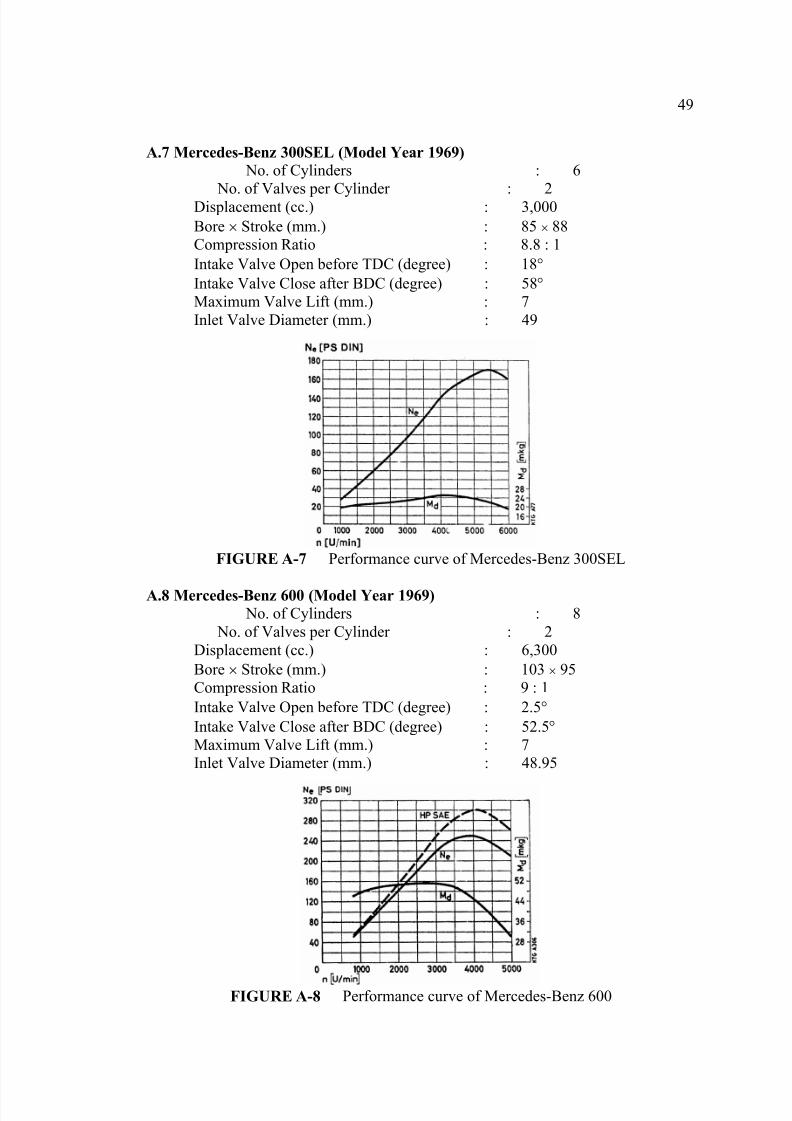
8/3/2019 An Analytical Model of Spark Ignition Engine for Performance Prediction
http://slidepdf.com/reader/full/an-analytical-model-of-spark-ignition-engine-for-performance-prediction 63/74
A.7 Mercedes-Benz 300SEL (Model Year 1969)
No. of Cylinders : 6
No. of Valves per Cylinder : 2Displacement (cc.) : 3,000
Bore × Stroke (mm.) : 85 × 88
Compression Ratio : 8.8 : 1
Intake Valve Open before TDC (degree) : 18°
Intake Valve Close after BDC (degree) : 58°
Maximum Valve Lift (mm.) : 7
Inlet Valve Diameter (mm.) : 49
FIGURE A-7 Performance curve of Mercedes-Benz 300SEL
A.8 Mercedes-Benz 600 (Model Year 1969)
No. of Cylinders : 8
No. of Valves per Cylinder : 2
Displacement (cc.) : 6,300
Bore × Stroke (mm.) : 103 × 95
Compression Ratio : 9 : 1
Intake Valve Open before TDC (degree) : 2.5°
Intake Valve Close after BDC (degree) : 52.5°
Maximum Valve Lift (mm.) : 7
Inlet Valve Diameter (mm.) : 48.95
FIGURE A-8 Performance curve of Mercedes-Benz 600
49

8/3/2019 An Analytical Model of Spark Ignition Engine for Performance Prediction
http://slidepdf.com/reader/full/an-analytical-model-of-spark-ignition-engine-for-performance-prediction 64/74
APPENDIX B
Matlab/Simulink Block Diagrams

8/3/2019 An Analytical Model of Spark Ignition Engine for Performance Prediction
http://slidepdf.com/reader/full/an-analytical-model-of-spark-ignition-engine-for-performance-prediction 65/74
51
F I G U R E B
- 1 M a i n m o d e l

8/3/2019 An Analytical Model of Spark Ignition Engine for Performance Prediction
http://slidepdf.com/reader/full/an-analytical-model-of-spark-ignition-engine-for-performance-prediction 66/74
FIGURE B-2 Cm block details
FIGURE B-3 Engine geometry block details
FIGURE B-4 Engine geometry/Vd block details
FIGURE B-5 Engine geometry/A(CA) block details
52

8/3/2019 An Analytical Model of Spark Ignition Engine for Performance Prediction
http://slidepdf.com/reader/full/an-analytical-model-of-spark-ignition-engine-for-performance-prediction 67/74
FIGURE B-6 Engine geometry/Crank geometry block details
FIGURE B-7 Engine geometry/V(CA),Vc block details
FIGURE B-8 Wiebe fn block details
FIGURE B-9 Burn duration block details
53

8/3/2019 An Analytical Model of Spark Ignition Engine for Performance Prediction
http://slidepdf.com/reader/full/an-analytical-model-of-spark-ignition-engine-for-performance-prediction 68/74
F I G U R E B - 1
0 P b l o c k
54

8/3/2019 An Analytical Model of Spark Ignition Engine for Performance Prediction
http://slidepdf.com/reader/full/an-analytical-model-of-spark-ignition-engine-for-performance-prediction 69/74
FIGURE B-11 P/Pratio block details
FIGURE B-12 P/Lv fn block details
FIGURE B-13 P/Cd block details
55

8/3/2019 An Analytical Model of Spark Ignition Engine for Performance Prediction
http://slidepdf.com/reader/full/an-analytical-model-of-spark-ignition-engine-for-performance-prediction 70/74
FIGURE B-14 P/mdot block details
FIGURE B-15 P/Cheat factor block details
FIGURE B-16 P/Cf factor block details
56
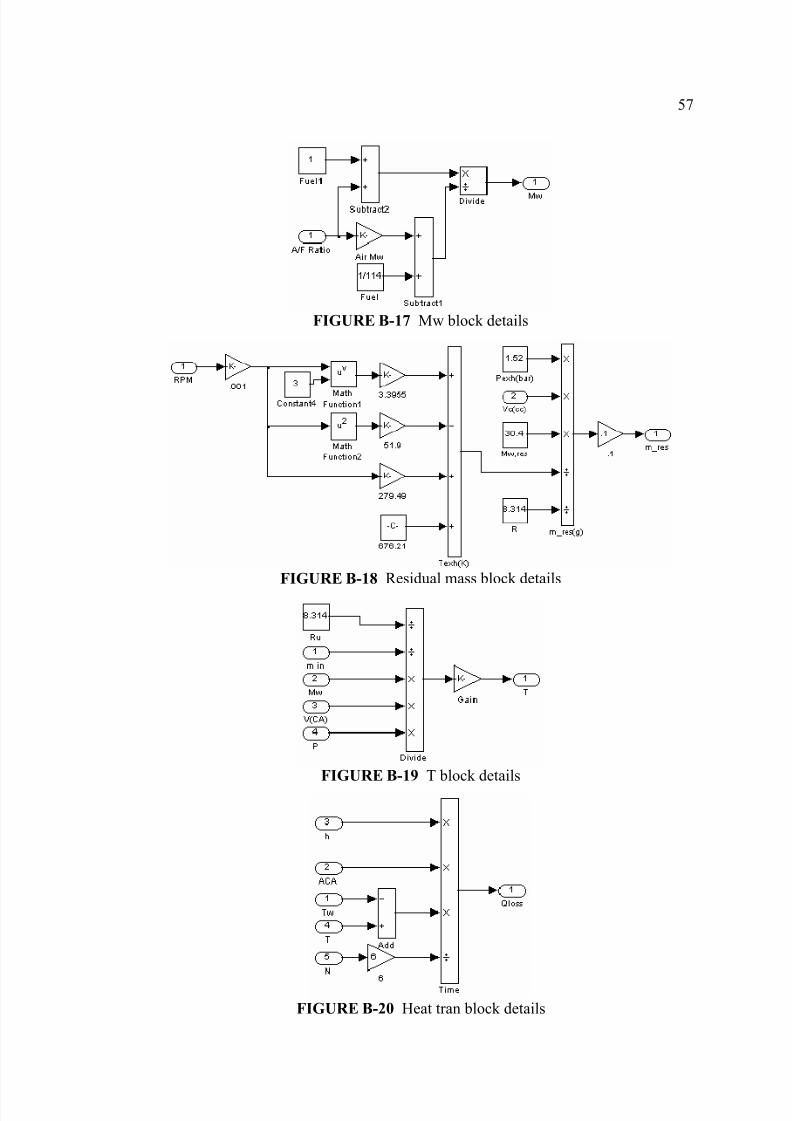
8/3/2019 An Analytical Model of Spark Ignition Engine for Performance Prediction
http://slidepdf.com/reader/full/an-analytical-model-of-spark-ignition-engine-for-performance-prediction 71/74
FIGURE B-17 Mw block details
FIGURE B-18 Residual mass block details
FIGURE B-19 T block details
FIGURE B-20 Heat tran block details
57

8/3/2019 An Analytical Model of Spark Ignition Engine for Performance Prediction
http://slidepdf.com/reader/full/an-analytical-model-of-spark-ignition-engine-for-performance-prediction 72/74
FIGURE B-21 h block details
FIGURE B-22 Work&Power block details
FIGURE B-23 Work&Power/Work block details
58

8/3/2019 An Analytical Model of Spark Ignition Engine for Performance Prediction
http://slidepdf.com/reader/full/an-analytical-model-of-spark-ignition-engine-for-performance-prediction 73/74
FIGURE B-24 Work&Power/FMEP block details
FIGURE B-25 Work&Power/Effective power block details
59
8/3/2019 An Analytical Model of Spark Ignition Engine for Performance Prediction
http://slidepdf.com/reader/full/an-analytical-model-of-spark-ignition-engine-for-performance-prediction 74/74
BIOGRAPHY
Name : Mr.Sitthichok Sitthiracha
Thesis Title : An Analytical Model of Spark Ignition Engine for
Performance Prediction
Major Field : Automotive Engineering
Biography
Mr.Sitthichok Sitthiracha has studied in King Mongkut's Institute of
Technology North Bangkok (KMITNB) since vocational school. It was first time for
him studying automotive vehicle. After that he studied Mechanical Engineering in
KMITNB. As undergraduate, he joined the cooperative education program which
gave chance to him for working in automotive industry about one year. Along the one
year program, he worked in many positions such as manufacturing & process
engineer, product engineer, and quality engineer. Then he got a bachelor degree in
Mechanical Engineering in 2003. After one year of graduate, he decided to study
Master degree in Automotive Engineering in KMITNB also. He was selected to have
an internship in South Korea about LPG retrofit on heavy duty truck engines and
engine testing for 4 months. He earned many experiences about engine technology
through practicalities which become the inspiration for this thesis.
60