An analysis of the drivers of child poverty now - GOV.UK
15
An analysis of the drivers of child poverty now Analysis of the characteristics that make it hard for families to escape poverty 26 th June, 2014
Transcript of An analysis of the drivers of child poverty now - GOV.UK

An analysis of the drivers of child poverty now
Analysis of the characteristics that make it hard for families to escape poverty
26th June, 2014

Analysis of the characteristics that make it hard for families to escape poverty
Contents
Introduction.......................................................................................................... 3
A greater intensity/prevalence of these characteristics leads to a greater
The prevalence of these characteristics has remained high over recent years,
The evidence review findings on what drives poverty ..................................... 4
Supporting work .................................................................................................. 6
The University of Essex – ‘Understanding Society Added Value Data Project’ 6 Office for National Statistics – ‘Analysis of longitudinal SILC data’................... 6
What we used the data for .................................................................................. 7
How we defined each of the drivers of poverty in our analysis ...................... 8
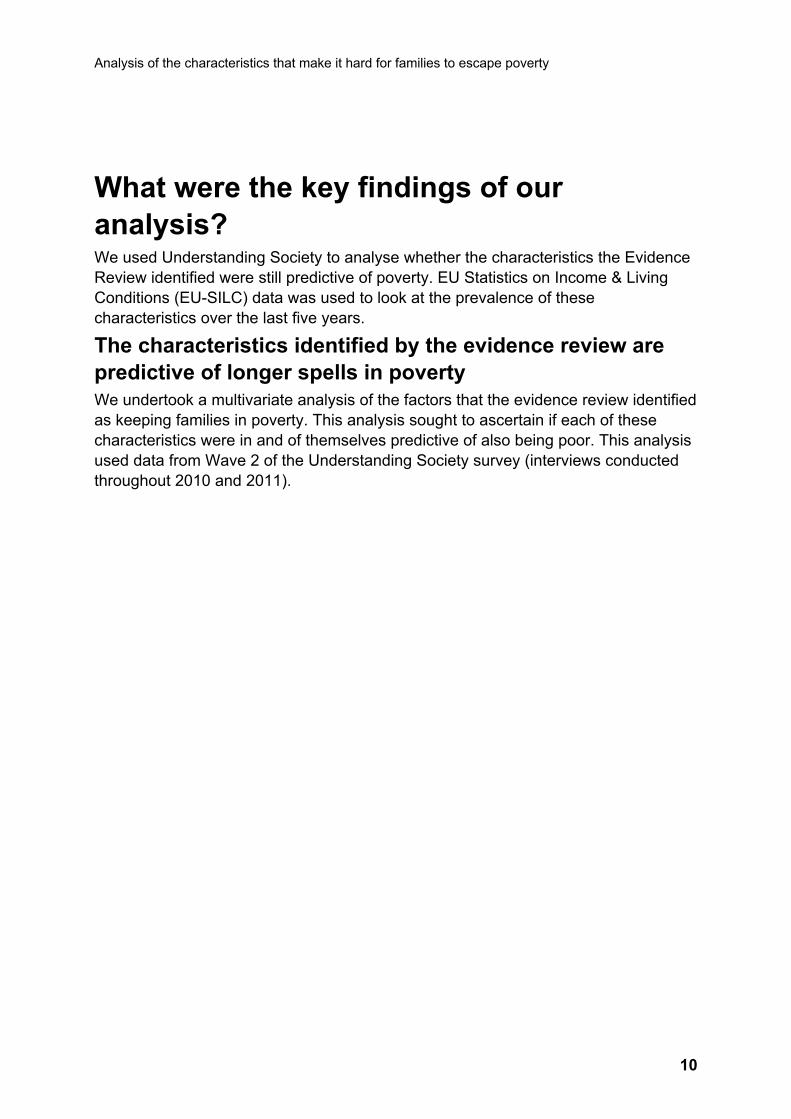
What were the key findings of our analysis? .................................................. 10
likelihood of low income.................................................................................. 12
as has the poverty risk associated with them ................................................. 13
Conclusion........................................................................................................... 15

Analysis of the characteristics that make it hard for families to escape poverty
Introduction To support the development of the Child Poverty Strategy, we (officials in the Child Poverty Unit) undertook a comprehensive evidence review, for which we examined a wide range of research from academia, Government departments, and private research institutions1. In it, we identify the key factors that make it harder for some families to get out of poverty. By identifying and understanding these root causes of child poverty, we can target action effectively.
The Evidence Review relied mainly on pre-2008 research. We therefore conducted a brief piece of analysis using more up-to-date sources of longitudinal data, to ensure the Review’s findings were still valid. Where it was possible to test the review’s findings, we found strong support from this analysis.
This paper presents a high-level summary of what we were able to conclude. We did not intend this to be a comprehensive poverty analysis - rather a short and high-level validation exercise. For our full conclusions of what drives child poverty now and in the future, please consult the Evidence Review.
1 The evidence review, which also identifies the factors that cause poor children to become poor adults, was published in February alongside the draft Strategy. It is available here: https://www.gov.uk/government/uploads/system/uploads/attachment_data/file/285389/Cm_8781_Child _Poverty_Evidence_Review_Print.pdf
3

Analysis of the characteristics that make it hard for families to escape poverty
The evidence review findings on what drives poverty The diagram below demonstrates which family characteristics the evidence review identified as playing key roles in causing longer spells of poverty2 and attempts to illustrate how these influences take effect.
Figure 1: Increased likelihood of child being in low income according to several family characteristics
The main factor is lack of sufficient income from parental employment, which restricts the amount of earnings a household has. This is not just about worklessness, but also working insufficient hours and/or low pay. This in turn is often caused by:
Long-term worklessness, increasing difficulties in returning to work, including skill loss, employer bias and changes in attitudes to work.
Low parental qualifications limiting an adult’s level of wages.
2 Throughout the evidence review we primarily used relative low income (equivalised for household size and composition) to define poverty. Relative low income is defined as children living in households which have less than 60% of the median income. This adjusts income for household size and composition.
4

Analysis of the characteristics that make it hard for families to escape poverty
Parental ill health or family instability which can both reduce the number of parents whose earnings contribute to income, and may also mean the remaining parent is more restricted in terms of employment due to caring responsibilities either for the child or the disabled family member.
Family size, with larger families requiring higher levels of income to avoid poverty. It can also restrict parental employment due to caring responsibilities.
Parental drug & alcohol dependency, although only a small number of children are affected, the effects for these parents and children are profound.
5

Analysis of the characteristics that make it hard for families to escape poverty
Supporting work To help validate these findings, we commissioned/conducted two pieces of work, as detailed below.
The University of Essex – ‘Understanding Society Added Value Data Project’ We used the Understanding Society survey to carry out poverty analysis using more recent data. Understanding Society is a longitudinal survey that captures information every year about the social and economic circumstances and attitudes of people living in 40,000 UK households. Longitudinal surveys trace the changes in circumstances for the same individuals over time, in order to reveal the dynamics of poverty. Understanding Society is the biggest longitudinal UK survey of its kind, and therefore ideal for such analysis, as it allows us to look at the characteristics of families who stay in poverty for longer.
However, some of the variables (or family characteristics) that the evidence review identified as important correlates or drivers of poverty had missing information, and there was no net income variable available at the time. We commissioned the University of Essex (who are responsible for this survey) to impute these variables and supply a net income variable – the main output from the work being the final, completed dataset.
Office for National Statistics – ‘Analysis of longitudinal SILC data’ We asked the ONS to conduct some longitudinal analysis using EU Statistics on Income and Living Conditions (EU-SILC) data, which comes from the General Lifestyle Survey (GLF). Whilst the GLF is smaller than Understanding Society, it has captured longitudinal information on household characteristics and incomes since 2006. This enabled us to validate our work on Understanding Society and to look across several years, which Understanding Society could not (there being only two years of data available at the time we were conducting the analysis). The main output from this work was a small dataset showing the proportion of children with each permutation of characteristics and/or being in low income for one or two years, from 2006 to 2011.
6

Analysis of the characteristics that make it hard for families to escape poverty
What we used the data for We used these two sources of data to analyse:-
what proportion of children live in households with characteristics which the evidence review concluded were predictive of being stuck in poverty – using EU-SILC and Understanding Society;
how has this changed over the last few years – using EU-SILC;
whether children who live in these households are more likely to be stuck in low income, and what other characteristics they possess – using Understanding Society outputs, due to the larger sample size.
7

Analysis of the characteristics that make it hard for families to escape poverty
How we defined each of the drivers of poverty in our analysis The following table contains a brief description of how we defined each of the key characteristics that were predictive of poverty, as well as low income, in our analysis.
Figure 2: Our definition of poverty drivers (characteristics) as measured using Understanding Society and the General Lifestyle Survey
Characteristic Definition Proportion of children in
2010-2011 with these
characteristics (according to
Understanding Society)
Long-term worklessness
This includes all children where neither parent has been in paid employment for at least 12 months.
17%
Low parental qualifications
Due to slightly different questions on educational attainment, we had slightly different definitions across the two surveys. In the Understanding Society survey, ‘low parental qualifications’ includes any child living in a family where neither parent has qualifications above GCSE. In the GLF it includes any child living in a family where both parents have fewer than five GSCEs or a single AS-level.
23%
One-adult families
This includes any child living in a family where there is only one resident parent.
25%
Large families We have defined large families as those with three or more dependent children. This is because evidence suggests that is the point at which a family is significantly more likely to be in low income.
30%
Low income We have defined poverty as living in a household that has below 60% of median income. Household income includes the sum, across all household members, of income (after the deduction of Income Tax and National Insurance Contributions) from employment and self-employment, investments and savings, private and occupational pensions, Social Security benefits and tax credits.
18%
8

Analysis of the characteristics that make it hard for families to escape poverty
The evidence review also identified parental drug and alcohol dependency, or parental ill health, as being predictive of longer spells in poverty. However, it was not possible to include these in our analysis. This was because:-
Parental drug and alcohol dependency is very difficult to gauge in a survey and, although its impacts are devastating, it affects too small a number of children to accurately measure.
The best measure of parental ill health and disability available in Understanding Society was self-declared. The survey asked respondents if they had any long-standing physical or mental impairment, illness or disability, and then whether these problems caused difficulty in a number of areas of the respondent’s life. This was not ideal, since it identified a large group without being specific about the severity of the ill health / disability.
9
Analysis of the characteristics that make it hard for families to escape poverty
What were the key findings of our analysis? We used Understanding Society to analyse whether the characteristics the Evidence Review identified were still predictive of poverty. EU Statistics on Income & Living Conditions (EU-SILC) data was used to look at the prevalence of these characteristics over the last five years.
The characteristics identified by the evidence review are predictive of longer spells in poverty We undertook a multivariate analysis of the factors that the evidence review identified as keeping families in poverty. This analysis sought to ascertain if each of these characteristics were in and of themselves predictive of also being poor. This analysis used data from Wave 2 of the Understanding Society survey (interviews conducted throughout 2010 and 2011).
10

Analysis of the characteristics that make it hard for families to escape poverty
The following chart shows the increased likelihood that a child is in relative low-income poverty, based on whether they have each of the characteristics below. For instance, a child in a long-term workless household is almost five times more likely to be in poverty than a child who is not (all other factors held equal).3
Figure 3: Increased likelihood of child being in low income according to having various family characteristics (source: Understanding Society survey, 2010-2011)
3 It should be noted that this regression analysis does not take account other characteristics known to be important in predicting poverty (such as previous time in poverty) and is therefore likely to overstate the increased likelihood of being in poverty for having each of these characteristics. It does however suggest that each of these characteristics is significantly associated with an increased likelihood of poverty, even when the other characteristics here are accounted for.
11
Analysis of the characteristics that make it hard for families to escape poverty
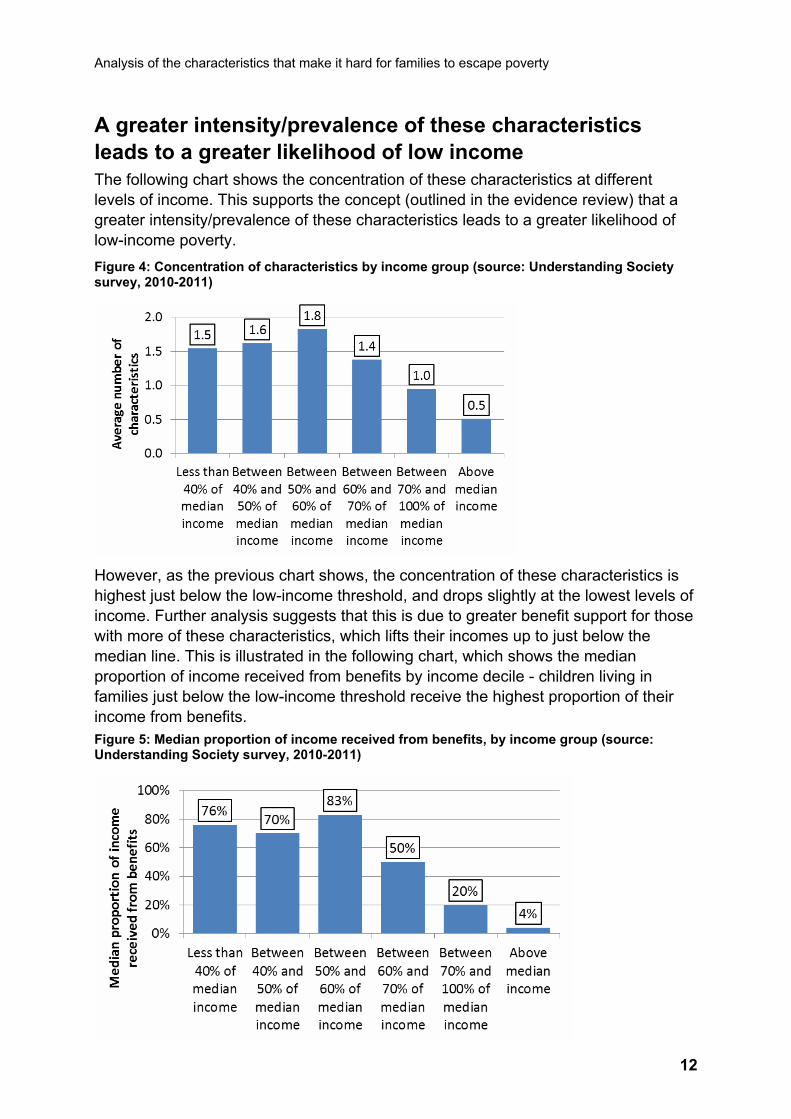
A greater intensity/prevalence of these characteristics leads to a greater likelihood of low income The following chart shows the concentration of these characteristics at different levels of income. This supports the concept (outlined in the evidence review) that a greater intensity/prevalence of these characteristics leads to a greater likelihood of low-income poverty.
Figure 4: Concentration of characteristics by income group (source: Understanding Society survey, 2010-2011)
However, as the previous chart shows, the concentration of these characteristics is highest just below the low-income threshold, and drops slightly at the lowest levels of income. Further analysis suggests that this is due to greater benefit support for those with more of these characteristics, which lifts their incomes up to just below the median line. This is illustrated in the following chart, which shows the median proportion of income received from benefits by income decile - children living in families just below the low-income threshold receive the highest proportion of their income from benefits. Figure 5: Median proportion of income received from benefits, by income group (source: Understanding Society survey, 2010-2011)
12

Analysis of the characteristics that make it hard for families to escape poverty
Living in a family with these characteristics leads to an increased likelihood of longer spells in poverty Finally, the following chart shows the concentration of characteristics based on whether a child was poor this year, last year, or both. Children who have been poor for two years have the highest concentration of these family characteristics, which further supports the concept that having these family characteristics leads to an increased likelihood of longer spells in poverty. Figure 6: Average number of factors by low-income status in current and previous year/wave (source: Understanding Society survey, 2009-2011)
The prevalence of these characteristics has remained high over recent years, as has the poverty risk associated with them ONS’s EU-SILC data was used to identify whether these characteristics were still as prevalent as they were five years ago, and whether they still carried the same apparent poverty risks.
13

Analysis of the characteristics that make it hard for families to escape poverty
The following chart shows how the proportion of children living in long-term workless or one-adult families has decreased by a few percentage points, whilst the proportion of children living in large families, or with parents with low qualifications (GCSE or below) has stayed broadly constant. All characteristics are still very prevalent.
Figure 7: Proportion of children living in a family that has one of the below characteristics (source: UK EU-SILC, 2006 – 2011)
The following chart shows how most of these characteristics carry a very slightly reduced risk of poverty in 2011 as compared with 2006, reflecting the overall reduction in poverty seen amongst all children, although there is some volatility over time. All characteristics carry at least twice the risk of poverty when compared with all children.
Figure 8: Proportion of children in poverty, by each of the following characteristics (source: UK EU-SILC, 2006 – 2011)
14

Analysis of the characteristics that make it hard for families to escape poverty
Conclusion Our high-level analysis showed that the characteristics identified by the Evidence Review continue to be prevalent and are still strongly associated with longer spells in poverty.
We, (the Child Poverty Unit) have commissioned the National Centre for Social Research to conduct a comprehensive analysis of ‘poverty transitions’. The work will use the latest, post-recession data from the Understanding Society survey, building upon the work we commissioned the University of Essex to carry out (improving the USoc data). It will examine what factors are associated with entries into and exits from poverty, and will include an in-depth focus on labour market variables and ethnic minority groups, amongst other areas of developing interest in poverty-dynamics research and analysis. It is expected that the final report will be published in the autumn of 2014. Early findings are available in this paper here.4
4 Child poverty transitions research - early findings report: https://www.gov.uk/government/publications/child-poverty-transitions-early-findings-report
15