AN ANALYSIS OF HISTROICAL TAGGING DATA TO ESTIMATE ...
17
SCRS/2014/089 Collect. Vol. Sci. Pap. ICCAT, 71(1): 342-358 (2015) AN ANALYSIS OF HISTROICAL TAGGING DATA TO ESTIMATE MIGRATION RATES FOR TROPICAL TUNA IN THE ATLANTIC: AN EXAMPLE USING BIGEYE TUNA (THUNNUS OBESUS) Michelle Sculley 1 , David Die 1 SUMMARY A spatially structured tagging model was modified from previous work by Aires-de-Silva (2009), Xiao (2006), and Hilborn (1990) and applied to conventional tagging data for bigeye tuna from the ICCAT tagging database. Bayesian posterior migration and catchability parameters were estimated for a four region model of the Atlantic Ocean. Estimates of catchability are larger in the eastern Atlantic Ocean and smaller in the western Atlantic. Migration parameters in the northwestern Atlantic are the best estimated, with the majority of the tagging data located in this area. Results show little movement from the northwestern Atlantic to other regions with a high residency rate of 0.74. Migration rates from regions the other three regions are poorly estimated and have a large standard error. An eight region model of the western Atlantic is proposed as a better model to estimate bigeye tuna movements in the Atlantic from currently available data. RÉSUMÉ Un modèle de marquage spatialement structuré a été modifié par rapport aux travaux antérieurs d'Aires-de-Silva (2009), de Xiao (2006) et de Hilborn (1990) et appliqué aux données de marquage conventionnel pour le thon obèse provenant de la base de données de marquage de l'ICCAT. Des paramètres bayésiens de migration et de capturabilité a posteriori ont été estimés pour un modèle de quatre régions de l'océan Atlantique. Les estimations de la capturabilité sont plus grandes dans l'océan Atlantique Est et plus petites dans l'Atlantique Ouest. Les paramètres de migration au Nord-Ouest Atlantique sont les mieux estimés, la majorité des données de marquage se situant dans cette zone. Les résultats montrent peu de mouvement de l'Atlantique Nord-Ouest vers d'autres régions avec un taux de résidence élevé de 0,74. Les taux de migration des trois autres régions sont mal estimés et comportent une grande erreur standard. Un modèle à huit régions de l'Atlantique Ouest est proposé comme un meilleur modèle pour estimer les déplacements du thon obèse dans l'Atlantique à partir des données actuellement disponibles. RESUMEN Se modificó un modelo de marcado estructurado espacialmente a partir de trabajos anteriores de Aires-de-Silva (2009), Xiao (2006) y Hilborn (1990) y se aplicó a los datos de marcado convencional para el patudo procedentes de la base de datos de marcado de ICCAT. Se estimaron parámetros de capturabilidad y migración posterior bayesianos para un modelo de cuatro regiones del océano Atlántico. Las estimaciones de capturabilidad eran mayores en el océano Atlántico oriental y menores en el Atlántico occidental. Los parámetros de migración en el Atlántico occidental norte son los mejor estimados, y la mayoría de los datos de marcado se localizan en esta zona. Los resultados muestran pocos movimientos del Atlántico occidental norte hacia otras regiones, con una tasa elevada de residencia (0,74). Las tasas de migración de las otras tres regiones están escasamente estimadas y tienen un gran error estándar. Se propone un modelo de ocho regiones del Atlántico occidental como el mejor modelo para estimar los movimientos del patudo en el Atlántico a partir de los datos actualmente disponibles. KEYWORDS Migrations, Tagging, Tuna fisheries, Bigeye tuna 1 Rosenstiel School, University of Miami, 4600 Rickenbacker C. Miami, FL, USA, Email: [email protected] 342
Transcript of AN ANALYSIS OF HISTROICAL TAGGING DATA TO ESTIMATE ...
SCRS/2014/089 Collect. Vol. Sci. Pap. ICCAT, 71(1): 342-358 (2015)
AN ANALYSIS OF HISTROICAL TAGGING DATA TO ESTIMATE MIGRATION
RATES FOR TROPICAL TUNA IN THE ATLANTIC: AN EXAMPLE USING
BIGEYE TUNA (THUNNUS OBESUS)
Michelle Sculley1, David Die1
SUMMARY
A spatially structured tagging model was modified from previous work by Aires-de-Silva
(2009), Xiao (2006), and Hilborn (1990) and applied to conventional tagging data for bigeye
tuna from the ICCAT tagging database. Bayesian posterior migration and catchability
parameters were estimated for a four region model of the Atlantic Ocean. Estimates of
catchability are larger in the eastern Atlantic Ocean and smaller in the western Atlantic.
Migration parameters in the northwestern Atlantic are the best estimated, with the majority of
the tagging data located in this area. Results show little movement from the northwestern
Atlantic to other regions with a high residency rate of 0.74. Migration rates from regions the
other three regions are poorly estimated and have a large standard error. An eight region
model of the western Atlantic is proposed as a better model to estimate bigeye tuna movements
in the Atlantic from currently available data.
RÉSUMÉ
Un modèle de marquage spatialement structuré a été modifié par rapport aux travaux
antérieurs d'Aires-de-Silva (2009), de Xiao (2006) et de Hilborn (1990) et appliqué aux
données de marquage conventionnel pour le thon obèse provenant de la base de données de
marquage de l'ICCAT. Des paramètres bayésiens de migration et de capturabilité a posteriori
ont été estimés pour un modèle de quatre régions de l'océan Atlantique. Les estimations de la
capturabilité sont plus grandes dans l'océan Atlantique Est et plus petites dans l'Atlantique
Ouest. Les paramètres de migration au Nord-Ouest Atlantique sont les mieux estimés, la
majorité des données de marquage se situant dans cette zone. Les résultats montrent peu de
mouvement de l'Atlantique Nord-Ouest vers d'autres régions avec un taux de résidence élevé de
0,74. Les taux de migration des trois autres régions sont mal estimés et comportent une grande
erreur standard. Un modèle à huit régions de l'Atlantique Ouest est proposé comme un meilleur
modèle pour estimer les déplacements du thon obèse dans l'Atlantique à partir des données
actuellement disponibles.
RESUMEN
Se modificó un modelo de marcado estructurado espacialmente a partir de trabajos anteriores
de Aires-de-Silva (2009), Xiao (2006) y Hilborn (1990) y se aplicó a los datos de marcado
convencional para el patudo procedentes de la base de datos de marcado de ICCAT. Se
estimaron parámetros de capturabilidad y migración posterior bayesianos para un modelo de
cuatro regiones del océano Atlántico. Las estimaciones de capturabilidad eran mayores en el
océano Atlántico oriental y menores en el Atlántico occidental. Los parámetros de migración
en el Atlántico occidental norte son los mejor estimados, y la mayoría de los datos de marcado
se localizan en esta zona. Los resultados muestran pocos movimientos del Atlántico occidental
norte hacia otras regiones, con una tasa elevada de residencia (0,74). Las tasas de migración
de las otras tres regiones están escasamente estimadas y tienen un gran error estándar. Se
propone un modelo de ocho regiones del Atlántico occidental como el mejor modelo para
estimar los movimientos del patudo en el Atlántico a partir de los datos actualmente
disponibles.
KEYWORDS
Migrations, Tagging, Tuna fisheries, Bigeye tuna
1 Rosenstiel School, University of Miami, 4600 Rickenbacker C. Miami, FL, USA, Email: [email protected]
342

Introduction Movement parameters of tropical tunas in the Atlantic are not well estimated. This is primarily due relatively few tagging studies performed in the Atlantic which were regional and often did not record tag recoveries outside of the region of interest. Additionally, movement information from tagging data is hindered by the often short time-at-liberty for tagged individuals. Tagging studies have shown that approximately 70% of tag returns in the Atlantic are within 30 days of tagging, which does not permit extensive movements (Hallier, 2005). The majority of movement information from these tagging studies includes time at liberty estimates, total distance traveled and general direction traveled (Hallier, 2005, Hallier, 2003, Kleiber & Hampton, 1994, Miyabe & Bard, 1986). Small scale daily movement estimates of the tropical tunas have been described using acoustic tagging methods, which provides information on daily depth distributions and movements around an archipelago or group of fish aggregating devices (Dagorn, et al. 2000, Dagorn, et al. 2007, Itano & Holland, 2000). However annual migration rates between large regions have yet to be estimated. In order to simulate a large scale tuna tagging program in the Atlantic Ocean, movement parameters of each tropical tuna species must be estimated for each region. These movement parameters will influence the number of tagged animals caught and reported in each region and may have a significant impact on the ability of a tagging program to estimate natural mortality and catchability of various fleets. A Bayesian model was used to estimate annual movement parameters for bigeye tuna using historical tagging data in the ICCAT statistical database. These estimates will then be used as priors for estimating migration rates in future analyses. Methods Tagging data were obtained from the International Commission for the Conservation of Atlantic Tuna conventional tagging database. Data from 1993 through 2003 were used, a period of time that included two tagging programs in the Atlantic Ocean. The MAC (Mattes de thons associes aux canneurs) program tagged approximately 3,000 bigeye tuna in the eastern Atlantic Ocean between 1993- 2000. The second tagging program, ICCAT’s Bigeye Tuna Year Program (BETYP) tagged an additional 1800 bigeye in 1999-2003. The last recorded tag recovery from these releases was in 2004. The tagging data were modeled in two ways: modeling the entire Atlantic Ocean consisting of four regions (Figure 1) and modeling just the Eastern Atlantic Ocean consisting of eight regions (Figures 2 and 11). Movements were estimated between four regions in the Atlantic Ocean, corresponding to major fishing grounds in the Atlantic. The north and south were divided by 7°N, and the east and west were divided by 35°W in the north and 32°W in the south. Region one corresponds with the northeast region and includes all fisheries in Northern Africa. Region two corresponds to the southeast Atlantic and includes all fisheries in the Gulf of Guinea. Region three corresponds to the southwest Atlantic and includes all of the Brazilian fisheries. Region four corresponds to the northwest Atlantic and includes the US and Canadian fleets, the Caribbean Sea and Gulf of Mexico, and the Venezuelan fisheries. In total, 8345 tuna were tagged during the 11 years in the analysis. In the four region model, 2159 of the 8345 tuna tagged were recovered. The majority of the recoveries were within three years, with one bigeye tuna released in 1995 and recovered ten years later in 2005. This data point was not included in this analysis. All other tag recoveries were within three years of the release. Aires-da-Silva et al. (2005, 2009) applied a spatially structured tagging model to estimate the movements of blue sharks in the North Atlantic Ocean using the maximum likelihood based framework of Hilborn (1990) and Xiao (1996). Their model structure was adapted to the bigeye data. Tag releases were broken down into tagging groups, defined as the fish released in a particular area in a particular year. There were 32 tag groups, with 11 releases in regions one and four, and five in regions two and three. The expected number of tag returns in each region, year, and tagging group was modeled as a function of the number of tags available to be caught in the region from the previous year times the fishing mortality and reporting rate:
𝐸𝐸𝐸𝐸𝑖𝑖,𝑦𝑦,𝑘𝑘 = 𝑁𝑁𝑁𝑁𝑁𝑁𝑁𝑁𝑖𝑖,𝑦𝑦,𝑘𝑘𝑞𝑞𝑘𝑘𝐸𝐸𝑦𝑦,𝑘𝑘𝐸𝐸
343

where ERi,y,k is the expected number of recoveries of tag group i in year y in area k; Ntagi,y,k is the predicted number of tagged fish of group i in year y in area k; qk is the catchability in area k; Ey,k is the effort in year y in area k; and R is the reporting rate. In model 1, the reporting rate was assumed to be one and constant between regions. In model two, reporting rate was allowed to vary for each region and values were based upon estimates from {Carruthers, 2010 #464}, with regions one and two set at 0.65, a intermediate of the reporting rates estimated for baitboats and purse seines, regions three and four were set to 0.4 the average longline reporting rate. Catchability was assumed to be constant over time in order to reduce time to convergence; however catchability could be allowed to vary between years to reduce residual variation. The predicted number of tagged fish of group i movements in year y in area k is a function of the number of fish tagged in the previous year in each area multiplied by the probability of capture, probability of survival, and the probability of moving into area k:
𝑁𝑁𝑁𝑁𝑁𝑁𝑁𝑁𝑖𝑖 ,𝑦𝑦+1,𝑘𝑘 = �𝑁𝑁𝑁𝑁𝑁𝑁𝑁𝑁𝑖𝑖,𝑦𝑦,𝑠𝑠(1 − 𝑒𝑒𝑞𝑞𝑠𝑠𝐸𝐸𝑠𝑠,𝑦𝑦)𝑒𝑒−(𝑀𝑀+𝜆𝜆)𝑝𝑝𝑠𝑠,𝑘𝑘
𝑛𝑛
𝑠𝑠=1
where ps,k is the migration rate of fish from area s to area k. Natural mortality (M) was fixed at 0.4 and tag loss (λ) was assumed to be negligible. The number of tagged fish in each area in year one for each tagging group was a function of the number of fish tagged times the probability of migration to each area from the tagging region to the recapture region. This allowed for the recovery of fish in regions other than the release region in the first year. Recoveries were calculated for a total of three years. The number of estimated migration parameters was reduced due to the constraint that ∑ 𝑝𝑝𝑠𝑠,𝑘𝑘 = 1.𝑘𝑘
1 A negative binomial likelihood was used to compute the likelihood of the observed number of recoveries given the estimated population dynamics parameters. Uninformative dirichlet priors with α=1 were used for migration parameters, and uninformative uniform priors were used for catchability parameters. The effort for each region and year was approximated by the total catch for each region and year from the ICCAT task I dataset. Each model was run in JAGS via R for 10 million iterations with a burn in of 50,000 iterations. Posterior distributions for migration rates (p) and catchability (q) were drawn from 1000 samples of the iterations, thinning to draw one sample out of every 10,000 iterations. Convergence was determined using the BRG diagnostics and quartiles. Results The fit of model one to the bigeye tuna conventional tagging data is in Figures 2 and 3. In general, the model overestimated the total number of recoveries. The model fit the data in region one the best (Figure 3a) and the other three regions the poorest. Model two reduced the number of expected tag returns overall, where tagging groups which released large numbers of tags generally underestimating numbers of tags returned and tagging groups with fewer numbers of tags released generally underestimating the number of tags returned (Figure 4).
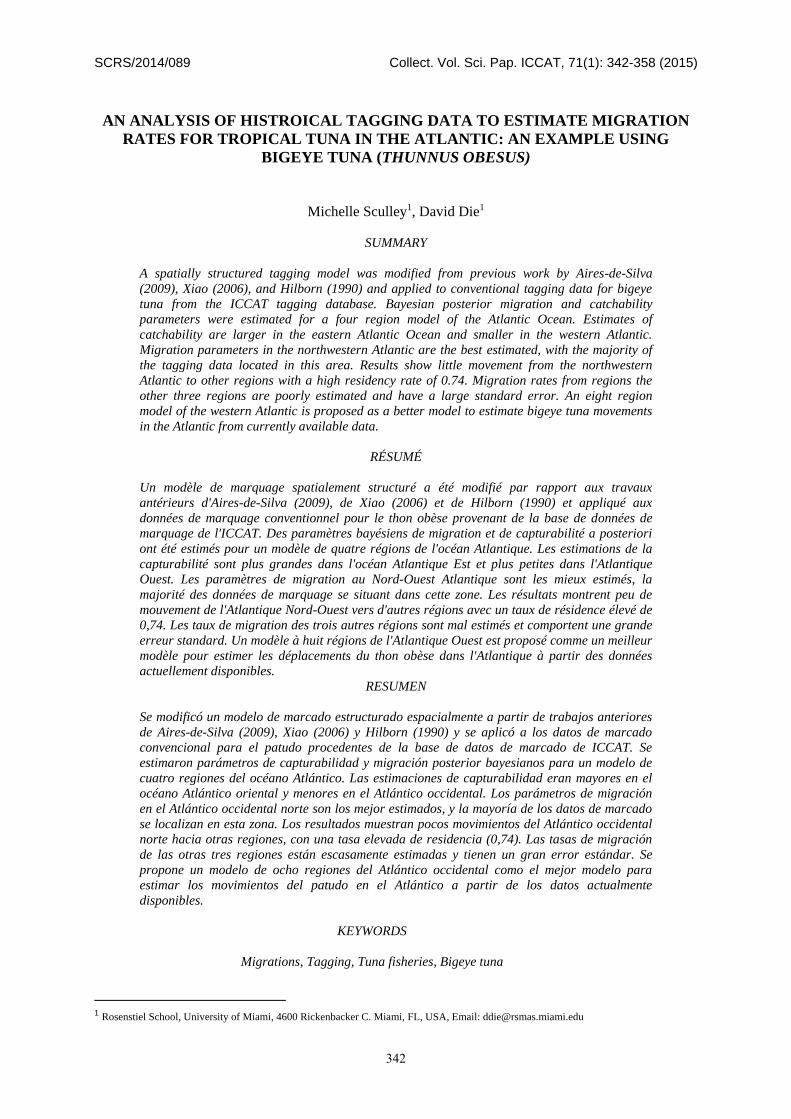
The parameter estimates, their standard error, and quartiles are presented in Table 1 (model one) and Table 2 (model two). Estimates of migration are not different between the two models, suggesting reporting rate does not influence the migration estimates. There are two different movement parameters estimated, the probability of staying in the original region, and the probability of leaving that region. The probability of staying, or the residence rate, is higher than or as high as any of the movement rates out of the region. This is especially true for regions one and two. Movement rates for regions three and four are poorly estimated, as evidenced by their large posterior density plot (Figures 6 to 9). Results suggest that there is little movement of bigeye tuna into or out of region one (Figure 4), with the probability of remaining in region one 0.74. However, there results indicate that there is a lot of movement of bigeye from regions three and four into regions two, three, and four. Catchability parameters are well estimated (Figure 5) for both models. Results for model one indicate that catchability is highest in regions one (3.2 x 10⁻⁵) and two (2.9 x 10⁻⁵) and lowest in regions three (2.0 x 10⁻⁷) and four (1.3 x 10⁻⁷) (Table 1). Model two catchability estimates are higher than those in model one for regions three (3.95 x 10⁻⁷) and four (1.98 x 10⁻⁷), but are similar from regions one and two (Table 2).
344

Discussion The overestimated number of tag returns in model one is likely due to the assumption that reporting rate is 100% and there is no tag loss. Estimates of return rates were much closer to the observed return rates in model two, although region one is still better estimated than any of the other three regions. Better results may be obtained by using a more realistic tag shedding rate or by setting a different rate for each region which is weighted by the proportion of the catch caught by each fleet. Reporting rates used in model two are just an average of the most important gear group in each region. Region one is the best estimated number of tag returns, as the majority of releases and recoveries are located there. Most of the years and regions have zero recoveries, and some had 100% recoveries. In general, the movement estimates into and out of region three and four are poorly estimated due to the few number of recoveries in the regions, two and five tags, respectively. These few numbers of tags in the western Atlantic suggest that a four region model for bigeye tuna may not be the most appropriate. Rather, an eight region model has been developed based upon statistical areas defined by Fonteneau,Ariz,Gaertner,Nordstrom and Pallares (2000) with addition of statistical areas around the Azores and Canary Islands (Figure 10). Future work will be using this eight region model to investigate the movements of bigeye tuna between these fishing grounds. The high residency rate for each of the regions may be due to seasonal movements of the bigeye tuna, which would not be visible in an annual time step. In order to tease apart annual and seasonal movements, the time step of the model would have to be reduced from years to months or quarters. This would further inflate the number of zeroes in the model, and would likely have some problems fitting the model due to the large number of zeroes in the data.
The model is designed to be able to add complexity and possibly account for more of the variability in the data. First, a constant catchability is used for each region; however, it is unlikely that catchability is constant in each year. The model allows for catchability to be estimated for each year and region. However, this would be difficult without the addition of more tagging data, as there is not enough data at present to estimate catchability rates by year. Additionally, it would be possible to estimate both migration and natural mortality, although these parameters would likely be confounded and difficult to estimate simultaneously (Hilborn, 1990). Instead, sensitivity analyses could be performed using different hypotheses on the natural mortality of bigeye tuna to investigate the impact of the natural mortality on the movement rates.
The movement of bigeye tuna from tagging data in the Atlantic has not yet been estimated quantitatively. This research has laid out a framework which would allow for the estimation of movements of tropical tunas both throughout the entire Atlantic as well as between smaller areas in the eastern Atlantic. It offers a good foundation for future work and application to both yellowfin tuna and skipjack tuna. Based upon initial assessment of the available tagging data, it would likely be most useful to estimate yellowfin tuna movements using the four region model presented above, while the eight region model in the Eastern Atlantic would likely be most appropriate for skipjack tuna. Furthermore, it may be appropriate to use a delta model to model the positive recoveries separately from the presence/absence data due to the large number of zeroes in the dataset. It may also be useful to remove tags which are returned within a short period of their release, which may not have had the time at large in order to make any movements from the area from which it was released, currently all tag data is included. This may reduce the residency rates for each region. Finally, incorporating the length of individual fish into the estimate of the probability of movement would likely add useful information to the model to determine if these movements are size or age based.
345

Literature cited
Aires-Da-Silva, A., Maunder, M.N., Gallucci, V.F., Kohler, N.E. and Hoey, J.J. (2009) A spatially structured tagging model to estimate movement and fishing mortality rates for the blue shark (Prionace glauca) in the North Atlantic Ocean. Marine and Freshwater Research, 60, 1029-1043.
Aires-Da-Silva, A., Taylor, I., Punt, A.E., Gallucci, V.F., Kohler, N.E., Turner, P., Briggs, R. and Hoey, J.J.
(2005) A Framework for estimating movement and fishing mortality rates of the blue shark, Prionace glauca, in the North Atlantic from tag-recapture data. Collected Volume of Scientific Papers ICCAT, 58, 1073-1086.
Dagorn, L., Bach, P. and Josse, E. (2000) Movement patterns of large bigeye tuna ( <i>Thunnus obesus ) in
the open ocean, determined using ultrasonic telemetry. Marine Biology, 136, 361-371. Dagorn, L., Holland, K.N. and Itano, D.G. (2007) Behavior of yellowfin (Thunnus albacares) and bigeye (T-
obesus) tuna in a network of fish aggregating devices (FADs). Marine Biology, 151, 595-606. Fonteneau, A., Ariz, J., Gaertner, D., Nordstrom, V. and Pallares, P. (2000) Observed changes in the species
composition of tuna schools in the Gulf of Guinea between 1981 and 1999, in relation with the Fish Aggregating Device fishery. Aquatic Living Resources, 13, 253-257.
Hallier, J.P. (2003) Movements of bigeye tuna (Thunnus obesus) in the tuna associated baitboat fishery of Dakar.
Collected Volume of Scientific Papers ICCAT, 55, 2093-2110. Hallier, J.P. (2005) Movements of tropical tunas from the tuna associated baitboat fishery of Dakar and from
BETYP and historical tagging operations in the Atlantic Ocean. Collected Volume of Scientific Papers ICCAT, 57, 76-99.
Hilborn, R. (1990) Determination of Fish Movement Patterns from Tag Recoveries using Maximum Likelihood
Estimators. Canadian Journal of Fisheries and Aquatic Sciences, 47, 635-643. Itano, D.G. and Holland, K.N. (2000) Movement and vulnerability of bigeye (Thunnus obesus) and yellowfin
tuna (Thunnus albacares) in relation to FADs and natural aggregation points. Aquatic Living Resources, 13, 213-223.
Kleiber, P. and Hampton, J. (1994) Modeling effects of FADs and islands on movement of skipjack tuna
(Katsuwonus pelamis): Estimating parameters from tagging data. Canadian Journal of Fisheries & Aquatic Sciences, 51, 2642-2653.
Miyabe, N. and Bard, F.X. (1986) Movements of skipjack in the Eastern Atlantic, from results of tagging by
Japan. Proceedings of the ICCAT International Skipjack Year Program, 1, 342-347. Xiao, Y. (1996) A framework for evaluating experimental designs for estimating rates of fish movement from
tag recoveries. Canadian Journal of Fisheries and Aquatic Sciences, 53, 1272-1280.
346

Table 1. Parameter estimates and quartiles (p[starting region, ending region]) for model one.
Mean Standard Deviation
2.50% 25% 50% 75% 97.50%
p[1,1] 0.735 0.115 0.485 0.656 0.75 0.828 0.92 p[1,2] 0.026 0.01 0.011 0.019 0.025 0.032 0.05 p[1,3] 0.087 0.092 0.002 0.018 0.056 0.121 0.332 p[1,4] 0.152 0.107 0.016 0.066 0.128 0.215 0.426 p[2,1] 0.003 0.003 0 0.001 0.002 0.003 0.011 p[2,2] 0.261 0.076 0.136 0.209 0.253 0.305 0.434 p[2,3] 0.422 0.251 0.009 0.184 0.468 0.64 0.789 p[2,4] 0.315 0.253 0.005 0.084 0.25 0.534 0.796 p[3,1] 0.073 0.07 0.002 0.021 0.053 0.102 0.264 p[3,2] 0.132 0.114 0.004 0.046 0.098 0.189 0.432 p[3,3] 0.347 0.237 0.013 0.14 0.318 0.529 0.83 p[3,4] 0.448 0.24 0.031 0.242 0.452 0.643 0.853 p[4,1] 0.005 0.006 0 0.001 0.004 0.007 0.02 p[4,2] 0.181 0.067 0.081 0.134 0.17 0.22 0.333 p[4,3] 0.362 0.152 0.102 0.248 0.358 0.465 0.675 p[4,4] 0.451 0.154 0.151 0.338 0.452 0.566 0.732 q[1] 3.20E-05 4.21E-06 2.27E-05 2.95E-05 3.26E-05 3.52E-05 3.84E-05 q[2] 2.90E-05 6.54E-06 1.45E-05 2.50E-05 2.98E-05 3.41E-05 3.87E-05 q[3] 1.98E-07 4.02E-07 7.63E-09 4.07E-08 8.82E-08 2.02E-07 1.09E-06 q[4] 1.28E-07 2.16E-07 8.74E-09 2.88E-08 6.45E-08 1.39E-07 6.22E-07
347

Table 2. Parameter estimates and quartiles for model two.
Parameter Mean Standard Deviation
2.50% 25% 50% 75% 97.50%
p[1,1] 0.736 0.117 0.488 0.658 0.752 0.828 0.92 p[1,2] 0.027 0.010 0.012 0.020 0.025 0.033 0.05 p[1,3] 0.085 0.088 0.002 0.021 0.055 0.120 0.34 p[1,4] 0.151 0.108 0.015 0.064 0.126 0.217 0.41 p[2,1] 0.003 0.003 0.000 0.001 0.002 0.003 0.01 p[2,2] 0.265 0.076 0.130 0.211 0.261 0.315 0.42 p[2,3] 0.431 0.246 0.009 0.207 0.474 0.645 0.79 p[2,4] 0.302 0.246 0.006 0.073 0.242 0.523 0.77 p[3,1] 0.074 0.069 0.002 0.023 0.055 0.103 0.25 p[3,2] 0.132 0.113 0.004 0.049 0.100 0.188 0.42 p[3,3] 0.341 0.233 0.015 0.139 0.309 0.529 0.81 p[3,4] 0.452 0.239 0.032 0.262 0.449 0.646 0.88 p[4,1] 0.005 0.006 0.000 0.001 0.003 0.006 0.02 p[4,2] 0.179 0.067 0.076 0.131 0.168 0.217 0.33 p[4,3] 0.357 0.150 0.094 0.246 0.346 0.460 0.65 p[4,4] 0.459 0.151 0.164 0.348 0.460 0.570 0.73 q[1] 3.21E-05 4.02E-06 2.33E-05 2.98E-05 3.26E-05 3.50E-05 3.82E-05 q[2] 2.91E-05 6.47E-06 1.52E-05 2.50E-05 2.98E-05 3.39E-05 3.95E-05 q[3] 3.55E-07 7.36E-07 1.91E-08 6.74E-08 1.40E-07 3.24E-07 2.07E-06 q[4] 1.97E-07 3.36E-07 1.23E-08 4.54E-08 9.41E-08 2.18E-07 8.99E-07
348

Figure 1. Map of four major regions in the Atlantic Ocean with BET tag releases and recoveries (red dots) and tracks of recovered fish (gray lines).
349

Figure 2. Expected number of tag returns compared to observed number of tag returns for each tagging group.
350

a.) b.)
c.) d.)
Figure 3. Expected and observed number of tag returns for each tag group by region.
351

Figure 4. Number of expected and observed tag returns in each tagging group for model 2.
Figure 5. Migration rates between regions as estimated in the model. Arrows indicate direction of travel, thickness indicates magnitude of the movement, and color indicates standard error of the estimate: red = large standard error, green = small standard error, values indicate annual migration rate to that region, bold indicates small standard error, circled numbers indicate residency rate with colors indicating standard error of the estimate as above.
352

Figure 6. Trace and posterior density plots of catchability estimates.
353
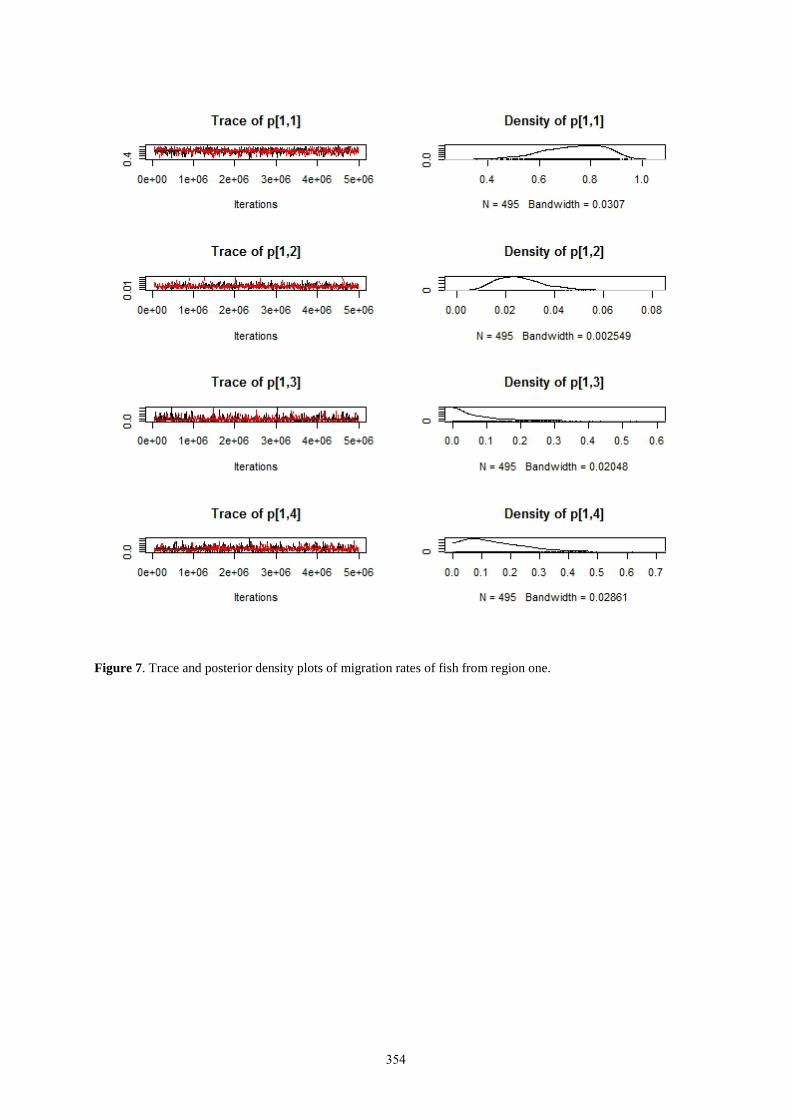
Figure 7. Trace and posterior density plots of migration rates of fish from region one.
354
Figure 8. Trace and posterior density plots of migration of fish from region two.
355

Figure 9. Trace and posterior density plots of migration rates of fish from region three.
356

Figure 10. Trace and posterior density plots of migration rates of fish from region four.
357

Figure 11. Map of the eight fishing regions in the eastern Atlantic Ocean modeled, with BET tag releases and recoveries (red dots) and tracks of recovered fish (gray lines).
358