3D Particle Measurement Online particle size distribution ...
http://dx.doi.org/10.5277/ppmp130131
Physicochem. Probl. Miner. Process. 49(1), 2013, 341−356 Physicochemical Problems
of Mineral Processing
www.minproc.pwr.wroc.pl/journal/ ISSN 1643-1049 (print)
ISSN 2084-4735 (online)
Received May 16, 2012; reviewed; August 3, 2012
AN ANALYSIS OF EFFECT OF PARTICLE SIZE
ON BATCH FLOTATION OF COAL
Marian BROZEK, Anna MLYNARCZYKOWSKA
AGH University of Science and Technology, Faculty of Mining and Geoengineering, Department of Environ-
mental Engineering and Mineral Processing, Al .Mickiewicza 30, 30-065 Kraków, Poland,
tel/fax +48-12-617-21-98, e-mail: [email protected], [email protected]
Abstract: This paper presents the analysis of the batch flotation with regard to the size of the floated
particles with coal as an example. Empirical studies were conducted on samples of bituminous coal from
the Jankowice coal mine (33 type in Polish classification). Experimental includes fractional flotation of
coal samples with various particle size, the float and sink analysis of flotation products and determination
the ash content in each flotation and densimetric fractions. The evaluation of flotational upgrade was
based on the partition curve and value of heterogeneity index (standard deviation) with the division into
concentrate and tailings as a measure of flotation efficiency. From the partition curve, partition size,
which is assumed in flotation as the maximum size of floatable particles under the given physicochemical
conditions, was calculated. On the basis of float and sink analyses, it was found that floated particles are
particles with hydrophobic properties corresponding to the density (related to the mineral matter content)
below 1.6 Mg/m3. In this connection, the probability of detachment of a particle from a given particle size
fractions, was calculated as a relation between the mass of particles with the density below 1.6 Mg/m3 in
tailings and the mass of particles with this density in the feed. With the increase in particle size, the de-
gree of heterogeneity increases and reaches the maximum value for particle size fractions 0.315–0.4 mm,
then decreases for larger particles. The characteristics of the dependence of the degree of heterogeneity on
particle size is analogous as in many flotation processes – the dependence of the flotation rate constant
flotation on particle size.
Key words: flotation, float and sink analysis, probability of detachment, indices flotation processing
Introduction
Flotation is the most common and widely accepted method of enrichment of fine coal
below 0.5 mm and even below 1 mm. This method has been used to enrich several
million tones of coking and power coal in Poland.
Coal is a heterogeneous material of two kinds. The petrographic composition and
content of mineral matter cause changes in particle hydrophobic properties, and actu-
M. Brozek, A. Mlynarczykowska 342
ally generate their distribution. The organic coal matter has hydrophobic properties,
while the degree of hydrophobicity, measured by the contact angle, varies with the
maceral composition. The components of the mineral matter, however, are hydro-
philic. With the increase in the coverage rate of the particle by the mineral matter, the
contact angle, the value of which depends also on the degree of surface roughness and
the presence of microcracks, decreases. The relation between volume and surface
properties for coal was proved and described with the use of deterministic and stochas-
tic models of batch flotation (Brożek and Młynarczykowska, 2006, 2007, 2009).
The flotometric equation is also known which is based on the balances of forces
acting in the three-phase particle-air bubble-liquid system, solved only numerically at
the moment of particle detachment. This equation in the form of polynomial of 3rd
degree has been presented as a trigonometric function with only one solution. The
team of Drzymala (Watanabe et al., 2011) presented the analytical form of an equa-
tion, connecting the maximum size of floating particle and its hydrophobicity, ex-
pressed as a contact angle.
A significant aspect in flotation upgrading is constituted by the analysis of elemen-
tary phenomena occurring at phase boundaries, which have a decisive effect upon the
process effectiveness. These problems have been widely described in the literature
(Hukki, 1953; Kelsall, 1960; Bogdanov et al., 1964; Laskowski and Iskra, 1970;
Woodburn et al., 1971; Bartlett and Mular, 1974; Jiang and Holtham, 1986; Flynn,
1987; Laskowski et al., 1991; Jiang. 1991; Laskowski, 2002; Vianna et al., 2003; Ho-
naker and Ozsever, 2003).
A variable content of useful component, especially in the ores upgraded by flota-
tion, requires deep milling for liberation of the minerals. Flotation comprises very fine
particles (from a few to several tens microns) which, in given physicochemical and
hydrodynamic conditions, either are able to make up a stable flotation aggregate or are
taken by the rotating medium and are mechanically transported into the concentrate. In
numerous works concerning both ores and coal the authors are still trying to describe
the effect of the finest particles upon upgrading effectiveness, both theoretically and
technologically. They are explaining the mechanisms which determine forming of
flotation aggregates, simultaneously setting the limits of particle sizes which are sub-
jected to classical flotation (De Bruyn and Modi, 1956; Collins and Jameson, 1976;
Trahar and Warren, 1976; Scheludko et al., 1976; Bustamante and Warren, 1983;
Crawford and Ralston, 1988; Drzymala, 1994a; 1994b; Malysa, 2000; Miettinen et al.,
2010; Kowalczuk et al., 2011; Chipfunhu et al., 2011).
The analysis of the effect of particle size on flotation properties of coal in the batch
flotation process is presented in this article.
The use of partition curves for the analysis of enrichment results is a common
method of the separation accuracy evaluation and parameters calculated on the basis
of those curves are the indicator of separation devices' quality.
Flotation enrichment in a machine with mechanical agitation of flotation pulp, oc-
curs inherently in turbulent conditions (Mika and Fuerstenau, 1968).
An analysis of effect of particle size on batch flotation of coal 343
Such a regime of separation leads to the phenomenon of particle detachment and
transition the rules of useful components to tailings. In connection with this, the sepa-
ration process is subject to the probability calculus. The statistical character of the
separation process is expressed numerically by the partition function and its graphical
representation – the partition curve (Tromp’s curve), determining the probability of
finding a particle with specific properties occurring in a given separation product.
The separation efficiency in industrial practice as said above, is measured by prob-
able error. In flotation conditions the value of probable error depends on factors relat-
ed to physical and physicochemical properties of particles, flotation machine charac-
teristics and parameters related to the reagent regime in the flotation chamber.
The consequence of particle scattering is consist in their transition to improper
products and this fact depends on the relation between forces acting on each particle.
These comprise forces facilitating particle detachment from the air bubble and the
particle adhesion force to an air bubble.
The partition number (recovery) for particles of the cell product (tailings) is ex-
pressed by the following formula:
k
k p
nT
n n (1)
where: nk – the number of floatable particles of a narrow size fraction with given flota-
tion properties occurring in the cell product, np – the number of particles with given
flotation properties occurring in the froth product.
Formula (1) presents a fraction of the total number of floatable particles with given
flotation properties which remained in a cell science they were subject to detachment.
It may also determine the probability of a particle to occur in the cell product (tail-
ings). This probability is equivalent to the probability of particle detachment from an
air bubble, so in the case of flotation the partition number for tailings is the probability
of particle detachment from the air bubble.
The analysis of the effect of particle sizes, on flotation properties of coal in the
batch flotation process is presented in this article.
Empirical studies were conducted on samples of bituminous coal from the Jan-
kowice coal mine (33 type in Polish classification). They include performing fraction-
al flotation of the raw material samples with various particle size, the float and sink
analysis of separation products and determination of the ash content in all density frac-
tions.
The evaluation of the enrichment process was based on the partition curve and the
value of heterogeneity index (standard deviation) with the splitting into the concen-
trate and tailings.

M. Brozek, A. Mlynarczykowska 344
Experimental
Method of samples preparation
The coal sample was crushed in two stages, at first in a jaw crusher and then in a roll
crusher to the particle size below 0.63 mm. The purpose of such a method of crushing
was to limit the yield of the finest particles, below 0,1 mm, in the crushing product.
The obtained crushing product was sieved to obtain the following size fractions: 0.1–
0.2 mm, 0.2–0.315 mm, 0.315–0.4 mm, 0.4–0.5 mm and 0.5–0.63 mm. A sample with
a wide range of particle sizes of 0.1–0.63 mm was made up from the narrow size frac-
tions and with equal weight yield of respective size fractions in order to determine the
degree of independence of the narrow particle size flotation process. The ash content
was determined in all samples. Each sample was washed on a screen 0.063 mm before
flotation in order to remove fine dust which could have affected the flotation results.
Fractional flotation
Flotation tests were carried out in a Denver type mechanical flotation machine with
flotation cell volume of 1 dm3. n-hexanol was used as a collecting-frothmaking rea-
gent. It does not change pulp pH but only reduces the surface tension on the gas–liquid
phases boundary, increasing at the same time air dispersion in the suspension. Also the
adsorption of alcohol occurs on the surface of air bubbles which ensures their stabili-
zation and prevents coalescence (Malysa, 2000; Krzan and Malysa, 2002). A solution
with concentration of 0.08 g/dm3 of hexanol was prepared. The solids content of 80 g
in 1 dm3 of the flotation suspension, is equivalent to the consumption of the reagent in
the amount of 1000 g per 1 Mg of dry feed. Low concentration of flotation pulp was
kept because of practical reasons because favourable coal flotation results can be
achieved at low pulp density (Sablik, 1998).
A sample with the mass of 80 g was moistened in 1 dm3 of solution in the flotation
cell for 15 minutes, with the impeller off. Then the suspension was agitated for 5
minutes without the air inflow to the flotation cell, which facilitated better reagent
adsorption on the surface of floated particles. After turning the air inflow on, fractional
flotation was conducted, gathering subsequent fractions of the froth product for: 15 s,
15 s, 30 s, 60 s and 60 s. Total flotation time was equal to 180 s (up to white froth).
The tailings product comprised the remains in the flotation cell.
Flotation of all six samples was conducted in the same conditions. The ash content
was determined in flotation products.
Float an sink analysis of flotation products
All products of fraction flotation were subject to the float and sink analysis in carbon
tetrachloride solutions were performed. The liquid maximum density was equal to the
density of pure CCl4, that is 1.60 Mg/m3. Lower values of liquid density; 1.35 and
1.225 Mg/m3, were obtained by dilution with anhydrous ethyl alcohol. The choice of
liquid density was conditioned by the mass of the obtained densimetric fractions in
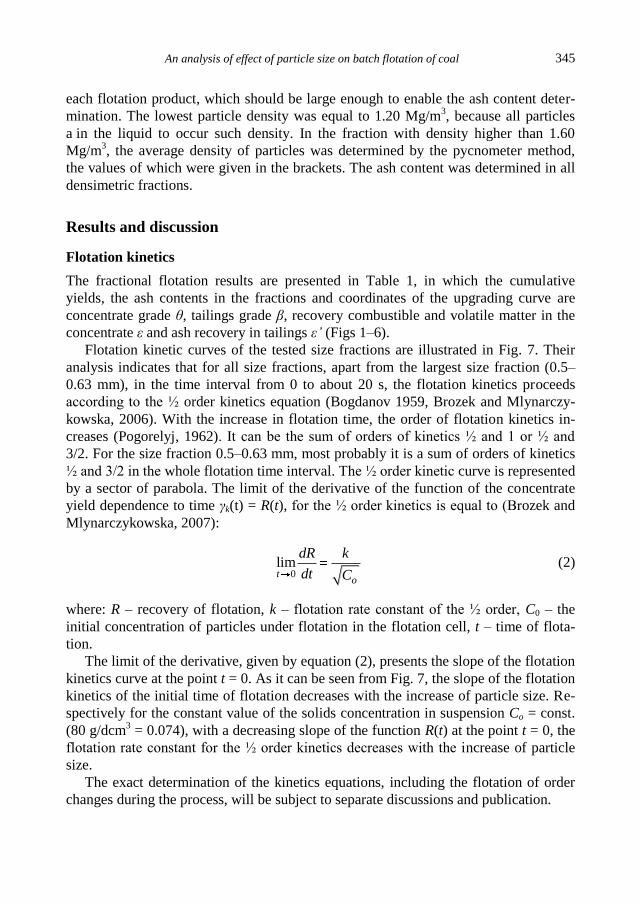
An analysis of effect of particle size on batch flotation of coal 345
each flotation product, which should be large enough to enable the ash content deter-
mination. The lowest particle density was equal to 1.20 Mg/m3, because all particles
a in the liquid to occur such density. In the fraction with density higher than 1.60
Mg/m3, the average density of particles was determined by the pycnometer method,
the values of which were given in the brackets. The ash content was determined in all
densimetric fractions.
Results and discussion
Flotation kinetics
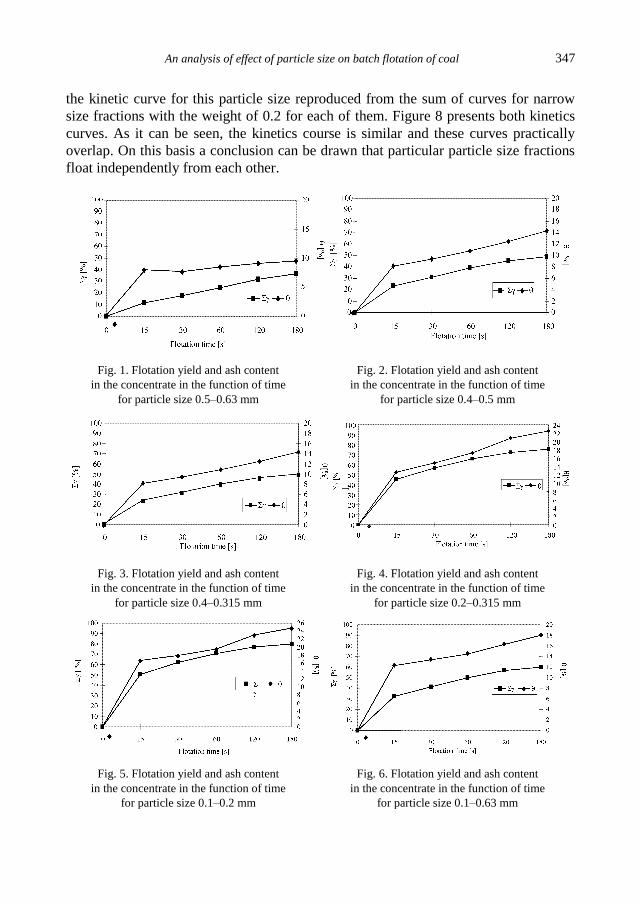
The fractional flotation results are presented in Table 1, in which the cumulative
yields, the ash contents in the fractions and coordinates of the upgrading curve are
concentrate grade θ, tailings grade β, recovery combustible and volatile matter in the
concentrate ε and ash recovery in tailings ε’ (Figs 1–6).
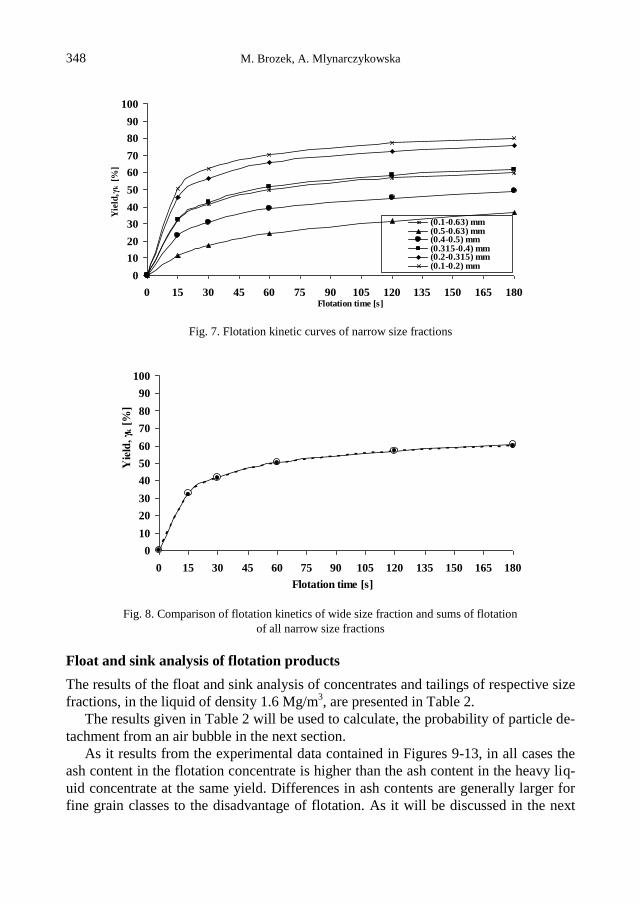
Flotation kinetic curves of the tested size fractions are illustrated in Fig. 7. Their
analysis indicates that for all size fractions, apart from the largest size fraction (0.5–
0.63 mm), in the time interval from 0 to about 20 s, the flotation kinetics proceeds
according to the ½ order kinetics equation (Bogdanov 1959, Brozek and Mlynarczy-
kowska, 2006). With the increase in flotation time, the order of flotation kinetics in-
creases (Pogorelyj, 1962). It can be the sum of orders of kinetics ½ and 1 or ½ and
3/2. For the size fraction 0.5–0.63 mm, most probably it is a sum of orders of kinetics
½ and 3/2 in the whole flotation time interval. The ½ order kinetic curve is represented
by a sector of parabola. The limit of the derivative of the function of the concentrate
yield dependence to time γk(t) = R(t), for the ½ order kinetics is equal to (Brozek and
Mlynarczykowska, 2007):
0
limt
o
dR k
dt C (2)
where: R – recovery of flotation, k – flotation rate constant of the ½ order, C0 – the
initial concentration of particles under flotation in the flotation cell, t – time of flota-
tion.
The limit of the derivative, given by equation (2), presents the slope of the flotation
kinetics curve at the point t = 0. As it can be seen from Fig. 7, the slope of the flotation
kinetics of the initial time of flotation decreases with the increase of particle size. Re-
spectively for the constant value of the solids concentration in suspension Co = const.
(80 g/dcm3 = 0.074), with a decreasing slope of the function R(t) at the point t = 0, the
flotation rate constant for the ½ order kinetics decreases with the increase of particle
size.
The exact determination of the kinetics equations, including the flotation of order
changes during the process, will be subject to separate discussions and publication.

M. Brozek, A. Mlynarczykowska 346
Table 1. The results of fractional flotation and indices of flotation upgrading
Particle
size Produkt
name
Flotation
time
Ash
A ∑ γ ↓ θ ∑ γ ↑ β ε' ε 0 th 0/ th
[mm] [s] [%] [%] [%] [%] [%] [%] [%] [–] [–] [–]
0.1
–0
.63
K1 15 12.40 32.06 12.4 100 37.93 100 45.24
0.237 0.604 0.39
K2 30 17.01 41.39 13.44 67.94 49.97 89.52 57.72
K3 60 19.85 49.90 14.53 58.61 55.22 85.33 68.70
K4 120 28.81 57.03 16.32 50.10 61.22 80.88 76.87
K5 180 53.66 59.93 18.13 42.97 66.60 75.46 79.04
Tailings 67.53 100 37.93 40.07 67.53 71.35 100
Feed 100
0.5
–0
.63
K1 15 7.99 11.37 7.99 100 33.51 100 15.73
0.161 0.472 0.34
K2 30 6.91 17.61 7.61 88.63 36.79 97.29 24.47
K3 60 10.71 24.36 8.47 82.39 39.05 96.00 33.53
K4 120 11.08 31.78 9.08 75.64 41.58 93.85 43.46
K5 180 12.22 36.45 9.48 68.22 44.90 91.39 49.62
Tailings 47.3 100 33.51 63.55 47.30 89.69 100
Feed 100
0.4
–0
.5
K1 15 8.17 23.3 8.17 100 42.16 100 36.99
0.273 0.635 0.43
K2 30 13.01 30.93 9.36 76.70 52.48 95.49 48.47
K3 60 16.49 38.97 10.83 69.07 56.84 93.13 60.07
K4 120 22.73 45.33 12.50 61.03 62.16 89.99 68.57
K5 180 36.25 49.20 14.37 54.67 66.74 86.56 72.84
Tailings 69.07 100 42.16 50.80 69.07 83.23 100
Feed 100
0.3
15–
0.4
K1 15 10.47 32.69 10.47 100 40.14 100 48.89
0.287 0.632 0.45
K2 30 17.67 42.62 12.14 67.31 54.56 91.48 62.55
K3 60 20.00 51.64 13.52 57.38 60.94 87.11 74.62
K4 120 32.08 58.49 15.69 48.36 68.58 82.61 82.39
K5 180 50.58 61.60 17.45 41.51 74.61 77.14 84.96
Tailings 76.55 100 40.14 38.40 76.55 73.22 100
Feed 100
0.2
–0
.315
K1 15 12.60 45.47 12.60 100 37.36 100 63.43
0.260 0.484 0.54
K2 30 23.84 56.56 14.81 54.53 57.99 84.66 76.92
K3 60 31.92 65.85 17.22 43.44 66.71 77.58 87.02
K4 120 56.59 72.42 20.79 34.15 76.18 69.64 91.57
K5 180 63.86 75.43 22.51 27.58 80.85 59.69 93.30
Tailings 82.93 100 37.36 24.57 82.93 54.55 100
Feed 100
0.1
–0
.2
K1 15 16.46 50.47 16.46 100 36.89 100 66.80
0.245 0.482 0.51
K2 30 23.38 62.05 17.75 49.53 57.71 77.48 80.87
K3 60 31.39 70.46 19.38 37.95 68.18 70.14 90.01
K4 120 59.60 77.16 22.87 29.54 78.65 62.99 94.30
K5 180 71.51 80.03 24.62 22.84 84.24 52.16 95.59
Tailings 86.07 100 36.89 19.97 86.07 46.60 100
Feed 100
To determine the degree of independence of flotation of particles of different sizes,
the flotation of the wide size fraction 0.1–0.63 mm was conducted and compared with
An analysis of effect of particle size on batch flotation of coal 347
the kinetic curve for this particle size reproduced from the sum of curves for narrow
size fractions with the weight of 0.2 for each of them. Figure 8 presents both kinetics
curves. As it can be seen, the kinetics course is similar and these curves practically
overlap. On this basis a conclusion can be drawn that particular particle size fractions
float independently from each other.
Fig. 1. Flotation yield and ash content
in the concentrate in the function of time
for particle size 0.5–0.63 mm
Fig. 2. Flotation yield and ash content
in the concentrate in the function of time
for particle size 0.4–0.5 mm
Fig. 3. Flotation yield and ash content
in the concentrate in the function of time
for particle size 0.4–0.315 mm
Fig. 4. Flotation yield and ash content
in the concentrate in the function of time
for particle size 0.2–0.315 mm
Fig. 5. Flotation yield and ash content
in the concentrate in the function of time
for particle size 0.1–0.2 mm
Fig. 6. Flotation yield and ash content
in the concentrate in the function of time
for particle size 0.1–0.63 mm
M. Brozek, A. Mlynarczykowska 348
0
10
20
30
40
50
60
70
80
90
100
0 15 30 45 60 75 90 105 120 135 150 165 180Flotation time [s]
Yie
ld, γ
k [%
]
(0.1-0.63) mm(0.5-0.63) mm(0.4-0.5) mm(0.315-0.4) mm(0.2-0.315) mm(0.1-0.2) mm
Fig. 7. Flotation kinetic curves of narrow size fractions
0
10
20
30
40
50
60
70
80
90
100
0 15 30 45 60 75 90 105 120 135 150 165 180
Flotation time [s]
Yie
ld, γ k
[%
]
Fig. 8. Comparison of flotation kinetics of wide size fraction and sums of flotation
of all narrow size fractions
Float and sink analysis of flotation products
The results of the float and sink analysis of concentrates and tailings of respective size
fractions, in the liquid of density 1.6 Mg/m3, are presented in Table 2.
The results given in Table 2 will be used to calculate, the probability of particle de-
tachment from an air bubble in the next section.
As it results from the experimental data contained in Figures 9-13, in all cases the
ash content in the flotation concentrate is higher than the ash content in the heavy liq-
uid concentrate at the same yield. Differences in ash contents are generally larger for
fine grain classes to the disadvantage of flotation. As it will be discussed in the next
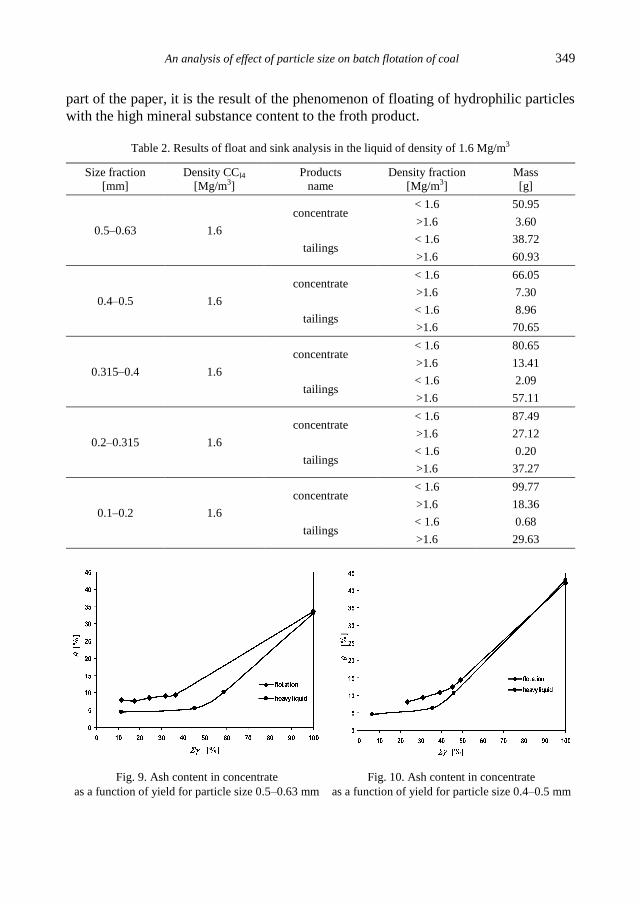
An analysis of effect of particle size on batch flotation of coal 349
part of the paper, it is the result of the phenomenon of floating of hydrophilic particles
with the high mineral substance content to the froth product.
Table 2. Results of float and sink analysis in the liquid of density of 1.6 Mg/m3
Size fraction
[mm]
Density CCl4
[Mg/m3]
Products
name
Density fraction
[Mg/m3]
Mass
[g]
0.5–0.63 1.6
concentrate < 1.6 50.95
>1.6 3.60
tailings < 1.6 38.72
>1.6 60.93
0.4–0.5 1.6
concentrate < 1.6 66.05
>1.6 7.30
tailings < 1.6 8.96
>1.6 70.65
0.315–0.4 1.6
concentrate < 1.6 80.65
>1.6 13.41
tailings < 1.6 2.09
>1.6 57.11
0.2–0.315 1.6
concentrate < 1.6 87.49
>1.6 27.12
tailings < 1.6 0.20
>1.6 37.27
0.1–0.2 1.6
concentrate < 1.6 99.77
>1.6 18.36
tailings < 1.6 0.68
>1.6 29.63
Fig. 9. Ash content in concentrate
as a function of yield for particle size 0.5–0.63 mm
Fig. 10. Ash content in concentrate
as a function of yield for particle size 0.4–0.5 mm

M. Brozek, A. Mlynarczykowska 350
Fig. 9. Ash content in concentrate
as a function of yield for particle size 0.315–0.4 mm
Fig. 10. Ash content in concentrate
as a function of yield for particle size 0.2–0.315 mm
0
5
10
15
20
25
30
35
40
0 10 20 30 40 50 60 70 80 90 100
flotation
heavy liquid
[%
]
[%]
Fig. 13. Ash content in concentrate as a function of yield for particle size 0.1–0.2 mm
Evaluation of flotation
Partition curve
According to the dependence of the flotation rate constant on particle size, the yield of
K1 product, as shown in Table 1, after flotation time of 15 s, decreases with the in-
crease in size fraction from the value of 50.47% for the size fraction 0.1–0.2 mm to the
value of 11.37% for the size fraction 0.5–0.63 mm.
The concentrate yield after flotation time of 180 s (up to empty froth) decreases
with the increase in particle size from the value of 80.03% for the size fraction 0.1–0.2
mm to the value of 36.45 % for the size fraction 0.5–0.63 mm. The decrease in the
concentrate yield with the increase in particle size is equivalent to the increase in the
tailings yield. The increase in the tailings yield is related to the increase in the proba-
bility of particle detachment.
As it result from comes out of the data (Table 2), the flotation tailings of the finest
particle size fraction 0.1–0.2 mm, contain merely 0.68 g of fraction with the density
below 1.6 Mg/m3, while the concentrate contains 99,77 g. For this reason, it was as-

An analysis of effect of particle size on batch flotation of coal 351
sumed that floated particles are these with hydrophobic properties corresponding to
the density (related to the mineral matter content) below 1.6 Mg/m3. It is coal for
which the density of particles is connected with the content of mineral matter which
can be described by means of ash content. The lower the density of particles, the high-
er the content of organic coal matter, low ash content and better floatability. The mu-
tual relations of the mentioned features have been described in the following works
Brozek (1995a, b, c), Brozek and Mlynarczykowska (2005).
Therefore, the probability of detachment of a particle from a given particle size
fraction, according to formula (1), was calculated as a relation between the mass of
particles with the density below 1.6 Mg/m3 in tailings and the mass of particles with
this density in the feed. Particle size, being the arithmetic mean of lower and upper
limit of the size fraction, was assigned to the probability calculated in this way. The
particle size 0.2–0.315 was omitted due to too weak partition for tailings. The detach-
ment probability are as follows:
for the size fraction 0.1–0.2 mm
0.68 g
(0.15 mm) 100% 0.68%100.45 g
dP (3a)
for the size fraction 0.315–0.4 mm
2.09 g
(0.357 mm) 100% 2.52%82.74 g
dP (3b)
for the size fraction 0.4–0.5 mm
8.96 g
(0.45 mm) 100% 11.94%75.01g
dP (3c)
for the size fraction 0.5–0.63 mm
38.72 g
(0.57 mm) 100% 43.17%89.67 g
dP . (3d)
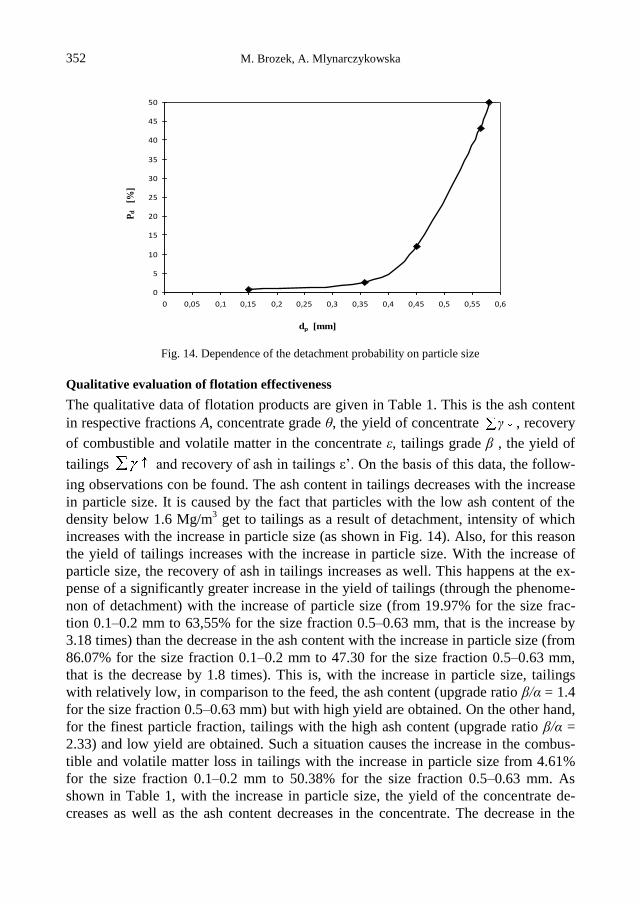
In Fig. 14, the dependence of detachment probability on particle size and at the
same time the partition curve giving the probability for a particle with the density be-
low 1.6 Mg/m3 of getting to tailings was plotted. The partition size approximated from
the partition curve and simultaneously maximum floatable particle size in the physico-
chemical conditions in the flotation cell, assumed in this paper, is equal to d50 =
0.58 mm.
M. Brozek, A. Mlynarczykowska 352
0
5
10
15
20
25
30
35
40
45
50
0 0,05 0,1 0,15 0,2 0,25 0,3 0,35 0,4 0,45 0,5 0,55 0,6
dp [mm]
Pd
[%
]
Fig. 14. Dependence of the detachment probability on particle size
Qualitative evaluation of flotation effectiveness
The qualitative data of flotation products are given in Table 1. This is the ash content
in respective fractions A, concentrate grade θ, the yield of concentrate γ , recovery
of combustible and volatile matter in the concentrate ε, tailings grade β , the yield of
tailings and recovery of ash in tailings ε’. On the basis of this data, the follow-
ing observations con be found. The ash content in tailings decreases with the increase
in particle size. It is caused by the fact that particles with the low ash content of the
density below 1.6 Mg/m3 get to tailings as a result of detachment, intensity of which
increases with the increase in particle size (as shown in Fig. 14). Also, for this reason
the yield of tailings increases with the increase in particle size. With the increase of
particle size, the recovery of ash in tailings increases as well. This happens at the ex-
pense of a significantly greater increase in the yield of tailings (through the phenome-
non of detachment) with the increase of particle size (from 19.97% for the size frac-
tion 0.1–0.2 mm to 63,55% for the size fraction 0.5–0.63 mm, that is the increase by
3.18 times) than the decrease in the ash content with the increase in particle size (from
86.07% for the size fraction 0.1–0.2 mm to 47.30 for the size fraction 0.5–0.63 mm,
that is the decrease by 1.8 times). This is, with the increase in particle size, tailings
with relatively low, in comparison to the feed, the ash content (upgrade ratio β/α = 1.4
for the size fraction 0.5–0.63 mm) but with high yield are obtained. On the other hand,
for the finest particle fraction, tailings with the high ash content (upgrade ratio β/α =
2.33) and low yield are obtained. Such a situation causes the increase in the combus-
tible and volatile matter loss in tailings with the increase in particle size from 4.61%
for the size fraction 0.1–0.2 mm to 50.38% for the size fraction 0.5–0.63 mm. As
shown in Table 1, with the increase in particle size, the yield of the concentrate de-
creases as well as the ash content decreases in the concentrate. The decrease in the

An analysis of effect of particle size on batch flotation of coal 353
yield is related to the phenomenon of low-ash particles' detachment, which get to tail-
ings and increase the loss of combustible and volatile matter in tailings. On the other
hand, the decrease of the concentrate grade with the increase of particle size or, the
other way round, the increase of the concentrate grade with the decrease of particle
size is the result of entrainment, called mechanical flotation of gangue particles (hy-
drophilic particles) to the concentrate (Konopacka, 2005). The intensity of this phe-
nomenon increases with the decrease in floated particle size as well as with the in-
crease in flotation rate. Mechanical flotation causes deterioration of the concentrate
quality and increase in ash remnants in the concentrate at decreasing the floated parti-
cle size from 10.31 % for the size fraction 0.5–0.63 mm to 54.40% for the size fraction
0.1–0.2 mm. To sum up, it can be said that the phenomenon of detachment concerns
larger particles and causes the loss in combustible and volatile matter in tailings; on
the other hand, the phenomenon of entrainment, characteristic of smaller particles,
increases ash remnants in the coal concentrate. Both phenomena decrease the flotation
effectiveness.
For determining the optimum enriched particle size, because of the phenomena of
large particles detachment and entrainment of fine particles, on the basis of the results
given in Table 1, the degree of heterogeneity was calculated for flotation of particular
size fractions with splitting into the concentrate and tailings. The degree of heteroge-
neity can be the measure of differentiation of a certain feature or the component con-
tent (characteristic of a given raw material) in the separation products. With the split-
ting into the concentrate and tailings, the degree of heterogeneity is expressed by the
following formula (Stepinski 1964):
2 2
1a k k (4)
where: γk – the yield of the concentrate, α – feed grade, θ –the concentrate grade, β –
the tailings grade.
From the mathematical point of view, this is the standard deviation of a random
variable, such as the ash content in the case of coal. The larger value of the heteroge-
neity index, the more diverse the separation products, i.e. the better separation. With
the accurate separation, the ash content in the concentrate and tailings, respectively,
are equal to: θ = 0 and β = 1.
In this case the degree of heterogeneity is as follows:
2 2 22 2a k k . (5)
On the basis of the balance equation
1k k (6)

M. Brozek, A. Mlynarczykowska 354
for the ideal separation (1 )k o and (1 )k the degree of heterogeneity
has the maximum value and is equal to:
2th . (7)
With the lack of separation θ = α and β =α and from the formula (4) it follows that
σa = 0.
On the basis of flotation results given in Table 1, the real 0 and theoretical th de-
gree of heterogeneity and the relation of those values /a thσ σ as a measure of flotation
efficiency. The calculation results are included in Table 1. With the increase in particle
size, the degree of heterogeneity increases and reaches the maximum value for particle
fractions 0.315–0.4 mm, and then it decreases for larger particles. The characteristics
of the dependence of the degree of heterogeneity on particle size is analogous with
many flotation processes – the dependence of the flotation rate constant on particle
size.
A similar tendency is demonstrated by the dependence of flotation efficiency on
particle size. The relation /a thσ σ has the maximum value for particles from the frac-
tion 0.2–0.315 mm. Thus, it can be said that within this particle size interval, because
of the low probability of detachment, there is low scattering of hydrophobic particles
to tailings.
Conclusions
1. From the comparison of flotation kinetics of wide particle fractions to kinetics ob-
tained from the sum of kinetic curves for narrow size fraction, with appropriate
weights, it appears that particles with different sizes float independently from each
other. Knowing the particle size distribution of the feed and flotation kinetics of
each size fractions, the flotation course of the feed can be forecast.
2. The ash content in tailings decreases with the increase in particle size. It is caused
by the fact that particles with the low ash content with the density below 1.6 Mg/m3
get to tailings as a result of detachment, intensity of which increases with the in-
crease in particle size. This causes the increase in the loss of combustible and vola-
tile matter in tailings with the increase in particle size.
3. The yield of the concentrate decreases with the increase in particle size. The de-
crease in the yield is related to the phenomenon of detachment of low-ash particles,
which get to tailings increasing by this the loss of combustible and volatile matter
in tailings.
4. The ash content increases in the concentrate with the decrease in particle size. It is
related to the effect of entrainment of gangue (hydrophilic particles) to the concen-
trate. The intensity of this phenomenon increases with the decrease in floated parti-
cle size as well as with the increase in the flotation rate. This causes the increase in
ash remnants in the concentrate.
An analysis of effect of particle size on batch flotation of coal 355
5. To sum up, it can be said that the phenomenon of detachment concerns larger par-
ticles and causes the increase in the loss of combustible and volatile matter in tail-
ings; nevertheless, the phenomenon of mechanical flotation, characteristic of
smaller particles, increases ash remnants in the coal concentrate. Both phenomena
decrease the flotation effectiveness.
6. The degree of heterogeneity increases with the increase in particle size and reaches
the maximum value for particles of the size fraction 0.315 – 0.4 mm, then decreas-
es for larger particles. The characteristics of the dependence of the degree of heter-
ogeneity on particle size is analogous as in many flotation processes – the depend-
ence of the flotation rate constant on particle size.
Acknowledgements
The paper has been supported by the statutory project No 11.11.100.276
References
BARTLETT D.R., MULAR A.L., 1974, Dependence of flotation rate on particle size and fractional
mineral content. Int. J. Miner. Proces., 1, 277–286.
BOGDANOV O.S., HAINMAN V.J., MAXIMOV I.I., 1964, On certain physical – mechanical factors
determining the rate of flotation. Proc. VII IMPC, New York, Gordon &Breach, 169–174.
BUSTAMANTE H., WARREN L.J., 1983, Relation between the relative density of composite coaly
grain and their flotation recovery. Int.J. Miner. Process., 10, 95–111.
BROŻEK M., MŁYNARCZYKOWSKA A., 2005, Distribution of adhesion rate constant in the coal
sample. Acta Metallurgica Slovaca; ISSN 1335–1532.
BROŻEK M., MŁYNARCZYKOWSKA A., 2006, Application of the stochastic model for analysis of
flotation kinetics with coal as an example. Physicochemical Problems of Mineral Processing, 40, 31–
44.
BROŻEK M., MŁYNARCZYKOWSKA A., 2006, Analysis of kinetics models of batch flotation. Physi-
cochemical Problems of Mineral Processing., 41, 51–65.
BROŻEK M., MŁYNARCZYKOWSKA A., 2009. Kinetic flotation. Wyd. IGSMiE PAN, Cracow.
CHIPFUNHU D., MASSIMILIANO Z., STEPHEN G., 2011, The dependency of the critical contact
angle for flotation on particle size – Modelling the limits of fine particle flotation. Minerals Engineer-
ing 24, 50–57
COLLINS G.L., JAMESON G.J., 1976, Experiment on the flotation of fine particles. The influence of
particle size and change. Chem. Eng. Sci., 31, 985–991.
CRAWFORD R., RALSTON J., 1988. The influence of particle size and contact angle in mineral flota-
tion. Int. J. Miner. Process., 23, 1–24
DE BRUYN P.L., MODI H.J., 1956. Particle size and flotation rate of quartz. Trans. AIME, 205, 415–
419.
DRZYMAŁA J., 1994a. Characterization of materials by Hallimond tube flotation. Part 1: maximum size
of entrained particles. Int. J. Miner. Process., 42, 139–152.
DRZYMAŁA J., 1994b. Characterization of materials by Hallimond tube flotation. Part 2: maximum size
of floating particles and contact angle. Int. J. Miner. Process., 42, 153–167.
FLYNN S.A., 1987. A froth ultra-fine model for the selective separation of coal from mineral in a dis-
persed air flotation cell. Pow. Techn., 49, 127–142
M. Brozek, A. Mlynarczykowska 356
HONAKER R.Q., OZSEVER A.V., 2003. Evaluation of the selective detachment process in flotation
froth. Minerals Engineering, 16, 975–982
HUKKI R.T., 1953, measurement and evaluation of the rate of flotation as a function of particle size.
Trans. AIME, 196, 1122–1123.
JIANG Z.W., HOLTHAM P.N., 1986. Theoretical model of collision between particles and bubbles.
Trans. IMM, 95, 187–194.
JIANG Z.W., 1991. Modelling of flotation process by quantitative analysis of the collision and adhesion
between particles and bubbles. Proc. XVII IMPC, Dreseden, vol. 2, 429–440.
KELSALL D.F., 1960. Application of probability in the assessment of flotation system. Trans. IMM, 70,
191–204
KONOPACKA Ż., 2005. Mechanical flotation. Publishing House of Technical University of Wroclaw,
Wroclaw
KOWALCZUK P. B., SAHBAZ O., DRZYMALA J.,2011, Maximum size of floating particles in differ-
ent flotation cells. Minerals Engineering, 24 8, 766–771
KRZAN M., MAŁYSA K., 2002, Profiles of local velocities of bubbles in n-butanol, n-hexanol,
n-nonanol solution. Coll. Surfaces. A: Physicochemical and Engineering Aspects, 207, 279–291.
LASKOWSKI J., ISKRA J., 1970. Role of capillary effects in bubble-particle collision in flotation .Trans.
IMM, 79, 6–10.
LASKOWSKI J.S., XU Z, YOON R.H., 1991. Energy barrier in particle-to-bubble attachment and its
effect on flotation kinetics. Proc. XVII IMPC, Dresden, vol. 2, 237–249.
LASKOWSKI J.S., 2002. Fundamental and engineering aspects of coal surface heterogeneity. Proc. XIV
ICPC, Johanesburg, 265–271.
MAŁYSA E., 2000, Floatability of coals as a function of surfach activity of the alcohols. Gospodarka
Surowcami Mineralnymi, 16, 45–54.
MIETTINEN T., RALSTON J., FORNASIERO D.,2010, The limits of fine particle flotation, Minerals
Engineering 23, 420–437.
SABLIK J., 1998, Flotacja węgli kamiennych. Główny Instytut Górnictwa. Katowice, Poland.
MIKA T., FUERSTENAU D.W., 1968. Pogorelyj microscopic model of the flotation process. Proc. VIII
IMPC, Leningrad, vol. II, 246–269.
SCHELUDKO A., TOSHEV B.V., BOJADJIEV D.T., 1976. Attachment of particles to a liquid surface
capillary theory of flotation. Journal of the Chemical Society, Faraday Transactions 1: Physical
Chemistry in Condensed Phases 72, 2815–2828.;
SCHULZE H.J., 1977. New theoretical and experimental investigations on stability of bubble particle
aggregates in flotation: a theory on the upper particle size of floatability. Int. J. Miner. Process., 4,
241-259.
SCHULZE H.J., 1992. Interface actions in mineral processes. Aufbereitungs Technik, 33, 434–443.
STĘPIŃSKI W., 1964. Gravitational processing. PWN Warsaw.
TRAHAR W.J., WARREN L.J., 1976. The flotability of very fine particles – a review. Int. J. Miner.
Process., 3, 103–131.
WATANABE M., KOWALCZUK P. B., DRZYMALA J., 2011. Analytical solution of equation relating
maximum size of floating particles and its hydrophobicity. Physicochemical Problems of Mineral Pro-
cessing, 46, 13-20
WOODBURN E.T., KING R.P., COLBORN R.P., 1971, The effect of particle size distribution on the
performance of a phosphate flotation process. Metall. Trans., 2, 3163–3174.

An analysis of effect of particle size on batch flotation of coal 357
VIANNA S.M., FRANZIDIS J.P., MANLAPING E.V., SILVESTER E.S., FU PING-HAO, 2003, The
influence of particle size and collector coverage on the flotability of galena particles in a natural ore.
Proc. XXII IMPC, Cape Town 2003, 816–826.