
An analysis of Createch R&D business activity in the UK
24
An analysis of Createch R&D business activity in the UK ISBN: 978-1-913095-47-5 Juan Mateos-Garcia September 2021
Transcript of An analysis of Createch R&D business activity in the UK

An analysis of Createch R&D business activity in the UK ISBN: 978-1-913095-47-5
Juan Mateos-Garcia
September 2021

Acknowledgements
This paper and the research was co-funded by the Arts and Humanities Research Council (AHRC) and the Creative Industries Policy and Evidence Centre (PEC).
About the Author
Juan Mateos-Garcia is Director of Innovation Mapping at Nesta, where he leads a team using novel data sources and analytical methods to map innovation and inform policies to support it. Juan has 15 years of experience doing policy-relevant research for the creative industries. This includes work in the Brighton Fuse, the Livingstone-Hope Independent Review of Skills for the Video Games and Visual Effects Industry, The Geography of Creativity and Creative Nation. Before joining Nesta, Juan was a researcher at the University of Brighton and at the Science Policy Research Unit at the University of Sussex. Juan is an economist with a MSc in Science and Technology Policy from the University of Sussex.
About the Creative Industries Policy and Evidence Centre
The Creative Industries Policy and Evidence Centre (PEC) works to support the growth of the UK’s Creative Industries through the production of independent and authoritative evidence and policy advice.
Led by Nesta and funded by the Arts and Humanities Research Council as part of the UK Government’s Industrial Strategy, the Centre comprises of a consortium of universities from across the UK (Birmingham; Cardiff; Edinburgh; Glasgow; Work Foundation at Lancaster University; LSE; Manchester; Newcastle; Sussex; Ulster). The PEC works with a diverse range of industry partners including the Creative Industries Federation. For more details visit www.pec.ac.uk and @CreativePEC
An analysis of Createch R&D business activity in the UK
Executive summary 4
1 Introduction 5
2 Definitions, data sources and methods 6
3 Findings 8
a. Levels and distribution of activity and examples 8 b. Educational background of createch talent 9 c. Geography of createch businesses in the UK 11 d. Access to finance 15
4 Conclusions 19
Appendix: Our createch identification pipeline 21
References and Endnotes 23

4
An analysis of Createch R&D business activity in the UK
Executive summaryWe use CrunchBase, a global technology company database, to explore drivers of success for createch R&D intensive businesses that produce knowledge to deliver technological innovation in artistic, creative and cultural domains in the UK. Having identified 2,800 createch companies in the data (8 per cent of all companies with sufficiently large descriptions in the data), we analyse the composition of their leaders’ skills base, their geography and access to finance. These are our findings and their implications:
1. Arts, Humanities and Design disciplines have a stronger presence in the skills base of createch companies. For example, key personnel in createch companies are almost six times as likely to have an educational background in communication and media studies than those in non-createch businesses. This result underscores the importance of STEAM (Science, Technology, Engineering, Mathematics and the Arts) disciplines and degrees for high potential createch businesses.
2. Createch businesses are more geographically concentrated than the wider creative industries. 57 per cent of createch companies are based in London, almost twice the share of creative businesses based in the capital according to official data. By contrast, publicly funded createch R&D activities are less geographically concentrated. We also find evidence that creative cities with a diversity of creative industries and research activities tend to have stronger createch clusters than homogeneous creative ecosystems. This finding is consistent with the idea that complex createch activities might find it easier to thrive in larger and denser creative ecosystems. Public R&D funding could plan an important role helping newer and smaller createch clusters to develop and diversify, making the geography of createch, and the distribution of its benefits, more inclusive.
3. Createch businesses tend to be more reliant on early-stage sources of finance than non-createch companies. When we compare the amounts raised by createch companies with non-createch businesses after controlling for many other factors, we find that createch businesses tend to raise between 22 per cent and 34 per cent less funding, supporting the idea that innovative createch businesses in the intersection of arts, culture and technology might face barriers accessing the finance they need to innovate and grow.

An analysis of Createch R&D business activity in the UK
5
1
IntroductionInnovators and entrepreneurs are increasingly exploring business opportunities at the intersection of the arts, creativity and digital technologies (AHRC/DCMS, 2021). Policymakers looking to support ‘createch’ Research and Development (R&D) need access to the right evidence to inform their funding and investment decisions.
The Creative Industries Policy and Evidence Centre in partnership with the AHRC, the Creative Industries Council and Nesta have put in place a programme of research to contribute to this evidence base in the UK. This has resulted in three published reports respectively analysing the UK’s global position in createch markets and investment in the sector, public support for createch R&D,1 and access to createch skills and future investment.2 Those studies highlighted rapid growth in the level of private and public investment in createch activity and the central position of the UK in global createch markets. Here, in a fourth publication we present the results of an analysis of createch R&D business activity in the UK with a focus on key drivers of createch success including talent, place and access to finance.
Section 2 sets out our definitions, data sources and methods.
Section 3 presents findings, beginning with a descriptive analysis of the state of play followed by an analysis of the educational background of key personnel in createch businesses, the geography of createch businesses in the UK and access to finance compared to non-createch businesses.
Section 4 discusses implications and next steps.

An analysis of Createch R&D business activity in the UK
6
2
Definitions, data sources and methodsWe define createch R&D as the production of knowledge to deliver technological innovation in artistic, creative and cultural domains. In our definition, technological innovation entails more than the mere adoption of a technology (for example, when a designer sells their product in an online platform, or a film company uses a camera to shoot a video), it requires the creation or adaptation of the technology, usually through computer programming. In the preceding examples, if the designer develops a website offering immersive ways to experience their products, or if the film company customises its camera to shoot 3D movies (as Ridley Scott did for Avatar), we would classify them as ‘createch’. While we recognise that createch activities will often involve ‘emerging technologies’3 such as artificial intelligence or virtual reality, in part because these novel technologies need to be creatively adapted and repurposed into new domains, we also include within our definition established technologies that can be extended and deployed in innovative ways (for example, although streaming platforms go back several years, an arts organisation that develops a new system to distribute its products would count, in our definition, as createch).
Official business data such as the Interdepartmental Business Registry (IDBR) lacks the detailed business descriptions that are required to operationalise this definition, so we rely on CrunchBase, a crowdsourced directory of technology companies widely used in entrepreneurship research. CrunchBase collects its data through a variety of channels including contributions from investors and the public complemented with an in-house data team. A search in Google Scholar reveals at least 3,000 academic articles using CrunchBase data. Crucially for our purposes, CrunchBase includes text descriptions and ‘tags’ about a company’s activity and technology focus that we can use to identify createch companies, and information about the educational background of entrepreneurs and company funding outcomes that we can use to analyse the qualifications of createch talent and their access to finance.
Importantly, CrunchBase is not a census of all companies but instead focuses on startups and digital technology companies with high growth potential. Therefore we would expect to find a substantial overlap between that group of companies and R&D-intensive createch businesses, and hence it is the primary data source for this study.
An analysis of Createch R&D business activity in the UK
7
In order to find createch companies, we implement a complex analytical pipeline where we first identify creative companies in the data based on their Standard Industrial Classification codes based on the DCMS’s classification of the sector and CrunchBase tags that companies are labelled with and detect those involved in createch and more likely to be involved in technological innovations through a semantic analysis of their descriptions (see the Appendix for additional details, and our GitHub repository for the code we have developed in the project). We implement additional filters on createch segments less geared towards creative markets such as AI and data, computing or blockchain in order ensure that our sample genuinely comprises companies developing technologies with a focus on creative applications.
A limiting factor for this is the availability of sufficiently long and detailed company descriptions so we restrict our analysis to those companies with longer descriptions where we can be more confident about the accuracy of our semantic methods, comprising 37,379 companies in total (38 per cent of the population of CrunchBase companies).
We have compared the number of companies that we excluded from the analysis because of description length across a range of categories and find that in general they tend to be younger and smaller – this suggests that our results are more likely to capture larger and more mature createch businesses in the CrunchBase data and leads us to focus the report on cross-sectional analyses instead of longitudinal analyses that could be skewed by shifts in data coverage over time (i.e. the fact that companies incorporated in recent years might be underrepresented in our dataset). One consequence of our conservative approach is that we are unlikely to capture all createch businesses in the UK and our results should be interpreted with that in mind.
In addition to CrunchBase, we also draw on:
• The Gateway to Research, a database of publicly funded research in the UK which we analysed intensively in our previous createch R&D study.4 There, we identified UKRI-funded createch projects and companies through an analysis of project descriptions and company sectors and analysed their evolution, sectoral distribution and geography. Here, we draw on the outputs of that analysis to analyse the co-location between R&D-intensive createch businesses and publicly funded createch R&D activities.
• The Interdepartmental Business Register, the UK’s official business register maintained by the ONS and available from NOMIS, an open data website for labour market statistics. We extract information about the number of businesses in various creative industries sub-sectors based on the DCMS classification and use them in our analysis of co-location between createch businesses and the wider creative industries.

An analysis of Createch R&D business activity in the UK
8
3
FindingsWe begin with a descriptive analysis of createch business activity in the UK including levels, examples and evolution of activity and educational background of key personnel.
a. Levels and distribution of activity and examples
Figure 1 show the number of active createch companies in different categories based on the same taxonomy we used in our analysis of public funding for createch R&D published in June. These include:
• AI and data: businesses using data analytics, data science, machine learning algorithms and AI in a creative industries context. Some examples in our data include SnowBall, a marketing agency that uses data analytics for consumer communication, SenSat, a company that turns complex visual and spatial data into real-time simulations, and Switch Concepts, a business that provides cloud-based services to increase publishers’ online revenues.
• Blockchain: businesses deploying distributed ledgers in creative markets including companies such as Armacoin or TRUTH, which are seeking to increase transparency in advertising markets with blockchain technology.
• Computing: this includes companies active in areas such as social networks, app development and cloud computing. Some examples include Avanatta, a collaborative video making app, and Pult, developers of a platform that enables streaming of content through Internet Protocol networks.
• Creative content: Businesses creating interactive and immersive content and content creation tools and platforms. Golden-i makes it possible to operate wireless wearable headsets by voice command and head movement, FrameBlast enables the creation and distribution of mini-HD video and TheBookSeekers is a platform for searching and discovering children’s books.
• Creative services: This category captures companies building technologies to enhance the delivery of creative services like advertising, design or architecture. Amongst them we find a large number of digital marketing, branding and search engine optimisation companies. Some examples include View Holographics, a company developing holographic images for use in advertising and architecture; TemplateMix, a graphic design tool for non-technical users; and Swiften, a company that develops in-video micropayment platforms and advertising solutions.

An analysis of Createch R&D business activity in the UK
9
Figure 1: Number of estimated companies by createch category. Note that companies can belong to more than one createch category
0 400 800 1,200 1,600
Number of companies
Createchcategory
Creative services
Creative content
Computing
AI and Data
Blockchain
In total, we identify 2,814 unique createch businesses representing just under 8 per cent of all companies in our filtered dataset of around 37,000 companies. Creative services comprise the largest createch category followed by creative content and computing.
As the description of our categories and examples show, there is a high degree of overlap between ‘createch segments’ reflecting the hybrid and interdisciplinary nature of the sector: for example, many creative services createch businesses use data analytics and machine learning, and creative content companies participate in advertising value chains.
b. Educational background of createch talent
A growing body of literature has highlighted that the fusion of artistic and technological skills can act as a driver for innovation.5 Here we build on that literature by leveraging CrunchBase data on the qualifications of 1.2 million individuals in the technology ecosystem with the goal of assessing differences between the skills base of createch businesses and those in other sectors – a key assumption here is that looking at the educational qualifications of entrepreneurs, founders and business leaders in a sector tell us something about the capabilities required for commercial and technological success.
After merging this database with our text-restricted list of companies , we end with a list of 15,732 company-qualification pairs (including 1,189 related to createch businesses). We calculate the distribution of qualification subjects over createch and non-createch businesses and the extent to which a qualification subject is over or underrepresented in the createch skills base.6
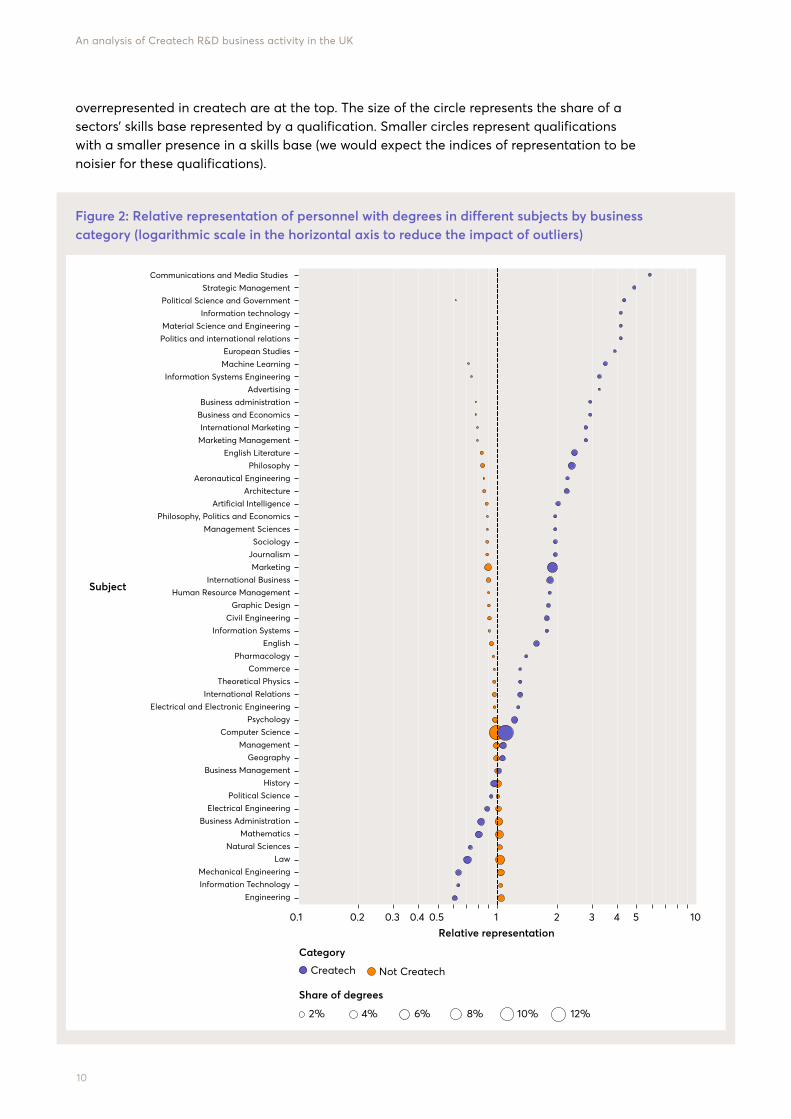
Figure 2 presents the results of our analysis focusing on the top 50 qualifications for key personnel – predominantly founders, co-founders, C-suite executives, directors and heads – in createch companies, noting that these qualifications are unstandardised so there is some degree of duplication between categories (e.g. ‘business’ and ‘business administration’).
The horizontal axis represents the degree of over- or under-representation of a subject in the skills base for a sector (the blue dots represent createch and the orange dots non-createch). We use scores in this axis to sort the vertical axis so that the qualifications most
An analysis of Createch R&D business activity in the UK
10
overrepresented in createch are at the top. The size of the circle represents the share of a sectors’ skills base represented by a qualification. Smaller circles represent qualifications with a smaller presence in a skills base (we would expect the indices of representation to be noisier for these qualifications).
Figure 2: Relative representation of personnel with degrees in different subjects by business category (logarithmic scale in the horizontal axis to reduce the impact of outliers)
0.1 0.2 0.3 0.4 0.5 1 2 3 4 5 10Relative representation
Category
Subject
Communications and Media Studies Strategic Management
Political Science and GovernmentInformation technology
Material Science and EngineeringPolitics and international relations
European StudiesMachine Learning
Information Systems EngineeringAdvertising
Business administrationBusiness and EconomicsInternational Marketing
Marketing ManagementEnglish Literature
PhilosophyAeronautical Engineering
ArchitectureArtificial Intelligence
Philosophy, Politics and EconomicsManagement Sciences
SociologyJournalismMarketing
International BusinessHuman Resource Management
Graphic DesignCivil Engineering
Information SystemsEnglish
PharmacologyCommerce
Theoretical PhysicsInternational Relations
Electrical and Electronic EngineeringPsychology
Computer ScienceManagement
GeographyBusiness Management
HistoryPolitical Science
Electrical EngineeringBusiness Administration
MathematicsNatural Sciences
LawMechanical EngineeringInformation Technology
Engineering
Createch Not Createch
Share of degrees
2% 4% 6% 8% 10% 12%

An analysis of Createch R&D business activity in the UK
11
We note with interest that key Arts, Humanities and Design qualifications tend to be overrepresented have a stronger presence in the createch skills base: for example, English Literature and Philosophy subjects are twice as frequent amongst createch key personnel than we would expect given the size of the sector’s skills base. Communication and Media studies qualifications are seven times more frequent in the Createch skillsbase than we would expect although this comprises a very small number of qualifications (0.7 per cent of the total). These results suggest that a variety of disciplines including subjects beyond STEM contribute to the createch workforce and leadership, underscoring the importance of ensuring their steady supply for the success of the sector.
c. Geography of createch businesses in the UK
There are multiple connections between place and R&D: R&D-intensive companies tend to cluster together in locations that provide access to skills, knowledge and infrastructure. In doing so, they benefit from knowledge spillovers that increase their innovation and productivity. Building on a series of publications investigating the geography of the UK’s creative economy, Nesta’s Creative Nation7 showed that the creative industries display a propensity to cluster in a few places in the UK and in particular London over and above what we see in the rest of the economy. Similar evidence about geographical clustering of technology companies has been provided by TechNation.8 We might expect createch businesses to be even more geographically concentrated than either creative or technology businesses. The reason for this is that createch requires more complex combinations of capabilities which might be easier to access in larger and more diverse creative ecosystems, and might benefit from face-to-face interaction enabled by geographical proximity.
In order to explore this question, we begin by plotting, in the left hand panel of Figure 3, the number of active createch companies in different segments in local economies in the UK (defined according to the official Travel to Work Area – TTWA – geography9) expressed as a per cent of the corresponding UK population, also including the number of participations in publicly funded createch R&D projects led by organisations in these locations. In the right hand panel we present the level of createch density in a location, calculated as the share of createch companies in a TTWA normalised by its share of all creative local establishments based on IDBR data and the DCMS definition. Both charts focus on the top 30 TTWAs by number of creative establishments in the IDBR data.

An analysis of Createch R&D business activity in the UK
12
Figure 3: The left hand panel shows the shares of activity in createch sectors and non-createch sectors based on CrunchBase, createch research participations based on the Gateway to Research, and creative industries establishments according to the Interdepartmental Business Register (logarithmic scale in horizontal axis). The right hand panel is a measure of relative representation of createch businesses in local creative industries, calculated as the ratio of createch share to creative industries share in each TTWA
The chart shows much higher levels of concentration in createch segments than in the wider creative industries. As an example, London accounts for 32 per cent of all creative industries establishments and 57 per cent of all createch establishments. The level of concentration is higher for some createch segments such as AI and Data, with 78 per cent of all businesses based in London, and Blockchain, where almost nine in ten businesses are based in the capital, perhaps unsurprisingly given the importance of financial services there). Creative
0.01%0.02% 0.1% 0.2% 1% 2% 10% 20% 100%
Share of UK activity
0.0 0.5 1.0 1.5
Createch representation
London
Slough and Heathrow
Manchester
Guildford and Aldershot
Reading
Birmingham
Luton
Bristol
Cambridge
Crawley
Glasgow
Edinburgh
High Wycombe and Aylesbury
Milton Keynes
Leeds
Oxford
Brighton
Southampton
Leicester
Chelmsford
Newcastle
Nottingham
Tunbridge Wells
Stevenage and Welwyn Garden
Southend
Basingstoke
Swindon
Cardiff
Belfast
Sheffield
AI & data All Createch Blockchain Computing Createch research participations
Creative content Creative industries establishments Creative services Not createch
Category

An analysis of Createch R&D business activity in the UK
13
services is the more evenly dispersed createch segment, with almost half of businesses located outside of London. It is worth noting that the levels of geographical concentration of non-createch businesses in CrunchBase are also very high, suggesting the presence of shared drivers of agglomeration for createch and non-createch companies such as access to finance, skills and clients.
Research participation in createch projects is much less concentrated geographically than business activity, with London leading 30 per cent of all createch projects funded by UKRI (vs. 57 per cent of business activity). This result suggests that public funding for createch R&D might be helping to attenuate the tendency towards geographical concentration in createch R&D activity, and to nurture the evolution of future clusters (We consider these issues in further detail below.)
The right hand panel of Figure 3 shows the ratio between the share of createch companies accounted by a TTWA and its share of creative businesses according to IDBR data. In addition to London, we find overrepresentation of createch business in creative clusters such as Bristol, Cambridge, Glasgow, Edinburgh, Newcastle, Cardiff and Belfast and parity between both categories in Manchester, Brighton, Oxford and Sheffield. By contrast, ‘creative conurbations’ in the greater South East such as Slough and Heathrow, High Wycombe and Aylesbury or Luton, which have been shown to account for high levels of creative employment in previous research display lower levels of createch intensity, perhaps suggesting that it is dense urban ecosystems that are more conducive to the development of strong createch clusters.
Factors associated with createch agglomeration
What local factors are associated with the development of createch clusters? We have calculated relative specialisation in createch business activity by TTWA, a measure of clustering, and calculated its correlation coefficient (Spearman rho) with other local factors that might be associated with it.10 These include:
• Relative specialisation in publicly funded creative industries research based on the presence of businesses that participate in createch projects derived from the analysis in our previous createch R&D report.11
• Relative specialisation in creative industries based on local establishments from the IDBR.
• Creative industry diversity calculated as the entropy of the distribution of each TTWA over its creative industries based on the DCMS classification.
• Createch research diversity calculated as the entropy of the distribution of createch research participations over different segments.
We present the results in Figure 4. They show positive and, in most cases, moderate associations between all the considered variables and a TTWA’s createch clustering, suggesting that places with stronger creative clusters and density of participation in createch research, and more diverse industrial and research ecosystems tend to display higher levels of createch clustering. We note the strong correlations between measures of industrial and research activity and diversity, highlighting complex interdependencies between different aspects of creative ecosystems.

An analysis of Createch R&D business activity in the UK
14
Figure 4: Correlation between a TTWA’s specialisation in createch business activities and potentially relevant variables
Local innovation system
We conclude our exploration of the geographic dimensions of createch in the UK by comparing its business geography with a createch research geography derived from the GtR data. In order to do this, we calculate the ratio between the share of createch research projects in a TTWA and its share of business activity. A value over one would suggest that a location is over-represented in research collaborations given its levels of industrial activity, while a value below 1 would suggest the opposite.12
Figure 5 presents the results. It shows that cities like Oxford, Cambridge, Southampton, Bristol and Edinburgh have higher levels of participation in publicly funded createch R&D activities given the size of their createch business population. By contrast, London displays lower levels of participation in publicly funded createch R&D activities given the size of its createch business ecosystem.
0.8
0.6
0.4
0.2
0.82 0.76
0.73
0.73
0.53
0.52 0.82
0.62 0.76
0.41
0.47
0.47 0.41
0.52 0.62
0.24 0.41
0.530.24
0.41
All Createch
Createch research participations
Creative industries (IDBR)
Diversity (IDBR)
Diversity (research)
All Cre
atech
Diversi
ty (ID
BR)
Diversi
ty (r
esea
rch)
Create
ch re
search
particip
ations
Creativ
e ind
ustri
es
(IDBR)

An analysis of Createch R&D business activity in the UK
15
Figure 5: Ratio between the share of participations in createch research collaborations funded by UKRI and the share of createch companies in a TTWA
d. Access to finance
Previous TechNation’s reports have evidenced rapid growth in the levels of investment in createch which are forecasted to continue in the future. We build on that analysis with a model of access to finance in createch businesses that leverages CrunchBase investment rounds data, which contains information about 13,314 funding events involving companies in our restricted dataset between 2010 and 2021.13 Our goal is to compare investment outcomes between createch and non-createch firms after controlling for other factors. Our prior is that createch firms that combine creativity, technology and business model innovation in novel and unexpected ways might experience stronger barriers accessing finance than technology businesses operating in more traditional verticals – this might be because these combinations might be hard to benchmark against existing ventures, require new skillsets in investors, or bring new forms of risk into a venture.
Oxford
Cambridge
Southampton
Slough and Heathrow
Leicester
Bristol
Guildford and Aldershot
Edinburgh
Reading
Chelmsford
Glasgow
Leeds
Birmingham
Luton
Milton Keynes
Manchester
Brighton
High Wycombe and Aylesbury
Crawley
London
Number of Createch businesses
10 20 100 200 1,000 2,000
0.0 0.5 1.0 1.5 2.0 2.5 3.0 3.5

An analysis of Createch R&D business activity in the UK
16
We begin exploring this question in Figure 6, where we consider the proportion of companies in our data with at least one financing event. It shows a higher proportion of companies with at least one financing event in all createch categories with the exception of creative services. Since creative services are the largest createch segment, they bring the average down for createch so that in aggregate terms, createch and non-createch firms end with similar proportions of funding events. Understanding what factors lead to lower rates of financing activity in createch creative services (such as for example more competition, less scalable business models or geography – as noted before, a larger share of creative service companies are based outside of London) is an important question for further research.
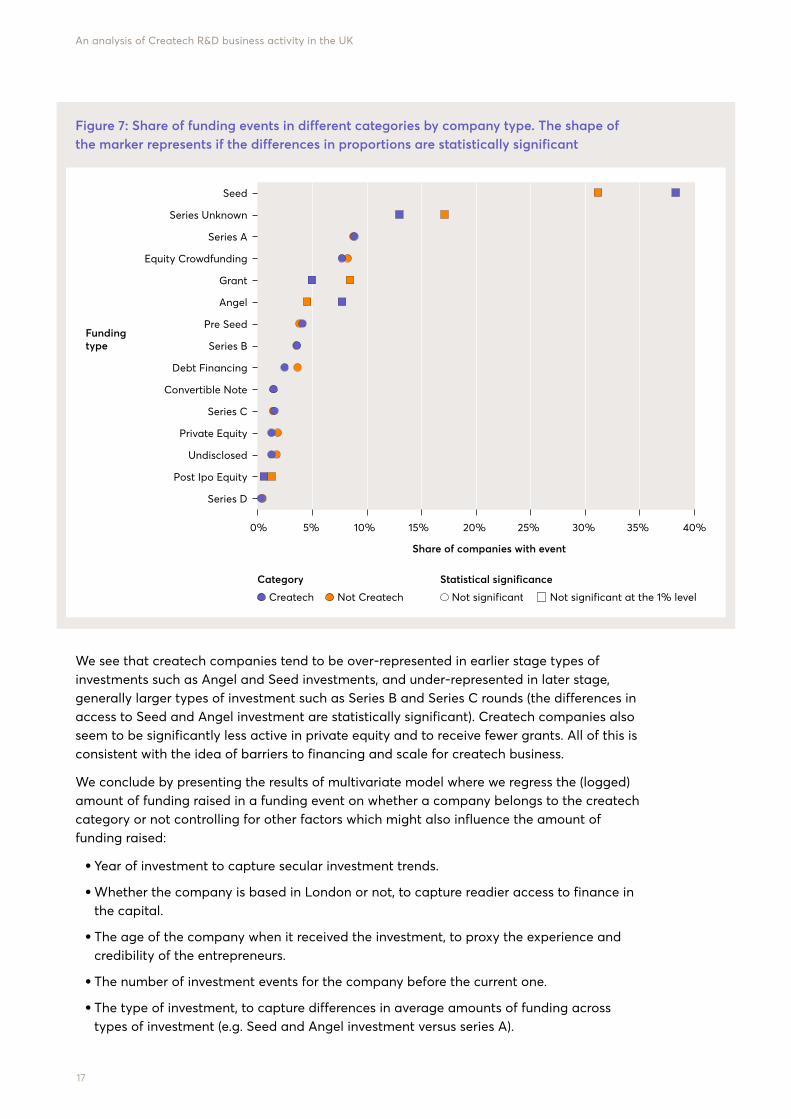
Before implementing our comparative analysis we consider, in Figure 7, whether createch companies tend to be involved in different types of funding events compared with non-createch firms focusing on the top 15 most frequent investment categories accounting for 97 per cent of all funding events.
Figure 6: Share of companies in our dataset with at least one funding event by createch category
0% 10% 20% 30% 40% 50% 60%
% of firms with investment event
Category
Blockchain
Computing
AI and Data
Creative content
All Createch
Not Createch
Creative services
An analysis of Createch R&D business activity in the UK
17
We see that createch companies tend to be over-represented in earlier stage types of investments such as Angel and Seed investments, and under-represented in later stage, generally larger types of investment such as Series B and Series C rounds (the differences in access to Seed and Angel investment are statistically significant). Createch companies also seem to be significantly less active in private equity and to receive fewer grants. All of this is consistent with the idea of barriers to financing and scale for createch business.
We conclude by presenting the results of multivariate model where we regress the (logged) amount of funding raised in a funding event on whether a company belongs to the createch category or not controlling for other factors which might also influence the amount of funding raised:
• Year of investment to capture secular investment trends.
• Whether the company is based in London or not, to capture readier access to finance in the capital.
• The age of the company when it received the investment, to proxy the experience and credibility of the entrepreneurs.
• The number of investment events for the company before the current one.
• The type of investment, to capture differences in average amounts of funding across types of investment (e.g. Seed and Angel investment versus series A).
Figure 7: Share of funding events in different categories by company type. The shape of the marker represents if the differences in proportions are statistically significant
Category
Createch Not Createch
Statistical significance
Not significant Not significant at the 1% level
Seed
Series Unknown
Series A
Equity Crowdfunding
Grant
Angel
Pre Seed
Series B
Debt Financing
Convertible Note
Series C
Private Equity
Undisclosed
Post Ipo Equity
Series D
0% 5% 10% 15% 20% 25% 30% 35% 40%
Share of companies with event
Fundingtype

An analysis of Createch R&D business activity in the UK
18
Our results show higher amounts raised in investment events that involve companies based in London, in more recent years, and with companies that are older in the year when they received the investment. Even after we adjust for all these factors, and for the investment type, we find that investment events involving createch firms tend to raise between 22 per cent and 34 per cent less, supporting the idea that createch firms face barriers accessing finance even after we adjust for other potential explanatory factors.
Figure 8: High density intervals and mean regression score for the amount of pounds raised in an investment event (logged) on key explanatory variables
-0.5 -0.4 -0.3 -0.2 -0.1 0.0 0.1 0.2 0.3 0.4
97% high Density Interval
Category
London-based
Year of investment
Company age inthe investment
Number of previousinvestments
Createch
An analysis of Createch R&D business activity in the UK
19
4
ConclusionsWe have deployed a complex machine learning pipeline to identify R&D-intensive createch businesses in the CrunchBase dataset. Our analysis shows that this group comprises a diverse set of businesses developing tools, platforms and content aimed at creative markets. When we look at the educational background of key personnel in createch companies we find a strong presence of Arts, Humanities and Design degrees compared with the non-createch baseline, supporting the idea that companies at the intersection of the arts, creativity and technology need access to talent with skills that go beyond STEM alone.
When we focus on the geography of createch, we find strong concentrations of createch businesses in dense creative clusters and particularly London. By contrast, publicly funded createch-related research activities are more evenly spread across the UK, consistent with the idea that this funding can play a role in mitigating a strong tendency towards concentration in complex createch R&D activities, particularly if this public funding spurs entrepreneurial spinouts and strengthens local ecosystems. Our analysis of co-location between createch business activity, research and the broader creative industries base reinforces this idea by showing a strong association between indicators capturing creative specialisation and economic diversity.
Our analysis of access to finance suggests that there are some barriers to accessing finance for R&D-intensive createch companies: although the share of businesses that have received at least one investment is higher in most createch categories than outside createch, the amounts raised are 33 per cent lower after we control for many potential confounding factors including the location of the company and its age and the type of investment. This suggests there may be particular challenges that createch businesses face when seeking finance that might have to be addressed through targeted interventions.
The createch programme of research led by the AHRC, the Creative Industries Policy and Evidence Centre, the Creative Industries Council and TechNation has demonstrated createch’s potential as a driver of investment, entrepreneurship, innovation and growth, but also some of the challenges standing in the face of a ‘createch economy’ which is deeply interdisciplinary, reliant on strong industrial diversity that tends to be present only in the largest creative clusters and in particular London, and involving complex combinations of creativity and technology that might be perceived as especially risky. We hope that the evidence generated by this programme of research helps UK policymakers to put in place educational, research, cluster building and investment and funding interventions to overcome these challenges and to realise createch’s economic and expressive potential.

An analysis of Createch R&D business activity in the UK
20
Limitations and issues for further research
Perhaps the strongest limitation in the analysis we have presented in this report is its reliance on company descriptions from the CrunchBase data: the need to focus on companies with longer descriptions where our semantic methods are more likely to yield accurate results reduces the size of our dataset in a way that is likely to underestimate the scale of the createch phenomenon in the UK, and prevents us from undertaking deep longitudinal analyses (some of these analyses can be found in TechNation’s study of createch investment trends).
Using short company descriptions to estimate their level of technological sophistication through a predictive model of the industry they belong to as we do here is an imperfect strategy that could be greatly enhanced with additional information about business’ innovation activities such as publications, patents and software development, as well as the background of their founders and the jobs they hire.
As we have noted throughout, several of the results we present here lend themselves to a variety of interpretations that are difficult to adjudicate between without access to additional data. For example, does the weak association between createch business and research activity that we find reflect a geographical mismatch between the locus of entrepreneurship and research in the UK, gaps in technology transfer and knowledge exchange between university and industry in particular locations, or differences in R&D intensity and business maturity across createch clusters? Other methods will be required to address those questions. The createch business R&D survey to be undertaken by Creative Industries Policy and Evidence Centre researchers building on our work here will help address those gaps in the evidence gap for creative industries and createch policymakers in the UK.

21
An analysis of Createch R&D business activity in the UK
Appendix: Our createch identification pipeline
In order to implement our definition of createch R&D (‘businesses that produce advanced technological knowledge applied in artistic, creative and cultural domains’) we need to:
1. Identify creative businesses and applications of technology.
2. Measure technological innovation activities in business.
We take the following steps to do this:
1. We identify all UK-based companies in CrunchBase (97,000 companies using the data accessed on August 2021).
2. We fuzzy match CrunchBase with Companies House, the UK business register in order to create a matched dataset of Crunchbase companies and 4-digit Standard Industrial Classification (SIC) codes. This yields 24,000 matches with a high level of certainty (match score over 80 in a scale from 1 to 100).
3. We identify creative companies in the CrunchBase data as those which are in creative SIC codes based on the DCMS classification in the fuzzy matched dataset from step 2 or have been tagged with creative industries categories in CrunchBase (this has the goal of capturing companies that were not fuzzy matched with Companies House as well as creative companies that may have been incorrectly classified outside of the creative SIC codes). This yields a very large 48,300 companies (around half of the CrunchBase database, which is not surprising given the inclusion of IT, Software and Computer Services in the creative industries DCMS classification).
4. We analyse the text descriptions of companies identified as creative using two strategies in parallel:
h We train a topic model on the corpus of creative CrunchBase company descriptions. This topic model yields a list of topics (groups of words that tend to appear in the same documents) and a weight for each topic in each document. We identify technology-related topics in this list of topics.
h We search for keywords related to emerging technologies in company descriptions. This search is enhanced by the use of word embedding techniques that help us to identify keywords that are related to those in our initial seed list.
22
An analysis of Createch R&D business activity in the UK
5. We train a predictive model on the CrunchBase-Companies House labelled dataset using creative industries DCMS industries as the target variable (based on company 4-digit SIC codes from Companies House) and company descriptions as the inputs, and removing companies with very short descriptions (less than 75 characters). This model yields sector predictions for 24,512 companies in the data. We use our predictions for the IT, Software and Computer Services category as a proxy for whether a company is involved in advanced technological innovation (i.e. carry out computer programming activities to create or adapt technologies to its needs).
6. We combine the outputs from all the aforementioned steps in order to identify createch companies and classify them into createch segments based on the same categories that we used in our previous analysis of public funding for createch research and development.14 More specifically:
h We tag companies with a createch category if they have a high weight on a topic related to a category, or their description contains keywords related to that category, and they have a predicted IT, Software and Computer Services label (produced in step 5) above 0.4 (18,600 companies out of 24,512 with any label – a high share that might have been expected given the prevalence of digital technology companies in the CrunchBase database).
h In the case of createch categories with a weaker creative, cultural or aesthetic element such as AI and Data, Computing or Blockchain, we require that the company has also been tagged with a high probability in a creative sub-sector other than ‘IT and Computer Services’ (a predicted label over 0.5 for any DCMS creative sub-sector – just under 9,000 companies fall in this category). This has the goal of focusing our analysis on technology innovation activities with a stronger creative component and, for example, exclude IT & software companies developing AI systems for the energy or biomedical sectors.
h We implement a heuristic step where companies in non-IT creative SIC codes that have not been assigned to a createch category previously, and which have a high predicted tech label, are automatically tagged with their most likely createch category.15 This is based on the assumption that software-intensive companies in (non-IT) creative SIC codes in CrunchBase are very likely to be operating in createch segments even if they are not identified by the semantic methods we described in step 4.
We remove from our final dataset any companies with description lengths below 250 characters.

23
An analysis of Createch R&D business activity in the UK
References
Endnotes
‘Boundless Creativity Report: Culture in a time of COVID-19’, Department for Digital, Culture, Media and Sport, and the Arts and Humanities Research Council, 2021.
‘The Createch Report 2021: Mapping the Intersection of Technology and Creativity. Part 1: Investment’, Commissioned by the Creative Industries Council, 2021.
‘The Createch Report 2021: Mapping the Intersection of Technology and Creativity. Part 2: The Future of Technology and Creativity’, Commissioned by the Creative Industries Council, 2021.
‘The Future UK Teach Built: Tech Nation Report 2021’, Tech Nation, 2021.
Mateos-Garcia, J., “Mapping the R&D Landscape for Creative Technologies”, Nesta, 2021
Mateos-Garcia, J., Klinger, J., & Stathoulopoulos, K., ‘Creative Nation: How the Creative Industries are Powering the UK’s Nations & Regions’, Nesta, 2018.
Rotolo, D., Hicks, D., & Martin, B., ‘What is an Emerging Technology’, Research Policy, 44:10 Pg. 1827-1843. 2015.
Siepel, J., Camerani, R., Masucci, M., ‘Skills Combinations and Firm Performance’, Small Business Economics, 56. Pg. 1425-1447. 2021.
1. technation.io/the-createch-report-2021/#methodology
2. technation.io/the-createch-report-2021-part-2/#executive-summary
3. www.sciencedirect.com/science/article/abs/pii/S0048733315001031
4. pec.ac.uk/policy-briefings/mapping-the-r-d-landscape-for-creative-technologies
5. Some examples include The Brighton Fuse and Siepel et al (2021).
6. This is based on the same formula as Ballasa’s Revealed Comparative Advantage index.
7. TTWAs are derived to reflect self-contained areas in which most people both live and work, and as such approximate labour market areas.
8. www.nesta.org.uk/report/creative-nation
9. technation.io/report2021
10. One advantage of using relative specialisation indices is that they are already normalised by a location’s size, allowing us to control implicity for that factor.
11. www.pec.ac.uk/policy-briefings/mapping-the-r-d-landscape-for-creative-technologies
12. Interpreting the sources of variation in this indicator goes beyond the scope of this report – it could be that local createch businesses are less focused on activities that require collaboration with universities or aware of opportunities for collaboration, or that universities are less engaged with their local ecosystems than in other places.
13. i.e. the dataset of companies with sufficiently large text descriptions to be incorporated into our analysis.
14. They are ‘AI and data’, ‘Creative content’, ‘Creative Services’, ‘Computing’ and ‘Blockchain’.
15. For example, companies in ‘Music and Performing Arts’ SIC codes are labelled in Creative Content, and ‘Advertising’ companies are labelled in Creative Services’.

Creative Industries Policy and Evidence Centre (PEC) 58 Victoria Embankment London EC4Y 0DS
+44 (0)20 7438 2500 [email protected] @CreativePECwww.pec.ac.uk
The Creative Industries Policy and Evidence Centre is led by Nesta. Nesta is a registered charity in England and Wales with company number 7706036 and charity number 1144091. Registered as a charity in Scotland number SCO42833. Registered office: 58 Victoria Embankment, London, EC4Y 0DS.
9 781913 095475