
An Analysis of 2013 Health Center Oral Health Provider...
48
An Analysis of 2013 Health Center Oral Health Provider Recruitment, Retention, and Job Satisfaction Survey Results
-
Upload
phungkhuong -
Category
Documents
-
view
218 -
download
4
Transcript of An Analysis of 2013 Health Center Oral Health Provider...

An Analysis of 2013 Health Center Oral Health Provider Recruitment, Retention,
and Job Satisfaction Survey Results

EXECUTIVE SUMMARY 1
INTRODUCTION AND METHODOLOGY 2
PART I: SURVEY FOR ORAL HEALTH PROVIDERS 4A. Overview of Respondents 4B. Reason for Working at Health Center and Sense of Autonomy 8C. Salaries and Benefits 9D. Experience in Health Centers 12E. Job Satisfaction 18
PART II: SURVEY FOR EXECUTIVE DIRECTORS 20A. Oral Health Component 20B. Number of Oral Health Providers 20C. Oral Health Vacancies 21D. Salaries and Benefits of Dentists, Dental Hygienists and Oral Health Program Managers 23
PART III: ANALYSIS AND DISCUSSION 25A. Summary of Associations 25B. Details of Statistically Significant Associations 26C. Discussion 28
REFERENCES 31
Appendix A: Survey for Oral Health Providers 32Appendix B: Executive Director Survey Questions 37Appendix C: Distribution of Salaries by Survey Year 41Appendix D: Budgeted and Employed Oral Health Positions, 2013 v. 2009 42Appendix E: Salaries by Level of Experience 43Glossary of Statistical Terms 44
CREDITS 45
TABLE OF CONTENTS
© National Network for Oral Health Access, September 2014
The information in this document was accurate at the time of this printing. As regulations and information regarding Health Centers are not static, NNOHA recommends that readers verify any critical information related to state regulations and take into account that changes may have occurred since the time of this printing.
This publication was supported by Grant/Cooperative Agreement No. #U30CS09745 from the Health Resources and Services Adminis-tration (HRSA). Its contents are solely the responsibility of the authors and do not necessarily represent the official views of HRSA.

EXECUTIVE SUMMARY
As part of a Cooperative Agreement with the Health Resources and Services Administration (HRSA), the National Network for Oral Health Access (NNOHA) worked with Baylor College of Dentistry in 2013 to develop and administer a survey of Health Center oral health providers and executive directors. The purpose of the survey was to provide information and analysis on oral health provider salaries, oral health provider satisfaction, and recruitment and retention strategies at Health Centers throughout the country. The survey was mailed to all Health Centers in the United States and was completed by 457 dentists, 144 dental hygienists, and 246 executive directors.
Highlights of key findings are as follows:
■ The majority of Health Center oral health providers are satisfied with their careers. Eighty-four percent of dentists and 94% of dental hygienists indicated intent to remain employed at Health Centers.
■ The number one reason for choosing Health Center careers indicated among dentists and dental hygienists was that they “felt a mission to the dentally underserved population.”
■ The majority of respondents indicated a high degree of satisfaction with their benefits and work environments, such as the quality of support staff.
■ Twenty-nine percent of executive directors reported having at least one dentist vacancy, and of those vacancies, only 35.6% were longer than 6 months in duration.
■ A large group of dental directors (39.8%) and dentists (26.3%) indicated that their salaries were greater than $140,000 per year (excluding benefits). While the most common salary range for dental hygienists was within the $50,001–$60,000 range, 24% indicated that their salaries were greater than $70,000 per year (excluding benefits).
■ Many oral health providers rotated through a Health Center oral health program before working at a Health Center, including 40.6% of dental directors, 51.7% of dentists, and 60.1% of dental hygienists.
■ Almost half of the respondents worked in private practices before working at Health Centers. In addition, a high percentage of respondents came to Health Centers immediately after graduating from school.
■ Providers with more years of experience or who had been employed by Health Centers longer were more likely to indicate intent to remain employed at Health Centers.
■ Providers who came to Health Centers because they felt a sense of mission; who perceived adequate interaction with Health Center medical colleagues; and who felt they had adequate administrative support, clerical support, and facilities and equipment were more likely to indicate intent to remain employed at Health Centers.
Survey results suggest that salary alone is not the main reason that oral health providers choose to leave or remain at Health Centers. Other factors also affect providers’ satisfaction with their careers. While some factors contributing to provider dissatisfaction cannot be changed, others can. To improve recruitment and retention rates at Health Center oral health programs, oral heath providers’ work environments and the quality of their interactions with medical colleagues, among other things, should be evaluated, and, when possible, improved. Overall, however, we found that a large number of oral health providers were satisfied with their Health Center careers.
1

Health Centers are public or private not-for-profit organizations that provide preventive and primary health services to populations with limited access to health care. The Health Center designation is available only to programs that meet certain federal requirements and that receive federal grant funds under Section 330 of the Public Health Service Act.
In 2012, there were 1,198 Health Centers receiving Section 330 funding nationwide. Of these, an estimated 891 Health Centers (74%) offered on-site oral health services, providing oral health care to over 4 million patients and medical care to about 18 million patients. In that same year, Health Centers employed 3,326.01 full-time-equivalent (FTE) dentists and 1,435.58 FTE dental hygienists.
In 2010i the National Network for Oral Health Access (NNOHA) published a 2009 survey and a related paper that explored key questions related to Health Center oral health provider recruitment and retention strategies, salaries, and job satisfaction. This paper, which summarizes and interprets the results of a national survey of Health Center oral health providers and executive directors that NNOHA conducted in 2013 under a Cooperative Agreement with the Health Resources and Services Administration (HRSA), updates and expands upon information provided in the earlier survey and paper. Detailed information about 2009 survey results is presented in Appendices C–E.
Health Centers nationwide face challenges in recruiting and retaining health providers, including dentists and dental hygienists. For this reason, Health Centers are eager to find ways to improve oral health providers’ job satisfaction, such as attracting candidates who are likely to remain at Health Centers, offering competitive salaries and benefits, and providing satisfying work environments. We hope that this paper will be of use to Health Centers that are seeking to improve their ability to recruit and retain oral health providers.
Survey DistributionA NNOHA-appointed workgroup provided input on and approval of the survey instruments and helped the primary investigator develop the survey instruments (appendices). The workgroup made minor changes to the 2009 survey questions and substantial changes to the survey-distribution and data-collection methodology. NNOHA e-mailed the 2013 survey to contacts at 1,128 Health Centers, the total number of Health Centers in the United Statesii in 2011 (according to the most recent data available at the time of the survey). This represents a 43.8% increase in the number of survey recipients. Two versions of the 2013 surveys were sent, one to Health Center executive directors and one to oral health providers, with different questions in each version.
i Download the Survey of Health Center Oral Health Providers: Dental Salaries, Provider Satisfaction, and Recruitment and
Retention Strategies, 2010 at http://www.nnoha.org/nnoha-content/uploads/2013/07/Survey-of-Health-Center-Oral-Health-Providers.
pdf.
ii The primary investigator mailed reminder postcards to the 1,128 Health Centers 4-5 weeks after the survey links were sent via
e-mail.
2
INTRODUCTION AND METHODOLOGY

Survey ResponseRespondents to the survey included 457 dentists, 144 dental hygienists, and 246 executive directors. There were 49 respondents who did not report their positions.
Analysis In this paper, we explore the following questions about Health Center oral health provider salaries and job satisfaction:
1. How much does salary affect dentists’ and dental hygienists’ job satisfaction?2. Does work environment have a significant effect on job satisfaction? 3. Do any specific job duties that may be particular to one group have a significant effect on
job satisfaction? 4. Does any part of the structure of the organizational system, its governance, or customer/
client/patient characteristics significantly affect retention of experienced dentists and dental hygienists?
5. Are there any un-alterable factors (e.g., providers’ commitment to helping the underserved, providers’ gender) that may affect dentists and dental hygienists’ job satisfaction?
In the Analysis and Discussion section, the question “Do you intend to remain in Community Health Center-based dentistry” was used as a proxy for job satisfaction. Since planning on leaving a job might be the ultimate result of job dissatisfaction, response to this statement was used as the dependent variable in cross-tabulation, logistic regression, and independent samples t-test association models of statistical analysis. All tests were done using the significance level of α=.05.
Survey ResultsThe narrative section of this paper provides selected tables and figures; additional analyses and the survey instruments are included in the appendices.
3

A. Overview of Respondents Part I of the survey was completed by 650 oral health providers, including 224 (34.5%) dental directors, 233 (35.9%) staff dentists, 144 (22.1%) dental hygienists, and 49 (0.07%) individuals in unreported positions.
1. Respondents by HRSA Regions Dentist (n=457) and dental hygienist (n=144) respondents represented all 10 HRSA regions (Figure 1). The states within each HRSA region are listed in Table 1.
Figure 1. Oral Health Provider Responses by HRSA Region
Table 1. HRSA RegionsRegion StatesRegion I Maine, New Hampshire, Vermont, Massachusetts, Rhode Island, ConnecticutRegion II New York, New Jersey, Puerto Rico, Virgin IslandsRegion III Pennsylvania, Maryland, Delaware, District of Columbia, Virginia, West VirginiaRegion IV Kentucky, Tennessee, North Carolina, South Carolina, Georgia, Florida,
Alabama, MississippiRegion V Minnesota, Wisconsin, Illinois, Indiana, Michigan, OhioRegion VI New Mexico, Texas, Oklahoma, Arkansas, LouisianaRegion VII Nebraska, Kansas, Iowa, MissouriRegion VIII Montana, North Dakota, South Dakota, Wyoming, Colorado, UtahRegion IX Arizona, California, Hawaii, NevadaRegion X Alaska, Oregon, Idaho, Washington
4
PART I: SURVEY FOR ORAL HEALTH PROVIDERS

5
2. Length of Time Practicing Dentistry/Dental HygieneA majority of dental director (n=220), dentist (n=230), and dental hygienist (n=142) respondents had been practicing dentistry or dental hygiene for 10 or more years.
Figure 2: Experience by Health Professional Type
3. Number of Years Practicing Community Health Care DentistryThe mean number of years of practice in Health Center dentistry was 8.2 years for dentists and 6.3 years for dental hygienists.
The median number of years of practice in Health Center dentistry was 5.0 years for dentists and 4.0 years for dental hygienists.
4. GenderThe majority of dentist respondents were female (55.2%, n=446) and a large majority of dental hygienist respondents were female (95.8%, n=143). These ratios are markedly different from national ratios of dentists: 73% male and 26% female.iii
5. Primary Dental Practice Activity Immediately Before Practicing in a Community Health Care SettingMost dentist and dental hygienist respondents were in some form of private practice immediately before starting work at Health Centers (Figures 3 and 4). For both dentists and dental hygienists, the second most common answer was that they were students before starting work at Health Centers.
iii Kaiser State Health Facts—United States: Professionally Active Dentists by Gender, 2012: http://www.statehealthfacts.org/profilei
ndjsp?ind=443&cat=8&rgn=1.

Figure 3. Dentists’ Practice Activity Immediately Before Starting at Health Center (n=435)
Figure 4. Dental Hygienists Activity Immediately Before Starting at Health Center (n=134)
6. Rotation Through a Health Center Oral Health Pro-gram While StudentMany respondents rotated through a Health Center oral health program before working at a Health Center, including 40.6% of dental directors (n=222), 51.7% of dentists (n=232), and 60.1% of dental hygienists (n=143).
7. Receipt of National Health Service Corps Scholarship or Loan Repayment, or Receipt of State Loan RepaymentThe National Health Service Corps (NHSC) loan repayment was the most commonly used
6

award or loan among dental director, dentist, and dental hygienist respondents (Figure 6). Among respondents that had received NHSC loans, 58.2% of oral health directors, 37.5% of dentists, and 81.8% of dental hygienists reported having completed all repayment obligations (Figure 8).
Figure 5. National Health Service Corps Scholarship Program Participation
Figure 6. National Health Service Corps Loan Repayment Participation
Figure 7. State Loan Repayment Participation
7

Figure 8. National Health Service Corps Loan Repayment Obligations Completed
B. Reason for Working at Health Center and Sense of AutonomyRespondents were asked to rank their top reasons for choosing a career in Health Center dentistry or dental hygiene. The number one response indicated by dentists and dental hy-gienists was “Felt a mission to the dentally underserved population.” Table 2 shows reasons that dentists and dental hygienists indicated attracted them to Health Center positions.
Table 2. Main Reason Attracted to Health Center Oral Health Practice
Reason(s) Dentist (n=457) Dental Hygien-ist (n=144)
Felt a mission to the dentally underserved population 42.3% 43.1%Loan repayment was available in Community Health Center practice
19.9% 7.6%
Wished to practice dentistry/dental hygiene in a community-based setting
10.3% 22.2%
Attracted by work schedule/leave policies/fringe ben-efits of Community Health Center practice
9.6% 16.0%
Sold private practice, or retired from government service
6.6% 0.7%
Wished to offer oral health care within an interdisciplin-ary environment
6.1% 3.5%
Unsatisfied with associate/employee dentist or dental hygienist arrangement currently available
5.0% 8.3%
Did not want to invest capital in a private practice or borrow money for a private practice
4.6% 2.8%
Previously published peer-reviewed studies have shown that a number of dentists working in Health Centers did not feel they had full autonomy in treating patients.(1,2) The survey asked both dentists and dental hygienists how they perceived their autonomy in treating Health Center patients. A small majority of dentists (50.2%) and a larger majority of dental hygienists
8

(61.1%) responded that they had full autonomy. Reasons cited by respondents who felt that their autonomy was limited are in Table 3.
Table 3. Perception of Degree of Autonomy in Treating PatientsReason Cited for Perception of Limited Autonomy in Treating Patients Dentist (n=457) Dental Hygien-
ist (n=144)Level of patient compliance with treatment plans/ap-pointment attendance
30.2% 21.5%
Types of services limited due to budget constraints (i.e. lab services)
28.4% 13.9%
Scope of treatment offered at my Health Center 28.2% 11.1%My state’s Medicaid policies/requirements 28.0% 19.4%Amount of access to specialists 25.2% 18.1%Degree of input into policy and budget decisions re-garding oral health services
21.4% 13.9%
Type of patient population served at my Health Center 21.2% 11.8%Number of encounters required 19.9% 13.9%Degree of comprehensive care that can be provided 16.6% 11.8%Degree of guidance from management in the treat-ment of patients
10.7% 9.7%
*Totals number more than 100% owing to multiple responses.
C. Salaries and Benefits 1. Salaries Respondents were asked to choose from a categorical selection of salary ranges that would indicate their gross pre-tax annual salary, not including the value of benefits. All dentists were grouped into five salary categories for statistical purposes. Similarly, dental hygienists were grouped into five salary categories.
Figure 9. Distribution of Dental Director Salary (n=196)
9

Figure 10. Distribution of Dentist Salary (n=176)
Figure 11. Distribution of Dental Hygienist Salary (n=93)
Respondents were asked questions about hourly wages for non-salaried or part-time em-ployed positions. Table 4 shows hourly wages.
Table 4. Hourly Wages for Non-Salaried or Part-Time Dentists and Dental HygienistsMean Median
Dentist $66.84 $62.00Dental hygienist $32.44 $34.00
2. Benefits Health Centers offered a wide range of benefits to oral health providers (Table 5). The mean continuing education reimbursement amount for dental directors was $1,849, for dentists $1,789, and for dental hygienists $1,048.The median number of days offered for vacation and sick leave combined was 27 for dental directors, 23.5 for dentists, and 20 for dental hygienists.
10

Table 5. Benefits— Responses of Dentists and Dental Hygienists Answering “Yes”Benefits Dentist Dental HygienistContinuing education allowance 92.4% (n= 449) 84.2% (n=139)Salary incentive plan offered 34.2% (n=441) 19.1% (n=136)403b or similar plan offered 91.3% (n=437) 94.2% (n=137)403b or similar plan match 66.7% (n=436) 78.8% (n=137)Adequate insurance coverage 71.8% (n=429) 72.6% (n=135)Adequate leave time 74.8% (n=433) 66.7% (n=135)Professional dues reimbursed 60.5% (n=433) 49.2% (n=132)
3. Salaries by RegionFigure 12 shows the normalized ratios of 2013 dentist salaries by HRSA Region. The region with the largest percentage of dentist salaries at or below $95K was Region I. The region with the largest percentage of dentist salaries above $140K was Region IX.
Figure 12. Normalized Ratios of Dentist Salaries by HRSA Region (n=384)
Figure 13 shows the normalized ratios of dental hygienist salaries by HRSA Region. The re-gion with the largest percentage of dental hygienist salaries at or below $40K was Region III. The region with the largest percentage of dental hygienist salaries above $70K was Region X. Note the small n value (n=99) when looking to determine national trends.
11

Figure 13. Normalized Ratios of Dental Hygienist Salaries by HRSA Region, 2013 (n=99)
D. Experience in Health Centers Respondents were asked about their perceptions about work environment and perquisites available to them in Health Centers.
1. Perceptions of Facility Appearance and Conditions A large majority of respondents (both dentists and dental hygienists) rated their facilities as very good or good, both in terms of physical building condition and appearance and in terms of equipment condition and oral health supplies (Figures 14–17).
Figure 14. Dentists’ Perceptions of Facility Appearance and Condition (n=432)
12

Figure 15. Dental Hygienists’ Perceptions of Facility Appearance and Condition (n=132)
Figure 16. Dentists’ Perceptions of Equipment Condition and Oral Health Supplies (n=435)
Figure 17. Dental Hygienists’ Perceptions of Equipment Condition and Oral Health Supplies (n=133)
13

2. Workplace Environmental IndicatorsSimilarly, as illustrated by Table 6, respondents were generally satisfied with oral health pro-gram staffing and support in their workplaces.
Table 6. Perception of Workplace Environmental Indicators: Responses of Dentists and Den-tal Hygienists Who Answered “Yes”
Workplace Environmental Indicator Dentist (n=457) Dental Hygienist (n=144)
Adequate quality/experience of dental assis-tants 72.6% 70.8%
Adequate number of dentists 69.8% 61.1%Adequate number of dental assistants 65.9% 68.8%Adequate administrative support 65.6% 68.1%Adequate dental assistant to dentist ratio 63.7% 74.3%Adequate number of dental hygienists 63.5% 72.2%Adequate interaction with medical colleagues at Health Center 60.8% 61.1%
Adequate clerical support 58.4% 52.8%Adequate number of Expanded Functions Dental Assistants (EFDAs) 29.8% 40.3%
3. Night or Weekend On-Call Responsibilities On-call weekend and evening duties were perceived as occurring either “seldom” or “never” by 81.5% of the dentist respondents, but 18.4% perceived that on-call duties were “often” or “too often.”
4. Administrative DutiesA series of questions aimed at oral health providers who have administrative duties (n=310) were designed to elucidate perceptions about adequacy of time allowed to fulfill those duties, time spent in clinical care, and time spent in administrative work. The mean number of hours spent in direct patient care for providers with administrative duties was 30.5 hours per week, with a mean of 9.7 hours performing administrative work. Figure 18 shows perceptions of time allowed to fulfill administrative duties.
Figure 18. Oral Health Professionals: Perception of Enough Time to Complete Administra-tive Duties (n=310)
14

Health Centers employ different types of organizational structures and chains of command. In most cases, dental directors were accountable to individuals with the following titles: chief executive officer/executive director: 57.3%, chief medical officer/medical director: 27.2%, and chief operating officer/director of operations: 10.2%.
5. Access to SpecialistsRespondents were asked about the availability of and perceived need for specialists. Spe-cialists perceived as most needed were pediatric dentists (36.8%) followed by oral surgeons (29.7%). More information about perceived need for specialists is shown in Table 7.
Table 7. Specialists Perceived as Most Needed by Health Center Oral Health Provider Re-spondentsType of Specialist n %Oral surgeon 193 29.7Pediatric dentist 239 36.8Periodontist 54 8.3Prosthodontist 12 1.8Orthodontist 23 3.5Some other kind 44 6.8None are needed 25 3.8
Table 8 outlines the types of specialists that respondents reported as being available at Health Centers. While most (59.8%) responded that no specialists were available at the Health Center, when specialists were available, the type most often available was pediatric dentist (18.0%).
Table 8. Availability of Specialists (All Respondents)Type of Specialist n %Oral surgeon 93 14.3Pediatric dentist 117 18.0Periodontist 29 4.5Prosthodontist 23 3.5Orthodontist 4 0.6Other (incl. endodontists) 18 2.8No specialists available 389 59.8
6. Assistant-to-Dentist RatiosAll respondents were asked to quantify the assistant-to-dentist ratio as an additional measure of job satisfaction perception, with the assumption being that having an opti-mal ratio improves productivity and can lead to increased job satisfaction. Figure 19 shows ratios.
15

Figure 19. Dental-Assistant-to Dentist Ratio (n=562)
7. Minimum Number of EncountersAll respondents were asked if their Health Center’s administration required a minimum num-ber of annual encounters and what that number was. A majority (64.5%) stated they had been informed by someone in their Health Center’s administration that there was a minimum an-nual encounter requirement per provider. After adjusting for outliers, the mean number of en-counter requirements for those responding dentists (n=195) was 2,801 per year, per dentist. After adjusting for outliers, the mean number of encounter requirements for those responding dental hygienists (n=36) was 1,952 per year, per dental hygienist.
8. Professional Organizations All respondents were asked about the professional organizations to which they belonged. The most common response from all three respondent groups (dental directors, dentists, and dental hygienists) was “other,” which included organizations such as the American Academy of Pediatric Dentistry, the Special Care Dentistry Association, primary care associations, and regional or state dental or dental hygiene associations. Besides other, the top two profes-sional organizations in which both dental directors and dentists had memberships were the American Dental Association and the Academy of General Dentistry, and the top professional organization in which dental hygienists were members was the American Dental Hygienists’ Association. Organization membership percentages are shown in tables 9–11.
Table 9. Dental Director Membership in Professional Organizations (n = 224)Type of Professional Organization n %National Network for Oral Health Access 127 56.7American Dental Association 142 63.4American Dental Hygienists’ Association 1 0.4National Dental Association 9 4Hispanic Dental Association 1 0.4American Association of Public Health Dentistry 12 5.3Academy of General Dentistry 42 18.7American Public Health Association 2 0.9None of these 16 7.1Other 188 83.9
16

Table 10. Dentist Membership in Professional Organizations (n = 233)Type of Professional Organization n %National Network for Oral Health Access 56 24American Dental Association 138 59.2American Dental Hygienists’ Association 0 0National Dental Association 6 2.6Hispanic Dental Association 3 1.3American Association of Public Health Dentistry 5 2.1Academy of General Dentistry 47 20.2American Public Health Association 0 0None of these 49 21Other 209 89.7
Table 11. Dental Hygienist Membership in Professional Organizations (n = 144)Type of Professional Organization n %National Network for Oral Health Access 36 25American Dental Association 6 4.2American Dental Hygienists’ Association 67 46.5National Dental Association 1 0.7Hispanic Dental Association 0 0American Association of Public Health Dentistry 5 3.5Academy of General Dentistry 1 0.7American Public Health Association 3 2.1None of these 44 30.5Other 138 95.8
Reimbursement for membership dues by Health Center practices was reported for 60.5% of the dentist respondents (n=433) and for 49.2% of the dental hygienist respondents (n=132).
17

E. Job Satisfaction As a proxy measure of provider job satisfaction, respondents were asked if they intended to remain employed at Health Centers. Figures 20 and 21 show percentages of respondents who intended to remain, and Figure 22 shows timelines for those who intended to leave.
Figure 20. Dentists’ Intent to Remain Employed at Health Centers (n=433)
Figure 21. Dental Hygienists’ Intent to Remain Employed at Health Centers (n=131)
18

Figure 22. Timeline of Dentists Intending to Leave Health Centers (n=71)
Only eight dental hygienists (6.1%) planned to leave their Health Centers: four indicated as soon as another opportunity opened, three indicated plans to leave in the next 2–5 years, and two indicated within the next year (one respondent selected two responses).
Respondents were asked what they hoped to change if they ever decided to leave Health Center practices, or, for those who indicated intent to leave, the reasons for planning to do so. Results are shown in Table 12.
Table 12. Reason for Intent to Leave Health Center PracticeReason Cited Dentist (n=71) Dental Hygienist (n=8)Need to increase salary 67.6% 100%Desire more autonomy 52.1% 25%Burnout* 49.3% 37.5%Increase scope of practice 47.9% 37.5%Enter private practice 42.2% 25%Need a change in work hours 38% 25%Encounter rates too high* 28.2% 25%Enter academics* 9.9% 0%Plan on retiring 8.5% 12.5%
*Totals are more than 100% due to multiple responses.
19

Of the 1,128 individuals who received the survey for Health Center executive directors, which was disseminated simultaneously with the survey for dentists and dental hygienists, 246 responded (response rate 21.8%). The executive director survey was designed to validate reported salaries from the dentists’ and dental hygienists’ self-reported salaries in the sepa-rately administered survey as well as to determine vacancy rates for oral health provider positions, identify methods used to recruit new hires, and quantify benefits allowed to current employees that encourage retention.
Table 13. Executive Director Responses by HRSA Region
RegionNumber of Executive Director Survey Re-spondents
Number of Executive Directors Who Were Sent the Survey
Regional Response Rate
Region I 22 94 23.4%Region II 20 94 21.3%Region III 21 109 19.3%Region IV 35 195 17.9%Region V 37 148 25.0%Region VI 23 130 17.7%Region VII 25 52 48.1%Region VIII 11 55 20.0%Region IX 39 158 24.7%Region X 12 85 14.1%
A. Oral Health ComponentRespondents were asked if their Health Center had an oral health component. If the answer was “yes,” a full panel of questions was asked about Health Center oral health program operational issues. If the answer was “no,” a limited number of skip logic questions were asked, and the survey was considered complete. Of the 246 respondents, 93.9% answered yes to the question about whether the Health Center had an oral health component. Fifteen (6.1%) answered no, and 40% of those respondents indicated that they contracted with private practice dentists for services. In three Health Centers, these reimbursements were fee-for-service, and in three others the reimbursements were by a flat rate per encounter. Of the 15 respondents who indicated that their Health Center had no oral health component, 10 (66.7%) planned to add oral health services in the next 3 years.
B. Number of Oral Health Providers Respondents were asked how many dentists, dental hygienists, and dental assistants their Health Center currently employed and what the budgeted numbers of positions were in their Health Center. Table 14 shows budgeted and employed oral health positions in Health Cen-ters.
20
PART II: SURVEY FOR EXECUTIVE DIRECTORS
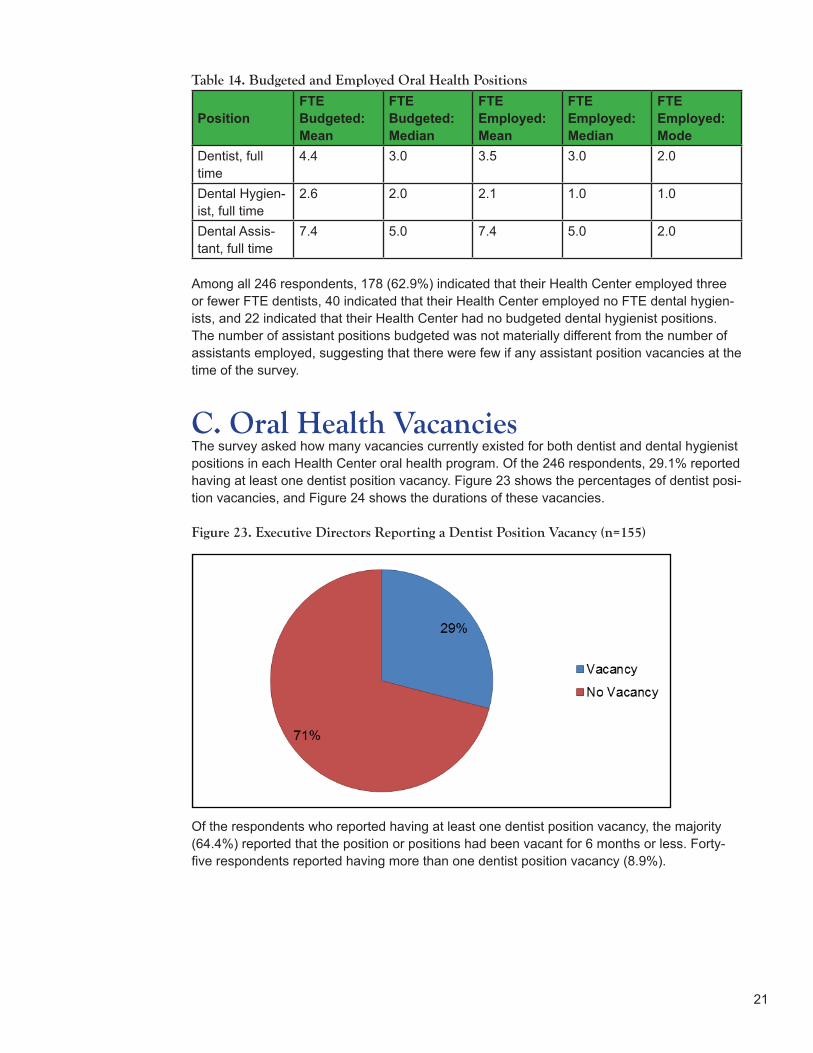
Table 14. Budgeted and Employed Oral Health Positions
PositionFTE Budgeted: Mean
FTE Budgeted: Median
FTE Employed: Mean
FTE Employed: Median
FTE Employed: Mode
Dentist, full time
4.4 3.0 3.5 3.0 2.0
Dental Hygien-ist, full time
2.6 2.0 2.1 1.0 1.0
Dental Assis-tant, full time
7.4 5.0 7.4 5.0 2.0
Among all 246 respondents, 178 (62.9%) indicated that their Health Center employed three or fewer FTE dentists, 40 indicated that their Health Center employed no FTE dental hygien-ists, and 22 indicated that their Health Center had no budgeted dental hygienist positions. The number of assistant positions budgeted was not materially different from the number of assistants employed, suggesting that there were few if any assistant position vacancies at the time of the survey.
C. Oral Health Vacancies The survey asked how many vacancies currently existed for both dentist and dental hygienist positions in each Health Center oral health program. Of the 246 respondents, 29.1% reported having at least one dentist position vacancy. Figure 23 shows the percentages of dentist posi-tion vacancies, and Figure 24 shows the durations of these vacancies.
Figure 23. Executive Directors Reporting a Dentist Position Vacancy (n=155)
Of the respondents who reported having at least one dentist position vacancy, the majority (64.4%) reported that the position or positions had been vacant for 6 months or less. Forty-five respondents reported having more than one dentist position vacancy (8.9%).
21

Figure 24. Duration of Dentist Position Vacancies (n=45)
In contrast, only 14 executive directors (9.2%) reported at least one dental hygienist vacancy.
Figure 25 shows percentages of dental hygienist position vacancies, and Figure 26 shows duration of these vacancies.
Figure 25. Executive Directors Reporting a Dental Hygienist Position Vacancy (n=153)
Among respondents who reported having at least one dental hygienist position vacancy, 7 (50%) reported that the position or positions had been vacant for 6 months or less.
22

Figure 26. Duration of Dental Hygienist Position Vacancies (n=14)
Two hundred and forty-six respondents answered the question about the most commonly used methods for recruiting dentists. The most commonly used method was “working with the NHSC” (11.4%), followed by “working with primary care associations” (9.3%).
Because few respondents answered the question about the most commonly used methods for recruiting dental hygienists, the data are not included here.
Respondents were also asked how many applicants had applied for any current dentist or dental hygienist jobs and how many firm offers the Health Center had made to fill vacancies. The median number of applicants for a vacant dentist position was 4.5, and the median num-ber of firm offers made was 1.0. Respondents indicated that the main reason applicants gave for rejecting firm offers of employment was “salary/benefits inadequate.” Because there were few vacant dental hygienist positions and few respondents answered questions about them, the data are not included in this paper.
D. Salaries and Benefits of Dentists, Dental Hygienists, and Oral Health Program ManagersExecutive directors were asked about dentists’ and dental hygienists’ salaries and benefits, for both budgeted vacant positions and for the highest-paid person filling existing positions. Table 15 shows salaries for dentists by level of experience.
Table 15. Salaries for Dentists by Level of ExperienceEntry Level < 1 year
>1 year to 5 years
>5 years to 10 years > 10 years Fringes %
Dentist, Mean $108,927 $111,514 $122,305 $125,519 23.6%
Dentist, Median $110,000 $112,500 $131,000 $135,000 25%
The highest-paid dentist on staff earned a mean of $135,830 and median of $132,500.
23

Table 16. Salaries for Dental Hygienists by Level of ExperienceEntry Level < 1 year
>1 year to 5 years
>5 years to 10 years > 10 years Fringes %
Dental Hygien-ist, Mean $52,093 $48,288 $55,870 $60,953 20.2%
Dental Hygien-ist, Median $48,200 $49,000 $54,000 $62,500 23%
The highest-paid dental hygienists’ on staff earned a mean of $62,001 and a median of $62,500.
One hundred and fifty-three respondents (17.6%) indicated that their Health Centers used contract dentists. The lowest mean and median hourly wages reported were $75.19 and $70.00, respectively. The highest mean and median hourly wages reported were $81.21 and $75.00.
In contrast, only 8 (5.5%) respondents reported using contract dental hygienists. The lowest and highest mean hourly wages were $35.20 and $40.17 for non-employee dental hygienists.
A small majority of respondents (50.9%) reported using a non-clinical oral health program manager to oversee the oral health program. The mean and median salaries of the oral health program manager were $65,504 and $50,500, respectively.
Table 17 shows benefits for dentists and dental hygienists as reported by executive directors.
Table 17. Benefits Offered to Dentists and Dental HygienistsBenefit Dentist Dental HygienistPaid vacation/sick leave 99.3% 93%Paid holidays 98.6% 91.4%Continuing education allowance 96.5% 78.9%Other insurance (disability, life) 95.7% 84.9%Medical insurance 95.1% 82.9%Retirement plan (403b or other) 94.2% 89.7%Tort claims coverage 93.6% 87.2%Dental/dental hygiene license paid 82.6% 66.9%Drug license fees paid 81.8% 45.9%Retirement plan match 75.6% 69.5%
24

A. Summary of AssociationsSignificant associations were found between intent to leave a Health Center and the following variables:
■ Years of Health Center practice
■ Total years of experience
■ Level of perceived autonomy in treating patients
■ Value placed on loan repayment
Significant associations were also found between intent to leave a Health Center and percep-tions of the following work environment indicators:
■ Adequate number of dental assistants
■ Quality of dental assistants
■ Number of Expanded Functions Dental Assistants (EFDAs) employed
■ Administrative support for the oral health program
■ Clerical support (including reception, records, and billing)
■ Quality of facility
■ Condition of dental equipment and supplies
Finally, significant associations were found between intent to leave a Health Center and per-ception of interactions with Health Center medical colleagues.
No significant associations were found between intent to leave a Health Center and the fol-lowing variables:
■ HRSA region in which the center was located
■ Salary reported for either dentists or dental hygienists
■ Variables of NHSC scholarship receipt, federal-loan-repayment assistance, or state-loan-repayment assistance
■ Year of completion of NHSC loan repayment
■ Dentist’s position in the Health Center
■ Provider’s gender
■ Perceived amount of administrative time allowed for providers who had administrative duties
■ Whether providers had rotated through Health Centers when they were in school
■ Title of the individual to whom providers reported administratively
25
PART III: ANALYSIS AND DISCUSSION

In addition, no significant associations were found between intent to leave a Health Center and the following job-satisfaction indicators:
■ Perception of on-call responsibilities
■ Number of dentists, number of dental hygienists, or ratio of dental assistants to dentists
■ Number of vacant dentist or dental hygienist positions in Health Centers with oral health program managers, as opposed to dental directors.
B. Details of Statistically Significant AssociationsYears in Health CenterIntent to leave a Health Center was significantly associated with years of employment in a Health Center. Providers planning to remain in a Health Center had a mean of 8.04 years’ experience, and those planning to leave had a mean of 5.33 years (p<.001, t-test).
Years of ExperienceIntent to leave a Health Center was significantly associated with level of experience (total years of practice) for both dentists and dental hygienists. χ2: p<.05.Using the reference category of ≥10 years, OR=1, odds ratios for intending to leave a Health Center according to experience categories were as follows:
≥5 years but <10 years OR 2.71 ≥1 year but <5 years OR 2.56 Less than 1 year OR 3.57
Interpretation: Providers with less than 1 year of experience were more than three times more likely to indicate intent to leave a Health Center than those with 10 or more years of experience.
AutonomyA provider’s perception that he or she did not have full autonomy in treating patients was significantly associated with intent to leave a Health Center. χ2: p<.001; OR 3.30.Interpretation: Providers who felt that they did not have full autonomy in treating patients were more than three times more likely to indicate intent to leave a Health Center than those who felt they had full autonomy.
Value Placed on Loan RepaymentStating that the number one reason a provider chose to practice at a Health Center was “loan repayment was available in Community Health Center practice” was significantly associated with intent to leave a Health Center. χ2: p<.032; OR 2.06.Interpretation: Providers who valued loan repayment highly were more than twice as likely to indicate intent to leave a Health Center than those who did not value loan repayment highly.
26

Number of Dental AssistantsThe number of dental assistants on staff was significantly associated with intent to leave a Health Center. χ2: p=.024; OR 1.76.Interpretation: Providers who responded that the number of dental assistants was inadequate were almost twice as likely to indicate intent to leave a Health Center as those who responded that the number was adequate.
Quality of Dental AssistantsQuality of dental assistants was significantly associated with intent to leave a Health Center. χ2: p=<.001; OR 2.67.Interpretation: Providers who responded that the quality of dental assistants was inadequate were more than twice as likely to indicate intent to leave a Health Center as those who responded that quality was adequate.
Number of EFDAsNumber of EFDAs at a Health Center was significantly associated with intent to leave a Health Center. χ2: p=.008; OR 2.20.Interpretation: In states where EFDAs are allowed, providers who responded that the number of EFDAs at the Health Center was inadequate were more than twice as likely to indicate intent to leave a Health Center as those who indicated that number was adequate.
Administrative Support Perception of administrative support available was significantly associated with intent to leave a Health Center. χ2: p=.006; OR 1.97. Interpretation: Providers who responded that administrative support at the Health Center was inadequate were almost twice as likely to indicate intent to leave a Health Center than those who indicated that administrative support was adequate.
Clerical SupportPerception of adequacy of clerical support (including reception, records, and billing) was significantly associated with intent to leave a Health Center. χ2: p=.001; OR 1.74. Interpretation: Providers who responded that clerical support in the Health Center practice was inadequate were 1.74 times more likely to indicate intent to leave a Health Center than those who responded that clerical support was adequate.
Interaction with Medical ColleaguesPerception of adequacy of interaction with medical colleagues in the Health Center was significantly associated with intent to leave a Health Center.χ2: p<.001; OR 2.86. Interpretation: Providers who responded
27

that interactions with medical colleagues in the Health Center were inadequate were almost three times as likely to indicate intent to leave a Health Center as those who indicated that interactions were adequate.
Rating of FacilityRating of the Health Center facility was significantly associated with intent to leave a Health Center. χ2: p=.006; OR 2.0. Interpretation: Providers who rated their facility as less than very good or good were twice as likely to indicate intent to leave a Health Center as those who rated their facility as very good or good.
Rating of Equipment and SuppliesRating of equipment and supplies was significantly associated with intent to leave a Health Center. χ2: p=.001; OR 2.29. Interpretation: Providers who rated equipment condition and supplies at their Health Center as less than very good or good were more than twice as likely to indicate intent to remain at a Health Center as those who rated those items as very good or good.
C. DiscussionThis paper describes a survey conducted to provide information about oral health provider salaries, oral health provider satisfaction, and recruitment and retention strategies at Health Centers throughout the country. To gain a better understanding of factors contributing to Health Center oral health professionals’ job satisfaction, this section analyzes factors significantly associated with oral health providers’ intent to leave a Health Center.
Among survey respondents, 8 in 10 dentists and 9 in 10 dental hygienists did not intend to leave their Health Centers, which is an improvement over the response rate in a previously published survey administered in 2003 and again in 2010.iv These results point to remarkably high job satisfaction rates among Health Center oral health providers. As for why recruitment and retention of oral health providers are problems for Health Centers, analyses of survey data demonstrate that salary alone is not the main issue. In fact, among these respondents, salary had no statistical association with intent to remain at or leave a Health Center.
The reported statistically significant associations are revealing in that they provide a glimpse of the characteristics of dissatisfied providers (i.e. providers intending to leave Health Centers). These providers were more likely than their satisfied counterparts to be less experienced overall and to be relatively recent hires. They also tended not to have chosen a career in Health Center dentistry or dental hygiene for primarily altruistic reasons or because of their commitment to serving underserved but rather because this career path offered the possibility of loan repayment.
Dissatisfied providers tended also to be somewhat unhappy with their work environments, specifically with Health Centers’ day-to-day administrative and clerical operations, interactions with medical colleagues, equipment and supplies available, and dental assistant staff at Health Centers.
iv Bolin KA, Shulman JD. Nationwide survey of work environment perceptions and dentists’ salaries in community health centers.
J Am Dent Assoc. 2005 Feb;136(2):214-20; and Bolin KA, Shulman JD. Nationwide survey of dentist recruitment and salaries in
community health centers. J Health Care Poor Underserved. 2004 May;15(2):161–9.
“Among survey respondents, 8 in 10 dentists and 9 in 10 dental hygienists did not intend to leave their Health Centers.”
28

To improve provider satisfaction, especially among less-experienced staff and relatively recent hires, Health Centers should consider implementing robust orientation programs, lunch and learns to help medical providers and oral health providers better understand each other’s work and build stronger relationships, and mentorship programs where experienced oral health staff help guide new staff. Dental directors, oral health program managers, and the entire administrative team should also instill a culture of daily dedication to the Health Center’s mission to help build a sense of community purpose.
Survey results show that almost 30 percent of responding executive directors reported at least one dentist vacancy, but less than 10 percent reported a dental hygienist vacancy. Since a majority of dentists and dental hygienists currently working in Health Centers have some previous work experience and came from private practice, Health Centers should target recruitment efforts to that labor source rather than simply working with the NHSC and PCAs and using dental school and dental hygiene school postings. More recruiting efforts could be directed toward popular professional journals or other venues that private practice dentists and dental hygienists are exposed to on a regular basis.
It is noteworthy that a large number of oral health providers rotated through a Health Center while in school, even though the numbers are not statistically significant in terms of intent to remain at a Health Center. This suggests that investing time and resources in externship-type experiences for dental students and dental hygiene students by collaborating with professional schools can benefit Health Centers in the long term.
Although dentists and dental hygienists currently employed at Health Centers did not indicate dissatisfaction with current salaries and benefits, overall, data suggest that new Health Center hires are concerned about starting salaries, as this was the most frequent reason that executive directors cited for being unable to hire oral health professionals to whom they had extended firm offers. However, the number of responses to the question about salaries was too small to analyze statistically. Data released from the American Dental Association provide a reminder of how large the compensation differential is between private practices and Health Centers, with the average net income of a full-time private practice general dentist in 2012 reported at $193,640v (whereas three-fourths of Health Center dentists commanded salaries of less than $140,000 in 2013). It should also be noted that data show an increase in salaries for Health Center oral health providers between 2009 and 2013 (see appendices for more information).
Health Center executive directors need to know the salaries that dentists typically command in the marketplace and to be proactive about articulating the advantages and benefits of working at Health Centers vs. in private practice. The fact that vacation time, paid holidays, tax-advantaged retirement plans, and other benefits are not provided in independently owned practices, but rather must be self-funded by independent owner dentists, can be emphasized to point out to potential new hires that total compensation offered by Health Centers may be more attractive than it initially appears.
v Vujici M et al. Despite Economic Recovery, Dentist Earnings Remain Flat. American Dental Association: http://www.ada.org/~/
media/ADA/Science%20and%20Research/HPI/Files/HPIBrief_1013_4.ashx.
29

NNOHA encourages Health Centers across the country to use the information presented in this paper to help refine recruitment and retention strategies. For instance, survey findings and other information presented in this paper can be used in drafting job descriptions, oral health program policies and procedures, and exit interview questions. While each Health Center is unique and survey findings therefore may not apply to all of them, we hope that the findings will be helpful to Health Centers seeking to refine their recruitment and retention efforts.
30

■ Bolin KA, Shulman JD. Nationwide survey of work environment perceptions and dentists’ salaries in community health centers. J Am Dent Assoc. 2005 Feb;136(2):214-20.
■ Bolin KA, Shulman JD. Nationwide survey of dentist recruitment and salaries in community health centers. J Health Care Poor Underserved. 2004 May;15(2):161-9.
■ Bolin KA. Survey of Health Center Oral Health Providers. National Network for Oral Health Access. October 2010.
■ Vujicic M, Lazar V. An analysis of dentists’ incomes, 1996-2009. JADA. 2012 May;143(5)452-460.
REFERENCES
31

Survey Questions for Oral Health Providers
1. In what HRSA Region is your Health Center dental component located?
2. What year did you graduate from Dental/Dental Hygiene School?
3. How long have you been practicing dentistry/dental hygiene?a. Less than one year b. > or = to 5 years but <10 yearsc. > or = to 1 year but <5 years d. > or = to 10 years
4. What is your gender?Female Male
5. What was your primary dental practice activity immediately prior to practicing in a Health Center setting?
a. Dental studentb. Dental Hygiene studentc. Graduate dental program/specialty programd. Private practice/owner, partner, associatee. Private practice/employee dentist, employee hygienistf. Commissioned officer in Military or Public Health Serviceg. Owner/partner in a collaborative dental hygiene practiceh. Local/state public health agency/other health center or safety net clinici. Retiredj. Other (please specify)
6. Did you rotate through a Health Center dental clinic while you were a dental student or dental hygiene student?
Yes No
7. What salary range closest represents your starting pay at the time you were hired?a. <$30,000 g. $80,001 -$95,000b. $30,001- $40,000 h. $95,001 -$110,000c. $40,001- $50,000 i. $110,001 -$125,000d. $50,001- $60,000 j. $125,001 -$140,000e. $60,001- $70,000 k. >$140,000f. $70,001 -$80,000
8. Please answer yes or no to the following statements.a. I have received or am currently receiving NHSC scholarship funding b. I have received or am currently receiving NHSC loan repayment funding c. I have received or am currently receiving loan repayment from a state program d. I have completed NHSC loan repayment obligations
9. If you have completed NHSC loan repayment obligations, what year were they completed?
Appendix A
32

10. What were your primary reasons for choosing a practice opportunity with a Health Center organization? (Please rank your top 3 choices with numbers 1,2, or 3 in order of importance to you. Please leave the remaining choices blank.)
a. Felt a mission to the dentally underserved populationb. Wished to offer oral health care within an interdisciplinary environment c. Wished to practice dentistry/dental hygiene in a community based setting d. Did not want to invest capital in, or borrow money for a private practicee. Attracted by work schedule/leave policies/fringe benefits of Health Center
practice f. Loan repayment was available in Health Center practiceg. Sold private practice, or retired from government serviceh. Unsatisfied with associate/employee dentist or dental hygienist arrangements
currently available
11. How do you perceive your professional practice autonomy in the treatment of Health Center patients?
a. I feel that I have full professional practice autonomy in the treatment of Health Center dental patients
b. I feel limited to some degree in terms of my professional practice autonomy in the treatment of Health Center dental patients
12. Which of the following reasons contribute to the feeling of limited practice autonomy? (Choose all that apply).
a. Level of patient compliance with treatment recommendations or appointment attendance
b. Scope of treatment offered at my Health Centerc. Type of patient population served at my Health Centerd. Amount of access to specialistse. Types of services limited due to budget constraints (i.e. lab services)f. Degree of comprehensive care that can be providedg. Degree of input into policy and budget decisions regarding dental servicesh. My state’s Medicaid policies/requirementsi. Degree of guidance from management in the treatment of patientsj. Number of encounters requiredk. Other (please specify)
13. What is your current position/title in the Health Center dental component?a. Dental Director b. Staff Dentist c. Dental Hygienistd. Other (please specify)
14. Are you a Dental Director, Staff Dentist of Dental Hygienist with administrative duties?Yes No
15. How do you feel about the amount of administrative time set aside outside of clinic to manage operations of the dental component? (i.e. committee work, management team meetings, staff evaluations, quality control issues, etc.)
a. I feel I have enough time to do these activitiesb. I feel I don’t have enough time, but I am allowed some time for these activitiesc. I am not allocated any time outside of clinic to do these activities
33

16. How many clinic hours (direct patient care) do you usually work on a weekly basis?
17. How many administrative hours do you generally work on a weekly basis?
18. What is the job title of the person to whom you are directly accountable?a. Executive Director b. Chief Operations Officerc. Medical Director d. Dental Program Director e. Other (please specify)
19. Are the any specialists available in your dental component? (Indicate any who are employed or contracted)
a. Oral surgeon b. Periodontist c. Orthodontistd. Pediatric dentiste. Prosthodontist f. None of these are availableg. Other (please specify)
20. What type of specialist do you feel is the MOST needed in your practice?a. Oral surgeon b. Periodontist c. Orthodontistd. Pediatric dentist e. Prosthodontistf. None are neededg. Other (please specify)
21. Are you offered continuing education time and expense reimbursement to maintain your credentials/licenses?
Yes No
22. Please indicate the amounts of days and dollar amount of reimbursement for CE.
23. How many days are you currently offered annually for vacation or paid time off?
24. How many sick days annually are you offered?
25. Do you feel the amounts of sick leave/personal leave are adequate?Yes No
26. Do you think your major medical insurance benefits are adequate?Yes No
27. Are you offered any retirement benefits through a 403b or 401k plan or similar plan?Yes No
28. Does your employer offer any match to your 403b, 401k, or similar plan?Yes No Don’t know
34

29. Is there a salary incentive (production incentive) program or plan for the practice offered to you?
Yes No
30. Are you a full time employed dental director/ staff dentist?Yes No
31. What is your yearly gross pre tax salary, not including benefits. Pre tax salary is defined as gross wages before income tax or Social Security/Medicare taxes are deducted.
a. <$65,000 e. $110,001 -$125,000b. $65,001- $80,000 f. $125,001 -$140,000c. $80,001- $95,000 g. >$140,000d. $95,001 -$110,000 h. Other (please specify)
32. Are you a full time employed dental hygienist?Yes No
33. What is your yearly gross pre tax salary, not including benefits? Pre tax salary is defined as gross wages before income tax or Social Security/Medicare taxes are deducted.
a. <$30,000 e. $60,001 -$70,000b. $30,001 -$40,000 f. $70,001- $80,000c. $40,001 -$50,000 g. >$80,000d. $50,001 -$60,000 h. Other (please specify)
34. If you are paid an hourly rate instead of a salary, or if you are not full time, please indicate your approximate hourly pay.
35. To which of the following professional organizations do you belong? (Check all that apply)a. American Dental Association b. American Dental Hygienists’ Association c. Hispanic Dental Association d. American Association of Public Health Dentistry e. Academy of General Dentistryf. American Public Health Associationg. National Dental Associationh. National Network for Oral Health Accessi. None of these j. Other (please specify)
36. Does your employer reimburse your membership dues in any of the above organizations?Yes No N/A
37. How many years have you been practicing Health Center dentistry?
38. How would you rate your current facility overall in terms of physical building condition and appearance?
a. Very good d. Needs improvement b. Good e. Poor c. Adequate
35

39. How would you rate your current facility overall in terms of dental equipment condition and dental supplies (patient chairs, operator stools, handpieces, cavitrons, instruments, etc.)
a. Very good d. Needs improvement b. Good e. Poor c. Adequate
40. How much time are you required to participate in night or weekend on call responsibilities?
a. Very often c. Seldom b. Often d. Never
41. Please rate the following regarding dental clinic staffing and support as adequate or inadequate.
a. Number of dental assistants b. Quality/experience of dental assistantsc. Number of EFDAs (in states where permitted) d. Clerical support: reception, records, billing e. Administrative support, including electronic health records f. Number of dentists employed g. Number of dental hygienists employed h. Assistant to dentist ratio i. Interaction with Medical colleagues at your center
42. What is the assistant to dentist ratio in your practice? (e.g. if there are 3 assistants for 2 dentists the ratio is 3:2, or if there are 6 assistants for 3 dentists the ratio is 2:1, etc.)
43. Have you been informed by anyone in administration that there is a minimum number of encounters that must be seen by each provider in the dental component?
Yes No
44. What is the number of encounters you have been told must be seen annually by each provider?
45. Do you intend to remain in Health Center dentistry for the foreseeable future?Yes No
46. How soon do you plan to leave the practice? (choose the one best answer)a. As soon as another opportunity opens upb. Within the next yearc. Within the next 2 5 years
47. What are factors affecting your decision to leave Health Center dental practice? (Choose all answers that apply)
a. Plan on retiring g. Desire more practice autonomyb. Need to increase income h. I think encounter rates are too highc. Need a change in work hours i. Burnoutd. Increase my scope of practice e. Entering private practicef. Desire to participate in resident education and/or academics/research
36

Appendix B
Executive Director Survey Questions
1. Does your Health Center have a dental component?a. Yes (Skip to Q.5) b. No (Continue to Q.2)
2. Does your health center contract with private dentists in the community to provide dental services?
3. How is the contracted dentist being reimbursed for dental services provided to Health Center patients?
a. Fee -for- serviceb. Flat fee per encounterc. Other (please specify)
4. Are there plans to add dental services in the next 3 years?Yes No
[End of the Survey for those that do not have a dental component.]
5. How many dentists are currently working as employees in the dental component?
6. How many of the dentists are full time (32 hours or more/week)?
7. How many dentist position (#FTE) are currently budgeted in the health center budget?
8. How many dental hygienists are currently employed in the dental component?
9. How many of the dental hygienists employed are full time (32 hours or more/week)?
10. How many dental hygienist positions (#FTE) are currently budgeted?
11. What is the number of clinical dental assistants employed by the center? (Please do not include receptionist, other clerical staff)
12. How many dental assistant positions (#FTE) are currently budgeted?
13. Do you employ a "Dental Program Manager" (non clinical position) to oversee the dental component?
Yes No
14. What is the salary of the Dental Program Manager?
15. Are there any dentist positions vacant currently?Yes No
16. What is the duration of the dentist vacancy as of April 2013?a. Less than 6 months
37

b. > or = to 6 months but <12 months c. > or = to 12 months but <24 monthsd. 24 months or more
17. What methods/sources have been used to recruit for or fill this vacant position? (Choose any that have been used)
a. Newspaper advertisement b. Dental Journal advertisement c. Posting at dental schools d. Speaking at dental schools/residency programs e. Hosting dental externs in the clinic f. Displays at job fairs/dental conventions g. Professional headhunters h. Staffing or temp agenciesi. National Health Service Corpsj. Primary Care Associationsk. CHC local website posting;state/national levell. NNOHA website job bankm. Immigration Visa sponsorshipn. Other (please specify)
18. Which one of the methods listed in the previous question have been the most productive?
19. How many dentist applicants have responded to the recruitment methods you have used during the entire duration of the vacancy?
20. If there is more than one dentist vacancy, how long has the additional dentist position been vacant?
a. Less than 6 months b. > or = to 6 months but <12 months c. > or = to 12 months but <24 monthsd. 24 months or moree. Other (please specify)
21. How many dentist applicants have been made firm offers for the vacant position(s) if applicable?
First vacancy _____ Other vacancies_____
22. If firm offer(s) were made but were rejected by candidates, what were the reasons given? (Choose any that apply)
a. Salary/benefits inadequateb. Condition of equipment of dental clinicc. Location of Community Health Centerd. No loan repayment availablee. Level of staffing of the dental clinicf. Spousal/significant other/family issuesg. Other (please specify)
23. What is the current budgeted annual salary amount for the first dentist vacancy?a. Entry level position < or = 1 yearb. >1 year to 5 years experiencec. >5 years to 10 years experienced. >10 years of experience 38

24. What is the estimated fringe benefits for this position as a percentage of salary?
25. Are there any Dental Hygienist positions vacant?Yes No
26. What is the duration of the Dental Hygienist vacancy?a. Less than 6 months b. > or = to 6 months but <12 monthsc. > or = to 12 months but <24 monthsd. 24 months or more
27. What methods have been used to recruit for this vacant position (Choose any that apply)a. Newspaper advertisement b. Dental Hygiene Journal advertisement c. Posting at dental hygiene schools d. Speaking at dental hygiene schools e. Hosting dental hygiene externs in the clinic f. Displays at job fairs/dental conventions g. Professional headhuntersh. Staffing or temp agenciesi. National Health Service Corpsj. Primary Care Associationsk. CHC local website posting;state/national levell. NNOHA website job bankm. Other (please specify)
28. Which method has been most productive in your recruitment of dental hygienists?
29. How many dental hygiene applicants have responded to any of the methods cited during the entire duration of the current vacancy?
30. How many applicants have been made firm offers for the vacant position?
31. If offers have been made but have been rejected, what were the reasons given? (Choose any that apply)
a. Salary/benefits inadequate b. Condition of equipment of dental clinicc. Location of Community Health Center d. No loan repayment availablee. Level of staffing of the dental clinic f. Spousal/significant other/family issues g. Other (please specify)
32. The current budgeted amount for the dental hygienist vacancy is:a. Entry level position < or = 1 yearb. >1 year to 5 years experiencec. >5 years to 10 years experienced. >10 years of experience
33. What is the estimated amount of fringe benefits for this position as a percentage of salary?
34. Are there any contract labor (not employee) dentists retained on staff?Yes No
39

40
35. What is the lowest and highest amount paid per hour for contract dentists?Lowest $/hour _____Highest $/hour _____
36. Thinking of the currently highest paid full time dentist (employee) please indicate if the following are offered to that employee:
a. Paid medical insurance g. Tort claims coverageb. Other insurance (disability, life) h. Dental license fee paidc. Paid holidays i. Drug license fee(s) paidd. Paid vacation/sick leave j. Continuing education allowancee. Retirement plan (403b or other) k. Otherf. Retirement plan match
37. What is the annual gross pay of the highest paid dentist (employee) in your organization (Before taxes or other deductions)?
38. The highest paid dentist (employee) in your organization has what level of experience?a. < or = 1 year b. >1 year to 5 years experience c. >5 years to 10 years experienced. >10 years of experience
39. Are there contract labor dental hygienists (non employees) on staff?Yes No
40. What is the highest and lowest hourly pay for contract dental hygienists?Highest $/hour _____Lowest $/hour _____
41. Thinking of the highest paid dental hygienist employee on staff please answer the following:
a. Paid medical insurance g. Tort claims coverageb. Other insurance (disability, life) h. Dental license fee paidc. Paid holidays i. Drug license fee(s) paidd. Paid vacation/sick leave j. Continuing education allowancee. Retirement plan (403b or other) k. Otherf. Retirement plan match
42. What is the annual gross pay of the highest paid dental hygienist (employee) in your organization (Before taxes or other deductions)?
43. What is the experience level of the highest paid dental hygienist on staff at your organization?
a. < or = 1 year b. >1 year to 5 years experience c. >5 years to 10 years experienced. >10 years of experience
Distribution of Salaries by Survey Year
41
Appendix C

Appendix D
Budgeted and Employed Oral Health Positions, 2013 v. 2009
PositionFTE Budgeted: Mean
FTE Budgeted: Median
FTE Employed: Mean
FTE Employed: Median
FTE Employed: Mode
Dentist, full time: 2013 4.4 3.0 3.5 3.0 2.0
Dentist, full time: 2009 3.4 2.5 2.7 2.0 1.0
Dental Hygienist, full time: 2013 2.6 2.0 2.1 1.0 1.0
Dental Hygienist, full time: 2009 1.6 1.0 1.3 1.0 1.0
Dental Assistant, full time: 2013 7.4 5.0 7.4 5.0 2.0
42

Appendix E
Salaries by Level of Experience
Salaries for Dentists by Level of Experience, 2013 v. 2009Entry Level < 1 year
>1 year to 5 years
>5 years to 10 years > 10 years Fringes %
Dentist, Mean 2013 $108,927 $111,514 $122,305 $125,519 23.6%Dentist, Mean 2009 $97,935 $107,380 $115,102 $145,015 24.2%Dentist, Median 2013 $110,000 $112,500 $131,000 $135,000 25%Dentist, Median 2009 $98,391 $110,000 $116,480 $120,000 24%
Salaries for Dental Hygienists by Level of Experience, 2013 v. 2009Entry Level < 1 year
>1 year to 5 years
>5 years to 10 years > 10 years Fringes %
Dental Hygienist, Mean 2013 $52,093 $48,288 $55,870 $60,953 20.2%
Dental Hygienist, Mean 2009 $50,081 $55,934 $54,569 $58,357 22%
Dental Hygienist, Median 2013 $48,200 $49,000 $54,000 $62,500 23%
Dental Hygienist, Median 2009 $52,250 $57,610 $56,160 $61,046 23%
43

Mean: The sum of a list of numbers, divided by the number of numbers; also known as the average.
Median: The "middle value" of a list. The smallest number such that at least half the numbers in the list are no greater than it. If the list has an odd number of entries, the median is the middle entry in the list after sorting the list into increasing order. If the list has an even number of entries, the median is the smaller of the two middle numbers after sorting.
Mode: The most common (frequent) value.
n: Sample size, or in the case of this report, the total number of individuals that answered the particular question.
Source: University of California, Berkeley. Glossary of Statistical Terms, 1997–2013. http://www.stat.berkeley.edu/~stark/SticiGui/Text/gloss.htm#m.
Glossary of Statistical Terms
44

CREDITS
Special Acknowledgements:
Thank you to Kenneth Anthony Bolin, DDS, MPH, Baylor College of Dentistry, for conducting the survey and developing the analysis.
Thank you to current and former members of NNOHA’s Workforce Development Workgroup for volunteering their time and expertise to review the initial survey and this document:
Wayne Cottam, DMD, MSSteven Geiermann, DDSEthan Kerns, DDS Kecia Leary, DDS, MSAndrea Martin Charlyne Mason-Dozier, DDSWilhelm Piskorowski, DDSRene Rosas, DDSBuddhi Shrestha, DDS, MS, PhDAmanda Stangis, MPH
NNOHA would also like to thank the National Maternal and Child Oral Health Resource Center for their assistance in the production of this paper.
Thank you to:
Michele L. Junger, DDS, MPHNNOHA Project OfficerPublic Health AnalystOral Health Training Branch, Division of Medicine and DentistryBureau of Health WorkforceHealth Resources and Services Administration
NNOHA staff:
Phillip ThompsonExecutive [email protected]
Maria Smith, MPAProject [email protected]
Mitsuko IkedaFormer Project Director
Sonia Sheck, MSFormer Special Projects Coordinator
45

The National Network for Oral Health Access (NNOHA) is a nationwide network of Health Center dental providers. These providers understand that oral disease can affect a person’s speech, appearance, health, and quality of life and that inadequate access to oral health services is a significant problem for low-income individuals. The members of NNOHA are committed to improving the overall health of the country’s underserved individuals through increased access to oral health services.
For more information on NNOHA, visit www.nnoha.org, send an email to [email protected], or call 303-957-0635.
The mission of the National Network for Oral Health Access (NNOHA) is to improve the oral health of underserved popula-tions and contribute to overall health through leadership, advo-cacy, and support to oral health providers in safety-net systems.


